21
Unemployed and Alone: How does Unemployment affect Social Participation in Europe Martina Dieckhoff and Vanessa Gash
| Date post: | 10-Dec-2015 |
| Category: |
Documents |
| Upload: | madison-marshall |
| View: | 214 times |
| Download: | 1 times |

Unemployed and Alone: How does Unemployment affect Social Participation in
Europe
Martina Dieckhoff and Vanessa Gash

The Issue (1)
• As the economic recession continues, old concerns surrounding the implications of mass unemployment on social cohesion are regaining ground.
• This paper asks how unemployment affects social engagement.
• Previous work has shown that unemployment reduces the level of participation in social life (e.g. Paugam & Russell 2000; Brand & Burgard 2008).
• This decrease in social participation is regarded as problematic for a variety of reasons:
– Social participation increases a persons social network.– Social networks in turn provide social and economic resources, such as
information about jobs (Coleman 1988; Granovetter 1973, Moerbeck 2001), which should facilitate labour market re-entry.
– We expect a link between social participation and well-being (Putnam 2000).– From a functionalist perspective social participation can be seen as a mechanism
to integrate disparate communities (Fukuyama 1995).
The Issue (2)
Why might the unemployed be less socially involved?
• Some argue that the economic distress associated with unemployment may reduce social participation (Putnam 2000).
• Others emphasise the psychological dimension of job-loss as an important factor for declining participation (Brand and Burgard 2008) as workers self-esteem and self-perception may suffer.
As institutions can mediate the financial as well as the psychological consequences of unemployment. The effect of unemployment on participation should differ cross-nationally, supporting a cross-national research design.

Research Design
Principal Research Questions:
1. Can we replicate previous findings that find unemployment decreases social participation?
2. Is there cross-national variation in this tendency?3. What country level factors are associated with decreased
(or increased) social participation?
Our principal aim is to identify the different effects of country (macro)level variance on unemployed workers propensity for social engagement relative to employed workers.

What is Social Participation
• Paugam and Russell (2000) and Gallie et al. (2003) identify three different sphere’s of social participation.
• Primary sphere: immediate household and family relations• Secondary sphere: Encounters with friends and relatives
outside the household• Tertiary sphere: Participation in organisational and
associational life

The data (1)
• This paper uses the 2006 EU-SILC module on social participation. • The dataset provides information for 25 EU countries with rich information
on the different spheres of sociability.These include questions relating to: - cultural participation (#of times went to cinema/to live performances..) - the frequency of contact with friends, family and neighbours - participation in public life
• This paper predominantly looks at the impact of the tertiary sphere of social participation. We examine unemployed respondents participation in: – church or religious activities, – activities of recreational groups or organisations – charitable organisations.
• The data provides the best data for a cross-national comparative analysis of social participation among the unemployed relative to the employed.
• Note high # of unemployed in the next table

Incomplete table of LF Status by
Country (SILC 2006)
Country Working full-time
Working part-time
Unemployed Total
Austria 5074 (42%) 1158 (10%) 361 (3%) 12010 Belgium 4369 (39%) 1294 (12%) 793 (7%) 11246 Czech Rep. 7055 (47%) 365 (2%) 688 (5%) 14856 Germany 8591 (33%) 5059 (19%) 1295 (5%) 25979 Denmark 6050 (54%) 1097 (10%) 264 (2%) 11246 Estonia 6452 (50%) 440 (3%) 503 (4%) 13007 Spain 11956 (42%) 1448 (5%) 1856 (7%) 28142 Finland 11286 (51%) 1552 (7%) 1057 (5%) 22134 France 8091 (42%) 1757 (9%) 1127 (6%) 19252 Greece 5100 (40%) 593 (5%) 662 (5%) 12606 Hungary 6580 (40%) 441 (3%) 842 (5%) 16516 Ireland 4143 (36%) 1272 (11%) 418 (4%) 11479 Italy 17871 (39%) 2336 (5%) 2520 (5%) 45975 Netherlands 6185 (36%) 4546 (26%) 228 (1%) 17377 Norway 6114 (55%) 993 (9%) 211 (2%) 11108 Poland 13817 (40%) 1344 (4%) 3488 (10%) 34893 Portugal 4684 (46%) 525 (5%) 574 (6%) 10148 Sweden 6424 (49%) 1688 (13%) 456 (3%) 13108 Slovenia 12908 (48%) 358 (1%) 2194 (8%) 27066 Slovak Rep. 6379 (51%) 272 (2%) 885 (7%) 12630 United Kingdom 7214 (42%) 2383 (14%) 352 (2%) 17012 EU average 187020 (43%) 33270 (8%) 22442 (5%) 430119

The data (2)
• The EU-SILC is billed as a comparative cross-national dataset and follows on from the ECHP.
• However, the strategy of ex-post harmonisation in the SILC has resulted in considerable risks of undocumented non-comparability.
• We therefore spent some time examining the wording of the questionnaires.
• We have (to date) compared the questionnaires in: UK, FR, IRL, DE, DK, AU, SE.
• With plans to further review the questionnaires for: PL, CZ, SP, IT and FI.
The Problems
• While broad agreement in the questionnaire wording was identified, there a number of problems:
• Some countries provide many examples for the different types of participation (e.g. “by this we mean”, “such as..“), while others provide none. Those that provide none are likely to have lower observed social participation if people remain unclear.
• When attempting to measure social participation on the aforementioned secondary level, some national surveys prompt that respondents should exclude people they live with while others don‘t, which is likely to lead to upward bias in the latter case.
• One more notable probem concerns the measurement of participation in activities of churches or other religious groups.
– Some countries prompt that going to church counts as a form of religious participation, others dont. Those that do appear to have much higher rates of religious group participation.
– For this reason we focus on participation in recreational activities in this presentation, as it appears to be the least corrupted by variation in questionnaire wording.
Contextual Information
We use contextual level variables from several sources including data from OECD, Eurostat and the 2009 ESS release. This allowed us to include:
• Controls for macro-economic context: unemployment rate & GDP
• Measures of generosity of unemployment benefits: average replacement rates
• mean national variation in attitudes towards the unemployed, which was approximated by the following likert type variables:
– Benefits make people lazy– The unemployed don’t try to find jobs– Benefit stops people caring for themselves and others

Measuring unemployment
• We employ a measure of unemployment based on respondents’ self-defined labour market status,

Variation in macro-level variables
Unemployment Rate, ILO 2005
0
2
4
6
8
10
12
14
16
18
20
IE NO LU NL DK UK AT CY SI HU IT PT SE CZ EE LT FI BE LV ES FR GR DE SK PL

Variation in macro-level variables
ATTITUDES: “To what extent do you agree or disagree that social benefits and services in [your country] make people lazy”.
1=agree strongly, 5=disagree strongly.
mean(benefits make people lazy)
1.00
1.50
2.00
2.50
3.00
3.50
4.00
4.50
5.00
GB HU SI FR PL SK NO PT BE NL IL DE ES BG SE FI CH DK CY EE RU
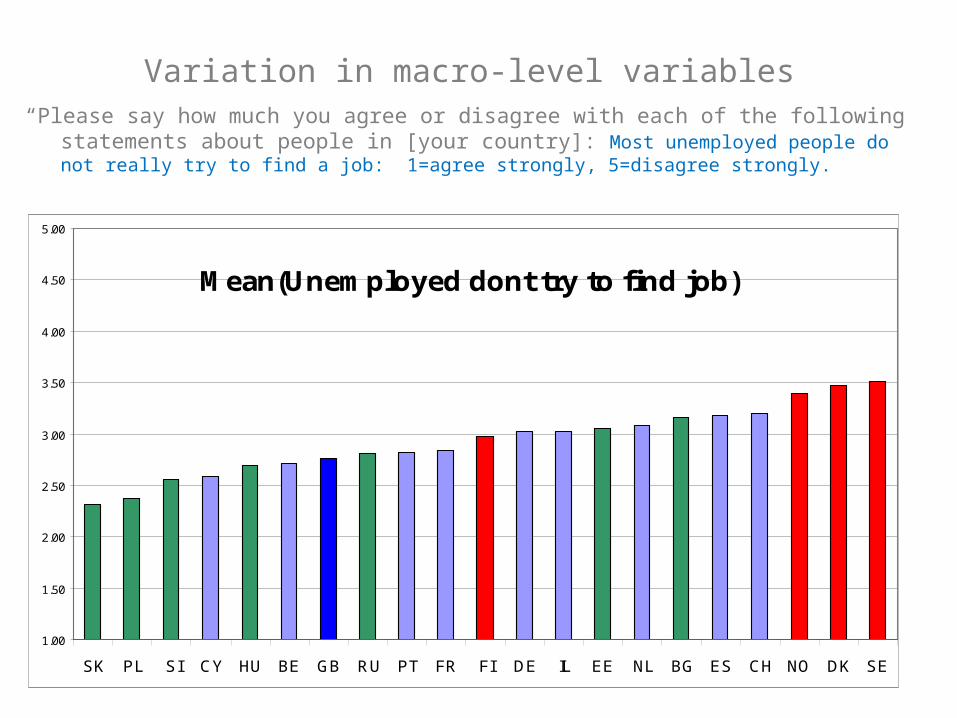
Variation in macro-level variables “Please say how much you agree or disagree with each of the following statements
about people in [your country]: Most unemployed people do not really try to find a job: 1=agree strongly, 5=disagree strongly.
Mean(Unemployed dont try to find job)
1.00
1.50
2.00
2.50
3.00
3.50
4.00
4.50
5.00
SK PL SI CY HU BE GB RU PT FR FI DE IL EE NL BG ES CH NO DK SE
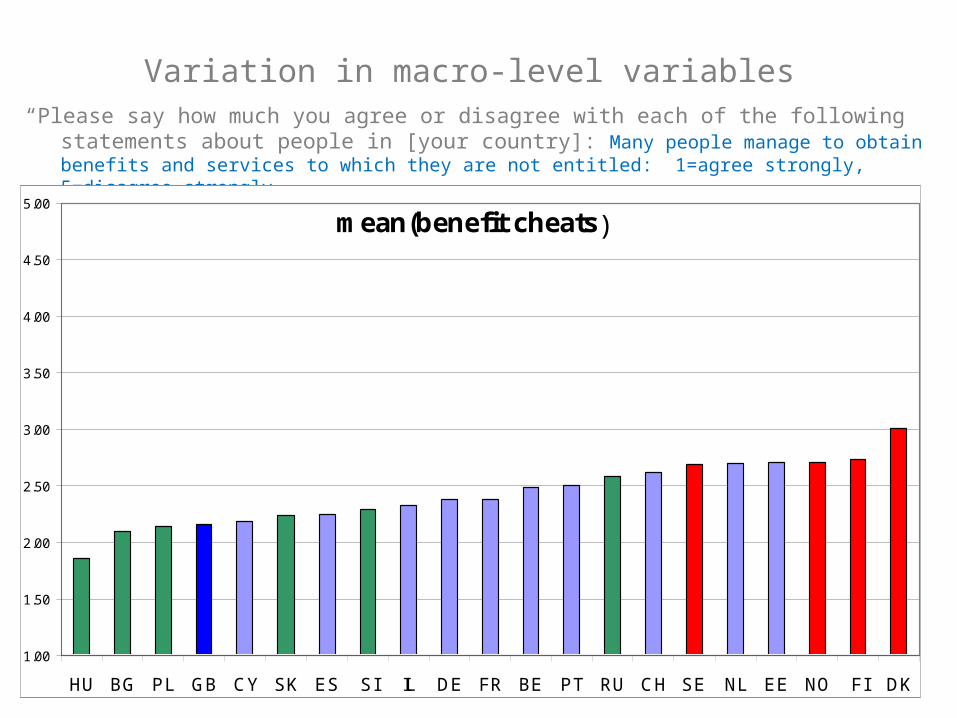
Variation in macro-level variables “Please say how much you agree or disagree with each of the following statements
about people in [your country]: Many people manage to obtain benefits and services to which they are not entitled: 1=agree strongly, 5=disagree strongly.
mean(benefit cheats)
1.00
1.50
2.00
2.50
3.00
3.50
4.00
4.50
5.00
HU BG PL GB CY SK ES SI IL DE FR BE PT RU CH SE NL EE NO FI DK

Expectations
• H1: If it is mainly financial contraints that drive social withdrawal of the unemployed, then generosity of benefits should be central in mediating the negative effect of unemployment on participation.
• H2: If it is mainly loss of self-esteem, the feeling of being „stigmatised“ that leads the unemployed to withdraw, then societal attitudes towards the unemployed should mediate the impact of unemployment on participation (because an individual‘s self-perception is obviously influenced by those around her).
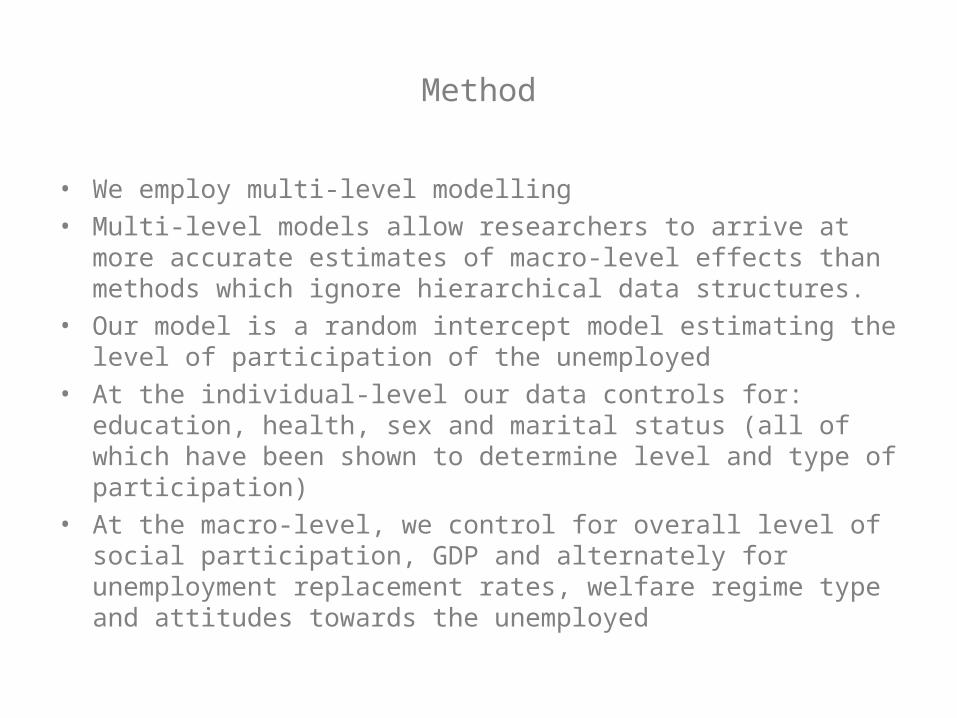
Method
• We employ multi-level modelling• Multi-level models allow researchers to arrive at more
accurate estimates of macro-level effects than methods which ignore hierarchical data structures.
• Our model is a random intercept model estimating the level of participation of the unemployed
• At the individual-level our data controls for: education, health, sex and marital status (all of which have been shown to determine level and type of participation)
• At the macro-level, we control for overall level of social participation, GDP and alternately for unemployment replacement rates, welfare regime type and attitudes towards the unemployed

Findings
As a preliminary analysis we can confirm that the unemployed have lower levels of social participation, and that this varies across countries.
MODEL 0Y=Recreatonal Activity UNEMP-EMP
Coeff SE
Self-Defined Unemp. Status (average random country effect) -0.473 0.056Cross-country Variance in Unemployment Effect [Uj of UNEMP] 0.041 0.019Cross-country Variance in the intercept of Y 5.285 1.763INDIVIDUAL LEVEL VARIABLESMen 0.274 0.009Age -0.086 0.003MACRO-VARIABLESUnemployed Dont try to find Work 0.192 0.398CROSS-LEVEL INTERACTIONunemp*unemployed dont try to find work 0.054 0.166
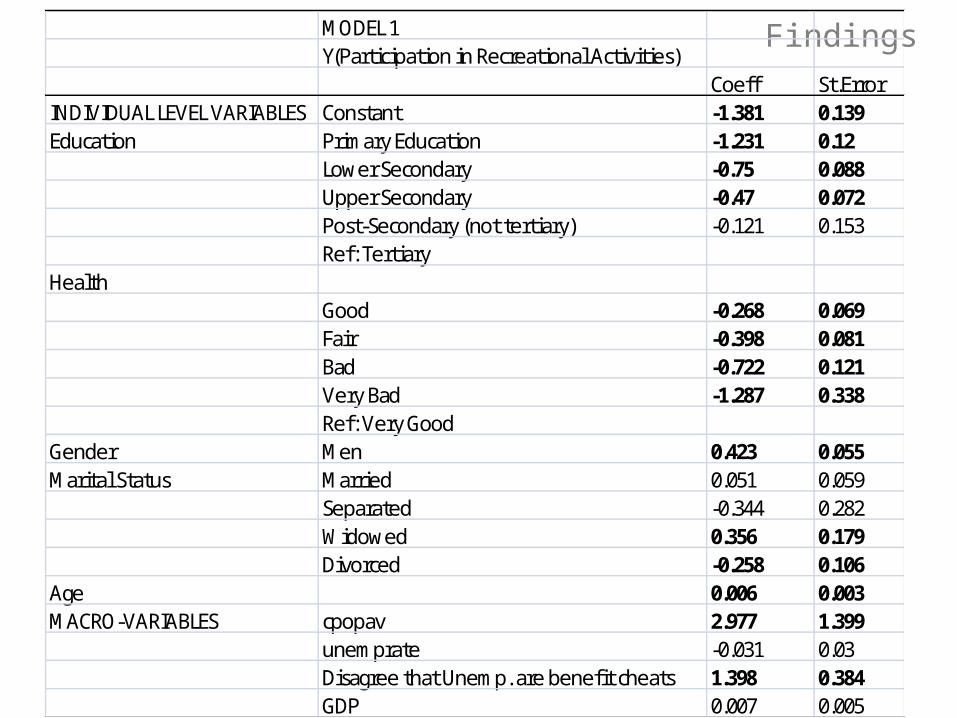
FindingsMODEL 1Y(Participation in Recreational Activities)
Coeff St.ErrorINDIVIDUAL LEVEL VARIABLES Constant -1.381 0.139Education Primary Education -1.231 0.12
Lower Secondary -0.75 0.088Upper Secondary -0.47 0.072Post-Secondary (not tertiary) -0.121 0.153Ref: Tertiary
HealthGood -0.268 0.069Fair -0.398 0.081Bad -0.722 0.121Very Bad -1.287 0.338Ref: Very Good
Gender Men 0.423 0.055Marital Status Married 0.051 0.059
Separated -0.344 0.282Widowed 0.356 0.179Divorced -0.258 0.106
Age 0.006 0.003MACRO-VARIABLES cpopav 2.977 1.399
unemprate -0.031 0.03Disagree that Unemp. are benefit cheats 1.398 0.384GDP 0.007 0.005
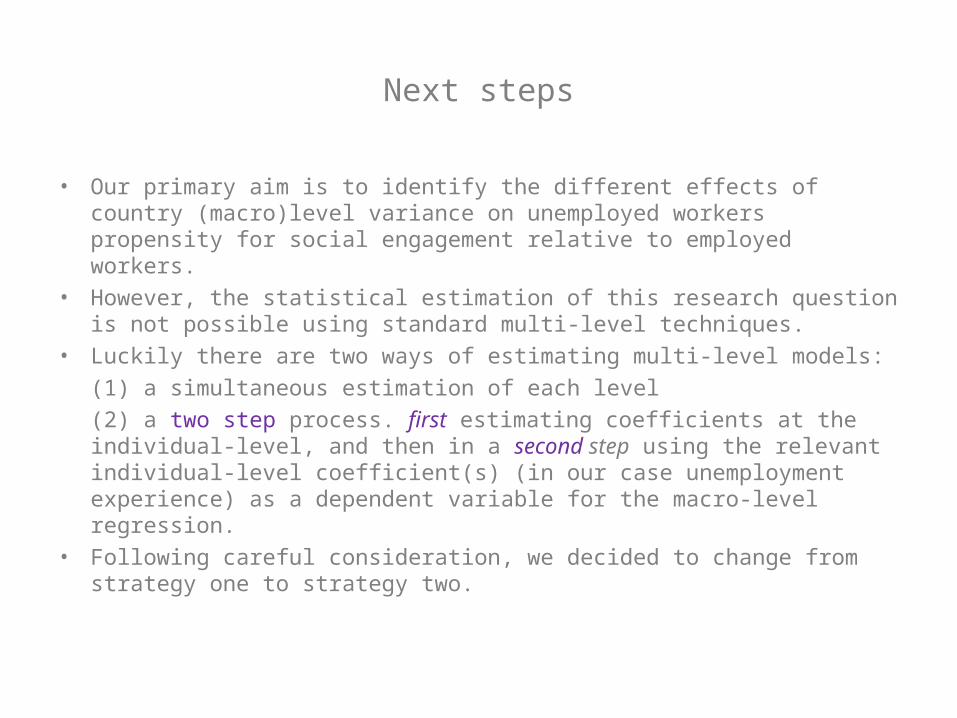
Next steps
• Our primary aim is to identify the different effects of country (macro)level variance on unemployed workers propensity for social engagement relative to employed workers.
• However, the statistical estimation of this research question is not possible using standard multi-level techniques.
• Luckily there are two ways of estimating multi-level models:(1) a simultaneous estimation of each level(2) a two step process. first estimating coefficients at the individual-level, and then in a second step using the relevant individual-level coefficient(s) (in our case unemployment experience) as a dependent variable for the macro-level regression.
• Following careful consideration, we decided to change from strategy one to strategy two.
Next steps
The Reasons for this are as follows:
Practical Reasons: Compuational Efficiency! We resorted to Random Intercept Models focusing only on the unemployed rather than random slope models (of the employed & the unemployed), as with the data size at hand simultaneous random slope models had real problems converging. This strategy is not ideal as we want to investigate the „relative“ disadvantage of the unemployed.
Substantial Reasons:
• In contrast to the simultaneous variant of ML-models, two-step ML-models allow individual effects to vary across countries (and also time).
• Assumption of joint normality of level1 and level2 errors in the simultaneous variant can cause problems especially with binary outcomes (Franzese 2005).


