57
UNEQUAL ACCESS TO CREDIT The Hidden Impact of Credit Constraints

UNEQUAL ACCESS TO CREDITThe Hidden Impact of Credit Constraints

AuthorsKausar Hamdani, Ph.D., Senior Vice President and Senior Advisor Claire Kramer Mills, Ph.D., Assistant Vice PresidentEdison Reyes, AssociateJessica Battisto, Senior Analyst
PublishedSeptember 2019
The views expressed here are those of the authors and do not necessarily reflect those of the Federal Reserve Bank of New York or the Federal Reserve System..
PROJECT OVERVIEW 21
CREDIT INSECURITY INDEX FRAMEWORK 52
CREDIT INSECURITY SNAPSHOT, 2018 Q4 123
CREDIT INSECURITY TRENDS 214
EVIDENCE OF PROGRESS IN CREDIT INSECURITY 255
CREDIT INSECURITY INDEX METHODOLOGY 527
ACKNOWLEDGMENTS 568
POLICY AND PRACTICE FOR CREDIT INSECURITY 356
TABLE OF CONTENTS

22
Access to credit is an asset for individuals to pursue economic opportunity and enhance financial security. Aggregated across residents and viewed collectively, it becomes a lens on a community's financial well- being and resiliency to shocks.1 However, access to credit must be measured carefully if it is to be an accurate lens, and useful to inform community development policy and practice.
Typically, access to credit is gauged by the relative size of the formal credit economy–the percent of residents in the community with a credit file and score, which allows them access to mainstream credit products and services. Unfortunately, credit constraints that limit access are rarely incorporated in measures even though they are a high concern in policy conversations about residents' ability to obtain credit products at fair terms when they choose.2 Therefore, outcomes that constrain residents’ ability to borrow at choice need to be incorporated into measures of community credit health and well-being.
Since access to mainstream credit products does not equal the ability to obtain credit at choice, measures such as the share of residents in, or not in, the formal credit economy are incomplete when assessing credit health. They omit individuals who are in the formal credit economy but may have derogatory infor-mation in their credit files such as low credit scores, poor debt payment histories, or over-utilized credit lines, among other considerations.3 Although a part of the formal credit economy, they may find it difficult to borrow for opportunity or to weather emergencies when they choose to.4 Evidence of credit constraints and financial insecurity are well documented; a recent survey found that 17% of U.S. adults are not able to pay all of their current month’s bills in full, and another 12% of adults would be unable to pay their current month’s bills if they also had an unexpected $400 expense.5
When the impact of credit constraints is omitted from the discussion, communities may seem to be more credit healthy or credit secure than warranted. Indeed, communities with high concentrations of residents with no or low ability to obtain credit at choice–the ‘credit insecure’ communities–may even be missed when assessing community needs and consequently receive less policy and programmatic attention than otherwise. The importance of incorporating and measuring credit constraints accurately is particularly relevant when assessing the well-being of low- and middle-income communities where limited savings, uneven income flow, and liquidity constraints are an everyday stressor for many residents.6
1 See https://www.newyorkfed.org/medialibrary/media/outreach-and-education/CommunityCredit-2014-BookofSummaryCharts.pdf for a discussion of the conceptual framework that makes this connection.
2 For example, see Report on the Economic Well-Being of U.S. Households in 2018, May 2019 https://www.federalreserve.gov/consumerscommunities/files/2018-report-economic-well-being-us-households-201905.pdf
3 This list are just some examples; there might be other considerations.4 We are not suggesting that such credit constraints are imprudent or unwarranted.5 See https://www.federalreserve.gov/consumerscommunities/files/2018-report-economic-well-being-us-households-201905.pdf, p.26 See Jonathan Morduch and Rachel Schneider, The U.S. Financial Diaries, and all the research at https://www.usfinancialdiaries.org/issue
1UNEQUAL ACCESS TO CREDIT
PROJECT OVERVIEW

3
To address the information gap, we create a new tool, the Credit Insecurity Index. The index uses the Community Credit analytical framework and indicators to examine credit health at the community level.7 We combine several credit-limiting outcomes into a single score for each community to gauge ‘credit insecurity’ or lack of access to credit at choice within that community.8 Using severity tiers, the scores scale relative credit insecurity, across place and over time, in America during 2005–18.
The Credit Insecurity Index, and other Community Credit tools, were created to empower community stakeholders with more accurate and nuanced evidence. At a minimum, the analytics are useful to gauge a community’s credit health. However, credit data are also used for non-credit applications that affect individuals’ economic well-being more broadly. For example, pre-employment checks typically include a credit check before a job offer is made. Credit scores are often used to qualify individuals for preferential insurance rates, waive utility deposits, and obtain advantageous telecommunications packages. There is even evidence that some individuals vet the credit-worthiness of potential life partners before making serious commitments.9 For these reasons among others, credit is an asset that individuals need to safeguard since it affects their overall economic well-being and financial resiliency like other assets. As such, the asset-like properties of credit make it a lens on a community’s well-being.
Credit data are attractive for community development analysis given their timeliness, relatively high accuracy, and ‘big data’ coverage and statistical properties. Typically, the well-being of underserved com-munities is assessed using measures (such as income and wealth), which unfortunately are available with a considerable lag or not at all, especially at the micro-geography levels that are of interest to prac-titioners. In contrast, there is a commercial incentive for credit data to be accurate and timely. Firms and other organizations who subscribe to credit bureau services require accurate information to make business decisions that will affect their operations and profitability. Undoubtedly, errors occur in credit files, which consumers are encouraged to monitor and correct. Nevertheless, credit data are among the more accurate and convenient sources of information available for big data analysis.
The Credit Insecurity Index can deepen our understanding of circumstances that affect our communities. In this report, we document the resiliency of communities to recover from the 2007 financial crisis and subsequent economic recession. However, other applications are possible. For example, index scores also measure a community’s potential resiliency if subject to a natural disaster or to adapt to the challenges of climate change; high scores suggest less capacity to adapt or to recover without assistance. The index is also useful to assess the impact of policy actions such as investments in Opportunity Zones and ensuing improvements in community well-being.
7 See publicly available data on New York Fed webpage https://www.newyorkfed.org/data-and-statistics/data-visualization/community- credit-profiles/index.html#overview
8 The index is the sum of the share of the adult population not in the formal credit economy plus a simple average of credit-limiting outcomes of those in the formal credit economy.
9 See Jane Dokko, Geng Li, and Jessica Hayes, “Credit Scores and Committed Relationships,” Series 2015-081, Board of Governors of the Federal Reserve System, 2015 available at http://dx.doi.org/10.17016/FEDS.2015.081
Unequal Access to Credit / Project Overview

4
Community stakeholders may use the Credit Insecurity Index in several ways. The scores allow readers to quantify the impact of credit constraints on their community, and to situate their local experience with-in the broader national context of place and history. Specifically, the scores sort communities on a credit insecurity scale and identify communities with persistent credit insecurity over time. The scores aid decision-making on how and where to allocate resources among communities, and to ensure that planned resources are sufficient to the scale and nature of the challenge being targeted. The scores can benchmark the impact of new or additional investments in communities over time by examining pre- and post-inter-vention community conditions. Lastly, the index is complementary to other indicators in the community development tool kit. For example, credit insecurity index analytics may be cross-tabulated to indicators of race and ethnicity, poverty and education to enrich the policy discussion and broaden the menu of appropriate responses.
Given the breadth of the project, the evidence is presented in five analytical papers and each is a separate lens on how credit constraints depress access to credit and contribute to financial insecurity. The first analytical paper, Credit Insecurity Index Framework, discusses credit insecurity and presents the conceptual framework for the index and its value as an indicator of well-being and financial stability. The next two papers, The Credit Insecurity Landscape in 2018 and Credit Insecurity Trends, characterize credit insecurity, over time and place, in America. The fourth paper, Evidence of Progress in Credit Insecurity, presents evidence of progress—where credit is on an improving trajectory—and evidence of communities that are mired in persistent credit insecurity. The last analytical paper, Policy and Practice for Credit Insecurity, reviews the evidence to inform the policy and practice discussion of community well-being.
The views expressed here are those of the authors and do not necessarily reflect those of the Federal Reserve Bank of New York or the Federal Reserve System..
Kausar Hamdani, Ph.D. Senior Vice President and Senior Advisor
Edison Reyes Associate
Claire Kramer Mills, Ph.D. Assistant Vice President
Jessica Battisto Senior Analyst
Unequal Access to Credit / Project Overview

5
In this paper, we describe why the Credit Insecurity Index measures credit health more accurately, and how it is calculated from several Community Credit sub-components. We also introduce a typology of severity tiers, which is used to sort communities by distress and to compare and contrast local credit conditions and histories. Lastly, we present index scores side-by-side with human capital, financial well-being, demo-graphic and diversity indicators to allow readers to compare the scores, for each severity tier, with familiar measures of well-being and distress.
TAKEAWAY: Credit constraints matter when assessing the credit health of a community. By omitting their impact, over half of the credit insecurity problem that communities actually contend with, may be missed, and policy and practice may fall short relative to the severity of the need.
Using Credit to Understand Community Well-BeingUsing credit data to measure the credit health of individuals is a familiar application. In the Community Credit framework, we go one step further by using credit data to assess the financial health of a community.
For individuals, credit is a tool to tap future resources for use today. Used prudently, it supports wealth- building, enhances financial security, and provides a buffer for unforeseen emergencies. Given the wide-spread use of financial data in modern economic life, credit behaviors also affect access to broader economic opportunities. For example, the ability to access credit at choice may allow residents to start a business or invest in education and training to build skills. In contrast, individuals who are not in the formal credit economy—that is, those without credit files or credit scores—may find it difficult to obtain a loan at all or on favorable credit terms. In addition, negative credit information may cause them to lose job opportunities, to pay higher insurance rates, find it difficult to rent housing, or to encounter other economic hurdles.
For communities, residents with access to credit at choice are not only personally better off, they are also a source of strength for communal credit health and resiliency. When viewed collectively, residents’ aggregated ability to access credit is a gauge of their community’s credit health. Communities with higher concentrations of individuals with access to credit are better off, all things being equal, than communities with lower concentrations in their potential to pursue upward economic mobility and show resiliency to recover from unexpected adversities.10
10 See Raj Chetty, et al., Where is the land of Opportunity? The Geography of Intergenerational Mobility in the United States , The Quarterly Journal of Economics, Volume 129, Issue 4, November 2014, Pages 1553–1623, https://doi.org/10.1093/qje/qju022
2UNEQUAL ACCESS TO CREDIT
CREDIT INSECURITY INDEX FRAMEWORK

6
However, access to credit must be measured carefully if it is to be an effective lens on community health to inform policy and practice. Unfortunately, credit constraints are rarely incorporated directly in measures of access to credit. Simple measures, such as the share of residents not in the formal credit economy, omit individuals who are in the formal credit economy but are unlikely to obtain a loan because of negative information in their credit files—such as low credit scores, poor debt payment histories, or fully utilized credit lines, among other considerations.11 Such individuals are part of the formal credit economy, given that they have institutional access to mainstream credit products and services, yet they may find it difficult to borrow to pursue opportunity or meet emergencies.12
Consequently, the impact of credit constraints is likely under-measured yet is of high concern to policy-makers and practitioners. All too often, the needs of communities with high concentrations of residents with no or low access to credit at choice–the ‘credit insecure’ communities–may be under-appreciated and under-resourced. This concern may be particularly acute when assessing the credit health of low- and middle-income communities where limited savings, uneven income flow, and liquidity constraints are an everyday challenge for many residents.13
Credit Insecurity Index: Conceptual Components The first step is to distinguish conceptually between administrative access to credit products and services and the ability to borrow at choice.14 While credit data measure the former, individuals seek the latter as a financial asset to build financial security and for economic opportunity.15 This distinction is foundational to how we measure the impact of credit constraints.
A method was needed to parse the institutional access to credit data by the likelihood of individuals obtaining funding at their choice. We use an attributes or hedonic index, which is particularly useful when quality differences are being measured rather than units of goods and services.16 In brief, we combine multiple credit-limiting outcomes within the community into a single place-based score of community credit insecurity, which gauges credit health and financial well-being.
More specifically, we use the Community Credit framework described in Community Credit: A New Perspective on America’s Communities to create the Credit Insecurity Index.17 The following diagram illustrates the index approach.
11 These are just some examples; there are others.12 We are not suggesting that such credit constraints are imprudent or unwarranted.13 See the U.S. Financial Diaries Research Project at https://www.usfinancialdiaries.org/issue14 That is, to borrow an amount at terms and timing of one’s own choosing.15 See An Invisible Finance Sector: How Households Use Financial Tools of Their Own Making, https://www.usfinancialdiaries.org/issue3-informal16 Hedonic modeling was first articulated by Kelvin J. Lancaster in A New Approach to Consumer Theory, available at https://www.jstor.org/stable/
pdf/1828835.pdf?refreqid=excelsior%3Af53eac637d7c6ba8bac6a7391b050bed.
Modern examples include the Index of Economic Freedom by the Heritage Foundation (https://www.heritage.org/index/book/methodology) and the Freedom of the World Index by the Frasier Foundation, Cato Institute, and the German people. In both instances, freedom scores are derived from multiyear qualitative and quantitative data from global sources of qualities that attest to freedom in a country. The country scores are tracked and compared across the globe and time.
For details, see James Gwartney, Robert Lawson, and Joshua Hall, Freedom of the World reports (Vancouver: Fraser Institute). See also Joshua Hall and Robert Lawson, “Economic Freedom of the World: An Accounting of the Literature,” Contemporary Economic Policy 32, no. 1 (2014): 1–19.
17 These ideas are discussed in detail in Community Credit: A New Perspective on America’s Communities, Federal Reserve Bank of New York, 2014.
Unequal Access to Credit / Credit Insecurity Index Framework

7
Credit Insecurity Index
Adult Population(18+ yrs.)
Credit Insecurity
Index Score
Community Credit Indicators
In the Formal Credit Economy
Not in the Formal Credit Economy
Credit Constrained
Included in the Formal Credit Economy
but unlikely to obtain credit at choice
Not included in the Formal Credit Economy
No Revolving Credit
Utilization Rate >100%
Deep Subprime Credit Score
Struggling or Consistently Delinquent Payment History
Not Included in Formal Credit Economy
Credit Limiting Outcomes
In the Community Credit framework, the adult population (18+ years) in the community is divided into two subgroups–those with a credit file and credit score and those without. The two groups are measured by the ‘Included’ and the ‘Not Included’ indicators, respectively, and each group contributes to credit insecu-rity in a different way. A decade’s worth of these data are available at the New York Fed website under Community Credit.18
By definition, residents without a credit file or a credit score are not connected to mainstream credit insti-tutions and are likely to rely on friends, family, or alternative lenders, who may have either limited lending capacity or be a more expensive source of funds than mainstream financial lenders. By not being in the formal credit economy, these residents are likely to face hurdles in their efforts to seek credit from mainstream credit institutions and to access economic opportunities as discussed earlier.19
Credit insecurity in a community may also derive from adults who are in the formal credit economy but have credit histories or items on their credit files that make them higher credit risks. To a ccount for credit-constraining outcomes among residents in the formal credit economy, we apply other Community Credit indicators as credit attributes to quality-adjust the “Included” indicator for credit insecurity.
18 https://www.newyorkfed.org/data-and-statistics/data-visualization/community-credit-profiles#overview19 The first step in obtaining credit from mainstream credit channels is to establish a credit presence in the form of a credit file and credit score.
Responsible credit providers play a key role in helping individuals access affordable funding, especially when the alternatives may be high-cost lenders. High-cost debt is known to exacerbate a household’s financial problems.
Unequal Access to Credit / Credit Insecurity Index Framework

8
Credit Insecurity Scores: A Numerical Example on How to Calculate The Credit Insecurity Index is the sum of two Community Credit indicators: Not Included and Included, quality-adjusted to capture credit outcomes that make it unlikely for residents to obtain credit at choice.
Credit Insecurity Index Components
Credit Insecurity
Index Score
Not Included in the
Formal Credit Economy
Included in the
Formal Credit Economy
1
4
No Revolving
Credit
High Utilization
≥100%
Deep Subprime
Credit Score
Struggling or Consistently Delinquent Payment History
The first element of the index score represents adult residents not included in the formal credit economy; by definition, they are not connected to mainstream credit institutions and are likely to rely on non- traditional sources for their credit needs as noted previously. The Community Credit data indicate that 10.5% of U.S. adults were not included in the formal credit economy as of the fourth quarter of 2018.
The second element of the index score represents adults who are in the formal credit economy but have credit histories or items in their credit files that mark them as higher credit risks. While there are various ways to select this group, we focused on the following credit-limiting outcomes: 1) individuals without a revolving credit product, 2) individuals who have fully- or over-utilized their credit limits, 3) individuals with “deep subprime” credit scores (i.e., an Equifax Credit Risk score of 580 or less), and 4) residents with blemished payment histories (i.e., chronically delinquent or severely overdue on payments during the past five quarters on any debt obligation). We give equal weight to each of these credit attributes in the index. The data indicate that this source of credit insecurity adds another 13.3 points to the Credit Insecurity Index score for the U.S. for the fourth quarter of 2018.
U.S. Credit Insecurity Index Calculation, 2018 Q4
23.8 10.5 89.5 1
4 14.7 6.2 26.0 12.7
Source: FRBNY Consumer Credit Panel/Equifax
Combining the two sources (10.5 plus 13.3), the Credit Insecurity Index score for the U.S. was 23.8 as of the fourth quarter of 2018. In other words, just under half of the credit insecurity in America is due to adults who are not in the formal credit economy, while a little over half is due to credit outcomes that make it difficult for individuals in the formal credit economy to access credit at choice for economic opportunity.
Higher index scores indicate that a community is more credit constrained, or credit insecure, than commu-nities with lower scores. In other words, higher index scores identify communities with a larger share of residents who are unlikely to obtain credit at choice for resiliency or opportunity than communities with lower index scores.
Unequal Access to Credit / Credit Insecurity Index Framework

9
Another way to interpret the index is as follows. If credit insecurity in the U.S. were due solely to adults not connected to mainstream credit institutions, then the Credit Insecurity Index score would be 10.5. How-ever, negative credit outcomes also limit access to credit; in 2018, they caused the U.S. index score to more than double. Access to credit within a community was eroded by adverse credit outcomes for its adult residents, as well as by the presence of adults who are not in the formal credit economy. Altogether, credit insecurity doubled in the U.S. when metrics incorporated the impact of credit constraints.
Since the scores are consistently measured quantities, communities may be compared with each other, and be benchmarked to the U.S., states and counties, and over time. To gauge relative severity, the distribu-tion of scores is sorted into severity tiers, from a low severity tier called “credit-assured” to a high severity tier called “credit-insecure.”
Once we calculate an index score, the community is sorted into one of the five mutually exclusive tiers of relative severity shown in the following table:
Typology of Severity Tiers for the Credit Insecurity Index
Credit Insecurity Index Tier Description Associated Score Range
Credit-Assured Tier index score falls into the best-performing tier <19
Credit-Likely Tier index score falls into the second-best-performing tier 19—23
Mid-Tier index score falls into the middle-performing tier 24—28
Credit-At-Risk Tier index score falls into the second-worst-performing tier 29—35
Credit-Insecure Tier index score falls into the worst-performing tier ≥36
The index score and severity tier are two ways to characterize the impact of credit constraints on a com-munity’s credit health. Details on the credit-limiting outcomes are provided in the Methodology paper.
Credit Insecurity Index Scores Align with Economic Indicators of Well-BeingAs a test-of-concept exercise, we compared Credit Insecurity Index scores with measures of well-being frequently used by community development stakeholders. The following table presents economic indicators for U.S. counties, where data are available, grouped by the severity tiers of the Credit Insecurity Index as of the fourth quarter of 2018.20 We present three clusters of economic indicators—Demographics and Diversity, Human Capital, and Financial Well-Being.
20 For more on the risks of borrowing from family members, see https://www.cnbc.com/2019/04/02/taking-a-loan-from-family-is-risky-for-both-lender-and-borrower.html.
Unequal Access to Credit / Credit Insecurity Index Framework

10
Economic Indicators for U.S. Counties Grouped by Credit Insecurity Index Tiers, 2018 Q4
2018 Q4 Demographics and Diversity IndicatorsHuman Capital
Indicators
Financial Well-Being Indicators
Credit Insecurity Index Tiers
Number of counties
% of U.S. adult pop.
% change in adult
pop., 2007–2018
% of pop. in rural
counties
% of pop. that is non- white
% of pop. that is Black
or African American*
% of pop. that is
Hispanic or Latino
% of adults w/o HS diploma
% of adults (16+) not in
workforce
Avg. of median
household income ratios**
% of U.S.
adult pop. below
poverty level
% of formal credit
economy with a
subprime credit score
% of adult
pop. not in the formal credit
economy
Credit-Assured Counties (<19) 685 26.4 10.9 10.0 26.8 6.1 10.9 8.9 33.6 1.03 9.4 22.3 5.0
Credit-Likely Counties (19–23) 611 23.7 12.2 11.4 32.5 10.1 13.2 10.9 36.1 0.94 13.2 28.4 9.0
Mid-Tier Counties (24–28) 717 30.6 12.5 11.3 46.4 14.0 24.0 14.7 37.2 0.90 16.1 34.0 11.8
Credit-At-Risk Counties (29–35) 643 14.4 11.3 23.2 47.3 18.8 22.0 16.7 38.9 0.83 19.5 39.5 15.5
Credit-Insecure Counties (≥36) 426 5.0 9.7 36.1 54.6 25.2 21.6 18.6 44.3 0.74 24.9 44.4 24.2
U.S. — — 11.7 14.2 38.5 12.3 17.6 12.8% 36.6 — 14.6 30.5 10.5
* The percentage of the population that is Black or African American listed under the Not Hispanic or Latino classification in the U.S. Census 2013–17 5-Year American Community Survey.
**The average of ratios of the county median household income to its state median household income.
Sources: FRBNY Consumer Credit Panel/Equifax, U.S. Census Population Estimates Program, U.S. Census 2013–17 5-Year American Community Survey
Overall, the credit insecurity scores align with other markers of economic well-being and distress. Compared with other counties, the credit-insecure and the credit-at-risk counties are often rural, have lower median income ratios and higher poverty rates, more unemployed workers, a less educated talent pool, and higher African-American and Hispanic shares of the population. For example, while 27% of the population in the credit-assured counties is non-white, 58% of the population in the credit-insecure counties is non-white.
The financial well-being indicators for the credit-insecure tier of counties show that one in four adult resi-dents is not in the formal credit economy and that those in it have credit-quality issues such as low credit scores. As a result, many residents in these communities are unlikely to obtain loans easily at choice. Without access to mainstream credit institutions, residents will need to rely on alternative sources such as friends, family, pawnbrokers, and others who may be high cost and have limited capacity to lend.21 Numerous studies have described the cycle of costly debt that many households cannot escape. Yet, such families are most in need of funding for emergencies since studies have documented that they often have little to no savings.22
21 For more on the risks of borrowing from family members, see https://www.cnbc.com/2019/04/02/taking-a-loan-from-family-is-risky-for-both-lender-and-borrower.html.
22 See The U.S. Financial Diaries: https://www.usfinancialdiaries.org/ and also see the various reports and research produced by ALICE: https://www.unitedforalice.org/all-reports
Unequal Access to Credit / Credit Insecurity Index Framework

11
Practical Applications of the Credit Insecurity Analytics All too often, experts are well versed in local issues but are unable to benchmark how their community compares with the larger ecosystem of the nation or other communities. The index analytics, presented in the following papers, provide a common set of facts to quantify how communities compare with one another. The scores place communities on a single spectrum across geography and time to better identify, describe, and compare the American credit experience.
Each paper presents the evidence in a comprehensive and multilayered way—at the national, state, and county levels—using annual time-series data for 2005 through 2018. Since the sample period encompass-es the Great Recession and the subsequent credit recovery, we use 2007, 2012, and 2018 as benchmark years to examine credit insecurity under varying macroeconomic environments, and to gauge progress over time.
The evidence is presented to be accessible to the non-technical reader. The data maps are designed to conveniently identify the most credit insecure communities, to inform resource choices among competing communities and goals, and to guide where new or additional investments could generate the greatest impact.
No particular policy actions or goals are advocated; the analytics provide evidence on the impact of credit constraints on credit health, which can help frame policy questions more accurately, monitor progress, and evaluate social impacts over time and among communities.
The views expressed here are those of the authors and do not necessarily reflect those of the Federal Reserve Bank of New York or the Federal Reserve System..
Kausar Hamdani, Ph.D. Senior Vice President and Senior Advisor
Edison Reyes Associate
Claire Kramer Mills, Ph.D. Assistant Vice President
Jessica Battisto Senior Analyst
Unequal Access to Credit / Credit Insecurity Index Framework

12
In this paper, we use the Credit Insecurity Index to identify the broad contours of financial health of American communities as of the fourth quarter of 2018. We provide a snapshot of scores for the U.S., all 50 states and most of the country’s 3,142 counties for this period. Each score reflects access to credit at choice to pursue economic opportunity and build financial well-being in a community. Higher scores reflect more credit insecurity and worse credit health, and vice versa.
TAKEAWAY: The impact of credit constraints on credit health varies considerably across commu-nities. Underlying the national credit insecurity score of 23.8 points, there is wide heterogeneity of credit conditions at the state and county levels in America. Altogether, 426 U.S. counties are identi-fied as in the most severe credit insecurity tier. Another 643 counties are identified as in the second most severe tier. Geographically, there is some clustering of credit-insecure counties in the south and south-west regions of the country.
About the Credit Insecurity Index
3UNEQUAL ACCESS TO CREDIT
CREDIT INSECURITY SNAPSHOT, 2018 Q4
The Credit Insecurity Index combines multiple credit-limiting outcomes into a single score to gauge ‘credit insecurity’ or lack of access to credit at choice for a community. The first component of the score is the relative size of the not-included in the formal credit economy or the share of residents not having a credit file or score. The second component is the size of the formal credit economy adjusted to reflect outcomes that limit borrowing at choice such as having no revolving credit products, fully utilized credit lines, a low credit score, or a poor repayment history. We calculate a score for the U.S., all 50 states and most of the 3,142 counties using the following formula.
Since the scores are consistently measured quantities, communities may be compared with each other, on a severity scale, from the lowest severity called “credit-assured” to the highest severity called “credit-insecure.”
Credit Insecurity Severity Tiers
CREDIT-ASSURED TIER
Index Score range: <19
CREDIT-INSECURE TIER
Index score range: ≥36
CREDIT-LIKELY TIER
Index score range: 19–23
CREDIT MID- TIER
Index score range: 24–28
CREDIT-AT-RISK TIER
Index score range: 29–35
LEAST CREDIT INSECURE MOST CREDIT INSECURE
Credit Insecurity Index Components
Credit Insecurity
Index Score
Not Included in the
Formal Credit Economy
Included in the
Formal Credit Economy
1
4
No Revolving
Credit
High Utilization
≥100%
Deep Subprime
Credit Score
Struggling or Consistently Delinquent Payment History
13
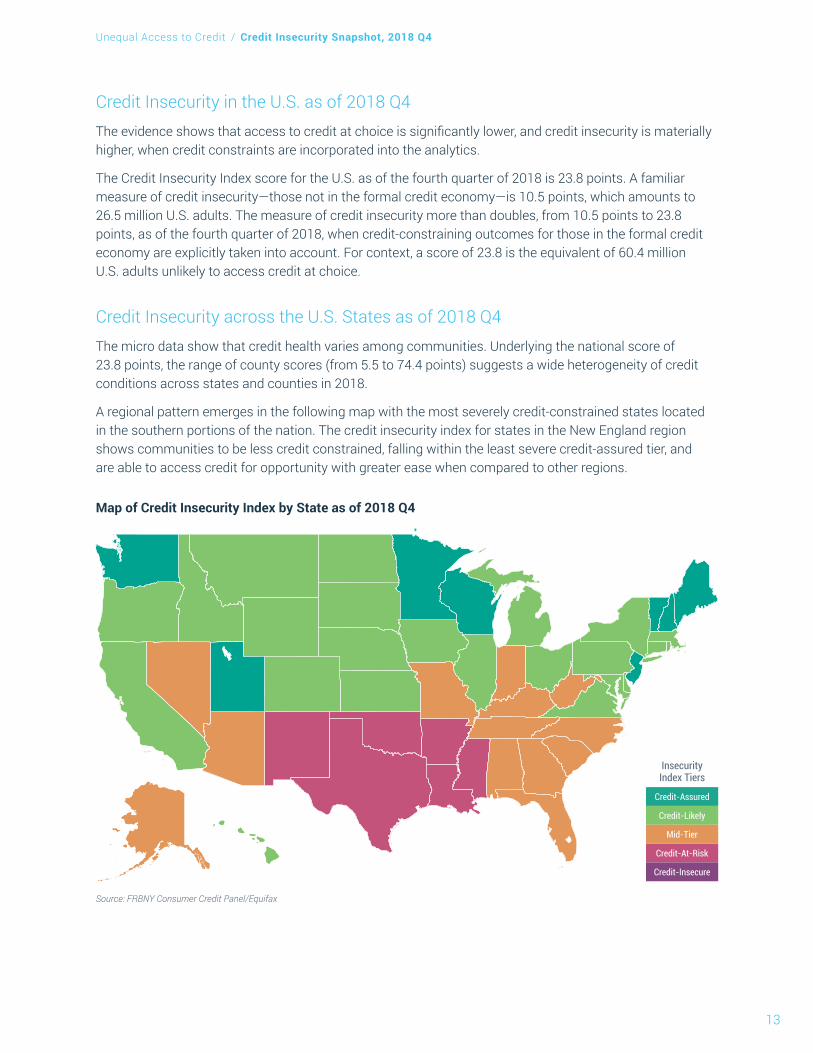
Credit Insecurity in the U.S. as of 2018 Q4The evidence shows that access to credit at choice is significantly lower, and credit insecurity is materially higher, when credit constraints are incorporated into the analytics.
The Credit Insecurity Index score for the U.S. as of the fourth quarter of 2018 is 23.8 points. A familiar measure of credit insecurity—those not in the formal credit economy—is 10.5 points, which amounts to 26.5 million U.S. adults. The measure of credit insecurity more than doubles, from 10.5 points to 23.8 points, as of the fourth quarter of 2018, when credit-constraining outcomes for those in the formal credit economy are explicitly taken into account. For context, a score of 23.8 is the equivalent of 60.4 million U.S. adults unlikely to access credit at choice.
Credit Insecurity across the U.S. States as of 2018 Q4The micro data show that credit health varies among communities. Underlying the national score of 23.8 points, the range of county scores (from 5.5 to 74.4 points) suggests a wide heterogeneity of credit conditions across states and counties in 2018.
A regional pattern emerges in the following map with the most severely credit-constrained states located in the southern portions of the nation. The credit insecurity index for states in the New England region shows communities to be less credit constrained, falling within the least severe credit-assured tier, and are able to access credit for opportunity with greater ease when compared to other regions.
Map of Credit Insecurity Index by State as of 2018 Q4
Source: FRBNY Consumer Credit Panel/Equifax
Credit-At-Risk
Credit-Likely
Credit-Assured
Mid-Tier
Credit-Insecure
Insecurity Index Tiers
Unequal Access to Credit / Credit Insecurity Snapshot, 2018 Q4

14
Among states in 2018, Mississippi ranked as the most credit-insecure in the nation. Arkansas, Texas, Louisiana, and Oklahoma ranked as the next most credit insecure states. In contrast, states ranked as the least credit insecure are New Hampshire, Minnesota, Vermont, New Jersey and Maine.
Credit Insecurity among U.S. Counties in 2018 Q4The credit insecurity landscape is more complex at the county level. The following map shows the Credit Insecurity Index scores for most of the 3,142 U.S. counties as of the fourth quarter of 2018. Our threshold for calculating county-level measures is a sample minimum of 50 observations per county, which represents a minimum of 1,000 adult residents. Consequently, 60 counties are unmapped and not included in this analysis. For 2018, we analyze 3,082 counties.
A regional pattern at the county level is more nuanced than for states because credit-insecure counties exist in states with low overall index scores.
Map of Credit Insecurity Index Scores by County as of 2018 Q4
Source: FRBNY Consumer Credit Panel/Equifax
The following histogram shows the distribution of scores for U.S. counties, color-sorted by the five tiers of severity, as of the fourth quarter of 2018.23
23 Puerto Rico has 46 counties that rank among the weakest performers. We do not discuss them in this report since their dynamics may be different from those of the mainland states and counties.
Credit-At-Risk
Credit-Likely
Credit-Assured
Mid-Tier
Credit-Insecure
Insecurity Index Tiers
Unmapped
Unequal Access to Credit / Credit Insecurity Snapshot, 2018 Q4

15
Credit Insecurity Index Histogram for U.S. Counties as of 2018 Q4
Source: FRBNY Consumer Credit Panel/Equifax
Num
ber o
f Cou
nties
0
40
80
120
160
Credit Insecurity Index5 10 15 20 25 30 35 40 45 50 55 60 65 65
Credit-At-Risk
Credit-Likely
Credit-Assured
Mid-Tier
Credit-Insecure
Insecurity Index Tiers
To identify regional concentrations of credit insecurity at the county level, we highlight counties in the two most severe tiers, the credit-insecure and the credit-at-risk tiers, in the following two maps. The credit-insecure tier is the group most in need; the credit-at-risk tier counties may be in transition in their credit trajectories, whether positively or negatively.24
Altogether, 426 U.S. counties are sorted into the most severe, credit-insecure, tier. They are indicated in the following map. Many are clustered in the south and south-west regions of the country.
Map of Counties Identified as in the Credit-Insecure Tier as of 2018 Q4
Credit-At-Risk
Credit-Likely
Credit-Assured
Mid-Tier
Credit-Insecure
Insecurity Index Tiers
Unmapped
Source: FRBNY Consumer Credit Panel/Equifax
24 Mobility in credit insecurity is discussed in a later paper.
Unequal Access to Credit / Credit Insecurity Snapshot, 2018 Q4

16
The fifty counties scoring highest in credit insecurity as of the fourth quarter of 2018 are shown in the following table.
50 Most Credit-Insecure Counties in the U.S. as of 2018 Q4
County/State State Credit Insecurity Index ScoreAleutians West Census Area Alaska 74.4Todd County South Dakota 70.5North Slope Borough Alaska 68.3Kusilvak Census Area Alaska 67.3Crowley County Colorado 66.8Oglala Lakota County South Dakota 66.1Stewart County Georgia 66.0Telfair County Georgia 65.2Concho County Texas 65.0Wheeler County Georgia 64.3Lake County Tennessee 63.8Garza County Texas 62.7Sioux County North Dakota 62.6Northwest Arctic Borough Alaska 62.2Calhoun County Georgia 62.0Lafayette County Florida 61.1Glades County Florida 60.6Yukon-Koyukuk Census Area Alaska 57.5Bethel Census Area Alaska 57.3Dooly County Georgia 57.1Newton County Texas 57.1San Juan County Utah 55.6Radford City Virginia 55.6Gilmer County West Virginia 55.6Bent County Colorado 55.4La Salle County Texas 55.1West Feliciana Parish Louisiana 54.8Frio County Texas 54.6Reeves County Texas 54.5Tallahatchie County Mississippi 54.4Apache County Arizona 54.4Walker County Texas 54.0Dillingham Census Area Alaska 54.0Union County Florida 53.6Harrisonburg City Virginia 53.5Marion County Georgia 53.4Johnson County Georgia 53.2Greensville County Virginia 53.1East Carroll Parish Louisiana 52.8Pershing County Nevada 52.7Lincoln County Arkansas 52.7Macon County Georgia 52.5Yazoo County Mississippi 52.4La Paz County Arizona 52.1Charlton County Georgia 51.9Saguache County Colorado 51.7Tattnall County Georgia 51.7Jenkins County Georgia 51.5Corson County South Dakota 51.1Quitman County Mississippi 51.0
Unequal Access to Credit / Credit Insecurity Snapshot, 2018 Q4
17
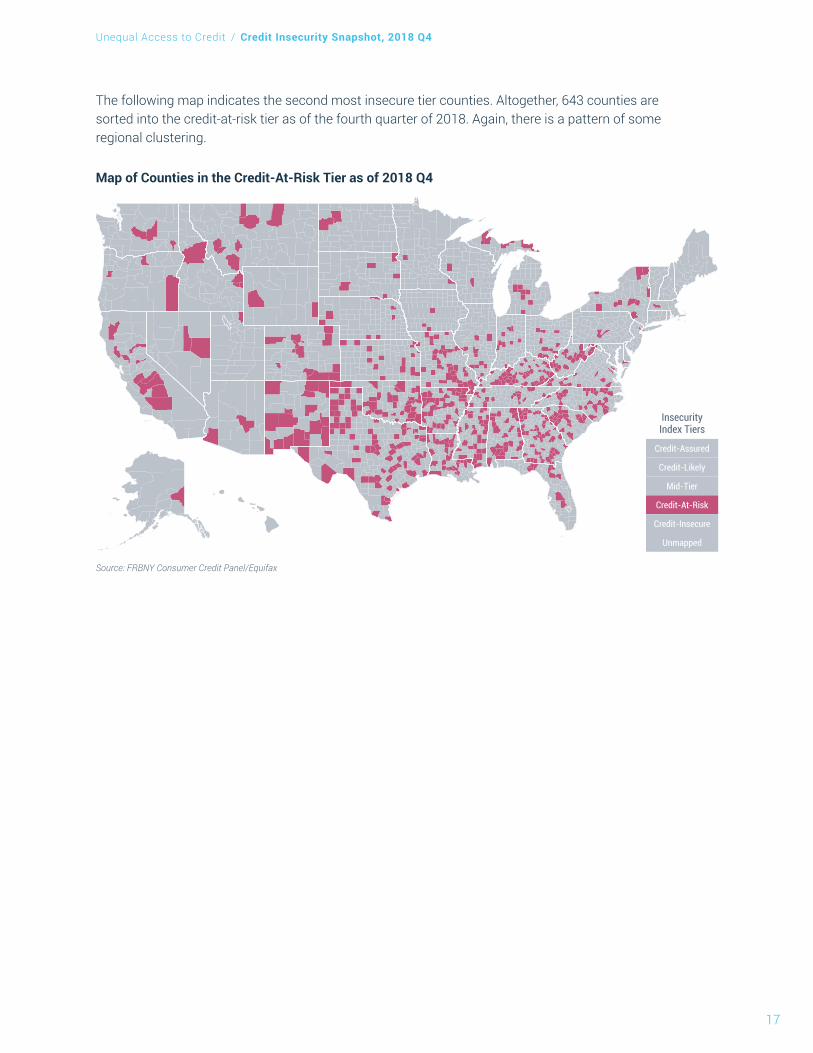
The following map indicates the second most insecure tier counties. Altogether, 643 counties are sorted into the credit-at-risk tier as of the fourth quarter of 2018. Again, there is a pattern of some regional clustering.
Map of Counties in the Credit-At-Risk Tier as of 2018 Q4
Credit-At-Risk
Credit-Likely
Credit-Assured
Mid-Tier
Credit-Insecure
Insecurity Index Tiers
Unmapped
Source: FRBNY Consumer Credit Panel/Equifax
Unequal Access to Credit / Credit Insecurity Snapshot, 2018 Q4

18
Another way to understand geographic clustering is to view the distribution of credit-insecure counties by state. In the following chart, the geographic distribution of the most credit-insecure (score ≥36) counties by state is shown as of the fourth quarter of 2018.
Number of Counties in Each State Scored as Credit-Insecure as of 2018 Q4
Source: FRBNY Consumer Credit Panel/Equifax
0 5 10 15 20 25 30 35 40 45 50 55 60Number of Credit-Insecure Counties
TexasGeorgiaMississippiFloridaKentuckyOklahomaArkansasVirginiaLouisianaMissouriNorth CarolinaTennesseeAlabamaAlaskaSouth CarolinaColoradoIllinoisKansasWest VirginiaArizonaSouth DakotaMontanaNebraskaNew MexicoNorth DakotaPennsylvaniaCaliforniaIndianaMichiganIdahoMarylandNevadaOhioUtahWashingtonWyomingIowaMinnesotaNew JerseyNew York
Texas has the largest number of counties in this tier (60), which account for 8.8% of Texas’s adult population, followed by Georgia and Mississippi. In contrast, Connecticut, Delaware, Hawaii, Maine, Massachusetts, New Hampshire, Oregon, Rhode Island, Vermont, and Wisconsin have no credit- insecure counties. As such, these states are not shown in the chart for visual ease.
However, some states have more counties than others, which affects how to think about regional concentrations of credit insecurity. In the following chart, the share of counties in each state that is scored as credit-insecure is shown.
Unequal Access to Credit / Credit Insecurity Snapshot, 2018 Q4

19
Share of Counties in Each State That Are Scored as Credit-Insecure as of 2018 Q4
Source: FRBNY Consumer Credit Panel/Equifax
0% 5% 10% 15% 20% 25% 30% 35% 40% 45% 50%Share of Counties that are Credit-Insecure
ArizonaAlaskaMississippiFloridaGeorgiaTexasOklahomaLouisianaArkansasSouth CarolinaKentuckyAlabamaNew MexicoColoradoWest VirginiaNorth CarolinaTennesseeVirginiaNevadaMontanaMissouriSouth DakotaNorth DakotaWyomingMarylandIllinoisKansasNebraskaPennsylvaniaUtahCaliforniaWashingtonMichiganNew JerseyIdahoIndianaOhioNew YorkMinnesotaIowa
Texas, for example, has more counties than any other U.S. state. If concentration is measured as a share of the total number of counties, then Texas drops from the top position to number six. Instead, Arizona is at the top of the list with the largest share of its counties in the credit-insecure tier (46.7%), which account for 11.7% of Arizona’s adult population. Meanwhile, Minnesota and Iowa remain at the bottom of the list with the fewest shares of counties in the credit-insecure tier.
Also, some counties have larger populations than others; the share of the state population residing in cred-it-insecure counties is another metric of impact and is presented in the chart on the following page. By this metric, Mississippi ranks number one, followed by Louisiana and Pennsylvania. Viewed by share of adult population, Texas now ranks thirteenth highest and Arizona ranks fourth highest.
Unequal Access to Credit / Credit Insecurity Snapshot, 2018 Q4

20
Share of State Population Residing in Counties Scored as Credit-Insecure as of 2018 Q4
Source: FRBNY Consumer Credit Panel/Equifax
0% 5% 10% 15% 20% 25%Share of State Population
MississippiLouisianaPennsylvaniaArizonaGeorgiaWest VirginiaVirginiaMarylandOklahomaAlaskaArkansasMissouriTexasNew MexicoWyomingAlabamaNew YorkKentuckySouth CarolinaSouth DakotaKansasNorth CarolinaMontanaIndianaNorth DakotaTennesseeFloridaColoradoNew JerseyNebraskaUtahIllinoisMichiganIdahoWashingtonOhioIowaCaliforniaNevadaMinnesota
The views expressed here are those of the authors and do not necessarily reflect those of the Federal Reserve Bank of New York or the Federal Reserve System..
Kausar Hamdani, Ph.D. Senior Vice President and Senior Advisor
Edison Reyes Associate
Claire Kramer Mills, Ph.D. Assistant Vice President
Jessica Battisto Senior Analyst
Unequal Access to Credit / Credit Insecurity Snapshot, 2018 Q4

21
In this paper, we use the Credit Insecurity Index to identify key trends in credit insecurity during 2005 to 2018, a period that experienced a variety of credit conditions including a financial crisis, the Great Reces-sion, and subsequent credit recovery. This period is an informative lens on how credit health and financial security respond, at various levels of community, to macro forces pulling at the economy.
TAKEAWAY: The impacts of credit constraints vary with macroeconomic conditions. The index shows a pro-cyclical pattern with a lag during 2005 to 2018 when the U.S. economy suffered major economic disruptions and a recovery. Access to credit for opportunity was depressed in the nation and most communities during the financial crisis and recession through 2012. Unfortunately, the credit recovery, as of the fourth quarter of 2018, remains below 2007 levels of credit health for the U.S. as a whole and for many counties.
About the Credit Insecurity Index
UNEQUAL ACCESS TO CREDIT
CREDIT INSECURITY TRENDS 4
The Credit Insecurity Index combines multiple credit-limiting outcomes into a single score to gauge ‘credit insecurity’ or lack of access to credit at choice for a community. The first component of the score is the relative size of the not-included in the formal credit economy or the share of residents not having a credit file or score. The second component is the size of the formal credit economy adjusted to reflect outcomes that limit borrowing at choice such as having no revolving credit products, fully utilized credit lines, a low credit score, or a poor repayment history. We calculate a score for the U.S., all 50 states and most of the 3,142 counties using the following formula.
Since the scores are consistently measured quantities, communities may be compared with each other, on a severity scale, from the lowest severity called “credit-assured” to the highest severity called “credit-insecure.”
Credit Insecurity Severity Tiers
CREDIT-ASSURED TIER
Index Score range: <19
CREDIT-INSECURE TIER
Index score range: ≥36
CREDIT-LIKELY TIER
Index score range: 19–23
CREDIT MID- TIER
Index score range: 24–28
CREDIT-AT-RISK TIER
Index score range: 29–35
LEAST CREDIT INSECURE MOST CREDIT INSECURE
Credit Insecurity Index Components
Credit Insecurity
Index Score
Not Included in the
Formal Credit Economy
Included in the
Formal Credit Economy
1
4
No Revolving
Credit
High Utilization
≥100%
Deep Subprime
Credit Score
Struggling or Consistently Delinquent Payment History

22
Credit Insecurity in the U.S. from 2005 to 2018The following chart shows the 2005–18 history of credit insecurity for the U.S. and its two component drivers—the share of adult residents Not Included in the formal credit economy and impact of credit constraints on residents who are in the formal credit economy but have credit outcomes that make it unlikely for them to obtain a loan at their choice on affordable terms.
U.S. Credit Insecurity Index between 2005 and 2018
Source: FRBNY Consumer Credit Panel/Equifax
0
5
10
15
20
25
30
2005 2006 2007 2008 2009 2010 2011 2012 2013 2014 2015 2016 2017 2018
Not Included in the Formal Credit Economy Included in the Formal Credit Economy with Credit Constraints Credit Insecurity Index
The index shows improving credit health for the U.S. leading up to 2007, followed by a worsening through 2012. While credit insecurity improved after 2012, as of the fourth quarter of 2018 it remains above the 2007 level by 0.9 points. In other words, a full recovery of U.S. credit insecurity relative to 2007 has not yet been achieved.
Credit Insecurity among States from 2005 to 2018The pro-cyclical pattern is also apparent at the state level. In the chart below, the range of scores for U.S. states is shown by year. Note how the distribution range shifts higher between 2007 and 2012 and shifts lower thereafter. This shift mimics the U.S. pattern seen in the previous chart.
Credit Insecurity Index by State from 2005 to 2018
15
20
25
30
35
40
2005 2006 2007 2008 2009 2010 2011 2012 2013 2014 2015 2016 2017 2018
Source: FRBNY Consumer Credit Panel/Equifax
Unequal Access to Credit / Credit Insecurity Trends

23
The chart below shows the change in the index score by state between 2007 and 2018.
Post-Financial Crisis Change in Credit Insecurity Index Score by State between 2007 and 2018
Improved Not ImprovedNYWIVTUTILGANJNHRIMICATXARMATNMOMENEMNMS
-5 +5-4 +4-3 +3-2 +2-1 +10Change in Credit Insecurity Index Score
Source: FRBNY Consumer Credit Panel/Equifax
KSIASCAKKYPAOHSDCOORALIDOKMDDCWAINNDCTVANCNMLAAZDEMTNVHIFLWVWY
+0.91
Among the 50 states, New York had the best 2007 to 2018 improvement (-3.1 points) and its recovery was considerably stronger than that of the U.S. (+0.9 points) for the same time period.25 Wisconsin, Vermont, and Utah also improved better than their 2007 level of credit health (by about 1 point).
States with near zero values on the chart, such as New Hampshire and New Jersey, are examples of states that achieved a full recovery to their 2007 level of credit health.
Unfortunately, states such as Wyoming (+4.7 points) had the weakest 2007 to 2018 recovery in the nation. Other states with similarly incomplete recoveries (+3 to +4 points) are West Virginia, Florida, Hawaii, Neva-da and Montana.
25 Recall that lowering the credit insecurity score is an improvement in credit health. The U.S. score in 2018 is still 0.9 points above its 2007 value, which means that the U.S. is still more credit insecure in 2018 relative to 2007.
Unequal Access to Credit / Credit Insecurity Trends
24
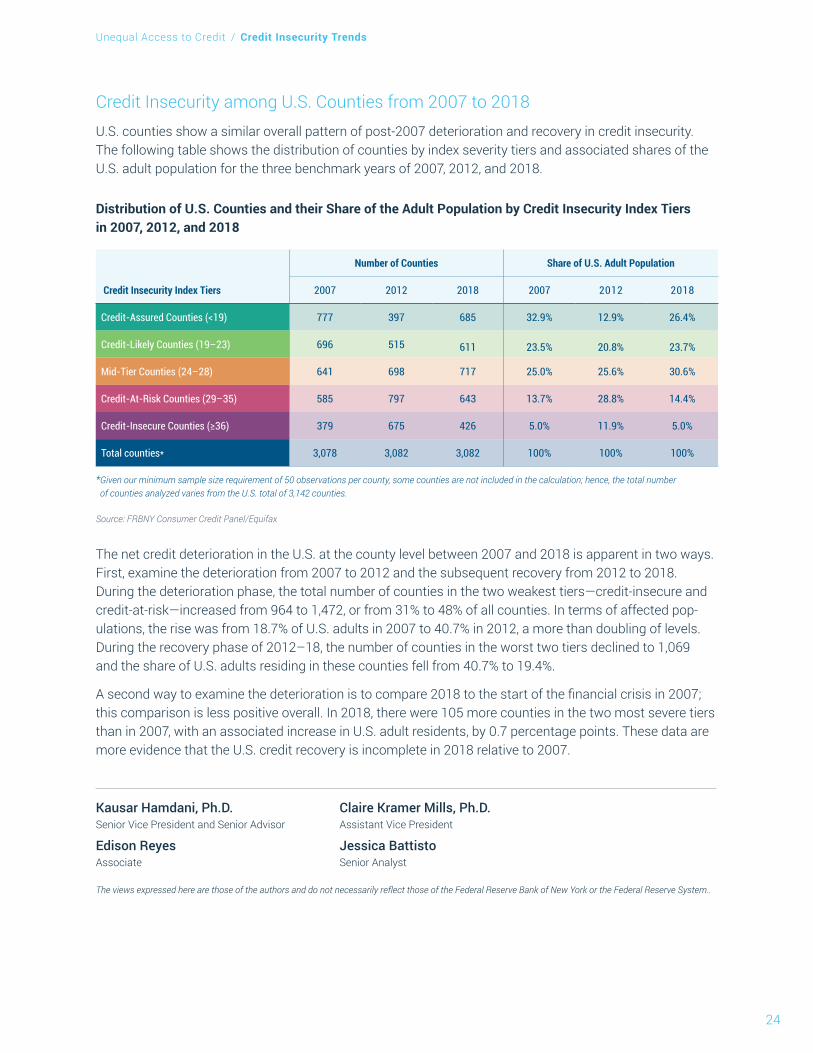
Credit Insecurity among U.S. Counties from 2007 to 2018U.S. counties show a similar overall pattern of post-2007 deterioration and recovery in credit insecurity. The following table shows the distribution of counties by index severity tiers and associated shares of the U.S. adult population for the three benchmark years of 2007, 2012, and 2018.
Distribution of U.S. Counties and their Share of the Adult Population by Credit Insecurity Index Tiers in 2007, 2012, and 2018
Number of Counties Share of U.S. Adult Population
Credit Insecurity Index Tiers 2007 2012 2018 2007 2012 2018
Credit-Assured Counties (<19) 777 397 685 32.9% 12.9% 26.4%
Credit-Likely Counties (19–23) 696 515 611 23.5% 20.8% 23.7%
Mid-Tier Counties (24–28) 641 698 717 25.0% 25.6% 30.6%
Credit-At-Risk Counties (29–35) 585 797 643 13.7% 28.8% 14.4%
Credit-Insecure Counties (≥36) 379 675 426 5.0% 11.9% 5.0%
Total counties* 3,078 3,082 3,082 100% 100% 100%
* Given our minimum sample size requirement of 50 observations per county, some counties are not included in the calculation; hence, the total number of counties analyzed varies from the U.S. total of 3,142 counties.
Source: FRBNY Consumer Credit Panel/Equifax
The net credit deterioration in the U.S. at the county level between 2007 and 2018 is apparent in two ways. First, examine the deterioration from 2007 to 2012 and the subsequent recovery from 2012 to 2018. During the deterioration phase, the total number of counties in the two weakest tiers—credit-insecure and credit-at-risk—increased from 964 to 1,472, or from 31% to 48% of all counties. In terms of affected pop-ulations, the rise was from 18.7% of U.S. adults in 2007 to 40.7% in 2012, a more than doubling of levels. During the recovery phase of 2012–18, the number of counties in the worst two tiers declined to 1,069 and the share of U.S. adults residing in these counties fell from 40.7% to 19.4%.
A second way to examine the deterioration is to compare 2018 to the start of the financial crisis in 2007; this comparison is less positive overall. In 2018, there were 105 more counties in the two most severe tiers than in 2007, with an associated increase in U.S. adult residents, by 0.7 percentage points. These data are more evidence that the U.S. credit recovery is incomplete in 2018 relative to 2007.
The views expressed here are those of the authors and do not necessarily reflect those of the Federal Reserve Bank of New York or the Federal Reserve System..
Kausar Hamdani, Ph.D. Senior Vice President and Senior Advisor
Edison Reyes Associate
Claire Kramer Mills, Ph.D. Assistant Vice President
Jessica Battisto Senior Analyst
Unequal Access to Credit / Credit Insecurity Trends

25
In this paper, we use the Credit Insecurity Index to benchmark mobility or changes in accessing credit for opportunity and resiliency. From a policy perspective, both change and no change are of interest. Communities experiencing improvement are worth examining to identify “best strategies and practices.” Communities showing deterioration are candidates for intervention to arrest and even reverse their negative trajectories. No change is equally important because credit insecurity has persisted in these communities for over a decade; these places are mired on the wrong side of the divide in access to credit for opportunity and resiliency.
Since progress, or lack thereof, may be measured in various ways, we use two markers of credit mobility—migration among index severity tiers, and a change in the index score—at three benchmark points in time—2007 and 2012 as economic turning points, and 2018 as the present—from which to assess the direction and magnitude of change.
TAKEAWAY: The evidence suggests that progress is infrequent and credit insecurity is persistent. From 2007 to 2018, the overall distribution of counties shifted towards greater credit insecurity with 22.6%, or 825, of counties experiencing tier downgrades. Among the majority (58.2% or 1,790) of counties that remained in their 2007 severity tiers, 286 counties remained in the most severe credit insecurity tier. Put differently, counties that remained in the two most credit insecure tiers are the home for 11.5% of the U.S. adult population. Even during the recovery period of 2012–18 when the entire nation was improving, credit-insecure counties were more likely to have a weaker-than-U.S. progress trajectory than other tiers.
5UNEQUAL ACCESS TO CREDIT
EVIDENCE OF PROGRESS IN CREDIT INSECURITY

26
About the Credit Insecurity Index
The Credit Insecurity Index combines multiple credit-limiting outcomes into a single score to gauge ‘credit insecurity’ or lack of access to credit at choice for a community. The first component of the score is the relative size of the not-included in the formal credit economy or the share of residents not having a credit file or score. The second component is the size of the formal credit economy adjusted to reflect outcomes that limit borrowing at choice such as having no revolving credit products, fully utilized credit lines, a low credit score, or a poor repayment history. We calculate a score for the U.S., all 50 states and most of the 3,142 counties using the following formula.
Since the scores are consistently measured quantities, communities may be compared with each other, on a severity scale, from the lowest severity called “credit-assured” to the highest severity called “credit-insecure.”
Credit Insecurity Severity Tiers
CREDIT-ASSURED TIER
Index Score range: <19
CREDIT-INSECURE TIER
Index score range: ≥36
CREDIT-LIKELY TIER
Index score range: 19–23
CREDIT MID- TIER
Index score range: 24–28
CREDIT-AT-RISK TIER
Index score range: 29–35
LEAST CREDIT INSECURE MOST CREDIT INSECURE
Credit Insecurity Index Components
Credit Insecurity
Index Score
Not Included in the
Formal Credit Economy
Included in the
Formal Credit Economy
1
4
No Revolving
Credit
High Utilization
≥100%
Deep Subprime
Credit Score
Struggling or Consistently Delinquent Payment History
Unequal Access to Credit / Evidence of Progress in Credit Insecurity
27
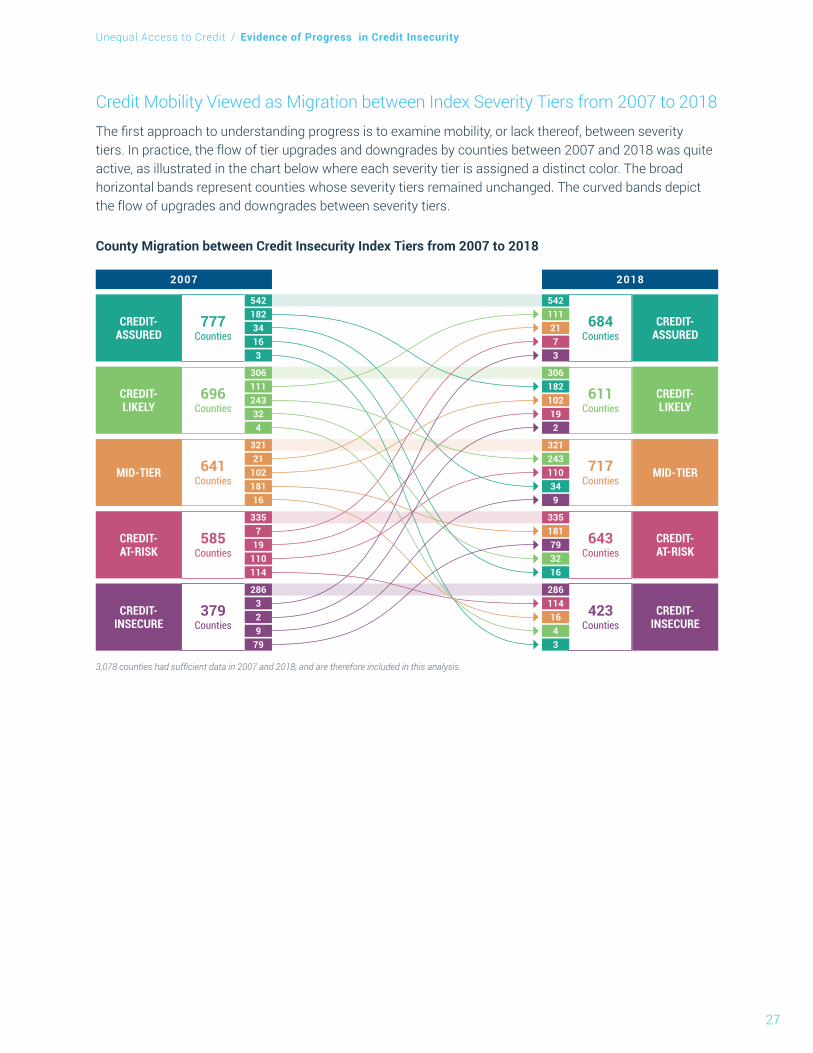
Credit Mobility Viewed as Migration between Index Severity Tiers from 2007 to 2018The first approach to understanding progress is to examine mobility, or lack thereof, between severity tiers. In practice, the flow of tier upgrades and downgrades by counties between 2007 and 2018 was quite active, as illustrated in the chart below where each severity tier is assigned a distinct color. The broad horizontal bands represent counties whose severity tiers remained unchanged. The curved bands depict the flow of upgrades and downgrades between severity tiers.
County Migration between Credit Insecurity Index Tiers from 2007 to 2018
2007 2018
3,078 counties had sufficient data in 2007 and 2018, and are therefore included in this analysis.
54218234163
CREDIT- ASSURED
306111243324
CREDIT- LIKELY
32121
10218116
MID-TIER
3357
19110114
CREDIT- AT-RISK
286329
79
5421112173
306182102192
321243110349
335181793216
2861141643
CREDIT- INSECURE
CREDIT- ASSURED
CREDIT- LIKELY
MID-TIER
CREDIT- AT-RISK
CREDIT- INSECURE
777 Counties
696 Counties
641 Counties
585 Counties
379 Counties
684 Counties
611 Counties
717 Counties
643 Counties
423 Counties
Unequal Access to Credit / Evidence of Progress in Credit Insecurity

28
Counties without Tier MigrationThe first pattern to notice is that most counties remained in their original 2007 severity tier. From 2007 to 2018, 1,790 counties remained in their credit tier and account for 172.8 million people, or 68.1%, of the total U.S. adult population. While counties with the least credit insecurity maintained their ability to access credit for economic opportunity and resiliency, the history is discouraging for counties in the worst two severity tiers where a lack of access to credit for opportunity persisted over the decade.
� Credit-Assured and Credit-Likely Counties: Compositionally, 542 counties remained in the best per-forming, credit-assured, tier while 306 counties remained in the second best, credit-likely, tier. Altogether, these counties are the home of 51.0 million adults or 20% of the U.S. adult population.
� Credit Mid-Tier Counties: An additional 321 counties remained in the credit mid-tier, and are the home of another 25.5 million adults or 10% of the U.S. adult population.
� Credit-At-Risk and Credit-Insecure Counties: Unfortunately, 286 counties remained in the worst tier and 335 counties remained in the second worst tier during 2007–18. Together, these counties are the home of another 29.2 million adults or 11.5% of the U.S. adult population. This history of non-improve-ment identifies communities with entrenched credit insecurity. Examples are Bronx County, New York; Philadelphia County, Pennsylvania; and Hidalgo County, Texas among other examples.26
Counties without Tier Migration from 2007 to 2018
2007 2018
3,078 counties had sufficient data in 2007 and 2018, and are therefore included in this analysis.
54218234163
CREDIT- ASSURED
306111243324
CREDIT- LIKELY
32121
10218116
MID-TIER
3357
19110114
CREDIT- AT-RISK
286329
79
5421112173
306182102192
321243110349
335181793216
2861141643
CREDIT- INSECURE
CREDIT- ASSURED
CREDIT- LIKELY
MID-TIER
CREDIT- AT-RISK
CREDIT- INSECURE
777 Counties
696 Counties
641 Counties
585 Counties
379 Counties
684 Counties
611 Counties
717 Counties
643 Counties
423 Counties
26 No significance should be attached to the examples cited in the text; other counties could have been mentioned. We wished to provide concrete examples of counties to illustrate the point and make the numbers real.
Unequal Access to Credit / Evidence of Progress in Credit Insecurity

29
Counties That Upgraded to an Improved Severity TierThe second striking pattern is that all severity tiers experienced inflows and outflows, confirming that communities change over time, even counties in the most severe credit insecurity tiers. From 2007 to 2018, 463 counties experienced an upgrade in credit tier, which account for 23.5 million people, or 9.2%, of the total U.S. adult population.
The distribution of counties that showed tier improvement was as follows:
� Credit-Assured and Credit-Likely Counties: Among the upgrades, 111 counties moved from the cred-it-likely to the credit-assured tier. An additional 154 counties upgraded to one of the two best tiers from a lower tier (mid-tier, credit-at-risk, or credit-insecure). All together, these counties are the home of 10.5 million adults or 4.1% of the U.S. adult population. Examples of considerable improvement are Franklin County in Vermont and Lee County in Georgia, which moved three levels from the at-risk tier to the credit-assured tier.
� Credit Mid-Tier Counties: Meanwhile, 102 counties were upgraded from mid-tier to the second-best cred-it-likely tier and 21 counties upgraded two levels to the best-performing credit-assured tier. All together, these counties are the home of 5.1 million adults or 2.0% of the U.S. adult population. Examples of one-tier and two-tier upgrades are Hamilton County, Ohio and Lincoln County, North Carolina, respectively.
� Credit-At-Risk and Credit-Insecure Counties: All together, 150 counties upgraded out of the two worst tiers, and are the home of 10.0 million adults or 3.9% of the U.S. adult population. Examples of upgrades are Queens County, New York and Burnet County, Texas. Particularly noteworthy are the three counties that upgraded from the worst tier to the best severity tier during the period: Sheridan County, Kansas, Wheeler County, Oregon, and Rock County, Nevada.
Counties That Upgraded to an Improved Severity Tier from 2007 to 2018
2007 2018
3,078 counties had sufficient data in 2007 and 2018, and are therefore included in this analysis.
54218234163
CREDIT- ASSURED
306111243324
CREDIT- LIKELY
32121
10218116
MID-TIER
3357
19110114
CREDIT- AT-RISK
286329
79
5421112173
306182102192
321243110349
335181793216
2861141643
CREDIT- INSECURE
CREDIT- ASSURED
CREDIT- LIKELY
MID-TIER
CREDIT- AT-RISK
CREDIT- INSECURE
777 Counties
696 Counties
641 Counties
585 Counties
379 Counties
684 Counties
611 Counties
717 Counties
643 Counties
423 Counties
Unequal Access to Credit / Evidence of Progress in Credit Insecurity

30
Counties That Downgraded to a Worse Severity TierFrom 2007 to 2018, 825 counties experienced a downgrade in credit severity tier, which account for 57.5 million people, or 22.6%, of the total U.S. adult population.
The distribution of counties that showed tier deterioration is as follows:
� Credit-Assured and Credit-Likely Counties: Among the downgrades, 332 counties dropped from one of the top two tiers to a lower tier (mid-tier, credit-at-risk, or credit-insecure). All together, these counties are the home to 22.4 million adults or 8.8% of the U.S. adult population. An example of considerable deterioration is Greenlee County, Arizona, which declined from the best-performing tier in 2007 to the worst performing tier in 2018. The two other counties with a similar performance are Jefferson County, Iowa and Lincoln County, Idaho.
� Credit Mid-Tier Counties: Unfortunately, 181 counties were downgraded one tier level and 16 counties were downgraded two tier levels from mid-tier. All together, these counties are the home of another 11.3 million adults or 4.4% of the U.S. adult population. Examples of one-tier and two-tier downgrades are Mobile County, Alabama, and Rio Arriba County, New Mexico, respectively.
� Credit-At-Risk and Credit-Insecure Counties: Unfortunately, 114 counties were downgraded one level from at-risk to credit-insecure. All together, these counties are the home of another 3.8 million adults or 1.5% of the U.S. adult population. Examples of the downgrades are Richmond City, Virginia, and Pinal County, Arizona.
Counties That Downgraded to a More Severe Tier from 2007 to 2018
2007 2018
3,078 counties had sufficient data in 2007 and 2018, and are therefore included in this analysis.
54218234163
CREDIT- ASSURED
306111243324
CREDIT- LIKELY
32121
10218116
MID-TIER
3357
19110114
CREDIT- AT-RISK
286329
79
5421112173
306182102192
321243110349
335181793216
2861141643
CREDIT- INSECURE
CREDIT- ASSURED
CREDIT- LIKELY
MID-TIER
CREDIT- AT-RISK
CREDIT- INSECURE
777 Counties
696 Counties
641 Counties
585 Counties
379 Counties
684 Counties
611 Counties
717 Counties
643 Counties
423 Counties
Unequal Access to Credit / Evidence of Progress in Credit Insecurity

31
The Net Impact of Tier MigrationNote that the distribution of counties by severity tier has shifted towards greater credit insecurity in 2018 as compared to 2007.
Distribution of Counties' Severity Tiers, 2007 and 2018
0%
5%
10%
15%
20%
25%
30%
Credit-Assured Credit-Likely Mid-Tier Credit-At-Risk Credit-InsecureCredit Severity Tiers
Shar
e of C
ount
ies
2007 2018
On net, the share of counties with the best credit health, identified as “credit-assured” and “credit-likely,” declined from 48% of all U.S. counties in 2007 to 42% in 2018. This shrinkage of the best severity tiers reflects the incomplete recovery in credit security reported for the U.S. Some of the downward movement was towards the mid-tier. On net, counties with mid-tier credit insecurity scores increased in share from 21% of all U.S. counties in 2007 to 23% in 2018. All together, these counties are the home of 77.6 million adults or 30.6% of the U.S. adult population. And some of the downward shift was to the most distressed tiers. On net, the share of counties in the bottom two credit insecurity tiers rose from 31% of all U.S. counties in 2007 to 35% in 2018. All together, these counties are the home of another 49.1 million adults or 19.3% of the U.S. adult population.
Mobility Viewed as a Change in Index Scores from 2012 to 2018While a tier upgrade may not have been achieved, a community may nevertheless be on an improving trajectory. To examine this possibility, we use the lens of a net change in index scores between 2012 and 2018 as an alternative gauge of credit mobility. As 2012 was the low point in the post-crisis cycle for most counties and the nation as a whole, improvement since then–from 2012 to 2018–is the most optimistic window for benchmarking progress. Counties failing to show progress during this interval, when the nation as a whole was improving, were not proportionately up-lifted by the broader national recovery.
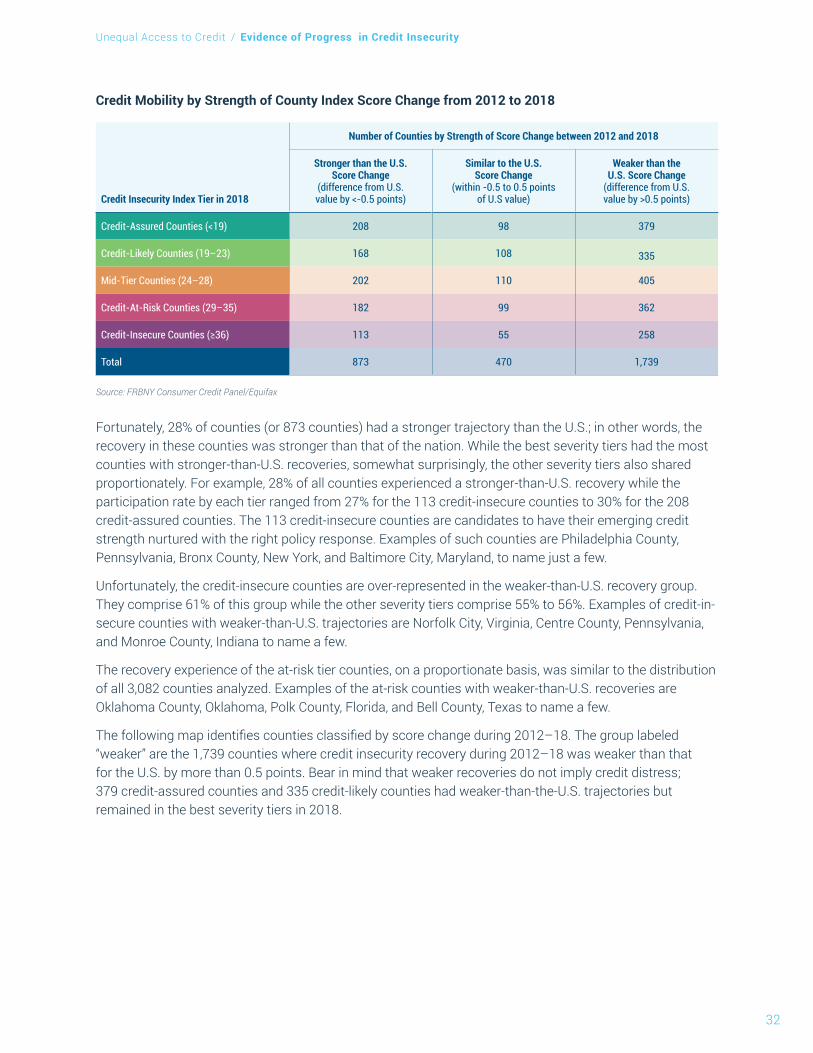
To assess the strength of post-2012 trajectories, we selected a decrease of 3.7 points—the change in the U.S. insecurity score between 2012 and 2018—as a benchmark value.27 In the following table, we sorted counties into three groups: 1) those showing a trajectory stronger than the U.S. by more than 0.5 points; 2) those showing a trajectory similar to the U.S. with scores within +/- 0.5 points; and 3) those showing a trajectory weaker than the U.S. by more than 0.5 points. Data for 3,082 counties that meet our minimum size threshold of 50 observations, are presented in the table.28
27 In other words, U.S. credit insecurity score decreased by 3.7 points during 2012–18, since lower scores mean improved credit security.28 The total number of counties analyzed (3,082) for this calculation is less than the total number of counties in the U.S. (3,142). We use a minimum
of 50 credit records within a county as a threshold for calculating county-level measures; hence, counties with fewer observations are not included in this analysis.
Unequal Access to Credit / Evidence of Progress in Credit Insecurity
32
Credit Mobility by Strength of County Index Score Change from 2012 to 2018
Number of Counties by Strength of Score Change between 2012 and 2018
Credit Insecurity Index Tier in 2018
Stronger than the U.S. Score Change
(difference from U.S. value by <-0.5 points)
Similar to the U.S. Score Change
(within -0.5 to 0.5 points of U.S value)
Weaker than the U.S. Score Change
(difference from U.S. value by >0.5 points)
Credit-Assured Counties (<19) 208 98 379
Credit-Likely Counties (19–23) 168 108 335
Mid-Tier Counties (24–28) 202 110 405
Credit-At-Risk Counties (29–35) 182 99 362
Credit-Insecure Counties (≥36) 113 55 258
Total 873 470 1,739
Source: FRBNY Consumer Credit Panel/Equifax
Fortunately, 28% of counties (or 873 counties) had a stronger trajectory than the U.S.; in other words, the recovery in these counties was stronger than that of the nation. While the best severity tiers had the most counties with stronger-than-U.S. recoveries, somewhat surprisingly, the other severity tiers also shared proportionately. For example, 28% of all counties experienced a stronger-than-U.S. recovery while the participation rate by each tier ranged from 27% for the 113 credit-insecure counties to 30% for the 208 credit-assured counties. The 113 credit-insecure counties are candidates to have their emerging credit strength nurtured with the right policy response. Examples of such counties are Philadelphia County, Pennsylvania, Bronx County, New York, and Baltimore City, Maryland, to name just a few.
Unfortunately, the credit-insecure counties are over-represented in the weaker-than-U.S. recovery group. They comprise 61% of this group while the other severity tiers comprise 55% to 56%. Examples of credit-in-secure counties with weaker-than-U.S. trajectories are Norfolk City, Virginia, Centre County, Pennsylvania, and Monroe County, Indiana to name a few.
The recovery experience of the at-risk tier counties, on a proportionate basis, was similar to the distribution of all 3,082 counties analyzed. Examples of the at-risk counties with weaker-than-U.S. recoveries are Oklahoma County, Oklahoma, Polk County, Florida, and Bell County, Texas to name a few.
The following map identifies counties classified by score change during 2012–18. The group labeled “weaker” are the 1,739 counties where credit insecurity recovery during 2012–18 was weaker than that for the U.S. by more than 0.5 points. Bear in mind that weaker recoveries do not imply credit distress; 379 credit-assured counties and 335 credit-likely counties had weaker-than-the-U.S. trajectories but remained in the best severity tiers in 2018.
Unequal Access to Credit / Evidence of Progress in Credit Insecurity

33
Map of Counties by Credit Insecurity Index Score Change from 2012 to 2018
Similar
Stronger
Weaker
Unmapped
Source: FRBNY Consumer Credit Panel/Equifax
Lastly, the following table presents Credit Insecurity Index scores, and the change in values for the bench-mark periods, for several well-known counties across the country. Bear in mind that negative values indicate improved credit insecurity within the county relative to the benchmark year.
Change in Credit Insecurity Index Score for Select Counties
CountyCredit Insecurity
Index Score, 2018Index Score Change,
2007–2018Index Score Change,
2012–2018
St. Louis County, Missouri 16.0 2.0 -2.3King County, Washington 17.1 2.8 -2.4Baltimore city, Maryland 18.6 3.8 -2.8Erie County, New York 19.6 2.0 -2.5Monroe County, New York 19.7 0.3 -4.2Los Angeles County, California 24.4 -1.6 -6.6Cook County, Illinois 24.9 -1.7 -6.3Miami-Dade County, Florida 26.5 -0.2 -8.6Maricopa County, Arizona 26.7 1.8 -1.9Milwaukee County, Wisconsin 28.8 -0.3 -3.4Essex County, New Jersey 29.3 -1.2 -6.2Shelby County, Tennessee 30.7 2.0 -3.6District of Columbia, District of Columbia 30.8 1.6 -3.4Bexar County, Texas 31.0 2.3 -3.3Kings County, New York 31.7 -9.6 -10.7Montgomery County, Alabama 33.4 2.4 -2.9Dallas County, Texas 33.5 -1.8 -4.5Philadelphia County, Pennsylvania 36.6 -0.5 -4.5Bronx County, New York 40.7 -5.6 -10.1
Source: FRBNY Consumer Credit Panel/Equifax
Unequal Access to Credit / Evidence of Progress in Credit Insecurity

34
Notice that all of these counties improved during the national recovery period of 2012–18. However, several counties—St. Louis, Missouri, King County, Washington, Baltimore City, Maryland, Erie County, New York, Monroe County, New York, Maricopa County, Arizona, Shelby County, Tennessee, Washington D.C., Bexar County, Texas, and Montgomery County, Alabama—have experienced an incomplete recovery relative to 2007.
In other words, readers must consider both initial conditions and score change when assessing progress. For example, King County, Washington has an adult population of 1.8 million and is the home of the City of Seattle. It is sorted as credit-assured or credit-likely during the entire 2005–18 period, even though it was adversely affected by the financial crisis and recession, and has not fully recovered to its 2007 level of credit insecurity.
In contrast, at the bottom of the table is Bronx County, New York, one of New York City’s five boroughs and with an adult population of about 1.1 million. During 2005–18, it is consistently sorted as credit-insecure even though it experienced a reasonably strong recovery and has surpassed its 2007 level of credit insecurity.
The views expressed here are those of the authors and do not necessarily reflect those of the Federal Reserve Bank of New York or the Federal Reserve System..
Kausar Hamdani, Ph.D. Senior Vice President and Senior Advisor
Edison Reyes Associate
Claire Kramer Mills, Ph.D. Assistant Vice President
Jessica Battisto Senior Analyst
Unequal Access to Credit / Evidence of Progress in Credit Insecurity

35
The Credit Insecurity Index was inspired by conversations with community development professionals. They highlighted the information gap; the diagnostic importance of trajectories to understand which direction communities are headed; and the utility of summary descriptors to focus and further the policy conversation. In this paper, we review credit insecurity as both a challenge and an opportunity for policy and practice. Both asset- and credit-oriented organizations will find the analytics useful since access to credit is an asset for wealth-building, and credit is a financial tool to manage liquidity needs. Experts and community leaders may use the index scores to identify communities in need; to scale the relative severity of need; and to benchmark the impact of new or additional investments in communities over time by examining pre- and post-intervention community conditions. They have the necessary local knowledge to apply the analytics to policy questions and to evaluate social impacts over time and across communities. No particular policy actions or goals are advocated.
About the Credit Insecurity IndexThe Credit Insecurity Index uses the Community Credit framework29 where access to credit is a financial asset for economic opportunity and resiliency. Consumer credit data are aggregated to examine credit health and economic well-being within a community. Missing from traditional analytics was the impact of credit constraints on a community’s credit health. Yet, access to credit is an asset and indicator of community well-being only if individuals can borrow amounts at reasonable terms when they so choose. Constraints on the ability to borrow at choice diminishes access to credit as a financial asset and widens the opportu-nity gap in communities.
The Credit Insecurity Index was designed to score and scale the relative impact of credit constraints on communities. It combines several credit-limiting outcomes from the Community Credit framework into a single score to measure ‘credit insecurity’ or lack of access to credit at choice within a community.30 The scores are sorted into severity tiers to scale relative credit insecurity, across place and over time, in America during 2005–18.
A natural question is how the index scores compare with credit scores, which are widely used in research and practice to characterize communities. While both types of scores are summary measures, there are several differences worth noting. First, a credit score is a descriptor of an individual whereas the Credit Insecurity Index score is a descriptor of a community or group of individuals, typically identified by location or place.
29 See https://www.newyorkfed.org/data-and-statistics/data-visualization/community-credit-profiles/index.html#overview30 The index is the sum of the share of the adult population not in the formal credit economy plus a simple average of credit-limiting outcomes
of those in the formal credit economy.
6UNEQUAL ACCESS TO CREDIT
POLICY AND PRACTICE FOR CREDIT INSECURITY

36
To describe a community, often the median value is presented when credit scores are used. Such an approach is equivalent to characterizing a community by the individual with the median credit score. In contrast, the Credit Insecurity Index score computes the credit outcomes of a representative sample of all the individuals in a community; it is based on a weighted average of all actual credit-limiting outcomes, not the outcomes of an individual resident.
The purpose and inputs into the insecurity index and credit scores are also different. While the formulae underlying credit scores vary and are proprietary, the Credit Insecurity Index formula is as follows and also discussed in the Methodology paper.
About the Credit Insecurity Index
While credit scores have various commercial applications, they were designed to assess an individual’s ability to repay their debt obligations. A credit score is computed using a variety of factors that may differ among credit rating organizations. The Credit Insecurity Index score is designed to capture constraints on a community’s ability to access credit at choice based on five familiar credit measures; it is a measure of a burden on a community. Note that low credit scores are an element in the Credit Insecurity Index score since they lower the ability to borrow at choice.
The Credit Insecurity Index combines multiple credit-limiting outcomes into a single score to gauge ‘credit insecurity’ or lack of access to credit at choice for a community. The first component of the score is the relative size of the not-included in the formal credit economy or the share of residents not having a credit file or score. The second component is the size of the formal credit economy adjusted to reflect outcomes that limit borrowing at choice such as having no revolving credit products, fully utilized credit lines, a low credit score, or a poor repayment history. We calculate a score for the U.S., all 50 states and most of the 3,142 counties using the following formula.
Since the scores are consistently measured quantities, communities may be compared with each other, on a severity scale, from the lowest severity called “credit-assured” to the highest severity called “credit-insecure.”
Credit Insecurity Severity Tiers
CREDIT-ASSURED TIER
Index Score range: <19
CREDIT-INSECURE TIER
Index score range: ≥36
CREDIT-LIKELY TIER
Index score range: 19–23
CREDIT MID- TIER
Index score range: 24–28
CREDIT-AT-RISK TIER
Index score range: 29–35
LEAST CREDIT INSECURE MOST CREDIT INSECURE
Credit Insecurity Index Components
Credit Insecurity
Index Score
Not Included in the
Formal Credit Economy
Included in the
Formal Credit Economy
1
4
No Revolving
Credit
High Utilization
≥100%
Deep Subprime
Credit Score
Struggling or Consistently Delinquent Payment History
Unequal Access to Credit / Policy and Practice for Credit Insecurity

37
Observations for PolicymakersThe evidence presented in this collection of papers can inform community development policy and practice in several ways:
The Credit Insecurity Index measures the impact of credit constraining outcomes in a community; it is an efficient way to identify communities in distress and to size the magnitude of relative need. The index scores measure the prevalence of credit outcomes that collectively constrain access to credit at choice in a community. Numerical magnitudes matter in that larger scores denote higher credit insecurity. The scores assess the extent to which credit constraints impact their community. Empirical evidence confirms that credit constraints are a consequential barrier to credit health and economic well-being in America’s communities. In general, scores of credit insecurity double when constraints are incorporated, than when not. In other words, omitting the impact of credit constraints from the analysis is akin to missing half of the credit access problem.
Specifically, the credit insecurity score for the U.S. more than doubles, from 10.5 points to 23.8 points, as of the fourth quarter of 2018.31 For context, a simple measure of credit insecurity is 10.5 which amounts to 26.5 million U.S. adults not in the formal credit economy. When credit-constraining outcomes of those in the formal credit economy are explicitly taken into account, it is as if a total of 23.8%, or about 60.4 million U.S. adults, lack access to credit at choice.
The index provides fresh information to empower community stakeholders with their decision-making. Absent the insecurity index, some communities with access-to-credit challenges might be missed. Asset strength of other communities would be over-estimated, and likely found lacking, when called upon in times of macroeconomic need or national disasters.
Policymakers may use the scores in a dashboard or other applications as an indicator of credit insecurity, to identify communities in need, and to match resources to the size of the challenge.
Index scores, by design, enable an apples-to-apples comparison among communities, and situate local experience within the broader national context of place and history. Often, experts are well versed in local issues but are unable to benchmark local conditions to the larger ecosystem of their communities or the nation. The scores place communities on a single spectrum across geography and time, to better iden-tify, describe, and compare communities. Heat maps highlight the prevalence and regional placement of credit insecurity in the national landscape. The index analytics provide a common set of facts to quantify how communities compare; to inform resource choices among peers and competitors, and goals; and to identify where new or additional investments would generate the greatest impact.
For example, the evidence shows that most communities were adversely affected by the financial crisis and subsequent recession. The scores allow communities to assess whether their impact was larger, or smaller, than that of peers or the nation. For example, Wyoming experienced the weakest 2007–18 recov-ery of any state while New York experienced the strongest. Or, focusing just on the 2012–18 recovery, we identify counties that experienced a weaker or stronger recovery than the nation.
31 As of the fourth quarter of 2018, 10% of the U.S. adult population did not have a credit file and credit score. Credit constraints add to this value to result in a Credit Insecurity Index measure of 24.
Unequal Access to Credit / Policy and Practice for Credit Insecurity
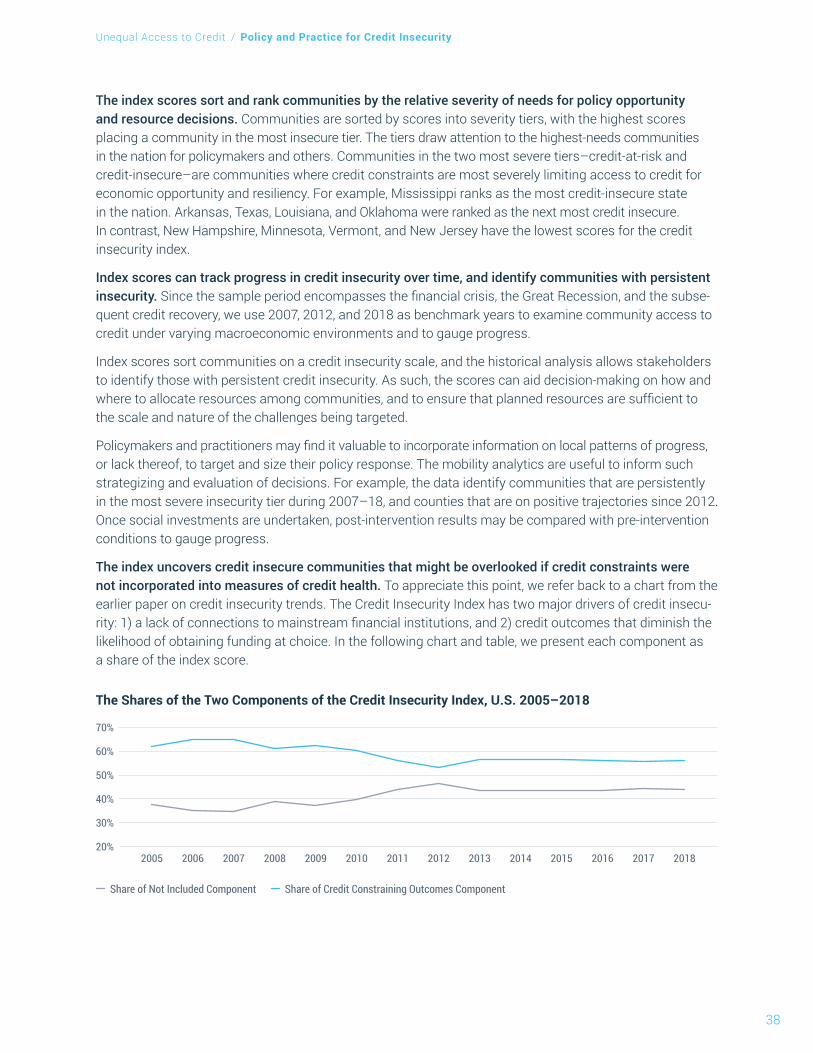
38
The index scores sort and rank communities by the relative severity of needs for policy opportunity and resource decisions. Communities are sorted by scores into severity tiers, with the highest scores placing a community in the most insecure tier. The tiers draw attention to the highest-needs communities in the nation for policymakers and others. Communities in the two most severe tiers–credit-at-risk and credit-insecure–are communities where credit constraints are most severely limiting access to credit for economic opportunity and resiliency. For example, Mississippi ranks as the most credit-insecure state in the nation. Arkansas, Texas, Louisiana, and Oklahoma were ranked as the next most credit insecure. In contrast, New Hampshire, Minnesota, Vermont, and New Jersey have the lowest scores for the credit insecurity index.
Index scores can track progress in credit insecurity over time, and identify communities with persistent insecurity. Since the sample period encompasses the financial crisis, the Great Recession, and the subse-quent credit recovery, we use 2007, 2012, and 2018 as benchmark years to examine community access to credit under varying macroeconomic environments and to gauge progress.
Index scores sort communities on a credit insecurity scale, and the historical analysis allows stakeholders to identify those with persistent credit insecurity. As such, the scores can aid decision-making on how and where to allocate resources among communities, and to ensure that planned resources are sufficient to the scale and nature of the challenges being targeted.
Policymakers and practitioners may find it valuable to incorporate information on local patterns of progress, or lack thereof, to target and size their policy response. The mobility analytics are useful to inform such strategizing and evaluation of decisions. For example, the data identify communities that are persistently in the most severe insecurity tier during 2007–18, and counties that are on positive trajectories since 2012. Once social investments are undertaken, post-intervention results may be compared with pre-intervention conditions to gauge progress.
The index uncovers credit insecure communities that might be overlooked if credit constraints were not incorporated into measures of credit health. To appreciate this point, we refer back to a chart from the earlier paper on credit insecurity trends. The Credit Insecurity Index has two major drivers of credit insecu-rity: 1) a lack of connections to mainstream financial institutions, and 2) credit outcomes that diminish the likelihood of obtaining funding at choice. In the following chart and table, we present each component as a share of the index score.
The Shares of the Two Components of the Credit Insecurity Index, U.S. 2005–2018
20%
30%
40%
50%
60%
70%
2005 2006 2007 2008 2009 2010 2011 2012 2013 2014 2015 2016 2017 2018
Share of Not Included Component Share of Credit Constraining Outcomes Component
Unequal Access to Credit / Policy and Practice for Credit Insecurity

39
The Shares of the Two Components of the Credit Insecurity Index, U.S. 2005–2018
Year, Q4Share of the Credit Insecurity Index Score
due to the Not Included ComponentShare of the Credit Insecurity Index Score
due to the Credit Constraining Outcomes Component
2005 37.7% 62.3%2006 34.9% 65.1%2007 34.7% 65.3%2008 38.8% 61.2%2009 37.3% 62.7%2010 39.6% 60.4%2011 44.1% 55.9%2012 46.8% 53.2%2013 43.6% 56.4%2014 43.5% 56.5%2015 43.6% 56.4%2016 43.9% 56.1%2017 44.5% 55.5%2018 44.0% 56.0%
Source: FRBNY Consumer Credit Panel/Equifax
Notice that at the national level, credit constraints on individuals in the formal credit economy are a larger contributor to the score than being Not Included in the formal credit economy, even though both vary over time with macroeconomic and financial conditions. Also note that both components are moving closer over time as the contribution of non-inclusion rises while the contribution of credit constraining outcomes falls. As of the fourth quarter of 2018, non-inclusion contributed to 44% of the credit insecurity score for the U.S. while credit constraining outcomes contributed the remaining 56%. On net, while the impact of credit constraints remains below its pre-financial-crisis level of 65.3%, the impact of individuals Not Included in the formal credit economy and not having a credit file and score remains elevated.
County-Level Decomposition Analysis A similar decomposition may be calculated for counties. Focusing on the 1,069 counties that are in the two most credit insecure tiers as of the fourth quarter of 2018, several patterns emerge. Without the index, 1) some counties would be missed as being credit insecure because the dominant driver of insecurity is credit constraining outcomes within the community, not non-inclusion; 2) credit insecurity in some counties would be understated because the impacts of credit constraining outcomes were omitted; and 3) credit insecurity in some counties would be overstated or falsely identified. Such relative comparisons can help guide resource allocation choices by policymakers and practitioners.
Note that for all 1,069 counties in the bottom two index ranges, credit insecurity would be under-measured if only the non-inclusion component was used to measure access to credit. The under-measurement varies across counties.
These three types of misidentification are discussed on the following pages.
Unequal Access to Credit / Policy and Practice for Credit Insecurity

40
Counties That Might Be Missed When Identifying Severe Credit InsecurityIf we used non-inclusion in the formal credit economy as the sole filter of limited access to credit, then the 168 counties in the following table would be missed when identifying communities with severe credit insecurity. The dominant driver of credit insecurity in these 168 counties is constraining credit outcomes within the community, not non-inclusion. The eight counties at the top of the table such as Holmes County, Humphreys County, and Coahoma County, Mississippi through to Petersburg City, Virginia are examples where credit constraining outcomes are severe enough to sort these counties into the most severe credit insecurity tier. Other counties that might be overlooked without the index are identified below.
Counties That Might Be Missed When Identifying Severe Credit Insecurity, 2018 Q4
County/StateCredit Insecurity Index,
2018 Q4Credit Constraining
Outcomes ComponentNot Included in Formal
Credit Economy ComponentHolmes County, Mississippi 41.1 30.6 10.5Humphreys County, Mississippi 38.5 32.7 5.7Coahoma County, Mississippi 38.4 28.7 9.7Hampton County, South Carolina 38.3 28.6 9.7Sharkey County, Mississippi 37.4 31.9 5.5Brooks County, Texas 36.6 36.6 0.0Orangeburg County, South Carolina 36.4 27.2 9.2Petersburg City, Virginia 36.2 25.5 10.7Choctaw County, Oklahoma 35.7 25.4 10.3Noxubee County, Mississippi 35.7 32.1 3.6Clay County, Mississippi 35.4 26.0 9.4Pemiscot County, Missouri 35.4 25.1 10.3Leflore County, Mississippi 35.3 32.8 2.5Wolfe County, Kentucky 35.3 24.3 11.0Washington County, Georgia 35.2 25.9 9.3Wayne County, Mississippi 35.1 24.8 10.3Screven County, Georgia 35.1 24.3 10.8Richland Parish, Louisiana 35.0 24.5 10.5Wilkinson County, Georgia 35.0 25.5 9.5Simpson County, Mississippi 34.8 24.2 10.6Wilcox County, Alabama 34.8 31.8 3.0Hinds County, Mississippi 34.7 25.4 9.3Kleberg County, Texas 34.7 27.3 7.3Jefferson County, Mississippi 34.5 32.4 2.2Magoffin County, Kentucky 34.4 23.6 10.9McCurtain County, Oklahoma 34.4 23.7 10.7Treutlen County, Georgia 34.4 27.1 7.3Dillon County, South Carolina 34.3 29.1 5.2Hockley County, Texas 34.3 24.1 10.2Tunica County, Mississippi 34.3 34.3 0.0Sumter County, Georgia 34.0 24.9 9.2Cook County, Georgia 33.9 23.1 10.7Ben Hill County, Georgia 33.9 28.1 5.7Emanuel County, Georgia 33.8 28.2 5.7Chickasaw County, Mississippi 33.8 24.0 9.8Emporia city, Virginia 33.8 25.4 8.4Knox County, Kentucky 33.5 22.6 11.0Montgomery County, Alabama 33.4 22.9 10.5Troup County, Georgia 33.3 23.0 10.3Avoyelles Parish, Louisiana 33.3 23.8 9.5Vance County, North Carolina 33.3 23.1 10.2Washington Parish, Louisiana 33.2 23.5 9.6Adair County, Oklahoma 33.1 27.0 6.1Concordia Parish, Louisiana 33.1 26.6 6.5Evangeline Parish, Louisiana 33.1 22.5 10.6Starr County, Texas 33.1 26.2 6.9
Continued on next page
Unequal Access to Credit / Policy and Practice for Credit Insecurity

41
County/StateCredit Insecurity Index,
2018 Q4Credit Constraining
Outcomes ComponentNot Included in Formal
Credit Economy ComponentDecatur County, Georgia 32.8 26.1 6.6Franklin Parish, Louisiana 32.7 25.0 7.7Tate County, Mississippi 32.7 22.5 10.3Clinch County, Georgia 32.7 26.7 6.0Escambia County, Alabama 32.6 22.7 9.9Barnwell County, South Carolina 32.5 28.0 4.6Washington County, Mississippi 32.5 29.1 3.4Harlan County, Kentucky 32.5 23.7 8.8Dunklin County, Missouri 32.5 23.5 8.9Gray County, Texas 32.5 22.7 9.7Tift County, Georgia 32.4 21.9 10.5Bibb County, Georgia 32.4 24.1 8.3Letcher County, Kentucky 32.2 22.3 9.9Crittenden County, Arkansas 32.1 24.0 8.1Desha County, Arkansas 32.1 23.9 8.2Stephens County, Texas 32.1 22.2 9.9San Augustine County, Texas 32.1 22.9 9.1Fairfield County, South Carolina 32.0 26.0 6.0Deaf Smith County, Texas 32.0 25.1 6.9Conecuh County, Alabama 32.0 25.3 6.7Gonzales County, Texas 31.9 22.7 9.2Logan County, West Virginia 31.8 22.4 9.4Navarro County, Texas 31.7 23.5 8.2Bertie County, North Carolina 31.7 22.0 9.7Butler County, Missouri 31.6 22.2 9.4Mayes County, Oklahoma 31.6 20.7 10.9Lowndes County, Alabama 31.5 30.8 0.8Franklin County, Alabama 31.5 21.5 9.9Jackson Parish, Louisiana 31.4 20.9 10.6Talladega County, Alabama 31.4 23.7 7.8Atascosa County, Texas 31.4 24.0 7.4Lamb County, Texas 31.4 23.0 8.4Webster County, West Virginia 31.4 22.2 9.2Chester County, South Carolina 31.3 26.1 5.2Pike County, Mississippi 31.3 26.7 4.6Darlington County, South Carolina 31.3 24.5 6.8Whitley County, Kentucky 31.3 20.7 10.6Jim Wells County, Texas 31.2 28.6 2.6Harrison County, Texas 31.2 20.9 10.3Monroe County, Arkansas 31.2 25.9 5.3Montgomery County, Mississippi 31.1 25.7 5.4Vinton County, Ohio 31.1 20.9 10.2Richmond County, North Carolina 31.0 23.3 7.7Carter County, Kentucky 31.0 20.6 10.5Hopewell city, Virginia 31.0 23.6 7.3Abbeville County, South Carolina 31.0 20.3 10.7Newberry County, South Carolina 31.0 21.5 9.5Campbell County, Tennessee 30.9 23.0 7.9Marion County, South Carolina 30.9 28.6 2.3Clarke County, Alabama 30.9 25.9 4.9Murray County, Oklahoma 30.9 20.1 10.8Lawrence County, Kentucky 30.8 22.6 8.2Jackson County, Alabama 30.8 20.5 10.3Lincoln County, Georgia 30.8 19.8 11.0Stephens County, Oklahoma 30.8 20.7 10.1Dallam County, Texas 30.7 24.9 5.8Webster Parish, Louisiana 30.7 24.2 6.5Shelby County, Tennessee 30.7 21.3 9.4Dyer County, Tennessee 30.6 21.7 8.9Scioto County, Ohio 30.5 19.7 10.8Calhoun County, Texas 30.4 20.3 10.2
Continued on next page
Unequal Access to Credit / Policy and Practice for Credit Insecurity

42
County/StateCredit Insecurity Index,
2018 Q4Credit Constraining
Outcomes ComponentNot Included in Formal
Credit Economy ComponentColleton County, South Carolina 30.4 25.5 4.9Hutchinson County, Texas 30.4 22.8 7.6Ward County, Texas 30.4 26.3 4.1Halifax County, North Carolina 30.3 23.6 6.7Randolph County, Alabama 30.3 21.8 8.5Marion County, Texas 30.3 23.2 7.0Ouachita Parish, Louisiana 30.3 21.7 8.6Nevada County, Arkansas 30.2 21.4 8.8Chilton County, Alabama 30.1 20.7 9.4Hill County, Texas 30.1 20.6 9.5Newton County, Georgia 30.0 22.8 7.2Chambers County, Alabama 30.0 23.1 6.9Chaves County, New Mexico 29.9 19.8 10.2Early County, Georgia 29.9 29.9 0.0Twiggs County, Georgia 29.9 25.0 4.9Pushmataha County, Oklahoma 29.9 20.9 9.0Boone County, West Virginia 29.9 20.0 9.9Polk County, Georgia 29.9 22.7 7.2Leslie County, Kentucky 29.9 25.2 4.7East Baton Rouge Parish, Louisiana 29.9 19.8 10.1Bowie County, Texas 29.9 21.7 8.1Lowndes County, Mississippi 29.8 21.0 8.9Muskogee County, Oklahoma 29.8 23.4 6.5Harrison County, Mississippi 29.8 20.5 9.3Spalding County, Georgia 29.8 22.2 7.6Caddo Parish, Louisiana 29.7 22.5 7.2Stoddard County, Missouri 29.7 19.2 10.5Russell County, Alabama 29.6 23.5 6.1Angelina County, Texas 29.6 22.0 7.6Upshur County, Texas 29.6 19.7 9.9Garrard County, Kentucky 29.6 19.4 10.2Cochran County, Texas 29.6 29.6 0.0Delta County, Texas 29.5 21.1 8.5Laurens County, South Carolina 29.5 24.2 5.3Lea County, New Mexico 29.5 23.0 6.5Florence County, South Carolina 29.5 23.7 5.8Greenwood County, South Carolina 29.5 20.7 8.7Owen County, Kentucky 29.4 18.9 10.6St. Helena Parish, Louisiana 29.4 29.4 0.0Lawrence County, Alabama 29.4 20.4 9.0Marion County, Alabama 29.4 20.9 8.5Rhea County, Tennessee 29.4 20.0 9.4McNairy County, Tennessee 29.4 18.7 10.7Brown County, Texas 29.3 21.5 7.8Pottawatomie County, Oklahoma 29.3 20.6 8.7Thomas County, Georgia 29.2 20.6 8.6Bell County, Texas 29.2 21.3 7.9Pulaski County, Illinois 29.2 19.3 9.9Christian County, Kentucky 29.2 20.6 8.6Uvalde County, Texas 29.1 24.4 4.7Pearl River County, Mississippi 29.1 19.3 9.8Mobile County, Alabama 29.1 21.7 7.4Appling County, Georgia 29.1 23.8 5.3Amite County, Mississippi 29.1 24.0 5.1Floyd County, Kentucky 29.1 24.3 4.8Newton County, Mississippi 29.1 23.6 5.5Bath County, Kentucky 29.0 24.8 4.2Luna County, New Mexico 29.0 19.4 9.6Geneva County, Alabama 29.0 19.9 9.1Bienville Parish, Louisiana 29.0 29.0 0.0Sequatchie County, Tennessee 29.0 18.7 10.3
Source: FRBNY Consumer Credit Panel/Equifax
Unequal Access to Credit / Policy and Practice for Credit Insecurity

43
Counties Where the Severity Is Likely to Be Understated without the IndexThe credit insecurity for the following 38 counties is likely to be understated without the index analytics. The Credit Insecurity Index, by including the impacts of detrimental credit outcomes for individuals in the formal credit economy, includes these communities as in the most credit insecure tier.
Credit-Insecure Counties Where Adverse Credit Outcomes Are Dominant, 2018 Q4
County/StateCredit Insecurity Index,
2018 Q4Credit Constraining
Outcomes ComponentNot Included in Formal
Credit Economy ComponentJim Hogg County, Texas 45.5 30.8 14.7Terry County, Texas 41.9 28.1 13.8Lee County, South Carolina 41.6 26.6 15.0Marlboro County, South Carolina 41.6 27.8 13.8Holmes County, Mississippi 41.1 30.6 10.5Greene County, Alabama 40.7 29.3 11.4Bamberg County, South Carolina 40.2 27.1 13.1Dougherty County, Georgia 40.0 25.2 14.9Williamsburg County, South Carolina 39.3 28.1 11.2Humphreys County, Mississippi 38.5 32.7 5.7Coahoma County, Mississippi 38.4 28.7 9.7Hampton County, South Carolina 38.3 28.6 9.7Lauderdale County, Tennessee 38.1 25.0 13.2Mississippi County, Arkansas 38.1 23.8 14.3Seminole County, Oklahoma 38.0 24.0 14.0Dallas County, Alabama 37.7 26.6 11.1Jasper County, Mississippi 37.6 24.1 13.4Clayton County, Georgia 37.4 26.2 11.2Sharkey County, Mississippi 37.4 31.9 5.5Edgecombe County, North Carolina 37.3 24.2 13.1Bolivar County, Mississippi 37.1 25.9 11.2Randolph County, Georgia 36.9 23.6 13.3Chesterfield County, South Carolina 36.9 23.4 13.5Catahoula Parish, Louisiana 36.9 22.1 14.8Jefferson County, Georgia 36.6 24.7 11.9Brooks County, Texas 36.6 36.6 0.0Scotland County, North Carolina 36.6 23.2 13.4Jeff Davis County, Georgia 36.6 22.8 13.8Clarendon County, South Carolina 36.6 24.9 11.7Copiah County, Mississippi 36.5 22.8 13.7Orangeburg County, South Carolina 36.4 27.2 9.2Breathitt County, Kentucky 36.3 23.2 13.1Clay County, Georgia 36.3 22.4 13.9Webb County, Texas 36.2 22.3 13.9Petersburg city, Virginia 36.2 25.5 10.7Covington County, Mississippi 36.2 23.1 13.0Bryan County, Oklahoma 36.1 21.8 14.3Lee County, Kentucky 36.0 23.0 13.1
Source: FRBNY Consumer Credit Panel/Equifax
Unequal Access to Credit / Policy and Practice for Credit Insecurity

44
Counties Where the Severity Is Likely to Be Overstated without the IndexLastly, there are 417 counties, identified in the table below, where the traditional Not Included filter is likely to overstate the credit insecurity challenge; their distress levels, relative to other counties, are not extremely severe.
For example, Grayson County, Virginia has an insecurity score of 35.5, which places it in the second worst, credit-at-risk, severity tier. However, the traditional Not Included component of 23.7 would identify it as a county that has among the worst access to credit. The difference in severity classifications is because Grayson County has a significant non-inclusion problem; however, residents in the formal credit economy are doing well. Overall, Grayson has a less severe insecurity challenge than other counties analyzed and sorted into the worst, credit-insecure, severity tier.
Counties Where Credit Insecurity Is Less Severe than Traditionally Measured, 2018 Q4
County/StateCredit Insecurity Index,
2018 Q4Credit Constraining
Outcomes ComponentNot Included in Formal
Credit Economy ComponentMonroe County, Mississippi 36.0 20.3 15.7Sevier County, Arkansas 36.0 15.7 20.3Pitt County, North Carolina 36.0 16.2 19.8Calhoun County, West Virginia 35.9 16.5 19.5Casey County, Kentucky 35.9 19.5 16.4Haines Borough, Alaska 35.9 6.1 29.8White Pine County, Nevada 35.8 9.4 26.5Tuscaloosa County, Alabama 35.8 16.1 19.8Blaine County, Oklahoma 35.8 18.0 17.8Idaho County, Idaho 35.8 9.4 26.4Delaware County, Oklahoma 35.8 19.5 16.3Chouteau County, Montana 35.8 6.1 29.7Hart County, Kentucky 35.8 16.0 19.7Jackson County, South Dakota 35.7 14.8 21.0Baker County, Florida 35.7 16.9 18.9New Madrid County, Missouri 35.7 19.1 16.6Catron County, New Mexico 35.7 10.8 24.9Wayne County, Kentucky 35.7 19.3 16.4Mecosta County, Michigan 35.7 11.3 24.4DeKalb County, Alabama 35.5 18.7 16.9Johnson County, Arkansas 35.5 14.3 21.2Suffolk County, Massachusetts 35.5 9.0 26.5Grayson County, Virginia 35.5 11.8 23.7Liberty County, Montana 35.5 6.5 28.9Saluda County, South Carolina 35.5 18.6 16.9Robertson County, Kentucky 35.4 20.4 15.0Socorro County, New Mexico 35.4 20.3 15.1East Feliciana Parish, Louisiana 35.3 19.8 15.6Yell County, Arkansas 35.3 18.8 16.5Lincoln County, West Virginia 35.3 18.9 16.4Lipscomb County, Texas 35.3 15.7 19.6Fredericksburg city, Virginia 35.3 13.6 21.6Charlottesville city, Virginia 35.3 7.9 27.4Braxton County, West Virginia 35.3 15.6 19.7Tippecanoe County, Indiana 35.3 10.8 24.5Wayne County, Nebraska 35.2 8.6 26.6Lauderdale County, Mississippi 35.2 19.2 16.1Butts County, Georgia 35.2 18.5 16.7Caswell County, North Carolina 35.2 15.3 19.9Fayette County, West Virginia 35.2 16.9 18.3Baca County, Colorado 35.1 9.9 25.3Weakley County, Tennessee 35.1 16.9 18.2
Continued on next page
Unequal Access to Credit / Policy and Practice for Credit Insecurity

45
County/StateCredit Insecurity Index,
2018 Q4Credit Constraining
Outcomes ComponentNot Included in Formal
Credit Economy ComponentGilliam County, Oregon 35.1 11.1 24.0Greene County, Illinois 35.1 14.4 20.7Lowndes County, Georgia 35.1 19.7 15.4Edgefield County, South Carolina 35.1 19.1 16.0Washita County, Oklahoma 35.0 17.8 17.2Edmonson County, Kentucky 35.0 14.8 20.2Fulton County, Arkansas 35.0 13.5 21.4Madera County, California 35.0 12.5 22.4Richmond County, Virginia 34.8 15.8 19.0Wise County, Virginia 34.8 16.4 18.4Glascock County, Georgia 34.7 19.2 15.5Cherokee County, Alabama 34.7 17.4 17.3Baraga County, Michigan 34.7 8.2 26.6Grimes County, Texas 34.7 17.3 17.3Otero County, New Mexico 34.7 15.2 19.5McIntosh County, Oklahoma 34.6 18.1 16.5Jasper County, Georgia 34.6 15.7 18.9Perry County, Arkansas 34.6 16.2 18.4Marshall County, Oklahoma 34.6 19.4 15.2Crawford County, Georgia 34.5 17.3 17.2Livingston County, Missouri 34.5 12.8 21.7Yuma County, Arizona 34.5 12.9 21.6Wyandotte County, Kansas 34.4 17.8 16.6Texas County, Missouri 34.4 13.3 21.1Medina County, Texas 34.4 17.3 17.1Dickenson County, Virginia 34.4 16.4 18.0Sierra County, California 34.4 5.4 29.0Fannin County, Texas 34.4 17.7 16.7Madison County, Idaho 34.4 7.0 27.3Tucker County, West Virginia 34.3 12.2 22.1Washington County, Colorado 34.3 10.7 23.7Whitfield County, Georgia 34.3 14.9 19.4Lincoln County, Oklahoma 34.3 18.8 15.5Granite County, Montana 34.3 9.1 25.2Randolph County, West Virginia 34.3 16.9 17.3Morgan County, Ohio 34.3 12.7 21.5Hudspeth County, Texas 34.2 14.2 20.1Sampson County, North Carolina 34.2 17.6 16.7Stevens County, Minnesota 34.2 5.1 29.1Tompkins County, New York 34.2 7.4 26.8Randolph County, Illinois 34.2 11.6 22.6Trinity County, California 34.2 7.6 26.5Alachua County, Florida 34.1 12.1 22.1Champaign County, Illinois 34.1 10.6 23.5Cheyenne County, Kansas 34.1 8.6 25.5Madison County, Kentucky 34.1 15.4 18.7Stafford County, Kansas 34.0 11.6 22.5Cameron Parish, Louisiana 34.0 14.7 19.3Calhoun County, Arkansas 34.0 18.1 15.9Allegany County, New York 34.0 11.2 22.8Leon County, Florida 34.0 13.5 20.6Alcorn County, Mississippi 34.0 17.4 16.6Oldham County, Texas 34.0 13.7 20.2Douglas County, Kansas 33.9 9.5 24.5Ritchie County, West Virginia 33.9 14.4 19.5Story County, Iowa 33.9 8.2 25.7Avery County, North Carolina 33.9 10.6 23.3Throckmorton County, Texas 33.9 17.7 16.2Lawrence County, Arkansas 33.9 18.1 15.8Cortland County, New York 33.8 11.4 22.5Phelps County, Missouri 33.8 14.5 19.3
Continued on next page
Unequal Access to Credit / Policy and Practice for Credit Insecurity

46
County/StateCredit Insecurity Index,
2018 Q4Credit Constraining
Outcomes ComponentNot Included in Formal
Credit Economy ComponentOuray County, Colorado 33.8 5.1 28.6Metcalfe County, Kentucky 33.7 17.0 16.8McKenzie County, North Dakota 33.7 10.8 22.9Greene County, Arkansas 33.7 17.0 16.7Deer Lodge County, Montana 33.7 11.2 22.5Vigo County, Indiana 33.7 15.3 18.4Douglas County, Missouri 33.7 12.9 20.8Logan County, Illinois 33.6 13.8 19.7Holmes County, Ohio 33.6 7.1 26.4Van Buren County, Arkansas 33.6 15.4 18.2Houghton County, Michigan 33.5 8.2 25.3Brewster County, Texas 33.5 16.4 17.1Dallas County, Texas 33.5 16.2 17.2Marion County, Arkansas 33.4 14.1 19.3Preston County, West Virginia 33.4 12.6 20.8Harlan County, Nebraska 33.4 8.0 25.4Custer County, Oklahoma 33.4 17.6 15.8Pike County, Missouri 33.4 13.9 19.5Logan County, Colorado 33.4 11.5 21.9Decatur County, Iowa 33.3 12.5 20.8Union County, New Mexico 33.3 14.7 18.6Lumpkin County, Georgia 33.2 13.4 19.8Todd County, Kentucky 33.2 17.9 15.3Putnam County, Tennessee 33.2 14.7 18.5Van Buren County, Tennessee 33.2 17.8 15.4King and Queen County, Virginia 33.2 13.1 20.1Stone County, Arkansas 33.2 15.1 18.1Franklin County, Arkansas 33.1 17.1 16.0Ripley County, Missouri 33.1 17.5 15.6Mills County, Texas 33.0 15.3 17.7Gratiot County, Michigan 33.0 11.6 21.4Donley County, Texas 33.0 17.8 15.2Perry County, Illinois 33.0 13.4 19.6Harper County, Kansas 33.0 11.4 21.6Huerfano County, Colorado 33.0 12.7 20.2Logan County, Oklahoma 33.0 13.5 19.4Hunt County, Texas 33.0 17.8 15.2Butler County, Kentucky 33.0 17.8 15.1Morrill County, Nebraska 32.9 10.5 22.3Gilpin County, Colorado 32.9 6.0 26.9Parke County, Indiana 32.9 13.4 19.4Harnett County, North Carolina 32.9 14.8 18.0Pendleton County, West Virginia 32.8 13.7 19.1Goshen County, Wyoming 32.8 10.2 22.6Decatur County, Kansas 32.8 7.1 25.6Carroll County, Virginia 32.8 13.0 19.8Faulk County, South Dakota 32.8 7.5 25.3Kern County, California 32.7 14.3 18.4McCormick County, South Carolina 32.7 15.9 16.8Gilmer County, Georgia 32.7 13.1 19.6Kiowa County, Oklahoma 32.7 17.7 15.0Kittitas County, Washington 32.6 7.6 25.1Jefferson County, Florida 32.6 15.8 16.8Breckinridge County, Kentucky 32.6 16.5 16.1Harris County, Texas 32.6 15.9 16.7Ballard County, Kentucky 32.6 14.9 17.6White County, Georgia 32.6 13.6 19.0Phillips County, Montana 32.5 8.5 24.0Lyon County, Kansas 32.5 12.6 20.0Hart County, Georgia 32.5 17.2 15.3Camden County, Missouri 32.5 12.6 19.8
Continued on next page
Unequal Access to Credit / Policy and Practice for Credit Insecurity

47
County/StateCredit Insecurity Index,
2018 Q4Credit Constraining
Outcomes ComponentNot Included in Formal
Credit Economy ComponentBoone County, Missouri 32.4 11.4 21.0Hays County, Texas 32.4 12.5 19.9Grand County, Colorado 32.4 5.7 26.8Faulkner County, Arkansas 32.4 15.6 16.8Bland County, Virginia 32.3 11.2 21.2White County, Arkansas 32.3 16.6 15.7Roanoke city, Virginia 32.3 17.1 15.2Audrain County, Missouri 32.3 16.8 15.5Cumberland County, Virginia 32.3 16.8 15.5Hancock County, Mississippi 32.3 16.3 16.0Montgomery County, Arkansas 32.3 12.4 19.8Madison County, Arkansas 32.3 14.2 18.1Washington County, Arkansas 32.3 13.7 18.6Cass County, Indiana 32.2 14.8 17.5Bon Homme County, South Dakota 32.2 7.7 24.5Scotland County, Missouri 32.2 9.3 22.9Meigs County, Ohio 32.2 16.5 15.7Granville County, North Carolina 32.1 14.4 17.7Wicomico County, Maryland 32.0 15.1 16.9Polk County, Missouri 31.9 14.2 17.8Sullivan County, Missouri 31.9 12.7 19.2Pickens County, South Carolina 31.9 14.5 17.4Person County, North Carolina 31.9 15.6 16.3Graham County, North Carolina 31.9 14.9 16.9Craig County, Virginia 31.9 14.7 17.1Franklin County, Texas 31.9 16.8 15.0Oglethorpe County, Georgia 31.8 14.8 17.0Ellsworth County, Kansas 31.8 13.6 18.2Polk County, Arkansas 31.8 14.6 17.2Southampton County, Virginia 31.8 14.4 17.4Brookings County, South Dakota 31.8 8.2 23.5Atchison County, Kansas 31.7 15.2 16.5Branch County, Michigan 31.7 12.6 19.1Kings County, New York 31.7 9.9 21.8Merced County, California 31.7 13.5 18.2Summit County, Colorado 31.6 5.3 26.4Sullivan County, New York 31.6 12.8 18.9Colfax County, Nebraska 31.6 9.8 21.8Greene County, Georgia 31.6 15.2 16.4Hardin County, Ohio 31.6 14.1 17.6Coke County, Texas 31.6 13.5 18.1Warren County, Kentucky 31.6 14.2 17.4Yuba County, California 31.6 12.8 18.8Gila County, Arizona 31.6 12.5 19.1Park County, Colorado 31.5 6.5 25.1Henry County, Virginia 31.5 15.6 15.9Tulare County, California 31.5 15.1 16.4Madison County, Ohio 31.5 12.4 19.1Broadwater County, Montana 31.5 7.8 23.7Southeast Fairbanks Census Area, Alaska 31.5 8.1 23.3Miami County, Indiana 31.4 15.6 15.9Huntingdon County, Pennsylvania 31.4 11.3 20.1Chippewa County, Michigan 31.3 11.3 20.0Ingham County, Michigan 31.3 12.0 19.3Union County, Iowa 31.3 11.8 19.5Bond County, Illinois 31.3 11.8 19.5Dade County, Georgia 31.3 15.6 15.6Malheur County, Oregon 31.3 15.2 16.0Sublette County, Wyoming 31.2 7.5 23.7Grundy County, Missouri 31.2 12.4 18.8Sharp County, Arkansas 31.2 15.2 16.1
Continued on next page
Unequal Access to Credit / Policy and Practice for Credit Insecurity
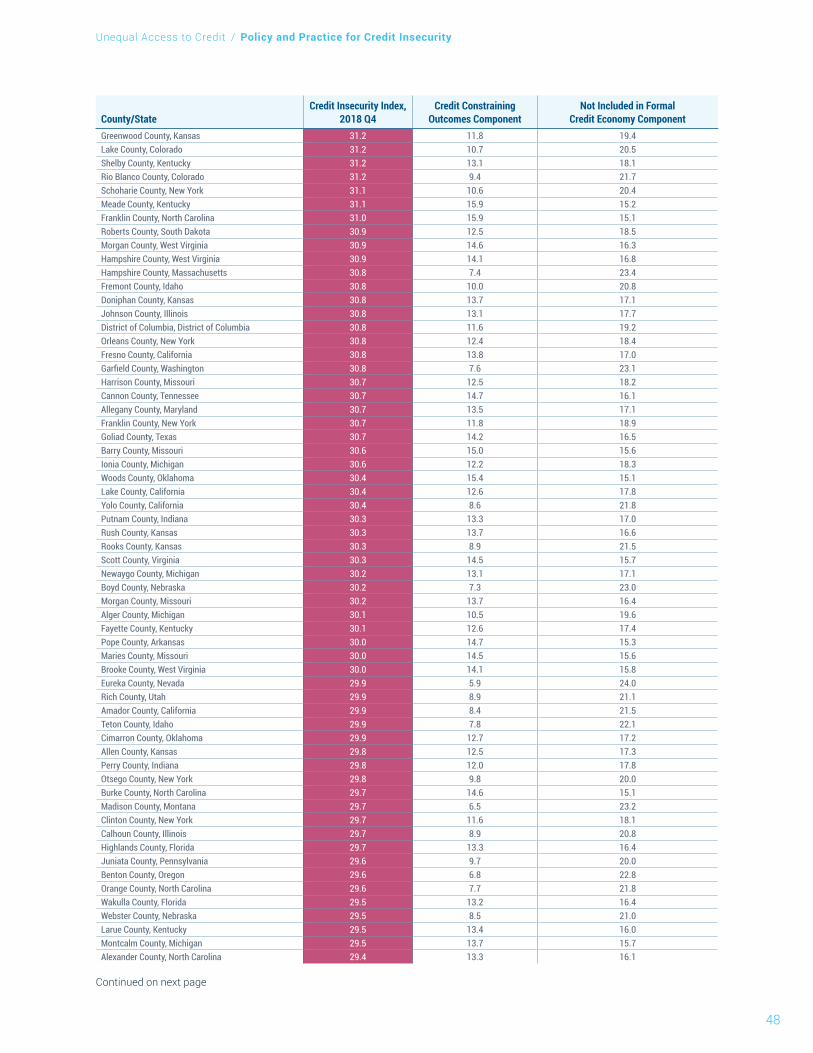
48
County/StateCredit Insecurity Index,
2018 Q4Credit Constraining
Outcomes ComponentNot Included in Formal
Credit Economy ComponentGreenwood County, Kansas 31.2 11.8 19.4Lake County, Colorado 31.2 10.7 20.5Shelby County, Kentucky 31.2 13.1 18.1Rio Blanco County, Colorado 31.2 9.4 21.7Schoharie County, New York 31.1 10.6 20.4Meade County, Kentucky 31.1 15.9 15.2Franklin County, North Carolina 31.0 15.9 15.1Roberts County, South Dakota 30.9 12.5 18.5Morgan County, West Virginia 30.9 14.6 16.3Hampshire County, West Virginia 30.9 14.1 16.8Hampshire County, Massachusetts 30.8 7.4 23.4Fremont County, Idaho 30.8 10.0 20.8Doniphan County, Kansas 30.8 13.7 17.1Johnson County, Illinois 30.8 13.1 17.7District of Columbia, District of Columbia 30.8 11.6 19.2Orleans County, New York 30.8 12.4 18.4Fresno County, California 30.8 13.8 17.0Garfield County, Washington 30.8 7.6 23.1Harrison County, Missouri 30.7 12.5 18.2Cannon County, Tennessee 30.7 14.7 16.1Allegany County, Maryland 30.7 13.5 17.1Franklin County, New York 30.7 11.8 18.9Goliad County, Texas 30.7 14.2 16.5Barry County, Missouri 30.6 15.0 15.6Ionia County, Michigan 30.6 12.2 18.3Woods County, Oklahoma 30.4 15.4 15.1Lake County, California 30.4 12.6 17.8Yolo County, California 30.4 8.6 21.8Putnam County, Indiana 30.3 13.3 17.0Rush County, Kansas 30.3 13.7 16.6Rooks County, Kansas 30.3 8.9 21.5Scott County, Virginia 30.3 14.5 15.7Newaygo County, Michigan 30.2 13.1 17.1Boyd County, Nebraska 30.2 7.3 23.0Morgan County, Missouri 30.2 13.7 16.4Alger County, Michigan 30.1 10.5 19.6Fayette County, Kentucky 30.1 12.6 17.4Pope County, Arkansas 30.0 14.7 15.3Maries County, Missouri 30.0 14.5 15.6Brooke County, West Virginia 30.0 14.1 15.8Eureka County, Nevada 29.9 5.9 24.0Rich County, Utah 29.9 8.9 21.1Amador County, California 29.9 8.4 21.5Teton County, Idaho 29.9 7.8 22.1Cimarron County, Oklahoma 29.9 12.7 17.2Allen County, Kansas 29.8 12.5 17.3Perry County, Indiana 29.8 12.0 17.8Otsego County, New York 29.8 9.8 20.0Burke County, North Carolina 29.7 14.6 15.1Madison County, Montana 29.7 6.5 23.2Clinton County, New York 29.7 11.6 18.1Calhoun County, Illinois 29.7 8.9 20.8Highlands County, Florida 29.7 13.3 16.4Juniata County, Pennsylvania 29.6 9.7 20.0Benton County, Oregon 29.6 6.8 22.8Orange County, North Carolina 29.6 7.7 21.8Wakulla County, Florida 29.5 13.2 16.4Webster County, Nebraska 29.5 8.5 21.0Larue County, Kentucky 29.5 13.4 16.0Montcalm County, Michigan 29.5 13.7 15.7Alexander County, North Carolina 29.4 13.3 16.1
Continued on next page
Unequal Access to Credit / Policy and Practice for Credit Insecurity

49
County/StateCredit Insecurity Index,
2018 Q4Credit Constraining
Outcomes ComponentNot Included in Formal
Credit Economy ComponentWinona County, Minnesota 29.4 8.4 21.0Dunn County, Wisconsin 29.4 8.4 21.0Washington County, New York 29.4 11.7 17.7Grant County, Washington 29.3 12.3 17.0Montgomery County, Illinois 29.3 13.6 15.8Kimball County, Nebraska 29.3 11.8 17.5Mountrail County, North Dakota 29.2 14.0 15.2Neosho County, Kansas 29.1 13.5 15.7Hamilton County, Illinois 29.1 13.6 15.5Madison County, North Carolina 29.1 13.3 15.8Adams County, Wisconsin 29.1 9.9 19.2Buena Vista County, Iowa 29.0 12.3 16.7Hamilton County, Kansas 29.0 11.8 17.1Alleghany County, North Carolina 28.9 9.7 19.3Cherry County, Nebraska 28.9 8.3 20.6Columbia County, Pennsylvania 28.9 10.8 18.1Gunnison County, Colorado 28.9 5.3 23.6Crawford County, Michigan 28.8 13.6 15.2Page County, Iowa 28.7 12.2 16.6De Baca County, New Mexico 28.7 11.2 17.5Greene County, New York 28.7 11.6 17.1Jefferson County, Oregon 28.7 13.3 15.4Lyman County, South Dakota 28.7 12.4 16.2Transylvania County, North Carolina 28.6 11.0 17.6Lyon County, Kentucky 28.6 11.0 17.6Yates County, New York 28.6 11.5 17.1Johnson County, Iowa 28.5 8.2 20.3Durham County, North Carolina 28.5 12.2 16.3Graham County, Kansas 28.5 11.2 17.3Schuyler County, Illinois 28.5 13.4 15.1Jackson County, Wisconsin 28.5 11.5 17.0Beltrami County, Minnesota 28.4 11.5 16.9Dawson County, Montana 28.4 9.0 19.4Clark County, Kansas 28.4 9.9 18.5Travis County, Texas 28.4 11.2 17.2Beaverhead County, Montana 28.4 7.9 20.4Custer County, Nebraska 28.3 8.9 19.4Bandera County, Texas 28.3 11.7 16.7Floyd County, Virginia 28.3 10.4 17.8Johnson County, Missouri 28.2 13.1 15.2Morton County, Kansas 28.2 12.4 15.8Pamlico County, North Carolina 28.2 12.1 16.0Wahkiakum County, Washington 28.2 8.5 19.7Highland County, Virginia 28.1 8.3 19.8Tehama County, California 28.1 13.1 15.0McPherson County, South Dakota 28.1 9.6 18.5St. Lawrence County, New York 28.1 12.5 15.6Clark County, Missouri 28.1 9.9 18.1New Hanover County, North Carolina 28.1 11.6 16.4Crawford County, Iowa 28.0 12.5 15.5Delaware County, New York 28.0 10.5 17.5Forest County, Wisconsin 28.0 11.4 16.6Latah County, Idaho 27.9 8.8 19.1Butte County, California 27.9 11.6 16.3Jewell County, Kansas 27.9 7.8 20.1Snyder County, Pennsylvania 27.9 10.3 17.6Davison County, South Dakota 27.8 10.1 17.8Trego County, Kansas 27.8 11.6 16.3Sanborn County, South Dakota 27.8 7.2 20.7Santa Barbara County, California 27.7 9.4 18.3Hawaii County, Hawaii 27.7 10.1 17.6
Continued on next page
Unequal Access to Credit / Policy and Practice for Credit Insecurity

50
County/StateCredit Insecurity Index,
2018 Q4Credit Constraining
Outcomes ComponentNot Included in Formal
Credit Economy ComponentSan Miguel County, Colorado 27.7 5.3 22.4Carbon County, Wyoming 27.6 12.1 15.5Polk County, North Carolina 27.6 9.7 17.8Blue Earth County, Minnesota 27.5 9.0 18.5Chaffee County, Colorado 27.5 6.5 21.0LaGrange County, Indiana 27.5 10.7 16.8Watonwan County, Minnesota 27.4 10.8 16.6Grays Harbor County, Washington 27.4 12.3 15.1Waldo County, Maine 27.3 12.1 15.2DeKalb County, Illinois 27.3 11.9 15.4Sitka City and Borough, Alaska 27.3 7.4 19.9Aitkin County, Minnesota 27.2 9.0 18.2Barber County, Kansas 27.1 10.6 16.5Monterey County, California 27.1 10.9 16.2Humboldt County, California 27.0 10.5 16.5Denver County, Colorado 26.9 9.6 17.3Pine County, Minnesota 26.9 11.4 15.5Modoc County, California 26.8 10.8 16.0Matanuska-Susitna Borough, Alaska 26.7 9.7 17.0Indiana County, Pennsylvania 26.7 11.4 15.4Adams County, Idaho 26.6 7.9 18.8Moody County, South Dakota 26.6 9.7 17.0Hudson County, New Jersey 26.6 11.2 15.4Dixon County, Nebraska 26.6 9.9 16.7Livingston County, New York 26.3 9.7 16.7Buffalo County, Nebraska 26.3 9.7 16.6Eagle County, Colorado 26.3 6.5 19.8Ellis County, Kansas 26.3 10.2 16.1Gregory County, South Dakota 26.2 8.9 17.4Iron County, Utah 26.2 10.5 15.6Deuel County, Nebraska 26.2 7.3 18.8Grant County, Wisconsin 26.1 9.1 17.0Garfield County, Colorado 26.1 9.6 16.6Routt County, Colorado 26.1 5.4 20.7Davis County, Iowa 26.1 10.5 15.5Ketchikan Gateway Borough, Alaska 26.0 8.3 17.7Big Horn County, Wyoming 26.0 9.3 16.6Washtenaw County, Michigan 25.9 8.8 17.1Boundary County, Idaho 25.9 10.6 15.3Butte County, South Dakota 25.8 10.8 15.1Custer County, South Dakota 25.8 8.4 17.4Archuleta County, Colorado 25.8 8.2 17.6Daniels County, Montana 25.7 8.7 17.0McCone County, Montana 25.5 6.4 19.2Kodiak Island Borough, Alaska 25.5 6.1 19.4Butte County, Idaho 25.4 10.1 15.4Plumas County, California 25.3 8.5 16.8Waushara County, Wisconsin 25.3 10.2 15.1Marquette County, Michigan 24.9 9.7 15.2Collier County, Florida 24.9 9.1 15.8La Plata County, Colorado 24.9 9.0 15.9San Luis Obispo County, California 24.8 7.9 16.9Sumter County, Florida 24.7 6.9 17.9Queens County, New York 24.6 9.2 15.4Teton County, Montana 24.4 8.0 16.3Nicollet County, Minnesota 24.3 9.0 15.3Pitkin County, Colorado 24.3 5.1 19.2Spink County, South Dakota 24.2 8.2 16.0Beaver County, Utah 24.1 8.0 16.2Pierce County, Wisconsin 24.0 7.6 16.4
Continued on next page
Unequal Access to Credit / Policy and Practice for Credit Insecurity

51
County/StateCredit Insecurity Index,
2018 Q4Credit Constraining
Outcomes ComponentNot Included in Formal
Credit Economy ComponentBarnes County, North Dakota 23.9 8.8 15.1Valley County, Idaho 23.8 6.6 17.3Clear Creek County, Colorado 23.8 7.9 15.9Hutchinson County, South Dakota 23.5 6.4 17.1Kenai Peninsula Borough, Alaska 23.4 7.9 15.6Cache County, Utah 23.0 7.9 15.1Custer County, Idaho 22.7 5.2 17.4Sioux County, Iowa 22.6 7.4 15.1Keweenaw County, Michigan 22.5 6.9 15.6San Juan County, Washington 21.5 6.0 15.5
Source: FRBNY Consumer Credit Panel/Equifax
Differences among counties by index components suggest ways to target policy and practice to local credit conditions. Even though communities may have the same insecurity score, their issues may be different. These differences may be used to target policy actions for greater impact. To illustrate this point, in the following table are four counties, each with the insecurity index score of 38.0, yet with differing un-derlying credit conditions and policy challenges.
Example of Counties with Same Index Scores but Different Underlying Conditions and Policy Challenges
County/StateCredit Insecurity Index,
2018 Q4Credit Constraining
Outcomes ComponentNot Included in Formal
Credit Economy ComponentSeminole County, Oklahoma 38.0 24.0 14.0Estill County, Kentucky 38.0 20.5 17.5Alamosa County, Colorado 38.0 12.8 25.2Toole County, Montana 38.0 9.6 28.4
For example, both Alamosa County, Colorado and Toole County, Montana experience severe non-inclusion from the formal credit economy. Policies, programs and product innovations that help connect residents to mainstream credit institutions and bring them into the formal credit economy are important to reducing credit insecurity. These counties might also need innovative credit products that meet residents’ needs and assist them with wealth building through the appropriate use of credit.
In contrast, both Seminole County, Oklahoma and Estill County, Kentucky are examples of counties where the policy and practice mix might tilt towards credit-building efforts since detrimental credit outcomes are identified as more important here than in Alamosa and Toole Counties. Hence, a tilt towards credit edu-cation, credit counseling, and credit remediation programs may support individuals who are in the formal credit economy but unlikely to obtain funding at choice because of their credit outcomes.
More research is needed before policy suggestions and program interventions may be identified; these examples illustrate how the index might be useful for policymakers and practitioners.
The views expressed here are those of the authors and do not necessarily reflect those of the Federal Reserve Bank of New York or the Federal Reserve System..
Kausar Hamdani, Ph.D. Senior Vice President and Senior Advisor
Edison Reyes Associate
Claire Kramer Mills, Ph.D. Assistant Vice President
Jessica Battisto Senior Analyst
Unequal Access to Credit / Policy and Practice for Credit Insecurity
52
The Credit Insecurity Index uses the Community Credit framework,32 where access to credit is a financial asset for economic opportunity. Consumer credit data are aggregated to examine credit health and economic well-being within a community. The index is an attributes index, which is particularly useful when differ-ences in quality matter. The index combines several Community Credit indicators as quality adjustments to the base indicators, ‘Included’ and ‘Not Included,’ from the Community Credit paradigm, to measure the impact of credit constraints within the community.
Data SourcesSeveral data sources were used for this project.
For the U.S., state, and county adult population values needed to calculate the Included and Not-Included measures, we use population estimates provided by the U.S. Census Bureau’s Population Estimates Program (PEP).
The economic indicators presented in this paper are sourced from the U.S. Census Bureau’s 2013–2017 5-Year American Community Survey.
The credit data are from the FRBNY Consumer Credit Panel/Equifax (CCP), which consists of detailed Equifax credit report data for a unique longitudinal quarterly panel of individuals and households. The panel is a five percent nationally representative sample of all individuals with a social security number and a credit report. All information is anonymized. Data are available quarterly, though year-end (Q4) values are used to calculate the index scores.33
To avoid small sample problems, we exclude from the analysis counties with fewer than 50 observations in the CCP as of the fourth quarter of 2018. As a result, we do not present information for 60 of the 3,142 Census-identified counties and equivalents in the U.S.
Credit Insecurity IndexThe Credit Insecurity Index focuses on the adult population that is credit constrained, that is, unlikely to obtain credit at their choice to manage emergencies, to take advantage of opportunities or to invest in one’s future. A community with a larger share of credit-constrained individuals is less credit secure and resilient than is a community with a smaller share.
32 See https://www.newyorkfed.org/data-and-statistics/data-visualization/community-credit-profiles/index.html#overview33 For more information about the CCP, see the Federal Reserve Bank of New York Staff Report, An Introduction to the FRBNY Consumer Credit Panel.
7UNEQUAL ACCESS TO CREDIT
CREDIT INSECURITY INDEX METHODOLOGY
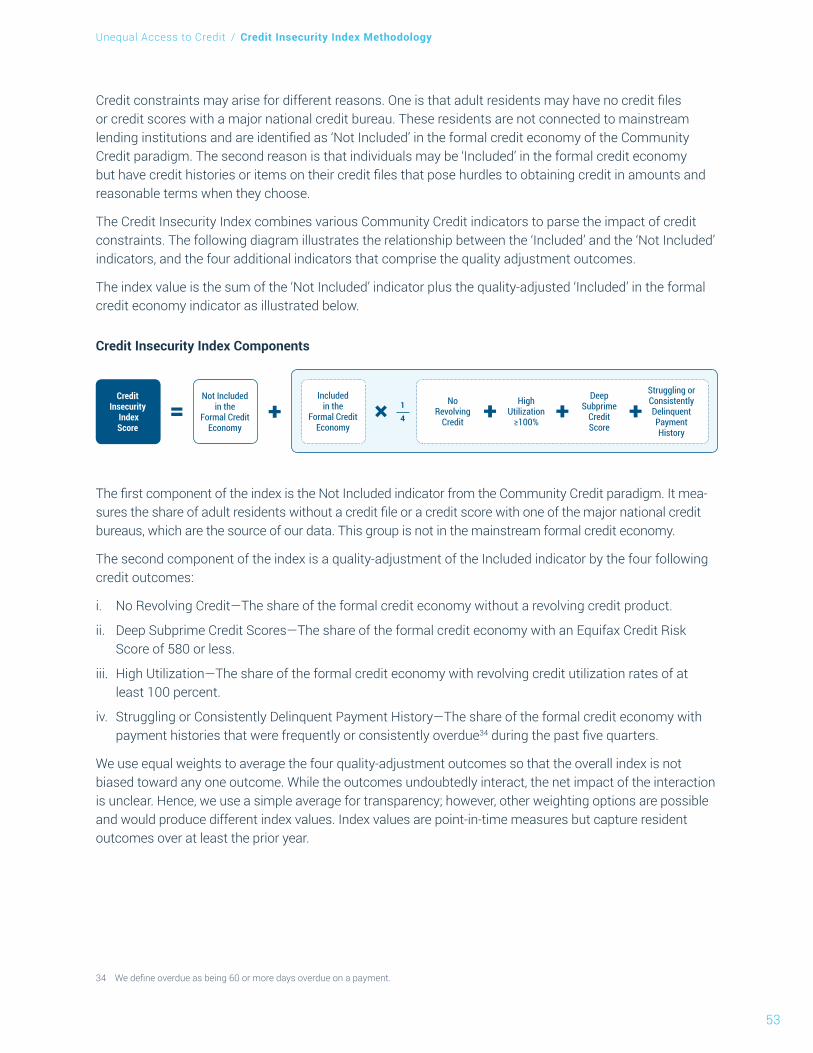
53
Credit constraints may arise for different reasons. One is that adult residents may have no credit files or credit scores with a major national credit bureau. These residents are not connected to mainstream lending institutions and are identified as ‘Not Included’ in the formal credit economy of the Community Credit paradigm. The second reason is that individuals may be ‘Included’ in the formal credit economy but have credit histories or items on their credit files that pose hurdles to obtaining credit in amounts and reasonable terms when they choose.
The Credit Insecurity Index combines various Community Credit indicators to parse the impact of credit constraints. The following diagram illustrates the relationship between the ‘Included’ and the ‘Not Included’ indicators, and the four additional indicators that comprise the quality adjustment outcomes.
The index value is the sum of the ‘Not Included’ indicator plus the quality-adjusted ‘Included’ in the formal credit economy indicator as illustrated below.
Credit Insecurity Index Components
Credit Insecurity
Index Score
Not Included in the
Formal Credit Economy
Included in the
Formal Credit Economy
1
4
No Revolving
Credit
High Utilization
≥100%
Deep Subprime
Credit Score
Struggling or Consistently Delinquent Payment History
The first component of the index is the Not Included indicator from the Community Credit paradigm. It mea-sures the share of adult residents without a credit file or a credit score with one of the major national credit bureaus, which are the source of our data. This group is not in the mainstream formal credit economy.
The second component of the index is a quality-adjustment of the Included indicator by the four following credit outcomes:
i. No Revolving Credit—The share of the formal credit economy without a revolving credit product.
ii. Deep Subprime Credit Scores—The share of the formal credit economy with an Equifax Credit Risk Score of 580 or less.
iii. High Utilization—The share of the formal credit economy with revolving credit utilization rates of at least 100 percent.
iv. Struggling or Consistently Delinquent Payment History—The share of the formal credit economy with payment histories that were frequently or consistently overdue34 during the past five quarters.
We use equal weights to average the four quality-adjustment outcomes so that the overall index is not biased toward any one outcome. While the outcomes undoubtedly interact, the net impact of the interaction is unclear. Hence, we use a simple average for transparency; however, other weighting options are possible and would produce different index values. Index values are point-in-time measures but capture resident outcomes over at least the prior year.
34 We define overdue as being 60 or more days overdue on a payment.
Unequal Access to Credit / Credit Insecurity Index Methodology

54
Numerical Example of Credit Insecurity Index, U.S. 2018 Q4
23.8 10.5 89.5 1
4 14.7 6.2 26.0 12.7
Source: FRBNY Consumer Credit Panel/Equifax
Combining the two sources (10.5 plus 13.3), the Credit Insecurity Index score for the U.S. was 23.8 as of the fourth quarter of 2018. In other words, just under half of the credit insecurity in America is due to adults who are not in the formal credit economy, while a little over half is due to credit outcomes that make it difficult for individuals in the formal credit economy to access credit at choice for economic opportunity and resiliency.
Index values are interpreted a little differently than the Community Credit indicators. An attractive feature of the original Community Credit indicators is the one-to-one correspondence between credit outcomes and population shares. For example, an indicator value of 89.5 is interpreted as 89.5% of residents or indi-viduals in the formal credit economy experienced that credit outcome. That one-to-one equivalence does not hold for the index scores because a person may have some credit outcomes but not others.
In the numerical calculation above, if credit insecurity in the U.S. were due solely to adults not connected to mainstream credit institutions, then the Credit Insecurity Index score would be 10.5. However, negative credit outcomes also limited access to credit; in 2018, it was as if the equivalent of 13.3% of adult U.S. residents were in the formal credit economy but had credit histories and outcomes that made it hard for them to access credit at choice. In other words, access to credit within a community was eroded by the presence of adults who are not in the formal credit economy as well as by adverse credit outcomes among residents in the formal credit economy. All together, credit insecurity more than doubled in the U.S. when metrics incorporated the impact of credit constraints.
The index score is a relative measure of the collective impact of credit constraints on a community, over time and geographies, rather than the actual size of the community’s credit attributes. Higher index score values indicate that a community is more credit constrained, or credit insecure, than communities with lower scores.
Unequal Access to Credit / Credit Insecurity Index Methodology
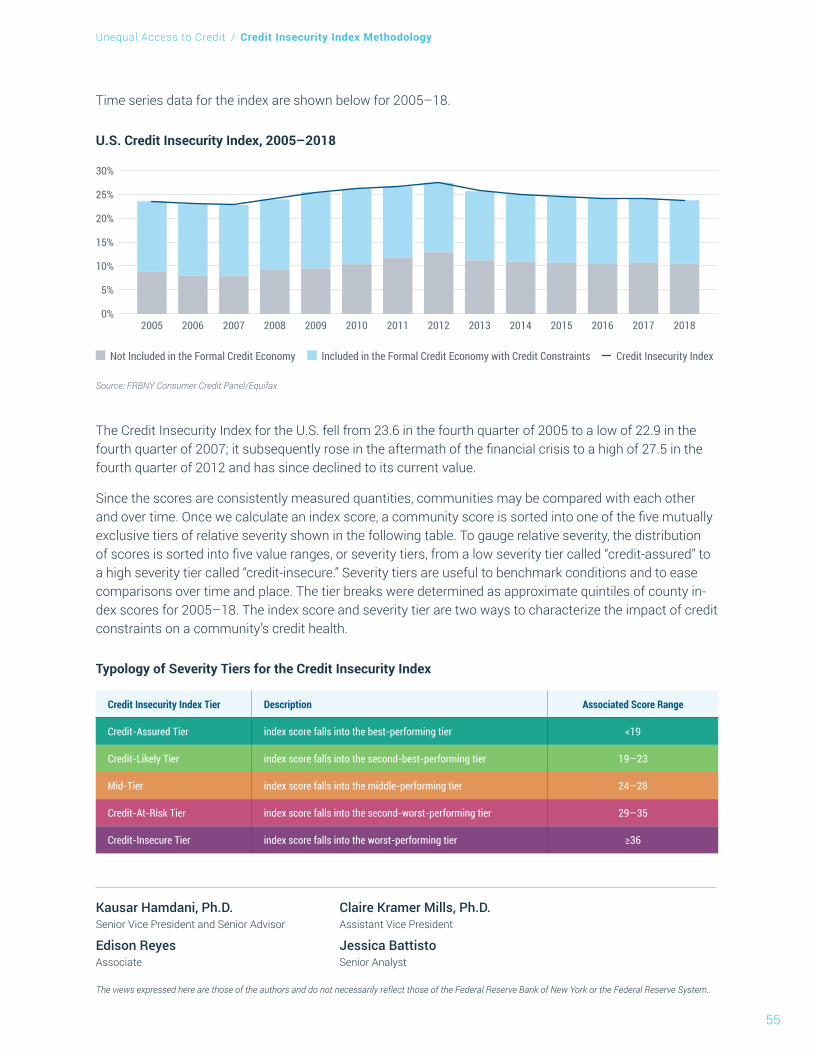
55
Time series data for the index are shown below for 2005–18.
U.S. Credit Insecurity Index, 2005–2018
Source: FRBNY Consumer Credit Panel/Equifax
0%
5%
10%
15%
20%
25%
30%
2005 2006 2007 2008 2009 2010 2011 2012 2013 2014 2015 2016 2017 2018
Not Included in the Formal Credit Economy Included in the Formal Credit Economy with Credit Constraints Credit Insecurity Index
The Credit Insecurity Index for the U.S. fell from 23.6 in the fourth quarter of 2005 to a low of 22.9 in the fourth quarter of 2007; it subsequently rose in the aftermath of the financial crisis to a high of 27.5 in the fourth quarter of 2012 and has since declined to its current value.
Since the scores are consistently measured quantities, communities may be compared with each other and over time. Once we calculate an index score, a community score is sorted into one of the five mutually exclusive tiers of relative severity shown in the following table. To gauge relative severity, the distribution of scores is sorted into five value ranges, or severity tiers, from a low severity tier called “credit-assured” to a high severity tier called “credit-insecure.” Severity tiers are useful to benchmark conditions and to ease comparisons over time and place. The tier breaks were determined as approximate quintiles of county in-dex scores for 2005–18. The index score and severity tier are two ways to characterize the impact of credit constraints on a community’s credit health.
Typology of Severity Tiers for the Credit Insecurity Index
Credit Insecurity Index Tier Description Associated Score Range
Credit-Assured Tier index score falls into the best-performing tier <19
Credit-Likely Tier index score falls into the second-best-performing tier 19—23
Mid-Tier index score falls into the middle-performing tier 24—28
Credit-At-Risk Tier index score falls into the second-worst-performing tier 29—35
Credit-Insecure Tier index score falls into the worst-performing tier ≥36
The views expressed here are those of the authors and do not necessarily reflect those of the Federal Reserve Bank of New York or the Federal Reserve System..
Kausar Hamdani, Ph.D. Senior Vice President and Senior Advisor
Edison Reyes Associate
Claire Kramer Mills, Ph.D. Assistant Vice President
Jessica Battisto Senior Analyst
Unequal Access to Credit / Credit Insecurity Index Methodology
56
The Community Credit body of work has evolved over the last five years. During that time, many individuals have generously shared their time and experience to make the work more robust, relevant and accessible to policymakers, practitioners, funders, researchers, government officials and other community stakeholders.
The development of the Credit Insecurity Index is no exception. We particularly wish to thank the following people for providing detailed comments on this report:
Michael Dedmon, Policy Manager, The Financial Clinic
Amelia Erwitt, Managing Director, CFE Fund
Nicky Grist, Principal, CFE Fund
Tammy Halevy, Senior Advisor, Public Private Strategies
Stephanie Hoopes, National Director, United For ALICE
Ruhi Maker, Senior Staff Attorney, Empire Justice Center
Jonathan Mintz, Chief Executive Officer, CFE Fund
Barbara Robles, Principal Economist, Board of Governors of the Federal Reserve System
Barbara van Kerkhove, Research/Policy Analyst, Empire Justice Center
Mae Watson Grote, Chief Executive Officer, The Financial Clinic
8UNEQUAL ACCESS TO CREDIT
ACKNOWLEDGMENTS


