Approved by the World Agricultural Outlook Board United States Department of Agriculture Foreign Agricultural Service Circular Series WAP 12-19 December 2019 Papua New Guinea: Palm Oil Production Reduced After Volcanic Eruption USDA estimates Papua New Guinea 2019/20 palm oil production at 510,000 metric tons (mt), down 120,000 (19 percent) from last month, and down 138,000 mt (21 percent) from last year. Harvested area is expected to total 150,000 hectares (ha), down 25,000 ha (14 percent) from last month, and similarly down from last year. Yield is forecast at 3.40 tons per hectare, 8 percent below last year. Volcanic eruptions in June, August and September of 2019 partially destroyed oil palm plantations closest to the volcano. These eruptions also generated a widespread layer of volcanic ash that will reduce crude palm oil production in areas more distant from the eruption site. World Agricultural Production
Transcript
Approved by the World Agricultural Outlook Board
United States Department of Agriculture Foreign
Agricultural Service Circular Series WAP 12-19 December 2019
Papua New Guinea: Palm Oil Production Reduced After Volcanic Eruption
USDA estimates Papua New Guinea 2019/20 palm oil production at 510,000 metric tons (mt), down 120,000 (19 percent) from last month, and down 138,000 mt (21 percent) from last year. Harvested area is expected to total 150,000 hectares (ha), down 25,000 ha (14 percent) from last month, and similarly down from last year. Yield is forecast at 3.40 tons per hectare, 8 percent below last year. Volcanic eruptions in June, August and September of 2019 partially destroyed oil palm plantations closest to the volcano. These eruptions also generated a widespread layer of volcanic ash that will reduce crude palm oil production in areas more distant from the eruption site.
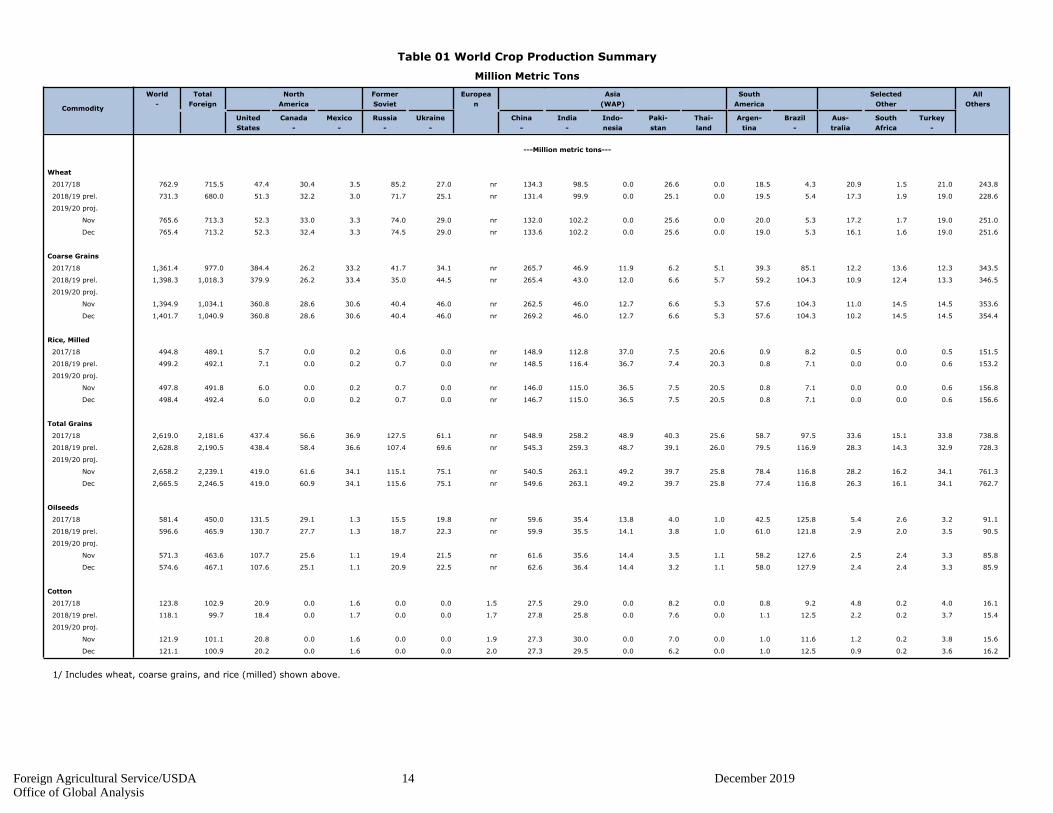
World Agricultural Production
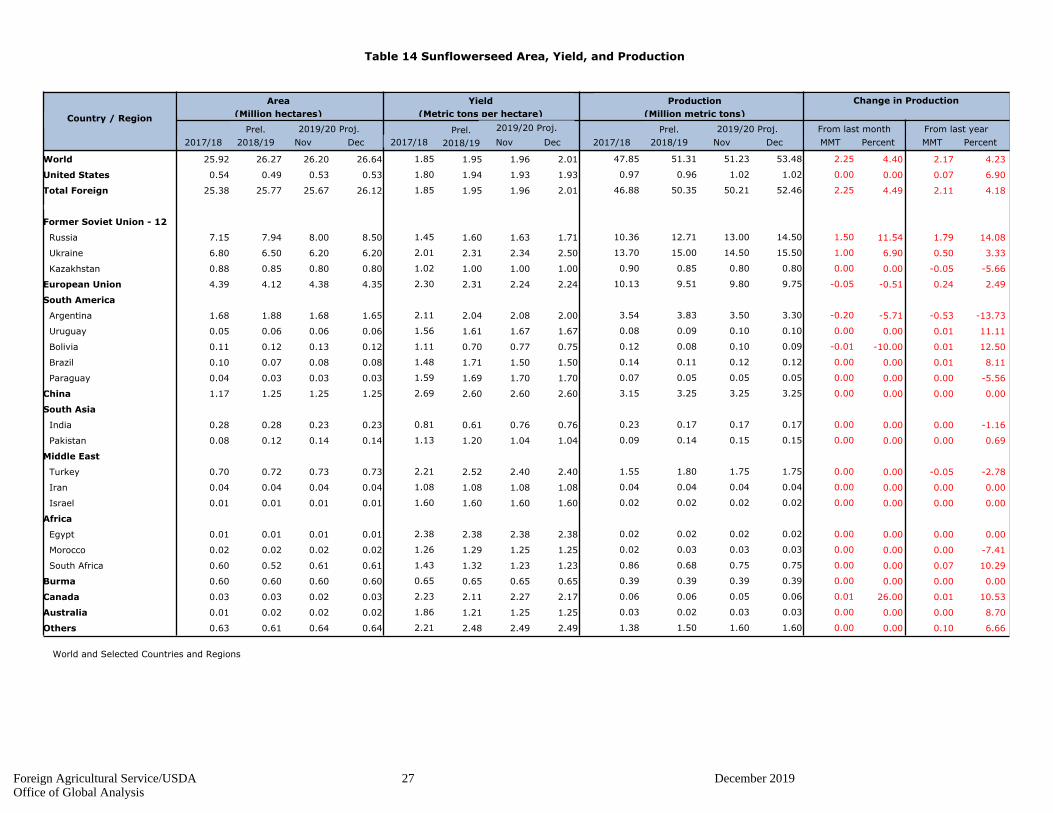
It is expected that large plantation companies will be able to overcome cashflow constraints from lower production, while smallholders may be forced to reduce input costs such as minimizing fertilizer applications. Recovery will be slow and local market observers estimate that production will remain below recent levels for the next two years. (For more information, please contact [email protected].) Russia Sunflowerseed: Record Yield Russia sunflowerseed production for 2019/20 is estimated at 14.5 million metric tons (mmt), up 12 percent from last month and 14 percent from last year. Total area is estimated at 8.5 million hectares, up 6 percent from last month and 7 percent from last year. Yield is estimated at 1.71 tons per hectare, up 5 percent from last month and 7 percent from last year. The month-to-month increase in yield is due to recent harvest reports of
Foreign Agricultural Service/USDA 2 December 2019Office of Global Analysis
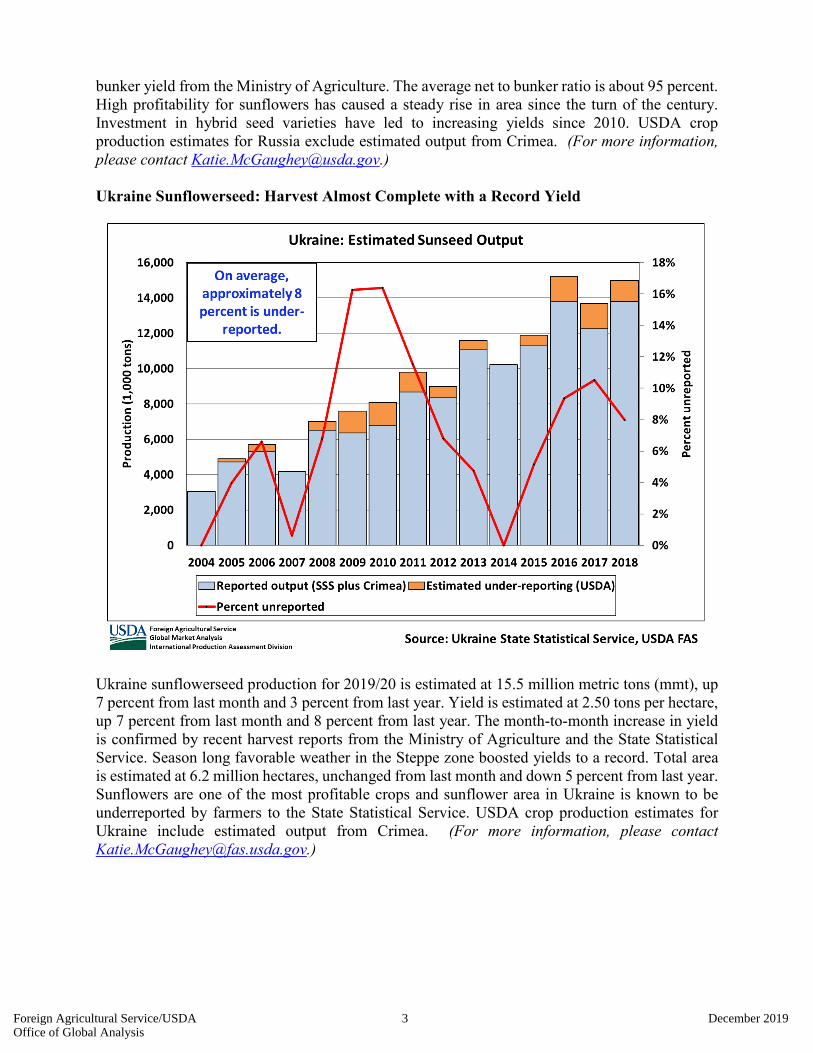
bunker yield from the Ministry of Agriculture. The average net to bunker ratio is about 95 percent. High profitability for sunflowers has caused a steady rise in area since the turn of the century. Investment in hybrid seed varieties have led to increasing yields since 2010. USDA crop production estimates for Russia exclude estimated output from Crimea. (For more information, please contact [email protected].) Ukraine Sunflowerseed: Harvest Almost Complete with a Record Yield
Ukraine sunflowerseed production for 2019/20 is estimated at 15.5 million metric tons (mmt), up 7 percent from last month and 3 percent from last year. Yield is estimated at 2.50 tons per hectare, up 7 percent from last month and 8 percent from last year. The month-to-month increase in yield is confirmed by recent harvest reports from the Ministry of Agriculture and the State Statistical Service. Season long favorable weather in the Steppe zone boosted yields to a record. Total area is estimated at 6.2 million hectares, unchanged from last month and down 5 percent from last year. Sunflowers are one of the most profitable crops and sunflower area in Ukraine is known to be underreported by farmers to the State Statistical Service. USDA crop production estimates for Ukraine include estimated output from Crimea. (For more information, please contact [email protected].)
Foreign Agricultural Service/USDA 3 December 2019Office of Global Analysis
India Peanuts: Yields at Near-Record Levels USDA estimates production will reach 6.2 million metric tons, up 31 percent from 2018. This 31 percent increase in production is due to ideal weather conditions in the main peanut producing area of Kutch, Gujarat. Harvested area is estimated to reach 4.7 million hectares, down nearly 6 percent from last year, but up 4 percent from last month. The 4 percent area increase is due to slightly higher planting in Gujarat and higher rabi estimates. Yield is estimated to reach 1.32 metric tons per hectare up 39 percent from last year’s low.
Although the southwest monsoon underperformed early in the season, it returned and progressed to the major peanut areas in central India, the states of Gujarat and Maharashtra. Gujarat produces 47 percent of total peanut production during the kharif season. Over half of this production is concentrated in the Kutch district of Gujarat. Cumulative rainfall is up significantly from the long-term average in Saurashtra and Kutch district. MODIS anomaly analysis of Normalized Difference Vegetation Index showed strong crop vigor during the pegging stage in mid-September. Gujarat has had the wettest season since 1981 according to CHIRPS (Climate Hazards Infrared Precipitation Stations). Currently, rabi season peanuts are being planted. Trade sources are estimating that rabi peanut area will increase from previous projections because of good rainfall and reservoirs used for
Foreign Agricultural Service/USDA 4 December 2019Office of Global Analysis
irrigation are at capacity across the country. As of November 28, rabi planting is near the long-term average.
Peanuts account for about 25 percent of India’s total oilseed production. There are two peanut-growing seasons in India: kharif and rabi. The kharif crop accounts for 85 percent of the total output, is typically planted in late June and harvested in October. The rabi crop is planted in late October through January and harvested in April. (For more information please contact [email protected].)
Foreign Agricultural Service/USDA 5 December 2019Office of Global Analysis
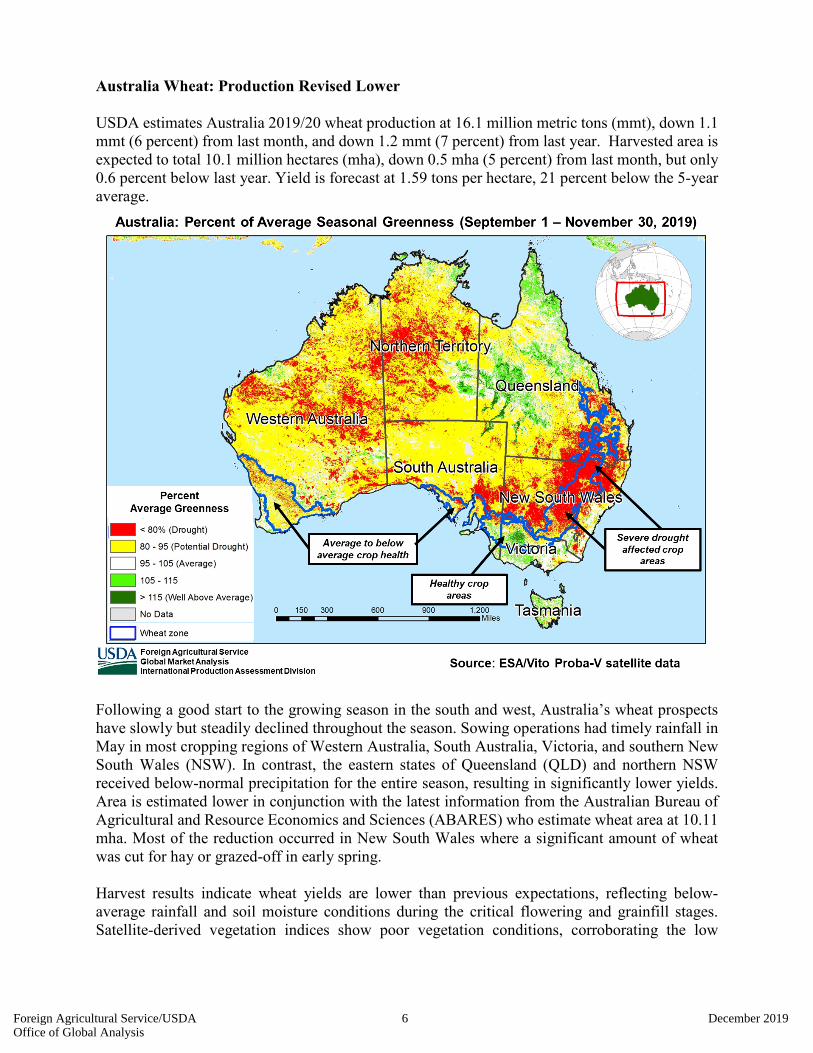
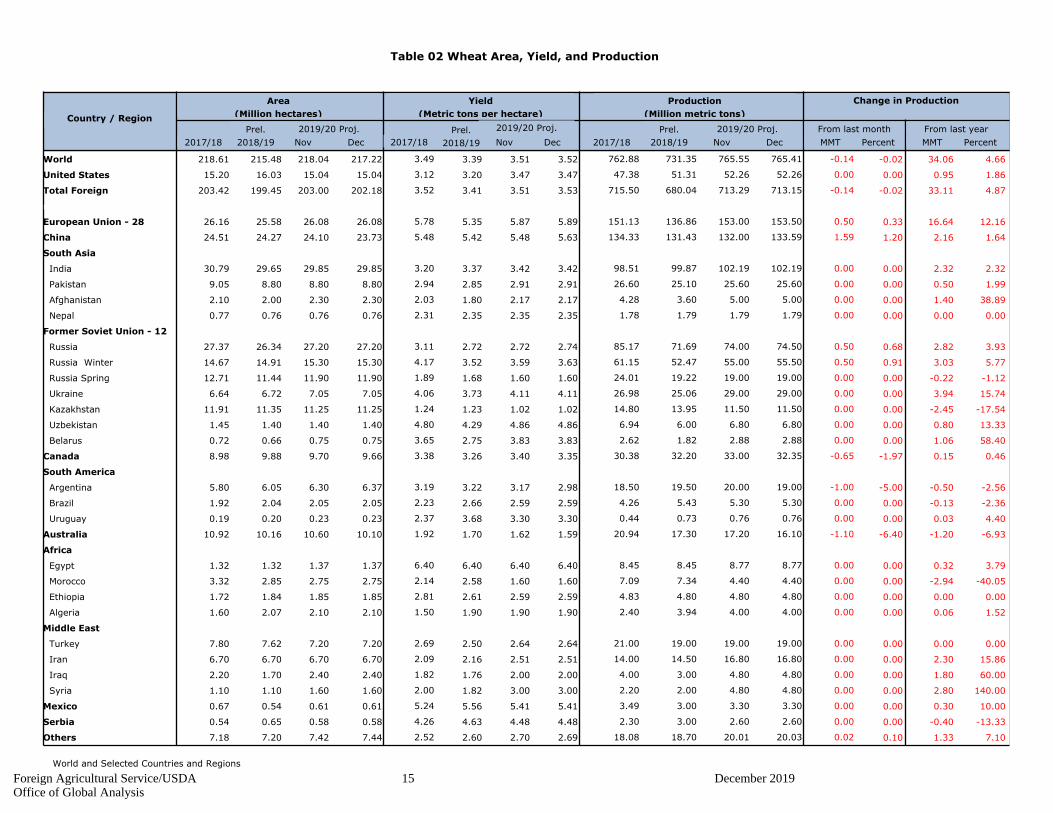
Australia Wheat: Production Revised Lower USDA estimates Australia 2019/20 wheat production at 16.1 million metric tons (mmt), down 1.1 mmt (6 percent) from last month, and down 1.2 mmt (7 percent) from last year. Harvested area is expected to total 10.1 million hectares (mha), down 0.5 mha (5 percent) from last month, but only 0.6 percent below last year. Yield is forecast at 1.59 tons per hectare, 21 percent below the 5-year average.
Following a good start to the growing season in the south and west, Australia’s wheat prospects have slowly but steadily declined throughout the season. Sowing operations had timely rainfall in May in most cropping regions of Western Australia, South Australia, Victoria, and southern New South Wales (NSW). In contrast, the eastern states of Queensland (QLD) and northern NSW received below-normal precipitation for the entire season, resulting in significantly lower yields. Area is estimated lower in conjunction with the latest information from the Australian Bureau of Agricultural and Resource Economics and Sciences (ABARES) who estimate wheat area at 10.11 mha. Most of the reduction occurred in New South Wales where a significant amount of wheat was cut for hay or grazed-off in early spring. Harvest results indicate wheat yields are lower than previous expectations, reflecting below-average rainfall and soil moisture conditions during the critical flowering and grainfill stages. Satellite-derived vegetation indices show poor vegetation conditions, corroborating the low
Foreign Agricultural Service/USDA 6 December 2019Office of Global Analysis
precipitation in QLD and NSW. Dry conditions have accelerated crop development. Harvesting is underway and will be complete by late December. (For more information, please contact [email protected].) Russia Wheat: Harvest is Essentially Complete
Russia wheat production for 2019/20 is estimated at 74.5 million metric tons (mmt), up 1 percent from last month and 4 percent from last year. The estimate includes 55.5 mmt of winter wheat and 19.0 mmt of spring wheat. USDA crop production estimates for Russia exclude output from Crimea. Total wheat yield is estimated at 2.74 tons per hectare, up 1 percent from last month and last year. Winter wheat accounts for about half of total wheat area and 70 percent of production. Harvest is complete and the month-to-month increase for winter wheat yield is based on harvest yield data from the Ministry of Agriculture and lower-than-expected winterkill rates over the previous winter. Spring wheat yields are unchanged from last month. Total wheat area (winter and spring) is estimated at 27.2 million hectares, unchanged from last month. Area, yield, and production estimates for Russia winter wheat and spring wheat are available on PSD Online. Select “Downloadable Data Sets” and open the zipped file for “Russia Wheat; Winter/Spring Area & Production” (For more information, please contact [email protected].)
Foreign Agricultural Service/USDA 7 December 2019Office of Global Analysis
Argentina Wheat: Slow Harvest between Spring Showers
USDA estimates Argentina wheat production for 2019/20 at 19.0 million metric tons, down 5 percent from last month and down 3 percent from last year. Area is estimated at 6.4 million hectares, up 1 percent from last month and 5 percent from last year. Yield is estimated at 2.98 tons per hectare, down 6 percent from last month and 7 percent from last year. Yields are lower in central Buenos Aires province due to dryness at grainfill. Western wheat areas also have yields which are down from the early, higher yields in northern Argentina. Much of the crop relied on subsoil moisture during flowering and grainfill. Harvest is underway. (For more information, please contact [email protected].)
Foreign Agricultural Service/USDA 8 December 2019Office of Global Analysis
Pakistan Cotton: Production Revised Down on Lower Arrival Data
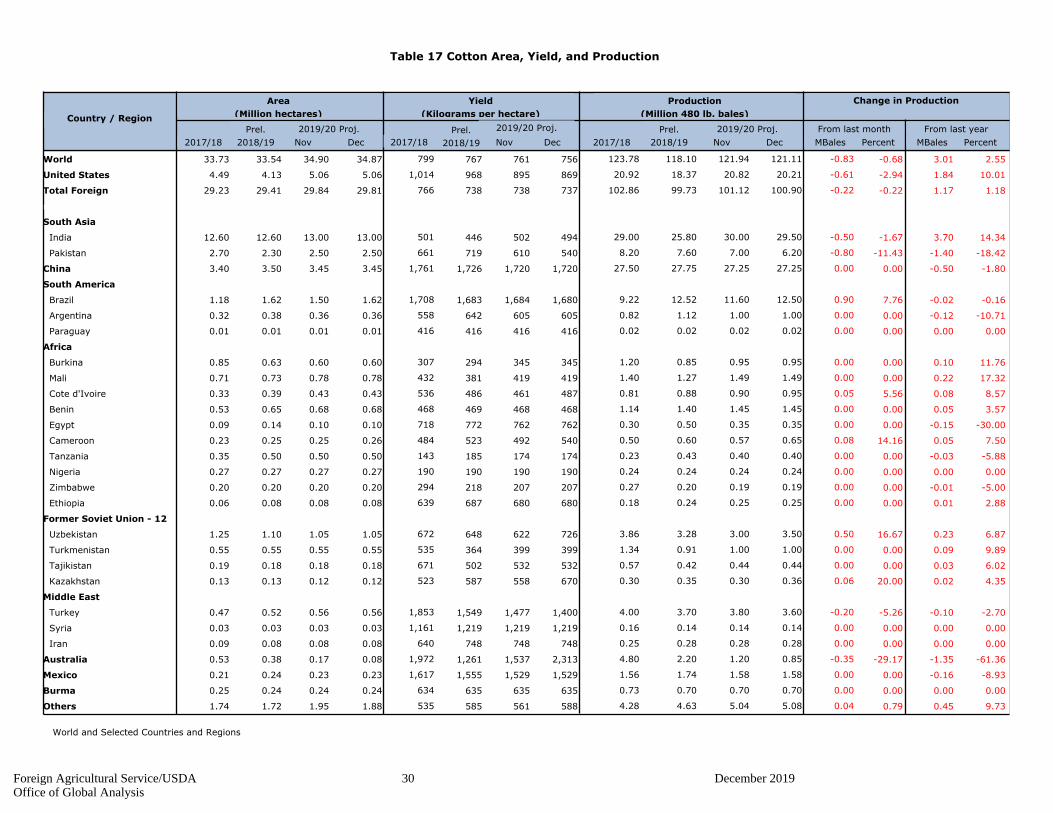
USDA estimates Pakistan cotton production at 6.2 million 480-pound bales, down 0.8 million bales (11 percent) from last month, and down 1.4 million bales (18 percent) from last year. Harvested area is estimated at 2.5 million hectares, unchanged from last month, but up 0.2 million hectares (9 percent) from last year. The yield is estimated at 540 kilograms per hectare, down 12 percent from last month and down 25 percent from last year. Production is revised down due to lower arrivals. At the beginning of December, cumulative seed cotton arrivals at gins are 29 percent less than the same time last year, according to the Pakistan Cotton Ginner’s Association. At the provincial level, the arrivals are down 24 percent in Punjab and down 15 percent in Sindh. Cotton planting began in April. Harvest began in August and is now more than three quarters complete. Peak
Foreign Agricultural Service/USDA 9 December 2019Office of Global Analysis
harvest typically occurs in October. The two major cotton producing provinces are Punjab (72 percent) and Sindh (27 percent). (For more information, please contact [email protected].) Australia Cotton: Production Forecast Down 61 Percent from Last Year
USDA forecasts 2019/20 Australia cotton production at 0.85 million 480-pound bales, down 350,000 bales (29 percent) from last month and 1.35 million (61 percent) from last year. Harvested area, mainly irrigated, is estimated at 80,000 hectares, down 53 percent from last month, and 79 percent from last year. Below-normal precipitation during the past six months and a current lack of soil moisture for dryland sowing operations resulted in the 53 percent decrease in cotton area. Additionally, irrigation water availability has been severely depleted. Dryland planting tends to vary with the seasonal weather forecast and prices at sowing. Irrigated cotton yields are substantially higher than dryland yields, and the difference widens in low-rainfall years. Yield is forecast for 2019/20 for Australia cotton at 2,313 kilograms per hectare, 26 percent above the 5-year average. On average, about 90 percent of Australia’s total cotton comes from irrigated areas. It is forecast that irrigated production will comprise 98 percent of the total crop. Sorghum and cotton are the two dominant summer crops in eastern Australia. Cotton sowing began in October and harvest begins in April. (For more information, please contact [email protected].)
Foreign Agricultural Service/USDA 10 December 2019Office of Global Analysis
This report uses information from the Foreign Agricultural Service’s (FAS) global network of agricultural attachés and counselors, official statistics of foreign governments and other foreign source materials, and the analysis of economic data and satellite imagery. Estimates of foreign area, yield, and production are from the International Production Assessment Division, FAS, and are reviewed by USDA’s Inter-Agency Commodity Estimates Committee. Estimates of U.S. area, yield, and production are from USDA’s National Agricultural Statistics Service. Numbers within the report may not add to totals because of rounding. This report reflects official USDA estimates released in the World Agricultural Supply and Demand Estimates (WASDE-584), December 10, 2019. Printed copies are available from the National Technical Information Service. Download an order form at http://www.ntis.gov/products/specialty/usda/fas_a-g.asp, or call NTIS at 1-800-363-2068. The FAS International Production Assessment Division prepared this report. The next issue of World Agricultural Production will be released after 12:00 p.m. Eastern Time January 10, 2020.
For further information, contact: U.S. Department of Agriculture Foreign Agricultural Service
Global Market Analysis International Production Assessment Division
Ag Box 1051, Room 4630, South Building Washington, DC 20250-1051
Telephone: (202) 720-1662 Fax: (202) 720-1158
GENERAL INFORMATION Director Ronald Frantz 202-720-4056 [email protected] Deputy Director Robert Tetrault 202-720-1071 [email protected] Administrative Assistant Dionndra Williams 202-720-1662 [email protected] USDA Remote Sensing Advisor Glenn Bethel 202-720-1280 [email protected] Sr. Analyst/Technical Lead Curt Reynolds, Ph.D. 202-690-0134 [email protected] Sr. Analyst/ Satellite Imagery Dath Mita, Ph.D. 202-720-7339 [email protected] Archives Manager/Technical Lead Sr. Analyst/ Global Special Jim Crutchfield 202-690-0135 [email protected] Projects Manager/Technical Lead Sr. Analyst/Technical Lead Vacant GIS Mapping/Imagery Specialist Lisa Colson 202-720-6652 [email protected] WAP Coordinator Ifeoma Collins 202-720-0240 [email protected] COUNTRY- AND REGION-SPECIFIC INFORMATION South America, Argentina, Venezuela, Denise McWilliams, Ph.D.202-720-0107 [email protected] and Colombia Western and Central Europe, Bryan Purcell 202-690-0138 [email protected] and North Africa Russia, Ukraine, Kazakhstan Katie McGaughey 202-720-9210 [email protected] South Asia, Sri Lanka Arnella Trent 202-720-0881 [email protected] Bangladesh, India, and Nepal East Asia, China, and Japan Dath Mita, Ph.D. 202-720-7339 [email protected] Sub-Saharan Africa, Curt Reynolds, Ph.D. 202-690-0134 [email protected] Nigeria and South Africa S.E. Asia, Indonesia, Thailand, Malaysia, Justin Jenkins 202-720-0419 [email protected] Cambodia and Vietnam Central America, Mexico, Ifeoma Collins 202-720-0240 [email protected] and Western United States Australia, New Zealand, Pakistan Jim Crutchfield 202-690-0135 [email protected] Papua New Guinea and South Pacific Islands Middle East, Central Asia, Afghanistan Vacant Iraq, Iran, and Syria Canada, Caribbean, Vacant Eastern United States Brazil Vacant
Foreign Agricultural Service/USDA 12 December 2019Office of Global Analysis
The Foreign Agricultural Service (FAS) updates its production, supply and distribution (PSD) database for cotton, oilseeds, and grains at 12:00 p.m. on the day the World Agricultural Supply and Demand Estimates
(WASDE) report is released. This circular is released by 12:15 p.m.
FAS Reports and Databases:
Current World Market and Trade and World Agricultural Production Reports (Please see Data Publications): https://apps.fas.usda.gov/psdonline/app/index.html#/app/home
Archives World Market and Trade and World Agricultural Production Reports: https://usda.library.cornell.edu/catalog?utf8=%E2%9C%93&search_field=all_fields&q=world+agricult
ural+production Production, Supply and Distribution Database (PSD Online):
http://apps.fas.usda.gov/psdonline/psdHome.aspx EU Countries Area and Production (Please see Downloadable Data Sets):
https://apps.fas.usda.gov/psdonline/app/index.html#/app/home Russia Wheat, Winter/Spring Area and Production (Please see Downloadable Data Sets):
https://apps.fas.usda.gov/psdonline/app/index.html#/app/home Global Agricultural Trade System (U.S. Exports and Imports):
Foreign Agricultural Service/USDA 30 December 2019Office of Global Analysis
TABLE 18 The table below presents a record of the December projection and the final Estimate. Using world wheat production as an example, the "root mean square error" means that chances are 2 out of 3 that the current forecast will not be above or below the final estimate by more than 0.8 percent. Chances are 9 out of 10 (90% confidence level) that the difference will not exceed 1.4 percent. The average difference between the December projection and the final estimate is 3.9 million tons, ranging from 0.4 million to 10.2 million tons. The December projection has been below the estimate 28 times and above 10 times.
RELIABILITY OF PRODUCTION PROJECTIONS 1/
COMMODITY AND REGION
Root mean square error
90 percent confidence
interval
Difference between forecast and final estimate
Average Smallest Largest
Years Below final
Above final
Percent ---Million metric tons---
WHEAT
World 0.8 1.4 3.9 0.4 10.2 28 10
U.S. 0.4 0.7 0.2 0.0 1.2 18 14
Foreign 0.9 1.6 3.9 0.3 10.3 28 10
COARSE GRAINS 2/
World 1.5 2.5 12.5 0.0 36.0 28 10
U.S. 1.3 2.2 2.4 0.0 7.5 19 19
Foreign 2.1 3.5 12.7 0.3 37.5 27 11
RICE (Milled)
World 2.0 3.3 5.7 0.0 16.2 31 7
U.S. 2.9 4.9 0.1 0.0 0.5 19 14
Foreign 2.0 3.4 5.8 0.1 16.2 32 6
SOYBEANS
World 3.8 6.4 5.6 0.1 23.8 21 17
U.S. 2.1 3.5 1.2 0.1 4.7 15 23
Foreign 6.2 10.6 5.6 0.1 25.1 18 20
COTTON ---Million 480-lb. bales---
World 3.2 5.4 2.3 0.0 7.2 22 15
U.S. 2.0 3.5 0.2 0.0 0.8 18 19
Foreign 3.7 6.4 2.3 0.0 7.1 21 16
UNITED STATES -------Million bushels-------
CORN 1.3 2.2 89 0 250 19 18
SORGHUM 4.1 7.0 15 1 53 20 18
BARLEY 1.5 2.5 4 0 24 16 10
OATS 1.1 1.9 2 0 18 7 9
1/ Marketing years 1981/82 through 2018/19. Final for grains, soybeans and cotton is defined as the first November estimates following the marketing year for 1981/82 through 2017/18, and for 2018/19 last month’s estimate. 2/ Includes corn, sorghum, barley, oats, rye, millet, and mixed grain
December 2019 Office of Global Analysis, FAS, USDA
Foreign Agricultural Service/USDA 31 December 2019Office of Global Analysis