United States Department of Agriculture Foreign Agricultural Service Circular Series WAP 8-15 August 2015 European Corn: Further Reduced From Heat and Dryness; Adverse Conditions Drift East European Union (EU) 2015/16 corn production is forecast at 62.3 million tons, 3.5 million tons below last month and 12.9 million tons below last year’s record crop of 75.0 million. Yield is forecast at 6.58 tons per hectare, 5.2 percent below last month, 17 percent below last year and 6.2 percent below the 5-year average. Area is estimated at 9.5 million hectares. After targeting western Europe during June, unfavorable conditions migrated east in July, most notably in south-central and southeastern Europe. A punishing heatwave with daily temperatures above 35°C (95°F) was accompanied by increased dryness. July is a critical period for corn in Europe because the plant is typically silking and tasseling. High temperatures (>35°C) during this sensitive period can cause severe pollination problems. In addition, a lack of summer precipitation in southern Europe resulted in very low soil moisture levels, limiting grainfill and reducing kernel size. World Agricultural Production Approved by the World Agricultural Outlook Board
Transcript
United States Department of Agriculture
Foreign Agricultural Service
Circular Series WAP 8-15 August 2015
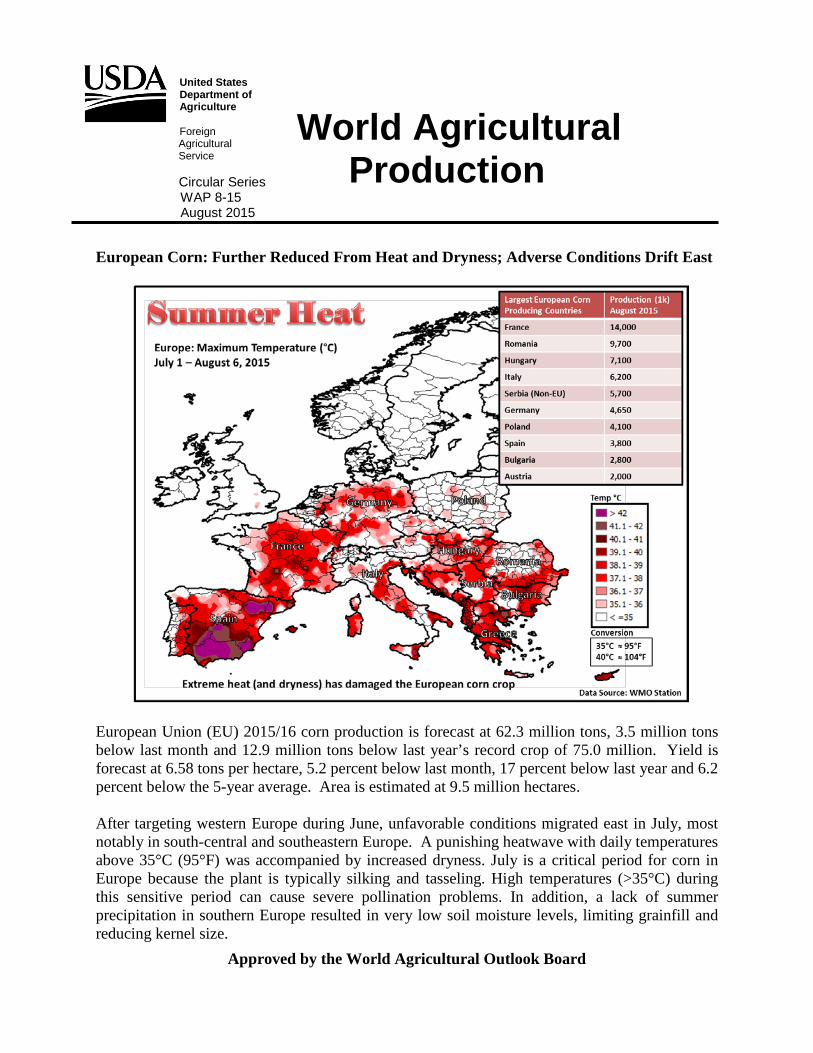
European Corn: Further Reduced From Heat and Dryness; Adverse Conditions Drift East
European Union (EU) 2015/16 corn production is forecast at 62.3 million tons, 3.5 million tons below last month and 12.9 million tons below last year’s record crop of 75.0 million. Yield is forecast at 6.58 tons per hectare, 5.2 percent below last month, 17 percent below last year and 6.2 percent below the 5-year average. Area is estimated at 9.5 million hectares.
After targeting western Europe during June, unfavorable conditions migrated east in July, most notably in south-central and southeastern Europe. A punishing heatwave with daily temperatures above 35°C (95°F) was accompanied by increased dryness. July is a critical period for corn in Europe because the plant is typically silking and tasseling. High temperatures (>35°C) during this sensitive period can cause severe pollination problems. In addition, a lack of summer precipitation in southern Europe resulted in very low soil moisture levels, limiting grainfill and reducing kernel size.
World Agricultural Production
Approved by the World Agricultural Outlook Board
France, the EU’s largest corn producer, has released several crop reports during the past couple of months indicating declines of corn conditions. While half of the French crop is irrigated, heat remains a major hindrance. The estimated corn crop in France is lowered 0.5 million tons to 14.0 million. This 0.5-million-ton cut to the French crop follows an even larger 1.4-million-ton cut last month. Italian corn is estimated down 1.0 million tons to 6.2 million as extreme heat scorched northern Italy’s agricultural Po Valley with record high temperatures. Similarly, Romania’s crop is estimated down 0.9 million tons to 9.7 million tons, with over 20 days above
35°C since June 1 in the southern region, and dryness in the west. Hungary is estimated down 0.6 million tons due to heat and dryness while other reductions in the EU included Croatia (by 0.3 million), Bulgaria (0.2 million), and Austria (0.2 million). Germany received rainfall during July; its crop was adjusted up (0.15 million).
Serbia, while outside the EU boundaries, is a significant European corn producer. Serbia’s 2015/16 corn harvest is estimated to be down 1.0 million from last month to 5.7 million tons. Serbia’s principal agricultural region Voivodina, located in its north, experienced its driest July in at
least 35 years. Production in neighboring Bosnia and Herzegovina (also not an EU member state), is estimated to be 0.1 million lower than last month at 0.65 million tons. (For more information, please contact [email protected])
China Corn: Higher Area and Yield Lead to Record Corn Crop
China’s 2015/16 corn production is forecast at a record 225.0 million tons, down 4.0 million tons from last month but up 9.3 million tons from last year’s crop. Harvested area is estimated at a record 37.8 million hectares, unchanged from last month but up 0.78 million hectares from last year. China’s corn area has been increasing steadily for more than a decade in response to favorable government policies and higher profits compared to competing crops such as cotton and soybeans. Yield is forecast at 5.94 tons per hectare, down 2 percent from last month but up 2 percent from last year.
Hot and unusually dry weather in July had a negative impact on reproductive corn in parts of Northeast China and the North China Plain, particularly in Liaoning and Jilin provinces. Recent moderate to heavy rainfall has eased the drought in these areas and growing conditions have stabilized. Most of China’s corn crop is in the reproductive to filling stage, and the weather in August will have a major impact on the final yield. (For more information, please contact [email protected])
Canada Wheat and Rapeseed: Yields Forecast to Decline Due to Persistent Dryness
USDA forecasts 2015/16 total wheat production at 26.5 million metric tons, down 1.0 million tons from last month and down 2.8 million tons from last year due to adverse growing conditions. Harvested area is forecast at 9.6 million hectares, unchanged from the previous month but up 0.14 million hectares last year. Yield is forecast at 2.76 tons per hectare, down 3.7 percent from the previous month and down 11 percent from last year. The yield reduction is due to persistent dryness.
The 2015/16 rapeseed production is forecast at 13.0 million metric tons, down 1.6 million tons from last month and down 2.6 million tons from last year. The decline in production is due to adverse growing conditions in Saskatchewan and Alberta. Yield is forecast at 1.65 tons per hectare, down 15 percent from last year. Area harvested is forecast at 7.9 million hectares, unchanged from last month’s forecast but down 0.18 million hectares from last year.
Personnel from the USDA Foreign Agricultural Service traveled to Saskatchewan and Alberta in mid-July and observed short, small heads and sparsely populated fields due to dryness. The
Western Prairies in general did not receive significant rainfall during most of the growing season from April 1 to July 25. Southern Saskatchewan and Alberta were the hardest hit. Manitoba, however, which produces about 10 percent of total wheat production and 14 percent of the total rapeseed production, received timely rains throughout the growing season. Soil moisture in Alberta as of early August was rated 30 percent good; soil moisture in Saskatchewan was rated 70 percent good. Satellite derived vegetative indices indicate crop vigor in Saskatchewan and Alberta is below average.
Vegetative indices from late June in Manitoba indicate better conditions which could offset poor conditions seen in Saskatchewan and Alberta.
A late-July storm brought enough rainfall to alleviate some of the dryness across the Western Prairies, but, it came too late to boost potential yields as the crop was well past its critical point. The latest provincial government crop report in Alberta rated both wheat and rapeseed at only 25 percent good to excellent, whereas in Saskatchewan the crop was rated 60 and 56 percent good to excellent, respectively. (For more information, please contact [email protected])
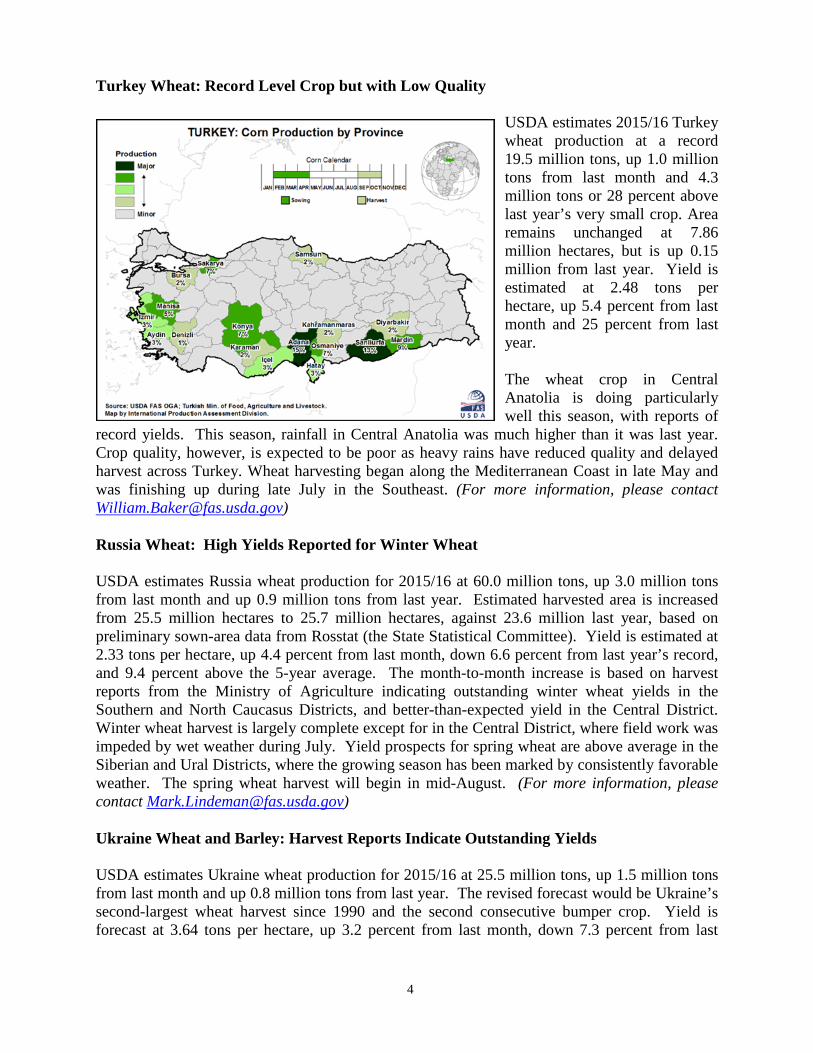
Turkey Wheat: Record Level Crop but with Low Quality
USDA estimates 2015/16 Turkey wheat production at a record 19.5 million tons, up 1.0 million tons from last month and 4.3 million tons or 28 percent above last year’s very small crop. Area remains unchanged at 7.86 million hectares, but is up 0.15 million from last year. Yield is estimated at 2.48 tons per hectare, up 5.4 percent from last month and 25 percent from last year.
The wheat crop in Central Anatolia is doing particularly well this season, with reports of
record yields. This season, rainfall in Central Anatolia was much higher than it was last year. Crop quality, however, is expected to be poor as heavy rains have reduced quality and delayed harvest across Turkey. Wheat harvesting began along the Mediterranean Coast in late May and was finishing up during late July in the Southeast. (For more information, please contact [email protected])
Russia Wheat: High Yields Reported for Winter Wheat
USDA estimates Russia wheat production for 2015/16 at 60.0 million tons, up 3.0 million tons from last month and up 0.9 million tons from last year. Estimated harvested area is increased from 25.5 million hectares to 25.7 million hectares, against 23.6 million last year, based on preliminary sown-area data from Rosstat (the State Statistical Committee). Yield is estimated at 2.33 tons per hectare, up 4.4 percent from last month, down 6.6 percent from last year’s record, and 9.4 percent above the 5-year average. The month-to-month increase is based on harvest reports from the Ministry of Agriculture indicating outstanding winter wheat yields in the Southern and North Caucasus Districts, and better-than-expected yield in the Central District. Winter wheat harvest is largely complete except for in the Central District, where field work was impeded by wet weather during July. Yield prospects for spring wheat are above average in the Siberian and Ural Districts, where the growing season has been marked by consistently favorable weather. The spring wheat harvest will begin in mid-August. (For more information, please contact [email protected])
Ukraine Wheat and Barley: Harvest Reports Indicate Outstanding Yields
USDA estimates Ukraine wheat production for 2015/16 at 25.5 million tons, up 1.5 million tons from last month and up 0.8 million tons from last year. The revised forecast would be Ukraine’s second-largest wheat harvest since 1990 and the second consecutive bumper crop. Yield is forecast at 3.64 tons per hectare, up 3.2 percent from last month, down 7.3 percent from last
year, and 13 percent above the 5-year average. Barley output is estimated at 8.3 million tons, up 2.3 million tons from last month but down 1.2 million tons from last year. Harvested area for barley was increased from 2.5 million hectares to an estimated 2.9 million hectares based on data from the State Statistical Committee, but still stands at the lowest level in 25 years. The low area, however, will be partly offset by high yield, which is estimated at 2.86 tons per hectare, 21 percent above the 5-year average. Spring barley will account for about two-thirds of the total barley output this year. The wheat and barley crops benefited from plentiful precipitation and a lack of heat stress throughout the growing season. According to the Ministry of Agricultural Policy and Food, 92 percent of the Ukraine’s wheat area and 95 percent of the barley were harvested as of August 6. All USDA crop estimates include estimated output for Crimea. (For more information, please contact [email protected])
Thailand Rice: Production Forecast to Decline as Irrigation Reserves Dwindle
USDA forecasts 2015/16 Thailand rice production at 18.0 million tons (milled basis), down 1.0 million tons from last month and down 0.75 million tons from last year. Harvested area is estimated at 10.2 million hectares, down 0.33 million hectares from last month and down 0.07 million hectares from last year. Yield is estimated below-average at 2.67 tons per hectare.
Thailand is in the midst of its wet-season crop, the first of two annual rice-growing periods. Wet-season rice is heavily dependent on monsoonal weather systems, with 70 percent of the crop being totally rainfed. The other 30 percent primarily lies in the Chao Phraya river basin and is irrigated from water stored in mountain reservoirs. The wet-season rice harvest is the larger of two annual crops, normally accounting for 72 percent of total annual production. Wet-season rice area has averaged about 8.8 million hectares since 2007. Thailand is experiencing the second consecutive year of drought, which has the potential to cripple its agricultural sector and slow its economy. Water shortages have been widespread, forcing the government to ration its use for agricultural, industrial, and urban consumers for the past 7 months. Less-than-adequate rainfall in 2014 resulted in insufficient recharge of key reservoirs, which underpin much of the economy and the country’s drinking water supply. The current 2015 summer monsoon or rainy season also started poorly, with well-below normal rainfall occurring in central growing regions during the May-June period. As a result, the government ordered additional reductions in irrigation supply, which reduced area sown to irrigated rice in the 2015/16 wet season. USDA/Bangkok reported this month that the government has issued a policy announcement to farmers concerning the 2015/16 dry-season rice crop. The report stated that owing to critically low reservoirs, it will only distribute 50 percent of the normal dry-season irrigation supply. Cultivated areas nearest the main canals will be targeted for rice production, with more distant fields remaining unplanted. Given these conditions it is unlikely that 2015/16 dry-season acreage will surpass last year’s drought- reduced level. (For more information, please contact [email protected])
China Cotton: Area and Yield Revised Downward
China’s 2015/16 cotton production is forecast at 26.0 million bales (5.66 million tons), down 1.0 million bales from last month and down 4.0 million bales from last year. Area is estimated at a record-low 3.63 million hectares, down 0.075 million hectares from last month and down 0.78 million from last year. Recent changes to China’s cotton policy resulted in lower prices and greater uncertainty for cotton farmers, who responded by shifting from cotton to other crops
(such as corn and rice) that offered higher returns. The estimated area in eastern China is down about 30 percent from last year, and recent government reports indicate larger-than-expected area reductions (8 to 13 percent) in Xinjiang province.
Cotton yield is forecast at a record 1562 kilograms per hectare, down 1.7 percent from last month but up 5.2 percent from last year. The month-to-month reduction is mainly due to unfavorable weather in Xinjiang. Record-breaking temperatures in July (up to 40° C. in many locations) persisted for several weeks and stressed cotton in the flowering/boll-formation stage. Hot and dry weather in July also affected reproductive cotton in parts of the North China Plain, while heavy and persistent rain had a negative impact on cotton in parts of the Yangtze River basin. Bolls will start opening by the end of August and harvest will take place in September and October. (For more information, please contact [email protected])
This report uses information from the Foreign Agricultural Service’s (FAS) global network of agricultural attachés and counselors, official statistics of foreign governments and other foreign source materials, and the analysis of economic data and satellite imagery. Estimates of foreign area, yield, and production are from the International Production Assessment Division, FAS, and are reviewed by USDA’s Inter-Agency Commodity Estimates Committee. Estimates of U.S. area, yield, and production are from USDA’s National Agricultural Statistics Service. Numbers within the report may not add to totals because of rounding. This report reflects official USDA estimates released in the World Agricultural Supply and Demand Estimates (WASDE-544), August 12, 2015. Printed copies are available from the National Technical Information Service. Download an order form at http://www.ntis.gov/products/specialty/usda/fas_a-g.asp, or call NTIS at 1-800-363-2068. The FAS International Production Assessment Division prepared this report. The next issue of World Agricultural Production will be released after 12:00 p.m. Eastern Time, September 11, 2015.
For further information, contact: U.S. Department of Agriculture Foreign Agricultural Service
Office of Global Analysis International Production Assessment Division
Ag Box 1051, Room 4630, South Building Washington, DC 20250-1051
Telephone: (202) 720-1156 Fax: (202) 720-1158
GENERAL INFORMATION Director Ronald Frantz 202-720-4056 [email protected] Deputy Director Paul Provance 202-720-2974 [email protected] USDA Remote Sensing Advisor Glenn Bethel 202-720-1280 [email protected] Sr. Analyst/Satellite Imagery Curt Reynolds, PhD 202-690-0134 [email protected] Archives Manager/Technical Lead Sr. Analyst/ Technical Lead Dath Mita, PhD 202-720-7339 [email protected] Sr. Analyst/ Global Special Jim Crutchfield 202-690-0135 [email protected] Projects Manager/Technical Lead Sr. Analyst/Technical Lead Robert Tetrault 202-720-1071 [email protected] GIS Analyst/WAP Coordinator Justin Jenkins 202-720-0419 [email protected] Management Analyst Rishan Chaudhry 202-720-1157 [email protected] COUNTRY- AND REGION-SPECIFIC INFORMATION South América, Argentina and Colombia Denise McWilliams, PhD 202-720-0107 [email protected] Western and Central Europe, Bryan Purcell 202-690-0138 [email protected] and North Africa Russia, Kazakhstan, Ukraine, Mark Lindeman 202-690-0143 [email protected] and other FSU-12 countries
Canada, Caribbean, Sri Lanka, Arnella Trent 202-720-0881 [email protected] and Bangladesh
East Asia, China, and Japan Paulette Sandene 202-690-0133 [email protected] India, Pakistan, and Nepal Dath Mita, PhD 202-720-7339 [email protected] Sub-Saharan Africa, Mexico, Curt Reynolds, PhD 202-690-0134 [email protected] Nigeria and South Africa S.E. Asia, Indonesia, Thailand, Malaysia, Michael Shean 202-720-7366 [email protected] Cambodia, and Vietnam Brazil, Venezuela, Central America, Robert Tetrault 202-720-1071 [email protected] Australia, New Zealand, Jim Crutchfield 202-690-0135 [email protected] Papua New Guinea, and South Pacific Islands Middle East, Afghanistan, Iraq, Bill Baker, PhD 202-260-8109 [email protected] Iran, Syria Western United States Justin Jenkins 202-720-0419 [email protected] Eastern United States Paul Provance 202-720-2974 [email protected]
The Foreign Agricultural Service (FAS) updates its production, supply and distribution (PSD) database for cotton, oilseeds, and grains at 12:00 p.m. on the day the World Agricultural Supply and Demand Estimates
(WASDE) report is released. This circular is released by 12:15 p.m.
FAS Reports and Databases:
Current World Market and Trade and World Agricultural Production Reports: http://apps.fas.usda.gov/psdonline/psdDataPublications.aspx
Archives World Market and Trade and World Agricultural Production Reports: http://usda.mannlib.cornell.edu/MannUsda/viewTaxonomy.do?taxonomyID=7
Production, Supply and Distribution Database (PSD Online): http://apps.fas.usda.gov/psdonline/psdHome.aspx
EU Countries Area & Production Estimates http://apps.fas.usda.gov/psdonline/psdDownload.aspx
Global Agricultural Trade System (U.S. Exports and Imports): http://apps.fas.usda.gov/gats/default.aspx