Page 1
University of Alberta
Reduction of spastic hypertonus by controlled nerve ablation with implanted devices
by
Einat Ravid
A thesis submitted to the Faculty of Graduate Studies and Research in partial fulfillment of the requirements for the degree of
Doctor of Philosophy
Biomedical Engineering
©Einat Ravid
Spring 2013 Edmonton, Alberta
Permission is hereby granted to the University of Alberta Libraries to reproduce single copies of this thesis and to lend or sell such copies for private, scholarly or scientific research purposes only. Where the thesis is
converted to, or otherwise made available in digital form, the University of Alberta will advise potential users of the thesis of these terms.
The author reserves all other publication and other rights in association with the copyright in the thesis and,
except as herein before provided, neither the thesis nor any substantial portion thereof may be printed or otherwise reproduced in any material form whatsoever without the author's prior written permission.
Page 2
Abstract
Spastic hypertonus is a sensorimotor disorder characterized by involuntary muscle
over-activity. Hypertonus emerges in the days and months following upper motor
neuron lesions such as spinal cord injury, stroke or multiple sclerosis and affects millions
of individuals around the world. Hypertonus impedes activities of daily life including
mobility and self-care and may result in muscle contracture and pain if it remains
untreated or if treatment fails. Current treatments for spastic hypertonus include
physiotherapeutic approaches, anti-spastic drugs, surgery and nerve ablation with
neurolytic drugs such as Phenol or Botulinum toxin A. Studies have shown a limited
efficacy of these treatments, and it is unclear whether they lead to improvements in
function. This dissertation deals with a novel approach to the treatment of spastic
hypertonus, namely the use of direct current (DC) delivered with implantable
electrodes, to ablate muscle nerves in a controlled fashion. This leads to an attenuation
of the neural drive to the innervated muscle. Once a desired attenuation is achieved,
functional electrical stimulation may be delivered via the same electrode to activate the
muscle for the purpose of functional movement.
The dissertation consists of three related studies. The first study (Chapter two)
evaluates the feasibility of the suggested treatment. Proof of principle was
Page 3
demonstrated in anesthetized animals by producing controlled reductions in muscle
force by applying DC to muscle nerves. The second study (Chapter three) explored DC
parameters (amplitudes and durations) that would be both effective and clinically
acceptable. DC nerve ablation was tested in the absence of anesthesia, and possible
mechanisms were explored. The third part of the dissertation (Chapter four) describes
the effect of DC on nerves of chronically implanted animals in the anesthetized and
conscious states. Nerve conduction abolished by DC was found to recover completely
after three months, consistent with nerve regeneration. A subsequent DC application
again abolished conduction, with a similar 3-month recovery. Differences between
results observed in anesthetized and conscious animals are discussed. In the conclusion
(Chapter 5), it is argued that controlled nerve ablation with DC may be a cost–effective
method for treating spastic hypertonus.
Page 4
Acknowledgments
First and foremost, I would like to thanks my supervisor Dr. Arthur Prochazka for
giving me the opportunity to conduct this research work. Thank you for the patience,
guidance, ideas and the willingness to share your vast knowledge with me. I appreciate
the chance you took by taking on someone with an industry approach to undertake
academic research, I learned much from you and it was a privilege and a pleasure to
work with you. I would like to thank the supervisory committee members Dr. David
Bennett and Dr. Nigel Ashworth for their valuable inputs and the external examiner, Dr.
Kevin Kilgore.
Special expression of appreciation to former and current members of the
Prochazka lab, Michel, you were always willing to help, even when your schedule was
very busy. You make the lab a fun place to work. Liu Shi, thank you for always willing to
help with experiments and for the many interesting conversation we had. Jan, your
ideas and suggestion were always helpful. I would also like to thank all the animal care
facility staff, especially Di and Brian, that worked very hard making sure the animals
were well taken care of. To all my colleagues on the fifth floor, you made this a great
place to work.
I would like to acknowledge the two important funding agencies, Canadian
Institutes for Health Research and Alberta Innovates Health Solutions.
A special thanks to my friends in Israel Anat Hazan and Liza Yaacobi, and in
Canada, Lori Cotê and Kathleen Arnold for the encouragements along the way. The
Habinkski family, thank you for giving me a home away from home and helping in many
ways throughout my graduate studies, especially during the last few months. To my
parents and sister, a heartfelt appreciation for supporting my decisions and for being
there for me.
To Maru, you gave me the peace of mind to do this research knowing Ido is in
the best of care. I will always be grateful for your loyalty, flexibility, dedication and the
amazing patience you have for Ido.
Page 5
Table of Contents
Chapter 1 1
Introduction 1
1.1 Spastic hypertonus 2
1.1.1 The importance of spasatic hypertonus 3
1.1.1.1 Impact of spasticity on daily life 3
1.1.1.2 Impact of spasticity on health care costs 3
1.1.2 Epidemiology of spastic hypertonus 3
1.1.2.1 Stroke population 3
1.1.2.2 SCI population 4
1.1.3 Pathophysiology of spastic hypertonus 4
1.1.3.1 Muscle over-activity in spastic hypertonus 5
1.1.3.2 Possible mechanisms underlying spasticity 6
1.1.3.2.1 Neuronal mechanisms 7
1.1.3.2.2 Non-neuronal mechanisms 9
1.1.4 Current treatments for spastic hypertonus 9
1.1.4.1 Physical and occupational therapy 9
1.1.4.2 Systemic anti-spastic drugs 9
1.1.4.3 Surgical intervention 11
1.1.4.4 Nerve conduction blocks 11
1.2 Historical review of the use of direct current (DC) in medicine 14
1.2.1 Electricity in medicine prior to Galvani’s discoveries 15
1.2.2 Galvani, Volta and the invention of the battery 16
1.2.3 Direct current in the service of neurophysiology 17
1.2.3 The use of direct current in electrotherapy 17
1.2.3 The use of direct current to block nerve conduction 19
Page 6
1.3 Electrochemistry and considerations for electrodes used with direct
current 20
1.3.1 The interface between electrode and electrolyte 20
1.3.2 The electrode reaction 21
1.3.3 Electrode materials 21
1.3.4 Considerations for electrical stimulation of biological tissue 22
1.3.5 Mechanisms of damage 23
1.4 Neurolytic blocks 23
1.5 Dissertation objectives and outline 24
1.6 References 26
Chapter 2 39
Nerve lesioning with direct current 39
2.1 Methods 40
2.1.1 Animals and surgical procedures 40
2.1.1.1 Acute surgical procedure 40
2.1.1.2 Chronic surgical procedure 41
2.1.2 Experimental procedures 42
2.1.2.1 Acute experiments 42
2.1.2.2 NFH staining 44
2.1.2.3 chronic experiments 44
2.1.3 Data analysis 46
2.1.3.1 Acute experiments 46
2.1.3.2 Chronic experiments 47
2.1.3.3 Charge density calculations 47
2.2 Results 47
2.2.1 Definitions 47
2.2.2 Acute experiments 48
2.2.2.1 Effects of DC amplitudes in the range 0.1-0.4 mA 48
2.2.2.2 Effects of DC amplitudes in the range 0.5-1mA 50
2.2.2.3 Force overshoot 51
2.2.2.4 Condition of electrodes 51
2.2.2.5 Histochemical results for NFH staining 51
Page 7
2.2.3 Chronic experiments 52
2.2.3.1 DC delivery in the anaesthetized cat 52
2.2.3.2 DC delivery in the awake cat 54
2.2.3.3 Condition of electrodes 54
2.3 Discussion 55
2.4 References 57
Chapter 3 59
Nerve lesioning with direct current (DC): Investigation of DC parameters
and possible mechanisms of DC induced nerve ablation 59
3.1 Methods 60
3.1.1 Definitions: 61
3.1.2 Animals and surgical procedures 61
3.1.2.1 Non-recovery experiments in rabbits to explore DC
parameters 61
3.1.2.2 Non-recovery experiments in rabbits with Lidocaine
blockade of common peroneal nerve (CPN) to elucidate
mechanisms of DC ablation 63
3.1.2.3 Non-recovery experiments in decerebrate cats to
demonstrate abolition of rigidity by DC nerve ablation 64
3.1.3 Experimental procedures 64
3.1.3.1 Exploring DC parameters 64
3.1.3.2 Lidocaine blockade of nerve conduction to elucidate
mechanism of nerve ablation 65
3.1.3.3 Decerebrate rigidity experiments 66
3.1.3.4 Nerve injury potentials 67
3.1.3.5 pH testing during DC delivery in saline 67
3.1.4 Data analysis 67
3.1.4.1 Exploring DC parameters 67
3.1.4.2 DC application during conduction block with Lidocaine 68
3.1.4.3 Charge density calculations 69
3.2 Results 69
3.2.1 Exploration of DC parameters 69
3.2.1.1 Constant DC amplitude and variable duration 71
3.2.1.2 Constant DC duration and increasing amplitude 72
Page 8
3.2.1.3 Testing the subcutaneous port 72
3.2.2 Decerebrate preparation 73
3.2.2.1 Nerve injury potentials in the absence of decerebrate
rigidity 77
3.2.3 DC application during conduction block with Lidocaine 79
3.2.4 pH testing in saline 81
3.3 Discussion 81
3.4 References 86
Chapter 4 91
Nerve lesioning with direct current (DC): Delivery of DC in chronically
implanted animals in the awake and conscious state 91
4.1 Methods 92
4.1.1 Electrode design for conscious animal experiments 92
4.1.1.1 Nerve cuffs 93
4.1.1.2 Subcutaneous ports 93
4.1.2 Surgical procedures 96
4.1.2.1 Chronic surgical procedure in rabbit 96
4.1.2.2 Chronic surgical procedure in cat 97
4.1.3 Experimental procedures 98
4.1.3.1 Experimental setup and procedures in the implanted cat
during brief periods of anesthesia 98
4.1.3.2 Experimental setup and procedures in the implanted,
awake cat 100
4.1.3.3 Experimental setup and procedures in the implanted,
awake rabbit 101
4.1.3.4 Transducer calibration 103
4.1.3.5 Data analysis 103
4.2 Results 104
4.2.1 DC delivery in the chronically implanted cats during brief periods
of anesthesia 104
4.2.2 DC delivery in chronically implanted, awake cat and rabbits 106
4.2.2.1 Cat 106
4.2.2.2 Rabbit 107
4.3 Discussion 110
Page 9
4.4 References 116
Chapter 5 121
General discussion and future directions 121
5.1 Treatment of spasticity with DC nerve stimulation by means of
implantable electrodes 121
5.1.1 Localization of treatment 122
5.1.2 Ease and duration of administration 122
5.1.3 Frequency of administration 123
5.1.4 Time duration from administration to effect 124
5.1.5 Risks and side effects 124
5.1.6 Cost-effectiveness 125
5.2 Future directions 127
5.2.1 Mechanisms of damage in the conscious and anesthetized animal 127
5.2.2 Neuropathic pain 127
5.2.3 Restoration of function following reduction of spasticity 128
5.3 Significance of research and concluding remarks 128
5.4 References 130
Appendix A: Summary of animals used, experimental parameters and results 134
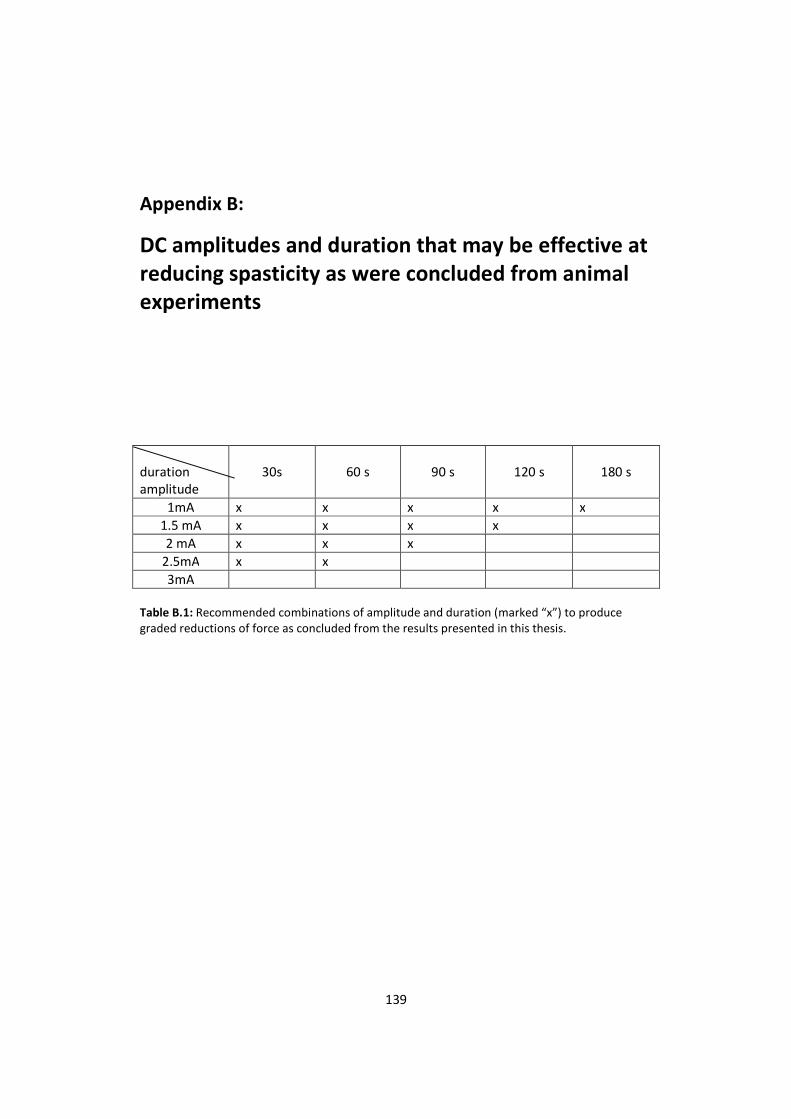
Appendix B: DC amplitudes and duration that may be effective at reducing
spasticity as were concluded from animal experiments 139
Page 10
List of Tables
Table 1.1: Pros and Cons of common treatments for spastic hypertonus 13
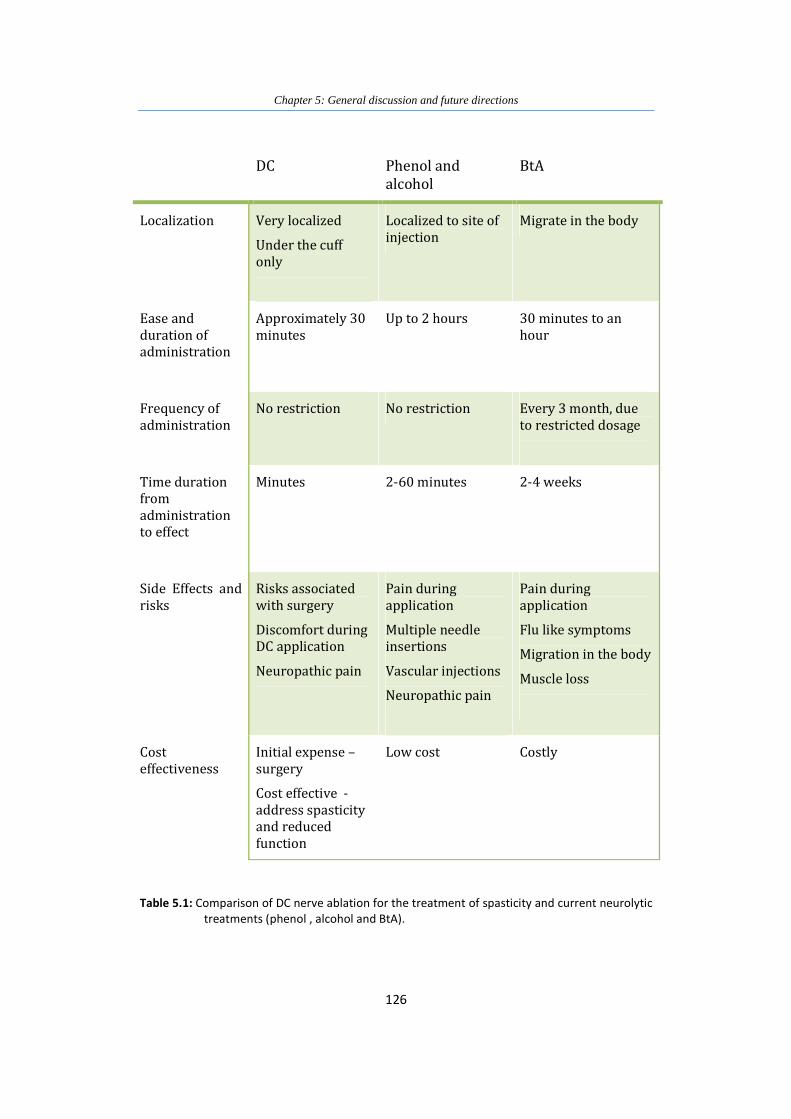
Table 5.1: Comparison of DC nerve ablation for the treatment of spasticity and
current neurolytic treatments (phenol , alcohol and BtA) 126
Table A.1: Rabbit used in acute experiments - data reported in thesis 134
Table A.2: Rabbit used in acute experiments – no results 135
Table A.3: Chronically implanted cats – DC under anesthesia 135
Table A.4: Animals used for Lidocaine tests reported in thesis 136
Table A.5: Animal used for experiments with Lidocaine – no results 136
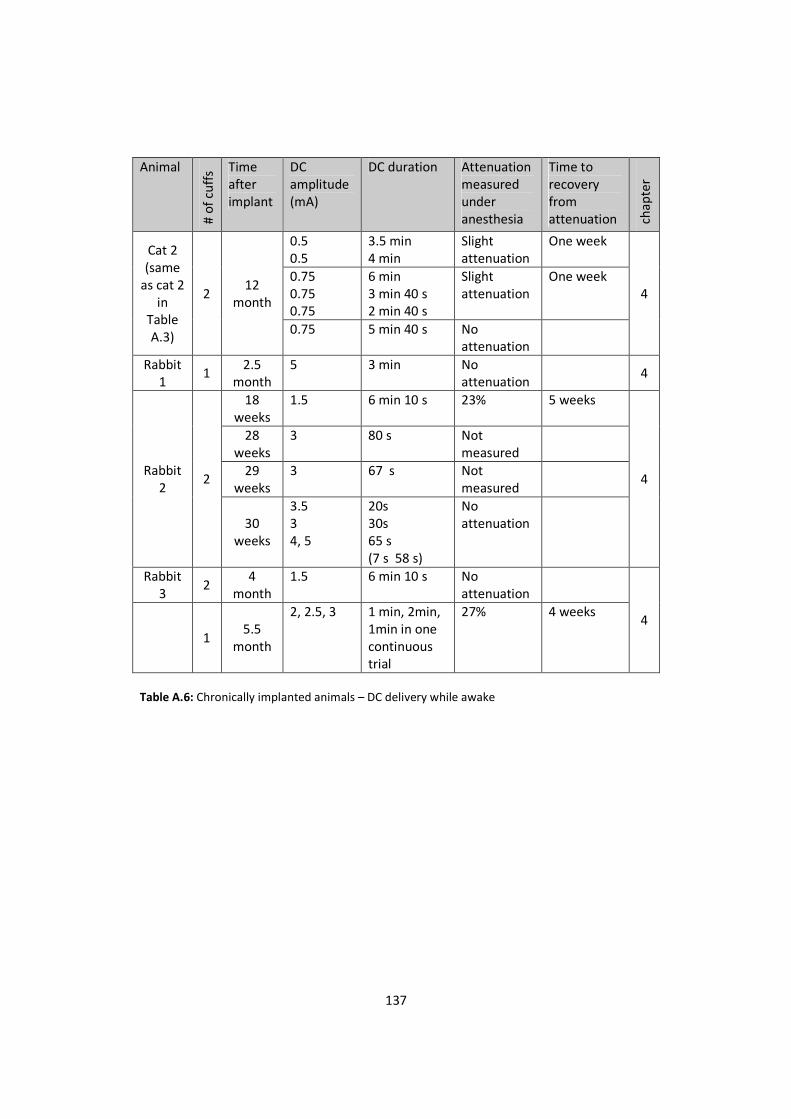
Table A.6: Chronically implanted animals – DC delivery while awake 137
Table A.7: Chronically implanted rabbits - could not be used for awake
experiments 138
Table B.1: Recommended combinations of amplitude and duration (marked “x”)
to produce graded reductions of force as concluded from the results
presented in this thesis 139
Page 11
List of Figures
Figure 1.1: An upper motor neuron lesion results in a sequence of
events that often lead to impaired function 5
Figure 1.2: spinal pathways involved in the development of spastic
hypertonus 7
Figure 1.3: Charge density and charge per phase 22
Figure 2.1: The nerve cuff electrodes used in the study 42
Figure 2.2: Acute experiment setup 44
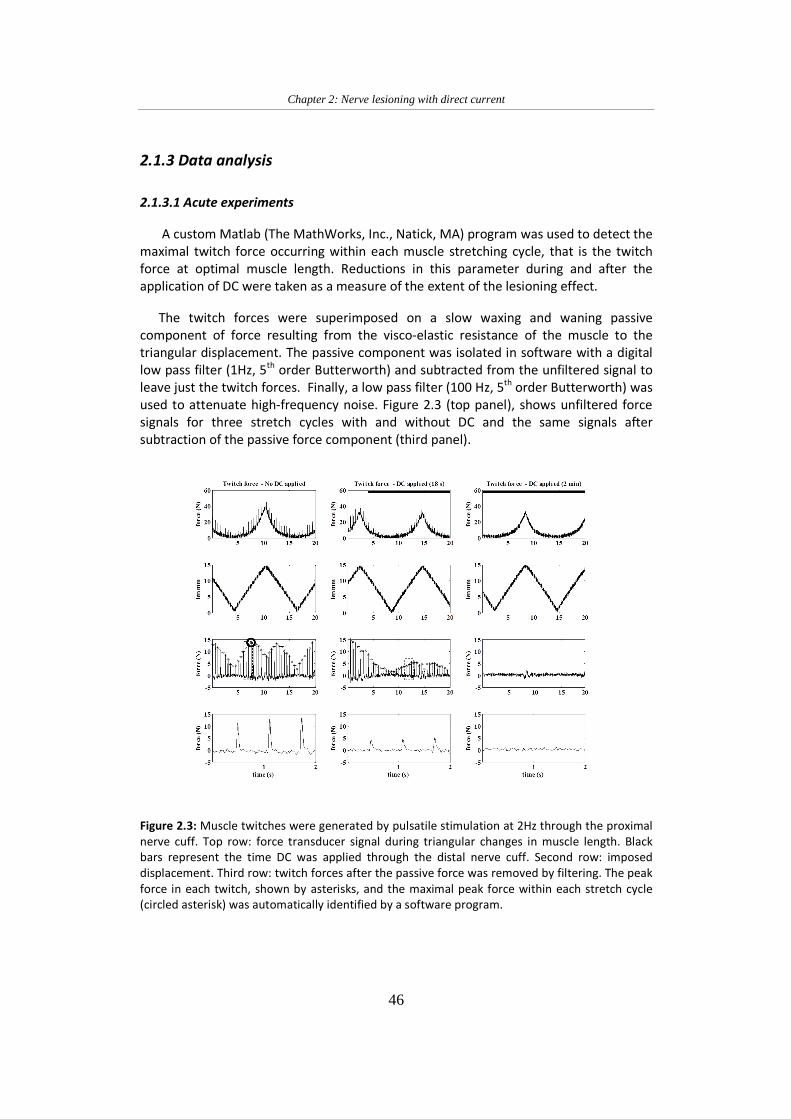
Figure 2.3: Muscle twitches were generated by pulsatile stimulation at
2Hz through the proximal nerve cuff 46
Figure 2.4: Changes in twitch force during episodes of DC application
over a 6-hour experiment 49
Figure 2.5: Changes in twitch force during episodes of DC application
over a 4-hour experiment 49
Figure 2.6: Changes in twitch force during episodes of DC application
at an amplitude of 0.5mA 50
Figure 2.7: Changes in twitch force during episodes of DC application
at an amplitude of 1.0mA 51
Figure 2.8: Photomicrographs of longitudinal sections of the nerve
stained with neurofilament H 52
Figure 2.9: Three separate DC lesioning sessions in an anesthetized cat
chronically implanted with test and DC cuffs on the
common peroneal nerve innervating the pretibial muscles
extensor digitorum longus and tibialis anterior 53
Figure 3.1: The nerve cuff electrodes used in the study 62
Figure 3.2: Subcutanous Port Schematics 62
Page 12
Figure 3.3: Subcutaneous port and lead 63
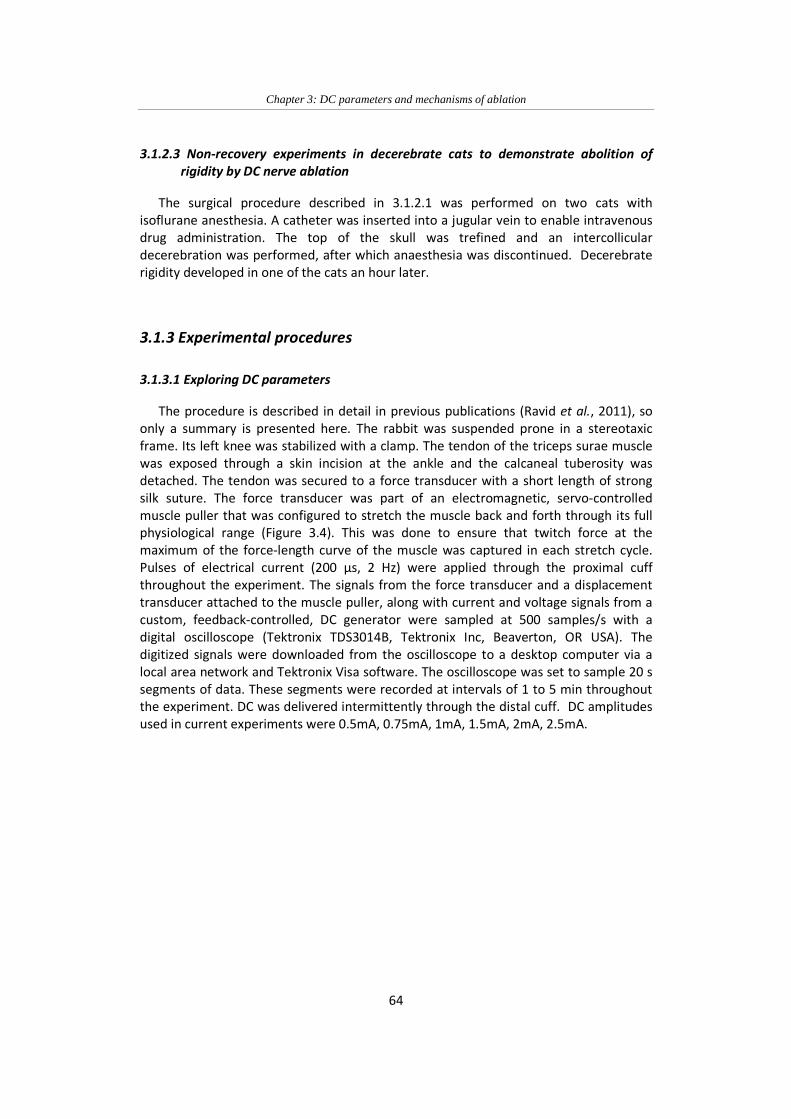
Figure 3.4: Arrangement in the experiments exploring DC parameters
and decerebrate rigidity. 65
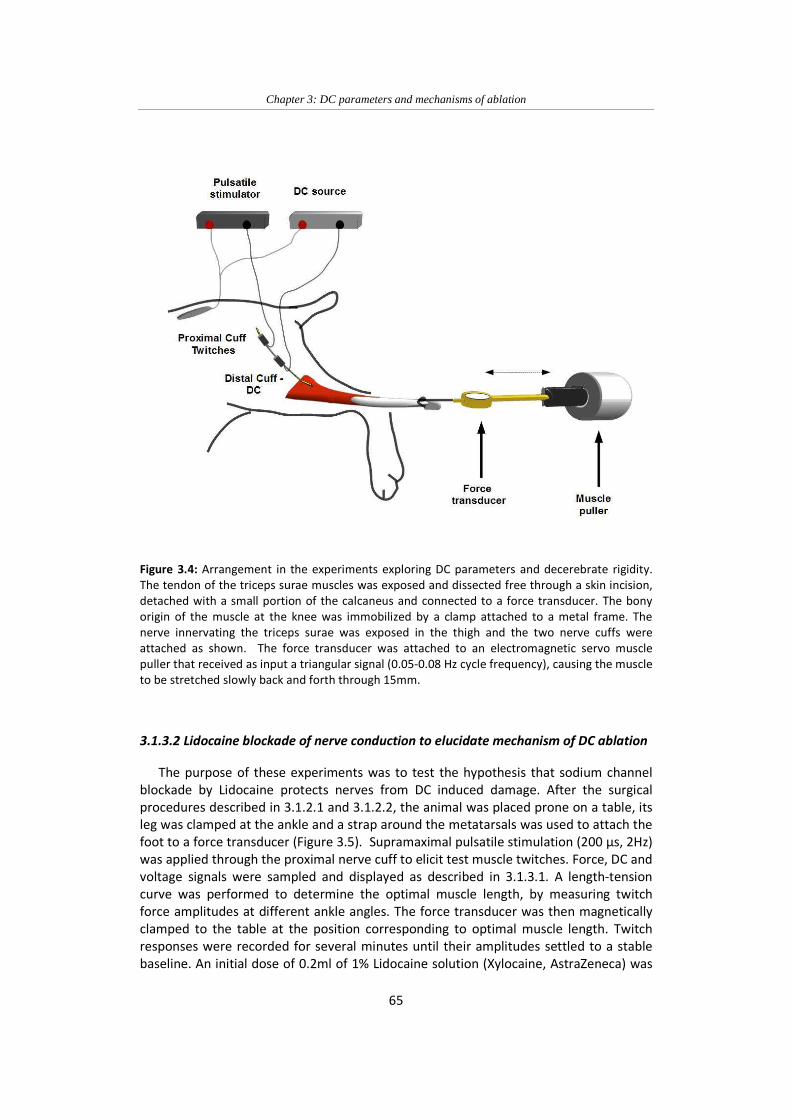
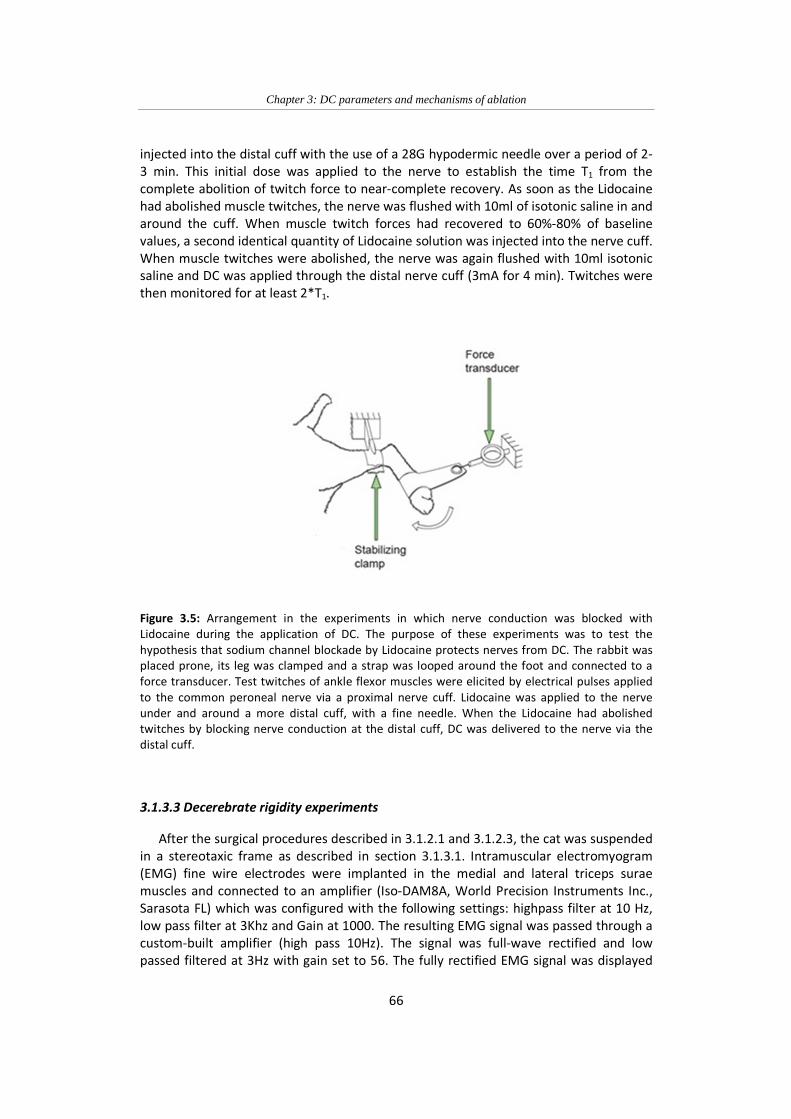
Figure 3.5: Arrangement in the experiments in which nerve conduction
was blocked with Lidocaine during the application of DC 66
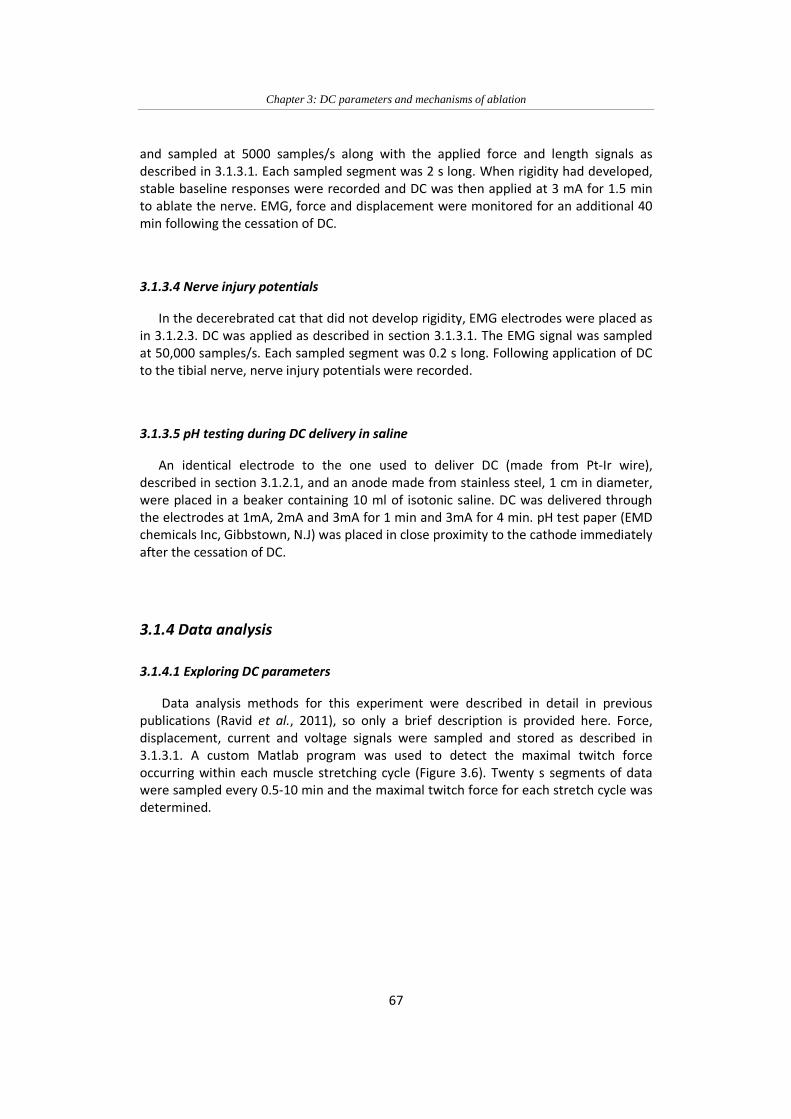
Figure 3.6: Muscle twitches were generated by pulsatile stimulation
(200 µs, 2 Hz) through the proximal nerve cuff 68
Figure 3.7: Changes in twitch force during and after six episodes of DC
(horizontal bars at top) applied at an amplitude of 0.75mA
for periods of 2 min 70
Figure 3.8: Changes in twitch force during and after 14 2-min
applications of DC at 0.75mA 70
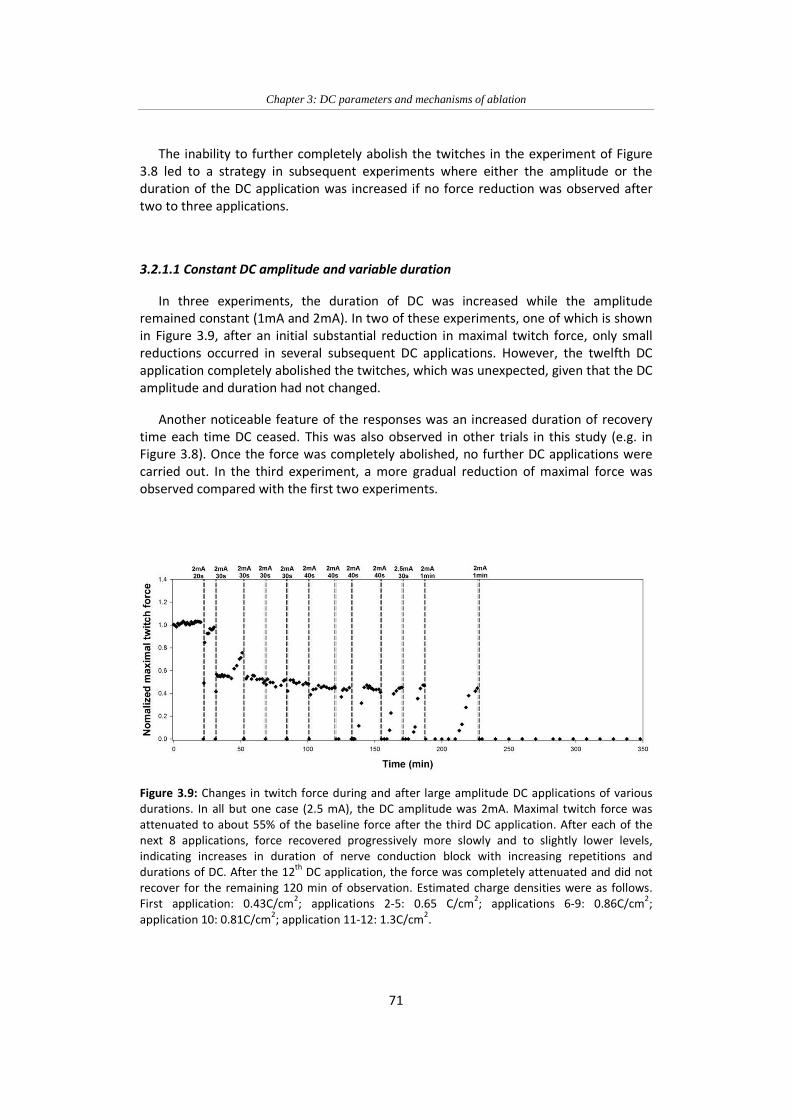
Figure 3.9: Changes in twitch force during and after large amplitude DC
applications of various durations 71
Figure 3.10: Changes in twitch force during and after episodes of DC at
progressively increasing amplitude 72
Figure 3.11: Changes in twitch force during episodes of DC delivered
through a sub-cutaneous port connector 73
Figure 3.12: EMG responses to muscle displacement (positive incline
indicates stretch) in the decerebrate cat that developed
rigidity 74
Figure 3.13: Superimposed EMG traces 75
Figure 3.14: Triceps surae EMG and twitch forces during a slow ramp-up
of DC and a slow muscle stretch and release in the cat that
did not develop decerebrate rigidity 75
Figure 3.15: EMG (green) and force (blue) responses to muscle
displacement (black, stretch upward) before (A) and 40 min
after DC application (B) 76
Figure 3.16: Time course of mean rectified EMG (red) and peak active
force (blue) per stretch cycle in a decerebrate cat 77
Figure 3.17: Denervation (fibrillation) potentials after DC ablation in a
cat that did not develop rigidity after DC nerve ablation 78
Figure 3.18: Denervation potentials analysis 78
Page 13
Figure 3.19: Lack of neuroprotective action of Lidocaine during DC
delivery 80
Figure 3:20 Same as in the second half of Figure 3.19 80
Figure 4.1: Nerve cuff and lead 93
Figure 4.2: Schematic drawing of the subcutaneous port 94
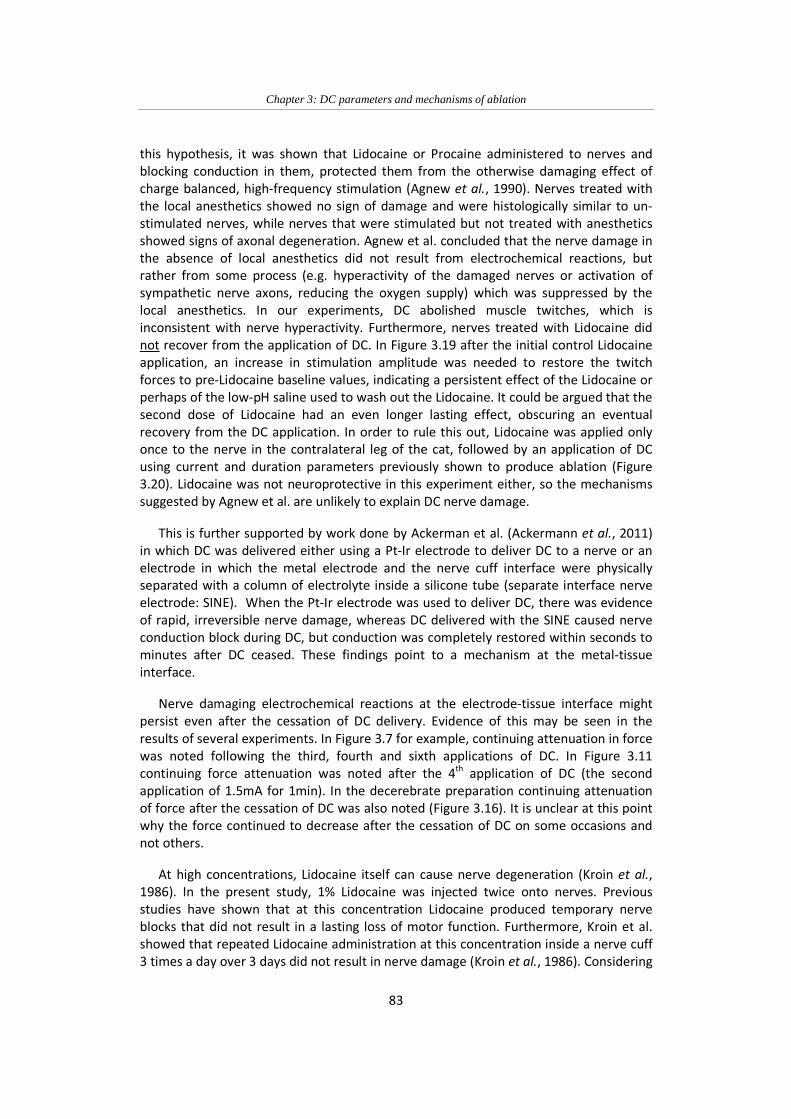
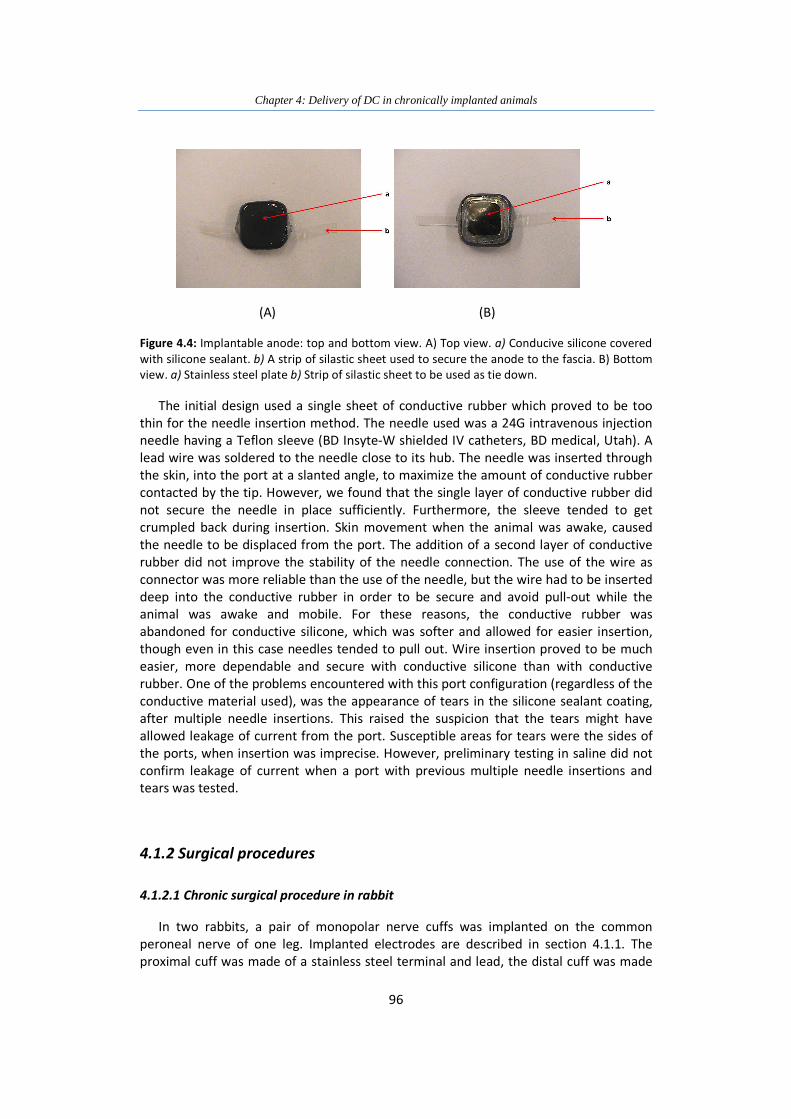
Figure 4.3: Subcutanous port: top and bottom view 95
Figure 4.4: Implantable anode: top and bottom view 96
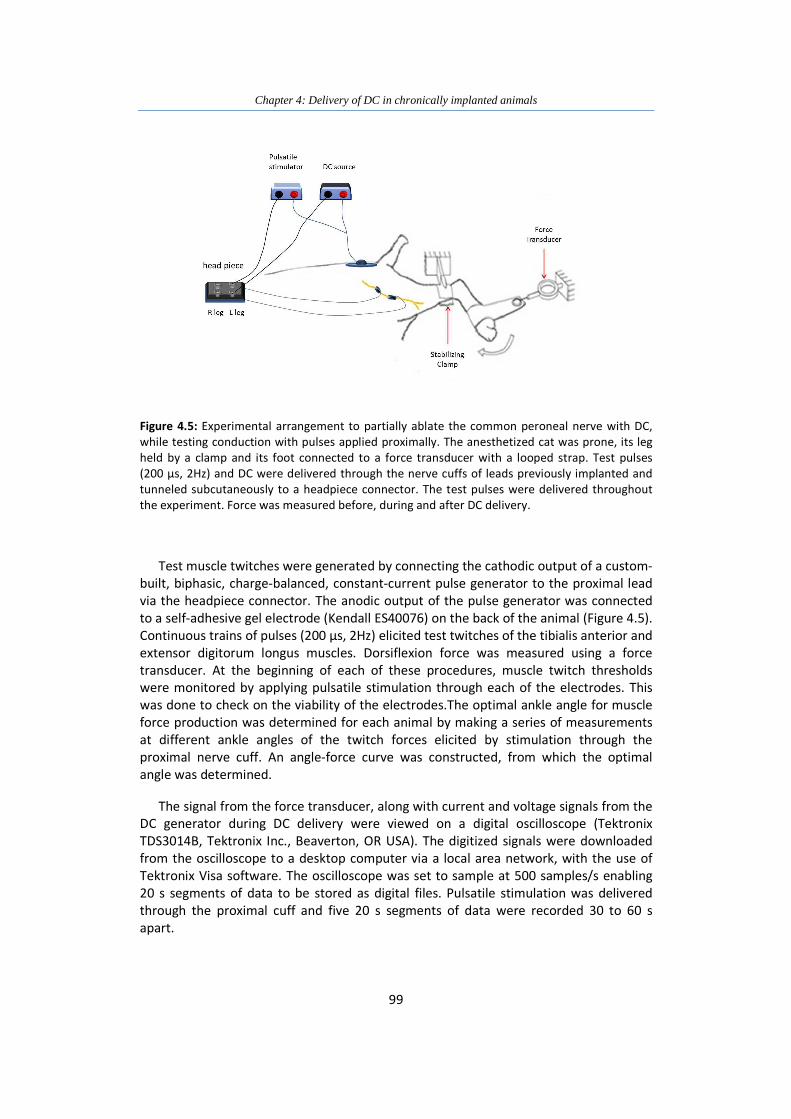
Figure 4.5: Experimental arrangement to partially ablate the common
peroneal nerve with DC, while testing conduction with
pulses applied proximally 99
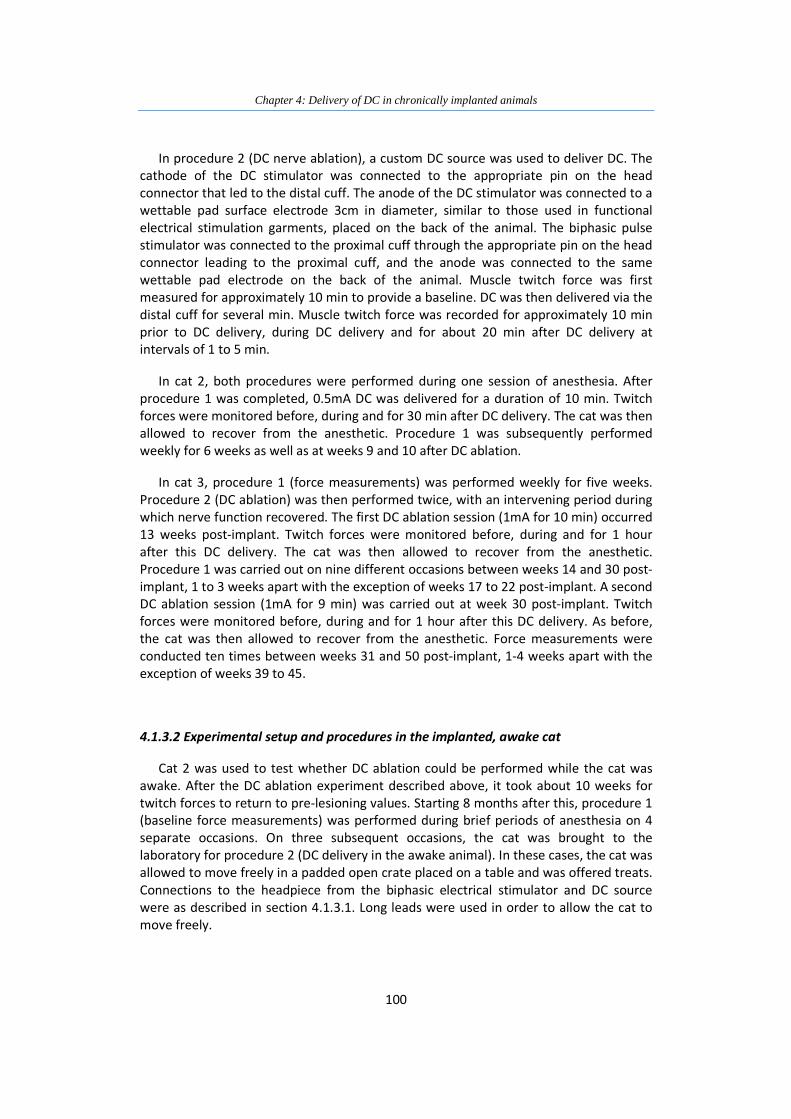
Figure 4.6: Experimental setup for delivery of DC in the chronically
implanted rabbit 102
Figure 4.7: Mean twitch force in chronically implanted 104
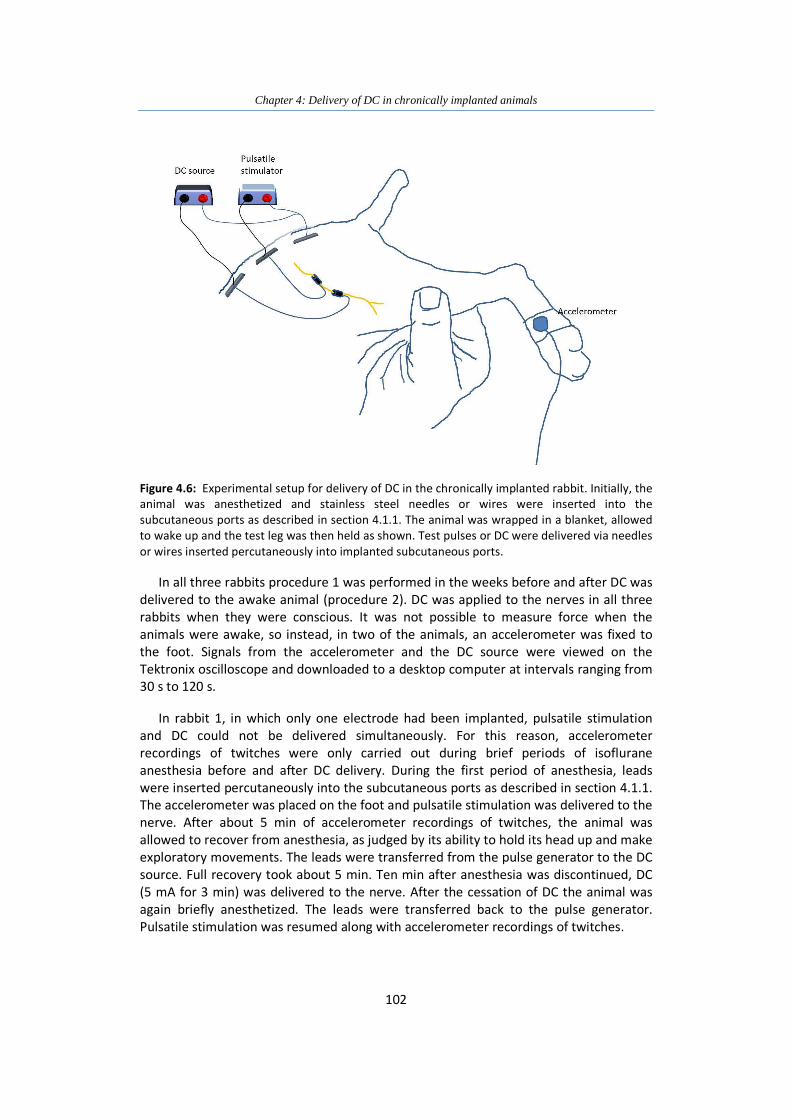
Figure 4.8: Mean twitch forces in a chronically implanted cat in the
weeks before and after two sessions in which DC was
delivered to the common peroneal nerve 105
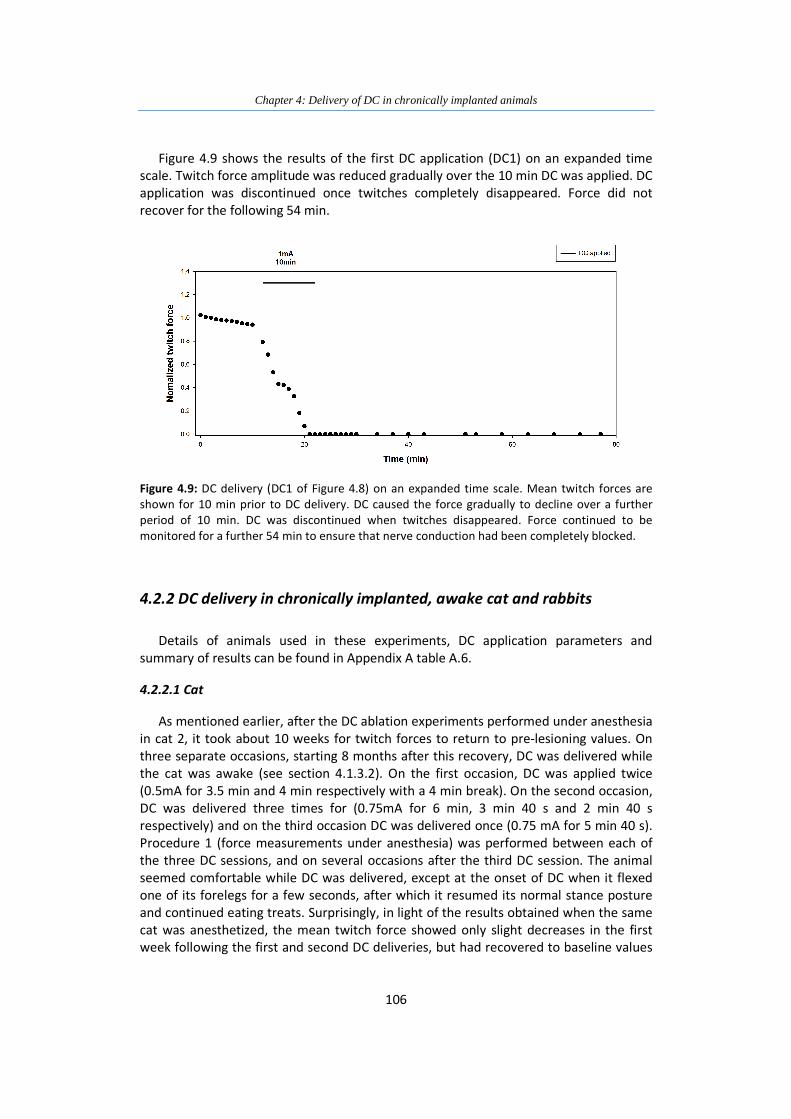
Figure 4.9: DC delivery (DC1 of Figure 4.7) on an expanded time scale 106
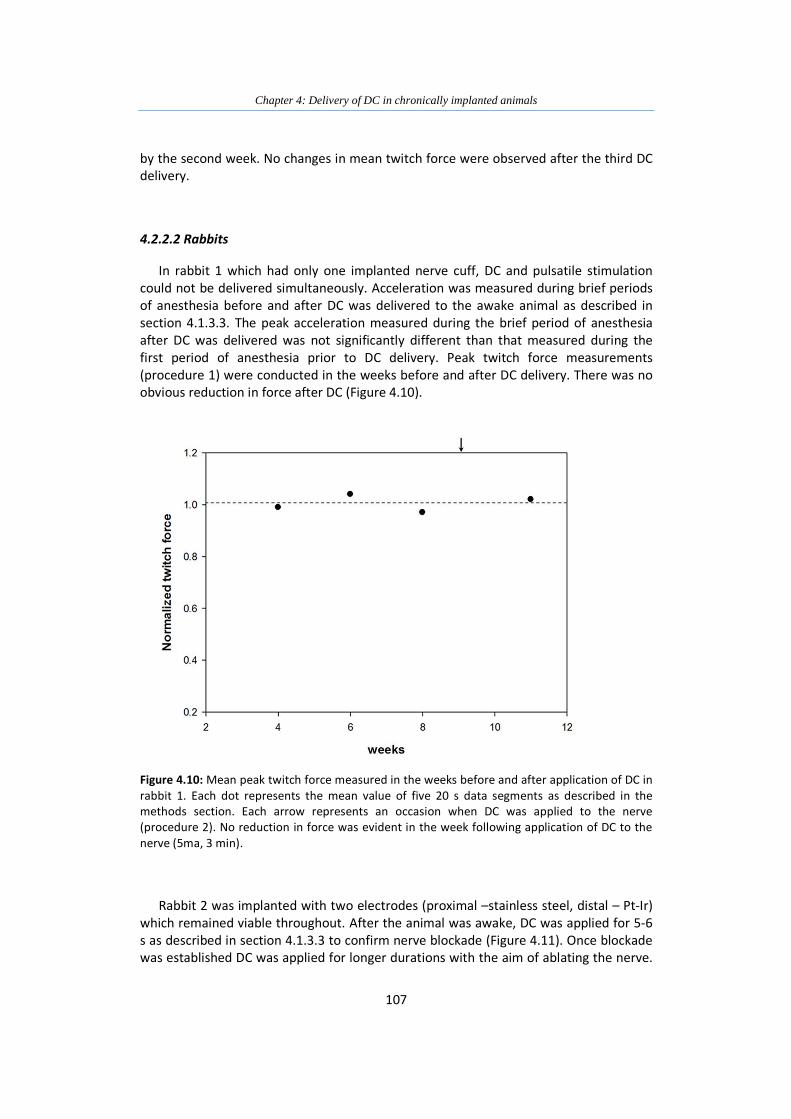
Figure 4.10: Mean peak twitch force measure in the weeks before and
after application of DC in rabbit 1. 107
Figure 4.11: Test twitches abolished by 3mA DC applied to the nerve in
an awake rabbit 108
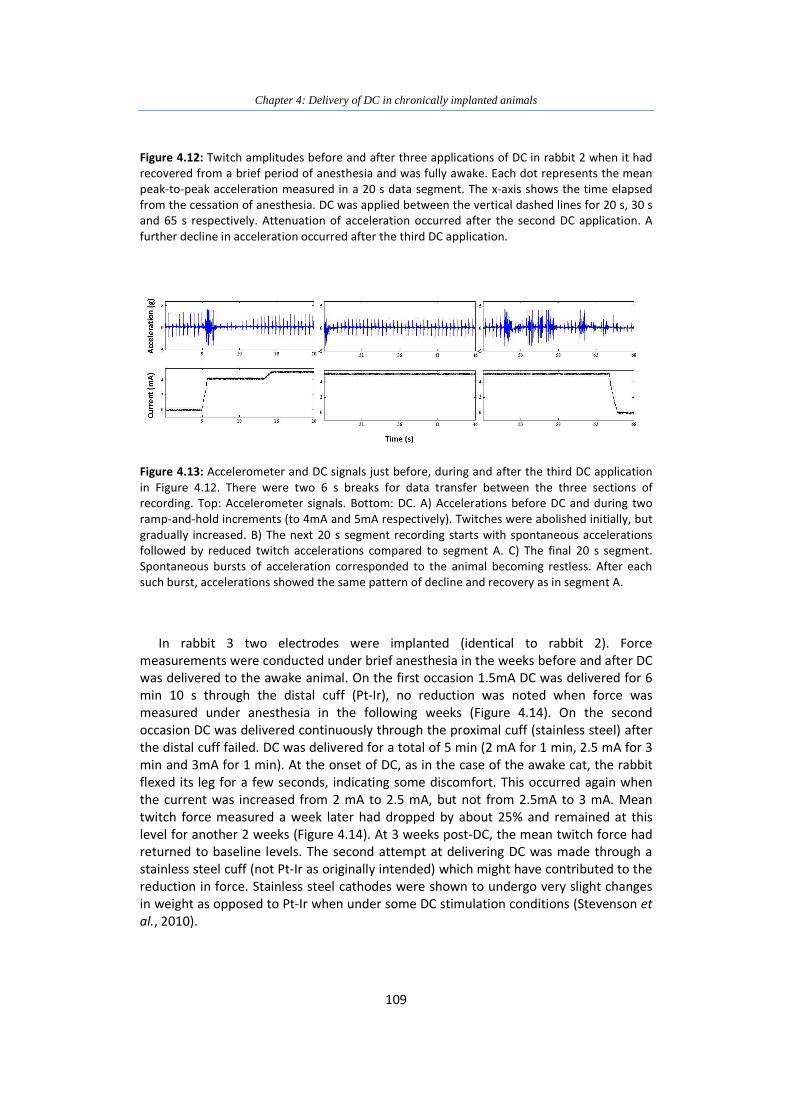
Figure 4.12: Twitch amplitudes before and after three applications of DC
in rabbit 2 when it had recovered from a brief period of
anesthesia and was fully awake 108
Figure 4.13: Accelerometer and DC signals just before, during and after
the third DC application in Figure 4.10 109
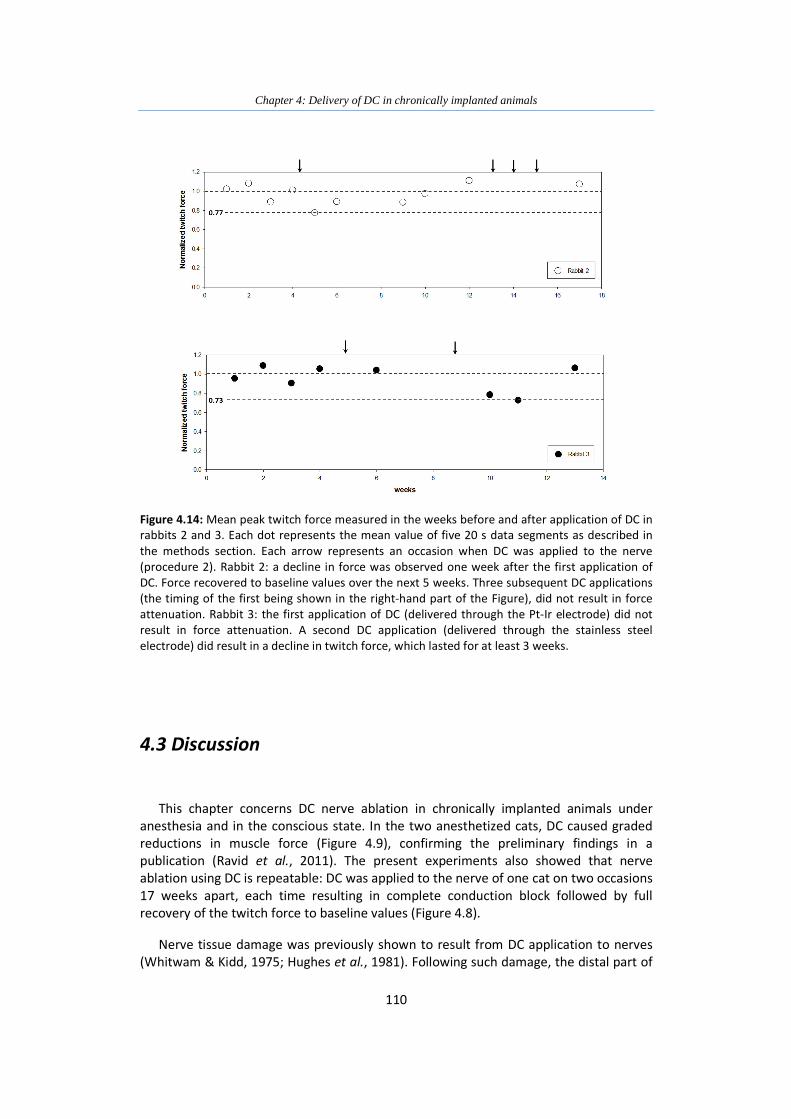
Figure 4.14: Mean peak twitch force measured in the weeks before and
after application of DC in rabbits 2 and 3 110
Page 14
List of Abbreviations
Abbreviation Definition
ADL
BtA
CNS
CPN
CRF
DC
ECF
EDL
EPSP
FES
KCC2
ITB
JIH
MN
MS
PIC
PRF
Pt-Ir
ROM
SCI
SINE
TA
UMN
activities of daily life
Botulinum toxin A
central nervous system
common peroneal nerve
conventional radiofrequency
direct current
extra cellular fluid
extensor digitorum longus
excitatory post synaptic potential
functional electrical stimulation
potassium-chloride co-transporter
intrathecal Baclofen
joint interval histogram
motoneuron
multiple sclerosis
persistent inward current
pulsed radiofrequency
platinum iridium
range of motion
spinal cord injury
separate interface nerve electrode
Tibialis anetrior
upper motor neuron
Page 15
1
Chapter 1
Introduction
The use of nerve conduction block for the treatment of neurological disorders has
been practised for many years. It was used to treat conditions such as neuropathic pain,
trigeminal neuralgia, sympathetic disorders and, since the early 1900’s, as a treatment
for spastic hypertonus (Zafonte & Munin, 2001), a condition resulting from upper
motoneuron lesions (UMNs), characterized by muscle over-activity.
Spastic hypertonus or spasticity often develops after UMN lesions resulting from
spinal cord injury (SCI), stroke or multiple sclerosis (MS) and is characterized by over
activity of muscles. This condition is manifested in increased resistance to muscle
stretch, hyper-reflexia and in some cases tonic co-contraction of agonists and
antagonists. It is most often associated with pain, contractures and abnormal posture.
Spasticity has a negative impact on mobility and function, activities of daily lives (ADL)
and delivery of personal care (Welmer et al., 2006; Lundstrom et al., 2008; Mayer,
2010).
Current treatments include conventional physiotherapy, anti-spastic medications,
surgical interventions and nerve conduction blocks. Physiotherapeutic treatments have
limited efficacy (Goldstein, 2001). Systemic drugs can reduce hyper-reflexia, but the
evidence for their overall efficacy is surprisingly weak, and they nearly always have
unwanted side-effects (Montane et al., 2004; Rizzo et al., 2004). Nerve blocking agents
have been used for many years to reduce muscle over-activity. The most commonly
used agent these days, Botulinum toxin A (BtA), is very costly (Horn et al., 2010). BtA has
largely replaced alcohol and phenol, which are difficult to administer and may result in
unacceptable complications (Zafonte & Munin, 2001). Administration of nerve blocking
agents is often suggested as an accompanying treatment to other interventions such as
systemic anti-spastic drugs (Kofler et al., 2009; Simon & Yelnik, 2010). Current spasticity
treatments are often successful in reducing muscle tone, but there is some debate as to
whether this necessarily results in improved functional outcomes (Elovic, 2001;
Goldstein, 2001; van Kuijk et al., 2002).
Considering the current status of spasticity treatment, there is a need for a cost-
effective intervention that would address reduction of spasticity as well as improve
motor function. Experiments with direct electrical current (DC) have demonstrated its
ability to block nerve conduction (Kuffler & Gerard, 1947; Mendell & Wall, 1964;
Fukushima et al., 1975; Bhadra & Kilgore, 2004) resulting in nerve damage and
diminished action potential propagation (Whitwam & Kidd, 1975; Hughes et al., 1981).
Neural prostheses (NPs) have been used for the last 40 years to improve motor and
sensory function by delivering electric stimulation to muscle nerves either
Page 16
Chapter 1: Introduction
2
percutaneously via electrodes applied to the skin or via wire electrodes implanted close
to or on the nerves (Prochazka et al., 2001). Some examples include cochlear implants
for restoration of hearing, peroneal nerve stimulators for improvement of ambulation
and NPs that improve hand grasp and release such as the stimulus router system (Gan,
2009). In theory, an implantable NP with one or more electrodes placed directly on the
nerve could provide the means for the precise delivery of DC to the nerve, enabling
block or controlled ablation. The same electrode could also be used to deliver pulsatile
functional electrical stimulation (FES) to axons not blocked or ablated by the DC
treatment.
Although DC was originally deemed unsuitable for clinical application due to its
damaging effect on nerve integrity and conduction (Whitwam & Kidd, 1975), It is this
very effect that may enable its success as a novel means of partially ablating nerves in
the treatment of spasticity.
This thesis investigates the feasibility of the use of DC, delivered via implantable
electrodes, as a cost-effective means of blocking or ablating nerves in the treatment of
spasticity. This introductory chapter provides a review of spasticity, its epidemiology,
symptoms, underlying mechanisms and current treatments. It also includes a historical
review of DC applications in the medical field and a current overview of DC nerve
blockade research as well as a brief description of the considerations for the use of
electrodes that could be used to deliver DC.
1.1 Spastic hypertonus
Spastic hypertonus was initially defined by Lance as “a motor disorder characterized
by a velocity-dependent increase in tonic stretch reflexes (muscle tone) with
exaggerated tendon jerks, resulting from hyper-excitability of the stretch reflexes, as
one component of the upper motoneuron syndrome” (Lance, 1980). New evidence from
spasticity research indicates this definition is no longer sufficient to describe the
phenomenon. It has become apparent for example that pathways such as those
involving cutaneous afferents, and not only stretch reflexes, are involved in generating
spastic hypertonus. A new, broader definition was suggested by Pandyan in 2005 which
describes spastic hypertonus as “disordered sensori-motor control, resulting from an
upper motor neuron lesion, presenting as intermittent or sustained, involuntary
activation of muscles”. (Pandyan et al., 2005; SCIRE, Version 3.0b).
It is important to define spasticity in order to be able to measure and test the effects
of any intervention aimed at treating this condition in a clinical setting. However, the
first question that needs to be asked is: why is spasticity important?
Page 17
Chapter 1: Introduction
3
1.1.1 The Importance of Spastic Hypertonus
In order to understand the importance of spastic hypertonus, one must look at two
main factors: impact on the daily lives of the individual suffering from spasticity and the
financial burden on the health care system which provides treatment for those who are
affected by it.
1.1.1.1 Impact of spasticity on daily life
Spasticity becomes clinically relevant when it impacts the function and care of a
patient (Brashear & Elovic, 2010). It is associated with reduced mobility and limitation of
activity (Welmer et al., 2006). Stroke survivors suffering from spasticity have lower
scores on measures of activities of daily life (ADL) (Sommerfeld et al., 2004; Welmer et
al., 2006; Lundstrom et al., 2008). Beyond the limitations on function, a myriad of issues
affect the everyday well-being of individuals with spasticity including skin irritation and
breakdown (resulting from constantly clenched fists), fungal infection and resulting
odor, shoulder subluxation, joint and muscle contractures, pressure on nerves such as
that exerted on the median nerve by a flexed wrist, difficulty in completing personal
care and hygiene and, of course, pain. Spasticity also has an impact on the individual’s
body image causing discomfort and embarrassment due to abnormal posture (Mayer,
2010). In a database of self-reported secondary complications following SCI, spasticity
was found to be the most commonly reported complication (53%) preceding pain (44%)
and pressure ulcers (38%) (Walter et al., 2002).
1.1.1.2 Impact of spasticity on health care costs
In 2008 the overall cost of the treatment of stroke in the United States (US) was
$34.3 billion (Roger et al., 2012). This report states that stroke results in disability more
often than mortality (19.4% death rate) and is reported as the 4th most common cause
of death but as the leading cause of long term disability in the US (Roger et al.,
2012).This often means longer hospital stays, rehabilitation treatment and placement in
long term continuing care facilities following discharge, all of which are considered a
major expense to the health care system (Rothwell, 2001; Roger et al., 2012).
Compensation for post-acute stroke care in the US is one of the rapidly growing
expenses in Medicare (Centers for Disease Control, 2003).
1.1.2 Epidemiology of spastic hypertonus
1.1.2.1 Stroke population
There are over 7 million stroke survivors living in the US today. Each year
approximately 795,000 individuals will suffer a stroke, 610,000 of these incidents will be
a first time event (Roger et al., 2012). Six months following a stroke event, 50% of
survivors will remain with some hemiparesis, 30% will be unable to walk independently
Page 18
Chapter 1: Introduction
4
and 26% will require assistance in ADL and the same percentage will require admission
into long term care facilities (Roger et al., 2012). Spasticity develops in 18% to 38% of
stroke survivors (Watkins et al., 2002; Sommerfeld et al., 2004; Welmer et al., 2006;
Lundstrom et al., 2008; Kong et al., 2012). The number of affected individuals ranges
from 1,260,000 to 2,660,000 in the US alone.
1.1.2.2 SCI population
270,000 individuals are estimated to be living with the after-effects of SCI in the US
today. Incidence is approximately 12,000 new cases each year (NSCISC, 2012) and
numbers are on the rise (SCIRE, Version 3.0a). Sixty seven percent of SCI survivors
developed spasticity before being discharged from hospital. This percentage increases
to 78% by the first annual checkup. The prevalence of spasticity increases with the level
of injury (Maynard et al., 1990).
1.1.3 Pathophysiology of spastic hypertonus
Injury to the CNS has immediate detrimental consequences to independent function.
But many changes that occur in the CNS, muscle and soft tissue following such an insult
take time to evolve and present as further complications days and even months after
the initial injury. Spasticity is one such change.
Changes that develop after CNS injury are classified into two categories: negative
signs and positive signs. Negative signs include flaccid weakness and loss of dexterity
due to lack of cortical drive. These usually appear immediately after injury. Positive signs
that develop over weeks and months are attributed to a gradual withdrawal of cortical
inhibition and other changes occurring in the CNS, as well as changes in the properties
of muscle and soft tissue (Mayer, 2010). Positive signs include: co-contraction, clonus,
spasms and what was defined by Lance as spasticity – increased tonic stretch reflexes
with exaggerated tendon jerks (Lance, 1980).
There is no definition of spasticity that is universally accepted. It is often used to
describe several of the positive signs mentioned above. Lance’s definition of spasticity is
still used by many, though it is considered narrow and incomplete for clinical purposes.
In the context of this work, the pathophysiology of positive signs presented as muscle
over-activity will be briefly reviewed and are shown in Figure 1.1.
Page 19
Chapter 1: Introduction
5
Figure 1.1: An upper motor neuron lesion results in a sequence of events that often lead to
impaired function. Weakness appears immediately following the injury but long term changes in
the CNS and soft tissue contribute to the eventual development of muscle over-activity, which
can lead to contractures, further impeding function and often cause pain. Based on Gracies et al.
1997a.
1.1.3.1 Muscle over-activity in spastic hypertonus
Response to passive muscle stretch
An abnormal resistance to imposed muscle stretch is Lance’s definition of spasticity.
Lance attributed the increased resistance to an abnormal increase in the tonic stretch
reflex. In healthy people, imposed stretch of a relaxed muscle results in very little or no
EMG activity. In spastic individuals, imposed stretch elicits involuntary EMG activity that
increases with stretch velocity (Lance, 1980; Sheean, 2002; Mayer, 2010). In the 1950s,
it was posited that in spasticity, muscle spindles were overly sensitive due to elevated
fusimotor drive and this caused exaggerated stretch reflexes. However, this was not
supported by later human neurography recordings (Hagbarth et al., 1973; Wilson et al.,
1999). A more likely explanation is that motoneurons have a reduced threshold to
afferent input (Powers, Campbell et al. 1989) and this may be the result of persistent
inward currents that develop after the loss of corticospinal synaptic inputs (Bennett et
al., 2004)
Page 20
Chapter 1: Introduction
6
Spastic dystonia
The flexed posture of the upper extremity in stroke survivors is a hallmark of spastic
dystonia. A similar phenomenon was studied in monkeys with brain lesions which
resulted in a flexed posture without any voluntary activity or muscle stretch(Denny-
Brown, 1980). The posture was maintained after transection of the dorsal roots which
indicated the drive was of efferent origin (Denny-Brown, 1980). Spastic dystonia is
believed to be a result of tonic drive to low threshold α-motorneurons from supraspinal
pathways. The outcome is sustained firing resulting in the inability of the muscle to relax
(Sheean, 2002; Gracies, 2005b)
Spastic co-contractions
Co-contraction is the simultaneous activation of the agonists and antagonists
muscles observed during volitional movements. Muscle co-activation occurs during
voluntary movements in healthy individuals, for example, when stabilization of a joint is
required, but in individuals with UMN lesion the occurrence is uncontrolled and often
excessive (Gracies, 2005b; Mayer, 2010). Abnormal co-activation of flexors and
extensors was found to be highly correlated with the response to imposed muscle
stretch (Dewald et al., 1995). It is suspected that spastic co-contraction occurs due to
inappropriate descending drive combined with impaired reciprocal inhibition which may
be further augmented by stretch reflex activity (Sheean, 2002; Mayer, 2010; Kheder &
Nair, 2012).
Clonus
Clonus is an involuntary, rhythmic contraction during or after a muscle stretch and is
often seen in a distal joint such as the ankle, however, it can also be triggered by
cutaneous stimuli such as cold or pain (Mayer, 2010). The occurrence of clonus is
attributed to the oscillation of the hyper-excitable phasic stretch reflex (Sheean, 2002;
Adams & Hicks, 2005). Reduced motoneuron (MN) thresholds and long pathway delays
have also been implicated (Hidler & Rymer, 1999).
Flexor spasms
These are involuntary movements that may be caused by a disinhibited flexor
withdrawal reflex, which is a polysynaptic, mediated response to painful stimuli causing
activation of flexor muscles and inhibition of extensors. (Sheean, 2002; Adams & Hicks,
2005; Kheder & Nair, 2012).
1.1.3.2 Possible mechanisms underlying spasticity
The time taken for exaggerated reflex responses to develop after a stroke or SCI,
which can be up to six weeks, indicates that they are not solely caused by the lack of
cortical inhibition. Changes in the CNS following injury, discussed below, are believed to
contribute to the emergence of an imbalance in inhibition and excitation (Brown, 1994;
Ward, 2012).
Page 21
Chapter 1: Introduction
7
1.1.3.2.1 Neuronal mechanisms
Axonal sprouting
Following an UMN lesion, injured descending axons innervating spinal MNs
degenerate. Intact axons sprout and form synapses on the spinal MNs in the spaces left
by the damaged axons. Sprouting can occur from residual descending corticospinal and
brainstem fibers, interneurons and Ia afferent fibers. Reorganization of axons might
contribute to motor recovery but is probably also responsible for the imbalance of
excitatory and inhibitory inputs to the MN that results in spasticity (Brown, 1994;
Gracies, 2005b, a; Elbasiouny et al., 2010).
Afferent inputs
In the intact nervous system, inputs to spinal MNs from descending pathways and
afferent pathways modulate MN activity. Figure 1.2 shows some of the neural
connections that are implicated in altered MN excitability in spasticity.
Figure 1.2: spinal pathways involved in the development of spastic hypertonus. Excitatory
synapses are represented by white circles; inhibitory synapses are represented by black small
circles. Inhibitory interneurons are represented by black large circles and α –motoneurons are
represented by colored circles. Based on Kandel and Schwartz et al. 2000.
Page 22
Chapter 1: Introduction
8
One of the mechanisms that has been implicated in spasticity is presynaptic
inhibition. Axons descending from the brain and terminating on Ia afferent synapses has
been shown to reduce Ia-evoked responses in α−MNs. Loss of this descending inhibitory
control may result in increased Ia input, which in turn can bring MNs closer to firing
threshold. Presynaptic inhibition was shown to be reduced in some individuals with
spasticity but not all (Nielsen et al., 2005). Another mechanism that was suggested to
play a role in facilitating MN excitation was post-activation depression, the reduction of
the amount of neurotransmitter release at Ia synapses with MNs due to repetitive
activation (Elbasiouny et al., 2010). Post-activation depression was shown to be
consistently reduced in spastic individuals (Nielsen et al., 2005).
Other inhibitory pathways implicated in spasticity are: reciprocal Ia inhibition and
nonreciprocal Ib inhibition. When Ia afferents of a muscle are activated by muscle
stretch, they activate Ia interneurons that inhibit MNs of the antagonist muscle, which
prevents it from contracting at the same time. A reduction in reciprocal inhibition can
result in undesirable co-contraction (Gracies, 2005b). A reduction in reciprocal inhibition
was shown to be present in ankle plantarflexor MNs of individuals with spasticity
resulting from MS, SCI and stroke (Nielsen et al., 2007). Non-reciprocal Ib inhibition
results from changes is muscle tension, signaled by Golgi tendon organs, which inhibit
homonymous MNs via di- and tri-synaptic connections (Kandel et al., 2000). This
inhibition was not detected during ankle plantarflexion in spastic individuals, instead
facilitation of soleus was observed (Gracies, 2005b; Nielsen et al., 2007). This impaired
mechanism could further exacerbate muscle co-contraction (Gracies, 2005b; Nielsen et
al., 2007).
Changes in α-Motoneuron excitability
Denervation hypersensitivity of α-MNs is seen after UMN lesions. It has been
attributed to persistent inward currents (PICs). PICs are voltage sensitive currents that
inactivate slowly and are under serotonin and norepinephrine control. Experiments
carried out in spinal rats showed that PICs changed after SCI, initially exhibiting reduced
amplitudes, but over time they became elevated, producing long-lasting plateau
potentials. PICs had the effect of amplifying excitatory post-synaptic potentials (EPSPs)
elicited by action potentials in sensory afferents responding to muscle stretch. This
change in α-MN excitation was proposed as one of the mechanisms leading to spasms,
hyper-reflexia and clonus (Bennett et al., 2004; Heckman et al., 2008).
A recent study showed that potassium-chloride co-transporter KCC2 is down-
regulated in MN membranes below a spinal cord lesion in individuals with SCI but not in
people with supraspinal lesions (Boulenguez et al., 2010). KCC2 maintains a low
intracellular chloride (Cl-) by transporting Cl- ions outside the cell. Once KCC2 is down-
regulated, Cl- can accumulate inside the cell, leading to membrane depolarization (De
Koninck, 2007).
Page 23
Chapter 1: Introduction
9
1.1.3.2.2 Non-neuronal mechanisms
After UMN injury paresis occurs, load-bearing muscles tend to stay immobile at a
short length. Immobilization and disuse lead to muscle atrophy and loss of sarcomeres,
as well as increases in connective tissue and fat content, all of which eventually results
in contractures. If disuse and immobilization persists, reduction in ROM and muscle
compliance may follow. It is suggested that changes to muscle properties may be one of
the underlying mechanisms of spasticity (Gracies, 2005a; Dietz & Sinkjaer, 2007).
1.1.4 Current treatments for spastic hypertonus
There are several approaches to the treatment of spasticity including physiotherapy
treatments such as stretching and vibration, anti-spastic medication, chemical
neurolysis and surgical interventions.
1.1.4.1 Physical and occupational therapy
This approach includes treatments such as stretching, casting, strength and ROM
exercises, vibration and cooling. Muscle stretch and ROM exercises require considerable
time commitment and often have limited efficacy and duration (Bovend'Eerdt et al.,
2008). Muscle stiffness and spastic reflexes may be reduced for no more than a few
hours after such treatment (Hinderer & Dixon, 2001). Spasticity and pain can be
exacerbated by stretch and in extreme cases, muscle tears have been reported
(Bovend'Eerdt et al., 2008). A recent study found that whole body vibration was
ineffective (Brogardh et al., 2012) though another study suggested that repetitive focal
muscle vibration might be beneficial (Caliandro et al., 2012). Overnight splinting of the
upper extremity may preserve wrist and finger extension but was not shown to
contribute to improvement in ROM or reduction in pain (Lannin et al., 2003). Local
muscle cooling was reported to alleviate spasticity and this could last up to 20 minutes
after cessation of treatment, thus this method may be useful as a rehabilitation
treatment to train antagonist muscles (Gracies, 2001). Regardless of the limited efficacy
of the treatments described above, rehabilitative approaches such as ROM exercises
assist in optimization of results achieved by other interventions and as such are
important in the overall treatment of spasticity (Goldstein, 2001).
1.1.4.2 Systemic anti-spastic drugs
Systemic anti-spastic medications targeting some of the central nervous mechanisms
described above are widely used to alleviate and treat spasticity. Four drugs are
approved for the treatment of spasticity: Baclofen, Diazepam, Tizanidine and
Dantrolene.
Page 24
Chapter 1: Introduction
10
Baclofen
Baclofen acts on pre- and post-synaptic terminals and inhibits mono- and poly-
synaptic pathways. It has been shown to induce hyperpolarization of the presynaptic
membrane in interneurons, resulting in reduced calcium influx, which, in turn, causes a
reduction of neurotransmitter release (Davidoff, 1985). Post-synaptically, Baclofen in
high concentrations hyperpolarizes the Ia afferent terminal, resulting in increased
presynaptic inhibition. Oral administration of Baclofen was shown to be most effective
in reducing spams in individuals with SCI and MS and less effective in treating post-
stroke spasticity (Kita & Goodkin, 2000). Side effects of orally administered Baclofen
include weakness and sedation, nausea, hallucination and reduced seizure threshold
(Elovic, 2001) and occasionally confusion, hypotonia, ataxia and reduction in motor
function (Gracies et al., 1997b).
When oral Baclofen is ineffective, intrathecal delivery may be an option. A pump is
implanted in the abdominal wall with a catheter inserted into the subarachnoid space,
delivering the drug directly onto the spinal cord, allowing a higher concentration of
Baclofen at lower dosages to be delivered locally, minimizing systemic effects (Gracies
et al., 1997b; Kita & Goodkin, 2000). Intrathecal Baclofen (ITB) delivery was successful in
reducing muscle tone (Meythaler et al., 2001; Schiess et al., 2011) and improving
strength as well as some function in individuals with post stroke spasticity (Schiess et al.,
2011), but it may also impede ambulation and is not effective for treatment of the
upper extremities (Kofler et al., 2009). Several complications can arise from ITB
including infection and mechanical pump failure such as catheter breakdown (Awaad et
al., 2012). The ITB procedure is expensive and therefore recommended for individuals
with severe limitations who do not respond to alternative treatments (Kita & Goodkin,
2000).
Diazepam
Diazepam, which increases presynaptic inhibition, has proved to be effective in
treating spasticity both in SCI and post stroke populations (Kita & Goodkin, 2000). Side
effects include addiction, intoxication, reduced motor co-ordination and, specifically,
sedation and cognitive depression (Gracies et al., 1997b), which may prove to be
detrimental in stroke survivors (Elovic, 2001). These side effects have relegated the use
of diazepam to an adjunct treatment (Gelber & Jozefczyk, 1999).
Tizanidine
Tizanidine is an α2-adrenergic agonists, which blocks excitatory neurotransmitter
release from spinal interneurons (Elovic, 2001). It was shown to be effective in spasticity
control, reducing tone and clonus as well as pain (Gelber et al., 2001). Side effects may
include sedation, dry mouth, potential for liver damage, and weakness. Tizanidine is
recommended for patients where weakness is more of a concern than the effects of
sedation (Gracies et al., 1997b).
Page 25
Chapter 1: Introduction
11
Dantrolene
Dantrolene blocks excitation-contraction coupling in muscle by the inhibition of
calcium release from the sarcoplasmic reticulum via the ryanodine receptor (Lapeyre et
al., 2010). Dantrolene has been shown to improve muscle tone and ROM (Gracies et al.,
1997b). Side effects may include weakness, nausea and liver toxicity (Gracies et al.,
1997b; Elovic, 2001). It is often recommended for individuals with supraspinal lesions
such as stroke and individuals with acute dystonia where weakening muscles can
improve postural control without the side effect of sedation (Gelber & Jozefczyk, 1999).
General comments
Though systemic anti-spastic medications may help control spasticity to some extent,
evidence of their overall efficacy is weak (Montane et al., 2004; Rizzo et al., 2004).
Furthermore, quite often improvement in function was not noted and in some cases
treatment impeded ADL and sensorimotor function (Gracies et al., 1997b; Elovic, 2001;
Esquenazi, 2006).
1.1.4.3 Surgical intervention
Following UMN lesions, muscle and soft tissue changes may occur, eventually
resulting in contractures, (Dietz & Sinkjaer, 2007; Ward, 2012) that may lead to pain,
reduced function and poor hygiene. The main goal of surgical interventions is to treat
the outcome of such changes with the aim of pain relief and function restoration.
Surgical interventions such as tendon lengthening, tendon transfer (Woo, 2001) and
partial neurotomy (Bollens et al., 2011) may be performed for this purpose. Superficialis
to Profundus tendon transfer surgery in the hemiplegic hand resulted in improved
hygiene and pain reduction at 6 weeks post-surgery (Keenan et al., 1987) as well as at
19 months post-surgery (Heijnen et al., 2008). Tibial neurotomy, although controversial,
is used to treat spastic equinovarus foot (Bollens et al., 2011). Surgical procedures are
recommended only after conventional treatments, such as the use of orthotics, have
failed (Heijnen et al., 2008) and many surgeries result in poor outcomes due to common
mistakes such as creating erroneous insertion points in tendon transfers (Woo, 2001).
1.1.4.4 Nerve conduction blocks
Nerve blocks are defined as the application of a chemical agent to a nerve for the
purpose of impairing conduction along the nerve (Gracies et al., 1997a). The primary
goal of such treatments is the reduction of muscle over-activity in selective muscles
without systemic effects (Frangiamore & O`Brien, 2004). There are three treatments
that fall into this category: injections of alcohol, phenol and BtA.
Page 26
Chapter 1: Introduction
12
Alcohol
Ethyl alcohol was used to treat spasticity since the early 1900’s (Zafonte & Munin,
2001). It works by non-selectively denaturizing proteins when administered at
concentrations above 10%, resulting in neuronal degeneration and fibrosis (Gracies et
al., 1997a). Adverse side effects include pain at the site of injection and dysesthesias
(unpleasant abnormal sensations) (Horn et al., 2010). Dysesthesias tend to be short-
lasting and treatable with medications.
Phenol
Similar to alcohol, phenol (also known as carbolic acid) acts by denaturizing proteins
in a non-selective manner when administered in concentrations above 3%. The resulting
effect is axonal demyelination and muscle denervation which can last on average up to 6
months (Zafonte & Munin, 2001). The main side effects are pain during injection and
dysesthesias that may subside with re-injection. The most dangerous complication of
phenol is unintentional vascular injection (Frangiamore & O`Brien, 2004). Due to the
non-selectivity of phenol, injection into a blood vessel may lead to thrombosis. Phenol is
fast-acting and results can be observed within 2-60 minutes.
A disadvantage common to treatment with both phenol and alcohol is the technical
difficulty of the injection procedure. Damage can result from exploration with the
injecting needle (Frangiamore & O`Brien, 2004; Horn et al., 2010) and the dosage
required for a desirable outcome is difficult to predict (Zafonte & Munin, 2001).
Furthermore, success of both the injection procedure and the results are highly
dependent on the physician’s expertise (Elovic et al., 2009).
Botulinum toxin A (BtA)
BtA causes neuromuscular block by disrupting neurotransmitter release from the
presynaptic terminals of motor nerves. It is injected into the target muscles where it is
taken up by endocytosis at the neuromuscular junction and selectively blocks
acetylcholine release (Dolly & Aoki, 2006). The onset of a BtA block is 24-73 hours from
injection but the peak effect is not observed until 2-6 weeks later. The duration of the
effect depends on factors such as dose, muscle size and injection technique (McGuire,
2001). Side effects of BtA injection include transient skin rash, pain at the injection site,
flu-like symptoms and muscle weakness which can impede function especially when
affecting the finger flexors (van Kuijk et al., 2002). Further complications may arise from
neurophysiological changes taking place after intramuscular injection. Animal
experiments demonstrated that BtA can reach the spinal ventral roots and migrate to
the contralateral spinal cord, altering central synaptic transmission (Gracies, 2004).
Furthermore, it leads to reduced muscle mass and weakness on both the injected side
and contralateral side (Fortuna et al., 2011). Although rare, some individuals may
develop immuno-resistance to BtA resulting in non-responsiveness to the treatment
(Brashear et al., 2002; Elovic et al., 2008; Elovic et al., 2009).
BtA was shown to be effective in treating spasticity (Esquenazi, 2006) both in upper
extremity (Brashear et al., 2002; Elovic et al., 2008) and lower extremity (Kirazli et al.,
1998). It was effective in reducing tone and improving ROM, but no clear evidence was
Page 27
Chapter 1: Introduction
13
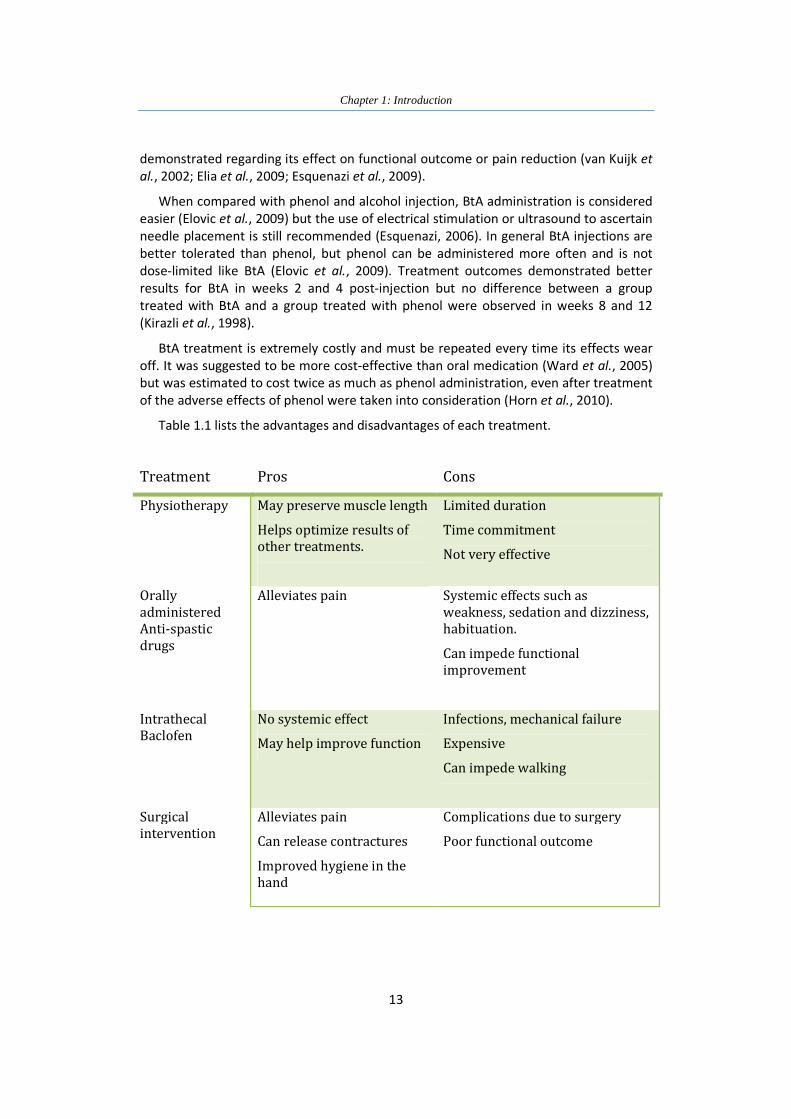
demonstrated regarding its effect on functional outcome or pain reduction (van Kuijk et
al., 2002; Elia et al., 2009; Esquenazi et al., 2009).
When compared with phenol and alcohol injection, BtA administration is considered
easier (Elovic et al., 2009) but the use of electrical stimulation or ultrasound to ascertain
needle placement is still recommended (Esquenazi, 2006). In general BtA injections are
better tolerated than phenol, but phenol can be administered more often and is not
dose-limited like BtA (Elovic et al., 2009). Treatment outcomes demonstrated better
results for BtA in weeks 2 and 4 post-injection but no difference between a group
treated with BtA and a group treated with phenol were observed in weeks 8 and 12
(Kirazli et al., 1998).
BtA treatment is extremely costly and must be repeated every time its effects wear
off. It was suggested to be more cost-effective than oral medication (Ward et al., 2005)
but was estimated to cost twice as much as phenol administration, even after treatment
of the adverse effects of phenol were taken into consideration (Horn et al., 2010).
Table 1.1 lists the advantages and disadvantages of each treatment.
Treatment Pros Cons
Physiotherapy May preserve muscle length
Helps optimize results of
other treatments.
Limited duration
Time commitment
Not very effective
Orally
administered
Anti-spastic
drugs
Alleviates pain Systemic effects such as
weakness, sedation and dizziness,
habituation.
Can impede functional
improvement
Intrathecal
Baclofen
No systemic effect
May help improve function
Infections, mechanical failure
Expensive
Can impede walking
Surgical
intervention
Alleviates pain
Can release contractures
Improved hygiene in the
hand
Complications due to surgery
Poor functional outcome
Page 28
Chapter 1: Introduction
14
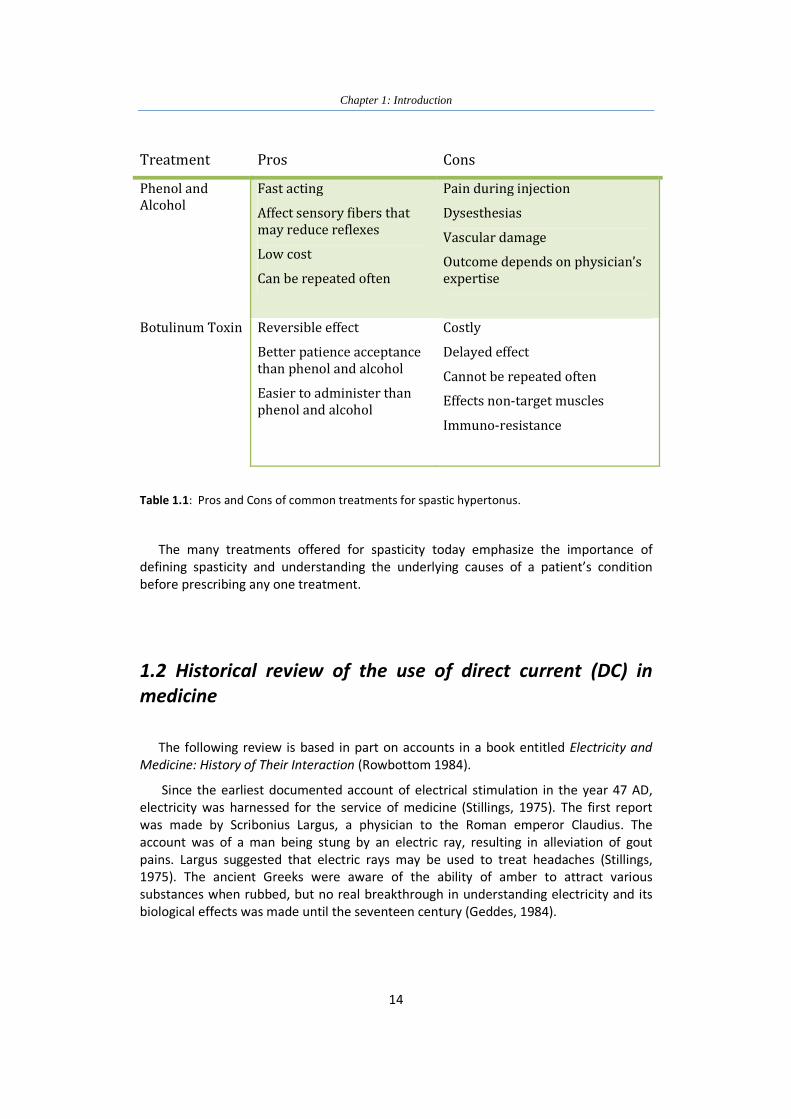
Treatment Pros Cons
Phenol and
Alcohol
Fast acting
Affect sensory fibers that
may reduce reflexes
Low cost
Can be repeated often
Pain during injection
Dysesthesias
Vascular damage
Outcome depends on physician’s
expertise
Botulinum Toxin Reversible effect
Better patience acceptance
than phenol and alcohol
Easier to administer than
phenol and alcohol
Costly
Delayed effect
Cannot be repeated often
Effects non-target muscles
Immuno-resistance
Table 1.1: Pros and Cons of common treatments for spastic hypertonus.
The many treatments offered for spasticity today emphasize the importance of
defining spasticity and understanding the underlying causes of a patient’s condition
before prescribing any one treatment.
1.2 Historical review of the use of direct current (DC) in
medicine
The following review is based in part on accounts in a book entitled Electricity and
Medicine: History of Their Interaction (Rowbottom 1984).
Since the earliest documented account of electrical stimulation in the year 47 AD,
electricity was harnessed for the service of medicine (Stillings, 1975). The first report
was made by Scribonius Largus, a physician to the Roman emperor Claudius. The
account was of a man being stung by an electric ray, resulting in alleviation of gout
pains. Largus suggested that electric rays may be used to treat headaches (Stillings,
1975). The ancient Greeks were aware of the ability of amber to attract various
substances when rubbed, but no real breakthrough in understanding electricity and its
biological effects was made until the seventeen century (Geddes, 1984).
Page 29
Chapter 1: Introduction
15
1.2.1 Electricity in medicine prior to Galvani’s discoveries
Gilbert, a physician of Queen Elizabeth I, devised the first electroscope to detect
weak electrostatic attraction (Rowbottom 1984). He placed a light metal needle on a
pin, rubbed numerous substances and watched for the needle to turn. Substances such
as crystal, opal, sealing wax possessed attractive powers, but substances such as metal
did not (Rowbottom 1984). In 1600 Gilbert published his work and named the latter,
electricks, the Greek name for amber, unknowingly naming a new science (Skilling,
1948). The use of the English word electricity began fifty years later (Skilling, 1948).
In late 1745 the first capacitor was invented and was known as the Leyden jar
(Geddes, 1984). It was composed of an electrified conductor (nail or tin tube) placed in a
container filled with water. When the container was held with one hand and the
conductor was touched with the other, the person who held the jar felt an electric
shock. The jar was simultaneously and independently invented by Kleist in Germany and
by Musschenbroek in Holland (Heilbron, 1979).
A surgeon from Paris, Abbé Nollet, claimed that he along with other two surgeons
were the first to use the Leyden Jar for therapeutic purposes on paralyzed limbs but
were unsuccessful in their trials (Rowbottom 1984). Another Parisian surgeon, Antoine
Louis, attempted to use the Leyden jar on three paralyzed patients but failed to restore
any functional movement (Hoff, 1936; Rowbottom 1984). The first report of successful
use of electricity to stimulate muscles using the Layden jar was in 1747 by Jean Jallabert,
a professor of mathematics and philosophy at Geneva, who worked with the leading
surgeon of Geneva, Guyot (Rowbottom 1984).
Jallabert and Guyot documented a set of experiments performed on a locksmith
who suffered a head injury 14 years prior (Rowbottom 1984). After conventional
treatment the locksmith remained with a limp and loss of sensation and movement of
the right arm, except for vertical motion. Both wrist and fingers were in a constant
flexed position and could not be moved. The arm was emaciated and fingers swollen.
Jallabert found a way to stimulate groups of muscles rather than to simply shock the
patient. After three months of treatment, complete use of the arm was regained and
sensation was restored. Furthermore, Jallabert combined electrotherapy and
physiotherapy by rubbing the patient’s arm, which was placed on a warm stove, before
and after treatment (Rowbottom 1984).
Following Jallabert’s successful account, numerous attempts by several individuals,
not necessarily physicians, to treat various medical conditions with electricity ensued,
resulting in varying degrees of success (Rowbottom 1984). The literature describing the
use of electricity in treating medical conditions was mounting (Hoff, 1936). Between
1750 and 1780, twenty six articles or book reviews on medical electricity were published
in the Journal de Médicine alone (Hoff, 1936). Research on the use of electricity also
continued in the field of physics (Baigrie, 2007). In the 1750’s Franklin explained the
concept of charge and in 1786 Coulomb published the law of electrical attraction.
Ironically, the next breakthrough in the science of electricity came from the field of
anatomy, not physics. In 1791, Galvani published his discoveries of ‘animal electricity’. A
publication that lead to Volta’s invention of the battery, which dramatically changed
the field of electricity (Baigrie, 2007).
Page 30
Chapter 1: Introduction
16
1.2.2 Galvani, Volta and the invention of the battery
Luigi Galvani, a professor of obstetrics in Bologna, practised medicine and performed
surgeries while doing extensive research in the field of anatomy (Skilling, 1948;
Rowbottom 1984). During Galvani’s studies in Bologna, several researchers
experimented with electrical stimulation of nerves and muscles using electric rays and
electric eels (Rowbottom 1984). During the 1780s, while making his famous discoveries
Galvani was probably aware of those experiments as well as the controversy of whether
electricity was the basis of muscle contraction (Hoff, 1936).
Galvani’s initial discovery was accidental. He conducted experiments on frogs’
muscle nerve preparation where the thighs were removed and the legs and feet were
connected to a stump of the spine by the sciatic nerve (Hoff, 1936). The preparation was
placed on the same table as an electrical machine used for other purpose. When an
assistant touched the nerve with a scalpel, muscle contractions were observed (Skilling,
1948; Rowbottom 1984). It was discovered that muscle contraction occurred only when
the machine was discharged and the assistant was touching the blade or the metallic
rivets of the handle. Galvani substituted the scalpel for wire conductors placed close to
the electrical machine achieving the same result (Rowbottom 1984).
In another set of experiments, based on Franklins experience with lightning and
storms clouds, Galvani was able to cause frogs muscles to contract using atmospheric
electricity (Rowbottom 1984). To his surprise he noticed infrequent contraction during
days of good weather (Geddes & Hoff, 1971). In order to test this phenomenon the frog
preparations were hung on an iron railing by a brass hook inserted into the spine and
Galvani was waiting for muscles to contract. When he pushed the preparations into the
iron railing, contractions occurred frequently (Rowbottom 1984).
Galvani then took the preparation into his laboratory and placed the frog on a metal
surface, when the hook touched the surface muscle contraction occurred (Skilling,
1948). He went on to try the same experiments with different metals and several other
non-conducting materials and found out that contractions were achieved only when
metals were used (Geddes & Hoff, 1971). This led Galvani to believe that electricity was
inherent in the animal itself. In 1791 Galvani published the work in Commentary on the
Forces of Electricity in Muscular Motion (Rowbottom 1984). Alessandro Volta, a
professor of physics in Pavia, read Galvani’s manuscript and after conducting a set of
experiments concluded differently (Skilling, 1948). Volta reasoned that the contractions
were not due to animal electricity, as Galvani claimed, but due to the contact of
dissimilar metals. He was able to show that electricity was present when two different
metals were brought into contact (Skilling, 1948). Volta theory was widely accepted
(Brazier, 1957) and animal electricity theory was pushed aside for the next 30 years
(Rowbottom 1984).
Galvani made a dramatic impact on the world of electricity and in the mid-1790s the
term galvanism was coined in honor Galvani’s discoveries (Rowbottom 1984).The
Galvani-Volta controversy eventually resulted in the invention of the voltaic pile in 1800
– what is now known as the first battery.
Page 31
Chapter 1: Introduction
17
1.2.3 Direct current in the service of neurophysiology
The increased use of DC in the 19th century corresponded to the rise of
electrophysiology. In the 1830s and 40s Carlo Matteuci, an Italian physicist and
neurophysiologist, was the first to observe what is now recognized as the action
potential (Moruzzi, 1996). He was also the first to demonstrate electrode polarization. In
the 1940s Du Bois-Reymond recreated Matteuci’s experiments in muscle physiology and
continued to explore the electrophysiology of nerves (Rowbottom 1984). Many findings
in this field are attributed to Du Bois-Reymond, including the discovery of action
potentials in peripheral and central nerves and the capability of nerves to produce
current in the brain (Brazier, 1957).
To further study the effect of DC on nerves, Du Bois-Reymond placed a section of a
nerve between two platinum wedges connected to a galvanometer, applied DC and
followed the deflection of the needle indicating the strength of the electrical current
(Rowbottom 1984). He discovered that when the current flowed in one direction the
deflection was increased while when the current flowed in the opposite direction the
deflection decreased (Rowbottom 1984). This phenomenon was initially noticed almost
40 years earlier by Johann Wilhelm Ritter, a German chemist, but his discovery went
unnoticed at that time (Geddes, 1984). Ritter passed electrical current from one hand to
the other and discovered that the hand connected to the negative electrode became
more stiff (Geddes, 1984). By the time Du Bois-Reymond discovered the effect of DC,
Faraday published his work introducing terminology such as electrode, cathode and ion
and Du Bios-Reymond used Faraday’s terminology to name the phenomenon
electrotonus (Rowbottom 1984).
In 1859, Pflüger, a student of Du Bois-Reymond further explored the electrotonus
phenomenon with DC, and used a myograph to measure contraction (Rowbottom
1984). He demonstrated that the excitably increased under the cathode and declined
under the anode, when the circuit was closed (Geddes, 1984). He further demonstrated
that increased excitability under the cathode, upon closing of the circuit, constituted a
more effective stimulus than the increase in excitability under the anode at the break of
the circuit. Lastly, Pflüger was also successful in achieving anodal block: with strong
current no contractions were observed (Rowbottom 1984).
Direct current was instrumental in discoveries made in the field of neurophysiology
and the field of electrophysiology was on the rise during the 19th century. But in the field
of electrotherapy a consensus was not reached regarding its beneficial contribution.
1.2.4 The use of direct current in electrotherapy
Early experiments with direct current from the voltaic pile were performed by Volta
on himself (Rowbottom 1984). He discovered that muscles could be contracted and
senses stimulated. He placed the two ends of the pile on his tongue to stimulate taste
and excited the optic nerve by touching one end of the pile to the eyeball and the other
to various areas of the face resulting in a perception of a flash. He noted that connection
to the body is improved when the area is initially moistened. Volta mentioned that
Page 32
Chapter 1: Introduction
18
shock could be felt only when the circuit was closed or broken. If contact was
maintained after the circuit was closed, pain would ensue several minutes later. He
attempted to stimulate the auditory nerve by placing the end of the pile to his ears, but
found that the shock was too uncomfortable and resulted in noise sounds (Rowbottom
1984).
In the late 18th century and early 19th century the use of galvanism with two different
metals and later with the voltaic pile was becoming common practice (Rowbottom
1984). In the early 1800s galvanism was reported successful in some cases of paralysis
and in treatment of pain. Contact breakers were invented and used in the treatment of
deafness (Rowbottom 1984). Resuscitation of individuals who drowned or asphyxiated
and later during surgeries was explored (Geddes, 1984).
Two extensive accounts of the uses of DC were published. In 1804, Charles H.
Wilkinson, an English surgeon and a pioneer in the use of galvanism in medicine,
published Elements of Galvanism in Theory and Practice, where he devotes several
sections to the application of galvanism in medicine, including a description of the
equipment he used and developed (Thornton, 2006). In 1826 Michael La Beaume, a
London surgeon published his work and recommendations on the use of galvanism
(Geddes, 1984). This body of work was translated to French and influenced the
development of electropuncture, the delivery of direct current via acupuncture needles
(Rowbottom 1984). Chinese acupuncture was introduced in France at that time and the
use of electropuncture to alleviate pain was published by Sarlandière, a French
anatomist and physiologist, in 1825 (Stillings, 1975) and accepted as a treatment
method. This method was later adopted by Magendie who used needles to deliver both
direct and induced current in his experiments (Rowbottom 1984).
In the 1830s, Guillaume Benjamin Armand Duchenne, a Parisian medical doctor,
conducted his first experiment with electrical stimulation on patient who suffered
neuralgia (Rowbottom 1984). Familiar with Magendie’s work on nerve stimulation with
needles, Duchanne started his scientific exploration with electropuncture and later,
introduced the methods of single muscle simulation using electrodes place on the skin.
He opposed the use of direct current in muscle and nerve stimulation but suggested
that it would be useful for cauterization during surgery and as a method to warm
acupuncture point (Rowbottom 1984).
A contemporary of Duchenne, Robert Remak, a physician in Prussia, preferred the
use of direct current and applied it on such cases as paralysis, contractures, rheumatism
and arthritis (Rowbottom 1984). He discovered that better outcomes were achieved in
cases of rheumatic conditions where inflammation was involved and concluded that
galvanic current had a catalytic action. This would prove to be true in 1900 when
Stéphane Leduc, a French Physician, demonstrated that Strychnine ions could penetrate
the skin by means of galvanic stimulation (Rowbottom 1984).
In the mid 1840’s the use of DC as a diagnostic tool commenced (Rowbottom 1984).
The first to use galvanic current in this manner was Marshal Hall, an English physician
and physiologist who used it to settle an argument of the time on whether paralyzed
muscle could be stimulated. In the late 1860s, Wilhelm Heinrich Erb, a German
physician, investigated the “reaction of degeneration” by means of direct and faradic
Page 33
Chapter 1: Introduction
19
currents and demonstrated that the phenomenon occurred only when lesions were in
the spinal cord and peripheral nerves (Rowbottom 1984).
One of the most famous experiments conducted with DC was carried out in 1870 by
Hitzig and Fritsch, German neurologists, who used it to demonstrate the localization
function of the brain (Hagner, 2012). Hitzig specialized in galvanic therapy, used it to
alleviate pain and developed his own electrodes.
In the 1930s electroshock was introduced as a treatment for depression by Ugo
Cerletti, an Italian neurologist (Rowbottom 1984). This was initially demonstrated by
Aldini, Glavani’s nephew, who explored the use of direct current stimulation on the
brain and reported that it improved melancholy.
The most common uses of galvanic therapy since its invention in the mid-19th
century has been to alleviate pain, where DC was being passed through the body with a
very low current (Geddes, 1984). An electric bath has been used, ostensibly for the
“removal of poison and metallic ions from the body” by immersing the individual in
water and passing current through the bath water. Further uses of galvanism included
resuscitation and cautery during surgery and the use of elecropuncture for the removal
of warts and moles (Geddes, 1984).
Today direct current is most commonly used for wound and bone fracture healing
(Friedenberg et al., 1971; Kloth & McCulloch, 1996; Kuzyk & Schemitsch, 2009; Victoria
et al., 2009) and galvanic vestibular stimulation is used as a research tool for whole body
balance (Fitzpatrick & Day, 2004; Carmona et al., 2011; Curthoys & Macdougall, 2012).
In the 1960’s there was an interest in brain stimulation with DC and in the last 5 years
this has been rekindled with the introduction of transcranial DC stimulation (tDCS). It is
being evaluated as a treatment for different neurological conditions and is used as a
research technique into mechanisms of excitability in the brain (Schulz et al., 2012)
1.2.5 The use of direct current to block nerve conduction
As mentioned earlier it was Pflüger who demonstrated in 1859 that nerve block can
be achieved using DC stimulation. By the early 20th century several methods of nerve
block were known, such as crush, local anesthetics (e.g., ether vapors) and hypoxia
(Grerard, 1931). It was recognized that the block could be reversible once the blocking
agent is removed (Grerard, 1931) and that nerve integrity must be maintained in order
for impulse propagation to occur (Adrian, 1914).
In the 1930s onwards the technique of large nerve fiber block using DC was used to
study small nerve fibers (Kuffler & Gerard, 1947; Manfredi, 1970). In the 1960s research
conducted on C fibers with this method contributed to the development of the gate
theory of pain (Mendell & Wall, 1964). In 1975 Whitwam and Kidd studied the effect of
DC on conduction in peripheral nerves. Their results indicated that after a certain
duration of DC application the block could not be reversed. They concluded that nerve
damage ensued and recommended that this technique should not be used in a clinical
setting where complete recovery is necessary (Whitwam & Kidd, 1975).
Page 34
Chapter 1: Introduction
20
Whitwam and Kidd’s observations were supported by results of studies exploring the
use of a DC stimulator for nerve explorations in clinical applications (Hughes et al.,
1981). In these studies myelin and axonal degeneration were observed when the
stimulator came in contact with the nerve for long durations, though it was
demonstrated that in surgical applications, damage is most likely avoided due to the
short durations of the stimulator’s use (estimated one second contact with the nerve)
(Hughes et al., 1981). Under appropriate conditions, the use of a DC stimulator for nerve
exploration was considered safe (Chase et al., 1984).
The technique of selectively blocking nerves with DC (Fukushima et al., 1975;
Petruska et al., 1998) or with high frequency alternating current, whereby DC was used
to block neuronal firing at the onset of the high-frequency current (Ackermann et al.,
2011b, a) was further explored with the intention of avoiding nerve damage. Recently,
the mechanisms underlying DC conduction block have been studied (Bhadra & Kilgore,
2004; Tai et al., 2009). It was found that DC block is most likely due to continuous
depolarization of axons under the cathode.
1.3 Electrochemistry and considerations for electrodes used
with direct current
An electrode is defined as an electronic conductor which makes contact with part of
a circuit that is not metallic. When an electrode is placed in biological tissue and current
is delivered, several processes take place. Initially an interface develops between the
electrode and the extracellular fluid (ECF) and a charged double layer is created. The
charge carriers in the electrode are electrons, while carriers in the ECF are ions (e.g.
sodium, chloride). When current is carried by two different substances in two phases,
chemical reactions at the electrodes are necessary in order to ensure continuation of
charge flow. This process is called electrode reaction.
1.3.1 The interface between electrode and electrolyte
Placing an electrode in an electrolyte (whether biological or otherwise) brings two
different phases into contact resulting in changes to their surface layers while an
interface develops between the phases. Transient processes occur at the interface
including charge transfer across the electrode, eventually resulting in a double layer
(typically 0.1 to 0.4nm wide) with a potential difference due to redistribution of charged
particles (Bagotsky, 2005). Charge redistribution in the metal results in electrons
accumulating on the electrode’s surface next to the interface, forming a tight layer of
charged particles. In the solution, a concentration gradient is formed, ions of opposite
charge are adsorbed and an opposite charged layer next to the electrode is created in
the solution. While the electrons cannot leave the metal, the ions are able to move a
small distance away from the surface. The entire double layer can be modeled as a
Page 35
Chapter 1: Introduction
21
capacitor with high capacitance (10-20 µF/cm2) due to the small distance between the
charged layers (Brummer et al., 1983; Bagotsky, 2005; Merrill et al., 2005; Merrill, 2011).
Faraday’s first law of electrolysis states that the mass of a substance produced in
electrolysis is directly proportional to the quantity of electricity (charge, measured in
coulombs) delivered at the electrode. Therefore, when transient currents occur
resulting in charge accumulation on the interface, a deviation from Faraday’s law is
observed. The resulting current is called a non-faradic or charging current (Bagotsky,
2005).
1.3.2 The electrode reaction
When current is delivered through an electrode placed in an electrolyte, non-faradic
as well as faradic currents occur where charge crosses the electrode into the electrolyte.
The resulting electrode reaction ensures the current will flow across the interface. There
are two types of electrode reactions: oxidization and reduction. The oxidization reaction
occurs at the anode (anodic reaction) and involves withdrawal of an electron from a
substance. Reduction occurs at the cathode (cathodic reaction) and involves electron
addition.
Electrode reactions can be reversible or irreversible. Most reactions are reversible
and will occur in the opposite direction once the direction of the current is reversed.
When no new species are formed, the reaction is non-faradic and results in the
redistribution of charge. If electron transfer does occur in a reversible reaction, the
reaction products remain attached to the electrode surface. An example of this type of
reaction would be oxide formation on an electrode. Irreversible reactions result in
products that cannot revert to their original form when the current direction is
reversed. This could be due to the solubility of the reaction product in the electrolyte or
the evolution of a gas. An example of an irreversible reaction is electrolysis and
formation of hydrogen gas at the cathode.
Irreversible reactions may result in changes to the electrode and surrounding
biological tissue. In the case of reduction of water, the reaction results in the formation
of hydrogen gas and hydroxyl ions. The latter contribute to change in the tissue’s pH
level (Brummer et al., 1983; Bagotsky, 2005; Merrill et al., 2005).
1.3.3 Electrode materials
There are two types of electrodes: reacting electrodes which are chemically involved
in the reaction and non-consumable electrodes or inert electrodes that do not
participate in the electrode reaction but are the source of the electrons for the reaction
(Bagotsky, 2005). When choosing an electrode for neural tissue stimulation, aspects
such as tissue reaction, electrode impedance and corrosion resistance should be taken
into consideration. Electrode material should be biocompatible and result in minimal
inflammatory response. Stainless steel and Platinum which are non-consumable
electrodes, demonstrated a small tissue response (Geddes & Roeder, 2003). Stainless
Page 36
Chapter 1: Introduction
22
steel contains nickel which makes it a potential allergen that quickly corrodes and hence
is less suitable for long term implantation. Platinum and Pt-Ir are not allergenic, have a
low electrode impedance and high corrosion resistivity and are therefore widely used in
implantable systems such as cardiac pacemakers and cochlear implants (Geddes &
Roeder, 2003; Merrill et al., 2005).
1.3.4 Considerations for electrical stimulation of biological tissue
Since faradic reactions may result in damage to the electrode and surrounding tissue,
much effort was made to describe stimulation parameters that are considered safe.
Monophasic pulses tested on brain tissue of monkeys proved to result in damage
presented as reduced neuronal excitability (Lilly et al., 1952). Experiments carried out on
cats showed that monophasic stimulation resulted in damage defined by the breakage
of the blood brain barrier, while biphasic charge-balanced stimulation demonstrated no
such result (Mortimer et al., 1970). Agnew and McCreary showed that prolonged
biphasic stimulation may still result in nerve damage, depending on the stimulation
parameters (Agnew & McCreery, 1990). Increase in stimulation threshold of myelinated
fibers, loss of nerve fibers and edema resulted when high frequency (50Hz) pulses were
applied as opposed to low frequency pulses (20Hz), even when the total charge
delivered was identical. The results indicated that several parameters were influencing
the occurrence of nerve damage and it was shown that the relationship between charge
density and charge per phase could indicate when damage would emerge (Agnew et al.,
1989; Agnew & McCreery, 1990; McCreery et al., 1990). Their work, as well as others’
work is summed up in Figure 1.3, reproduced with modifications from Merrill et al.
2005.
Figure 1.3: Charge density and charge per phase. This graph shows the relationship between the
amount of charge delivered per phase to the charge density and the safe regions of stimulation.
The red triangle shows the area where nerve damage was shown to occur. Reproduced with
modifications from Merrill et al. 2005.
Page 37
Chapter 1: Introduction
23
1.3.5 Mechanisms of damage
The exact mechanisms responsible for tissue damage created by electrical
stimulation is still not fully understood but several mechanisms were identified including
neuronal hyperactivity, burn due to heating and toxic effects of the products of the
electrode reaction (Dymond, 1976; Scheiner et al., 1990; Merrill et al., 2005; Stecker et
al., 2006).
Neuronal hyperactivity occurs when the nerve is over-stimulated resulting in neurons
firing for a prolonged duration. This theory is supported by Agnew and McCreary’s work.
They showed that only myelinated fibers were injured during damaging stimulation and
suggested that this pattern of damage was likely due to hyper-activity rather than other
mechanisms (Agnew & McCreery, 1990). Other investigators showed that damage is
most probably caused by species produced during the electrode reaction (Ackermann et
al., 2011b).
Electrical burns may result from increased temperatures of the tissue immediately
adjacent to the electrode during stimulation, though this issue is controversial (Scheiner
et al., 1990; Stevenson et al., 2010). Heating can be considered as one of the effects of
the electrode reactions. Several other products of the electrode reaction may contribute
to nerve damage. Hydrolysis of water molecules resulting in shifts in pH can change the
nerve environment to be more alkaline (Cathode) or acidic (Anode) (Brummer et al.,
1983; Scheiner et al., 1990). Irreversible reactions occurring at the electrode surface can
have numerous effects on the biological tissue during stimulation. These include
changes to the electrode due to development of a film on the electrode itself which may
result in higher current densities (Dymond, 1976) and dissolution of metal and electrode
corrosion that may be toxic to the surrounding tissue (Brummer et al., 1983). Lastly,
oxidization of inorganic particles such as chlorine at the anode may contribute to the
acidic environment created around the anode (Brummer et al., 1983; Berendson &
Simonsson, 1994).
1.4 Neurolytic blocks
The use of neurolytic agents is well documented and used for treatment of pain and
neurological disorders such as spasticity. There are several neurolytic techniques applied
to treat numerous conditions. Phenol, alcohol and BtA were previously described in this
chapter, the other techniques are: conventional radio frequency (CRF), pulsed
radiofrequency (PRF), and cryoablation.
CRF and PRF operate by creating a thermal lesion. They are applied to nociceptive
pathways for the purpose of pain control. CRF in the range of 55o to 70o is used on
dorsal root ganglia. PRF, considered safer since heat generation does not exceed 42o, is
often preferred to CRF (Khalid, 2011), but was shown to result in nerve structural
damage (Erdine et al., 2009) probably due to combined electrical and thermal injury.
Page 38
Chapter 1: Introduction
24
Complications include nerve damage and infection from needle insertion as well as
burns from erroneous placement of the grounding pad (Khalid, 2011).
Cryoablation is used mostly for the relief of post-thoracotomy pain. Localized
freezing of intercostal muscles by application of a cryprobe, with its tip cooled to -50o to
-70o, is achieved, resulting in reduced usage of post-operative analgesics. Cryoanalgesia
may lead to nerve damage but is not associated with neuromas, since the epineurium
and perineurium remain intact. Side effects may include: respiratory depression, nausea
(Moorjani et al., 2001) and possibly neuropathic pain (Myers et al., 1996).
Neurolytic treatments, specifically radiofrequency and alcohol, were shown to be
effective for the treatment of cancer pain. There is still controversy regarding its
usefulness in treating benign chronic pain and it is advised to exhaust other treatments
first (Jackson & Gaeta, 2008). Neurolytic treatments such as phenol and alcohol work by
causing a temporary or permanent conduction block. Treatment with phenol for
example is considered safe, simple and effective (Copp et al., 1970). The side effects of
neurolytic treatments and the benefits to be gained from them such as elimination of
clonus, improved range of motion (ROM), improved gait, reduction of pain, reduced cost
and the ability to repeat the treatments more often than BtA were reviewed in detail in
Horn et al. 2010.
1.5 Dissertation objectives and outline
The purpose of the work presented in this thesis was to explore the feasibility of the
use of DC as a novel treatment for spastic hypertonus in order to cause a partial nerve
lesion . Three studies were conducted and are presented in the following sections. This
report concludes with a final chapter in which the results are discussed and future
research directions are suggested.
Chapter 2: This chapter describes proof of principle experiments in which DC was
used to cause a controlled nerve lesion resulting in graded attenuation of muscle force.
Acute and chronic experiments are described with various current amplitudes and
durations, as well as histological results.
Chapter 3: Further exploration of DC amplitudes and durations are presented for the
purpose of determining parameters that would be clinically suitable and effective in
achieving force gradation and could be clinically suitable. Furthermore, acute
experiments conducted for the purpose of elucidating possible mechanisms of damage
are presented.
Chapter 4: DC nerve block and ablation in chronically implanted animals are
described. Experiments were carried out on anesthetized as well as awake animals.
Detailed descriptions of electrodes developed for the purpose of DC delivery in the
conscious animal are presented.
Page 39
Chapter 1: Introduction
25
Chapter 5: This chapter includes a summary of the results of my thesis work with a
discussion regarding the implication of the findings and the possibility for clinical
applications. Future directions are discussed.
Page 40
Chapter 1: Introduction
26
1.6 References
Ackermann DM, Jr., Bhadra N, Foldes EL & Kilgore KL. (2011a). Conduction block of
whole nerve without onset firing using combined high frequency and direct
current. Medical & biological engineering & computing 49, 241-251.
Ackermann DM, Jr., Bhadra N, Foldes EL & Kilgore KL. (2011b). Separated interface
nerve electrode prevents direct current induced nerve damage. J Neurosci
Methods 201, 173-176.
Adams MM & Hicks AL. (2005). Spasticity after spinal cord injury. Spinal cord 43, 577-
586.
Adrian ED. (1914). The all-or-none principle in nerve. J Physiol 47, 460-474.
Agnew WF & McCreery DB. (1990). Considerations for safety with chronically implanted
nerve electrodes. Epilepsia 31 Suppl 2, S27-32.
Agnew WF, McCreery DB, Yuen TG & Bullara LA. (1989). Histologic and physiologic
evaluation of electrically stimulated peripheral nerve: considerations for the
selection of parameters. Annals of biomedical engineering 17, 39-60.
Awaad Y, Rizk T, Siddiqui I, Roosen N, McIntosh K & Waines GM. (2012). Complications
of intrathecal baclofen pump: prevention and cure. ISRN neurology 2012,
575168.
Bagotsky VS. (2005). Fundamentals of Electrochemistry. John Wiley & Sons, Inc,
Hoboken, NJ, USA.
Baigrie B. (2007). Electricity and Magnetism. A Historical Perspective. Greenwood Press,
Westport, Connecticut.
Bennett DJ, Sanelli L, Cooke CL, Harvey PJ & Gorassini MA. (2004). Spastic long-lasting
reflexes in the awake rat after sacral spinal cord injury. Journal of
neurophysiology 91, 2247-2258.
Page 41
Chapter 1: Introduction
27
Berendson J & Simonsson D. (1994). Electrochemical aspects of treatment of tissue with
direct current. The European journal of surgery Supplement : = Acta chirurgica
Supplement, 111-115.
Bhadra N & Kilgore KL. (2004). Direct current electrical conduction block of peripheral
nerve. IEEE Trans Neural Syst Rehabil Eng 12, 313-324.
Bollens B, Deltombe T, Detrembleur C, Gustin T, Stoquart G & Lejeune TM. (2011).
Effects of selective tibial nerve neurotomy as a treatment for adults presenting
with spastic equinovarus foot: a systematic review. J Rehabil Med 43, 277-282.
Boulenguez P, Liabeuf S, Bos R, Bras H, Jean-Xavier C, Brocard C, Stil A, Darbon P,
Cattaert D, Delpire E, Marsala M & Vinay L. (2010). Down-regulation of the
potassium-chloride cotransporter KCC2 contributes to spasticity after spinal
cord injury. Nature medicine 16, 302-307.
Bovend'Eerdt TJ, Newman M, Barker K, Dawes H, Minelli C & Wade DT. (2008). The
effects of stretching in spasticity: a systematic review. Arch Phys Med Rehabil
89, 1395-1406.
Brashear A & Elovic E. (2010). Why is spasticity important? In Spasticity : Diagnosis and
Management, ed. Brashear AE, Elie pp. 466. Demos Medical Publishing New
York, NY, USA
Brashear A, Gordon MF, Elovic E, Kassicieh VD, Marciniak C, Do M, Lee CH, Jenkins S &
Turkel C. (2002). Intramuscular injection of botulinum toxin for the treatment of
wrist and finger spasticity after a stroke. The New England journal of medicine
347, 395-400.
Brazier MA. (1957). Rise of neurophysiology in the 19th century. Journal of
neurophysiology 20, 212-226.
Brogardh C, Flansbjer UB & Lexell J. (2012). No specific effect of whole-body vibration
training in chronic stroke: a double-blind randomized controlled study. Arch
Phys Med Rehabil 93, 253-258.
Brown P. (1994). Pathophysiology of spasticity. Journal of neurology, neurosurgery, and
psychiatry 57, 773-777.
Page 42
Chapter 1: Introduction
28
Brummer SB, Robblee LS & Hambrecht FT. (1983). Criteria for selecting electrodes for
electrical stimulation: theoretical and practical considerations. Annals of the
New York Academy of Sciences 405, 159-171.
Caliandro P, Celletti C, Padua L, Ileana M, Giusy R, Granata G, La Torre G, Enrico G &
Camerota F. (2012). Focal muscle vibration in the treatment of upper limb
spasticity: a pilot randomized controlled trial in chronic stroke patients. Arch
Phys Med Rehabil.
Carmona S, Ferrero A, Pianetti G, Escola N, Arteaga MV & Frankel L. (2011). Galvanic
vestibular stimulation improves the results of vestibular rehabilitation. Annals of
the New York Academy of Sciences 1233, E1-7.
Centers for Disease Control. (2003). Hospitalizations for stroke among adults aged over
65 years - United States 2000. JAMA 290, 1023-1024.
Chase SG, Hughes GB & Dudley AW, Jr. (1984). Neuropathologic changes following
direct-current stimulation of the rat sciatic nerve. Otolaryngology--head and
neck surgery : official journal of American Academy of Otolaryngology-Head and
Neck Surgery 92, 615-617.
Copp EP, Harris R & Keenan J. (1970). Peripheral nerve block and motor point block with
phenol in the management of spasticity. Proc R Soc Med 63, 937-938.
Curthoys IS & Macdougall HG. (2012). What Galvanic Vestibular Stimulation Actually
Activates. Frontiers in neurology 3, 117.
Davidoff RA. (1985). Antispasticity drugs: mechanisms of action. Annals of neurology 17,
107-116.
De Koninck Y. (2007). Altered chloride homeostasis in neurological disorders: a new
target. Current opinion in pharmacology 7, 93-99.
Denny-Brown D. (1980). Historical Aspect of the relation of Spasticity to Movement. In
Spasticity: Disordered Motor Control, ed. Feldman RY, RR; Koella, WP, pp. 510.
Symposia Specialists Inc. Medical Books, Chicago.
Dewald JP, Pope PS, Given JD, Buchanan TS & Rymer WZ. (1995). Abnormal muscle
coactivation patterns during isometric torque generation at the elbow and
shoulder in hemiparetic subjects. Brain 118 ( Pt 2), 495-510.
Page 43
Chapter 1: Introduction
29
Dietz V & Sinkjaer T. (2007). Spastic movement disorder: impaired reflex function and
altered muscle mechanics. Lancet neurology 6, 725-733.
Dolly JO & Aoki KR. (2006). The structure and mode of action of different botulinum
toxins. Eur J Neurol 13 Suppl 4, 1-9.
Dymond AM. (1976). Characteristics of the metal-tissue interface of stimulation
electrodes. IEEE Trans Biomed Eng 23, 274-280.
Elbasiouny SM, Moroz D, Bakr MM & Mushahwar VK. (2010). Management of spasticity
after spinal cord injury: current techniques and future directions.
Neurorehabilitation and neural repair 24, 23-33.
Elia AE, Filippini G, Calandrella D & Albanese A. (2009). Botulinum neurotoxins for post-
stroke spasticity in adults: a systematic review. Mov Disord 24, 801-812.
Elovic E. (2001). Principles of pharmaceutical management of spastic hypertonia.
Physical medicine and rehabilitation clinics of North America 12, 793-816, vii.
Elovic EP, Brashear A, Kaelin D, Liu J, Millis SR, Barron R & Turkel C. (2008). Repeated
treatments with botulinum toxin type a produce sustained decreases in the
limitations associated with focal upper-limb poststroke spasticity for caregivers
and patients. Arch Phys Med Rehabil 89, 799-806.
Elovic EP, Esquenazi A, Alter KE, Lin JL, Alfaro A & Kaelin DL. (2009). Chemodenervation
and nerve blocks in the diagnosis and management of spasticity and muscle
overactivity. Pm R 1, 842-851.
Erdine S, Bilir A, Cosman ER & Cosman ER, Jr. (2009). Ultrastructural changes in axons
following exposure to pulsed radiofrequency fields. Pain practice : the official
journal of World Institute of Pain 9, 407-417.
Esquenazi A. (2006). Improvements in healthcare and cost benefits associated with
botulinum toxin treatment of spasticity and muscle overactivity. Eur J Neurol 13
Suppl 4, 27-34.
Esquenazi A, Mayer NH, Elia AE & Albanese A. (2009). Botulinum toxin for the
management of adult patients with upper motor neuron syndrome. Toxicon :
official journal of the International Society on Toxinology 54, 634-638.
Page 44
Chapter 1: Introduction
30
Fitzpatrick RC & Day BL. (2004). Probing the human vestibular system with galvanic
stimulation. J Appl Physiol 96, 2301-2316.
Fortuna R, Vaz MA, Youssef AR, Longino D & Herzog W. (2011). Changes in contractile
properties of muscles receiving repeat injections of botulinum toxin (Botox). J
Biomech 44, 39-44.
Frangiamore J & O`Brien C. (2004). Pharmacology of Phenol Injections. In Dystonia:
Etiology, Clinical Geatures, and Treatment, ed. Mitchell F. Brin CLc, Joseph
Jankovic, pp. 113-118. Lippincott Williams & Wilkins, Philadelphia.
Friedenberg ZB, Roberts PG, Jr., Didizian NH & Brighton CT. (1971). Stimulation of
fracture healing by direct current in the rabbit fibula. The Journal of bone and
joint surgery American volume 53, 1400-1408.
Fukushima K, Yahara O & Kato M. (1975). Differential blocking of motor fibers by direct
current. Pflugers Archiv : European journal of physiology 358, 235-242.
Gan LS. (2009). The stimulus router system: A novel neural prosthesis. In Biomedical
Engineering, pp. 168. University of Alberta, Edmonton, Alberta, Canada.
Geddes LA. (1984). A short history of the electrical stimulation of excitable tissue.
Including electrotherapeutic applications. The Physiologist 27, S1-47.
Geddes LA & Hoff HE. (1971). The discovery of bioelectricity and current electricity. The
Glavani-Volta controversy. IEEE spectrum 8, 38-46.
Geddes LA & Roeder R. (2003). Criteria for the selection of materials for implanted
electrodes. Annals of biomedical engineering 31, 879-890.
Gelber DA, Good DC, Dromerick A, Sergay S & Richardson M. (2001). Open-label dose-
titration safety and efficacy study of tizanidine hydrochloride in the treatment
of spasticity associated with chronic stroke. Stroke 32, 1841-1846.
Gelber DA & Jozefczyk PB. (1999). Therapeutics in the Management of Spasticity.
Neurorehabilitation and neural repair 13, 5-14.
Goldstein EM. (2001). Spasticity management: an overview. J Child Neurol 16, 16-23.
Page 45
Chapter 1: Introduction
31
Gracies JM. (2001). Physical modalities other than stretch in spastic hypertonia. Physical
medicine and rehabilitation clinics of North America 12, 769-792, vi.
Gracies JM. (2004). Physiological effects of botulinum toxin in spasticity. Mov Disord 19
Suppl 8, S120-128.
Gracies JM. (2005a). Pathophysiology of spastic paresis. I: Paresis and soft tissue
changes. Muscle Nerve 31, 535-551.
Gracies JM. (2005b). Pathophysiology of spastic paresis. II: Emergence of muscle
overactivity. Muscle Nerve 31, 552-571.
Gracies JM, Elovic E, McGuire J & Simpson DM. (1997a). Traditional pharmacological
treatments for spasticity. Part I: Local treatments. Muscle Nerve Suppl 6, S61-91.
Gracies JM, Nance P, Elovic E, McGuire J & Simpson DM. (1997b). Traditional
pharmacological treatments for spasticity. Part II: General and regional
treatments. Muscle Nerve Suppl 6, S92-120.
Grerard RW. (1931). Nerve Conduction in Relation to Nerve Structure. hicago Journals
University of Chicago Press 6, 59-83.
Hagbarth KE, Wallin G & Lofstedt L. (1973). Muscle spindle responses to stretch in
normal and spastic subjects. Scandinavian journal of rehabilitation medicine 5,
156-159.
Hagner M. (2012). The electrical excitability of the brain: toward the emergence of an
experiment. Journal of the history of the neurosciences 21, 237-249.
Heckman CJ, Johnson M, Mottram C & Schuster J. (2008). Persistent inward currents in
spinal motoneurons and their influence on human motoneuron firing patterns.
The Neuroscientist : a review journal bringing neurobiology, neurology and
psychiatry 14, 264-275.
Heijnen IC, Franken RJ, Bevaart BJ & Meijer JW. (2008). Long-term outcome of
superficialis-to-profundus tendon transfer in patients with clenched fist due to
spastic hemiplegia. Disability and rehabilitation 30, 675-678.
Page 46
Chapter 1: Introduction
32
Heilbron JL. (1979). Electricity in the 17th and 18th centuries: A study of early modern
physics. University of California Press, Berkely and Los Angeles, California.
Hidler JM & Rymer WZ. (1999). A simulation study of reflex instability in spasticity:
origins of clonus. IEEE transactions on rehabilitation engineering : a publication
of the IEEE Engineering in Medicine and Biology Society 7, 327-340.
Hinderer SR & Dixon K. (2001). Physiologic and clinical monitoring of spastic hypertonia.
Physical medicine and rehabilitation clinics of North America 12, 733-746.
Hoff HE. (1936). Galvani and pre-Galvanian electrophysiologists. Annals of Science 1,
157-172.
Horn LJ, Singh G & Dabrowski ER. (2010). Chemoneurolysis with Phenol and Alcohol. In
Spasticity : Diagnosis and Management, ed. Brashear AE, Elie, pp. 466. Demos
Medical Publishing New York, NY, USA
Hughes GB, Bottomy MB, Jackson CG, Glasscock ME, 3rd & Sismanis A. (1981). Myelin
and axon degeneration following direct current peripheral nerve stimulation: a
prospective controlled experimental study. Otolaryngology--head and neck
surgery : official journal of American Academy of Otolaryngology-Head and Neck
Surgery 89, 767-775.
Jackson TP & Gaeta R. (2008). Neurolytic blocks revisited. Current pain and headache
reports 12, 7-13.
Kandel ER, Schwartz JS & Jessell TM. (2000). Principles of Neural Science McGraw-Hill
Health Professions Division.
Keenan MA, Korchek JI, Botte MJ, Smith CW & Garland DE. (1987). Results of transfer of
the flexor digitorum superficialis tendons to the flexor digitorum profundus
tendons in adults with acquired spasticity of the hand. The Journal of bone and
joint surgery American volume 69, 1127-1132.
Khalid MM. (2011). Chapter 60 – Pulsed radiofrequency, water-cooled radiofrequency,
and cryoneurolysis. In Essentials of Pain Medicine, ed. B HT, pp. 664. Elsevier Inc,
Philadelphia, PA.
Kheder A & Nair KP. (2012). Spasticity: pathophysiology, evaluation and management.
Practical neurology 12, 289-298.
Page 47
Chapter 1: Introduction
33
Kirazli Y, On AY, Kismali B & Aksit R. (1998). Comparison of phenol block and botulinus
toxin type A in the treatment of spastic foot after stroke: a randomized, double-
blind trial. Am J Phys Med Rehabil 77, 510-515.
Kita M & Goodkin DE. (2000). Drugs used to treat spasticity. Drugs 59, 487-495.
Kloth LC & McCulloch JM. (1996). Promotion of wound healing with electrical
stimulation. Advances in wound care : the journal for prevention and healing 9,
42-45.
Kofler M, Quirbach E, Schauer R, Singer M & Saltuari L. (2009). Limitations of intrathecal
baclofen for spastic hemiparesis following stroke. Neurorehabilitation and
neural repair 23, 26-31.
Kong KH, Lee J & Chua KS. (2012). Occurrence and temporal evolution of upper limb
spasticity in stroke patients admitted to a rehabilitation unit. Arch Phys Med
Rehabil 93, 143-148.
Kuffler SW & Gerard RW. (1947). The small-nerve motor system to skeletal muscle.
Journal of neurophysiology 10, 383-394.
Kuzyk PR & Schemitsch EH. (2009). The science of electrical stimulation therapy for
fracture healing. Indian journal of orthopaedics 43, 127-131.
Lance J. (1980). Pathophysiology of spasticity and clinical experi-ence with Baclofen. In
Spasticity: Disordered motor control, ed. Feldman RG, Young RR & Koella WP,
pp. 510. Symposia Specialists Inc. Medical books, Chicago.
Lannin NA, Horsley SA, Herbert R, McCluskey A & Cusick A. (2003). Splinting the hand in
the functional position after brain impairment: a randomized, controlled trial.
Arch Phys Med Rehabil 84, 297-302.
Lapeyre E, Kuks JB & Meijler WJ. (2010). Spasticity: revisiting the role and the individual
value of several pharmacological treatments. NeuroRehabilitation 27, 193-200.
Lilly JC, Austin GM & Chambers WW. (1952). Threshold movements produced by
excitation of cerebral cortex and efferent fibers with some parametric regions of
rectangular current pulses (cats and monkeys). Journal of neurophysiology 15,
319-341.
Page 48
Chapter 1: Introduction
34
Lundstrom E, Terent A & Borg J. (2008). Prevalence of disabling spasticity 1 year after
first-ever stroke. Eur J Neurol 15, 533-539.
Manfredi M. (1970). Differential block of conduction of larger fibers in peripheral nerve
by direct current. Archives italiennes de biologie 108, 52-71.
Mayer NH. (2010). Spasticity and Other Signs of Upper Motor Neuron Syndrome. In
Spasticity : Diagnosis and Management, ed. Brashear AE, Elie, pp. 466. Demos
Medical Publishing New York, NY, USA
Maynard FM, Karunas RS & Waring WP, 3rd. (1990). Epidemiology of spasticity following
traumatic spinal cord injury. Arch Phys Med Rehabil 71, 566-569.
McCreery DB, Agnew WF, Yuen TG & Bullara L. (1990). Charge density and charge per
phase as cofactors in neural injury induced by electrical stimulation. IEEE Trans
Biomed Eng 37, 996-1001.
McGuire JR. (2001). Effective use of chemodenervation and chemical neurolysis in the
management of poststroke spasticity. Top Stroke Rehabil 8, 47-55.
Mendell LM & Wall PD. (1964). Presynaptic Hyperpolarization: A Role for Fine Afferent
Fibres. J Physiol 172, 274-294.
Merrill DR. (2011). The Electrode-Matreials and configuration. In Essential
Neuromodulation, 1st edn, ed. Arle JE & Shils JL, pp. 504. Academic Press,
London, Burlington MA, San Diego, CA.
Merrill DR, Bikson M & Jefferys JG. (2005). Electrical stimulation of excitable tissue:
design of efficacious and safe protocols. J Neurosci Methods 141, 171-198.
Meythaler JM, Guin-Renfroe S, Brunner RC & Hadley MN. (2001). Intrathecal baclofen
for spastic hypertonia from stroke. Stroke 32, 2099-2109.
Montane E, Vallano A & Laporte JR. (2004). Oral antispastic drugs in nonprogressive
neurologic diseases: a systematic review. Neurology 63, 1357-1363.
Moorjani N, Zhao F, Tian Y, Liang C, Kaluba J & Maiwand MO. (2001). Effects of
cryoanalgesia on post-thoracotomy pain and on the structure of intercostal
Page 49
Chapter 1: Introduction
35
nerves: a human prospective randomized trial and a histological study.
European journal of cardio-thoracic surgery : official journal of the European
Association for Cardio-thoracic Surgery 20, 502-507.
Mortimer JT, Shealy CN & Wheeler C. (1970). Experimental nondestructive electrical
stimulation of the brain and spinal cord. Journal of neurosurgery 32, 553-559.
Moruzzi G. (1996). The electrophysiological work of Carlo Matteucci. 1964. Brain
research bulletin 40, 69-91.
Myers RR, Heckman HM & Powell HC. (1996). Axonal viability and the persistence of
thermal hyperalgesia after partial freeze lesions of nerve. Journal of the
neurological sciences 139, 28-38.
Nielsen JB, Crone C & Hultborn H. (2007). The spinal pathophysiology of spasticity--from
a basic science point of view. Acta Physiol (Oxf) 189, 171-180.
Nielsen JB, Petersen NT, Crone C & Sinkjaer T. (2005). Stretch reflex regulation in healthy
subjects and patients with spasticity. Neuromodulation : journal of the
International Neuromodulation Society 8, 49-57.
NSCISC. (2012). Spinal Cord Injury Facts and Figures at a Glance. National Spinal Cord
Injury Statistical Center, birmingham, Alabama.
Pandyan AD, Gregoric M, Barnes MP, Wood D, Van Wijck F, Burridge J, Hermens H &
Johnson GR. (2005). Spasticity: clinical perceptions, neurological realities and
meaningful measurement. Disability and rehabilitation 27, 2-6.
Petruska JC, Hubscher CH & Johnson RD. (1998). Anodally focused polarization of
peripheral nerve allows discrimination of myelinated and unmyelinated fiber
input to brainstem nuclei. Experimental brain research Experimentelle
Hirnforschung Experimentation cerebrale 121, 379-390.
Prochazka A, Mushahwar VK & McCreery DB. (2001). Neural prostheses. J Physiol 533,
99-109.
Rizzo MA, Hadjimichael OC, Preiningerova J & Vollmer TL. (2004). Prevalence and
treatment of spasticity reported by multiple sclerosis patients. Mult Scler 10,
589-595.
Page 50
Chapter 1: Introduction
36
Roger VL, Go AS, Lloyd-Jones DM, Benjamin EJ, Berry JD, Borden WB, Bravata DM, Dai S,
Ford ES, Fox CS, Fullerton HJ, Gillespie C, Hailpern SM, Heit JA, Howard VJ,
Kissela BM, Kittner SJ, Lackland DT, Lichtman JH, Lisabeth LD, Makuc DM,
Marcus GM, Marelli A, Matchar DB, Moy CS, Mozaffarian D, Mussolino ME,
Nichol G, Paynter NP, Soliman EZ, Sorlie PD, Sotoodehnia N, Turan TN, Virani SS,
Wong ND, Woo D & Turner MB. (2012). Heart disease and stroke statistics--2012
update: a report from the American Heart Association. Circulation 125, e2-e220.
Rothwell PM. (2001). The high cost of not funding stroke research: a comparison with
heart disease and cancer. Lancet 357, 1612-1616.
Rowbottom MS, Charles. (1984). Electricity and Medicine: History of Their Interaction.
San Francisco Press San Francisco.
Scheiner A, Mortimer JT & Roessmann U. (1990). Imbalanced biphasic electrical
stimulation: muscle tissue damage. Annals of biomedical engineering 18, 407-
425.
Schiess MC, Oh IJ, Stimming EF, Lucke J, Acosta F, Fisher S & Simpson RK. (2011).
Prospective 12-month study of intrathecal baclofen therapy for poststroke
spastic upper and lower extremity motor control and functional improvement.
Neuromodulation : journal of the International Neuromodulation Society 14, 38-
45; discussion 45.
Schulz R, Gerloff C & Hummel FC. (2012). Non-invasive brain stimulation in neurological
diseases. Neuropharmacology.
SCIRE. (Version 3.0a). Epidemiology. The Spinal Cord Injury Rehabilitation Evidence
(SCIRE) project, http://www.scireproject.com/.
SCIRE. (Version 3.0b). Spasticity The Spinal Cord Injury Rehabilitation Evidence (SCIRE)
project, http://www.scireproject.com/.
Sheean G. (2002). The pathophysiology of spasticity. Eur J Neurol 9 Suppl 1, 3-9;
dicussion 53-61.
Simon O & Yelnik AP. (2010). Managing spasticity with drugs. Eur J Phys Rehabil Med 46,
401-410.
Page 51
Chapter 1: Introduction
37
Skilling HH. (1948). Exploring Electricity. Man's Unfinished Quest. The Ronald Press
Company, New York.
Sommerfeld DK, Eek EU, Svensson AK, Holmqvist LW & von Arbin MH. (2004). Spasticity
after stroke: its occurrence and association with motor impairments and activity
limitations. Stroke 35, 134-139.
Stecker MM, Patterson T & Netherton BL. (2006). Mechanisms of electrode induced
injury. Part 1: theory. American journal of electroneurodiagnostic technology 46,
315-342.
Stevenson M, Baylor K, Netherton BL & Stecker MM. (2010). Electrical stimulation and
electrode properties. Part 2: pure metal electrodes. American journal of
electroneurodiagnostic technology 50, 263-296.
Stillings D. (1975). A survey of the history of electrical stimulation for pain to 1900.
Medical instrumentation 9, 255-259.
Tai C, Roppolo JR & de Groat WC. (2009). Analysis of nerve conduction block induced by
direct current. Journal of computational neuroscience 27, 201-210.
Thornton JL. (2006). Charles Hunnings Wilkinson (1763 or 64-1850). Annals of Science
23, 277-286.
van Kuijk AA, Geurts AC, Bevaart BJ & van Limbeek J. (2002). Treatment of upper
extremity spasticity in stroke patients by focal neuronal or neuromuscular
blockade: a systematic review of the literature. J Rehabil Med 34, 51-61.
Victoria G, Petrisor B, Drew B & Dick D. (2009). Bone stimulation for fracture healing:
What's all the fuss? Indian journal of orthopaedics 43, 117-120.
Walter JS, Sacks J, Othman R, Rankin AZ, Nemchausky B, Chintam R & Wheeler JS.
(2002). A database of self-reported secondary medical problems among VA
spinal cord injury patients: its role in clinical care and management. J Rehabil
Res Dev 39, 53-61.
Ward A, Roberts G, Warner J & Gillard S. (2005). Cost-effectiveness of botulinum toxin
type a in the treatment of post-stroke spasticity. J Rehabil Med 37, 252-257.
Page 52
Chapter 1: Introduction
38
Ward AB. (2012). A literature review of the pathophysiology and onset of post-stroke
spasticity. Eur J Neurol 19, 21-27.
Watkins CL, Leathley MJ, Gregson JM, Moore AP, Smith TL & Sharma AK. (2002).
Prevalence of spasticity post stroke. Clin Rehabil 16, 515-522.
Welmer AK, von Arbin M, Widen Holmqvist L & Sommerfeld DK. (2006). Spasticity and
its association with functioning and health-related quality of life 18 months after
stroke. Cerebrovasc Dis 21, 247-253.
Whitwam JG & Kidd C. (1975). The use of direct current to cause selective block of large
fibres in peripheral nerves. Br J Anaesth 47, 1123-1133.
Wilson LR, Gandevia SC, Inglis JT, Gracies J & Burke D. (1999). Muscle spindle activity in
the affected upper limb after a unilateral stroke. Brain 122 ( Pt 11), 2079-2088.
Woo R. (2001). Spasticity: orthopedic perspective. J Child Neurol 16, 47-53.
Zafonte RD & Munin MC. (2001). Phenol and alcohol blocks for the treatment of
spasticity. Physical medicine and rehabilitation clinics of North America 12, 817-
832, vii.
Page 53
39
Chapter 2
Nerve Lesioning with Direct Current1
There are over 3 million stroke survivors in North America, about 30% of whom have
severe motor impairments (Lloyd-Jones et al., 2009). There are also about 225,000
persons with SCI in the U.S. today, over 50% of whom are quadriplegic (NSCISC, 2008).
One of the most debilitating outcomes of stroke and cervical SCI is the loss of hand
and arm function. This has a direct effect on the level of independence in activities of
daily life (ADL), often preventing the injured persons from performing basic tasks such
as eating or dressing. The reduced function of the extremities in stroke and SCI survivors
may be further complicated by the development of over-activity of the muscles
controlling the limb. This is known as spastic hypertonus. Apart from restricting the
range of motion (ROM) of voluntary movement it is also associated with painful spasms
(Rizzo et al., 2004). Spastic hypertonus develops in about 20% of stroke survivors
(Sommerfeld et al., 2004) and 65% of persons with SCI (Skold et al., 1999).
The most common treatments for hypertonus include strengthening exercises,
muscle stretching, brushing, vibration, casting, pressure splinting and transcutaneous
electrical stimulation. The efficacy of these treatments is often quite limited, variable
and of short duration (Goldstein, 2001; Bovend'Eerdt et al., 2008). Oral medications
include benzodiazepines, Dantrolene and Baclofen (Kita & Goodkin, 2000; Goldstein,
2001; O'Brien, 2002). These drugs have adverse side effects such as drowsiness, fatigue,
weakness, sedation and dizziness (Kita & Goodkin, 2000; Montane et al., 2004), and
increased risk of falling (Esquenazi, 2006). In people with SCI, Baclofen is sometimes
delivered intrathecally via an implantable pump (Barker, 2008). The dosage required is
lower than the oral dose, reducing systemic side effects, but surgery is required and
other complications such as mechanical failure of the pump and infections may occur
(Kita & Goodkin, 2000). Surgical interventions of a biomechanical type such as tendon
lengthening, tendon transfer and osteotomy (Woo, 2001) are sometimes considered
when muscle changes such as contractures or paralysis occur (Esquenazi, 2006).
Chemical denervation by injection of phenol or, more commonly, botulinum toxin
(BtA) is widely used to reduce spastic hypertonus (Kirazli et al., 1998), Phenol causes
immediate nerve block that lasts between 6 weeks and 6 months, but the injections can
1 A version of this chapter was published. Ravid EN, Gan LS, Todd K & Prochazka A. (2011). Nerve
lesioning with direct current. J Neural Eng 8, 016005 Epub 2011 Jan 19
Page 54
Chapter 2: Nerve lesioning with direct current
40
be painful and muscle atrophy can occur as a result of neurolysis, demyelination and
axonal damage (van Kuijk et al., 2002). BtA acts on motor nerves by blocking the release
of acetylcholine, thus inhibiting synaptic transmission. It has fewer side effects than
phenol (Kirazli et al., 1998). However it takes up to two weeks to act, so producing the
desired level of nerve block requires skill and experience. The most important limitation
of BtA however is the relatively short duration of its nerve-blocking effect, typically 4 to
6 months (Dolly, 2003), necessitating repeated sets of expensive injections. In this paper
we introduce a new approach to treating hypertonus by means of controlled lesioning
of nerves using direct current (DC) stimulation. Previously DC has been used in acute
physiological studies to selectively block large nerve axons (Mendell & Wall, 1964;
Whitwam & Kidd, 1975; Bhadra & Kilgore, 2004). To our knowledge, long-term nerve
ablation for clinical purposes has not been previously suggested.
The mechanism by which DC ablates axons is not well understood, however it is
known that short-duration, charge-balanced biphasic pulses involve reversible reactions
at the electrode-tissue interface (McCreery et al., 1990), while long-duration,
monophasic pulses allow time for irreversible reactions to occur (Merrill et al., 2005). DC
could be viewed as an extremely long monophasic pulse.
Here we show that the damaging effect of applying DC to a nerve can be used to
gradually lesion it, reducing in a controlled manner the motor activity transmitted by the
nerve. We suggest that this could provide an effective treatment of spastic hypertonus
in some cases.
2.1 Methods
All the procedures described below were approved by the University of Alberta
Animal Care and Use Committee.
2.1.1 Animals and surgical procedures
2.1.1.1 Acute surgical procedure
Seven white New Zealand rabbits were used in a non-recovery experimental
procedure. The animals were surgically anaesthetized using isoflurane to effect (Forane,
Baxter Corp., Toronto, ON, Canada). The left sciatic nerve was exposed through an
incision overlying the hamstrings muscle. The common peroneal nerve was separated
from the tibial nerve and transected. Two nerve cuff electrodes were attached to the
tibial nerve, approximately 1 cm apart. The cuffs each comprised a strip of silicone with
a serrated tongue at one end, designed to be inserted into a slot close to the conductive
Page 55
Chapter 2: Nerve lesioning with direct current
41
terminals (Figure 2.1A). The strip functioned like a “tie-wrap,” which was used to fix
electrodes to the nerve (Kowalczewski, 2009). The nerve cuff leads were made of
insulated multi-stranded, stainless steel wire (AS632, Cooner Wire, Chatsworth, CA)
coiled inside a silicone tube (508-003, Dow Corning Corporation, Midland, MI). The more
distal of the two cuffs, which was used to deliver DC to the nerve had a single lead
terminating in a length of bare Pt-Ir wire (0.003” A-M Systems Inc, Carlsborg, WA) which
was sewn back and forth between two sutures in the strip forming an approximate
rectangle of sides 0.3 cm and 0.5 cm (Figure 2.1A). The more proximal cuff contained
two stainless steel terminals formed by tightly coiling the bared ends of two insulated
lead wires emerging from the silastic tube around the outside of the tube (Figure 2.1B).
Each terminal was 1mm in length and the distance between them was 4mm. A third
cuff, similar to the proximal cuff but with only a single bared terminal 5mm in length,
was implanted on the tibial nerve of the contralateral leg, to serve as a control (Figure
2.1C). Finally, an indifferent (anodal) electrode comprising an insulated lead terminating
in a bare stainless steel disc 3cm in diameter was placed under the skin over the
paravertebral muscles of the lower lumbar region.
2.1.1.2 Chronic surgical procedure
In a single cat two monopolar nerve cuffs were implanted on the common peroneal
nerve of each leg. The implant surgery was performed in a fully-equipped operating
room with sterile equipment and procedures. Acepromazine (0.1 mg/kg im),
hydromorphone (0.05 mg/kg im) and glycopyrrolate (0.01 mg/kg SC) were administered
pre-operatively. The cat was then anesthetized with isoflurane and intubated using a
pediatric tracheal tube. Anesthesia was maintained with 2-3% isoflurane in carbogen at
1.5 L/min. An intravenous catheter was inserted in the cephalic vein and a saline drip
was administered. Body temperature was maintained using a warm-water heating pad.
Respiration and heart rate were monitored throughout the surgery. The legs and back
were closely shaved, cleaned with soap and swabbed with iodine solution.
The distal cuffs in the chronic implant had 5mm Pt-Ir terminals as in Figure 2.1C and
the proximal cuffs were identical, except for stainless steel terminals. The other ends of
the four implanted leads terminated in an insulated connector, which was tunneled
under the skin of the animal’s back to an exit point on the head. Accompanying these
leads and also terminating in the connector were two insulated stainless steel reference
leads, whose bared terminals (1.5 cm in length) were implanted under the skin overlying
the lower lumbar spine. All electrodes were secured in place by suturing silicone tie-
downs to connective tissue. Four stainless steel screws were attached to the skull
through small skin incisions. A rubber mold with slits in its base was pushed onto the
screws to act as a former for the manufacture of a dental acrylic headpiece. The
connector was pulled into this mold through a slit. Dental acrylic was then poured into
the mold and allowed to harden. During subsequent experiments, the sockets in the
connector embedded in the headpiece enabled delivery of test pulses via the proximal
cuff and lesioning DC via the distal cuff in either leg.
Page 56
Chapter 2: Nerve lesioning with direct current
42
All skin incisions were closed with 3-0 Prolene suture. At extubation, the cat was
given ketoprofen (0.5-1 mg/kg SC) to minimize discomfort. During post-operative
recovery the cat was kept warm in a heated cage and provided with blankets. Analgesia
was maintained by giving hydromorphone (0.05-0.1mg/Kg SC) 6 hours after extubation.
The antibiotic Clavamox (10-20 mg/Kg) was administered for 7 days after surgery.
(A) (B) (C)
Figure 2.1: The nerve cuff electrodes used in the study. A) Pt-Ir nerve cuff, which delivered DC to
cause controlled ablation. Cuff is shown open, prior to placement on nerve. a) Silicone strip in
the form of a tie-wrap. b) A single terminal of Pt-Ir wire was soldered to the stainless steel wire
emerging from the silicone tubing of the lead. The Pt-Ir wire was sewn into the silicone strip,
looping back and forth between two sutures, also sewn into the strip. B) Proximal cuff which
delivered pulses to the nerve to generate test muscle twitches. c) Two insulated stainless steel
wires emerged from inside the silastic tubing of the lead, were stripped of insulation and tightly
coiled around the silastic tubing of the lead to form a bipolar terminal. C) Control electrode
implanted on the nerve in the contralateral leg. d) Silastic tubing through which the lead was
inserted.
2.1.2 Experimental procedures
2.1.2.1 Acute experiments
The rabbit was surgically anesthetized and placed prone, with its abdomen
supported by a sling strung between the parallel bars of a stereotaxic frame, its head
resting on the front of the frame. The animal’s left knee was stabilized with a clamp
containing two pins that were tightened onto the distal end of the femur. The tendon of
the triceps surae muscle was exposed and detached from the foot along with a small
part of the calcaneal bone. The tendon was secured to a force transducer via a strong
suture. The force transducer was mounted on an electromagnetic, servo-controlled
muscle puller that could be configured to stretch the muscle at different velocities and
through different lengths (Figure 2.2).
Pulses of electrical current (200 μs, 2 Hz) were applied through the proximal nerve
cuff to elicit test muscle twitches throughout the experiment. The pulse amplitudes
were adjusted to be 1.5 times threshold (1.5T) to activate all the alpha motoneurons in
the nerve. In the first two experiments a monophasic, constant voltage, pulse generator
was used (Grass SD9, Grass Medical Instruments, Quincy, Mass. USA). In the remaining
Page 57
Chapter 2: Nerve lesioning with direct current
43
five experiments, a custom, biphasic, charge-balanced, constant-current pulse generator
was used. The lead of the distal cuff was connected to the negative (cathodic) output of
a custom, feedback-controlled DC source. The indifferent lead under the skin of the
animal’s back was connected to the positive (anodic) terminal of the current source. DC
was applied in the range 0.1 to 1 mA for durations ranging from 5 to 45 min, according
to the lesioning effect. No current was delivered through the control nerve cuff in the
contralateral leg.
The muscle puller was controlled with a triangular signal 0.05-0.08 Hz (Function
Generator FG600, Feedback Instruments, England) slowly pulling the end of the tendon
back and forth through 15 mm. This was done to ensure that twitch force at the
maximum of the force-length curve of the muscle was captured in each stretch cycle.
The signals from force and displacement transducers attached to the muscle puller
were viewed on an oscilloscope (Tektronix TDS3014B, Tektronix Inc, Beaverton, OR
USA). The digitized signals were downloaded from the oscilloscope to a desktop
computer via a local area network and Tektronix Visa software. The oscilloscope was set
to sample at 250 or 500 samples/s enabling either 20 s or 40 s segments of data to be
stored. These segments were recorded at intervals of 1 to 5 min throughout the
experiment.
At the beginning of each experiment muscle twitches were recorded during
triangular muscle stretching in the absence of DC, in order to establish baseline length-
tension curves. The duration of these baseline measurements varied from 5 to 15 min
across all animals. After these initial measurements, DC was applied through the distal
nerve cuff for various lengths of time, depending on how much the peak force of muscle
twitches was reduced during DC application, and on how much it recovered thereafter.
Once the twitch force had stabilized for a few minutes, a new DC application would
start. If the twitch force was reduced to zero and did not recover within an hour or
more, the experiment was terminated and the animal was euthanized with
concentrated intravenous pentobarbital (Euthanyl).
At the end of each experiment, the force transducer was calibrated with a spring
balance and approximately 20mm lengths of each tibial nerve were dissected and flash-
frozen in isopentane for histochemical analysis of neurofilament H (NFH).
Page 58
Chapter 2: Nerve lesioning with direct current
44
Figure 2.2: Acute experiment setup. The tendon of the triceps surae muscles was exposed and
dissected free through a skin incision, detached with a small portion of the calcaneus and
connected to a force transducer. The bony origin of the muscle at the knee was immobilized by a
clamp attached to a metal frame. The nerve innervating the triceps surae was exposed in the
thigh and the two nerve cuffs were attached as shown. The force transducer was attached to an
electromagnetic servo muscle puller that received as input a triangular signal (0.05-0.08 Hz cycle
frequency), causing the muscle to be stretched slowly back and forth through 15mm.
2.1.2.2 NFH staining
Longitudinal nerve sections were stained with antibodies that bind to NFH. From the
left tibial nerve (which had been stimulated in the acute experiment), sections were
taken from five sites: distal to the DC cuff, within this cuff, between the two cuffs, within
the proximal cuff and from an area proximal to the proximal cuff. From the right,
unstimulated tibial nerve, sections were taken from within the control cuff and distally
and proximally to the cuff.
2.1.2.3 Chronic experiments
DC lesioning of the right common peroneal nerve was performed in a graded manner
in the temporarily anesthetized cat, once every 7 to 14 days over a period of 8 weeks,
culminating in a complete loss of nerve conduction. From weeks 1 to 20 post-lesioning,
at intervals of 2 to 4 weeks, twitch thresholds and responses to tetanic nerve
stimulation through the left proximal cuff (Lloyd-Jones et al.) and the right proximal and
distal cuffs (Rp and Rd) were determined during brief periods of anesthesia.
In the DC lesioning experiments the cat was anaesthetized with isoflurane. It was laid
on its left side on a heated pad and its right hindlimb was held by a retort clamp applied
Page 59
Chapter 2: Nerve lesioning with direct current
45
above the ankle. The clamp allowed foot dorsiflexion, while minimizing movement of
the shank. Care was taken not to tighten the clamp to a point where it would damage
the tissues. A 1cm wide band of webbing material was looped around the metatarsals
60mm from the pivot point of the ankle joint and attached to a force transducer so that
force was applied in the plantarflexion direction, at right angles to the long axis of the
foot. The leg clamp and force transducer were secured to a heavy metal frame, which in
turn was clamped to a table. As in the acute rabbit experiments, biphasic current pulses
(200 µs, 2 Hz) were applied via the Rp nerve cuff to elicit test muscle twitches. This was
achieved by connecting the cathodal output of the biphasic pulse generator to a socket
in the headpiece connector leading to the Rp cuff. In the first few trials the anodal
output was connected to a socket leading to one of the implanted indifferent electrodes
terminating under the skin over the lumbar spine. In later experiments a surface
indifferent electrode was used, as explained below. The pulse amplitudes were again
adjusted to 1.5T. At the beginning of each experiment baseline values of peak twitch
force were obtained.
After these initial measurements, lesioning DC was applied through the Rd cuff by
connecting the cathodal output of the DC source to the headpiece socket. The anodal
output of the DC source was connected in one of the following three ways. In the first
two weeks it was connected to one of the stainless steel indifferent electrodes
implanted in the lower back. At the end of the second week the voltage required to
maintain a constant current had increased to nearly the compliance level of the DC
source (45V), which suggested corrosion of the indifferent electrode. In week 3 we
therefore switched to a self-adhesive gel surface electrode (Kendall ES40076) as the
indifferent. By week 5, after repeated DC applications the voltage had again reached the
compliance level and we found that the Kendall electrode was discolored, indicating
corrosion. From week 6 onward, we used a wettable pad surface electrode 3cm in
diameter, which enabled DC to be applied for long periods at well below the compliance
voltage.
DC was applied at amplitudes in the range 0.3-0.4mA for durations of 10 to 40 min
according to the lesioning effect. The twitch force responses to 1.5T pulse trains
delivered through the proximal cuff were monitored on the oscilloscope and segments
of recording were stored digitally at intervals of 1 to 5 min. After each period of
application of DC, recording continued for up to one hour to monitor the recovery of
twitch force. After the final DC application in the last DC lesioning session, the twitch
responses were completely abolished (see Results). From weeks 1 to 20 post-lesioning,
the cat was briefly anesthetized every 2 to 4 weeks and muscle response thresholds to
stimulation via the Lp, Rp, and Rd cuffs were determined visually. At week 20 post-
lesioning, the thresholds had returned close to baseline and force measurements were
made as above.
Page 60
Chapter 2: Nerve lesioning with direct current
46
2.1.3 Data analysis
2.1.3.1 Acute experiments
A custom Matlab (The MathWorks, Inc., Natick, MA) program was used to detect the
maximal twitch force occurring within each muscle stretching cycle, that is the twitch
force at optimal muscle length. Reductions in this parameter during and after the
application of DC were taken as a measure of the extent of the lesioning effect.
The twitch forces were superimposed on a slow waxing and waning passive
component of force resulting from the visco-elastic resistance of the muscle to the
triangular displacement. The passive component was isolated in software with a digital
low pass filter (1Hz, 5th
order Butterworth) and subtracted from the unfiltered signal to
leave just the twitch forces. Finally, a low pass filter (100 Hz, 5th
order Butterworth) was
used to attenuate high-frequency noise. Figure 2.3 (top panel), shows unfiltered force
signals for three stretch cycles with and without DC and the same signals after
subtraction of the passive force component (third panel).
Figure 2.3: Muscle twitches were generated by pulsatile stimulation at 2Hz through the proximal
nerve cuff. Top row: force transducer signal during triangular changes in muscle length. Black
bars represent the time DC was applied through the distal nerve cuff. Second row: imposed
displacement. Third row: twitch forces after the passive force was removed by filtering. The peak
force in each twitch, shown by asterisks, and the maximal peak force within each stretch cycle
(circled asterisk) was automatically identified by a software program.
Page 61
Chapter 2: Nerve lesioning with direct current
47
The filtered force signal was further analyzed by the software to select the maximal
peak force in each muscle stretch cycle. The first five maximal peak force values of the
baseline measurements in a given experiment were averaged and all subsequent
maximal peak twitch forces sampled in that experiment were normalized to that mean
value. Normalized twitch forces are plotted in Figures 2.4-2.7.
2.1.3.2 Chronic experiments
As in the acute experiments, the force signal was digitally band-pass filtered (1Hz,
100 Hz) to attenuate DC drift and high frequency noise. The same Matlab algorithm to
detect peak twitch forces was also used. The average peak twitch force per 40 s sample
was computed.
2.1.3.3 Charge density calculations
In previous studies examining safe stimulation of nerves, charge density per phase
was a key variable. For each of the nerve cuff electrodes used to deliver DC, we
estimated the surface area in contact with the nerve, taking into account the semi-
circular profile of the exposed wires. Thus the DC cuff used in the acute rabbit
experiments had an estimated surface area of 0.3*0.5*/2 = 0.236 cm2. The cuff used
in the chronic implant in the cat had an estimated surface area of 0.093 cm2. In Figures
2.4, 2.5, 2.6, 2.7 and 2.9 we provide values of total charge density based on the level
and duration of DC, and the above estimates of surface area.
2.2 Results
2.2.1 Definitions
Baseline: Test period at the beginning of each experiment prior to delivering DC. Muscle
twitch forces elicited by a train of test stimuli applied through the proximal
cuff were continuously monitored. Durations of baseline period ranged from
5 to 15 min.
DC application: A single duration of DC applied to the nerve.
DC session: An experiment in which one or more DC applications occurred.
Page 62
Chapter 2: Nerve lesioning with direct current
48
Recovery: Period following the cessation of DC delivery. Test stimuli continued to be
applied through the proximal cuff and twitch force was monitored and
recorded.
Force overshoot: Peak twitch force values during recovery exceeded either the mean
baseline peak twitch force value or the value recorded just prior to the onset
of the preceding DC application.
2.2.2 Acute experiments
Details of animals used in these experiments, DC application parameters and summary of results can be found in Appendix A, table A.1.
2.2.2.1 Effect of DC amplitudes in the range 0.1 – 0.4mA
DC at 0.1mA was applied in two different animals for durations of 2.5, 10 and 45
min. This had little attenuating effect on the peak force of muscle twitches. Similarly, DC
at 0.2mA had little attenuating effect. It was not until DC reached 0.3mA and above that
attenuation of peak twitch forces became obvious. This is shown in the experiment of
Figure 2.4. After each of the two applications of DC at 0.3 mA and after the first two
applications at 0.4 mA, force recovered to levels above baseline. This was an
unexpected but repeated finding in our experiments. This did not occur after the third
and final DC application at 0.4 mA, which resulted in a complete abolition of force that
endured for the remainder of the experiment in this case. Similar results are shown in a
second animal in Figure 2.5, this time for three repeated applications of DC at 0.3mA.
Again, there was a cumulative effect of consecutive DC applications, leading to a long-
lasting attenuation of force, with complete abolition at the end of the experiment. Why
force declined in two stages in this case is not known, but this kind of variation in
repeated applications of DC at 0.3 to 0.4 mA was seen in other animals in this series.
Page 63
Chapter 2: Nerve lesioning with direct current
49
Figure 2.4: Changes in twitch force during episodes of DC application over a 6-hour experiment.
Top: amplitudes and durations of DC. Horizontal bars: duration of DC application. Data points:
normalized maximal twitch forces in stretch cycles measured at intervals of 1 to 5 min
throughout the experiment. Peak twitch forces were normalized to the baseline value: the mean
of 5 peak twitch force values measured just prior to the first application of DC. The larger the DC
amplitude the faster the twitch force was attenuated. In three cases peak twitch forces
rebounded to higher than baseline values between DC applications. There was a cumulative
effect of repeated DC applications at a given amplitude: peak twitch force attenuated faster on
repeated applications. The estimated charge densities for each consecutive DC application in this
figure were: 1.14, 2.29, 3.43, 2.67, 1.02, 3.05 and 2.03 C/cm2.
Figure 2.5: Changes in twitch force during episodes of DC application over a 4-hour experiment,
data displayed as in Figure 2.4. Clear examples of rebound and increased efficacy and speed of
attenuation with repeated DC applications at the same amplitude (0.3mA). The estimated charge
densities for each consecutive DC application in this figure were: 3.43, 2.67 and 2.29 C/cm2.
Page 64
Chapter 2: Nerve lesioning with direct current
50
2.2.2.2 Effect of DC amplitudes in the range 0.5-1mA
DC amplitudes in this range had a large effect, often resulting in a rapid and sharp
decline in force during DC application. Short applications of DC at 0.5 mA for 2.5 to 5
min (not illustrated) resulted in rapid declines in twitch force during DC application
followed by a recovery of force after DC was withdrawn, to levels equal to or exceeding
baseline values (not illustrated). Longer applications of DC at 0.5 mA (e.g. 10 and 20 min
in Figure 2.6), resulted in a complete abolition of twitch force, with incomplete recovery
after the first application, and long-lasting attenuation after a second application. A
similar pattern was seen for DC at 1 mA applied for durations of 2 to 5 min in two
animals. Figure 2.7 illustrates one such case. After the first application, force recovered,
but after the second, longer, application, no recovery was seen for the remaining 80 min
of the experiment.
Figure 2.6: Changes in twitch force during episodes of DC application at an amplitude of 0.5mA.
Data displayed as in Figure 2.4. In this experiment after a first application of DC (not shown) we
discovered that the test nerve stimuli were not supramaximal. This was corrected and the
experiment was restarted. This may explain the immediate and complete attenuation caused by
the first of the two DC applications illustrated. At this amplitude, force attenuation was rapid,
and after the second application, it was maintained for over 2 hours until the end of the
experiment. The wavy lines in the horizontal axes indicate a break of 10 to 15 min in data
collection. The estimated charge densities for each consecutive DC application in this figure
were: 1.27 and 2.54 C/cm2.
Page 65
Chapter 2: Nerve lesioning with direct current
51
Figure 2.7: Changes in twitch force during episodes of DC application at an amplitude of 1mA.
Data displayed as in Figure 2.4. As in Figure 2.6, force attenuation by DC was rapid and complete,
after the second application, it was maintained until the end of the experiment. The estimated
charge densities for each consecutive DC application in this figure were: 5.08 and 12.7 C/cm2.
2.2.2.3 Force Overshoot
Because force recovered beyond the baseline levels in some of the DC applications,
especially after having been abolished or strongly attenuated, in some experiments we
verified that proximal test stimuli were supramaximal by increasing their amplitude
without observing an increase in twitch forces.
2.2.2.4 Condition of electrodes
The same electrodes were used in all of the experiments. No corrosion was observed
in either the proximal or distal (DC) nerve cuff electrodes.
2.2.2.5 Histochemical results for NFH staining
Staining for NFH showed localized axonal damage under the distal cuff delivering DC.
No damage was visible in the area distal or proximal to this. Figure 2.8A shows
undamaged NFH-stained axons in one of these regions.The neurofilaments are straight
and discontinuities are attributable to out-of-plane sectioning, the ends are not curled.
In contrast, in the section shown in Figure 2.8B, taken from under a DC cuff, most of the
discontinuities have curly ends, indicating axonal damage.
Page 66
Chapter 2: Nerve lesioning with direct current
52
(A) (B)
Figure 2.8: Photomicrographs of longitudinal sections of the nerve stained with neurofilament H.
A) Segment of nerve taken from within the proximal cuff used to deliver test stimuli. Nerve
filaments are straight and continuous with little sign of damage. B) Segment of nerve taken from
within the distal cuff used to deliver DC. Nerve filaments in the left, right and middle of the
picture are broken, with curly edges, indicating localized axonal damage.
2.2.3 Chronic experiments
Details of animals used in these experiments, DC application parameters and summary of results can be found in Appendix A, table A.3.
2.2.3.1 DC delivery in the anaesthetized cat
As mentioned in Methods, 6 DC lesioning sessions took place at intervals of 7 to 14
days over a period of 8 weeks. On each occasion the cat (cat 1) was anesthetized for
approximately 2 hours and DC was delivered to the right common peroneal nerve
through the Rd cuff via the headpiece while test twitches were elicited via the Rp cuff
and muscle force was measured. The cat was then allowed to recover and rest until the
next session. Figure 2.9 shows results obtained in sessions 1, 3 and 6. The DC levels
during the experiments at weeks 2, 4 and 5 fluctuated, due to the corrosion problems
with the anodal electrodes described in Methods, so the results of these experiments
are not included in the Figure. Twitch forces were progressively reduced by DC in each
experiment in Figure 2.9, culminating in a complete abolition of force at the end of the
sixth session.
Page 67
Chapter 2: Nerve lesioning with direct current
53
Figure 2.9: Three separate DC lesioning sessions in an anesthetized cat chronically implanted
with test and DC cuffs on the common peroneal nerve innervating the pretibial muscles extensor
digitorum longus and tibialis anterior. The force measurements were performed by immobilizing
the leg just above the ankle with a retort clamp attached to a frame and attaching the transducer
of Figure 2.2 via a loop of canvas webbing to the foot close to the metatarsophalangeal joint.
Data displayed as in Figure 2.4. In the first session the DC amplitude was 0.3mA. In sessions 3 and
6 it was 0.4mA DC. Following the sixth (final) session, no ankle dorsiflexion could be elicited by
pulsatile or tetanic test stimuli for 8 weeks, after which a gradual recovery was observed. The cat
recovered quickly after each lesioning session, with no sign of discomfort. The estimated charge
densities for each consecutive DC application in this figure were: 7.1, 6.4 and 8.0 C/cm2
At weeks 1, 3, 5, 8, 12, 16 and 20 post-lesioning, the cat was briefly anesthetized
with isoflurane and muscle response thresholds to stimulation via the left and right
proximal nerve cuffs (Lp and Rp) were determined visually. As before, the cathode of the
pulse generator was connected to the appropriate socket in the headpiece and the
anode to a wettable surface electrode on the animal’s back. At week 1, threshold to
tetanic stimulation through the Lp cuff (200 μs at 40 Hz) was 0.12 mA, while in the right
leg tetanic stimulation via the Rp cuff at amplitudes up to 1.5mA failed to produce ankle
dorsiflexion, though a slight toe dorsiflexion was visible at the highest amplitudes.
Similar results were obtained at weeks 3 and 5.
To ensure that the absence of muscle responses on the right side were not due to a
failure in the headpiece connector, the lead or the electrode terminal in the Rp cuff, at
week 5, we also applied stimulation through pairs of stainless steel wires inserted into
the left and right tibialis anterior muscles (TA) with hypodermic needles. The wires had
5mm bared ends. In the left leg, tetanic intramuscular stimulation with 2mA pulses
elicited powerful ankle dorsiflexion, whereas in the right leg pulse amplitudes up to 23
mA failed to produce ankle dorsiflexion. The TA and Extensor Digitorum Longus (EDL)
Page 68
Chapter 2: Nerve lesioning with direct current
54
muscles were clearly atrophied at this stage. In addition, surface stimulation was applied
over these muscles through a pair of wettable pad electrodes. On the left side the
threshold to elicit muscle twitches was 3mA whereas on the right side stimulation at up
to 6mA failed to elicit muscle responses.
From weeks 8 to 20, responses in TA and EDL began to reappear. The following
twitch thresholds to stimulation through the Lp, Rp and Rd cuffs were determined. Week
8: 0.1mA, 0.3mA, 0.7mA; week 12: 0.1mA, 0.3mA, 0.6mA; week 16: 0.1mA, 0.2mA,
0.3mA; week 20: 0.1mA, 0.2mA, 0.4mA. Because thresholds at week 20 had returned
close to pre-lesioned values, twitch forces were measured with a force transducer as
described in Methods (Chronic Experiments). The mean peak twitch force had returned
to the values measured prior to DC lesioning in sessions 1 and 3. This indicates that the
muscle nerve had successfully regenerated.
2.2.3.2 DC delivery in the awake cat
As described in Methods, on one occasion DC (0.4mA) was delivered in the awake
animal through the Rd cuff by connecting the cathodal output of the constant current
stimulator to the headpiece and the anodal output to the implanted indifferent
electrode via the socket in the headpiece. DC was delivered for 2.5 min. The animal
showed no signs of discomfort during or after this procedure. As it was impossible to
measure twitch forces under these circumstances, it is unknown whether nerve block
occurred. However the experiment showed that DC could be delivered at an amplitude
that caused nerve block during anesthesia, without causing signs of discomfort. Future
experiments are planned to compare twitch forces measured during brief periods of
anesthesia before and after DC application in the awake animal.
2.2.3.3 Condition of electrodes
An attempt to re-lesion the nerve following the 20 weeks recovery period using the
same DC parameters (0.4mA for 40 min) did not result in force attenuation. In a brief
surgical procedure, it was found that the solder joint connecting the Pt-Ir terminal to the
stainless steel lead was corroded. This joint was insulated and therefore had not been in
contact with the nerve. The Pt-Ir terminal itself was intact, with no sign of corrosion. The
proximal cuff was fully intact, no corrosion was evident.
Page 69
Chapter 2: Nerve lesioning with direct current
55
2.3 Discussion
Because this method of nerve ablation was novel, the choice of electrodes,
stimulation parameters and outcome measures was exploratory in nature and the
results are therefore preliminary. However, some tentative conclusions may already be
drawn. The experiments showed that it is possible to lesion peripheral nerves in a
controlled manner by applying DC to them. This causes a controlled amount of
reduction in muscle force. Consecutive DC applications showed a cumulative effect on
muscle force, whereby the force declined faster and to a greater extent in each
subsequent DC application. This was also observed by Whitwam et al. (Whitwam & Kidd,
1975).
DC amplitudes of 0.1mA or 0.2mA required long durations of application in order to
attenuate muscle force, and the attenuation was temporary, which agrees with previous
results (Bhadra and Kilgore 2004). DC amplitudes of 0.3mA and 0.4mA were effective in
damaging the nerve in a controlled fashion but they required 20-40 min to take effect,
and complete blockade was usually not achieved. DC amplitudes of 0.5 to 1mA
produced large force reductions in a relatively small amount of time, which may be
desirable in some cases, but not necessarily if graded ablation is desired. The recovery in
twitch force seen between the end of one DC lesioning session and the next (e.g. Figure
2.9) can be attributed to the recovery of conduction in transiently blocked axons.
The DC charge densities in our study ranged from 1 to 13 C/cm2, i.e. one to two
orders of magnitude greater than the largest charge densities (1mC/cm2/phase)
explored in previous studies of safe and damaging pulsatile stimulation (Merrill et al.,
2005). Long trains of monophasic pulses, which deliver a linearly increasing charge
density, eventually damage nerves, so the rate of charge delivery (i.e. the current) and
the current density (determined by the surface area of the electrode) are clearly
variables that should be explored systematically in future studies of nerve ablation.
In our first two acute experiments, monophasic stimuli (2 pulses/s) were used to
elicit the test muscle twitches. We estimate the charge density per pulse to have been
about 8 μC/cm2 and the net charge 0.12 μC/cm2. These values are orders of magnitude
below damaging levels, so we assume that they did not contribute to the nerve blocks
reported here.
In the chronic cat experiment, we proceeded cautiously, increasing DC amplitudes
and durations in successive trials. The common peroneal nerve was evidently
completely ablated after the sixth DC lesioning session. By week 5 post-lesioning, the
Tibialis anterior (TA) and Extensor digitorum longus (EDL) muscles had atrophied and
twitches could not be elicited with surface, direct or intramuscular stimulation. We saw
a resumption of muscle responses at week 8 (56 days post-lesioning). This delay
corresponds well to the classical data of Gutmann et al (Gutmann et al., 1942) who
either crushed or cut the common peroneal nerve in rabbits 40-50mm proximal to their
muscles and found that motor responses first appeared 38-40 days after crushing and
54-70 days after cutting. In other experiments, after cutting the same nerves closer to
Page 70
Chapter 2: Nerve lesioning with direct current
56
the muscles (11-16mm, mean 13mm), the delays ranged from 35 to 48 days (mean 42
days).
Our study suggests that controlled nerve lesioning with DC might provide an
alternative treatment to chemo-denervation to reduce spastic hypertonus. Currently,
the most common form of chemo-denervation comprises intramuscular injections of
BtA. Nerve ablation with phenol provides a cheaper alternative, but this can be painful.
The benefits of chemodenervation are reduced focal muscle over-activity, improved
range of motion, improved hygiene and reduction in pain and caregiver time (McGuire,
2001). These are all goals that could potentially be achieved by using DC to ablate
nerves innervating muscles. BtA injections only take effect a week or two after injection,
and so it is impossible to grade the amount of attenuation of muscle force during the
injection procedure. Furthermore some side effects of chemodenervation including
adjacent muscle weakness, transient fatigue, nausea and dry mouth as well as the
difficulty in determining the best injection site (McGuire, 2001) would be avoided with
DC ablation.
DC could be delivered to a nerve by an implanted device. Once the desired
attenuation of spastic contractions was achieved, the same device could be used to
deliver trains of stimulus pulses to the nerve to control muscles in functional
movements such as hand grasp. In this way, the device would serve two functions: that
of an ablation device, and that of a neuroprosthesis. This might overcome the well-
known disadvantage of chemo-denervation, the reduction in functionality due to muscle
weakness (O'Brien, 2002; Esquenazi, 2006).
Nerves recover after chemo-denervation, so BtA treatment needs to be repeated
every few months. We found that nerve regeneration also occurred after DC ablation.
However, once DC leads are implanted, repeated ablations would simply involve short
applications of DC, which could be performed by medical technicians. Unlike cardiac
pacemakers, implanted DC stimulators could potentially receive energy by inductive
coupling prior to each use and they would therefore not need replacement every few
years. It may even be possible to dispense with an implanted stimulator by delivering DC
to the subcutaneous terminal of an implanted lead with a percutaneous needle
(Prochazka, A., patent pending). On the other hand DC implants would be unlikely to
replace BtA in cases in which hypertonus in multiple muscles needs to be treated, as this
would require several nerve electrodes to be implanted.
Page 71
Chapter 2: Nerve lesioning with direct current
57
2.4 References
Barker E. (2008). Managing spasticity with intrathecal drug delivery. Rn 71, 24-29; quiz 30.
Bhadra N & Kilgore KL. (2004). Direct current electrical conduction block of
peripheral nerve. IEEE Trans Neural Syst Rehabil Eng 12, 313-324. Bovend'Eerdt TJ, Newman M, Barker K, Dawes H, Minelli C & Wade DT.
(2008). The effects of stretching in spasticity: a systematic review. Arch Phys Med Rehabil 89, 1395-1406.
Dolly O. (2003). Synaptic transmission: inhibition of neurotransmitter release by
botulinum toxins. Headache 43 Suppl 1, S16-24. Esquenazi A. (2006). Improvements in healthcare and cost benefits associated
with botulinum toxin treatment of spasticity and muscle overactivity. Eur J Neurol 13 Suppl 4, 27-34.
Goldstein EM. (2001). Spasticity management: an overview. J Child Neurol 16,
16-23. Gutmann E, Guttmann L, Medawar PB & Young JZ. (1942). The Rate of
Regeneration of Nerve. J Exp Biol 19, 14-44. Kirazli Y, On AY, Kismali B & Aksit R. (1998). Comparison of phenol block and
botulinus toxin type A in the treatment of spastic foot after stroke: a randomized, double-blind trial. Am J Phys Med Rehabil 77, 510-515.
Kita M & Goodkin DE. (2000). Drugs used to treat spasticity. Drugs 59, 487-495. Kowalczewski J. (2009). Adjustable tissue or nerve cuff and methods of use. US
patent application 2009/0210042. Lloyd-Jones D, Adams R, Carnethon M, De Simone G, Ferguson TB, Flegal K,
Ford E, Furie K, Go A, Greenlund K, Haase N, Hailpern S, Ho M, Howard V, Kissela B, Kittner S, Lackland D, Lisabeth L, Marelli A, McDermott M, Meigs J, Mozaffarian D, Nichol G, O'Donnell C, Roger V, Rosamond W, Sacco R, Sorlie P, Stafford R, Steinberger J, Thom T, Wasserthiel-Smoller S, Wong N, Wylie-Rosett J & Hong Y. (2009). Heart disease and stroke statistics--2009 update: a report from the American Heart Association Statistics Committee and Stroke Statistics Subcommittee. Circulation 119, e21-181.
Page 72
Chapter 2: Nerve lesioning with direct current
58
McCreery DB, Agnew WF, Yuen TG & Bullara L. (1990). Charge density and charge per phase as cofactors in neural injury induced by electrical stimulation. IEEE Trans Biomed Eng 37, 996-1001.
McGuire JR. (2001). Effective use of chemodenervation and chemical neurolysis
in the management of poststroke spasticity. Top Stroke Rehabil 8, 47-55. Mendell LM & Wall PD. (1964). Presynaptic Hyperpolarization: a Role for Fine
Afferent Fibres. J Physiol 172, 274-294. Merrill DR, Bikson M & Jefferys JG. (2005). Electrical stimulation of excitable
tissue: design of efficacious and safe protocols. J Neurosci Methods 141, 171-198.
Montane E, Vallano A & Laporte JR. (2004). Oral antispastic drugs in
nonprogressive neurologic diseases: a systematic review. Neurology 63, 1357-1363.
NSCISC. (2008). Spinal Cord Injury, Facts and Figures at a Glance., ed. Center
NSCIS. University of Alabama at Birmingham, Birmingham, Alabama. O'Brien CF. (2002). Treatment of spasticity with botulinum toxin. Clin J Pain 18,
S182-190. Rizzo MA, Hadjimichael OC, Preiningerova J & Vollmer TL. (2004). Prevalence
and treatment of spasticity reported by multiple sclerosis patients. Mult Scler 10, 589-595.
Skold C, Levi R & Seiger A. (1999). Spasticity after traumatic spinal cord injury:
nature, severity, and location. Arch Phys Med Rehabil 80, 1548-1557. Sommerfeld DK, Eek EU, Svensson AK, Holmqvist LW & von Arbin MH.
(2004). Spasticity after stroke: its occurrence and association with motor impairments and activity limitations. Stroke 35, 134-139.
van Kuijk AA, Geurts AC, Bevaart BJ & van Limbeek J. (2002). Treatment of
upper extremity spasticity in stroke patients by focal neuronal or neuromuscular blockade: a systematic review of the literature. J Rehabil Med 34, 51-61.
Whitwam JG & Kidd C. (1975). The use of direct current to cause selective block
of large fibres in peripheral nerves. Br J Anaesth 47, 1123-1133. Woo R. (2001). Spasticity: orthopedic perspective. J Child Neurol 16, 47-53.
Page 73
59
Chapter 3
Nerve lesioning with direct current (DC):
Investigation of DC parameters and possible
mechanisms of DC induced nerve ablation
One of the most debilitating outcomes of stroke and spinal cord injury (SCI) is the
loss of motor function. The initial insult may be further exacerbated by spasticity, a
chronic over-activity of muscles. This condition can result in fatigue, reduced range of
motion (ROM), pain and contractures which impede activities of daily life (ADLs) (Rizzo
et al., 2004; Taricco et al., 2006). Several studies have shown that spasticity is associated
with reduced function and that survivors who developed spasticity had lower scores in
tests of ADLs (Sommerfeld et al., 2004; Welmer et al., 2006; Lundstrom et al., 2008).
Furthermore, a lesser degree of impairment was associated with better chances of
recovery for the upper extremities (Coupar et al., 2012) .
During the 6 to 18 month period following a stroke event, spasticity develops in
approximately 20% to 30% of survivors (Watkins et al., 2002; Sommerfeld et al., 2004;
Lundstrom et al., 2008; Kong et al., 2012). Although this is sometimes regarded as a low
percentage, the actual number of individuals requiring management of spasticity is high
when the prevalence of stroke and SCI is considered. Stroke prevalence in the United
States (US) alone is estimated at 7 million individuals (Roger et al., 2012). Of the
estimated 270,000 individuals living with SCI (NSCISC, 2012), over 60% develop
spasticity following injury, of whom more than half are medically treated. The incidence
of spasticity is greater in those with cervical or high thoracic SCI (Maynard et al., 1990).
With a decreasing incidence of mortality resulting from a stroke event (Roger et al.,
2012) and the high prevalence of individuals with SCI requiring care, the burden on the
health care system is increasing. Ten years ago, 250,000 disabled stroke survivors were
reported in the United Kingdom (UK) and £2.3 billion per year were spent on stroke
alone (Rothwell, 2001). In the US, a reported $34.3 billion were used for the treatment
of stroke in 2008 (Roger et al., 2012).
Current treatments for spasticity include physical and occupational therapy, anti-
spastic medications and chemodenervation agents (Goldstein, 2001). Physiotherapeutic
methods such as stretching, Range of Motion (ROM) exercises and casting require a
Page 74
Chapter 3: DC parameters and mechanisms of ablation
60
considerable time commitment, and are of limited efficacy and duration (Bovend'Eerdt
et al., 2008) .Whole body vibration has not lived up to its initial promise (Brogardh et al.,
2012; Lau RW et al., 2012) though a new study indicates that focal muscle vibration may
have a beneficial effect (Caliandro et al., 2012). Common oral anti-spastic drugs such as
Dantrolene, Tizianidine and Baclofen can cause adverse side effects such as muscle
weakness, hepatotoxicity, dizziness and sedation (Gracies et al., 1997; Kita & Goodkin,
2000; O'Brien, 2002) and they do not reduce spasticity in all patients (Maynard et al.,
1990; Taricco et al., 2006). A recent review concluded that while Baclofen and
Dantrolene reduced muscle tone, there was no evidence that this had a functional
impact (Simon & Yelnik, 2010). Baclofen can be delivered intrathecally via a surgically-
placed pump, allowing a lower dosage than oral medication, which reduces systemic
side-effects, however, other complications such as infections around the implants may
occur (Barker, 2008).
Chemodenervation agents such as phenol and Botulimum toxin type A (BtA) are used
to block nerve conduction. Phenol injections have a rapid onset but often have painful
side effects (van Kuijk et al., 2002; Elovic et al., 2009). BtA treatment is costly, may take
up to two weeks to take effect and usually lasts only a few months (Dolly, 2003),
necessitating repeated costly administration (Ward et al., 2005). BtA has proven
effective in reducing muscle tone and managing spasticity, but treatment did not
necessarily improve motor function (Elia et al., 2009; Teasell et al., 2012; Wolf et al.,
2012). Furthermore, recent research shows that continuous use of BtA results in muscle
atrophy and loss of muscle tissue in both the target muscle and muscles elsewhere in
the body (Fortuna et al., 2011).
Direct current (DC) has been used in the past to block conduction in peripheral
nerves, but was deemed unsuitable for clinical use since it resulted in nerve damage
(Whitwam & Kidd, 1975). We suggest that this effect of DC on nerves can in fact be
useful clinically. In a previous publication (Ravid et al., 2011) initial results of complete
and partial nerve ablation were presented. Here we explored stimulation parameters,
current amplitude and duration of stimulation with the goal of describing a stimulation
profile that would be effective and clinically acceptable. The following is our
presentation of the results of application of DC in anesthetized and decerebrate animals
and the outcome of investigations into possible mechanisms of nerve ablation.
3.1 Methods
All the procedures described below were approved by the University of Alberta
Animal Care and Use Committee.
Page 75
Chapter 3: DC parameters and mechanisms of ablation
61
3.1.1 Definitions
Baseline: Test period at the beginning of each experiment prior to
delivering DC.
DC application: Time duration when DC is applied to the nerve. Several DC applications
may be carried out in a single experiment.
Nerve Recovery: Time duration following a DC application when the nerve is allowed to
recover. DC is not applied during this period.
3.1.2 Animals and surgical procedures
3.1.2.1 Non-recovery experiments in rabbits to explore DC parameters
Seven white New Zealand rabbits were used in single, non-recovery experiments.
Surgical-plane anesthesia was induced with gaseous Isoflurane delivered through a
mask. A tracheotomy was performed, allowing anesthesia to be maintained via an
endotracheal tube. The left sciatic nerve was exposed through an incision overlying the
hamstrings muscle. The common peroneal nerve (CPN) was separated from the tibial
nerve and transected. Two silicone nerve cuff electrodes were attached to the tibial
nerve branch: a proximal nerve cuff to deliver test stimuli and a distal cuff to deliver DC.
The cuffs each comprised a strip of silicone in the form of a “tie-wrap,” which fixed the
cuff to the nerve (Figure 3.1). The leads were made of insulated, multi-stranded
stainless steel wire (AS632, Cooner Wire, Chatsworth, CA) coiled inside a silicone tube,
which was then filled with silicone sealant (RTV 118, Momentive Performance Materials,
Waterford, NY). A more detailed description of the surgical procedure and leads can be
found in a previous publication (Ravid et al., 2011).
The proximal nerve cuff, which was used to elicit test muscle twitches, contained a
pair of terminals formed from the stainless steel lead wires. Where they emerged from
the silicone tube, these wires were stripped of insulation and tightly coiled back around
the tube to form a bipolar terminal, which was then attached to the silicone tie-wrap
with silicone adhesive (Figure 3.1A). The distal nerve cuff, which was used to deliver DC,
contained a Platinum Iridium (Pt-Ir) terminal. In the first of the present experiments, this
terminal was formed as previously described (Ravid et al., 2011), by sewing a length of
Pt-Ir wire, soldered to the end of a single stainless steel lead wire, back and forth on one
side of the tie-wrap. In the remaining six experiments, the terminal was formed in a
similar way to those in the proximal cuff, by tightly coiling the length of Pt-Ir wire back
around the silicone tube containing the lead wire. As in the proximal cuff, this terminal
was then attached to a tie-wrap with silicone adhesive (Figure 3.1B).
At the other end of each of the lead wires, two types of connector were used, those
external to the body and those implanted under the skin of the animal’s back. The
external connectors were conventional 2-mm plug and socket connectors. The
Page 76
Chapter 3: DC parameters and mechanisms of ablation
62
connectors implanted under the skin were prototypes of insulated, conductive,
subcutaneous ports suitable for human clinical applications, where repeated sessions of
controlled nerve ablation are to be anticipated. The idea was to develop a port into
which a hypodermic needle, insulated except for its tip, could be introduced through the
skin, providing a temporary electrical connection to the nerve ablation lead (Figure 3.2).
(A) (B)
Figure 3.1: The nerve cuff electrodes used in the study. A) Proximal cuff which delivered pulses to
the nerve to generate test muscle twitches. a) Two insulated, multi-stranded stainless steel wires
that emerged from inside the silicone tubing of the lead were stripped of insulation and tightly
coiled back around the tubing to form a bipolar terminal. Cuff is shown open, prior to placement
on nerve. B) Pt-Ir nerve cuff, which delivered DC to cause controlled nerve ablation. b) A single
strand of Pt-Ir wire was soldered to the stainless steel wire emerging from the silicone tubing of
the lead. The Pt-Ir wire was coiled back around the silicone tubing to form a 5mm monopolar
cuff. c) Silicone strip in the form of a tie-wrap.
Figure 3.2: Subcutanous Port Schematics. The port is composed of two stainless steel plates. One
of the plates is bonded with silicone sealant to a silastic sheet. A layer of conductive rubber or
conductive silicone is glued to the second metal plate with conductive epoxy. The two plates are
glued together with conductive epoxy as well. The entire port is coated with silicone sealant.
There are two possible methods to connect to the port: 1) An insulated hypodermic needle with
only the tip exposed, may be inserted into the conductive rubber or silicone layers. 2) A wire,
insulated except for the tip, is inserted into the conductive layers via a hypodermic needle. The
needle is then withdrawn, leaving the uninsulated tip of the wire in the conductive material.
Page 77
Chapter 3: DC parameters and mechanisms of ablation
63
In this study the port was composed of two thin 2x2 cm stainless steel plates (SS316
flat pack, 0.010”, Mauldin products, Kemah, TX). An electrode lead was soldered to one
of the plates and the plates were glued together with silver conductive epoxy (8331-
14G, MG chemicals, B.C.), sandwiching the solder joint between them. A 2x2 cm sheet
of conductive rubber (C5020PF Canadian Medical Products Ltd, Scarborough ON) was
stuck to one of the plates with the same epoxy. The other plate was glued to a non-
conductive silastic sheet (0.010”+/- .002, material: SSF-METN-750, Speciality Silicone
Fabricators, Paso Robles, CA) with silicone sealant. Finally, the entire port and emerging
section of lead were coated with a layer of silicone sealant (Figure 3.3).
Figure 3.3: Subcutaneous port and lead. a) Conductive carbon layer under silicone sealant
layers. b) Silastic sheet comprising the backing of the port. c) Silicone sealant layers. d) Coiled Pt-
Ir wire inside a silicone tube filled with silicone sealant.
3.1.2.2 Non-recovery experiments in rabbits with Lidocaine blockade of common
peroneal nerve (CPN) to elucidate mechanism of DC ablation
Two rabbits and one cat were anesthetized as described in section 3.1.2.1. The
animal was placed prone on a table; the CPN was exposed in both legs. Two nerve cuff
electrodes (distal Pt-Ir, proximal stainless steel, external connectors as described in
section 3.1.2.1) were placed on each CPN. The incisions were closed with Michel clips to
keep the nerve from drying.
Page 78
Chapter 3: DC parameters and mechanisms of ablation
64
3.1.2.3 Non-recovery experiments in decerebrate cats to demonstrate abolition of
rigidity by DC nerve ablation
The surgical procedure described in 3.1.2.1 was performed on two cats with
isoflurane anesthesia. A catheter was inserted into a jugular vein to enable intravenous
drug administration. The top of the skull was trefined and an intercollicular
decerebration was performed, after which anaesthesia was discontinued. Decerebrate
rigidity developed in one of the cats an hour later.
3.1.3 Experimental procedures
3.1.3.1 Exploring DC parameters
The procedure is described in detail in previous publications (Ravid et al., 2011), so
only a summary is presented here. The rabbit was suspended prone in a stereotaxic
frame. Its left knee was stabilized with a clamp. The tendon of the triceps surae muscle
was exposed through a skin incision at the ankle and the calcaneal tuberosity was
detached. The tendon was secured to a force transducer with a short length of strong
silk suture. The force transducer was part of an electromagnetic, servo-controlled
muscle puller that was configured to stretch the muscle back and forth through its full
physiological range (Figure 3.4). This was done to ensure that twitch force at the
maximum of the force-length curve of the muscle was captured in each stretch cycle.
Pulses of electrical current (200 µs, 2 Hz) were applied through the proximal cuff
throughout the experiment. The signals from the force transducer and a displacement
transducer attached to the muscle puller, along with current and voltage signals from a
custom, feedback-controlled, DC generator were sampled at 500 samples/s with a
digital oscilloscope (Tektronix TDS3014B, Tektronix Inc, Beaverton, OR USA). The
digitized signals were downloaded from the oscilloscope to a desktop computer via a
local area network and Tektronix Visa software. The oscilloscope was set to sample 20 s
segments of data. These segments were recorded at intervals of 1 to 5 min throughout
the experiment. DC was delivered intermittently through the distal cuff. DC amplitudes
used in current experiments were 0.5mA, 0.75mA, 1mA, 1.5mA, 2mA, 2.5mA.
Page 79
Chapter 3: DC parameters and mechanisms of ablation
65
Figure 3.4: Arrangement in the experiments exploring DC parameters and decerebrate rigidity.
The tendon of the triceps surae muscles was exposed and dissected free through a skin incision,
detached with a small portion of the calcaneus and connected to a force transducer. The bony
origin of the muscle at the knee was immobilized by a clamp attached to a metal frame. The
nerve innervating the triceps surae was exposed in the thigh and the two nerve cuffs were
attached as shown. The force transducer was attached to an electromagnetic servo muscle
puller that received as input a triangular signal (0.05-0.08 Hz cycle frequency), causing the muscle
to be stretched slowly back and forth through 15mm.
3.1.3.2 Lidocaine blockade of nerve conduction to elucidate mechanism of DC ablation
The purpose of these experiments was to test the hypothesis that sodium channel
blockade by Lidocaine protects nerves from DC induced damage. After the surgical
procedures described in 3.1.2.1 and 3.1.2.2, the animal was placed prone on a table, its
leg was clamped at the ankle and a strap around the metatarsals was used to attach the
foot to a force transducer (Figure 3.5). Supramaximal pulsatile stimulation (200 µs, 2Hz)
was applied through the proximal nerve cuff to elicit test muscle twitches. Force, DC and
voltage signals were sampled and displayed as described in 3.1.3.1. A length-tension
curve was performed to determine the optimal muscle length, by measuring twitch
force amplitudes at different ankle angles. The force transducer was then magnetically
clamped to the table at the position corresponding to optimal muscle length. Twitch
responses were recorded for several minutes until their amplitudes settled to a stable
baseline. An initial dose of 0.2ml of 1% Lidocaine solution (Xylocaine, AstraZeneca) was
Page 80
Chapter 3: DC parameters and mechanisms of ablation
66
injected into the distal cuff with the use of a 28G hypodermic needle over a period of 2-
3 min. This initial dose was applied to the nerve to establish the time T1 from the
complete abolition of twitch force to near-complete recovery. As soon as the Lidocaine
had abolished muscle twitches, the nerve was flushed with 10ml of isotonic saline in and
around the cuff. When muscle twitch forces had recovered to 60%-80% of baseline
values, a second identical quantity of Lidocaine solution was injected into the nerve cuff.
When muscle twitches were abolished, the nerve was again flushed with 10ml isotonic
saline and DC was applied through the distal nerve cuff (3mA for 4 min). Twitches were
then monitored for at least 2*T1.
Figure 3.5: Arrangement in the experiments in which nerve conduction was blocked with
Lidocaine during the application of DC. The purpose of these experiments was to test the
hypothesis that sodium channel blockade by Lidocaine protects nerves from DC. The rabbit was
placed prone, its leg was clamped and a strap was looped around the foot and connected to a
force transducer. Test twitches of ankle flexor muscles were elicited by electrical pulses applied
to the common peroneal nerve via a proximal nerve cuff. Lidocaine was applied to the nerve
under and around a more distal cuff, with a fine needle. When the Lidocaine had abolished
twitches by blocking nerve conduction at the distal cuff, DC was delivered to the nerve via the
distal cuff.
3.1.3.3 Decerebrate rigidity experiments
After the surgical procedures described in 3.1.2.1 and 3.1.2.3, the cat was suspended
in a stereotaxic frame as described in section 3.1.3.1. Intramuscular electromyogram
(EMG) fine wire electrodes were implanted in the medial and lateral triceps surae
muscles and connected to an amplifier (Iso-DAM8A, World Precision Instruments Inc.,
Sarasota FL) which was configured with the following settings: highpass filter at 10 Hz,
low pass filter at 3Khz and Gain at 1000. The resulting EMG signal was passed through a
custom-built amplifier (high pass 10Hz). The signal was full-wave rectified and low
passed filtered at 3Hz with gain set to 56. The fully rectified EMG signal was displayed
Page 81
Chapter 3: DC parameters and mechanisms of ablation
67
and sampled at 5000 samples/s along with the applied force and length signals as
described in 3.1.3.1. Each sampled segment was 2 s long. When rigidity had developed,
stable baseline responses were recorded and DC was then applied at 3 mA for 1.5 min
to ablate the nerve. EMG, force and displacement were monitored for an additional 40
min following the cessation of DC.
3.1.3.4 Nerve injury potentials
In the decerebrated cat that did not develop rigidity, EMG electrodes were placed as
in 3.1.2.3. DC was applied as described in section 3.1.3.1. The EMG signal was sampled
at 50,000 samples/s. Each sampled segment was 0.2 s long. Following application of DC
to the tibial nerve, nerve injury potentials were recorded.
3.1.3.5 pH testing during DC delivery in saline
An identical electrode to the one used to deliver DC (made from Pt-Ir wire),
described in section 3.1.2.1, and an anode made from stainless steel, 1 cm in diameter,
were placed in a beaker containing 10 ml of isotonic saline. DC was delivered through
the electrodes at 1mA, 2mA and 3mA for 1 min and 3mA for 4 min. pH test paper (EMD
chemicals Inc, Gibbstown, N.J) was placed in close proximity to the cathode immediately
after the cessation of DC.
3.1.4 Data analysis
3.1.4.1 Exploring DC parameters
Data analysis methods for this experiment were described in detail in previous
publications (Ravid et al., 2011), so only a brief description is provided here. Force,
displacement, current and voltage signals were sampled and stored as described in
3.1.3.1. A custom Matlab program was used to detect the maximal twitch force
occurring within each muscle stretching cycle (Figure 3.6). Twenty s segments of data
were sampled every 0.5-10 min and the maximal twitch force for each stretch cycle was
determined.
Page 82
Chapter 3: DC parameters and mechanisms of ablation
68
Figure 3.6: Muscle twitches were generated by pulsatile stimulation (200 µs, 2 Hz) through the
proximal nerve cuff. Top row: Force transducer signal during triangular changes in muscle length.
The black bars represent the time DC was applied through the distal nerve cuff. Second row:
Imposed displacement. Third row: Twitch forces after the passive force was removed by filtering.
The peak force in each twitch, (identified with asterisks) and the maximal peak force within each
stretch cycle (circled asterisk) was automatically identified by a software program.
The maximal twitch force for each sample was then presented on a graph with the x
axis representing the timeline of the experiment.
3.1.4.2 DC application during conduction block with Lidocaine
The force transducer signal and DC source were sampled and downloaded to a
desktop computer as described in section 3.1.3.1. The force signal was then digitally
low-pass filtered (50Hz) and the mean peak twitch force was calculated for each 20 s
sample. The maximal twitch force for each sample was then presented on a graph with
the x axis representing the timeline of the experiment.
Page 83
Chapter 3: DC parameters and mechanisms of ablation
69
3.1.4.3 Charge density calculations
In previous studies examining safe stimulation of nerves, the charge density per
phase was found to be the most relevant variable (McCreery et al., 1990). To calculate
charge density, we estimated the surface area of the exposed wire inside a given nerve
cuff in contact with the nerve, taking into account the semi-circular profile of the
exposed wires. The DC cuff used in the first acute rabbit experiment had an estimated
surface area of 0.3*0.5*π/2 = 0.236 cm2. The DC cuff used in the rest of the experiments
had an estimated surface area of 0.093 cm2. In Figures 3.7 to 3.11 we provide values of
total charge density based on the level of DC and the above estimates of surface area.
3.2 Results
3.2.1 Exploration of DC parameters
Details of animals used in these experiments, DC application parameters and
summary of results can be found in Appendix A, table A.1.
In previous published experiments on DC nerve ablation (Ravid et al., 2011), the DC
amplitudes tested were in the range 0.1-0.5mA except in one experiment in which 1mA
of DC was applied for durations of 2 min and more. In the present experiments, we
explored the possibility of applying higher levels of DC (up to 2.5mA) for shorter
durations, a protocol that might be more suitable for clinical applications. Seven white
New Zealand rabbits were tested with the following DC amplitudes: 0.75mA, 1mA,
1.5mA, 2mA and 2.5mA. The duration of application ranged from 20 s to 2.5 min.
In two experiments, 0.75mA DC was delivered to the nerve for durations of 2 min. In
the first experiment (Figure 3.7), during the time DC was applied, twitches were
abolished, but they recovered quickly upon the cessation of DC. Attenuation of the
maximal twitch force was graded, with a reduction to 50% of baseline value after four
applications. Little further attenuation followed the fifth application, but complete
abolition was produced by the sixth application. Figure 3.8 shows a second experiment
with the identical profile of current-duration simulation parameters. In this experiment,
maximal twitch force reduction to ~50% of the baseline force value was seen
immediately after the first DC application. Thirteen additional DC applications of
identical amplitude and duration did not result in significant further attenuation. Note
that in this experiment too, twitches were abolished completely during DC applications.
Page 84
Chapter 3: DC parameters and mechanisms of ablation
70
Figure 3.7: Changes in twitch force during and after six episodes of DC (horizontal bars at top)
applied at an amplitude of 0.75mA for periods of 2 min. Twitch force was abolished during each
DC application, but recovered quickly when DC ceased. Force between DC applications only
began declining after the third DC application. An additional three applications were required to
abolish force completely for the final 40 min of observation. In this experiment, the nerve cuff
had an estimated contact area of 0.236cm2, so that 0.75mA for 2 min corresponded to a charge
density of 0.38 C/cm2.
Figure 3.8: Changes in twitch force during and after 14 2-min applications of DC at 0.75mA, as in
Figure 3.7. A reduction of the maximal twitch force to 50% of baseline value was evident
immediately after the first DC application. No further substantial reduction in maximal twitch
force was noted following 13 additional identical DC applications. As in the experiment of Figure
3.7, during each DC application, twitches, and by implication, nerve conduction through the DC
cuff, were completely blocked. Recovery of force after each DC application became prolonged as
additional DC applications were delivered (min 180 onwards). In this case the nerve cuff had an
estimated contact area of 0.093cm2 so that in each DC application, 0.75mA for 2 min
corresponded to a charge density of 0.97 C/cm2.
Page 85
Chapter 3: DC parameters and mechanisms of ablation
71
The inability to further completely abolish the twitches in the experiment of Figure
3.8 led to a strategy in subsequent experiments where either the amplitude or the
duration of the DC application was increased if no force reduction was observed after
two to three applications.
3.2.1.1 Constant DC amplitude and variable duration
In three experiments, the duration of DC was increased while the amplitude
remained constant (1mA and 2mA). In two of these experiments, one of which is shown
in Figure 3.9, after an initial substantial reduction in maximal twitch force, only small
reductions occurred in several subsequent DC applications. However, the twelfth DC
application completely abolished the twitches, which was unexpected, given that the DC
amplitude and duration had not changed.
Another noticeable feature of the responses was an increased duration of recovery
time each time DC ceased. This was also observed in other trials in this study (e.g. in
Figure 3.8). Once the force was completely abolished, no further DC applications were
carried out. In the third experiment, a more gradual reduction of maximal force was
observed compared with the first two experiments.
Figure 3.9: Changes in twitch force during and after large amplitude DC applications of various
durations. In all but one case (2.5 mA), the DC amplitude was 2mA. Maximal twitch force was
attenuated to about 55% of the baseline force after the third DC application. After each of the
next 8 applications, force recovered progressively more slowly and to slightly lower levels,
indicating increases in duration of nerve conduction block with increasing repetitions and
durations of DC. After the 12th
DC application, the force was completely attenuated and did not
recover for the remaining 120 min of observation. Estimated charge densities were as follows.
First application: 0.43C/cm2; applications 2-5: 0.65 C/cm
2; applications 6-9: 0.86C/cm
2;
application 10: 0.81C/cm2; application 11-12: 1.3C/cm
2.
Page 86
Chapter 3: DC parameters and mechanisms of ablation
72
3.2.1.2 Constant DC duration and increasing amplitude
In a fourth experiment, the duration of DC application remained constant and the
amplitude was progressively increased. A gradual controlled reduction of the maximal
twitch force was observed (Figure 3.10)
Figure 3.10: Changes in twitch force during and after episodes of DC at progressively increasing
amplitude. In this experiment, 1mA of DC was initially applied for 30 s. A graded reduction in
twitch force was observed as the DC amplitude was increased. Twitch force was eventually
reduced to ~10% of baseline values after 12 applications. The estimated charge densities were as
follows: applications 1-3: 0.32C/cm2; applications 3-6: 0.48C/cm
2; applications 7-9: 0.64C/cm
2;
applications 10-12: 0.8C/cm2.
3.2.1.3 Testing the subcutaneous port
In the experiments described above, DC was applied through the Pt-Ir wire leading
from the distal nerve cuff through the skin. In a clinical application, a subcutaneous
connector would be used. We therefore tested in 4 rabbits whether DC applied through
subcutaneous ports such as the one shown in Figure 3.3, gave similar nerve ablation
results. Figure 3.11 shows the results of one such trial in which 1.5mA of DC was applied
for periods of 30 and 60 s. A gradual reduction in force was observed with successive DC
applications.
Page 87
Chapter 3: DC parameters and mechanisms of ablation
73
Figure 3.11: Changes in twitch force during episodes of DC delivered through a sub-cutaneous
port connector. Initially, 1.5mA of DC was applied for 30 s. Consecutive applications were each 1
min in length. Similar results to those in Figures 3.9 and 3.10, but in this case, a gradual reduction
was evident without increases in DC duration or amplitude. After 8 DC applications, the force was
reduced to ~40% of baseline value. The estimated charge densities calculated in this experiment
were as follows. First application: 0.48C/cm2; applications 2-8: 0.97C/cm
2;
3.2.2 Decerebrate preparation
Decerebrate rigidity appeared about an hour after the procedures described in
3.1.3.3. Rigidity subsequently remained stable, as judged by reflex EMG responses of the
test muscle to repeated stretching prior to DC application, and after this, the responses
of the contralateral leg to sensory stimulation of the foot. Baseline values of force and
EMG were recorded for 4 min followed by DC application for 1.5 min and then
continued observation for 40 min to detect nerve recovery. Figure 3.12 shows the
rectified EMG responses to muscle displacement prior to DC onset (A) at the onset of DC
(B) and 40 min after DC was turned off (C). Figure 3.13, shows superimposed single
stretch cycles before onset of DC, 1 min after onset and 40 min after cessation of DC. At
the onset of DC (Figure 3.12B), EMG activity additional to the stretch-evoked responses
(Figure 3.12A) occurred, indicating that DC had elicited sensory input. These additional
responses quickly subsided and by 1 min after DC onset (Figure 3.13), even the stretch-
evoked response disappeared. They remained absent 40 min after DC ceased (Figure
3.12C and Figure 3.13).
In the decerebrate cat that did not develop rigidity, there was also a brief EMG
response during the DC ramp-up that was additional to the stretch-evoked responses
(Figure 3.14).
Page 88
Chapter 3: DC parameters and mechanisms of ablation
74
Figure 3.12: EMG responses to muscle displacement (positive incline indicates stretch) in the
decerebrate cat that developed rigidity. A) Before DC onset the EMG response was correlated
with displacement. B) At DC onset (3mA) the EMG activity became uncorrelated, indicating an
additional component of EMG elicited by the DC. C) EMG response to stretch 40 min after
cessation of DC at which time, EMG activity was virtually absent.
Page 89
Chapter 3: DC parameters and mechanisms of ablation
75
Figure 3.13: Superimposed EMG traces: Before DC onset (blue), during DC (green) and 40 min
after the cessation of DC (red). One min after DC onset the additional EMG responses shown in
Figure 3.12B subsided and stretch-evoked EMG activity disappeared. EMG responses to muscle
displacement remained absent and could not be detected even 40 min after cessation of DC.
Figure 3.14: Triceps surae EMG and twitch forces during a slow ramp-up of DC and a slow muscle
stretch and release in the cat that did not develop decerebrate rigidity. In this experiment the
triceps surae was stretched slowly back and forth through 15mm (row 4). Twitches were
delivered through the proximal cuff. DC was slowly increased to 1 mA over 5 s (row 2). During
this ramp-up, EMG activity additional to that associated with muscle twitches was observed (row
1 red portion of EMG signal), and this was correlated with an elevation in force (third panel red
circle).
Page 90
Chapter 3: DC parameters and mechanisms of ablation
76
Figure 3.15 shows the rectified EMG and force responses to muscle displacement before
DC (A) and 40 min after DC (B). The muscle force in Figure 3.15A comprised an active
EMG-related component plus a passive component. Only the passive component
remained in Figure 3.15B.
Figure 3.15: EMG (green) and force (blue) responses to muscle displacement (black, stretch
upward) before (A) and 40 min after DC application (B). At 40 min, EMG responses were absent
and only the passive force resulting from the stretch of the inactive muscle was observed.
Figure 3.16 shows the time course of mean rectified EMG and peak active muscle
force in each stretch cycle before, during and after DC was applied to the nerve. The
active force in each cycle was calculated by subtracting the average time course of three
cycles of passive force (Figure 3.15B, blue signal). The peak active forces in each cycle
throughout the experiment were then plotted in Figure 3.16. The mean EMG in each
cycle was calculated from the area under the rectified EMG signal and plotted in Figure
3.16. EMG and force were greatly attenuated during DC application but not entirely
abolished, as they had been in some of the DC applications in the anesthetized rabbits.
During the 40 min post-DC period, no EMG responses to stretching were apparent and
only a very small passive force response was observed.
Page 91
Chapter 3: DC parameters and mechanisms of ablation
77
Figure 3.16: Time course of mean rectified EMG (red) and peak active force (blue) per stretch
cycle in a decerebrate cat. The two dashed vertical lines indicate DC application (3mA for 1.5
min). Both the EMG and active force responses to stretch diminished to zero over a period of 15
min after DC was applied to the nerve, and remained absent for the following 25 min of
observation, indicating that DC had abolished decerebrate rigidity in this muscle.
3.2.2.1 Nerve injury potentials in the absence of decerebrate rigidity
In the cat that did not develop decerebrate rigidity, DC nerve ablation resulted in
spontaneous EMG activity that had the characteristics of denervation (fibrillation)
potentials. It was previously shown (Conrad et al., 1972) that unlike motor unit action
potentials, denervation potentials have a very low variance between consecutive inter-
spike intervals, along with a slow change in the mean of these intervals. This behaviour
can be seen in Figures 3.17 and 3.18. Raw EMG recorded from the left triceps surae of
the decerebrate cat after DC delivery is presented in Figure 3.17. The intervals between
the EMG spikes were calculated and are presented in Figure 3.18. Figure 3.18A shows a
plot of the inter-spike intervals versus time. Note the very small differences between
consecutive inter-spike intervals and the slow trend, first to smaller intervals, then to
larger intervals. We calculated the average proportional consecutive interval difference
to be 18, which is well below the value of 100, proposed as separating fibrillation
potentials from motor unit action potentials (Conrad et al., 1972) Figure 3.18B shows
the joint interval histogram where interval Ii is plotted against the next interval Ii+1 for n
values. This emphasizes the very low variance in consecutive intervals, confirming that
the DC had resulted in nerve injury.
Page 92
Chapter 3: DC parameters and mechanisms of ablation
78
Figure 3.17: nerve injury potentials after DC ablation in a cat that did not develop rigidity after
DC nerve ablation. Raw EMG data from medial and lateral triceps surae as recorded from the left
leg of the decerebrate cat after ablation of twitch force with DC.
Figure 3.18: Nerve injury potentials analysis. A) Interval versus time histogram. This graph shows
the very low difference between successive inter-spike intervals and the slow drift in these
intervals that are characteristic of denervation potentials (Conrad et al, 1972). B) Joint interval
histogram. The small variation between consecutive inter-spike intervals and the slow drift in
these intervals result in a plot in which the points are closely aligned to a straight line with a 45
degree angle.
Page 93
Chapter 3: DC parameters and mechanisms of ablation
79
3.2.3 DC application during conduction block with Lidocaine
Details of animals used in these experiments, DC application parameters and
summary of results can be found in Appendix A, table A.4.
It has been posited that high-frequency electrical stimulation of nerves damages
them by over-activating voltage-gated sodium channels in the neuronal cell membrane
(Agnew & McCreery, 1990). Lidocaine blocks sodium channels (Hille, 1966), the
activation of which is required for the generation of action potentials at nodes of
Ranvier and therefore the propagation of nerve activity. It was found that when
Lidocaine was applied to nerves, this protected them from high-frequency stimulation
(Agnew et al., 1990). We reasoned that if Lidocaine also protected nerves from damage
caused by DC, this would suggest that DC might ablate nerves by over-activating sodium
channels. Accordingly, we performed experiments in 2 rabbits and 1 cat to test this
hypothesis.
At the beginning of the experiment (Figure 3.19), the peak forces of muscle twitches
elicited by supramaximal stimulation through the proximal nerve cuff were recorded for
several minutes to establish the baseline twitch force. A 1% solution of Lidocaine was
then slowly injected over 2-4 min into the distal nerve cuff until muscle twitches started
to rapidly decline. T1, the time from complete abolition of twitches to the time twitch
forces recovered to 60%-80% of baseline was established (see section 3.1.3.2).
Following the recovery of twitch force, an identical dose of Lidocaine was then re-
applied to the nerve. Once nerve conduction was again blocked, DC (3mA) was delivered
for 4 min. Following this, the nerve was allowed to recover for a time greater than 2*T1.
In the two rabbits, the contralateral leg served as a control, where only DC (at identical
amplitude and duration) was applied. In the cat, Lidocaine was used on both the right
and the left leg. The experiment carried out on the right leg was identical to the one
described above in the rabbits’ right legs. In the cat’s left leg, after Lidocaine was
injected into the distal nerve cuff, 1mA of DC was applied for 10 min (Figure 3.20). These
alternative parameters had previously been shown to result in nerve block that lasted
for several weeks in a chronically implanted cat (described in Chapter 4).
In all three animals, after the initial dose of Lidocaine to establish T1, twitch forces in
response to the test stimuli returned to 60%-80% of baseline values within an hour or
two. In one of these cases, the amplitude of the proximal test stimuli was increased,
which returned the twitch forces close to baseline values. In all three experiments,
twitch forces abolished by DC application to the nerve, did not recover, regardless of
whether Lidocaine had been applied to the nerve or not.
Page 94
Chapter 3: DC parameters and mechanisms of ablation
80
Figure 3.19: Lack of neuroprotective action of Lidocaine during DC delivery. Lidocaine was
administered twice, the first time (left arrow) to establish the time course of nerve block and
recovery, the second time (right arrow) to cause nerve block during which DC was delivered.
After the first Lidocaine application, nerve conduction was completely blocked within 14 min. T1,
the time required for the force to begin to recover from the Lidocaine block was 29 min. At the
vertical arrow, the amplitude of the test stimulus pulses was increased at 91 min after the
beginning of the experiment and resulted in increase in twitch force. Lidocaine was re-
administered for a second time and complete conduction block was achieved 5 min later. One
minute after this, 3mA of DC was delivered for 4 min. Force did not recover for the remaining 2
hours of monitoring, indicating that Lidocaine had not protected the nerve from damage.
Figure 3.20: Same as in second half of Figure 3.19, performed in contralateral leg. Lidocaine was
applied as indicated and 10 minutes later, once the nerve was completely blocked, 1mA DC was
delivered to the nerve for 10 min (parameters previously shown to produce a block that lasted
for several weeks: see chapter 4). Force did not recover for the remaining 2 hours of monitoring,
again indicating that Lidocaine had not protected the nerve from damage.
Page 95
Chapter 3: DC parameters and mechanisms of ablation
81
3.2.4 pH testing in saline
In order to determine whether changes in pH may contribute to the conduction block
and damage following DC application, pH testing was conducted in vitro. Two electrodes
designed to deliver DC in vivo were placed in a 100 ml beaker of isotonic saline and
connected to a DC generator. Initial testing in which a few drops of phenol red were
added to the saline, showed that during the application of DC, there was a rapid and
dramatic change in colour of the saline to purple, first around the cathode and then
above it, eventually filling the entire top half of the beaker. This indicated a significant
increase in pH. To obtain more accurate values, thin sections of pH test paper were
placed in the vicinity of the cathode. For the durations and amplitudes of DC tested,
which were similar to those employed in the animals, the pH close to the cathode
changed from a physiological value of about 7.4 to values between 8 and 9.
3.3 Discussion
In this study we explored a range of DC amplitude and duration parameters that
provided controlled amounts of nerve ablation. We then demonstrated that DC
abolished hyperactive stretch reflexes in the absence of anesthesia in a decerebrate
animal model of spasticity. Finally, a possible mechanism of DC nerve ablation was
tested with the use of a Lidocaine blockade of nerve conduction.
The present results confirmed previously reported cumulative effects of DC
application. In the present study, we tested DC amplitudes of 0.75mA and above,
applied for relatively short durations. In the anesthetized animals, complete and
immediate conduction block was apparent in the majority of DC applications. The only
times this did not occur were at the first application, at instances where the DC duration
was brief (< 1min) and where DC amplitude was less or equal to 1mA (e.g. Figure 3.10).
In some of the experiments, one of the parameters (either DC amplitude or duration)
was kept constant while the other was increased. In Figure 3.9, DC amplitude was kept
constant (with the exception of a single DC application). Twitch force did not show a
graded attenuation. Similar results were observed in another animal (not shown). Figure
3.10 depicts the former case, where duration was kept constant and the amplitude was
increased over several applications. A more controlled attenuation can be seen in this
case. In some of the experiments, graded attenuation was observed after repeated DC
applications even though the DC amplitude and duration were constant. More
experiments are required with a larger number of animals to provide more clarity on the
optimal choice of parameters.
The attenuation or complete block of nerve conduction observed in all experiments
was presumably due to a “cathodic block” (Bhadra & Kilgore, 2004) in which a constant
Page 96
Chapter 3: DC parameters and mechanisms of ablation
82
depolarization of the membrane prevents action potentials from propagating. In the
experiment in the decerebtrate cat illustrated in Figure 3.12, a short period of EMG
activity was recorded when DC was turned off (not shown in the figure). This indicates
that a virtual anodic block may also have contributed to conduction block in this case.
Charge densities used in the set of experiments presented in this paper were less
than 1.5C/cm2, which is lower than the charge densities used in previous experiments
(Ravid et al., 2011) but still in the range that was defined as damaging (Merrill et al.,
2005). Charge density was shown to be one of the major predictors of nerve damage
caused by charge-balanced pulsatile stimulation at 50 pulses/s (McCreery et al., 1990).
Our results indicate that charge density may not be a reliable predictor of nerve damage
caused by DC. In the experiments of Figures 3.7 and 3.8, an identical net charge was
delivered (0.75mA for 2 min). However, the electrode surface areas, and therefore the
charge densities, differed in the two experiments (0.38C/cm2 in Figure 3.7 and
0.97C/cm2 in Figure 3.8). Complete ablation was reached after 6 DC applications in the
experiment of Figure 3.7, whereas even after 14 DC applications at the higher charge
density (Figure 3.8), nerve ablation was still incomplete.
As was mentioned in chapter 2, cumulative effects of DC conduction block were
observed after multiple consecutive applications of DC: force was attenuated faster and
remained attenuated longer after successive applications. This is seen in Figures 3.8-
3.10. In Figure 3.8 each DC application was 2 min in duration. In applications 1-7
complete conduction block was noted during DC delivery only. Further applications (8-
14) resulted in conduction block persisting with increasing durations after the cessation
of DC (except for application 14). In Figure 3.9 and 3.10 increased durations of
conduction block were noted from the 7th DC application onwards. One interesting
observation was the change in the duration of conduction block as the intervals
between DC applications were changed. In Figure 3.8, the interval between DC
applications 9 and 13 was 10 min and cumulative effects were noted (progressively
longer conduction blocks). The interval between applications 13 and 14 was 60 min. The
duration of conduction block seen after the 14th application was shorter than that after
the 13th application (2 min and 5 min respectively). This suggested that the longer the
interval between DC applications, the more the nerve recovers, reducing the duration of
conduction block (and presumably the amount of nerve damage) resulting from a
subsequent DC application. However, a different result was seen in Figure 3.9. The
intervals between applications 8-11 were 20 min, 15 min and 15 min respectively and as
in Figure 3.8, longer conduction blocks were observed with each application. However,
the interval between the penultimate and final applications was 38 min yet the final
application produced a complete and lasting conduction block. In a previous study,
longer DC “off” durations resulted in faster nerve recovery from DC block (Ackermann et
al., 2011). These results were obtained using a SINE (separate interface nerve
electrode), discussed below, which did not result in nerve damage. Though the results in
Figure 3.8 also suggest that longer “off” intervals allow more nerve recovery, the results
of Figure 3.9 show that this cannot be relied upon.
What is the mechanism by which nerves are damaged by electrical current? One
possibility is that the damage is caused by electrochemical processes associated with
the injection of large currents across the metal-tissue interface. In a study that tested
Page 97
Chapter 3: DC parameters and mechanisms of ablation
83
this hypothesis, it was shown that Lidocaine or Procaine administered to nerves and
blocking conduction in them, protected them from the otherwise damaging effect of
charge balanced, high-frequency stimulation (Agnew et al., 1990). Nerves treated with
the local anesthetics showed no sign of damage and were histologically similar to un-
stimulated nerves, while nerves that were stimulated but not treated with anesthetics
showed signs of axonal degeneration. Agnew et al. concluded that the nerve damage in
the absence of local anesthetics did not result from electrochemical reactions, but
rather from some process (e.g. hyperactivity of the damaged nerves or activation of
sympathetic nerve axons, reducing the oxygen supply) which was suppressed by the
local anesthetics. In our experiments, DC abolished muscle twitches, which is
inconsistent with nerve hyperactivity. Furthermore, nerves treated with Lidocaine did
not recover from the application of DC. In Figure 3.19 after the initial control Lidocaine
application, an increase in stimulation amplitude was needed to restore the twitch
forces to pre-Lidocaine baseline values, indicating a persistent effect of the Lidocaine or
perhaps of the low-pH saline used to wash out the Lidocaine. It could be argued that the
second dose of Lidocaine had an even longer lasting effect, obscuring an eventual
recovery from the DC application. In order to rule this out, Lidocaine was applied only
once to the nerve in the contralateral leg of the cat, followed by an application of DC
using current and duration parameters previously shown to produce ablation (Figure
3.20). Lidocaine was not neuroprotective in this experiment either, so the mechanisms
suggested by Agnew et al. are unlikely to explain DC nerve damage.
This is further supported by work done by Ackerman et al. (Ackermann et al., 2011)
in which DC was delivered either using a Pt-Ir electrode to deliver DC to a nerve or an
electrode in which the metal electrode and the nerve cuff interface were physically
separated with a column of electrolyte inside a silicone tube (separate interface nerve
electrode: SINE). When the Pt-Ir electrode was used to deliver DC, there was evidence
of rapid, irreversible nerve damage, whereas DC delivered with the SINE caused nerve
conduction block during DC, but conduction was completely restored within seconds to
minutes after DC ceased. These findings point to a mechanism at the metal-tissue
interface.
Nerve damaging electrochemical reactions at the electrode-tissue interface might
persist even after the cessation of DC delivery. Evidence of this may be seen in the
results of several experiments. In Figure 3.7 for example, continuing attenuation in force
was noted following the third, fourth and sixth applications of DC. In Figure 3.11
continuing force attenuation was noted after the 4th application of DC (the second
application of 1.5mA for 1min). In the decerebrate preparation continuing attenuation
of force after the cessation of DC was also noted (Figure 3.16). It is unclear at this point
why the force continued to decrease after the cessation of DC on some occasions and
not others.
At high concentrations, Lidocaine itself can cause nerve degeneration (Kroin et al.,
1986). In the present study, 1% Lidocaine was injected twice onto nerves. Previous
studies have shown that at this concentration Lidocaine produced temporary nerve
blocks that did not result in a lasting loss of motor function. Furthermore, Kroin et al.
showed that repeated Lidocaine administration at this concentration inside a nerve cuff
3 times a day over 3 days did not result in nerve damage (Kroin et al., 1986). Considering
Page 98
Chapter 3: DC parameters and mechanisms of ablation
84
these data, we can safely assume that the nerve damage caused by DC during a
Lidocaine-induced conduction block cannot be attributed to the Lidocaine.
Another possible factor that may contribute to nerve damage is a change in pH in the
extracellular fluid at the electrode-nerve interface. The results of experiments described
in 3.1.3.5 showed that pH levels rose to between 8 and 9 near the cathode when DC at
amplitudes and durations similar to those delivered in the animals was delivered in an
isotonic electrolyte solution. Similar results were seen in a previous study in which color
pH indicators were used to test pH changes when DC was delivered in a solution that
simulated the electrolytic composition of blood (Stevenson et al., 2010). Mortimer et al.
suggested that the rate of change in pH was responsible for tissue damage by electrical
stimulation and not the change in pH itself (Mortimer et al., 1980). These researchers
found that current densities above 50µA/mm2 damaged muscle tissue. This is an order
of magnitude less than the current densities in the experiments described in this thesis,
so the pH changes in our experiments may have been much greater. However, another
study (Huang et al., 2001) showed that pH shifts observed in vivo following unbalanced
electrical stimulation were smaller than ones measured in vitro, probably due to the
buffering action of proteins. Results from neurofilament H staining (chapter 2) showed
that nerve damage was localized to an area inside the cuff. It is conceivable that the cuff
restricted the spread of alkaline reaction products and those that escaped were
physiologically buffered by extracellular fluid. The damage seen within the cuff could
thus still have been a result of a large increase in pH. Further pH testing during DC
application to peripheral nerves in vivo should be conducted in order to determine the
true shift in pH that occurs during such stimulation.
In relation to this, one unexpected feature of our Lidocaine experiments was that
twitch forces did not recover fully after the application of the Lidocaine solution alone
(Figure 3.19). Furthermore, in the experiment of Figure 3.19, even though the test
stimuli (0.6mA pulses) prior to the Lidocaine infusion were supramaximal (increases did
not elicit larger twitches), during the recovery period, this was no longer the case: an
increase of pulse amplitude 0.8mA pulses was needed to elicit maximal twitch
responses. During the 90 min following DC application to the nerve, we increased the
amplitude of the test stimuli again, to check that that the abolition of twitches was not
simply due to a further increase in the threshold to the test stimuli. Previously nerves
have been shown to recover conduction fully from a complete Lidocaine block. One
factor in our experiments that could account for this was the use of isotonic saline from
intravenous drip bags to flush the distal nerve cuff after Lidocaine injection. The quoted
pH of these solutions is 5.5. It is likely that during the flushing procedure, some of the
saline entered the proximal cuff, which was only 10mm or so proximal to the distal cuff.
The ensuing shift in pH may have increased the threshold of the nerve in the proximal
cuff. In several classical experiments, it was shown that reductions in pH in the
extracellular fluid around mammalian nerves significantly increased their thresholds to
electrical stimulation (Lehmann, 1937; Koenig & Groat, 1945).
In the present study there was evidence of nerve injury potentials after DC ablation
in the decerebrate cat that demonstrated similar characteristics to denervation
potentials and nerve injury discharge. Recordings from chronically injured afferents
(Matzner & Devor, 1994) as well as denervation potentials in EMGs recorded in
Page 99
Chapter 3: DC parameters and mechanisms of ablation
85
individuals with peripheral nerve injuries (Conrad et al., 1972), show a characteristically
very low variability in the durations of consecutive intervals. It was found that the axons
chosen in Matzner’s study discharged at fixed intervals (Matzner & Devor, 1994), while
denervation potentials demonstrated a slow drift in the mean interval duration (Conrad
et al., 1972). Figure 3.18 shows denervation potentials features in an EMG recording
from a decerebrate cat following nerve ablation with DC. However, the maximal
individual discharge frequency measured from the EMG data (Figure 3.17) was 45
impulses/s. This frequency is more in line with discharge frequencies measured from
chronically injured afferents (13-60 impulses/s) (Matzner & Devor, 1994) than
denervation potentials frequencies (< 20 impulses/s) (Conrad et al., 1972). This indicates
that DC was causing immediate nerve damage.
It is difficult to perform functional muscle tests during DC application to nerves in
conscious animals. In order to test whether DC causes enough nerve ablation to reduce
spasticity when applied in the absence of anesthesia, we conducted an experiment in
which DC was delivered to the tibial nerve of an unanesthetized, decerebrate cat that
had developed decerebrate rigidity. The results, presented in Figures 3.12 and 3.15,
showed a complete reduction in force and EMG. This provides initial evidence that DC
could reduce spastic hypertonus.
The work presented in this report demonstrates that nerve ablation with relatively
short durations of DC is effective in reducing muscle force in a controlled manner. The
durations and currents we used are within a clinically acceptable range. Further studies
of the mechanism of DC nerve ablation are needed. Before a clinical trial could be
considered, potential adverse effects such as pain during DC and the development of
neuropathic pain need to be evaluated in chronically implanted animals.
Page 100
Chapter 3: DC parameters and mechanisms of ablation
86
3.4 References
Ackermann DM, Jr., Bhadra N, Foldes EL & Kilgore KL. (2011). Separated interface nerve
electrode prevents direct current induced nerve damage. J Neurosci Methods
201, 173-176.
Agnew WF & McCreery DB. (1990). Considerations for safety with chronically implanted
nerve electrodes. Epilepsia 31 Suppl 2, S27-32.
Agnew WF, McCreery DB, Yuen TG & Bullara LA. (1990). Local anaesthetic block protects
against electrically-induced damage in peripheral nerve. Journal of biomedical
engineering 12, 301-308.
Barker E. (2008). Managing spasticity with intrathecal drug delivery. Rn 71, 24-29; quiz
30.
Bhadra N & Kilgore KL. (2004). Direct current electrical conduction block of peripheral
nerve. IEEE Trans Neural Syst Rehabil Eng 12, 313-324.
Bovend'Eerdt TJ, Newman M, Barker K, Dawes H, Minelli C & Wade DT. (2008). The
effects of stretching in spasticity: a systematic review. Arch Phys Med Rehabil
89, 1395-1406.
Brogardh C, Flansbjer UB & Lexell J. (2012). No specific effect of whole-body vibration
training in chronic stroke: a double-blind randomized controlled study. Arch
Phys Med Rehabil 93, 253-258.
Caliandro P, Celletti C, Padua L, Ileana M, Giusy R, Granata G, La Torre G, Enrico G &
Camerota F. (2012). Focal muscle vibration in the treatment of upper limb
spasticity: a pilot randomized controlled trial in chronic stroke patients. Arch
Phys Med Rehabil.
Conrad B, Sindermann F & Prochazka VJ. (1972). Interval analysis of repetitive
denervation potentials of human skeletal muscle. Journal of neurology,
neurosurgery, and psychiatry 35, 834-840.
Coupar F, Pollock A, Rowe P, Weir C & Langhorne P. (2012). Predictors of upper limb
recovery after stroke: a systematic review and meta-analysis. Clin Rehabil 26,
291-313.
Page 101
Chapter 3: DC parameters and mechanisms of ablation
87
Dolly O. (2003). Synaptic transmission: inhibition of neurotransmitter release by
botulinum toxins. Headache 43 Suppl 1, S16-24.
Elia AE, Filippini G, Calandrella D & Albanese A. (2009). Botulinum neurotoxins for post-
stroke spasticity in adults: a systematic review. Mov Disord 24, 801-812.
Elovic EP, Esquenazi A, Alter KE, Lin JL, Alfaro A & Kaelin DL. (2009). Chemodenervation
and nerve blocks in the diagnosis and management of spasticity and muscle
overactivity. Pm R 1, 842-851.
Fortuna R, Vaz MA, Youssef AR, Longino D & Herzog W. (2011). Changes in contractile
properties of muscles receiving repeat injections of botulinum toxin (Botox). J
Biomech 44, 39-44.
Goldstein EM. (2001). Spasticity management: an overview. J Child Neurol 16, 16-23.
Gracies JM, Nance P, Elovic E, McGuire J & Simpson DM. (1997). Traditional
pharmacological treatments for spasticity. Part II: General and regional
treatments. Muscle Nerve Suppl 6, S92-120.
Hille B. (1966). Common mode of action of three agents that decrease the transient
change in sodium permeability in nerves. Nature 210, 1220-1222.
Huang CQ, Carter PM & Shepherd RK. (2001). Stimulus induced pH changes in cochlear
implants: an in vitro and in vivo study. Annals of biomedical engineering 29, 791-
802.
Kita M & Goodkin DE. (2000). Drugs used to treat spasticity. Drugs 59, 487-495.
Koenig H & Groat RA. (1945). Effects of lowering the blood pH on excitability of the
nervous system. Journal of neurophysiology 8, 267-272.
Kong KH, Lee J & Chua KS. (2012). Occurrence and temporal evolution of upper limb
spasticity in stroke patients admitted to a rehabilitation unit. Arch Phys Med
Rehabil 93, 143-148.
Kroin JS, Penn RD, Levy FE & Kerns JM. (1986). Effect of repetitive lidocaine infusion on
peripheral nerve. Experimental neurology 94, 166-173.
Page 102
Chapter 3: DC parameters and mechanisms of ablation
88
Lau RW, Yip SP & MY. P. (2012). Whole-Body Vibration Has No Effect on Neuromotor
Function and Falls in Chronic Stroke. Med Sci Sports Exerc.
Lehmann JE. (1937). The effect of changes in the pH on the action of mammalian A
nerve fibers. American journal of physiology 18, 600-612.
Lundstrom E, Terent A & Borg J. (2008). Prevalence of disabling spasticity 1 year after
first-ever stroke. Eur J Neurol 15, 533-539.
Matzner O & Devor M. (1994). Hyperexcitability at sites of nerve injury depends on
voltage-sensitive Na+ channels. Journal of neurophysiology 72, 349-359.
Maynard FM, Karunas RS & Waring WP, 3rd. (1990). Epidemiology of spasticity following
traumatic spinal cord injury. Arch Phys Med Rehabil 71, 566-569.
McCreery DB, Agnew WF, Yuen TG & Bullara L. (1990). Charge density and charge per
phase as cofactors in neural injury induced by electrical stimulation. IEEE Trans
Biomed Eng 37, 996-1001.
Merrill DR, Bikson M & Jefferys JG. (2005). Electrical stimulation of excitable tissue:
design of efficacious and safe protocols. J Neurosci Methods 141, 171-198.
Mortimer JT, Kaufman D & Roessman U. (1980). Intramuscular electrical stimulation:
tissue damage. Annals of biomedical engineering 8, 235-244.
NSCISC. (2012). Spinal Cord Injury Facts and Figures at a Glance. National Spinal Cord
Injury Statistical Center, birmingham, Alabama.
O'Brien CF. (2002). Treatment of spasticity with botulinum toxin. Clin J Pain 18, S182-
190.
Ravid EN, Gan LS, Todd K & Prochazka A. (2011). Nerve lesioning with direct current. J
Neural Eng 8, 016005.
Rizzo MA, Hadjimichael OC, Preiningerova J & Vollmer TL. (2004). Prevalence and
treatment of spasticity reported by multiple sclerosis patients. Mult Scler 10,
589-595.
Page 103
Chapter 3: DC parameters and mechanisms of ablation
89
Roger VL, Go AS, Lloyd-Jones DM, Benjamin EJ, Berry JD, Borden WB, Bravata DM, Dai S,
Ford ES, Fox CS, Fullerton HJ, Gillespie C, Hailpern SM, Heit JA, Howard VJ,
Kissela BM, Kittner SJ, Lackland DT, Lichtman JH, Lisabeth LD, Makuc DM,
Marcus GM, Marelli A, Matchar DB, Moy CS, Mozaffarian D, Mussolino ME,
Nichol G, Paynter NP, Soliman EZ, Sorlie PD, Sotoodehnia N, Turan TN, Virani SS,
Wong ND, Woo D & Turner MB. (2012). Heart disease and stroke statistics--2012
update: a report from the American Heart Association. Circulation 125, e2-e220.
Rothwell PM. (2001). The high cost of not funding stroke research: a comparison with
heart disease and cancer. Lancet 357, 1612-1616.
Simon O & Yelnik AP. (2010). Managing spasticity with drugs. Eur J Phys Rehabil Med 46,
401-410.
Sommerfeld DK, Eek EU, Svensson AK, Holmqvist LW & von Arbin MH. (2004). Spasticity
after stroke: its occurrence and association with motor impairments and activity
limitations. Stroke 35, 134-139.
Stevenson M, Baylor K, Netherton BL & Stecker MM. (2010). Electrical stimulation and
electrode properties. Part 2: pure metal electrodes. American journal of
electroneurodiagnostic technology 50, 263-296.
Taricco M, Pagliacci MC, Telaro E & Adone R. (2006). Pharmacological interventions for
spasticity following spinal cord injury: results of a Cochrane systematic review.
Eura Medicophys 42, 5-15.
Teasell R, Foley N, Pereira S, Sequeira K & Miller T. (2012). Evidence to practice:
botulinum toxin in the treatment of spasticity post stroke. Top Stroke Rehabil
19, 115-121.
van Kuijk AA, Geurts AC, Bevaart BJ & van Limbeek J. (2002). Treatment of upper
extremity spasticity in stroke patients by focal neuronal or neuromuscular
blockade: a systematic review of the literature. J Rehabil Med 34, 51-61.
Ward A, Roberts G, Warner J & Gillard S. (2005). Cost-effectiveness of botulinum toxin
type a in the treatment of post-stroke spasticity. J Rehabil Med 37, 252-257.
Watkins CL, Leathley MJ, Gregson JM, Moore AP, Smith TL & Sharma AK. (2002).
Prevalence of spasticity post stroke. Clin Rehabil 16, 515-522.
Page 104
Chapter 3: DC parameters and mechanisms of ablation
90
Welmer AK, von Arbin M, Widen Holmqvist L & Sommerfeld DK. (2006). Spasticity and
its association with functioning and health-related quality of life 18 months after
stroke. Cerebrovasc Dis 21, 247-253.
Whitwam JG & Kidd C. (1975). The use of direct current to cause selective block of large
fibres in peripheral nerves. Br J Anaesth 47, 1123-1133.
Wolf SL, Milton SB, Reiss A, Easley KA, Shenvi NV & Clark PC. (2012). Further assessment
to determine the additive effect of botulinum toxin type a on an upper
extremity exercise program to enhance function among individuals with chronic
stroke but extensor capability. Arch Phys Med Rehabil 93, 578-587.
Page 105
91
Chapter 4
Nerve lesioning with direct current (DC): delivery of
DC in chronically implanted animals in the
anesthetized and conscious state
Spastic hypertonus is a condition resulting from upper motoneuron lesions such as
spinal cord injury (SCI), stroke, multiple sclerosis (MS) or cerebral palsy (CP), and is
characterized by muscle over-activity. It is defined as “disordered sensori-motor control,
resulting from an upper motor neurone lesion, presenting as intermittent or sustained
involuntary activation of muscles” (Pandyan et al., 2005). Spastic hypertonus can lead to
reductions in range of motion and limitations in activity. Individuals with spasticity
achieved lower scores in tests of activities of daily life (ADL) (Sommerfeld et al., 2004;
Welmer et al., 2006; Lundstrom et al., 2008) and were found to be more likely to be
placed in long term care facilities (Watkins et al., 2002). Other reported complications
include: clenched fists resulting in skin breakdown and infection, contractures, pressure
on nerves and negative body perception (Mayer, 2010). Such complications can impede
personal care including grooming and dressing. In SCI populations, spasticity was the
most commonly reported secondary complication, ahead of pain and pressure ulcers
(Maynard et al., 1990).
Over seven million individuals currently living in the United States (US) have
experienced a stroke, with 710,000 events occurring every year (Roger et al., 2012).
Over 30% of victims experience motor deficits. The incidence of spasticity after stroke
ranges from 17% (Lundstrom et al., 2008) to over 38% (Watkins et al., 2002) in stroke
survivors. The prevalence of SCI is estimated at 270,000 affected individuals in the US
(NSCISC, 2012). The incidence of spasticity after SCI is reported at over 60% (Maynard et
al., 1990).
Current treatments of spasticity include physiotherapeutic methods such as stretch
and vibration, anti-spastic drugs, surgical interventions and injections of neurolytic
agents. Though conventional physiotherapy is considered indispensable for the
treatment of spasticity, approaches such as stretching (Bovend'Eerdt et al., 2008), whole
body vibration (Lau RW et al., 2012), splinting (Lannin et al., 2003) and cooling (Gracies,
2001) have not proven to be effective. The primary importance of physiotherapy lies in
its contribution to outcomes when combined with other treatment modalities
(Goldstein, 2001). Anti-spastic drugs such as Baclofen, Dantrolene and Tizanidine may
Page 106
Chapter 4: Delivery of DC in chronically implanted animals
92
help control spasticity but evidence for their efficacy is weak and incomplete (Montane
et al., 2004). Side effects of these drugs such as sedation, dizziness, nausea and
weakness are common (Rizzo et al., 2004). Surgical intervention is recommended when
contractures occur and all other treatment avenues are exhausted (Heijnen et al., 2008).
Chemodenervation agents such as phenol and alcohol have been used to treat spasticity
for decades (Zafonte & Munin, 2001) but injections are painful and a favorable outcome
highly depends on the expertise of the physician (Elovic et al., 2009). Botulinum toxin A
(BtA) is considered effective for the control of spasticity (Esquenazi, 2006), but is costly
(Horn et al., 2010). Its effect is only observed approximately two to four weeks after
injection (McGuire, 2001). Although better tolerated than phenol (Kirazli et al., 1998),
BtA can migrate in the body and affect other muscles that are not in the vicinity of the
injection site (Fortuna et al., 2011).
Despite the variety of treatments offered for spasticity, functional benefits have not
been clearly demonstrated, and in some cases, the treatments can evidently even
impede the desired improvements in function (Elovic, 2001; van Kuijk et al., 2002).
Furthermore, the large number of individuals affected by stroke and the extensive care
required to treat them, places a heavy burden on the health care system (Rothwell,
2001).
The application of direct current (DC) to partially ablate nerves using implantable
electrodes was suggested as a novel, cost-effective treatment for spasticity (Ravid et al.,
2011). In that report we showed that careful application of DC, in an acute experimental
setting, resulted in a controlled amount of reduction in muscle force. Preliminary
experiments in chronically implanted animals, conducted under anesthesia, were
described as well. In this chapter, we further explore the use of DC to lesion the nerve in
a controlled manner in the chronically implanted animal, both under anesthesia and in
the conscious state. Electrodes designed for use in conscious animals are described.
4.1 Methods
All the procedures described below were approved by the University of Alberta
Animal Care and Use Committee.
4.1.1 Electrode design for conscious animal experiments
In the design of an implantable electrode for DC nerve ablation, several issues had to
be addressed, including the design of a robust nerve cuff, an easily accessible port that
would be placed under the skin preventing the animal from damaging or removing it
and potential human clinical applications.
Page 107
Chapter 4: Delivery of DC in chronically implanted animals
93
Each electrode was composed of a nerve cuff terminal (Figure 4.1), a lead and a
subcutaneous port (Figure 4.2). The leads that delivered current pulses to nerves to test
conduction were made of multi-stranded stainless steel wire (AS632, Cooner Wire,
Chatsworth, CA). The leads that were used to deliver DC to ablate nerves were made of
Platium-Iridium (Pt-Ir) wire (0.003” bare, or 0.0055” coated, A-M Systems Inc, Carlsborg,
WA).
4.1.1.1 Nerve Cuffs
The lead wires, (stainless steel or Pt-Ir), were coiled inside a silicone tube (508-006,
Dow Corning Corporation, Midland, MI). The leads terminated in a nerve cuff comprised
of a strip of silicone with a serrated tongue at one end, designed to be wrapped around
a nerve and inserted into a slot in the silicone strip, close to the conductive terminal
(Figure 4.1). The strip functioned like a “tie-wrap,” which was used to fix electrodes to
the nerve (Kowalczewski, 2009). Inside each cuff there was a single conductive terminal
5mm in length. The terminal was formed from the lead wire, which emerged from the
silicone tube and was coiled tightly around the outside of a second, smaller silicone tube
(508-003, Dow Corning Corporation, Midland, MI). Both tubes were filled with silicone
sealant (RTV 118, Momentive Performance Materials, Waterford, NY).
Figure 4.1: Nerve cuff and lead. a) Conductive terminal comprised of coiled Pt-Ir wire. b) Silicone
“tie wrap”. c) Tie down used to secure the electrode to the fascia. d) Coiled lead inside a silicone
tube.
4.1.1.2 Subcutaneous ports
The connectors implanted under the skin were prototypes of insulated, conductive
subcutaneous ports suitable for human clinical applications, where repeated sessions of
controlled nerve ablation were anticipated. The idea was to develop a port into which a
hypodermic needle or fine wire, insulated except for its tip, could be introduced through
Page 108
Chapter 4: Delivery of DC in chronically implanted animals
94
the skin, providing a temporary electrical connection to the nerve ablation lead. We
experimented with both needles and wires. The needles were those of intravenous
catheter sets (see below). Alternatively, a length of AS631 Cooner wire, insulated except
for its tip, was loaded into a 21G hypodermic needle. The uninsulated end of the wire
was folded back from the tip of the needle to form a small (~5mm long) hook. The
needle was then inserted into the conductive material as described above and then
pulled back, leaving the uninsulated end of the wire securely embedded in the
conductive material of the port. The other end of the wire was then connected to a DC
or pulse generator. A schematic of the port and methods of insertion are shown in
Figure 4.2.
The port was composed of two thin 2x2 cm stainless steel plates (SS316 flat pack,
0.010”, Mauldin products, Kemah, TX) or Beryllium copper (0.1” in width). The electrode
lead was soldered to one of the plates and the plates were then glued together with
silver conductive epoxy (8331-14G, MG chemicals, B.C.), sandwiching the solder joint
between them. A 2x2 cm sheets of conductive rubber (C5020PF Canadian Medical
Products Ltd, Scarborough ON) or 2x2 cm sheets of conductive silicone (71-ECD-70D-
0.32, CS Hyde, Lake Villa, IL) were glued to one of the plates with the same epoxy. In a
later design two or three layers of the same conductive material were used (Figure 4.2).
The second plate was glued to a non-conductive silastic sheet (0.010”+/- .002, material:
SSF-METN-750, Specialty Silicone Fabricators, Paso Robles, CA) with silicone sealant. The
silastic sheet was 2x3 cm in size, accomodating space to secure the coiled lead to the
sheet in order to provide stress relief. In an early design a single silastic sheet was used.
In a later design two silastic sheets glued together with a very thin layer of silicone
sealant were employed. This alteration was made because we suspected that the silastic
sheet was permeable and had allowed the ingress of extracelular fluid. The entire port
and emerging section of lead were coated with a layer of silicone sealant. A photograph
of a subcutaneous port is shown in Figure 4.3.
Figure 4.2: Schematic drawing of the subcutaneous port. A metal plate was secured to a silastic
sheet on one side, and to a second metal plate on the other side. The solder joint between the
lead and one of the plates was sandwiched between the plates. Layers of conductive rubber or
conductive silicone were secured to the second plate and the entire port was coated with
Page 109
Chapter 4: Delivery of DC in chronically implanted animals
95
silicone sealant. Two methods were used to connect to the subcutaneous port. One method
involved the insertion of a hypodermic needle, insulated except for the tip and connected to a
wire lead. In the other method a wire lead, insulated except for the tip, was inserted into the
conductive material via a hypodermic needle. The needle was retracted and the wire was left in
the conductive material.
(A) (B)
Figure 4.3: Subcutanous port: top and bottom view. A) Top view. a) Conductive silicone covered
with silicone sealant. Three layers of conductive silicone were used. b) Two silastic sheets glued
with a very thin layer of silicone sealant. c) Silicone sealant coating. d) Coiled lead inside a
silicone tube secured to the silastic sheet for stess relief. B) Bottom view a) Silastic sheets. b)
Beryllium copper plate. c) Silicone sealant coating. d) Coiled lead inside a silicone tube.
In animals that were assigned to be stimulated without the use of anesthesia an
anode was implanted under the skin of the back near the tail. This was done in order to
avoid attaching large surface electrodes to the skin of the animal during DC applications.
The implantable anode was composed of two stainless steel plates connected with
conductive epoxy. A 2x2 cm sheet of conductive rubber or conductive silicone was glued
to one of the plates with the conductive epoxy. Two layers of conductive material were
used. The anode was covered with silicone sealant except for an area on the bottom
stainless steel plate (Figure 4.4). During experiments, the conductive ends of insulated
wires were introduced percutaneously into the conductive rubber or silicone layers as
described above. Current was delivered through the wires and transmitted to the
stainless steel plate by the conductive rubber or silicone. The exposed underside of the
plate delivered the current to the tissues.
Page 110
Chapter 4: Delivery of DC in chronically implanted animals
96
(A) (B)
Figure 4.4: Implantable anode: top and bottom view. A) Top view. a) Conducive silicone covered
with silicone sealant. b) A strip of silastic sheet used to secure the anode to the fascia. B) Bottom
view. a) Stainless steel plate b) Strip of silastic sheet to be used as tie down.
The initial design used a single sheet of conductive rubber which proved to be too
thin for the needle insertion method. The needle used was a 24G intravenous injection
needle having a Teflon sleeve (BD Insyte-W shielded IV catheters, BD medical, Utah). A
lead wire was soldered to the needle close to its hub. The needle was inserted through
the skin, into the port at a slanted angle, to maximize the amount of conductive rubber
contacted by the tip. However, we found that the single layer of conductive rubber did
not secure the needle in place sufficiently. Furthermore, the sleeve tended to get
crumpled back during insertion. Skin movement when the animal was awake, caused
the needle to be displaced from the port. The addition of a second layer of conductive
rubber did not improve the stability of the needle connection. The use of the wire as
connector was more reliable than the use of the needle, but the wire had to be inserted
deep into the conductive rubber in order to be secure and avoid pull-out while the
animal was awake and mobile. For these reasons, the conductive rubber was
abandoned for conductive silicone, which was softer and allowed for easier insertion,
though even in this case needles tended to pull out. Wire insertion proved to be much
easier, more dependable and secure with conductive silicone than with conductive
rubber. One of the problems encountered with this port configuration (regardless of the
conductive material used), was the appearance of tears in the silicone sealant coating,
after multiple needle insertions. This raised the suspicion that the tears might have
allowed leakage of current from the port. Susceptible areas for tears were the sides of
the ports, when insertion was imprecise. However, preliminary testing in saline did not
confirm leakage of current when a port with previous multiple needle insertions and
tears was tested.
4.1.2 Surgical procedures
4.1.2.1 Chronic surgical procedure in rabbit
In two rabbits, a pair of monopolar nerve cuffs was implanted on the common
peroneal nerve of one leg. Implanted electrodes are described in section 4.1.1. The
proximal cuff was made of a stainless steel terminal and lead, the distal cuff was made
Page 111
Chapter 4: Delivery of DC in chronically implanted animals
97
of a Pt-Ir terminal and lead. The conductive material used in the subcutaneous port was
conductive rubber. In one additional rabbit, only a single monopolar nerve cuff was
implanted on the common peroneal nerve of one leg. Implanted electrodes were as
described in section 4.1.1. The nerve cuff terminal and lead were composed of Pt-Ir wire
and conductive silicone was used in the subcutaneous port. The omission of one
electrode in the latter implant procedure was done in order to reduce possible damage
to the common peroneal nerve due to multiple cuff placements and to allow easier
recovery from surgery. An anode was implanted on the lower back of all three rabbits
approximately 2 cm rostral to the base of the tail. The implant surgery was performed in
a fully equipped operating room with sterile equipment and procedures. The following
pre-operative medications were administered: Acepromazine (0.05 mg/kg SC), Ketamine
(10 mg/kg SC) and Glycopyrrolate (0.01 mg/kg SC). The rabbits were anesthetized with
isoflurane (Forane, Baxter Corp., Toronto, ON, Canada). Anesthesia was maintained with
2-3% isoflurane in carbogen at 1.5 L/min. An intravenous catheter was inserted in the
marginal ear vein and a saline drip was administered. Body temperature was maintained
using a warm-water heating pad. Respiration and heart rate were monitored
throughout the surgery. The legs and back were closely shaved, cleaned with soap and
swabbed with iodine solution.
Tie downs (as shown in Figure 4.1) were secured with a 3-0 Silk suture. Muscle
incisions as well as skin incisions on the back were closed with 4-0 Vicryl sutures. Skin
incisions on the rabbits’ legs were closed with 3-0 Prolene sutures. Thirty minutes
before the rabbit was taken off anesthesia, ketoprofen (0.5-1 mg/kg SC) was
administered to minimize discomfort. During post-operative recovery, the rabbit was
kept warm in a heated cage and was also provided with blankets. Analgesia was
maintained by giving ketoprofen (0.5-1mg/Kg SC) up to three days post-surgery. Baytril
(5 mg/Kg SC) was administered for seven days after surgery.
4.1.2.2 Chronic surgical procedure in cat
A detailed account of this procedure was previously published (Ravid et al., 2011)
and is briefly reviewed here. In two cats (cats 2 and 3, table A.3 Appendix A), pairs of
nerve cuff electrodes were implanted on the common peroneal nerve of each leg. The
distal cuff had a 5mm long terminal, formed from a Platinum Iridium (Pt-Ir) wire wound
around a silicone tube and secured to a zip tie cuff, as in Figure 4.1. The proximal nerve
cuff terminal was identical in design to the Pt-Ir nerve cuff terminal but was made from
stainless steel wire, as was the lead. The lead wire from the nerve cuff terminal in the
distal electrode differed in the two cats. In the first cat, the lead was made of stainless
steel and the terminal was made from Pt-Ir, requiring a stainless steel-Pt-Ir solder joint
as previously described (Ravid et al., 2011). In the second cat, the lead wire was made
from Pt-Ir, as was the terminal. No solder joint was necessary since the bare end of the
lead wire was coiled around the silicone tube to create the terminal. This change in
design occurred due to failure of the stainless steel-Pt-Ir joint several months after
implantation. The leads from the proximal and distal nerve cuff terminals were tunneled
under the skin of the animal’s back to a connector secured in a percutaneous, acrylic
headpiece attached to the skull with screws.
Page 112
Chapter 4: Delivery of DC in chronically implanted animals
98
Both cats were anesthetized with isoflurane and anesthesia was maintained with 2-
3% in carbogen (1.5L/min). At extubation, ketoprofen (0.5-1 mg/kg sc) was given to
minimize discomfort. During post-operative recovery, the cats were kept warm in a
heated cage and were also provided with blankets. Analgesia was maintained by giving
Hydromorphone (0.05-0.1mg/Kg SC) six hours after recovery. A single injection of
Convenia was administered to prevent infections.
4.1.3 Experimental procedures
Experiments were performed on 2 cats and 3 rabbits. Two types of procedure were
carried out.
Procedure 1: Force measurements done under anesthesia. The twitch forces elicited by
test stimuli applied through the proximal nerve cuff were measured. This was done
weekly for one to 5 weeks prior to DC nerve ablation and for several weeks thereafter.
Procedure 2: DC nerve ablation. This was performed either under anesthesia (2 cats) or
in the awake animal (1 cat, 3 rabbits). Force or acceleration were monitored before and
after DC delivery and in 2 cats and 1 rabbit, during DC delivery.
4.1.3.1 Experimental setup and procedures in the implanted cat during brief periods of
anesthesia
After the animals had recovered from the implantation surgery, two procedures
were performed during brief periods of isoflurane anesthesia performed at weekly
intervals. In both procedures, the cat was placed in a prone position. The hind limb was
held by a retort clamp applied above the ankle. The clamp allowed foot dorsiflexion,
while minimizing movement of the shank. Care was taken not to tighten the clamp to a
point where it would potentially damage tissue. A 1 cm wide band of webbing material
was looped around the metatarsals 60 mm from the pivot point of the ankle joint and
attached to a force transducer so that force was applied in the plantarflexion direction,
at right angles to the long axis of the foot. The leg clamp and force transducer were
secured to a heavy metal frame, which in turn was clamped to a table (Figure 4.5).
Page 113
Chapter 4: Delivery of DC in chronically implanted animals
99
Figure 4.5: Experimental arrangement to partially ablate the common peroneal nerve with DC,
while testing conduction with pulses applied proximally. The anesthetized cat was prone, its leg
held by a clamp and its foot connected to a force transducer with a looped strap. Test pulses
(200 µs, 2Hz) and DC were delivered through the nerve cuffs of leads previously implanted and
tunneled subcutaneously to a headpiece connector. The test pulses were delivered throughout
the experiment. Force was measured before, during and after DC delivery.
Test muscle twitches were generated by connecting the cathodic output of a custom-
built, biphasic, charge-balanced, constant-current pulse generator to the proximal lead
via the headpiece connector. The anodic output of the pulse generator was connected
to a self-adhesive gel electrode (Kendall ES40076) on the back of the animal (Figure 4.5).
Continuous trains of pulses (200 µs, 2Hz) elicited test twitches of the tibialis anterior and
extensor digitorum longus muscles. Dorsiflexion force was measured using a force
transducer. At the beginning of each of these procedures, muscle twitch thresholds
were monitored by applying pulsatile stimulation through each of the electrodes. This
was done to check on the viability of the electrodes.The optimal ankle angle for muscle
force production was determined for each animal by making a series of measurements
at different ankle angles of the twitch forces elicited by stimulation through the
proximal nerve cuff. An angle-force curve was constructed, from which the optimal
angle was determined.
The signal from the force transducer, along with current and voltage signals from the
DC generator during DC delivery were viewed on a digital oscilloscope (Tektronix
TDS3014B, Tektronix Inc., Beaverton, OR USA). The digitized signals were downloaded
from the oscilloscope to a desktop computer via a local area network, with the use of
Tektronix Visa software. The oscilloscope was set to sample at 500 samples/s enabling
20 s segments of data to be stored as digital files. Pulsatile stimulation was delivered
through the proximal cuff and five 20 s segments of data were recorded 30 to 60 s
apart.
Page 114
Chapter 4: Delivery of DC in chronically implanted animals
100
In procedure 2 (DC nerve ablation), a custom DC source was used to deliver DC. The
cathode of the DC stimulator was connected to the appropriate pin on the head
connector that led to the distal cuff. The anode of the DC stimulator was connected to a
wettable pad surface electrode 3cm in diameter, similar to those used in functional
electrical stimulation garments, placed on the back of the animal. The biphasic pulse
stimulator was connected to the proximal cuff through the appropriate pin on the head
connector leading to the proximal cuff, and the anode was connected to the same
wettable pad electrode on the back of the animal. Muscle twitch force was first
measured for approximately 10 min to provide a baseline. DC was then delivered via the
distal cuff for several min. Muscle twitch force was recorded for approximately 10 min
prior to DC delivery, during DC delivery and for about 20 min after DC delivery at
intervals of 1 to 5 min.
In cat 2, both procedures were performed during one session of anesthesia. After
procedure 1 was completed, 0.5mA DC was delivered for a duration of 10 min. Twitch
forces were monitored before, during and for 30 min after DC delivery. The cat was then
allowed to recover from the anesthetic. Procedure 1 was subsequently performed
weekly for 6 weeks as well as at weeks 9 and 10 after DC ablation.
In cat 3, procedure 1 (force measurements) was performed weekly for five weeks.
Procedure 2 (DC ablation) was then performed twice, with an intervening period during
which nerve function recovered. The first DC ablation session (1mA for 10 min) occurred
13 weeks post-implant. Twitch forces were monitored before, during and for 1 hour
after this DC delivery. The cat was then allowed to recover from the anesthetic.
Procedure 1 was carried out on nine different occasions between weeks 14 and 30 post-
implant, 1 to 3 weeks apart with the exception of weeks 17 to 22 post-implant. A second
DC ablation session (1mA for 9 min) was carried out at week 30 post-implant. Twitch
forces were monitored before, during and for 1 hour after this DC delivery. As before,
the cat was then allowed to recover from the anesthetic. Force measurements were
conducted ten times between weeks 31 and 50 post-implant, 1-4 weeks apart with the
exception of weeks 39 to 45.
4.1.3.2 Experimental setup and procedures in the implanted, awake cat
Cat 2 was used to test whether DC ablation could be performed while the cat was
awake. After the DC ablation experiment described above, it took about 10 weeks for
twitch forces to return to pre-lesioning values. Starting 8 months after this, procedure 1
(baseline force measurements) was performed during brief periods of anesthesia on 4
separate occasions. On three subsequent occasions, the cat was brought to the
laboratory for procedure 2 (DC delivery in the awake animal). In these cases, the cat was
allowed to move freely in a padded open crate placed on a table and was offered treats.
Connections to the headpiece from the biphasic electrical stimulator and DC source
were as described in section 4.1.3.1. Long leads were used in order to allow the cat to
move freely.
Page 115
Chapter 4: Delivery of DC in chronically implanted animals
101
4.1.3.3 Experimental setup and procedures in the implanted, awake rabbit
Three rabbits were implanted as described in section 4.1.2.1. One rabbit was
implanted with a single nerve cuff and two were implanted with two nerve cuffs (table
A.6 appendix A).. In one of the rabbits (rabbit 3) implanted with two nerve cuffs, the
distal cuff (Pt-Ir DC electrode) failed. In all three rabbits, leads from the external current
sources were connected to the implanted nerve cuffs via the subcutaneous ports as
described in section 4.1.1. Two types of procedure were conducted. Procedure 1
involved the measurement of muscle twitch forces as described in section 4.1.3.1.
Procedure 2 was the application of DC when the animal was conscious. In the rabbit
implanted with only one (Pt-Ir) electrode, this electrode was used in procedure 1, to
apply test pulses, and in procedure 2 to apply DC.
Procedure 1: measurements of muscle twitch force to establish baselines were
performed during brief periods of anesthesia (see 4.1.3.1), for several weeks before and
after procedure 2. Leads were connected to the implanted electrodes via the
subcutaneous ports. Signals from the force transducer and the DC source were viewed
on the Tektronix oscilloscope and downloaded to a desktop computer at intervals
ranging from 30 to 60 s (see 4.1.3.1).
Procedure 2: The animal was briefly anesthetized with isoflurane. Cooner lead wires
or needles were inserted percutaneously into the subcutaneous ports. The leads were
looped and secured to the animal’s body to minimize the event of wire pullout during
movement once the animal was awake. A 3-axis accelerometer (ADXL335, Analog
Devices) was fixed to the foot, 60mm from the pivot point of the ankle joint. The animal
was wrapped in a blanket except for the test leg, which was held by the experimenter at
the shank while slightly elevated from the table in order to prevent the foot from
touching the table during dorsiflexion (Figure 4.6). The animal was securely held with its
head tucked under the experimenter’s elbow to ensure that the eyes were covered.
Page 116
Chapter 4: Delivery of DC in chronically implanted animals
102
Figure 4.6: Experimental setup for delivery of DC in the chronically implanted rabbit. Initially, the
animal was anesthetized and stainless steel needles or wires were inserted into the
subcutaneous ports as described in section 4.1.1. The animal was wrapped in a blanket, allowed
to wake up and the test leg was then held as shown. Test pulses or DC were delivered via needles
or wires inserted percutaneously into implanted subcutaneous ports.
In all three rabbits procedure 1 was performed in the weeks before and after DC was
delivered to the awake animal (procedure 2). DC was applied to the nerves in all three
rabbits when they were conscious. It was not possible to measure force when the
animals were awake, so instead, in two of the animals, an accelerometer was fixed to
the foot. Signals from the accelerometer and the DC source were viewed on the
Tektronix oscilloscope and downloaded to a desktop computer at intervals ranging from
30 s to 120 s.
In rabbit 1, in which only one electrode had been implanted, pulsatile stimulation
and DC could not be delivered simultaneously. For this reason, accelerometer
recordings of twitches were only carried out during brief periods of isoflurane
anesthesia before and after DC delivery. During the first period of anesthesia, leads
were inserted percutaneously into the subcutaneous ports as described in section 4.1.1.
The accelerometer was placed on the foot and pulsatile stimulation was delivered to the
nerve. After about 5 min of accelerometer recordings of twitches, the animal was
allowed to recover from anesthesia, as judged by its ability to hold its head up and make
exploratory movements. The leads were transferred from the pulse generator to the DC
source. Full recovery took about 5 min. Ten min after anesthesia was discontinued, DC
(5 mA for 3 min) was delivered to the nerve. After the cessation of DC the animal was
again briefly anesthetized. The leads were transferred back to the pulse generator.
Pulsatile stimulation was resumed along with accelerometer recordings of twitches.
Page 117
Chapter 4: Delivery of DC in chronically implanted animals
103
In rabbit 2, implanted with two nerve cuffs that remained viable throughout, after
the baseline force measurements had been performed, DC was applied on four
occasions, separated by 9 weeks, 1 week and 1 week respectively (Appendix 1, Table
A.6). On each occasion the animal was first anesthetized with isoflurane for a few
minutes. Leads were inserted into the subcutaneous ports. On the last three occasions
an accelerometer was placed on the foot and pulsatile stimulation (200 µs, 2Hz) was
delivered via the proximal cuff (section 4.1.3.3). DC (3mA) was applied for 5-6 s via the
distal cuff to confirm nerve blockade, as evidenced by the abolition of muscle twitches .
Anesthesia was discontinued and the animal was allowed to recover. During this
recovery, which lasted about 10 min, DC (3mA for 5-6 s) was again applied to confirm
nerve blockade. Once the animal was fully awake, as judged by its ability to hold its head
up and make exploratory movements, DC was delivered for longer durations.
Rabbit 3 had been implanted with two nerve cuffs, distal (Pt-Ir) and proximal
(stainless steel). DC delivery was carried out on two occasions. On the first occasion DC
was delivered through the Pt-Ir electrode, but prior to the second DC application muscle
twitch thresholds via the Pt-Ir electrode had risen from 0.2mA to more than 0.6 mA.
Furthermore, local pressure applied over the cuff reduced the threshold. This indicated
that the Pt-Ir electrode had migrated and was no longer reliable. Consequently, DC
ablation (procedure 2) was carried out on the second occasion with the use of the
stainless steel electrode. The animal was first anesthetized with isoflurane for a few
minutes. Wires were inserted into the subcutaneous ports. Anesthesia was discontinued
and the animal was allowed to recover. Once the animal was fully awake, as judged by
its ability to hold its head up and make exploratory movements, DC was delivered.
Delivery of DC was terminated if and when the animals showed signs of discomfort.
4.1.3.4 Transducer calibrations
At the end of each force measurement experiment, the force transducer was
calibrated with a spring balance. The accelerometer was calibrated by rotating it rapidly
through 90 degrees with the use of a custom hinged support.
4.1.3.5 Data analysis
A Matlab (The MathWorks, Inc., Natick, MA) program was written to detect the peak
amplitude of the muscle twitch force generated during pulsatile stimulation. From each
session prior to and after DC lesioning that twitch forces were measured under
anesthesia in both the cat and the rabbits, five data segments, each 20 s in length, were
collected and the mean twitch amplitude was computed. The overall mean twitch
amplitude from all individual baseline sessions was then computed and used to
normalize the means of the individual sessions (Figure 4.8).
For the sessions in which DC was delivered in the anesthetized cat, the mean twitch
force was calculated for each 20 s of sampled data (one data segment) and normalized
Page 118
Chapter 4: Delivery of DC in chronically implanted animals
104
to the mean baseline value (the mean of the first five twitches in the plot, as shown in
Figure 4.9).
For the sessions in which DC was delivered in awake rabbits, the mean peak-to-peak
value of acceleration was calculated for each 20 s of sampled data (one data segment)
and normalized to the mean baseline value.
4.2 Results
4.2.1 DC delivery in the chronically implanted cats during brief periods of
anesthesia
Details of animals used in these experiments, DC application parameters and
summary of results can be found in Appendix A, table A.3.
In the first cat (cat 2 table A.3 appendix A), as described in 4.1.3.1, procedure 1 (force
measurement) and procedure 2 (DC delivery) were performed in a single session of brief
anesthesia. After procedure 1 was completed, 0.5mA DC was delivered for 10 min.
Twitch forces were monitored before, during and for 30 min after DC delivery. The cat
was then allowed to recover from the anesthetic. In the 5 weeks following DC delivery,
the mean twitch force was 40% to 50% of the mean baseline value. At week 6 it began
recovering to ~60%. In week 9, the mean force had actually increased to ~130% of
baseline value and remained at this level in week 10.
Page 119
Chapter 4: Delivery of DC in chronically implanted animals
105
Figure 4.7: Mean twitch forces in a chronically implanted cat (cat 2 table A.3 Appendix A) in the
weeks before and after two sessions in which DC was delivered to the common peroneal nerve.
Each dot represents the mean twitch force derived from five data segments recorded in a single
force measurement experiment as described in 4.1.3.5. The DC application resulted in 60%
decline in force as was measured in the following week. Force recovered over the next 8 weeks.
In the second cat (cat 3 table A.3 Appendix A), five force measurement experiments
were performed, starting 2 weeks after the implant surgery. The mean twitch forces
increased during this period, probably reflecting a recovery from the effects of surgery.
Figure 4.8 displays the normalized mean twitch forces recorded over 40 weeks. The
mean twitch force just prior to DC delivery had increased from the previous two
baseline values. DC (1mA for 10 min) was then delivered. No force could be detected in
the week following DC application. The first sign of recovery started 3 weeks later. Force
gradually recovered to baseline values over the following 13 weeks. A second DC
application (1mA for 9 min) was delivered in week 30 post-implant. Twitches were again
abolished. The mean twitch force then gradually recovered over the subsequent 20
weeks and reached the baseline value in week 50.
Figure 4.8: Mean twitch forces in a chronically implanted cat (cat 3 table A.3 Appendix A) in the
weeks before and after two sessions in which DC was delivered to the common peroneal nerve.
Each dot represents the mean twitch force derived from five data segments recorded in a single
force measurement experiment as described in 4.1.3.5. Forces were measured in the weeks prior
to the initial DC application. Although the force seemed stable from measurements conducted in
weeks 9 and 11 it increased was increased when measured just prior to DC application, which
proved to be the true baseline value. Therefore the line indicating the baseline is not at 1.0 (the
average of the 3 measurements taken prior to DC) but at the true baseline value measured just
prior to DC1. The first delivery of DC (DC1) caused a rapid decline in twitch force to zero (see
Figure 4.9) and this was maintained in the following week. Force gradually recovered to the
baseline value over the subsequent 13 weeks. A second application of DC (DC2) resulted in a
similar time course of twitch decline followed by recovery.
Page 120
Chapter 4: Delivery of DC in chronically implanted animals
106
Figure 4.9 shows the results of the first DC application (DC1) on an expanded time
scale. Twitch force amplitude was reduced gradually over the 10 min DC was applied. DC
application was discontinued once twitches completely disappeared. Force did not
recover for the following 54 min.
Figure 4.9: DC delivery (DC1 of Figure 4.8) on an expanded time scale. Mean twitch forces are
shown for 10 min prior to DC delivery. DC caused the force gradually to decline over a further
period of 10 min. DC was discontinued when twitches disappeared. Force continued to be
monitored for a further 54 min to ensure that nerve conduction had been completely blocked.
4.2.2 DC delivery in chronically implanted, awake cat and rabbits
Details of animals used in these experiments, DC application parameters and
summary of results can be found in Appendix A table A.6.
4.2.2.1 Cat
As mentioned earlier, after the DC ablation experiments performed under anesthesia
in cat 2, it took about 10 weeks for twitch forces to return to pre-lesioning values. On
three separate occasions, starting 8 months after this recovery, DC was delivered while
the cat was awake (see section 4.1.3.2). On the first occasion, DC was applied twice
(0.5mA for 3.5 min and 4 min respectively with a 4 min break). On the second occasion,
DC was delivered three times for (0.75mA for 6 min, 3 min 40 s and 2 min 40 s
respectively) and on the third occasion DC was delivered once (0.75 mA for 5 min 40 s).
Procedure 1 (force measurements under anesthesia) was performed between each of
the three DC sessions, and on several occasions after the third DC session. The animal
seemed comfortable while DC was delivered, except at the onset of DC when it flexed
one of its forelegs for a few seconds, after which it resumed its normal stance posture
and continued eating treats. Surprisingly, in light of the results obtained when the same
cat was anesthetized, the mean twitch force showed only slight decreases in the first
week following the first and second DC deliveries, but had recovered to baseline values
Page 121
Chapter 4: Delivery of DC in chronically implanted animals
107
by the second week. No changes in mean twitch force were observed after the third DC
delivery.
4.2.2.2 Rabbits
In rabbit 1 which had only one implanted nerve cuff, DC and pulsatile stimulation
could not be delivered simultaneously. Acceleration was measured during brief periods
of anesthesia before and after DC was delivered to the awake animal as described in
section 4.1.3.3. The peak acceleration measured during the brief period of anesthesia
after DC was delivered was not significantly different than that measured during the
first period of anesthesia prior to DC delivery. Peak twitch force measurements
(procedure 1) were conducted in the weeks before and after DC delivery. There was no
obvious reduction in force after DC (Figure 4.10).
Figure 4.10: Mean peak twitch force measured in the weeks before and after application of DC in
rabbit 1. Each dot represents the mean value of five 20 s data segments as described in the
methods section. Each arrow represents an occasion when DC was applied to the nerve
(procedure 2). No reduction in force was evident in the week following application of DC to the
nerve (5ma, 3 min).
Rabbit 2 was implanted with two electrodes (proximal –stainless steel, distal – Pt-Ir)
which remained viable throughout. After the animal was awake, DC was applied for 5-6
s as described in section 4.1.3.3 to confirm nerve blockade (Figure 4.11). Once blockade
was established DC was applied for longer durations with the aim of ablating the nerve.
Page 122
Chapter 4: Delivery of DC in chronically implanted animals
108
On the first occasion 1.5mA was delivered for 6 min 10 s. This resulted in ~20%
attenuation of force which recovered over 4-5 weeks (Figure 4.14). On the second
occasion, 3mA DC was delivered for 80 s, 15.5 min after anesthesia was discontinued.
On the third occasion, 3mA DC was delivered for 67 s, 8.5 min after anesthesia was
discontinued. On the fourth occasion, DC was applied three times (Figure 4.12): 3.5mA
for 20 s at 8.5 min post-anesthesia, 3mA for 30 s at 11.5 min post-anesthesia and finally,
starting at 20 min post-anesthesia, 4mA for the first 7 s then ramping up to 5mA for
another 58 s. The raw signals from this third application of DC are shown in Figure 4.13.
Figure 4.11: Test twitches abolished by 3mA DC applied to the nerve in an awake rabbit. Top:
Twitch accelerations elicited by test stimuli applied to the common peroneal nerve via the
proximal electrode. Bottom: DC delivered to the nerve via the distal electrode.
Page 123
Chapter 4: Delivery of DC in chronically implanted animals
109
Figure 4.12: Twitch amplitudes before and after three applications of DC in rabbit 2 when it had
recovered from a brief period of anesthesia and was fully awake. Each dot represents the mean
peak-to-peak acceleration measured in a 20 s data segment. The x-axis shows the time elapsed
from the cessation of anesthesia. DC was applied between the vertical dashed lines for 20 s, 30 s
and 65 s respectively. Attenuation of acceleration occurred after the second DC application. A
further decline in acceleration occurred after the third DC application.
Figure 4.13: Accelerometer and DC signals just before, during and after the third DC application
in Figure 4.12. There were two 6 s breaks for data transfer between the three sections of
recording. Top: Accelerometer signals. Bottom: DC. A) Accelerations before DC and during two
ramp-and-hold increments (to 4mA and 5mA respectively). Twitches were abolished initially, but
gradually increased. B) The next 20 s segment recording starts with spontaneous accelerations
followed by reduced twitch accelerations compared to segment A. C) The final 20 s segment.
Spontaneous bursts of acceleration corresponded to the animal becoming restless. After each
such burst, accelerations showed the same pattern of decline and recovery as in segment A.
In rabbit 3 two electrodes were implanted (identical to rabbit 2). Force
measurements were conducted under brief anesthesia in the weeks before and after DC
was delivered to the awake animal. On the first occasion 1.5mA DC was delivered for 6
min 10 s through the distal cuff (Pt-Ir), no reduction was noted when force was
measured under anesthesia in the following weeks (Figure 4.14). On the second
occasion DC was delivered continuously through the proximal cuff (stainless steel) after
the distal cuff failed. DC was delivered for a total of 5 min (2 mA for 1 min, 2.5 mA for 3
min and 3mA for 1 min). At the onset of DC, as in the case of the awake cat, the rabbit
flexed its leg for a few seconds, indicating some discomfort. This occurred again when
the current was increased from 2 mA to 2.5 mA, but not from 2.5mA to 3 mA. Mean
twitch force measured a week later had dropped by about 25% and remained at this
level for another 2 weeks (Figure 4.14). At 3 weeks post-DC, the mean twitch force had
returned to baseline levels. The second attempt at delivering DC was made through a
stainless steel cuff (not Pt-Ir as originally intended) which might have contributed to the
reduction in force. Stainless steel cathodes were shown to undergo very slight changes
in weight as opposed to Pt-Ir when under some DC stimulation conditions (Stevenson et
al., 2010).
Page 124
Chapter 4: Delivery of DC in chronically implanted animals
110
Figure 4.14: Mean peak twitch force measured in the weeks before and after application of DC in
rabbits 2 and 3. Each dot represents the mean value of five 20 s data segments as described in
the methods section. Each arrow represents an occasion when DC was applied to the nerve
(procedure 2). Rabbit 2: a decline in force was observed one week after the first application of
DC. Force recovered to baseline values over the next 5 weeks. Three subsequent DC applications
(the timing of the first being shown in the right-hand part of the Figure), did not result in force
attenuation. Rabbit 3: the first application of DC (delivered through the Pt-Ir electrode) did not
result in force attenuation. A second DC application (delivered through the stainless steel
electrode) did result in a decline in twitch force, which lasted for at least 3 weeks.
4.3 Discussion
This chapter concerns DC nerve ablation in chronically implanted animals under
anesthesia and in the conscious state. In the two anesthetized cats, DC caused graded
reductions in muscle force (Figure 4.9), confirming the preliminary findings in a
publication (Ravid et al., 2011). The present experiments also showed that nerve
ablation using DC is repeatable: DC was applied to the nerve of one cat on two occasions
17 weeks apart, each time resulting in complete conduction block followed by full
recovery of the twitch force to baseline values (Figure 4.8).
Nerve tissue damage was previously shown to result from DC application to nerves
(Whitwam & Kidd, 1975; Hughes et al., 1981). Following such damage, the distal part of
Page 125
Chapter 4: Delivery of DC in chronically implanted animals
111
the nerve undergoes Wallerian degeneration and the proximal nerve portion undergoes
“die-back” to the first node of Ranvier (Fenrich & Gordon, 2004). Furthermore, nerve
regeneration occurs at 1-3 mm/day. It was also previously shown that after a crush or
cut injury of a muscle nerve 40-50 mm from the muscle, motor responses first returned
38-40 days after the crush injury and 54-70 days after the nerve cut and suture
procedure (Gutmann et al., 1942).
In the present study, the first signs of recovery of mean twitch force amplitude after
DC ablation in Cat 3 occurred at 4 weeks and 7 weeks after DC delivery (Figure 4.8). This
is comparable to the 38-40 days quoted by Gutmann et al. for nerve crush (but
interestingly, not nerve cut). Some methodological differences should be noted. First, in
Gutmann’s experiments, the rabbits were tested every day. Because we had to
anesthetize the animals in order to conduct force measurement, we only tested the cats
every 1-3 weeks, so the very first sign of recovery was most likely missed. The outcome
measure in the Gutmann et al. study was reflexive toe-spreading elicited by ground
contact. The authors mentioned that the return of dorsiflexion took on average 5 days
longer. In the present study, muscle activation was tested by stimulating the nerve
proximal to the site of DC delivery, which may be a more sensitive way of detecting first
recovery.
Another possible reason for the difference in observations could be the nature of the
damage. Gutmann demonstrated that recovery after nerve crush (~3mm/day) was
faster than recovery following nerve cut and suture (~2mm/day) (Gutmann et al., 1942).
In the experiments presented in this chapter, the nerve was damaged by DC which may
have a different recovery time than either cut or crush injuries. The difference in species
experimented on (rabbits versus cats) could be a factor as well.
In the studies presented in this chapter, complete recovery of twitch force was
observed following nerve ablation and attenuation of force with DC. Studies have shown
that after recovery from tibial nerve branch section and suture in cats, the normal
proportions of motor unit types were re-established (Foehring et al., 1986; Gordon et
al., 2004). In another study, evidence was adduced that 3 years after cutting the nerve
to the triceps surae muscles, their ability to generate force had returned to pre-lesioned
values, yet their reflex responses to stretching were greatly attenuated (Cope et al.,
1994). It was further noted in that paper that the incomplete recovery of stretch
response was observed after nerve cut, but not crush. In an earlier study, it had been
found that after a nerve transection and subsequent regeneration, the number of
functionally identifiable muscle-spindle and tendon-organ afferents was reduced to 25%
and 45% of normal, respectively (Banks et al., 1985). This could explain the Cope et al.
results. In a clinical application, the effect of nerve transection could be to reduce
hypertonus, even after muscle fibers are fully reinnervated. Since one of the
characteristics of spasticity is over-active stretch reflexes (Gracies, 2005), the resulting
attenuation of the reflex response without loss of motor control or strength following
recovery may be beneficial clinically. Further investigations should be carried out in
order to test whether this combination of preserved force capability but reduced stretch
reflexes applies to DC nerve ablation as well.
Page 126
Chapter 4: Delivery of DC in chronically implanted animals
112
In Cat 3 (Figure 4.8), in week 13 post-implantation, just before DC was first applied,
the peak twitch force was unexpectedly higher than the forces measured in weeks 9 and
11, which had been assumed to have reached a stable baseline level, consistent with a
complete recovery from the effects of surgery. However, more recovery evidently
occurred between weeks 11 and 13. DC then produced the anticipated abolition of
muscle force, followed several weeks later by full recovery back to the week 13 level,
and this sequence was repeated after the second DC application. In Cat 2, 9 weeks after
DC application, the force recovered to 130% of the baseline value measured just prior to
DC application. This indicates that full recovery had also not occurred at the time the
baseline measurement was made. This increase in force was not due to measurement
variability since the force transducer was calibrated after each experiment.
In the conscious animal, some brief force responses to DC, particularly at the onset,
were observed. These responses did not occur consistently and seemed to depend on
the duration of DC ramp-up. In Figure 4.11, the duration of DC ramp-up was less than 1 s
and an onset response was clearly visible. In another trial in the same animal (not
illustrated), the duration of DC ramp-up was 2.5 s and no onset response was observed.
This indicates that there may be a relationship between the occurrence of an onset
response and the duration of ramp-up. In a previous experiment on a decerebrate cat
(Chapter 3), an onset response occurred even when a five second ramp-up was applied.
Therefore a direct relationship between DC ramp-up time and onset response is difficult
to establish. In the experiments conducted here, ramp-up times of DC were between 1
and 5 s and were done manually. As can be seen from Figure 4.13 an initial ramp-up of
1 s resulted in an onset response, but an additional rise in DC over 2 s did not elicit a
further onset response. Were these onset responses aversive reactions to sensory input,
or were they the result of direct activation of alpha motoneurons by the DC? Onset
responses to DC ramp-ups have recently been studied in pentobarbital-anesthetized
rats (Ackermann et al., 2011). The faster the ramps, the larger the force responses, but
in some animals, responses occurred even for very slow (4 s) ramp-ups. At the blood
concentrations associated with deep anesthesia, pentobarbital normally abolishes
aversive responses to nociceptive input, however, deep anesthesia must be carefully
maintained, as aversive responses occur at medium depths of surgical anesthesia.
Ackerman et al. administered pentobarbital intra-peritoneally to maintain a level at
which eye-blink or withdrawal reflexes did not occur. Taken at face value, this suggests
that the onset responses were not evoked reflexly by sensory input. However, the
variability of the onset responses in our experiments in the conscious animals, the
associated orienting movements, and the lack of onset-responses in most of our
experiments performed on anesthetized animals lead us to believe that the onset
responses may be partly aversive.
DC delivery in conscious animals did not produce the amount of attenuation in
muscle force expected from experiments in which DC was applied during anesthesia or
in a decerebrate cat (Chapter 3). For example, in rabbit 1 (Figure 4.10), there was no
obvious reduction in force after DC had been applied in the awake state. In rabbit 2, on
the first occasion this was done, the force was reduced to 77% of pre-DC levels and this
lasted for a few weeks. But on the next three occasions, there were no lasting
reductions in force, even though twitches had been abolished by a brief application of
DC (Fig 4.11) and reduced after DC was applied in the awake state (Figure 4.12). A week
Page 127
Chapter 4: Delivery of DC in chronically implanted animals
113
after this, twitch forces were at pre-DC levels. This is in contrast to the long-lasting
attenuation of force caused by applying DC during anesthesia and allowing the animal to
recover (Chapter 2 and Figure 4.8 above).
Could the negative results in the conscious animals have been due to inadequate
current delivery through the electrodes? The voltage generated by the DC source during
DC delivery (in awake and anesthetized animals) was monitored on an oscilloscope. High
voltages or large voltage fluctuations that occurred in pilot experiments were associated
with electrode failure or pull-out from the subcutaneous ports. However in all three
rabbits studied, wires inserted percutaneously into the ports were secured externally
with adhesive tape to the animal’s body in order to minimize the chance of wire pull-out
due to movements during stimulation in the awake animal. Large changes in voltage
were not observed during DC delivery in any of the results reported here.
One possibility which might explain the small or absent reduction of force after DC
application in the awake animals is that the wires partially or completely pulled out of
the subcutaneous ports but remained under the skin. In such an event a large change in
voltage would not have occurred, yet little or no DC would have been delivered through
the cuff to the nerve. Given that currents up to 5mA were delivered in this way (Figure
4.13), local onset contractions might have been expected in the vicinity of the ports but
they may have been obscured by the animals’ voluntary movements.
In the awake cat experiment, DC was delivered through a headpiece. The connection
to the nerve cuff electrodes in this case was arguably more reliable, yet no significant
reduction of force was observed after DC application in the awake state. However, in
this case a much lower current was applied (<=0.75mA) and because the cat did not
remain still for long enough the current could not be delivered for long enough (6
minutes) to cause lasting nerve ablation.
What could account for a greater resistance to nerve ablation in the awake,
compared to the anesthetized animals?
It is possible that anesthesia may suppress mechanisms that in the conscious state
protect nerves from DC-induced damage. Nerve damaging processes associated with
electrical stimulation have been attributed to reactions at the electrode-tissue interface.
These include local changes in pH, metal dissolution and electrode corrosion (Merrill et
al., 2005; Stevenson et al., 2010).
For many years it was believed that the neuronal cell membrane was the binding site
of anesthetics and therefore the site of their action. It was assumed that anesthetics
dissolved in the lipid layer and took effect when a certain concentration had been
reached (Evers & Crowder, 2009). Breakthrough experiments conducted on purified
luciferase, a protein involved in light production in fireflies, demonstrated that this
process can be inhibited by various anesthetics, which bind to the protein (Franks &
Lieb, 1984). The authors suggested that the anesthetics compete for the light-activating
binding site on the protein. Proteins such as human serum albumin, tested in vitro, have
been shown to act as acid-base buffers, attenuating shifts in pH resulting from
hydrolysis at electrical stimulation electrodes (Huang et al., 2001). Furthermore, it was
Page 128
Chapter 4: Delivery of DC in chronically implanted animals
114
demonstrated that the presence of such proteins resulted in a lower dissolution rate of
platinum during electrical stimulation with platinum electrodes (Robblee et al., 1980).
Although it is unclear exactly which proteins serve as a buffer in vivo and whether
anesthetics affect these proteins at clinically active levels, it may be possible that the
protective action of such proteins is inhibited under anesthesia.
Other protective mechanisms that may be affected by anesthetics are the three main
physiological buffer systems (bicarbonate, phosphate and proteins). The local blood
supply of nerves may be reduced by anesthetics, which would reduce the available
supply of these buffers.
The supposition that general anesthesia might have facilitated nerve damage by
partially disabling protective mechanisms is not supported by results obtained from the
decerebrate cat in which complete ablation was reached (chapter 3: 3mA, 4 min) 1-2h
after anesthesia was withdrawn. However, one cannot rule out the possibility that the
duration the animal was on the table and the decerebration itself (which might
influence breathing and therefore pH levels in the body) may have resulted in conditions
which accommodated a more rapid nerve damage.
One of the difficulties encountered with delivering DC to the conscious animal was
the limited amount of time for which the animals remained in one place and tolerated
the DC application. According to the protocol, DC was discontinued if and when the
animal showed signs of discomfort. Another barrier was the measurement of twitch
responses to the test stimuli. In the anesthetized animal, twitch forces were easily
monitored, providing reliable measures of nerve ablation. In the conscious animal force
monitoring was not feasible.
In light of the challenges described in the previous paragraph, one could question to
what extent would it be acceptable by humans? Reports of other neuroablative
techniques (Simopoulos et al., 2008) and the ability of the rabbits to tolerate a few
minutes of DC application imply that DC delivery to the nerve may be acceptable.
Continuous radiofrequency (CRF) and pulsed radiofrequency (PRF) are neurolytic
techniques used to treat pain by causing a controlled heat lesion (Racz & Ruiz-Lopez,
2006) and were shown to cause nerve tissue damage (Erdine et al., 2009). In a pilot
study (Simopoulos et al., 2008) both CRF and PRF were applied to dorsal root ganglia
(DRG) and segmental nerves without injection of anesthetics onto the nerves despite
the temperatures used for treatment (54o during CRF for 1 min and 42
o PRF applied for 2
min). In view of these findings it is reasonable to expect that individuals that would be
treated with DC would not require the use of anesthetics on the nerves as in the CRF
and PRF applications. Furthermore, it is anticipated that individuals would be able to
withstand potential discomfort that could arise during DC application.
Neuropathic pain is known to occur in some cases following peripheral nerve injury
(Woolf & Mannion, 1999) and is defined as “pain caused by somatosensory system
disease or damage” (Baron et al., 2010). Its symptoms may include pain that is
independent of stimuli, allodynia, pain resulting from non-painful stimuli and
hyperalgesia, the increased pain response to painful stimuli (Woolf & Mannion, 1999).
None of the animals implanted in our experiments exhibited any signs of discomfort or
Page 129
Chapter 4: Delivery of DC in chronically implanted animals
115
alterations in behavior indicative of neuropathic pain (Zimmermann, 2001) following
ablation of the nerve with DC. Specific testing for allodynia and hyperalgesia were not
conducted in this study and therefore cannot be ruled out.
Subcutaneous ports: After several iterations of development, the subcutaneous ports
used in the experiments on the conscious animals (described in the methods section)
were effective in percutaneously delivering DC and electrical pulses to nerves on
repeated occasions. The incorporation of conductive silicone improved the reliability of
needle insertion, whether the purpose was to insert a wire or to use the needle as a
conductor. Furthermore, conductive silicone held the needles or wires more securely in
place than the conductive rubber.
The results of this study provided proof-of-principle that the repeated percutaneous
application of DC to nerves can be carried out with subcutaneous ports. Short durations
of DC produced controlled nerve ablation, when applied during brief periods of
anesthesia. Conclusive evidence of long term force reduction was not observed when
DC was applied in the awake state, although short-term conduction block was observed
and there was a decline of force during and immediately after DC application. There
were no obvious signs of significant or lasting pain during or after the application of DC.
Further testing is needed to determine the DC amplitudes and durations required to
achieve the controlled amounts of nerve ablation, and therefore reductions in
hypertonus, in the conscious state.
Page 130
Chapter 4: Delivery of DC in chronically implanted animals
116
4.4 References
Ackermann DM, Jr., Bhadra N, Foldes EL & Kilgore KL. (2011). Conduction block of whole
nerve without onset firing using combined high frequency and direct current.
Medical & biological engineering & computing 49, 241-251.
Banks RW, Barker D & Brown HG. (1985). Sensory reinnervation of muscles following
nerve section and suture in cats. J Hand Surg Br 10, 340-344.
Baron R, Binder A & Wasner G. (2010). Neuropathic pain: diagnosis, pathophysiological
mechanisms, and treatment. Lancet neurology 9, 807-819.
Bovend'Eerdt TJ, Newman M, Barker K, Dawes H, Minelli C & Wade DT. (2008). The
effects of stretching in spasticity: a systematic review. Arch Phys Med Rehabil
89, 1395-1406.
Cope TC, Bonasera SJ & Nichols TR. (1994). Reinnervated muscles fail to produce stretch
reflexes. Journal of neurophysiology 71, 817-820.
Elovic E. (2001). Principles of pharmaceutical management of spastic hypertonia.
Physical medicine and rehabilitation clinics of North America 12, 793-816, vii.
Elovic EP, Esquenazi A, Alter KE, Lin JL, Alfaro A & Kaelin DL. (2009). Chemodenervation
and nerve blocks in the diagnosis and management of spasticity and muscle
overactivity. Pm R 1, 842-851.
Erdine S, Bilir A, Cosman ER & Cosman ER, Jr. (2009). Ultrastructural changes in axons
following exposure to pulsed radiofrequency fields. Pain practice : the official
journal of World Institute of Pain 9, 407-417.
Esquenazi A. (2006). Improvements in healthcare and cost benefits associated with
botulinum toxin treatment of spasticity and muscle overactivity. Eur J Neurol 13
Suppl 4, 27-34.
Evers AS & Crowder CM. (2009). Mechanisms of Anesthesia and Consciousness. In
Clinical Anesthesia, sixth edn, ed. Barash PG, Cullen BF, Stoelting RK, Cahalan
MK & Stock MC. Lippincott Williams& Wilkins, Philadelphia, PA.
Page 131
Chapter 4: Delivery of DC in chronically implanted animals
117
Fenrich K & Gordon T. (2004). Canadian Association of Neuroscience review: axonal
regeneration in the peripheral and central nervous systems--current issues and
advances. The Canadian journal of neurological sciences Le journal canadien des
sciences neurologiques 31, 142-156.
Foehring RC, Sypert GW & Munson JB. (1986). Properties of self-reinnervated motor
units of medial gastrocnemius of cat. I. Long-term reinnervation. Journal of
neurophysiology 55, 931-946.
Fortuna R, Vaz MA, Youssef AR, Longino D & Herzog W. (2011). Changes in contractile
properties of muscles receiving repeat injections of botulinum toxin (Botox). J
Biomech 44, 39-44.
Franks NP & Lieb WR. (1984). Do general anaesthetics act by competitive binding to
specific receptors? Nature 310, 599-601.
Goldstein EM. (2001). Spasticity management: an overview. J Child Neurol 16, 16-23.
Gordon T, Thomas CK, Munson JB & Stein RB. (2004). The resilience of the size principle
in the organization of motor unit properties in normal and reinnervated adult
skeletal muscles. Canadian journal of physiology and pharmacology 82, 645-
661.
Gracies JM. (2001). Physical modalities other than stretch in spastic hypertonia. Physical
medicine and rehabilitation clinics of North America 12, 769-792, vi.
Gracies JM. (2005). Pathophysiology of spastic paresis. II: Emergence of muscle
overactivity. Muscle Nerve 31, 552-571.
Gutmann E, Guttmann L, Medawar PB & Z. YJ. (1942). The rate of regeneration of nerve.
J Exp Biol 19, 14-44.
Heijnen IC, Franken RJ, Bevaart BJ & Meijer JW. (2008). Long-term outcome of
superficialis-to-profundus tendon transfer in patients with clenched fist due to
spastic hemiplegia. Disability and rehabilitation 30, 675-678.
Horn LJ, Singh G & Dabrowski ER. (2010). Chemoneurolysis with Phenol and Alcohol. In
Spasticity : Diagnosis and Management, ed. Brashear AE, Elie, pp. 466. Demos
Medical Publishing New York, NY, USA
Page 132
Chapter 4: Delivery of DC in chronically implanted animals
118
Huang CQ, Carter PM & Shepherd RK. (2001). Stimulus induced pH changes in cochlear
implants: an in vitro and in vivo study. Annals of biomedical engineering 29, 791-
802.
Hughes GB, Bottomy MB, Jackson CG, Glasscock ME, 3rd & Sismanis A. (1981). Myelin
and axon degeneration following direct current peripheral nerve stimulation: a
prospective controlled experimental study. Otolaryngology--head and neck
surgery : official journal of American Academy of Otolaryngology-Head and Neck
Surgery 89, 767-775.
Kirazli Y, On AY, Kismali B & Aksit R. (1998). Comparison of phenol block and botulinus
toxin type A in the treatment of spastic foot after stroke: a randomized, double-
blind trial. Am J Phys Med Rehabil 77, 510-515.
Kowalczewski J. (2009). Adjustable tissue or nerve cuff and methods of use. US patent
application 2009/0210042.
Lannin NA, Horsley SA, Herbert R, McCluskey A & Cusick A. (2003). Splinting the hand in
the functional position after brain impairment: a randomized, controlled trial.
Arch Phys Med Rehabil 84, 297-302.
Lau RW, Yip SP & MY. P. (2012). Whole-Body Vibration Has No Effect on Neuromotor
Function and Falls in Chronic Stroke. Med Sci Sports Exerc.
Lundstrom E, Terent A & Borg J. (2008). Prevalence of disabling spasticity 1 year after
first-ever stroke. Eur J Neurol 15, 533-539.
Mayer NH. (2010). Spasticity and Other Signs of Upper Motor Neuron Syndrome. In
Spasticity : Diagnosis and Management, ed. Brashear AE, Elie, pp. 466. Demos
Medical Publishing New York, NY, USA
Maynard FM, Karunas RS & Waring WP, 3rd. (1990). Epidemiology of spasticity following
traumatic spinal cord injury. Arch Phys Med Rehabil 71, 566-569.
McGuire JR. (2001). Effective use of chemodenervation and chemical neurolysis in the
management of poststroke spasticity. Top Stroke Rehabil 8, 47-55.
Merrill DR, Bikson M & Jefferys JG. (2005). Electrical stimulation of excitable tissue:
design of efficacious and safe protocols. J Neurosci Methods 141, 171-198.
Page 133
Chapter 4: Delivery of DC in chronically implanted animals
119
Montane E, Vallano A & Laporte JR. (2004). Oral antispastic drugs in nonprogressive
neurologic diseases: a systematic review. Neurology 63, 1357-1363.
NSCISC. (2012). Spinal Cord Injury Facts and Figures at a Glance. National Spinal Cord
Injury Statistical Center, birmingham, Alabama.
Pandyan AD, Gregoric M, Barnes MP, Wood D, Van Wijck F, Burridge J, Hermens H &
Johnson GR. (2005). Spasticity: clinical perceptions, neurological realities and
meaningful measurement. Disability and rehabilitation 27, 2-6.
Racz GB & Ruiz-Lopez R. (2006). Radiofrequency procedures. Pain practice : the official
journal of World Institute of Pain 6, 46-50.
Ravid EN, Gan LS, Todd K & Prochazka A. (2011). Nerve lesioning with direct current. J
Neural Eng 8, 016005.
Rizzo MA, Hadjimichael OC, Preiningerova J & Vollmer TL. (2004). Prevalence and
treatment of spasticity reported by multiple sclerosis patients. Mult Scler 10,
589-595.
Robblee LS, McHardy J, Marston JM & Brummer SB. (1980). Electrical stimulation with Pt
electrodes. V. The effect of protein on Pt dissolution. Biomaterials 1, 135-139.
Roger VL, Go AS, Lloyd-Jones DM, Benjamin EJ, Berry JD, Borden WB, Bravata DM, Dai S,
Ford ES, Fox CS, Fullerton HJ, Gillespie C, Hailpern SM, Heit JA, Howard VJ,
Kissela BM, Kittner SJ, Lackland DT, Lichtman JH, Lisabeth LD, Makuc DM,
Marcus GM, Marelli A, Matchar DB, Moy CS, Mozaffarian D, Mussolino ME,
Nichol G, Paynter NP, Soliman EZ, Sorlie PD, Sotoodehnia N, Turan TN, Virani SS,
Wong ND, Woo D & Turner MB. (2012). Heart disease and stroke statistics--2012
update: a report from the American Heart Association. Circulation 125, e2-e220.
Rothwell PM. (2001). The high cost of not funding stroke research: a comparison with
heart disease and cancer. Lancet 357, 1612-1616.
Simopoulos TT, Kraemer J, Nagda JV, Aner M & Bajwa ZH. (2008). Response to pulsed
and continuous radiofrequency lesioning of the dorsal root ganglion and
segmental nerves in patients with chronic lumbar radicular pain. Pain physician
11, 137-144.
Page 134
Chapter 4: Delivery of DC in chronically implanted animals
120
Sommerfeld DK, Eek EU, Svensson AK, Holmqvist LW & von Arbin MH. (2004). Spasticity
after stroke: its occurrence and association with motor impairments and activity
limitations. Stroke 35, 134-139.
Stevenson M, Baylor K, Netherton BL & Stecker MM. (2010). Electrical stimulation and
electrode properties. Part 2: pure metal electrodes. American journal of
electroneurodiagnostic technology 50, 263-296.
van Kuijk AA, Geurts AC, Bevaart BJ & van Limbeek J. (2002). Treatment of upper
extremity spasticity in stroke patients by focal neuronal or neuromuscular
blockade: a systematic review of the literature. J Rehabil Med 34, 51-61.
Watkins CL, Leathley MJ, Gregson JM, Moore AP, Smith TL & Sharma AK. (2002).
Prevalence of spasticity post stroke. Clin Rehabil 16, 515-522.
Welmer AK, von Arbin M, Widen Holmqvist L & Sommerfeld DK. (2006). Spasticity and
its association with functioning and health-related quality of life 18 months after
stroke. Cerebrovasc Dis 21, 247-253.
Whitwam JG & Kidd C. (1975). The use of direct current to cause selective block of large
fibres in peripheral nerves. Br J Anaesth 47, 1123-1133.
Woolf CJ & Mannion RJ. (1999). Neuropathic pain: aetiology, symptoms, mechanisms,
and management. Lancet 353, 1959-1964.
Zafonte RD & Munin MC. (2001). Phenol and alcohol blocks for the treatment of
spasticity. Physical medicine and rehabilitation clinics of North America 12, 817-
832, vii.
Zimmermann M. (2001). Pathobiology of neuropathic pain. European journal of
pharmacology 429, 23-37.
Page 135
121
Chapter 5
General discussion and future directions
Spastic hypertonus is a condition that is not easily treatable and several approaches
are used today in an attempt to address its debilitating effects. In this body of work,
experiments designed to explore a novel way to treat spastic hypertonus were
presented. The proposed method is to apply direct current (DC) to nerves innervating
over-active muscles via implanted electrodes, for the purpose of partially ablating the
nerves and thus reducing the neural drive to the muscles. Chapter 2 describes the initial
experiments which involved delivery of DC to a muscle nerve, in order to establish
amplitudes and durations required to achieve nerve ablation. These experiments were
exploratory in nature. In Chapter 3 a more extensive investigation of the DC parameters
(amplitude and duration) required to produce a desired amount of nerve ablation was
described. Experiments in which an animal model of spastic hypertonus, namely
decerebrate rigidity, are depicted along with an exploration of the possible mechanisms
by which DC stimulation induces nerve damage. In Chapter 4, the use of DC in
chronically implanted animals, in both the anesthetized and conscious states, is
explored and a prototype of an implantable port for the repeated percutaneous delivery
of DC is presented.
5.1 Treatment of spasticity with DC nerve stimulation by
means of implantable electrodes
Current treatments of spastic hypertonus can help control the condition to various
degrees, by reducing hyper-reflexia for example, but surprisingly, little or no
improvement in the performance of ADLs has been shown, even when these treatments
are effective in reducing muscle tone (Gracies et al., 1997; van Kuijk et al., 2002;
Bovend'Eerdt et al., 2008; Esquenazi et al., 2009). There is clearly a need for a treatment
for spasticity that will also improve motor function. The use of implantable electrodes to
deliver DC may enable clinicians to alleviate spasticity. The subsequent use of these
electrodes to deliver FES to the partially ablated nerve may provide a means by which
functional improvement may be achieved. Implantable electrodes have long been used
in the field of neuroprosthetics (NP) to help restore function after nerve injury (Waters
Page 136
Chapter 5: General discussion and future directions
122
et al., 1975; Prochazka et al., 2001) and may serve to help rehabilitation after spasticity
is reduced, by means of delivery of FES via the same implantable electrodes.
Although further experiments are required before any clinical trials should be
conducted, the experiments described in this thesis indicate that implanted electrodes
accessed percutaneously may provide a feasible means of delivering DC to overactive
nerves to ablate them in a controlled manner for the treatment of spasticity. These
experiments addressed solely the issue of alleviation of spastic hypertonus and they did
not involve any comparisons of motor function before and after ablation.
Aside from the benefit of having a single system that can both alleviates spastic
hypertonus and subsequently deliver FES to produce controlled functional movement,
this novel approach may have other advantages over current treatments, as well as
some shared disadvantages. These will be described below with reference to the
studies’ findings. The use of DC for nerve ablation, as compared with other neurolytic
agents, is summarized in table 5.1.
5.1.1 Localization of treatment
The use of DC to partially ablate a peripheral nerve does not result in systemic
effects such as sedation and dizziness that accompany the use of anti-spastic drugs
(Gracies et al., 1997; Kita & Goodkin, 2000; Montane et al., 2004). Furthermore there is
no risk of vascular damage due to a misplaced needle during injection, that can occur
with phenol or alcohol (Frangiamore & O`Brien, 2004). It has become apparent in the
last few years that the action of BtA, a popular neurolytic treatment for spasticity, is not
localized to the site of injection as it has been shown to migrate in the body (Gracies,
2004; Fortuna et al., 2011). NFH staining of nerve sections following DC nerve ablation,
described in Chapter 2, showed axonal damage localized under the cuff only. No axonal
damage was observed distally or proximally to the cuff. However, one local effect of DC
that could in principle affect surrounding tissues is a decrease in pH, as we observed in a
saline solution in vitro. This may be counteracted in vivo by the body’s buffering
mechanisms (Huang et al., 2001). The lack of axonal damage in the vicinity of the cuff, as
was seen from the NFH staining, implies that pH shifts or other electrode reactions are
most likely localized under the cuff as well.
5.1.2 Ease and duration of administration
As opposed to neurolytic injections, such as phenol and alcohol, where significant
expertise is required of a physician in order to achieve favorable outcomes (Elovic et al.,
2009), application of DC to the nerve once a cuff has been implanted is relatively simple.
Administration of phenol or alcohol requires exploration with needles and electrical
stimulators to determine the correct site of injection. This process is time consuming (up
to 2 hours) and can involve multiple needle insertions prior to the injection itself
(Frangiamore & O`Brien, 2004; Horn et al., 2010). Administration of BtA is also
recommended to be conducted with electrical stimulation or ultrasound in order to
ascertain needle placement (Esquenazi, 2006). In the studies described in this thesis,
Page 137
Chapter 5: General discussion and future directions
123
connections to the subcutaneous ports, as in Chapter 4, were made under brief
anesthesia. This might not be needed in humans. Furthermore, we found that making
percutaneous connections to subcutaneous ports required very little time and often, a
single needle insertion, which would be a desirable clinical feature.
It was shown in Chapter 2 that low current amplitudes (0.1-0.5mA) require a very
long duration (30 to 45 minutes) to achieve the desired attenuation and therefore are
less attractive clinically. Brief applications (min) of higher levels of DC (1-3 mA), as
described in Chapters 3 and 4, can lead to substantial reductions in force that can last
for a long time (weeks) before nerve regeneration occurs (see table B.1 in Appendix B
for recommended amplitudes and durations). Results from DC stimulation in the
conscious animal indicated that anesthesia might have contributed to the reduction
being achieved in such a short time, since similar DC currents and durations did not
result in long-lasting force attenuation in the conscious animal as described in Chapter
4. The reduction in twitch amplitudes observed in the conscious animal during
application of 4-5mA DC for one minute, though not long-lasting, indicates that a few
minutes should suffice to achieve the desired force attenuation. Though further
exploration is required to determine a more exact time range for application in the
absence of anesthesia, we estimate that the entire process from insertion of the
electrode into the subcutaneous port to achieving the desired reduction in force should
require no more than 30 minutes.
5.1.3 Frequency of administration
As is the case for phenol and alcohol (Horn et al., 2010), there is no foreseeable
restriction on the number of times DC can be applied to the same nerve. BtA, systemic
anti-spastic medications and Intrathecal Baclofen (ITB) are all dose-restricted (Penn &
Kroin, 1987; Gracies et al., 1997; Horn et al., 2010). During the exploration of DC
amplitudes and durations described in Chapters 2 and 3, it was evident that when
repeated applications of DC were carried out, nerve conduction block was reached
faster and lasted longer with every additional application (Figures 3.8-3.10). This was
previously observed by other investigators (Whitwam & Kidd, 1975).
Experiments carried out in chronically implanted cats, described in Chapter 4,
showed that muscle force responses to electrical stimuli applied proximal to the lesion
recovered to pre-lesion values over some weeks following DC nerve ablation. In a
person with underlying hyper-reflexia, this may be accompanied by a return of muscle
over-activity as well, at which time the process of delivery of DC can be repeated, much
like other neurolytic injections. We assume that the recovery was due to regeneration
of motor axons from the site of injury in the DC cuff to the muscle. However, DC
presumably ablated sensory axons too. The question then arises, did the sensory axons
regenerate at the same rate and to the same extent? It was previously found that
following recovery from nerve cut, but not crush, responses to stretch remained
impaired (Cope et al., 1994). In an earlier study, it was found that after a nerve
transection and subsequent regeneration, the number of functionally identifiable
muscle-spindle and tendon-organ afferents was reduced to 25% and 45% of normal,
respectively (Banks et al., 1985). This could explain the Cope results. The effect could be
Page 138
Chapter 5: General discussion and future directions
124
to reduce hypertonus, even when muscle fibers are fully reinnervated. Further studies
should be conducted in order to determine if this is the case when a nerve is ablated
with the use of DC. Such an outcome might be favorable in reducing spasticity and may
result in fewer repeated applications.
5.1.4 Time duration from administration to effect
In the acute and chronic setting, when DC amplitudes above 0.5mA were applied,
only a few minutes were required to result in force declines which lasted for the
remaining hours of the acute experiments and for weeks after successful ablations in
chronic experiments. The rapid onsets and extended durations of force attenuation are
similar to those seen with phenol or alcohol injections (Frangiamore & O`Brien, 2004)
whereas force reductions after BtA injections can take 2-4 weeks to develop (Kirazli et
al., 1998). In some cases, force was completely abolished during DC application and
then returned to lower levels when DC ceased (e.g. Figure 3.10 and 3.11), whereas in
other cases a gradual reduction in force during DC application was observed (e.g. Figure
4.8). In the former cases, to produce a desired amount of attenuation, it would be
necessary to apply DC for several successive short periods until the desired force is
reached. The proposed percutaneous delivery system, would allow DC amplitudes and
durations to be adjusted in this way.
5.1.5 Risks and side effects
Spasticity treatments that target central nervous mechanisms, such as systemic anti-
spastic drugs, are often accompanied by undesirable side effects such as sedation,
dizziness, reduced cognition, weakness and liver damage (Gracies et al., 1997; Kita &
Goodkin, 2000; Elovic, 2001). Treatments such as BtA and phenol injections are applied
to specific nerves and muscles and thus avoid major systemic side effects, though it
should be remembered that BtA has recently been shown to produce muscle weakness
in distant muscles in the body (Fortuna et al., 2011). Nerve lesioning with DC acts the
same way therefore no systemic effects are expected.
There are two main types of risk associated with the application of DC via implanted
electrodes: risks associated with surgery and the risk of developing neuropathic pain as
a result of nerve ablation. The main risks associated with the surgery are infections and
pain following the operation (Gan, 2009). Neuropathic pain may occurs following
peripheral nerve injuries (Woolf & Mannion, 1999) and its prevalence is estimated at 1-
3% in the general population (Hayes et al., 2002). It is hard to predict what the incidence
of neuropathic pain would be following a DC nerve lesion. One would expect that
treatments such as phenol and alcohol injections, which lead to neuronal degeneration
(Zafonte & Munin, 2001), may also result in neuropathic pain, though the incidence of
such events is unclear.
Page 139
Chapter 5: General discussion and future directions
125
The chronically implanted animals in our study showed no signs of pain over the
weeks and months after DC nerve ablation. They did not show an increased tendency to
flex the lesioned limb, as they might if the limb were constantly painful. However,
because the incidence of pain after nerve injury is 1-3% (Hayes et al., 2002), it is
reasonable to expect a similar incidence after DC nerve ablation. To evaluate this issue
properly would therefore require a large number of animals. This was outside the scope
of the present studies, but it is an important point that needs to be cleared up before
human clinical trials could be contemplated.
5.1.6 Cost-effectiveness
Cost-effectiveness of a treatment can be very hard to estimate since in addition to
the direct costs of the treatment itself, physicians, nurses and physiotherapists’ time,
the impact of side effects on quality of life and most importantly, attaining of pre-
treatment targets should all be included (Ward et al., 2005). Treatment of spasticity
with DC delivered via implantable electrodes would require surgery, which would
involve significant costs at the outset, particularly when hospitalization and recovery
costs were included. However, it has been suggested that 64% of failed treatments with
BtA and orally administered drugs result in corrective surgery anyway (Ward et al.,
2005). Thus, although BtA and anti-spastic medications are widely used, surgery is still
needed in some cases of spasticity.
Clinicians estimate that only 35% of patients treated with anti-spastic drugs see
sufficient benefits from the treatment to warrant the cost, as opposed to 73% treated
with BtA (Ward et al., 2005). BtA treatment is expensive (Horn et al., 2010). A recent
analysis indicated it was more cost-effective than orally administered drugs (Ward et al.,
2005), but it was estimated to be twice as expensive as treatment with phenol, even
when side effects were considered (Horn et al., 2010).
The treatment of spasticity is a big burden on the healthcare system (Rothwell, 2001;
Roger et al., 2012). An implantable system will have a high cost initially, due to the costs
of the device and surgery. However, unlike BtA, the cost of repeated treatments with
DC, when applied through implanted ports, would be low, as the treatments could be
performed by medical technicians. Furthermore, the same implanted leads could in
principle be used to apply FES to improve activities of daily life, further reducing the
incurred physiotherapists cost and potential assisted care cost. To achieve this, the
implanted ports would have to be modified so that they could deliver either DC via the
percutaneous wires described in this thesis, or FES pulses through another device such
as an implanted radio frequency pulse generator. All things considered, an implantable
system that addresses spasticity and reduced function might in fact turn out to be a
more cost-effective treatment for spastic hypertonus than present-day treatments.
Page 140
Chapter 5: General discussion and future directions
126
DC Phenol and
alcohol
BtA
Localization Very localized
Under the cuff
only
Localized to site of
injection
Migrate in the body
Ease and
duration of
administration
Approximately 30
minutes
Up to 2 hours 30 minutes to an
hour
Frequency of
administration
No restriction No restriction Every 3 month, due
to restricted dosage
Time duration
from
administration
to effect
Minutes 2-60 minutes 2-4 weeks
Side Effects and
risks
Risks associated
with surgery
Discomfort during
DC application
Neuropathic pain
Pain during
application
Multiple needle
insertions
Vascular injections
Neuropathic pain
Pain during
application
Flu like symptoms
Migration in the body
Muscle loss
Cost
effectiveness
Initial expense –
surgery
Cost effective -
address spasticity
and reduced
function
Low cost Costly
Table 5.1: Comparison of DC nerve ablation for the treatment of spasticity and current neurolytic
treatments (phenol , alcohol and BtA).
Page 141
Chapter 5: General discussion and future directions
127
5.2 Future directions
The work presented in this dissertation is an early investigation of a novel treatment
for spasticity using DC to lesion nerves in a controlled manner; therefore there are
several research avenues to pursue. The following sections outline areas of particular
interest.
5.2.1 Mechanisms of damage in the conscious and anesthetized animal
As was shown in Chapter 4, DC amplitudes and durations that were effective in
ablating nerves in anesthetized animals were less effective when applied in conscious
animals. Studies have shown that proteins such as human serum albumin may impede
the damaging effects of the electrode reaction for example by buffering pH changes
(Robblee et al., 1980; Huang et al., 2001) and anesthesia is known to bind to proteins
and have the ability to alter their activation (Franks & Lieb, 1984). Another possibility is
that the blood supply to peripheral nerves may be reduced by anesthetics, and this
might reduce the availability of the body’s three main acid-base buffering systems.
Further investigations into the mechanism of damage due to DC stimulation are needed.
The emphasis should be on understanding the mechanism of DC ablation using in vitro
and in vivo preparations, and the role of anesthesia in making nerves more vulnerable
to DC.
5.2.2 Neuropathic pain
The possible emergence of neuropathic pain following DC nerve ablation should be
evaluated prior to clinical application. Two main points should be considered before any
such testing is carried out. The first issue concerns the animal models used to study
neuropathic pain. It was suggested by Costigan et al. (Costigan et al., 2009) that while
rodents may be a good model for studying the mechanism of pain they are not accurate
predictors of the type of pain that might emerge in humans. The second point to be
considered is the finding that the incidence of neuropathic pain in cats and dogs
following trauma was higher than in humans (Mathews, 2008). As was previously
mentioned, neuropathic pain may result from peripheral nerve damage. In the general
population, the prevalence of neuropathic pain is hard to estimate but is thought to be
approximately 1.5% (Taylor, 2006). An Acute Pain Services (APS) center in Australia
estimated the incidence of neuropathic pain between 1% and 3% (Hayes et al., 2002). A
different study, looking at traumatic nerve injuries, suggested that the incidence of
neuropathic pain after peripheral nerve trauma is closer to 50% (Ciaramitaro et al.,
2010). The incidence of neuropathic pain may in fact depend on the size of the nerve
involved: a recent extensive review (Costigan et al., 2009) reported that sectioning of
large nerves was associated with a 30%-60% incidence of sustained pain, whereas
damage of a small nerve during hernia repair only resulted in a ~5% incidence. The
Page 142
Chapter 5: General discussion and future directions
128
same review cites several epidemiological studies that report an overall prevalence of
neuropathic pain of ~5% (Costigan et al., 2009).
A new study suggests that the nerve response to a mild preconditioning nerve lesion
leads to neuroprotection from neuropathic pain that would otherwise be expected to
result from a subsequent lesion (Moalem-Taylor et al., 2011). This can be easily tested
with an implantable electrode system such as the one described in this dissertation
work and could be easily clinically implemented if proven to work.
5.2.3 Restoration of function following reduction of spasticity
Alleviation of spastic hypertonus does not in general improve the voluntary control
of muscles paralyzed as a result of central nervous system disorder. The same implanted
leads that are used to deliver DC ablation could subsequently be used to deliver FES to
the nerve to help restore voluntary function, provided there was a means of connecting
a controllable pulse generator to the leads. The efficacy of implantable FES systems in
improving motor function has previously been demonstrated in several studies (Kilgore
et al., 2008; Gan et al., 2012).
5.3 Significance of research and concluding remarks
Due to the dependency of the outcome of DC ablation on the number of DC
applications in a single session and the parameters used, and in light of the variability of
force reduction observed between different animals of the same species, it is
recommended that some method of evaluating nerve-evoked muscle force should be
carried out during DC application (e.g. applying low-frequency pulsatile stimulation of
the nerve and measuring twitch force). Furthermore it is recommended that DC is not
applied more than 3 times in a single treatment and that the applications should be
spaced by 5-10 min to allow outcome evaluation. From the results in the anesthetized
animals it seems that mid-range amplitudes (1-1.5mA) do not result in immediate
conduction block but rather in graded attenuation when applied for durations of 2-3
min. Since the results in the conscious animals were inconclusive, it is not feasible at this
time to estimate the amplitude and duration of DC that would be required to achieve
graded reductions of muscle force in humans. This requires further testing in both
conscious animals and humans.
The objective of this work was to test a novel method of alleviating spastic
hypertonus, a condition that afflicts millions of people around the world, reducing their
quality of life, impeding basic functions of daily life and costing millions of dollars to
health care systems. The current treatments for spastic hypertonus address spasticity
with little consideration to the side effects of the treatment, or to functional
improvement. The system suggested in this dissertation offers an alternative means of
Page 143
Chapter 5: General discussion and future directions
129
reducing spastic hypertonus. It may prove to be a cost–effective treatment with few
side effects and the potential to improve voluntary motor function.
Page 144
Chapter 5: General discussion and future directions
130
5.4 References
Banks RW, Barker D & Brown HG. (1985). Sensory reinnervation of muscles following
nerve section and suture in cats. J Hand Surg Br 10, 340-344.
Bovend'Eerdt TJ, Newman M, Barker K, Dawes H, Minelli C & Wade DT. (2008). The
effects of stretching in spasticity: a systematic review. Arch Phys Med Rehabil
89, 1395-1406.
Ciaramitaro P, Mondelli M, Logullo F, Grimaldi S, Battiston B, Sard A, Scarinzi C,
Migliaretti G, Faccani G & Cocito D. (2010). Traumatic peripheral nerve injuries:
epidemiological findings, neuropathic pain and quality of life in 158 patients.
Journal of the peripheral nervous system : JPNS 15, 120-127.
Cope TC, Bonasera SJ & Nichols TR. (1994). Reinnervated muscles fail to produce stretch
reflexes. Journal of neurophysiology 71, 817-820.
Costigan M, Scholz J & Woolf CJ. (2009). Neuropathic pain: a maladaptive response of
the nervous system to damage. Annual review of neuroscience 32, 1-32.
Elovic E. (2001). Principles of pharmaceutical management of spastic hypertonia.
Physical medicine and rehabilitation clinics of North America 12, 793-816, vii.
Elovic EP, Esquenazi A, Alter KE, Lin JL, Alfaro A & Kaelin DL. (2009). Chemodenervation
and nerve blocks in the diagnosis and management of spasticity and muscle
overactivity. Pm R 1, 842-851.
Esquenazi A. (2006). Improvements in healthcare and cost benefits associated with
botulinum toxin treatment of spasticity and muscle overactivity. Eur J Neurol 13
Suppl 4, 27-34.
Esquenazi A, Mayer NH, Elia AE & Albanese A. (2009). Botulinum toxin for the
management of adult patients with upper motor neuron syndrome. Toxicon :
official journal of the International Society on Toxinology 54, 634-638.
Fortuna R, Vaz MA, Youssef AR, Longino D & Herzog W. (2011). Changes in contractile
properties of muscles receiving repeat injections of botulinum toxin (Botox). J
Biomech 44, 39-44.
Page 145
Chapter 5: General discussion and future directions
131
Frangiamore J & O`Brien C. (2004). Pharmacology of Phenol Injections. In Dystonia:
Etiology, Clinical Geatures, and Treatment, ed. Mitchell F. Brin CLc, Joseph
Jankovic, pp. 113-118. Lippincott Williams & Wilkins, Philadelphia.
Franks NP & Lieb WR. (1984). Do general anaesthetics act by competitive binding to
specific receptors? Nature 310, 599-601.
Gan LS. (2009). The stimulus router system: A novel neural prosthesis. In Biomedical
Engineering, pp. 168. University of Alberta, Edmonton, Alberta, Canada.
Gan LS, Ravid E, Kowalczewski JA, Olson JL, Morhart M & Prochazka A. (2012). First
permanent implant of nerve stimulation leads activated by surface electrodes,
enabling hand grasp and release: the stimulus router neuroprosthesis.
Neurorehabilitation and neural repair 26, 335-343.
Gracies JM. (2004). Physiological effects of botulinum toxin in spasticity. Mov Disord 19
Suppl 8, S120-128.
Gracies JM, Nance P, Elovic E, McGuire J & Simpson DM. (1997). Traditional
pharmacological treatments for spasticity. Part II: General and regional
treatments. Muscle Nerve Suppl 6, S92-120.
Hayes C, Browne S & Burstal R. (2002). Neuropathic pain in the acute pain service: a
prospective survey. Acute Pain 4, 45-48.
Horn LJ, Singh G & Dabrowski ER. (2010). Chemoneurolysis with Phenol and Alcohol. In
Spasticity : Diagnosis and Management, ed. Brashear AE, Elie, pp. 466. Demos
Medical Publishing New York, NY, USA
Huang CQ, Carter PM & Shepherd RK. (2001). Stimulus induced pH changes in cochlear
implants: an in vitro and in vivo study. Annals of biomedical engineering 29, 791-
802.
Kilgore KL, Hoyen HA, Bryden AM, Hart RL, Keith MW & Peckham PH. (2008). An
implanted upper-extremity neuroprosthesis using myoelectric control. The
Journal of hand surgery 33, 539-550.
Kirazli Y, On AY, Kismali B & Aksit R. (1998). Comparison of phenol block and botulinus
toxin type A in the treatment of spastic foot after stroke: a randomized, double-
blind trial. Am J Phys Med Rehabil 77, 510-515.
Page 146
Chapter 5: General discussion and future directions
132
Kita M & Goodkin DE. (2000). Drugs used to treat spasticity. Drugs 59, 487-495.
Mathews KA. (2008). Neuropathic pain in dogs and cats: if only they could tell us if they
hurt. The Veterinary clinics of North America Small animal practice 38, 1365-
1414, vii-viii.
Moalem-Taylor G, Li M, Allbutt HN, Wu A & Tracey DJ. (2011). A preconditioning nerve
lesion inhibits mechanical pain hypersensitivity following subsequent
neuropathic injury. Molecular pain 7, 1.
Montane E, Vallano A & Laporte JR. (2004). Oral antispastic drugs in nonprogressive
neurologic diseases: a systematic review. Neurology 63, 1357-1363.
Penn RD & Kroin JS. (1987). Long-term intrathecal baclofen infusion for treatment of
spasticity. Journal of neurosurgery 66, 181-185.
Prochazka A, Mushahwar VK & McCreery DB. (2001). Neural prostheses. J Physiol 533,
99-109.
Robblee LS, McHardy J, Marston JM & Brummer SB. (1980). Electrical stimulation with Pt
electrodes. V. The effect of protein on Pt dissolution. Biomaterials 1, 135-139.
Roger VL, Go AS, Lloyd-Jones DM, Benjamin EJ, Berry JD, Borden WB, Bravata DM, Dai S,
Ford ES, Fox CS, Fullerton HJ, Gillespie C, Hailpern SM, Heit JA, Howard VJ,
Kissela BM, Kittner SJ, Lackland DT, Lichtman JH, Lisabeth LD, Makuc DM,
Marcus GM, Marelli A, Matchar DB, Moy CS, Mozaffarian D, Mussolino ME,
Nichol G, Paynter NP, Soliman EZ, Sorlie PD, Sotoodehnia N, Turan TN, Virani SS,
Wong ND, Woo D & Turner MB. (2012). Heart disease and stroke statistics--2012
update: a report from the American Heart Association. Circulation 125, e2-e220.
Rothwell PM. (2001). The high cost of not funding stroke research: a comparison with
heart disease and cancer. Lancet 357, 1612-1616.
Taylor RS. (2006). Epidemiology of refractory neuropathic pain. Pain practice : the
official journal of World Institute of Pain 6, 22-26.
van Kuijk AA, Geurts AC, Bevaart BJ & van Limbeek J. (2002). Treatment of upper
extremity spasticity in stroke patients by focal neuronal or neuromuscular
blockade: a systematic review of the literature. J Rehabil Med 34, 51-61.
Page 147
Chapter 5: General discussion and future directions
133
Ward A, Roberts G, Warner J & Gillard S. (2005). Cost-effectiveness of botulinum toxin
type a in the treatment of post-stroke spasticity. J Rehabil Med 37, 252-257.
Waters RL, McNeal D & Perry J. (1975). Experimental correction of footdrop by electrical
stimulation of the peroneal nerve. The Journal of bone and joint surgery
American volume 57, 1047-1054.
Whitwam JG & Kidd C. (1975). The use of direct current to cause selective block of large
fibres in peripheral nerves. Br J Anaesth 47, 1123-1133.
Woolf CJ & Mannion RJ. (1999). Neuropathic pain: aetiology, symptoms, mechanisms,
and management. Lancet 353, 1959-1964.
Zafonte RD & Munin MC. (2001). Phenol and alcohol blocks for the treatment of
spasticity. Physical medicine and rehabilitation clinics of North America 12, 817-
832, vii.
Page 148
134
Appendix A:
Summary of animals used, experimental parameters
and results
Rabbit
number
DC
amplitude
(mA)
DC
duration
Order of application
(amplitude/duration)
Final
attenuation
In force
cha
pte
r
1 0.5, 1 2.5, 5 min 2x(0.5/2.5), 0.5/5, 1/2.5 80% 2
2 0.1, 0.2 2.5, 5, 10
min
0.1/2.5, 0.1/10, 0.2/5,
0.2/10, 0.2/5
60% 2
3 1 2, 5 min 100% 2
4 0.2, 0.3,
0.4, 0.5
5,10, 20
min
0.2/10, 2x(0.3/5), 0.3/10,
0.3/20, 0.4/10, 0.5/20
No
permanent
reduction
2
5 0.5 10,20 min 100% 2
6 0.1, 0.2,
0.3, 0.4
10, 20, 30,
35, 45 min
0.1/45, 0.2/45, 0.3/45,
0.3/35, 0.4/10, 0.4/20,
0.4/30
100%
2
7 0.3 45, 35, 30
min
65% 2
8 0.75 2 min 6x(0.75/2) 100% 3
9 0.75 2 min 14x(0.75/2) 63% 3
10 2, 2.5 20, 30, 40
s 1, 1.5
min
2/20 5x(2/30), 3x(2/40),
2.5/30, 2x(2/1)
100%
3
11 1, 1.5, 2,
2.5
30 s 3x(1/30), 3x(1.5/30),
3x(2/30), 3x(2.5/30)
90% 3
12 1 45 s, 1,
1.5, 2 min
3x(1/45), 3x(1/1),
3x(1/1.5), 2x(1/2)
100% 3
13 2 30 s, 1, 1.5
min
4x(2/30), 4x(2/1),
3x(2/1.5)
80% 3
14 1.5 30 s, 1min 1.5/30, 7x(1.5/1) 60% 3
Table A.1: Rabbit used in acute experiments - data reported in thesis
Page 149
135
Rabbit DC
amplitude
DC
duration
Order of application
(amplitude/duration)
Technical problems
rendering results
inconclusive, so not
reported in the thesis
1 0.5, 0.75 2 min 13X(0.5/2), 2x(0.75/2) Muscle puller had to be
readjusted
2 0.75 2 min 3x(0.75/2) Cuff broke, problems with
DC stimulator
3 2 30 s, 45 s,
1 min, 1.5
min, 2 min
4x(2/30), 2/45,
3x(2/1), 2/1.5, 2/2
Used rabbit implanted with
initial version of
subcutaneous ports, had to
change the anode in the
middle of the experiment
4 2 1 2/1 Used rabbit implanted with
initial version of
subcutaneous ports. Muscle
puller jittered. Length
tension curve was
performed and muscle
puller was set.
Table A.2: Rabbit used in acute experiments – no results
Cat
number
Time
after
implant
DC
amplitude
DC
duration
Force
attenuation
Time to
recovery
from final
attenuation cha
pte
r
1
3 weeks 0.3 mA 37min 90% -
temporary 2 month 2
6 weeks 0.4 mA 35 min 50%
11 weeks 0.4 ma 30 min 100%
2 4 month 0.5mA 10 min 60% 7 weeks 4
3 13 weeks 1mA 10 min 100% 16 weeks
4 30 weeks 1mA 9 min 100% 20 weeks
Table A.3: Chronically implanted cats – DC under anesthesia
Page 150
136
animal L-leg R-leg DC
amplitude
DC
duration
Attenuation
and recovery
cha
pte
r
Rabbit 1
Lidocaine
Lidocaine + DC
DC only 3 mA 4 min 100% R+L leg
no recovery 3
Rabbit 2 Lidocaine
Lidocaine+ DC
DC only 3 mA 4 min 100% R+L leg
no recovery 3
Cat Lidocaine
Lidocaine+ DC
Lidocaine
+DC
R-leg: 3 mA
L-leg: 1mA
R-leg : 4
min
L-leg: 10
min
100% R+L leg
No recovery 3
Table A.4: Animals used for Lidocaine tests reported in thesis
Animal L-leg R-leg Result Technical problems
rendering results
inconclusive, so not
reported in the thesis
Rabbit 1 Lidocaine - Initial conduction
block lasted more
than 2 hours
Initial conduction block
lasted more than 2 hours
(very young animal)
Rabbit 2 Lidocaine - Initial conduction
block lasted more
than 2 hours
ditto
Table A.5: Animal used for experiments with Lidocaine – no results
Page 151
137
Animal
# o
f cu
ffs Time
after
implant
DC
amplitude
(mA)
DC duration Attenuation
measured
under
anesthesia
Time to
recovery
from
attenuation cha
pte
r
Cat 2
(same
as cat 2
in
Table
A.3)
2 12
month
0.5
0.5
3.5 min
4 min
Slight
attenuation
One week
4
0.75
0.75
0.75
6 min
3 min 40 s
2 min 40 s
Slight
attenuation
One week
0.75 5 min 40 s No
attenuation
Rabbit
1 1
2.5
month
5 3 min No
attenuation
4
Rabbit
2 2
18
weeks
1.5 6 min 10 s 23% 5 weeks
4
28
weeks
3 80 s Not
measured
29
weeks
3 67 s Not
measured
30
weeks
3.5
3
4, 5
20s
30s
65 s
(7 s 58 s)
No
attenuation
Rabbit
3 2
4
month
1.5 6 min 10 s No
attenuation
4
1 5.5
month
2, 2.5, 3 1 min, 2min,
1min in one
continuous
trial
27% 4 weeks
Table A.6: Chronically implanted animals – DC delivery while awake
Page 152
138
Rabbit
number
Reason for failure as a chronic Alternative
use
Description of
alternative use
Reported
in chapter
1 Implanted with initial version of
subcutaneous electrodes (right
leg). Rabbit chewed stainless
steel electrode.
Used
acutely
Rabbit 3 in
table A.2 (used
left leg)
2 Implanted with initial version of
subcutaneous electrodes (right
leg). Stainless steel electrode
failed.
Used
acutely
Rabbit 13 in
table A.1 (used
left leg) 3
3 Implanted with initial version of
subcutaneous electrodes (left
leg). Could not stimulate
through subcutaneous port.
Used
acutely
Rabbit 4 in
table A.2
4 Implanted with a newer version
of subcutaneous ports.
Electrodes failed after 4 months
before sufficient data could be
collected.
Used
acutely
Tested the
latest version
of
subcutaneous
electrodes.
5 Implanted with final version of
subcutaneous electrodes using
conductive silicone. A single Pt-
Ir electrode was implanted.
Wire broke off.
Table A.7: Chronically implanted rabbits - could not be used for awake experiments
Page 153
139
Appendix B:
DC amplitudes and duration that may be effective at
reducing spasticity as were concluded from animal
experiments
duration
amplitude
30s 60 s 90 s 120 s 180 s
1mA x x x x x
1.5 mA x x x x
2 mA x x x
2.5mA x x
3mA
Table B.1: Recommended combinations of amplitude and duration (marked “x”) to produce
graded reductions of force as concluded from the results presented in this thesis.