URENCO Limited Unaudited Interim Condensed Consolidated Financial Statements FOR THE 6 MONTHS ENDED 30 JUNE 2011 Disclaimer These financial statements and the information contained within them do not constitute an offering of securities or otherwise constitute an invitation or inducement to underwrite, subscribe for or otherwise acquire securities in or issued by any company within the URENCO Group. Any forward-looking statements contained within this release are inherently subject to risks and uncertainties. Actual results may differ materially from those expressed or implied by such forward- looking statements and, accordingly, any person reviewing this release should not rely on such forward- looking statements. URENCO Limited disclaims and intention or obligation to publicly update or revise any forward-looking statements, whether as a result of new information, future events, or otherwise.
Transcript
URENCO Limited Unaudited Interim Condensed Consolidated Financial Statements FOR THE 6 MONTHS ENDED 30 JUNE 2011 Disclaimer These financial statements and the information contained within them do not constitute an offering of securities or otherwise constitute an invitation or inducement to underwrite, subscribe for or otherwise acquire securities in or issued by any company within the URENCO Group. Any forward-looking statements contained within this release are inherently subject to risks and uncertainties. Actual results may differ materially from those expressed or implied by such forward-looking statements and, accordingly, any person reviewing this release should not rely on such forward-looking statements. URENCO Limited disclaims and intention or obligation to publicly update or revise any forward-looking statements, whether as a result of new information, future events, or otherwise.
2
The URENCO Group URENCO is an independent international energy and technology group with its head office based in Marlow, UK. It operates facilities in Germany, the Netherlands, the UK and New Mexico, US. It operates in a pivotal area of the nuclear fuel supply chain, which enables the sustainable generation of electricity for consumers around the world. Utilising centrifuge technology, URENCO provides safe, cost-effective and reliable uranium enrichment services for civil power generation within a framework of high environmental, social and corporate responsibility standards. Currently URENCO fulfils around 27% of the global enrichment market, and aims to establish itself as the leading global supplier of enrichment and enrichment technology. www.urenco.com
3
CONTENTS
Page
Corporate Information 4
Highlights 5
Statement of Directors’ Responsibilities 9
Independent Review Report to URENCO Limited 10
Interim Consolidated Income Statement 11
Interim Consolidated Statement of Comprehensive Income 12
Interim Consolidated Statement of Financial Position 13
Interim Consolidated Statement of Changes in Equity 14
Interim Consolidated Cash Flow Statement 15
Notes to the Interim Condensed Consolidated Financial Statements 16
4
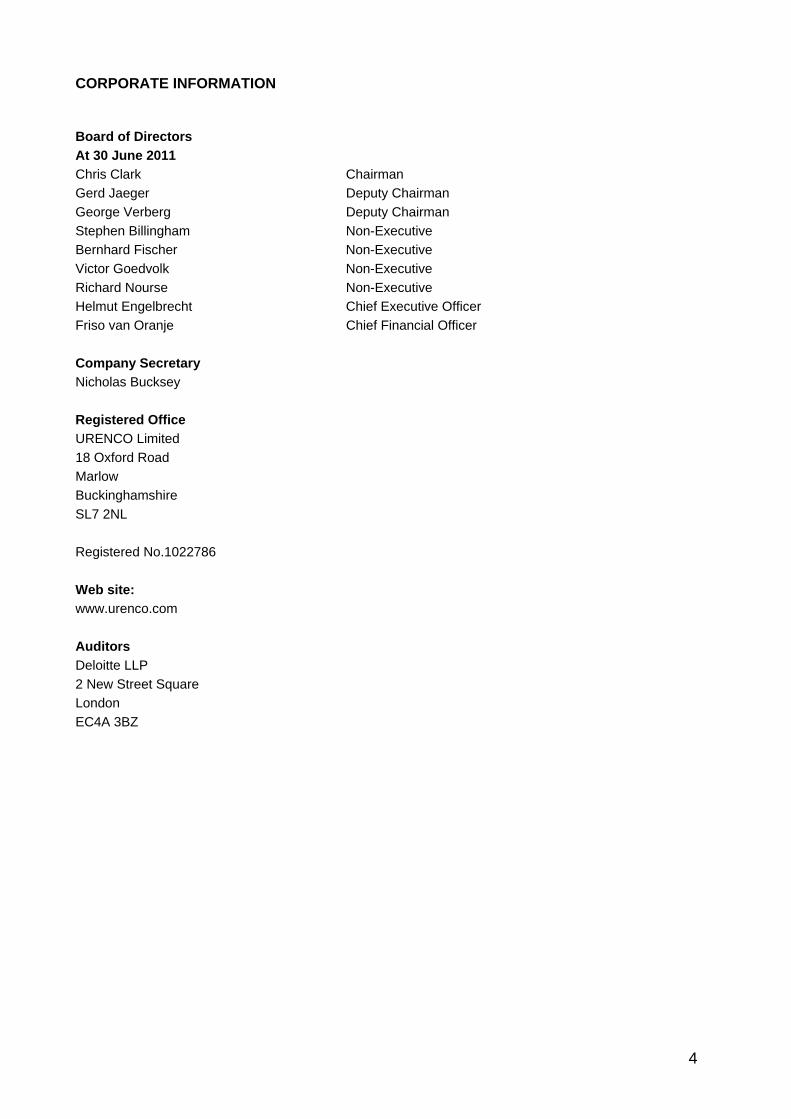
CORPORATE INFORMATION Board of Directors At 30 June 2011 Chris Clark Chairman Gerd Jaeger Deputy Chairman George Verberg Deputy Chairman Stephen Billingham Non-Executive Bernhard Fischer Non-Executive Victor Goedvolk Non-Executive Richard Nourse Non-Executive Helmut Engelbrecht Chief Executive Officer Friso van Oranje Chief Financial Officer Company Secretary Nicholas Bucksey Registered Office URENCO Limited 18 Oxford Road Marlow Buckinghamshire SL7 2NL Registered No.1022786 Web site: www.urenco.com Auditors Deloitte LLP 2 New Street Square London EC4A 3BZ
HIGHLIGHTS URENCO financial performance in line with expectations for the first half of 2011
Highlights
• Shift in delivery profile compared to 2010 leads to significant revenue increase
• Increase in production capacity of 4% across geographies since December 2010
• Order book remains strong at more than €20 billion extending out beyond 2025
• Improved funding position following re-financing of revolving credit facilities at €750 million and
extended European Investment Bank loan
• Tails management facility (TMF) site preparation work completed and lead contract signed for
construction services
• Japan earthquake and impact on nuclear generation in Japan and other countries will slow near
term growth in deliveries
Financial highlights
Six months to 30 June 2011
(unaudited)
Six months to 30 June 2010 Restated
% change
€m €m i
Revenue 527 390 35%
EBITDA 306 264 16%
EBITDA margin - % 58% 68% (10%)
Income from operating activities 190 167 14%
Net income 125 98 28%
Net income margin - % 24% 25% (1%)
Capital expenditure 334 368 (9)%
Cash generated from operating activities 390 357 8% i Restated for change in accounting policy - under IAS 31 Interests in joint ventures, as detailed in note 2.
• Shift in delivery profile compared to 2010 leads to significant revenue increase
Revenue for the first half of 2011 was €527 million, a 35% increase on 2010 half year. This was driven by 29% higher separative work deliveries to our customers. EBITDA increased by 16% to €306 million (2010: €264 million) mainly as the result of higher revenue and production cost savings, driven by further economies of scale. EBITDA margin at 58% was 10% lower than half year 2010. The main driver for this was a foreign exchange retranslation gain included in 2010 results (2010: €33 million). Net income grew by 28% during the period (2011: €125 million; 2010: €98 million). This is higher than the growth in EBITDA (2011: €306 million; 2010 €264 million, an increase of 16%), in part as a result of gains on ineffective hedges (€7 million) during the first half of 2011. The net income margin at the half year was 24% (2010: 25%), impacted by higher depreciation costs.
6
The Group’s tax charge for the half year was €39.3 million (2010: €18.2 million), with an effective rate of 24% (2010: 16%). The Group invested €334 million in new production capacity (2010: €368 million). The Group expects further new capacity to be added across Europe and in the United States. Cash generation from operating activities was €390 million (2010: €357 million), an 8% increase, mainly as a result of the shift in customer deliveries. Tax paid in the period was €74 million (2010: €60 million), reducing net cash flow from operating activities to €316 million, a 6% increase on 2010.
• Increase in production capacity of 4% across geographies since December 2010
URENCO continued capacity expansion at its European sites during the first half of 2011. This has added circa 500 t/SW of capacity, bringing the Group’s total amount to more than 13,500 tSW/a. This equates to a 4% increase from the start of 2011 (2010: 13,000 tSW/a). The Group expects that new capacity will be added during the second half of 2011.
Commissioning issues at URENCO’s US facility are still causing delays in bringing additional capacity online. URENCO continues to work with the US Nuclear Regulatory Commission (NRC) towards a resolution. Overall, the impact from URENCO’s US facility on the Group’s capacity has been mitigated by additional capacity in Europe, as well as URENCO’s flexible business model.
• Order book remains strong at more than €20 billion extending out beyond 2025
URENCO’s order book remains strong, with only minimal impact seen as a result of the events in Japan and the nuclear phase-out in Germany. Currently, forward orders stand at more than €20 billion and extend beyond 2025. This strong visibility of future revenues successfully underpins URENCO’s strategy of growth through investment. URENCO continues to be a leading provider of enrichment services to the global nuclear power industry, maintaining a market share of around 27%*. * internal calculation
• Improved funding position following re-financing of revolving credit facilities at €750 million and extended European Investment Bank loan
URENCO’s liquidity position continues to be good, with significant forward cover from its committed funding facilities through into 2013. In the first half of 2011, the syndicated bank facility of €500 million maturing in 2012 was replaced with a new syndicated and a bilateral facility totalling €750 million, with a term out to 2016. In addition, €75 million was drawn down as part of the funding arrangements with the European Investment Bank (EIB).
• Tails Management Facility (TMF) site preparation work completed and lead contract signed for construction services
Site preparation works have been completed in the first half of 2011 for the TMF, which will be built at URENCO’s UK site. Detailed design work continues. A contract has been signed for project management, design engineering, procurement and construction management services. A further contract has also been signed for the supply of core technology. It is anticipated that construction will begin in 2012, with operations due to commence in 2015. The TMF is an important project for URENCO, as it will provide control over the cost of tails and the ability to manage tails in a responsible manner.
7
The TMF will comprise a UF6 tails deconversion unit and a number of associated storage, maintenance and residue processing facilities. This supports URENCO’s long-term strategy for the management of tails pending future re-use.
• Japan earthquake and impact on nuclear generation in Japan and other countries will slow near term growth in deliveries
The effects of the earthquake and subsequent tsunami that took place in Japan earlier in 2011 are still being assessed in terms of impact on the global nuclear industry. URENCO has so far experienced minimal impact from the events that took place mainly as a result of URENCO’s flexibility of investment and geographical spread, however near term growth in customer deliveries will slow. The Group will continue to assess this impact and will monitor future capacity development.
Outlook The Group expects to deliver stable operational and financial results for 2011, with revenues expected to be slightly higher and EBITDA broadly in line with the 2010 full year results. Net income at the full year is expected to be lower than 2010. Operational cash flow will remain strong and continue to be a significant source of funds for the Group’s expansion programme. We expect to continue capacity expansion in the second half of 2011 in order to meet our customer commitments, which extend beyond 2025. Helmut Engelbrecht, Chief Executive of the URENCO Group, commenting on the half-year results, said: URENCO’s operations continued to perform well in the first half of 2011, and capacity increased by 4%. Our financial results were also robust, with higher customer deliveries providing better financial performance compared to the same period last year. “The consequences of the events in Japan are still unfolding and the final implications for the global nuclear industry are not yet fully understood. Although the impact on URENCO is minimal to date, we are aware that this will have implications for how we do business in the future. However, as URENCO has a flexible and robust business model, we are confident that the Group will continue to grow and remain strong both operationally and financially. “We expect to continue capacity expansion in the second half of 2011 in order to meet our customer commitments, which extend beyond 2025.”
8
REVIEW OF FINANCIAL RESULTS Income Statement for the period ending 30 June 2011 Separative Work Unit (SWU) deliveries were 29% higher in the period to June 2011, compared with the same period last year. In addition, deliveries of feed to our customers grew by 17% and average selling prices saw a small increase compared to half year 2010. These combined factors led to an increase in revenue which reached €527 million (2010: €390 million). EBITDA was 16% higher during the first half of 2011, reaching €306 million (2010: €264 million). The increase in EBITDA was as a result of increased revenue and reduced average production costs driven by economies of scale and cost control. The first half of 2010 EBITDA of €264 million included foreign exchange retranslation gains on balance sheet items of €33 million. The impact of retranslation for half year 2011 is a loss of €7 million. Net finance costs for the half year 2011 were €26 million, compared to €51 million at half year 2010. The portion of the hedge portfolio not eligible for hedge accounting under IAS39 (including ineffective hedges) led to a €19 million charge to the income statement for the first six months of 2010. This charge was primarily driven by the weakening of the Euro against both the Dollar and Sterling. This compares to a gain of €7 million for the half year 2011. The tax charge for the first half of the year at €39 million (2010: €18 million) is higher than the same period last year with an effective tax rate of 24% (2010: 16%). The increase in the effective tax rate compared with the previous half year period is mainly the result of unusually large non-taxable foreign exchange gains included in the Group's income statement in the six months to 30 June 2010. Net income grew by 28% during the period (2011: €125 million; 2010 €98 million). This is higher than the growth in EBITDA in part as a result of certain gains on ineffective hedges during the first half of 2011. The net income margin at the half year was 24% (2010: 25%), impacted by higher depreciation costs. Statement of Financial Position – as at 30 June 2011 The book value of tangible assets increased by €77 million in the first half of the year, reflecting the growth through investment strategy. Capital expenditure during the first six months of 2011 amounted to €334 million which compares to €368 million at half year 2010. The timing of customer receipts and supplier payments led to higher net cash flow from operating activities of €316 million (2010: €297 million). Net debt was €2,485 million as at 30 June 2011, up €76 million from 31 December 2010 and mainly reflecting capital expenditure made in the first half of the year. The Group held cash and cash equivalents of €97 million at the end of June 2011 (2010: €38 million). Total equity has increased by €3 million with retained earnings increasing by €34 million in the period. This has been offset in part by equity movements in hedging reserve (IAS39) and foreign currency retranslation reserve which, when combined, reduce equity by €31 million.
9
STATEMENT OF DIRECTORS’ RESPONSIBILITIES The Directors of the Company as listed on page 4 hereby confirm that to the best of their knowledge:
• the condensed set of financial statements has been prepared in accordance with IAS 34 as adopted by the European Union and gives a true and fair view of the assets, liabilities, financial position and profit and loss of URENCO.
By Order of the Board Helmut Engelbrecht Chief Executive Officer Friso van Oranje Chief Financial Officer
10
REPORT ON REVIEW OF INTERIM CONDENSED CONSOLIDATED FINANCIAL STATEMENTS TO THE SHAREHOLDERS OF URENCO LIMITED We have been engaged by the company to review the condensed set of consolidated financial statements in the half-yearly financial report for the six months ended 30 June 2011 which comprises the consolidated income statement, the consolidated statement of comprehensive income, the consolidated statement of financial position, the consolidated statement of changes in equity, the consolidated cash flow statement and related notes 1 to 13. We have read the other information contained in the half-yearly financial report and considered whether it contains any apparent misstatements or material inconsistencies with the information in the condensed set of financial statements. This report is made solely to the company in accordance with International Standard on Review Engagements (UK and Ireland) 2410 "Review of Interim Financial Information Performed by the Independent Auditor of the Entity" issued by the Auditing Practices Board. Our work has been undertaken so that we might state to the company those matters we are required to state to it in an independent review report and for no other purpose. To the fullest extent permitted by law, we do not accept or assume responsibility to anyone other than the company, for our review work, for this report, or for the conclusions we have formed. Directors' responsibilities The half-yearly financial report is the responsibility of, and has been approved by, the directors. The directors are responsible for preparing the half-yearly financial report in accordance with International Accounting Standard 34, “Interim Financial Reporting,” as adopted by the European Union. As disclosed in note 2, the annual financial statements of the group are prepared in accordance with IFRSs as adopted by the European Union. The condensed set of financial statements included in this half-yearly financial report has been prepared in accordance with International Accounting Standard 34, "Interim Financial Reporting," as adopted by the European Union. Our responsibility Our responsibility is to express to the Company a conclusion on the condensed set of financial statements in the half-yearly financial report based on our review. Scope of Review We conducted our review in accordance with International Standard on Review Engagements (UK and Ireland) 2410 "Review of Interim Financial Information Performed by the Independent Auditor of the Entity" issued by the Auditing Practices Board for use in the United Kingdom. A review of interim financial information consists of making inquiries, primarily of persons responsible for financial and accounting matters, and applying analytical and other review procedures. A review is substantially less in scope than an audit conducted in accordance with International Standards on Auditing (UK and Ireland) and consequently does not enable us to obtain assurance that we would become aware of all significant matters that might be identified in an audit. Accordingly, we do not express an audit opinion. Conclusion Based on our review, nothing has come to our attention that causes us to believe that the condensed set of financial statements in the half-yearly financial report for the six months ended 30 June 2011 is not prepared, in all material respects, in accordance with International Accounting Standard 34 as adopted by the European Union. Deloitte LLP Chartered Accountants and Statutory Auditor London, UK 25 August 2011
11
INTERIM CONSOLIDATED INCOME STATEMENT Six months ended
30 June Year ended 31
December 2011 2010 2010 (restated i) (restated i) Unaudited Audited Notes €m €m €m Revenue from sale of goods and services 3 527.0 389.5 1,259.4 Work performed by the entity and capitalised 6.2 7.9 14.5Changes to inventories of finished goods and
work in progress 36.8 54.3 (16.9)Raw materials and consumables used (27.6) (0.4) (32.8)Tails provision created 10 (55.1) (49.8) (102.3)Revision of decommissioning provision - (0.5) -Employee benefits expense (64.3) (63.7) (129.2)Depreciation and amortisation 4 (113.9) (92.2) (203.3)Other expenses (116.8) (73.5) (183.5)Share of results of joint venture (2.1) (4.5) (15.4) Income from operating activities 190.2 167.1 590.5 Finance income 4 40.9 45.5 63.6Finance costs 4 (66.8) (96.2) (132.4)Income before tax 164.3 116.4 521.7 Income tax expense 5 (39.3) (18.2) (134.6) Net income relating to the period/year attributable to equity holders of the parent
125.0 98.2 387.1
Earnings per share: € € €Basic and diluted earnings per share 0.74 0.58 2.30
i The June 2010 and December 2010 results have been restated for a change in accounting policy IAS 31 Interests in Joint Ventures, refer to note 2.
12
INTERIM CONSOLIDATED STATEMENT OF COMPREHENSIVE INCOME
Six months ended 30 June
Year ended 31 December
2011 2010 2010 Unaudited Audited (restated i) (restated i) €m €m €m Net income 125.0 98.2 387.1 Other comprehensive income: Cash flow hedges – transfers to revenue from sales of goods and services and capital expenditure
7.3 13.6 29.8
Cash flow hedges – mark to market 67.9 (198.3) (90.0)Net investment hedge – mark to market 7.5 (78.9) (29.7)Deferred tax on hedges (20.6) 56.5 14.8Current tax on hedges - - 2.6Exchange differences on foreign currency translation of foreign operations
(101.6) 166.1 51.8
Deferred tax credit on translation exchange differences
- - 0.2
Current tax credit on translation exchange differences
- - 2.4
Exchange differences on hedge reserve 8.7 (7.8) (3.5)Actuarial gains/(losses) on defined benefit pension schemes
(1.4) (4.6) 12.2
Deferred tax on actuarial gains / (losses) 0.3 1.4 (4.4)Current tax on actuarial gains / (losses) - - 0.7Utility partner payments - - (0.3)Deferred tax on utility partner payments - - 5.6 Other comprehensive income (31.9) (52.0) (7.8) Total comprehensive income relating to the period/year attributable to equity holders of the parent
93.1 46.2 379.3
i The June 2010 and December 2010 results have been restated for a change in accounting policy IAS 31 Interests in Joint Ventures, refer to note 2.
13
INTERIM CONSOLIDATED STATEMENT OF FINANCIAL POSITION
Notes
30 June 2011
Unaudited
€m
30 June 2010
Unaudited (restated i)
€m
31 December 2010
Audited (restated i)
€m ASSETS Non-current assets Property, plant and equipment 7 3,632.8 3,495.8 3,555.9Intangible assets 68.5 30.9 75.1Investments 39.5 40.8 34.8Derivative financial instruments 111.3 56.6 79.1Deferred tax assets 136.2 156.6 122.4 3,988.3 3,780.7 3,867.3Current assets Inventories 201.2 216.6 139.3Trade and other receivables 594.3 487.4 733.4Derivative financial instruments 18.1 23.6 16.4Income tax recoverable 23.0 15.1 4.5Cash and cash equivalents 8 96.6 27.2 38.2 933.2 769.9 931.8TOTAL ASSETS 4,921.5 4,550.6 4,799.1 EQUITY AND LIABILITIES Equity attributable to equity holders of the parent
Share capital 237.3 237.3 237.3Additional paid in capital 16.3 16.3 16.3Retained earnings 1,346.9 1,007.1 1,313.0Hedging reserve (99.5) (309.2) (170.3)Foreign currency translation reserve (99.7) 113.6 1.9Total equity 1,401.3 1,065.1 1,398.2 Non-current liabilities Trade and other payables 35.4 9.9 10.7Obligations under finance lease 0.2 0.3 0.1Interest bearing loans and borrowings 9 2,167.0 2,148.8 2,157.8Provisions 10 602.9 530.1 568.9Retirement benefit obligations 11 39.3 60.2 41.5Deferred income 9.4 9.6 9.5Derivative financial instruments 37.0 178.5 55.7Deferred tax liabilities 74.8 21.3 39.7 2,966.0 2,958.7 2,883.9Current liabilities Trade and other payables 171.8 132.6 176.5Obligations under finance lease 0.2 0.5 0.3Interest bearing loans and borrowings 9 317.8 271.7 250.8Provisions 10 0.3 1.9 1.1Derivative financial instruments 12.0 98.3 42.7Income tax payable 29.9 21.8 40.6Deferred income 22.2 - 5.0 554.2 526.8 517.0Total liabilities 3,520.2 3,485.5 3,400.9TOTAL EQUITY AND LIABILITIES 4,921.5 4,550.6 4,799.1i The June 2010 and December 2010 results have been restated for a change in accounting policy IAS 31 Interests in Joint Ventures, refer to note 2.
14
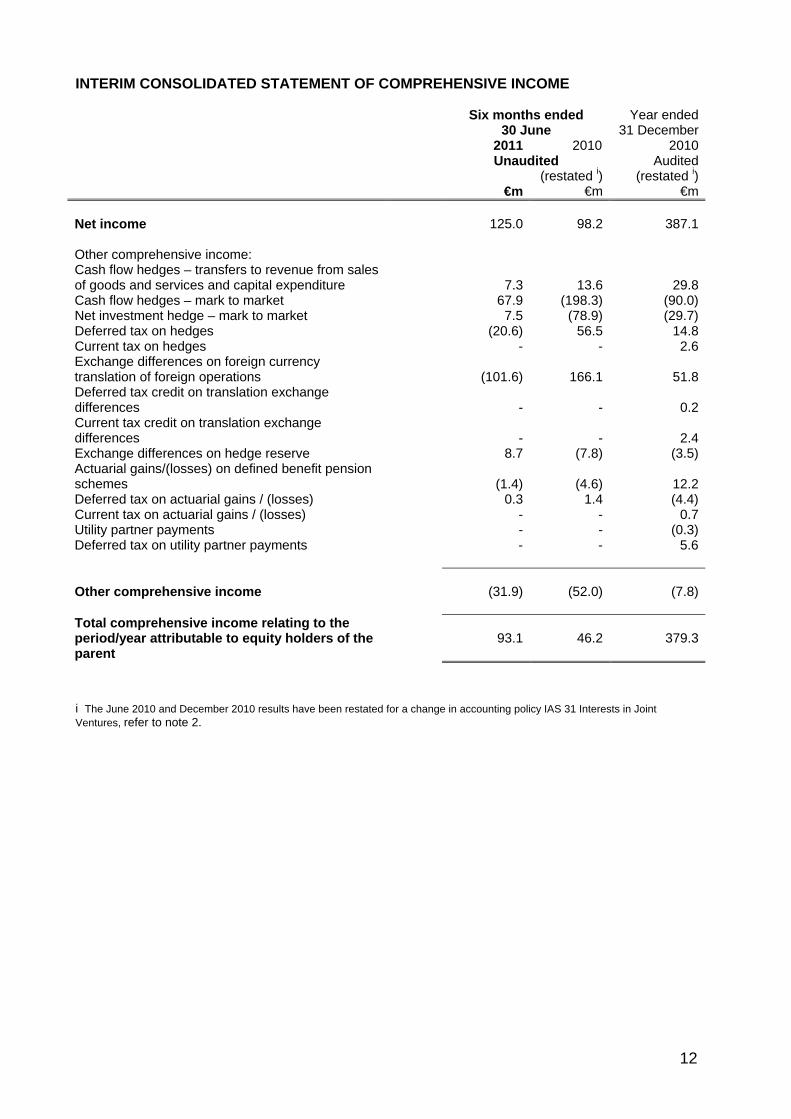
INTERIM CONSOLIDATED STATEMENT OF CHANGES IN EQUITY
Issued capital
€m
Additional
paid in capital
€m
Retained earnings
€m
Hedging reserves
€m
Foreign currency
translation reserve
€m
Attributable to equity
holders of the parent
€m As at 31 December 2010 (Audited) 237.3 16.3 1,313.0 (170.3) 1.9 1,398.2Income for the period - - 125.0 - - 125.0Other comprehensive income - - (1.1) 70.8 (101.6) (31.9)Total comprehensive income - - 123.9 70.8 (101.6) 93.1Equity dividend payable - - (90.0) - - (90.0)As at 30 June 2011 (Unaudited) 237.3 16.3 1,346.9 (99.5) (99.7) 1,401.3
Issued capital
€m
Additional
paid in capital
€m
Retained earnings
€m
Hedging reserves
€m
Foreign currency
translation reserve
€m
Attributable to equity
holders of the parent
€m As at 31 December 2009 (Audited) 237.3 16.3 987.1 (94.3) (52.5) 1,093.9Income for the period - - 98.2 - - 98.2Other comprehensive income - - (3.2) (214.9) 166.1 (52.0)Total comprehensive income - - 95.0 (214.9) 166.1 46.2Equity dividends paid - - (75.0) - - (75.0)As at 30 June 2010 (Unaudited) 237.3 16.3 1,007.1 (309.2) 113.6 1,065.1
Issued capital
€m
Additional
paid in capital
€m
Retained earnings
€m
Hedging reserves
€m
Foreign currency
translation reserve
€m
Attributable to equity
holders of the parent
€m As at 31 December 2009 (Audited) 237.3 16.3 987.1 (94.3) (52.5) 1,093.9Income for the period - - 387.1 - - 387.1Other comprehensive income - - 13.8 (76.0) 54.4 (7.8)Total comprehensive income 400.9 (76.0) 54.4 379.3Equity dividends paid - - (75.0) - - (75.0)As at 31 December 2010 (Audited) 237.3 16.3 1,313.0 (170.3) 1.9 1,398.2
Additional paid in capital This represents the 21.7% shares given to Urenco Limited by its shareholders in 2006 as additional paid in capital bringing the Urenco holding in ETC to 50%. Hedging reserve The hedging reserve is a separate component of equity used to record changes in the fair values of cash flow hedging instruments and net investment hedges in accordance with the Group’s accounting policy. Foreign currency translation reserve The foreign currency translation reserve is used to record exchange differences arising from the translation of the financial statements of foreign subsidiaries and the parent entity into the Euro presentational currency.
15
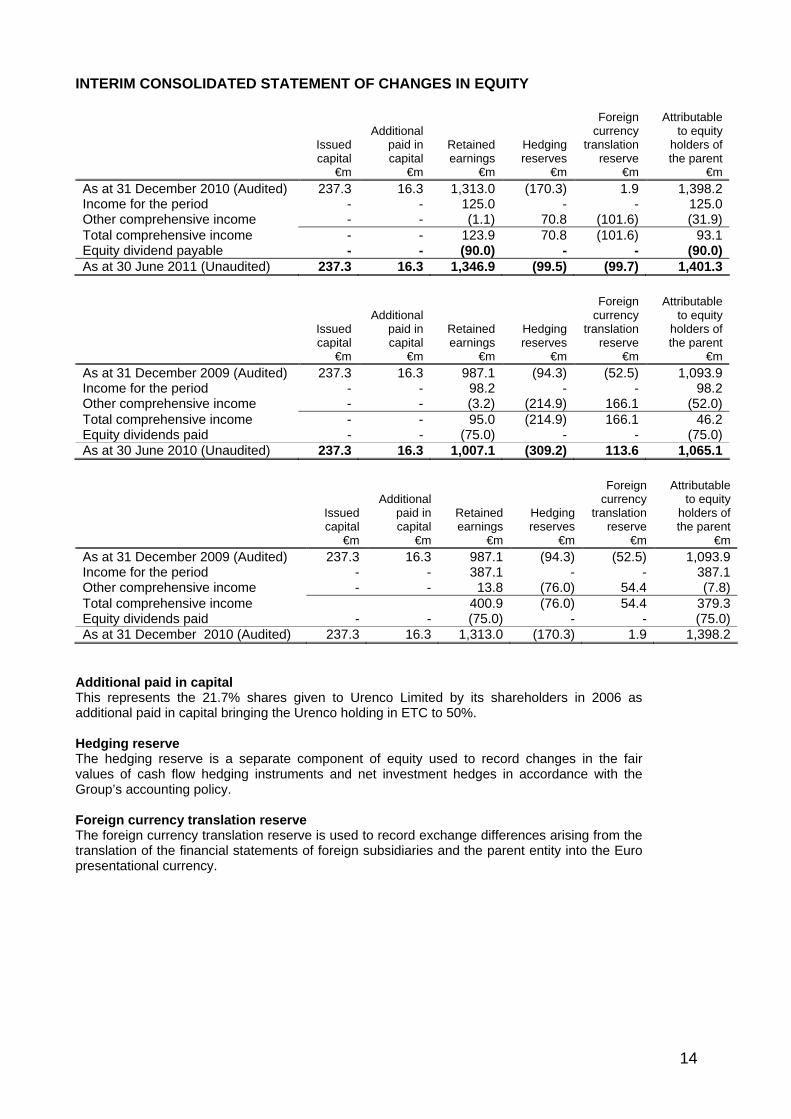
INTERIM CONSOLIDATED CASH FLOW STATEMENT
Six months ended
30 June
Six months ended
30 JuneYear ended
31 December
2011
2010
(restatedi)2010
(restatedi) Unaudited Unaudited Audited NOTE €m €m €mIncome before tax 164.3 116.4 521.7Adjustments to reconcile Group income before tax to net
cash inflows from operating activities:
Share of joint venture results 2.1 4.5 15.4Depreciation and amortisation 4 113.9 92.2 203.3Finance income 4 (40.9) (45.5) (63.6)Finance cost 4 66.8 96.2 132.4Loss on write off of property, plant and equipment - 0.1 0.6Increase/(decrease) in provisions 32.8 70.0 92.3 Operating cash flows before movements in working
capital
339.0 333.9 902.1(Increase) / decrease in inventories (40.9) (56.8) 18.0Decrease/(increase) in receivables (ii) 157.8 99.7 (86.5)(Decrease) / increase in payables (65.8) (20.0) 26.7Cash generated from operating activites 390.1 356.8 860.3Income taxes paid (74.4) (60.1) (142.2)Net cash flow from operating activities 315.7 296.7 718.1
Investing activities Interest received 16.3 15.1 34.7Proceeds from non designated derivatives - - 0.7Purchases of property, plant and equipment (333.8) (367.7) (676.6)Increase in prepayments in respect of fixed asset purchases (ii) (29.9) (35.3) (121.9)Purchase of intangible assets (0.2) - (25.0)Net cash flow from investing activities (347.6) (387.9) (788.1)
Financing activities Interest paid (61.9) (79.8) (119.6)Payments in respect of non designated derivatives (1.0) (12.0) (14.7)Dividends paid to equity holders - (75.0) (75.0)Proceeds from new borrowings 329.3 500.0 817.4Repayment of borrowings (173.6) (256.7) (539.2)Repayment of finance lease liabilities (0.2) (0.4) (0.7)Net cash flow from financing activities 92.6 76.1 68.2
Net (decrease)/increase in cash and cash equivalents 60.7 (15.1) (1.8)Cash and cash equivalents at beginning of period/year 38.2 38.4 38.4Effect of foreign exchange rate changes (2.3) 3.9 1.6Cash and cash equivalents at end of period/year 8 96.6 27.2 38.2
i The June 2010 and December 2010 results have been restated for a change in accounting policy IAS 31 Interests in Joint
Ventures, refer to note 2. ii This includes prepayments in respect of fixed asset purchases representing 50% of payments made to the ETC joint venture in
advance of deliveries of centrifuge cascades.
NOTES TO THE INTERIM CONDENSED CONSOLIDATED FINANCIAL STATEMENTS
16
1. CORPORATE INFORMATION Urenco Limited is a limited company incorporated in Great Britain and registered in England and Wales under the Companies Act 2006. The address of the registered office is given on page 4. Urenco Limited is the ultimate holding company of the Urenco Group. The nature of the Group’s operations and its principal activities are set out in note 4. The Interim Condensed Consolidated Financial Statements of the Group were authorised for issue by the Audit Committee on 25 August 2011, under an authority granted by the Board at its meeting on 29 June 2011. 2. BASIS OF PREPARATION AND ACCOUNTING POLICIES Basis of preparation The interim condensed consolidated financial statements for the six months ended 30 June 2011 have been prepared in accordance with IAS 34 Interim Financial Reporting. The interim condensed consolidated financial statements do not include all of the information and disclosures required in the annual financial statements, and should be read in conjunction with the Group’s 2010 Annual Report and Accounts. The financial information contained in this report is unaudited. The interim condensed consolidated income statement, the interim condensed consolidated statement of comprehensive income, the interim condensed statement of financial position, the statement of changes in equity and the interim condensed consolidated cash flow statement for the interim period to 30 June 2011 have been reviewed by the auditors. Their report to the shareholders of Urenco Limited is set out on page 10. The information for the year ended 31 December 2010 does not constitute statutory accounts within the meaning of Section 435 of the Companies Act 2006 and has been extracted from the statutory accounts for the year ended on that date, which have been filed with the Registrar of Companies. The report of the auditors on the statutory accounts for the year ended 31 December 2010 was unqualified and did not contain a statement under Section 498(2) or 498(3) of the Companies Act 2006.
NOTES TO THE INTERIM CONDENSED CONSOLIDATED FINANCIAL STATEMENTS
17
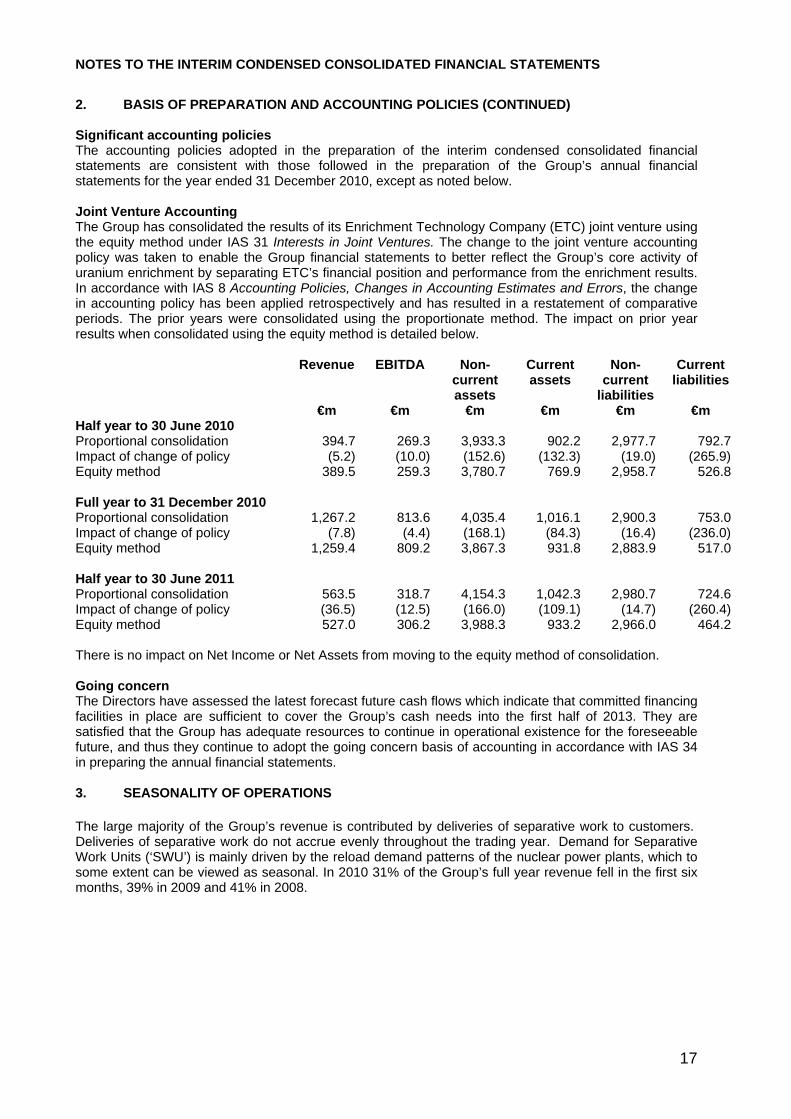
2. BASIS OF PREPARATION AND ACCOUNTING POLICIES (CONTINUED) Significant accounting policies The accounting policies adopted in the preparation of the interim condensed consolidated financial statements are consistent with those followed in the preparation of the Group’s annual financial statements for the year ended 31 December 2010, except as noted below. Joint Venture Accounting The Group has consolidated the results of its Enrichment Technology Company (ETC) joint venture using the equity method under IAS 31 Interests in Joint Ventures. The change to the joint venture accounting policy was taken to enable the Group financial statements to better reflect the Group’s core activity of uranium enrichment by separating ETC’s financial position and performance from the enrichment results. In accordance with IAS 8 Accounting Policies, Changes in Accounting Estimates and Errors, the change in accounting policy has been applied retrospectively and has resulted in a restatement of comparative periods. The prior years were consolidated using the proportionate method. The impact on prior year results when consolidated using the equity method is detailed below. Revenue EBITDA Non-
current assets
Current assets
Non-current
liabilities
Current liabilities
€m €m €m €m €m €m Half year to 30 June 2010 Proportional consolidation 394.7 269.3 3,933.3 902.2 2,977.7 792.7Impact of change of policy (5.2) (10.0) (152.6) (132.3) (19.0) (265.9)Equity method 389.5 259.3 3,780.7 769.9 2,958.7 526.8 Full year to 31 December 2010 Proportional consolidation 1,267.2 813.6 4,035.4 1,016.1 2,900.3 753.0Impact of change of policy (7.8) (4.4) (168.1) (84.3) (16.4) (236.0)Equity method 1,259.4 809.2 3,867.3 931.8 2,883.9 517.0 Half year to 30 June 2011 Proportional consolidation 563.5 318.7 4,154.3 1,042.3 2,980.7 724.6Impact of change of policy (36.5) (12.5) (166.0) (109.1) (14.7) (260.4)Equity method 527.0 306.2 3,988.3 933.2 2,966.0 464.2 There is no impact on Net Income or Net Assets from moving to the equity method of consolidation. Going concern The Directors have assessed the latest forecast future cash flows which indicate that committed financing facilities in place are sufficient to cover the Group’s cash needs into the first half of 2013. They are satisfied that the Group has adequate resources to continue in operational existence for the foreseeable future, and thus they continue to adopt the going concern basis of accounting in accordance with IAS 34 in preparing the annual financial statements. 3. SEASONALITY OF OPERATIONS The large majority of the Group’s revenue is contributed by deliveries of separative work to customers. Deliveries of separative work do not accrue evenly throughout the trading year. Demand for Separative Work Units (‘SWU’) is mainly driven by the reload demand patterns of the nuclear power plants, which to some extent can be viewed as seasonal. In 2010 31% of the Group’s full year revenue fell in the first six months, 39% in 2009 and 41% in 2008.
NOTES TO THE INTERIM CONDENSED CONSOLIDATED FINANCIAL STATEMENTS
18
4. SEGMENT INFORMATION Operating segments are reported in a manner consistent with the internal reporting provided to the chief decision makers. The chief decision maker has been identified as the Executive Directors. Operating segments have been identified based on the risk and returns of the Group’s major operations. The risks and returns of the Group’s operations are primarily determined by the nature of the different activities that the Group engages in, rather than by the geographical location of these operations. The Group’s operating segments are as follows: • for the enrichment business: the provision of enrichment and associated services for the nuclear power industry. URENCO’s US enrichment plant commenced commercial operations in June 2010 having received the necessary approvals from the US Nuclear Regulatory Commission. • for the greenfield site development business: the provision of construction and project services for the Tails Management Facility at the UK site. • for construction of centrifuges: being ETC; the research, development, manufacture and installation of plant and equipment for the provision of enrichment services. Segment performance is evaluated based on Net Income which is calculated on the same basis as income from operating activities in the consolidated financial statements. Finance costs and finance income are managed centrally and presented in the segment note accordingly. Transfer prices between operating segments are on an arm’s length basis in a manner similar to transactions with third parties.
NOTES TO THE INTERIM CONDENSED CONSOLIDATED FINANCIAL STATEMENTS
19
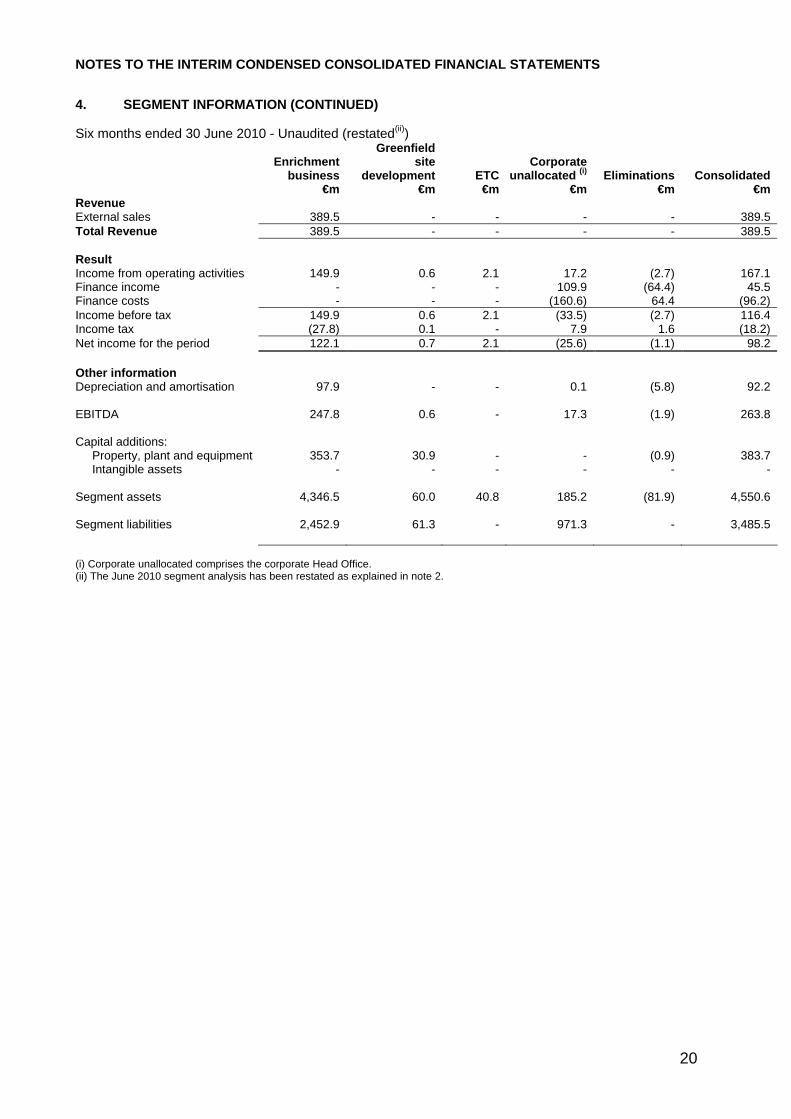
4. SEGMENT INFORMATION (CONTINUED) Segment information for the six months ended 30 June 2011 and 2010 retrospectively, and for the year ended 31 December 2010, is presented below: Six months ended 30 June 2011 - Unaudited
Enrichment business
Greenfield site
development
ETC Corporate
unallocated (i)
Eliminations
Consolidated €m €m €m €m €m €m Revenue External sales 527.0 - - - - 527.0 Total Revenue 527.0 - - - - 527.0 Result Income from operating activities 261.0 (3.8) 5.0 (70.9) (1.1) 190.2 Finance income - - - 110.0 (69.1) 40.9 Finance costs - - - (135.9) 69.1 (66.8) Income before tax 261.0 (3.8) 5.0 (96.8) (1.1) 164.3 Income tax (56.1) 0.8 - 11.8 4.2 (39.3) Net income for the period 204.9 (3.0) 5.0 (85.0) 3.1 125.0 Other information Depreciation and amortisation 117.2 - - 0.7 (4.0) 113.9 EBITDA 378.2 (3.8) - (70.3) 2.1 306.2 Capital additions:
Segment assets 4,346.5 60.0 40.8 185.2 (81.9) 4,550.6 Segment liabilities 2,452.9 61.3 - 971.3 - 3,485.5 (i) Corporate unallocated comprises the corporate Head Office. (ii) The June 2010 segment analysis has been restated as explained in note 2.
NOTES TO THE INTERIM CONDENSED CONSOLIDATED FINANCIAL STATEMENTS
21
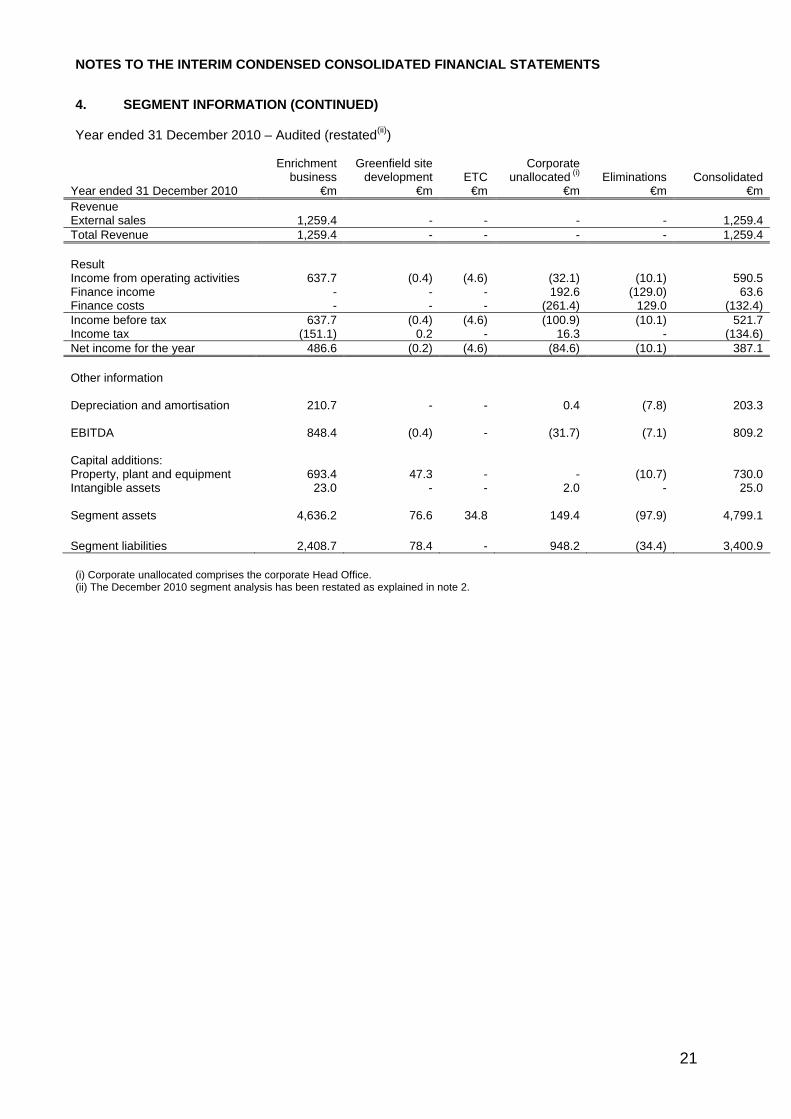
4. SEGMENT INFORMATION (CONTINUED) Year ended 31 December 2010 – Audited (restated(ii))
Year ended 31 December 2010
Enrichment business
€m
Greenfield site development
€m
ETC
€m
Corporate unallocated (i)
€m
Eliminations
€m Consolidated
€m Revenue External sales 1,259.4 - - - - 1,259.4 Total Revenue 1,259.4 - - - - 1,259.4 Result Income from operating activities 637.7 (0.4) (4.6) (32.1) (10.1) 590.5 Finance income - - - 192.6 (129.0) 63.6 Finance costs - - - (261.4) 129.0 (132.4) Income before tax 637.7 (0.4) (4.6) (100.9) (10.1) 521.7 Income tax (151.1) 0.2 - 16.3 - (134.6) Net income for the year 486.6 (0.2) (4.6) (84.6) (10.1) 387.1 Other information Depreciation and amortisation 210.7 - - 0.4 (7.8) 203.3 EBITDA 848.4 (0.4) - (31.7) (7.1) 809.2 Capital additions: Property, plant and equipment 693.4 47.3 - - (10.7) 730.0 Intangible assets 23.0 - - 2.0 - 25.0 Segment assets 4,636.2 76.6 34.8 149.4 (97.9) 4,799.1 Segment liabilities 2,408.7 78.4 - 948.2 (34.4) 3,400.9 (i) Corporate unallocated comprises the corporate Head Office. (ii) The December 2010 segment analysis has been restated as explained in note 2.
NOTES TO THE INTERIM CONDENSED CONSOLIDATED FINANCIAL STATEMENTS
22
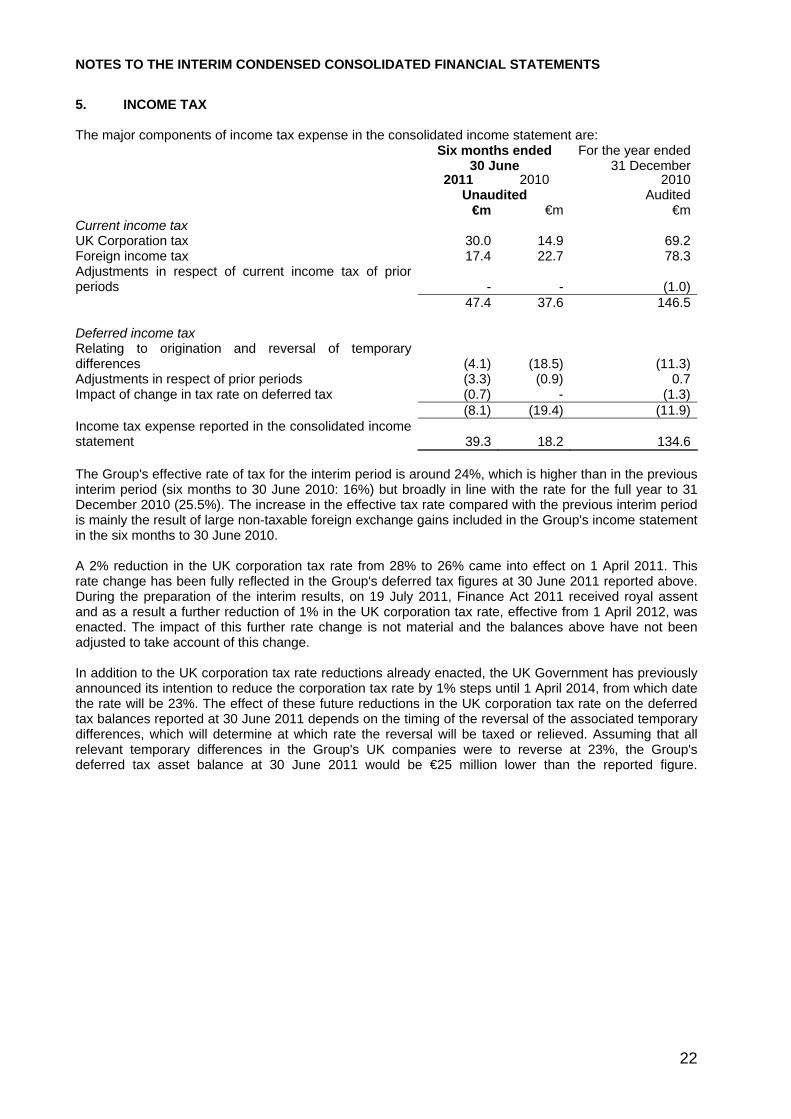
5. INCOME TAX The major components of income tax expense in the consolidated income statement are: Six months ended
30 JuneFor the year ended
31 December 2011 2010 2010 Unaudited Audited €m €m €mCurrent income tax UK Corporation tax 30.0 14.9 69.2Foreign income tax 17.4 22.7 78.3Adjustments in respect of current income tax of prior periods - - (1.0) 47.4 37.6 146.5 Deferred income tax Relating to origination and reversal of temporary differences (4.1) (18.5) (11.3)Adjustments in respect of prior periods (3.3) (0.9) 0.7Impact of change in tax rate on deferred tax (0.7) - (1.3) (8.1) (19.4) (11.9)Income tax expense reported in the consolidated income statement 39.3 18.2 134.6 The Group's effective rate of tax for the interim period is around 24%, which is higher than in the previous interim period (six months to 30 June 2010: 16%) but broadly in line with the rate for the full year to 31 December 2010 (25.5%). The increase in the effective tax rate compared with the previous interim period is mainly the result of large non-taxable foreign exchange gains included in the Group's income statement in the six months to 30 June 2010. A 2% reduction in the UK corporation tax rate from 28% to 26% came into effect on 1 April 2011. This rate change has been fully reflected in the Group's deferred tax figures at 30 June 2011 reported above. During the preparation of the interim results, on 19 July 2011, Finance Act 2011 received royal assent and as a result a further reduction of 1% in the UK corporation tax rate, effective from 1 April 2012, was enacted. The impact of this further rate change is not material and the balances above have not been adjusted to take account of this change. In addition to the UK corporation tax rate reductions already enacted, the UK Government has previously announced its intention to reduce the corporation tax rate by 1% steps until 1 April 2014, from which date the rate will be 23%. The effect of these future reductions in the UK corporation tax rate on the deferred tax balances reported at 30 June 2011 depends on the timing of the reversal of the associated temporary differences, which will determine at which rate the reversal will be taxed or relieved. Assuming that all relevant temporary differences in the Group's UK companies were to reverse at 23%, the Group's deferred tax asset balance at 30 June 2011 would be €25 million lower than the reported figure.
NOTES TO THE INTERIM CONDENSED CONSOLIDATED FINANCIAL STATEMENTS
23
6. DIVIDENDS PAID AND PROPOSED
Six months ended 30 June
For the year ended 31 December
2011 2010 2010 Unaudited Audited €m €m €mAmounts recognised as distributions to equity holders in the period:
Final dividend for the year ended 31 December 2010: 53.57 cents per share, due to be paid October 2011 90.0 - -Final dividend for the year ended 31 December 2009: 44.64 cents per share, paid April 2010 - 75.0 75.0 The final proposed dividend of €90.0 million for the year ended 31 December 2010 was approved by shareholders on 7 April 2011 and is due to be paid to shareholders in October 2011. There is no interim dividend proposed for the current period (six months to 30 June 2010: €nil). 7. PROPERTY, PLANT AND EQUIPMENT During the six months ended 30 June 2011, the Group acquired assets and capitalised costs with a value of €354.0 million (30 June 2010: €383.7 million; 31 December 2010: €730.0 million), relating to property, plant and equipment. The majority of this cost relates to assets for the enrichment plants. See also note 12 for capital commitments. 8. CASH AND CASH EQUIVALENTS For the purpose of the interim condensed consolidated cash flow statement, cash and cash equivalents are comprised of the following: At 30 June At 31 December 2011
2010
(restated) 2010
(restated) Unaudited Audited €m €m €mCash at bank and in hand 57.9 26.5 37.9Short term deposits 38.7 0.7 0.3 96.6 27.2 38.2 Cash at bank earns interest at floating rates based on money market deposits at call or for fixed periods. Cash and cash equivalents comprise cash held by the Group and short-term bank deposits with an original maturity of three months or less. The carrying amount of these assets approximates their fair value.
NOTES TO THE INTERIM CONDENSED CONSOLIDATED FINANCIAL STATEMENTS
24
9. OTHER FINANCIAL ASSETS AND FINANCIAL LIABILITIES Cash flow hedges As at 30 June 2011, the Group held 156 forward exchange contracts designated as cash flow hedges of expected future US Dollar sales to customers and 30 of expected EUR sales to customers throughout the world. The forward currency contracts are being used to hedge the foreign currency risk of the firm commitments. The terms of the forward currency contracts have been negotiated to match the terms of the commitments. The cash flow hedges of the expected future sales were assessed to be highly effective and as at 30 June 2011 a cumulative unrealised gain of €22.6 million is included in equity and a credit of €0.6 million taken to the income statement. A deferred tax credit of €20.6 million relating to the hedging instrument has been included in equity. Net changes in the fair value of non-designated derivatives recognised in the Income Statement was a profit of €6.5 million (2010: loss of €14.6 milllion), and included in finance income / expenses. Fair value hedges The Group uses interest rate swaps and cross currency interest rate swaps to manage its exposure to interest rate movements on its borrowings and also to effectively hedge its net investments in foreign subsidiaries. The interest rate swaps convert fixed rate debt into floating rate debt in the same currency and the cross currency interest rate swaps convert fixed rate debt in one currency into fixed and floating rate debt in another currency. The fair value of swaps entered into at 30 June 2011 is estimated at €54.0 million asset (combined currency and interest rate swaps) (2010: €56.4 million asset). These amounts are based on current market rates versus URENCO actual rates at the balance sheet date. Hedge of net investments in foreign operations Included in loans at 30 June 2011 were borrowings of $1.1 billion, which have been designated as a hedge of the net investments in the United States subsidiary, Urenco Investments Inc and Louisiana Energy Services, and are being used to hedge the Group’s exposure to foreign exchange risk on these investments. Also included in loans at 30 June 2011 were borrowings of €294.0 million, which have been designated as hedges of the net investment in the Group’s European subsidiaries, Urenco Nederland BV and Urenco Deutschland GmbH and are being used to hedge the Group’s exposure to foreign exchange risk on these investments. Gains or losses on the retranslation of these borrowings are transferred to equity to offset any gains or losses on translation of the net investment in the subsidiary. Borrowing and repayment of debt During the six months to 30 June 2011, the group raised additional long term financing to fund its capacity expansion by way of a long term loan from the European Investment Bank of $108.6 million with an amortising 17 year loan at a floating rate. In addition, the Company re-negotiated its €500 million bank facility maturing in 2012 and replaced it with a €650 million syndicated facility and €100 million bilateral loan maturing in 2016. As at 30 June 2011, the total current interest bearing loans and borrowings was €317.8 million (31 December 2010 €250.8 million), and the total non-current interest bearing loans and borrowings was €2,167.0 million (31 December 2010 €2,157.8 million).
NOTES TO THE INTERIM CONDENSED CONSOLIDATED FINANCIAL STATEMENTS
25
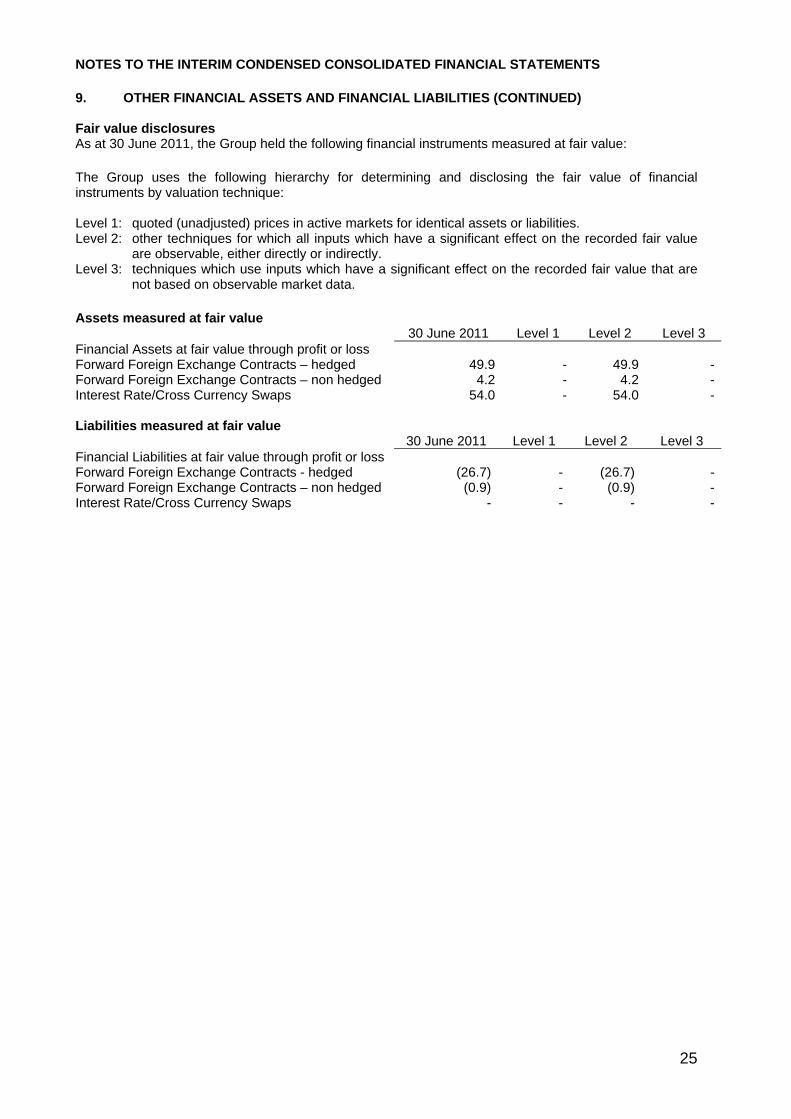
9. OTHER FINANCIAL ASSETS AND FINANCIAL LIABILITIES (CONTINUED) Fair value disclosures As at 30 June 2011, the Group held the following financial instruments measured at fair value: The Group uses the following hierarchy for determining and disclosing the fair value of financial instruments by valuation technique: Level 1: quoted (unadjusted) prices in active markets for identical assets or liabilities. Level 2: other techniques for which all inputs which have a significant effect on the recorded fair value
are observable, either directly or indirectly. Level 3: techniques which use inputs which have a significant effect on the recorded fair value that are
not based on observable market data. Assets measured at fair value 30 June 2011 Level 1 Level 2 Level 3 Financial Assets at fair value through profit or loss Forward Foreign Exchange Contracts – hedged 49.9 - 49.9 -Forward Foreign Exchange Contracts – non hedged 4.2 - 4.2 -Interest Rate/Cross Currency Swaps 54.0 - 54.0 - Liabilities measured at fair value 30 June 2011 Level 1 Level 2 Level 3 Financial Liabilities at fair value through profit or loss Forward Foreign Exchange Contracts - hedged (26.7) - (26.7) -Forward Foreign Exchange Contracts – non hedged (0.9) - (0.9) -Interest Rate/Cross Currency Swaps - - - -
NOTES TO THE INTERIM CONDENSED CONSOLIDATED FINANCIAL STATEMENTS
26
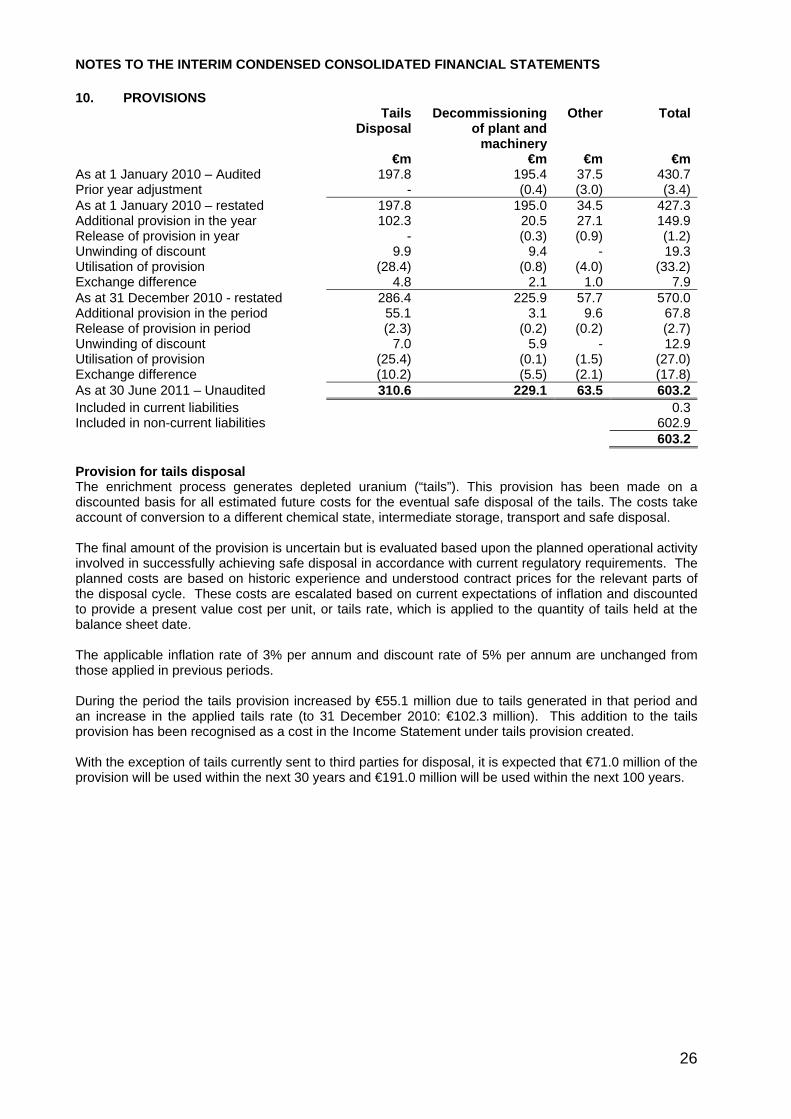
10. PROVISIONS Tails
DisposalDecommissioning
of plant and machinery
Other Total
€m €m €m €mAs at 1 January 2010 – Audited 197.8 195.4 37.5 430.7Prior year adjustment - (0.4) (3.0) (3.4)As at 1 January 2010 – restated 197.8 195.0 34.5 427.3Additional provision in the year 102.3 20.5 27.1 149.9Release of provision in year - (0.3) (0.9) (1.2)Unwinding of discount 9.9 9.4 - 19.3Utilisation of provision (28.4) (0.8) (4.0) (33.2)Exchange difference 4.8 2.1 1.0 7.9As at 31 December 2010 - restated 286.4 225.9 57.7 570.0Additional provision in the period 55.1 3.1 9.6 67.8Release of provision in period (2.3) (0.2) (0.2) (2.7)Unwinding of discount 7.0 5.9 - 12.9Utilisation of provision (25.4) (0.1) (1.5) (27.0)Exchange difference (10.2) (5.5) (2.1) (17.8)As at 30 June 2011 – Unaudited 310.6 229.1 63.5 603.2Included in current liabilities 0.3Included in non-current liabilities 602.9 603.2 Provision for tails disposal The enrichment process generates depleted uranium (“tails”). This provision has been made on a discounted basis for all estimated future costs for the eventual safe disposal of the tails. The costs take account of conversion to a different chemical state, intermediate storage, transport and safe disposal. The final amount of the provision is uncertain but is evaluated based upon the planned operational activity involved in successfully achieving safe disposal in accordance with current regulatory requirements. The planned costs are based on historic experience and understood contract prices for the relevant parts of the disposal cycle. These costs are escalated based on current expectations of inflation and discounted to provide a present value cost per unit, or tails rate, which is applied to the quantity of tails held at the balance sheet date. The applicable inflation rate of 3% per annum and discount rate of 5% per annum are unchanged from those applied in previous periods. During the period the tails provision increased by €55.1 million due to tails generated in that period and an increase in the applied tails rate (to 31 December 2010: €102.3 million). This addition to the tails provision has been recognised as a cost in the Income Statement under tails provision created. With the exception of tails currently sent to third parties for disposal, it is expected that €71.0 million of the provision will be used within the next 30 years and €191.0 million will be used within the next 100 years.
NOTES TO THE INTERIM CONDENSED CONSOLIDATED FINANCIAL STATEMENTS
27
10. PROVISIONS (CONTINUED) Provision for decommissioning of plant and machinery The Directors intend to decommission plant, including associated buildings, as soon as practically possible after it is shut down. Enrichment plant will be disassembled, decommissioned and the site returned to ‘greenfield’ status. To meet these eventual costs of decommissioning, provisions are charged in the accounts, for all plant in operation, at amounts considered to be adequate for the purpose. The final amount of the provision is uncertain but is evaluated based upon the planned operational activity involved in successfully achieving full decommissioning of any land, plant or equipment used in enrichment activities, in accordance with the Directors’ intention and current regulatory requirements. The planned costs are based on historic experience and price estimates for the relevant activities and processes of the decommissioning cycle, which include deconstruction, decontamination and disposal of all materials involved in the enrichment process. These costs are escalated based on current expectations of inflation and discounted to provide a present value cost based on the expected useful life of the asset in use. The applicable inflation rate of 3% per annum and discount rate of 5% per annum are unchanged from those applied in previous periods. During the period the decommissioning provision increased by €3.1 million due to the installation of additional plant and machinery (2010: €20.6 million). This addition to the decommissioning provision has been recognised as an equivalent addition to the decommissioning asset in the Balance Sheet. It is expected that this provision will be used over the next 30 years. Other provisions These comprise overfeeding provisions relating to our plants in the Netherlands and UK, personnel provisions (mainly relating to early retirement schemes in Germany) and provisions relating to the disposal and cleaning of containers. It is expected that other provisions will be used over the next seven years.
NOTES TO THE INTERIM CONDENSED CONSOLIDATED FINANCIAL STATEMENTS
28
11. RETIREMENT BENEFIT OBLIGATIONS The Group operates a number of pension schemes in the UK, Germany, The Netherlands and the USA. Some are defined benefit schemes (four in total); others are defined contribution schemes and are funded externally. The defined benefit schemes comprise both funded and unfunded schemes. There was a €2.2 million decrease in the overall Group pension liability during the six month period ended 30 June 2011 (30 June 2010: €7.6 million increase; 31 December 2010: €11.1 million decrease). This decrease was due to the impact of changes in exchange rates. 12. COMMITMENTS AND CONTINGENCIES Contingent Liabilities No contingent liabilities have been identified as at 30 June 2011.
Capital commitments At 30 June 2011 the Group had capital commitments of €340.7 million (30 June 2010: €605.6 million; 31 December 2010: €510.7 million) relating to property, plant and equipment. These capital commitments are for the acquisition of new machinery and the construction of new enrichment facilities. 13. EVENTS AFTER THE BALANCE SHEET DATE As of 25 August 2011, no other material structural changes or business events have occurred that might serve to alter any of the disclosures contained in the interim condensed consolidated financial statements.
NOTES TO THE INTERIM CONDENSED CONSOLIDATED FINANCIAL STATEMENTS
29
14. RELATED PARTY TRANSACTIONS The following table provides the total amount of transactions which have been entered into with related parties during the six months ended 30 June 2011 and 30 June 2010 (both Unaudited) and the balances with related parties at 30 June 2011 (Unaudited) and at 31 December 2010 (Audited):
(i) These amounts are 100% of the amounts due from/to the Enrichment Technology Company Limited. The Department for Energy and Climate Change (DECC), E.ON Kernkraft GmbH and RWE Power AG are all related parties of the Group because of their indirect shareholdings in URENCO Limited. Enrichment Investments Limited (formerly BNFL Enrichment Limited) is held by DECC through a company called Enrichment Holdings Limited. Enrichment Technology Company Limited is a related party due to the Group’s 50% shareholding in the joint venture. Sales of goods and services to related parties and purchases of goods and services from them were made under the Group’s normal trading terms. The amounts outstanding are unsecured and will be settled in cash. No guarantees have been given or received. No provisions have been made and no expense incurred for doubtful debts in respect of the amounts owed by related parties. The URENCO Group funds 50% of the Enrichment Technology Company Limited. Interest is charged at market rates. The Enrichment Technology Company Limited pension scheme is administered as part of the URENCO pension scheme. Included in URENCO’s Share of results of joint venture and Investments is 50% of the Enrichment Technology Company Limited Income Statement charges and liabilities arising from retirement benefit obligations. Included in the amounts recognised in income in respect of the defined benefit schemes is a charge of €2.3 million relating to the Joint Venture (2010: €2.5 million). Included in the share of net assets of the joint venture is a recognised liability is €11.6 million relating to the Joint Venture (31 December 2010: €11.8 million). Remuneration of key management personnel The remuneration of the Directors, who are the key management personnel of the Group, is set out below in aggregate for each of the categories specified in IAS 24 Related Party Disclosures. Six months ended
30 June Year ended
31 December 2011 2010 2010 Unaudited Audited €m €m €m Short-term employee benefits 0.8 1.0 2.2 Post-employment benefits 0.2 0.1 0.2 1.0 1.1 2.4 Directors’ transactions No Director has ever had a loan from the Company or any other transaction with the Company other than remuneration for his services as a Director, covered above.
Sales of Goods & Services
Purchases of Goods & Services
Amounts Owed by Related Parties
Amounts Owed to Related Parties
Period ended Period ended Period ended Period ended
DEFINITIONS Revenue – Revenue from sale of goods and services Net Income – Income for the period/year attributable to equity holders of the parent. EBITDA – Earnings before interest (including other finance costs), taxation, depreciation and amortisation (or income from operating activities plus depreciation and amortisation, plus joint venture results). Order Book – Contracted and agreed business. Separative Work Unit (‘SWU’) – The standard measure of the effort required to increase the concentration of the fissionable U235 isotope. Net Debt – Loans and borrowings (current and non-current) plus obligations under finance leases less cash and cash equivalents. Net Finance Costs – Finance costs less finance income net of capitalised borrowing cost and including cost/income of non designated.