Page 1
Deutsche Bank Markets Research
North America
United States
Synthetic Equity & Index Strategy
US ETF Weekly Research
Date
27 April 2015
US ETP assets rose by $35.5bn during last week
Data in this report is as of Friday, April 24th
________________________________________________________________________________________________________________
Deutsche Bank Securities Inc.
Deutsche Bank does and seeks to do business with companies covered in its research reports. Thus, investors should be aware that the firm may have a conflict of interest that could affect the objectivity of this report. Investors should consider this report as only a single factor in making their investment decision. DISCLOSURES AND ANALYST CERTIFICATIONS ARE LOCATED IN APPENDIX 1.MCI (P) 148/04/2014.
Author
Sebastian Mercado
Strategist
(+1) 212 250-8690
[email protected]
Contacts
Shan Lan
Strategist
(+852) 22036716
[email protected]
Ari Rajendra
Strategist
(+44) 20 754-52282
[email protected]
Related recent research Date
TAARSS says prefer a mix of Bonds and Equities in Q2
05 Apr 2015
ETF Assets to Pass $3 trillion Milestone in 2015
26 Jan 2015
House View Portfolio: 2015 Annual Rebalance
15 Jan 2015
Source: Deutsche Bank
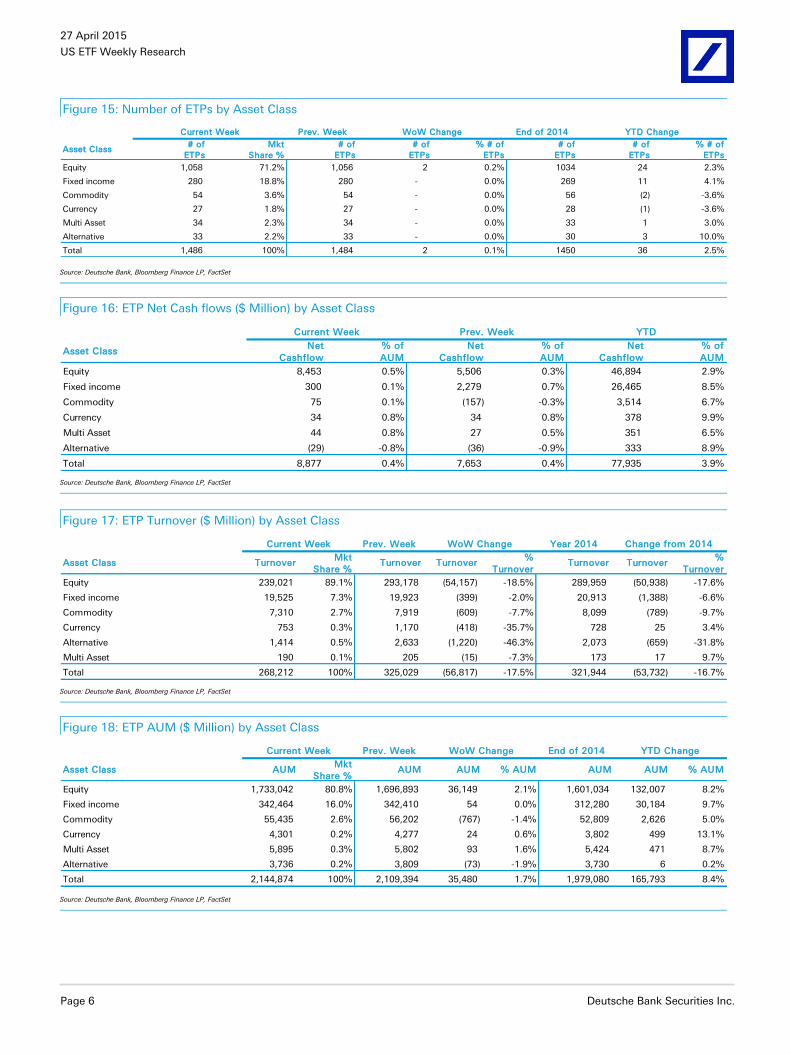
Market and Net Cash Flows Review The US (S&P 500) edged higher by 0.60%; while, outside the US, the MSCI EAFE (in USD) and the MSCI EM (USD) rose by 1.17% and 0.84%, respectively. In the meantime, performance was mixed across US sectors. The Technology (+2.57%) and the Utilities (+2.03%) sectors recorded the largest increases; meanwhile, Financials (-0.84%) and Consumer Staples (-0.84%) were the worst performing sectors. The DB Liquid Commodity Index rose by 0.03%; in the meantime, the Agriculture sector (DB Diversified Agriculture Index), Gold, and Silver prices fell by 0.24%, 1.60%, and 3.40%, respectively; while, the WTI Crude Oil rose by 0.78%. Moving into other asset classes, the 10Y US Treasury Yield increased 6bps ending at 1.93%. Last but not least, Volatility (VIX) dropped by 2.46% during the same period. The total US ETP flows from all products registered $8.9bn (+0.4% of AUM) of inflows during last week vs. $7.6bn (+0.4%) of inflows the previous week, setting the YTD weekly flows average at +$4.6bn (+$77.9bn YTD in total cash flows). Equity, Fixed Income, and Commodity ETPs experienced flows of +$8.5bn (+0.5%), +$0.3bn (+0.1%), and +$0.1bn (+0.1%) last week vs. +$5.5bn (+0.3%), +$2.3bn (+0.7%), and -$0.2bn (-0.3%) in the previous week, respectively. Among US sectors, Consumer Discretionary (+$0.2bn, +1.1%) and Healthcare (+$0.2bn, +0.3%) received the top inflows, while Financials (-$0.5bn, -0.7%) and Materials (-$0.3bn, -2.9%) experienced the largest outflows. Top 3 ETPs & ETNs by inflows: SPY (+$1.9bn), VTI (+$1.9bn), DBEF (+$1.2bn) Top 3 ETPs & ETNs by outflows: HYG (-$0.4bn), IYR (-$0.3bn), XLV (-$0.3bn)
New Launch Calendar: Small Cap US, Pakistan There were two new ETFs listed during the last week. One of them offers exposure to Small Cap US companies, and the other one to the broad Pakistan equity market.
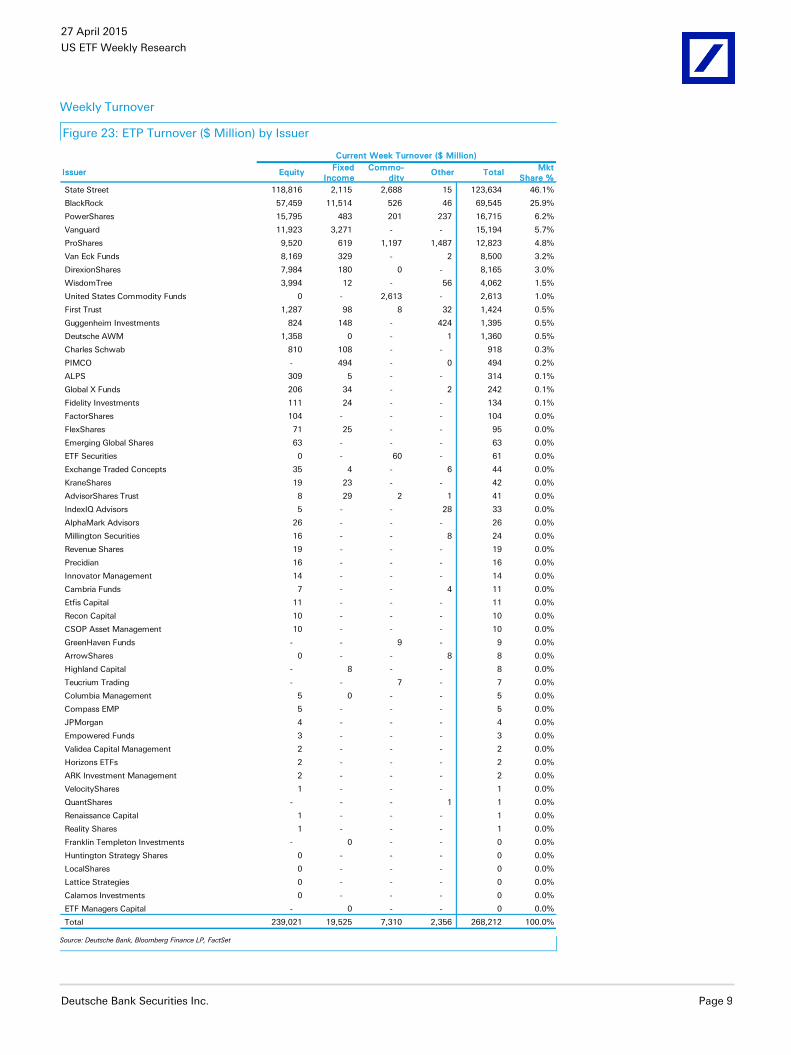
Turnover Review: Floor activity decreased by 17.5% Total weekly turnover decreased by 17.5% to $268.2bn vs. $325.0bn from the previous week. Furthermore, last week's turnover level was 16.7% below last year's weekly average. Equity, Fixed Income, and Commodity ETPs turnover decreased by $54.2bn (-18.5%), $0.4bn (-2.0%), and $0.6bn (-7.7%) during the same period, respectively.
Asset under Management (AUM) Review: Assets increased by $35.5bn US ETP assets rose by $35.5bn (+1.7%) totaling $2.145 trillion at the end of the week. As of last Friday, US ETPs had accumulated an asset growth of +8.4% YTD. Assets for Equity, Fixed Income, and Commodity ETPs moved +$36.1bn, +$0.1bn, and -$0.8bn during last week, respectively.
Page 2
27 April 2015
US ETF Weekly Research
Page 2 Deutsche Bank Securities Inc.
Table Of Contents
Flows in Focus ..................................................................... 3
ETP – Market Overview ....................................................... 5 Current Week ..................................................................................................... 5 New Products ..................................................................................................... 7 ETN Data Snapshot ............................................................................................ 7 Issuer Rankings .................................................................................................. 8
ETP – Net Cash Flows ....................................................... 11 Investment Focus ............................................................................................. 11 Sub Segment .................................................................................................... 12 Issuer ................................................................................................................ 15 Index Provider (Top 10 Abs. CF) ....................................................................... 16 Underlying Index/Security................................................................................. 17 Top ETPs ........................................................................................................... 18
ETP – Weekly Turnover ..................................................... 19 Investment Focus ............................................................................................. 19 Sub Segment .................................................................................................... 20 Issuer ................................................................................................................ 23 Index Provider ................................................................................................... 24 Underlying Index/Security................................................................................. 24 Top ETPs ........................................................................................................... 25
ETP – Assets Under Management ..................................... 26 Investment Focus ............................................................................................. 26 Sub Segment .................................................................................................... 27 Issuer ................................................................................................................ 30 Index Provider ................................................................................................... 31 Underlying Index/Security................................................................................. 31 Top ETPs ........................................................................................................... 32
Appendix A: How we define ETPs ..................................... 33
Page 3
27 April 2015
US ETF Weekly Research
Deutsche Bank Securities Inc. Page 3
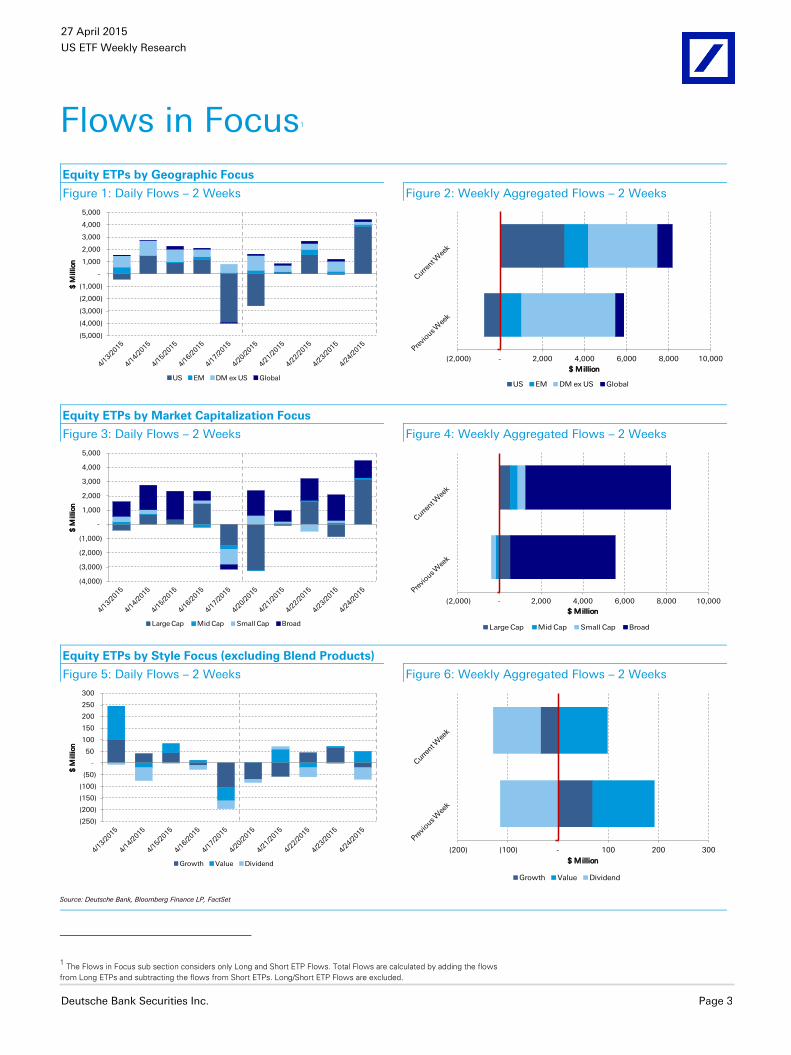
Flows in Focus1
Equity ETPs by Geographic Focus
Figure 1: Daily Flows – 2 Weeks Figure 2: Weekly Aggregated Flows – 2 Weeks
(5,000)
(4,000)
(3,000)
(2,000)
(1,000)
-
1,000
2,000
3,000
4,000
5,000
$ M
illion
US EM DM ex US Global
(2,000) - 2,000 4,000 6,000 8,000 10,000
$ Million
US EM DM ex US Global
Equity ETPs by Market Capitalization Focus
Figure 3: Daily Flows – 2 Weeks Figure 4: Weekly Aggregated Flows – 2 Weeks
(4,000)
(3,000)
(2,000)
(1,000)
-
1,000
2,000
3,000
4,000
5,000
$ M
illion
Large Cap Mid Cap Small Cap Broad
(2,000) - 2,000 4,000 6,000 8,000 10,000
$ Million
Large Cap Mid Cap Small Cap Broad
Equity ETPs by Style Focus (excluding Blend Products)
Figure 5: Daily Flows – 2 Weeks Figure 6: Weekly Aggregated Flows – 2 Weeks
(250)
(200)
(150)
(100)
(50)
-
50
100
150
200
250
300
$ M
illion
Growth Value Dividend
(200) (100) - 100 200 300
$ Million
Growth Value Dividend
Source: Deutsche Bank, Bloomberg Finance LP, FactSet
1 The Flows in Focus sub section considers only Long and Short ETP Flows. Total Flows are calculated by adding the flows
from Long ETPs and subtracting the flows from Short ETPs. Long/Short ETP Flows are excluded.
Page 4
27 April 2015
US ETF Weekly Research
Page 4 Deutsche Bank Securities Inc.
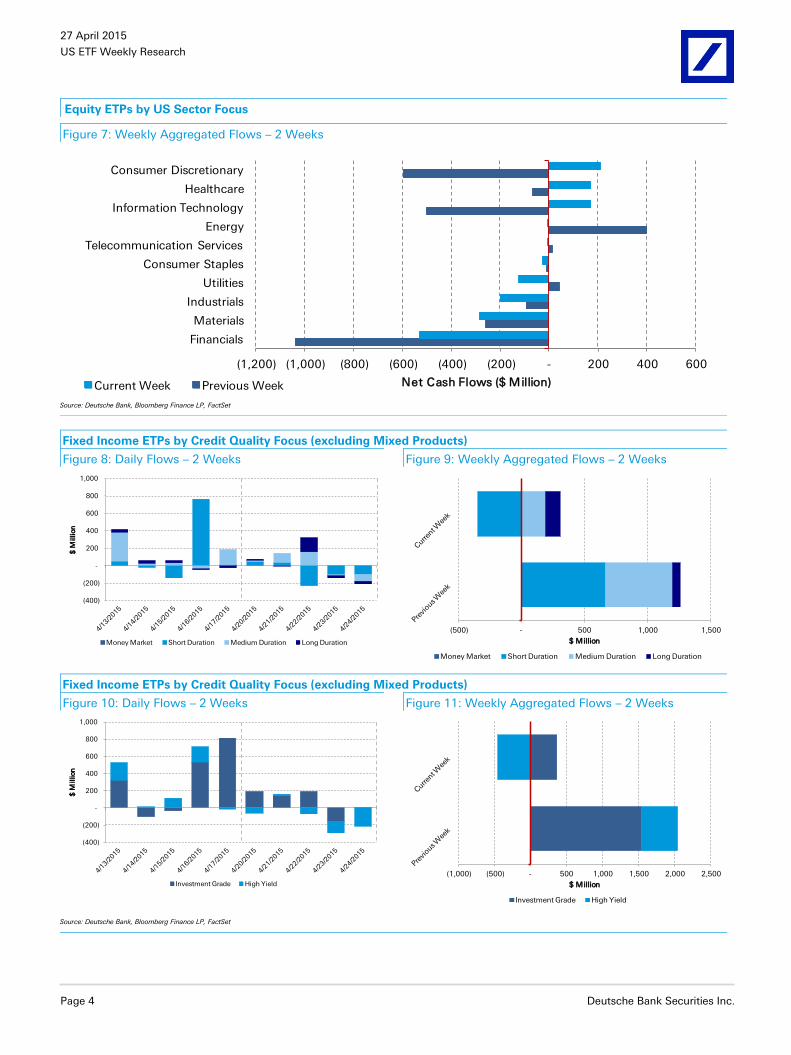
.Equity ETPs by US Sector Focus
Figure 7: Weekly Aggregated Flows – 2 Weeks
(1,200) (1,000) (800) (600) (400) (200) - 200 400 600
Financials
Materials
Industrials
Utilities
Consumer Staples
Telecommunication Services
Energy
Information Technology
Healthcare
Consumer Discretionary
Net Cash Flows ($ Million)Current Week Previous Week
Source: Deutsche Bank, Bloomberg Finance LP, FactSet
Fixed Income ETPs by Credit Quality Focus (excluding Mixed Products)
Figure 8: Daily Flows – 2 Weeks Figure 9: Weekly Aggregated Flows – 2 Weeks
(400)
(200)
-
200
400
600
800
1,000
$ M
illion
Money Market Short Duration Medium Duration Long Duration
(500) - 500 1,000 1,500
$ Million
Money Market Short Duration Medium Duration Long Duration
Fixed Income ETPs by Credit Quality Focus (excluding Mixed Products)
Figure 10: Daily Flows – 2 Weeks Figure 11: Weekly Aggregated Flows – 2 Weeks
(400)
(200)
-
200
400
600
800
1,000
$ M
illion
Investment Grade High Yield
(1,000) (500) - 500 1,000 1,500 2,000 2,500
$ Million
Investment Grade High Yield
Source: Deutsche Bank, Bloomberg Finance LP, FactSet
Page 5
27 April 2015
US ETF Weekly Research
Deutsche Bank Securities Inc. Page 5
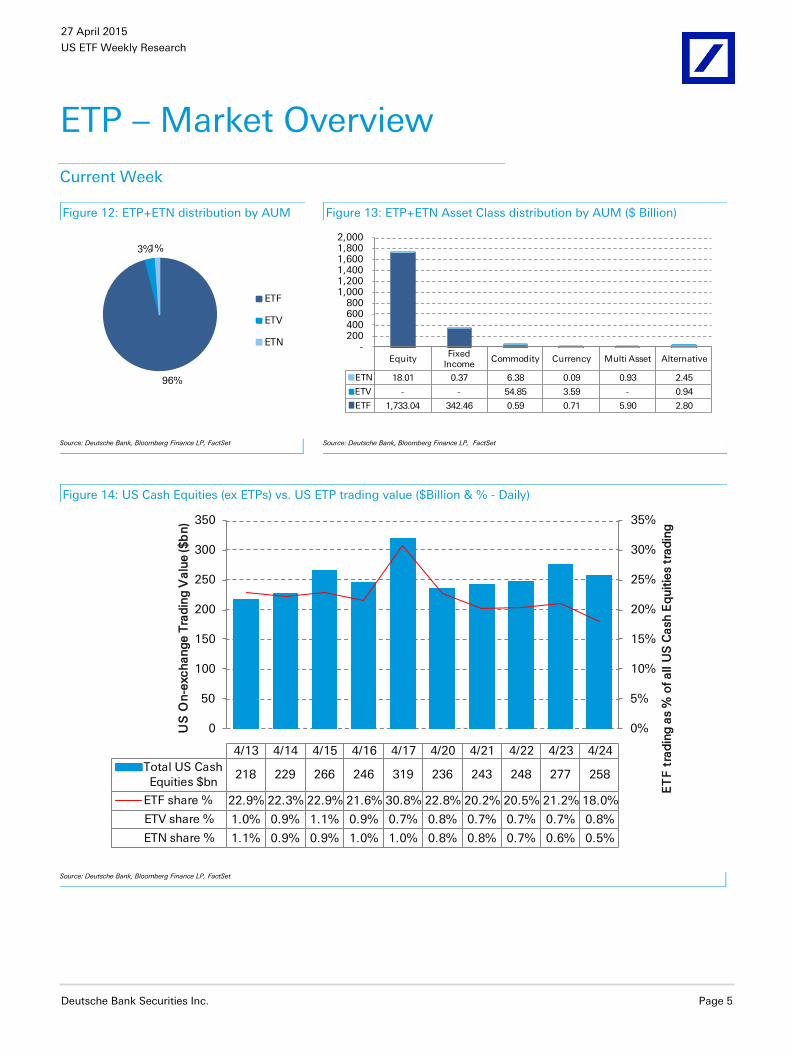
ETP – Market Overview
Current Week
Figure 12: ETP+ETN distribution by AUM Figure 13: ETP+ETN Asset Class distribution by AUM ($ Billion)
96%
3%1%
ETF
ETV
ETN
EquityFixed
IncomeCommodity Currency Multi Asset Alternative
ETN 18.01 0.37 6.38 0.09 0.93 2.45
ETV - - 54.85 3.59 - 0.94
ETF 1,733.04 342.46 0.59 0.71 5.90 2.80
-200 400 600 800
1,000 1,200 1,400 1,600 1,800 2,000
Source: Deutsche Bank, Bloomberg Finance LP, FactSet
Source: Deutsche Bank, Bloomberg Finance LP, FactSet
Figure 14: US Cash Equities (ex ETPs) vs. US ETP trading value ($Billion & % - Daily)
0%
5%
10%
15%
20%
25%
30%
35%
0
50
100
150
200
250
300
350
ET
F t
rad
ing
as
% o
f a
ll U
S C
ash
Eq
uit
ies
tra
din
g
US
On
-exc
ha
ng
e T
rad
ing
Va
lue (
$b
n)
4/13 4/14 4/15 4/16 4/17 4/20 4/21 4/22 4/23 4/24
Total US Cash Equities $bn
218 229 266 246 319 236 243 248 277 258
ETF share % 22.9% 22.3% 22.9% 21.6% 30.8% 22.8% 20.2% 20.5% 21.2% 18.0%
ETV share % 1.0% 0.9% 1.1% 0.9% 0.7% 0.8% 0.7% 0.7% 0.7% 0.8%
ETN share % 1.1% 0.9% 0.9% 1.0% 1.0% 0.8% 0.8% 0.7% 0.6% 0.5%
Source: Deutsche Bank, Bloomberg Finance LP, FactSet
Page 6
27 April 2015
US ETF Weekly Research
Page 6 Deutsche Bank Securities Inc.
Figure 15: Number of ETPs by Asset Class
Prev. Week End of 2014
Asset Class# of
ETPs
Mkt
Share %
# of
ETPs
# of
ETPs
% # of
ETPs
# of
ETPs
# of
ETPs
% # of
ETPs
Equity 1,058 71.2% 1,056 2 0.2% 1034 24 2.3%
Fixed income 280 18.8% 280 - 0.0% 269 11 4.1%
Commodity 54 3.6% 54 - 0.0% 56 (2) -3.6%
Currency 27 1.8% 27 - 0.0% 28 (1) -3.6%
Multi Asset 34 2.3% 34 - 0.0% 33 1 3.0%
Alternative 33 2.2% 33 - 0.0% 30 3 10.0%
Total 1,486 100% 1,484 2 0.1% 1450 36 2.5%
Current Week WoW Change YTD Change
Source: Deutsche Bank, Bloomberg Finance LP, FactSet
Figure 16: ETP Net Cash flows ($ Million) by Asset Class
Asset Class Net
Cashflow
% of
AUM
Net
Cashflow
% of
AUM
Net
Cashflow
% of
AUM
Equity 8,453 0.5% 5,506 0.3% 46,894 2.9%
Fixed income 300 0.1% 2,279 0.7% 26,465 8.5%
Commodity 75 0.1% (157) -0.3% 3,514 6.7%
Currency 34 0.8% 34 0.8% 378 9.9%
Multi Asset 44 0.8% 27 0.5% 351 6.5%
Alternative (29) -0.8% (36) -0.9% 333 8.9%
Total 8,877 0.4% 7,653 0.4% 77,935 3.9%
Current Week Prev. Week YTD
Source: Deutsche Bank, Bloomberg Finance LP, FactSet
Figure 17: ETP Turnover ($ Million) by Asset Class
Prev. Week Year 2014
Asset Class TurnoverMkt
Share %Turnover Turnover
%
Turnover Turnover Turnover
%
Turnover
Equity 239,021 89.1% 293,178 (54,157) -18.5% 289,959 (50,938) -17.6%
Fixed income 19,525 7.3% 19,923 (399) -2.0% 20,913 (1,388) -6.6%
Commodity 7,310 2.7% 7,919 (609) -7.7% 8,099 (789) -9.7%
Currency 753 0.3% 1,170 (418) -35.7% 728 25 3.4%
Alternative 1,414 0.5% 2,633 (1,220) -46.3% 2,073 (659) -31.8%
Multi Asset 190 0.1% 205 (15) -7.3% 173 17 9.7%
Total 268,212 100% 325,029 (56,817) -17.5% 321,944 (53,732) -16.7%
Current Week WoW Change Change from 2014
Source: Deutsche Bank, Bloomberg Finance LP, FactSet
Figure 18: ETP AUM ($ Million) by Asset Class
Prev. Week End of 2014
Asset Class AUMMkt
Share % AUM AUM % AUM AUM AUM % AUM
Equity 1,733,042 80.8% 1,696,893 36,149 2.1% 1,601,034 132,007 8.2%
Fixed income 342,464 16.0% 342,410 54 0.0% 312,280 30,184 9.7%
Commodity 55,435 2.6% 56,202 (767) -1.4% 52,809 2,626 5.0%
Currency 4,301 0.2% 4,277 24 0.6% 3,802 499 13.1%
Multi Asset 5,895 0.3% 5,802 93 1.6% 5,424 471 8.7%
Alternative 3,736 0.2% 3,809 (73) -1.9% 3,730 6 0.2%
Total 2,144,874 100% 2,109,394 35,480 1.7% 1,979,080 165,793 8.4%
YTD ChangeCurrent Week WoW Change
Source: Deutsche Bank, Bloomberg Finance LP, FactSet
Page 7
27 April 2015
US ETF Weekly Research
Deutsche Bank Securities Inc. Page 7
New Products
Figure 19: New Listings
ETP Name IssuerAsset Class
& StructureExchange TER
Bloom-
berg
Reuters
Code
Alphamark Actively Managed Small Cap ETF AlphaMark Advisors Equity ETF Nasdaq 0.90% SMCP US SMCP.O
Global X MSCI Pakistan ETF Global X Funds Equity ETF NYSE Arca 0.88% PAK US PAK.K
Source: Deutsche Bank, Bloomberg Finance LP, FactSet
ETN Data Snapshot
Figure 20: ETN Summary by Asset Class
Asset ClassCurrent
Week
End of
2014%Chg
Current
Week
Prev.
WeekYTD
Current
Week
Prev.
Week%Chg
Current
Week
End of
2014%Chg AUM
Cash
Flow*Turnover Products
Equity 18,014 16,990 6.0% 32 1 751 370 418 -11.6% 56 53 5.7% 64% 4% 4% 27%
Fixed income 374 448 -16.6% (1) (0) (47) 11 13 -20.1% 19 23 -17.4% 1% -11% 0% 9%
Commodity 6,377 5,409 17.9% 86 (111) 1,204 3,082 3,328 -7.4% 96 96 0.0% 23% 22% 36% 46%
Currency 94 119 -21.1% 0 (1) (29) 5 7 -23.7% 11 13 -15.4% 0% -25% 0% 5%
Multi Asset 932 1,040 -10.3% 4 (4) (95) 41 27 50.7% 6 7 -14.3% 3% -9% 0% 3%
Alternative 2,449 2,803 -12.6% (118) (137) 204 5,100 8,733 -41.6% 19 19 0.0% 9% 7% 59% 9%
Total 28,239 26,808 5.3% 3 (252) 1,987 8,609 12,527 -31.3% 207 211 -1.9% 100% 7% 100% 100%
AUM ($ MM) Cash Flow ($ MM) Turnover ($ MM) Products Market Share %
Source: Deutsche Bank, Bloomberg Finance LP, FactSet *Cash Flow Market Share corresponds to YTD Cash Flow / End of 2014 AUM
Figure 21: ETN Summary by Issuer
IssuerCurrent
Week
End of
2014%Chg
Current
Week
Prev.
WeekYTD
Current
Week
Prev.
Week%Chg
Current
Week
End of
2014%Chg AUM
Cash
Flow*Turnover Products
Barclays Bank 9,430 8,971 5.1% 7 (63) 735 3,304 5,687 -41.9% 81 81 0.0% 33% 8% 38% 39%
UBS 5,849 5,188 12.8% 13 10 647 179 140 27.8% 37 34 8.8% 21% 12% 2% 18%
JPMorgan 5,551 5,694 -2.5% - - - 175 225 -22.3% 1 1 0.0% 20% 0% 2% 0%
Credit Suisse 4,329 3,961 9.3% (24) (224) 524 4,809 6,303 -23.7% 27 27 0.0% 15% 13% 56% 13%
Deutsche Bank 852 881 -3.3% 6 (0) (35) 104 122 -15.0% 29 35 -17.1% 3% -4% 1% 14%
RBS 831 747 11.3% - - 59 9 12 -24.8% 13 13 0.0% 3% 8% 0% 6%
Swedish Export CC 726 765 -5.1% 1 - (10) 15 18 -16.8% 7 7 0.0% 3% -1% 0% 3%
Citigroup 263 186 41.5% - 25 76 2 1 66.9% 3 3 0.0% 1% 41% 0% 1%
Goldman Sachs 157 158 -1.0% - - - 4 5 -19.1% 1 1 0.0% 1% 0% 0% 0%
Morgan Stanley 103 111 -6.9% - - (8) 1 1 26.5% 1 2 -50.0% 0% -7% 0% 0%
Van Eck Funds 80 79 0.1% - - (1) 5 5 -9.7% 4 4 0.0% 0% -1% 0% 2%
HSBC USA Inc 30 30 1.2% - - - 0 0 122.9% 1 1 0.0% 0% 0% 0% 0%
RBC GAM 28 28 1.7% - - 0 1 7 -83.1% 1 1 0.0% 0% 1% 0% 0%
Guggenheim 9 9 -0.2% - - - 0 0 -26.7% 1 1 0.0% 0% 0% 0% 0%
Total 28,239 26,808 5.3% 3 (252) 1,987 8,609 12,527 -31.3% 207 211 -1.9% 100% 7% 100% 100%
AUM ($ MM) Cash Flow ($ MM) Turnover ($ MM) Products Market Share %
Source: Deutsche Bank, Bloomberg Finance LP, FactSet *Cash Flow Market Share corresponds to YTD Cash Flow / End of 2014 AUM
Page 8
27 April 2015
US ETF Weekly Research
Page 8 Deutsche Bank Securities Inc.
Issuer Rankings
Figure 22: ETP Net Cash flows ($ Million) ranking by Issuer
Issuer EquityFixed
Income
Commo-
dity Other Total
Vanguard 2,979 (30) - - 2,949
BlackRock 2,448 170 82 7 2,707
Deutsche AWM 1,244 (4) - - 1,240
First Trust 625 14 - 20 659
State Street 599 (69) 126 0 656
Charles Schwab 301 35 - - 336
WisdomTree 256 - - 9 265
Guggenheim Investments 44 2 - 65 111
FactorShares 49 - - - 49
Global X Funds 26 9 - - 34
PIMCO - 31 - - 31
ALPS 27 3 - - 29
AlphaMark Advisors 25 - - - 25
DirexionShares 15 10 - - 24
AdvisorShares Trust 7 7 1 - 16
Fidelity Investments 15 - - - 15
Van Eck Funds (10) 21 - 1 13
KraneShares 3 9 - - 12
Millington Securities 4 - - 5 9
Recon Capital 8 - - - 8
Exchange Traded Concepts 5 - - 3 8
Innovator Management 8 - - - 8
Compass EMP 6 - - - 6
ArrowShares - - - 6 6
JPMorgan 5 - - - 5
Emerging Global Shares 3 - - - 3
Cambria Funds - - - 3 3
ARK Investment Management 2 - - - 2
Empowered Funds 1 - - - 1
Reality Shares 1 - - - 1
Etfis Capital 1 - - - 1
Teucrium Trading - - 0 - 0
Columbia Management - - - - -
Precidian - - - - -
QuantShares - - - - -
Huntington Strategy Shares - - - - -
Highland Capital - - - - -
Horizons ETFs - - - - -
VelocityShares - - - - -
LocalShares - - - - -
Renaissance Capital - - - - -
Franklin Templeton Investments - - - - -
Calamos Investments - - - - -
Validea Capital Management - - - - -
ETF Managers Capital - - - - -
Lattice Strategies - - - - -
Revenue Shares (3) - - - (3)
IndexIQ Advisors - - - (3) (3)
GreenHaven Funds - - (5) - (5)
CSOP Asset Management (8) - - - (8)
FlexShares (10) 1 - - (8)
ETF Securities - - (14) - (14)
PowerShares (46) 24 37 (33) (18)
United States Commodity Funds (0) - (110) - (110)
ProShares (177) 68 (43) (34) (186)
Total 8,453 300 75 49 8,877
Current Week Net Cashflows ($ Million)
Source: Deutsche Bank, Bloomberg Finance LP, FactSet
Page 9
27 April 2015
US ETF Weekly Research
Deutsche Bank Securities Inc. Page 9
Weekly Turnover
Figure 23: ETP Turnover ($ Million) by Issuer
Issuer EquityFixed
Income
Commo-
dity Other Total
Mkt
Share %
State Street 118,816 2,115 2,688 15 123,634 46.1%
BlackRock 57,459 11,514 526 46 69,545 25.9%
PowerShares 15,795 483 201 237 16,715 6.2%
Vanguard 11,923 3,271 - - 15,194 5.7%
ProShares 9,520 619 1,197 1,487 12,823 4.8%
Van Eck Funds 8,169 329 - 2 8,500 3.2%
DirexionShares 7,984 180 0 - 8,165 3.0%
WisdomTree 3,994 12 - 56 4,062 1.5%
United States Commodity Funds 0 - 2,613 - 2,613 1.0%
First Trust 1,287 98 8 32 1,424 0.5%
Guggenheim Investments 824 148 - 424 1,395 0.5%
Deutsche AWM 1,358 0 - 1 1,360 0.5%
Charles Schwab 810 108 - - 918 0.3%
PIMCO - 494 - 0 494 0.2%
ALPS 309 5 - - 314 0.1%
Global X Funds 206 34 - 2 242 0.1%
Fidelity Investments 111 24 - - 134 0.1%
FactorShares 104 - - - 104 0.0%
FlexShares 71 25 - - 95 0.0%
Emerging Global Shares 63 - - - 63 0.0%
ETF Securities 0 - 60 - 61 0.0%
Exchange Traded Concepts 35 4 - 6 44 0.0%
KraneShares 19 23 - - 42 0.0%
AdvisorShares Trust 8 29 2 1 41 0.0%
IndexIQ Advisors 5 - - 28 33 0.0%
AlphaMark Advisors 26 - - - 26 0.0%
Millington Securities 16 - - 8 24 0.0%
Revenue Shares 19 - - - 19 0.0%
Precidian 16 - - - 16 0.0%
Innovator Management 14 - - - 14 0.0%
Cambria Funds 7 - - 4 11 0.0%
Etfis Capital 11 - - - 11 0.0%
Recon Capital 10 - - - 10 0.0%
CSOP Asset Management 10 - - - 10 0.0%
GreenHaven Funds - - 9 - 9 0.0%
ArrowShares 0 - - 8 8 0.0%
Highland Capital - 8 - - 8 0.0%
Teucrium Trading - - 7 - 7 0.0%
Columbia Management 5 0 - - 5 0.0%
Compass EMP 5 - - - 5 0.0%
JPMorgan 4 - - - 4 0.0%
Empowered Funds 3 - - - 3 0.0%
Validea Capital Management 2 - - - 2 0.0%
Horizons ETFs 2 - - - 2 0.0%
ARK Investment Management 2 - - - 2 0.0%
VelocityShares 1 - - - 1 0.0%
QuantShares - - - 1 1 0.0%
Renaissance Capital 1 - - - 1 0.0%
Reality Shares 1 - - - 1 0.0%
Franklin Templeton Investments - 0 - - 0 0.0%
Huntington Strategy Shares 0 - - - 0 0.0%
LocalShares 0 - - - 0 0.0%
Lattice Strategies 0 - - - 0 0.0%
Calamos Investments 0 - - - 0 0.0%
ETF Managers Capital - 0 - - 0 0.0%
Total 239,021 19,525 7,310 2,356 268,212 100.0%
Current Week Turnover ($ Million)
Source: Deutsche Bank, Bloomberg Finance LP, FactSet
Page 10
27 April 2015
US ETF Weekly Research
Page 10 Deutsche Bank Securities Inc.
AUM
Figure 24: ETP AUM ($ Million) ranking by Issuer
Issuer EquityFixed
Income
Commo-
dity Other Total
Mkt
Share %
BlackRock 646,305 173,021 12,715 1,700 833,741 38.9%
Vanguard 402,155 75,311 - - 477,465 22.3%
State Street 364,500 37,704 28,226 432 430,861 20.1%
PowerShares 77,007 16,183 5,301 2,708 101,199 4.7%
WisdomTree 59,562 843 - 910 61,314 2.9%
First Trust 38,036 1,802 226 1,148 41,212 1.9%
Charles Schwab 29,410 3,291 - - 32,700 1.5%
Guggenheim Investments 23,073 6,650 - 1,897 31,620 1.5%
ProShares 16,232 4,679 1,958 2,639 25,508 1.2%
Van Eck Funds 18,114 5,344 - 73 23,531 1.1%
Deutsche AWM 16,772 52 - 137 16,961 0.8%
ALPS 11,447 491 - - 11,938 0.6%
PIMCO - 11,732 - 15 11,747 0.5%
FlexShares 6,154 2,710 - - 8,864 0.4%
DirexionShares 8,224 603 3 - 8,830 0.4%
United States Commodity Funds 5 - 4,289 - 4,293 0.2%
Global X Funds 3,783 338 - 37 4,158 0.2%
Fidelity Investments 3,104 140 - - 3,245 0.2%
Exchange Traded Concepts 1,870 421 - 240 2,531 0.1%
ETF Securities 16 - 2,328 - 2,344 0.1%
Emerging Global Shares 1,796 - - - 1,796 0.1%
Millington Securities 1,030 - - 419 1,449 0.1%
IndexIQ Advisors 199 - - 1,185 1,384 0.1%
AdvisorShares Trust 493 764 31 66 1,354 0.1%
Revenue Shares 1,099 - - - 1,099 0.1%
FactorShares 635 - - - 635 0.0%
Cambria Funds 371 - - 73 444 0.0%
Highland Capital - 323 - - 323 0.0%
CSOP Asset Management 269 - - - 269 0.0%
GreenHaven Funds - - 251 - 251 0.0%
ArrowShares 4 - - 237 241 0.0%
KraneShares 189 16 - - 205 0.0%
Compass EMP 198 - - - 198 0.0%
JPMorgan 179 - - - 179 0.0%
VelocityShares 116 - - - 116 0.0%
Teucrium Trading - - 108 - 108 0.0%
Precidian 101 - - - 101 0.0%
Etfis Capital 98 - - - 98 0.0%
Lattice Strategies 83 - - - 83 0.0%
Horizons ETFs 82 - - - 82 0.0%
Empowered Funds 60 - - - 60 0.0%
Recon Capital 44 - - - 44 0.0%
Columbia Management 28 11 - - 39 0.0%
ARK Investment Management 39 - - - 39 0.0%
Renaissance Capital 31 - - - 31 0.0%
Franklin Templeton Investments - 30 - - 30 0.0%
Calamos Investments 29 - - - 29 0.0%
AlphaMark Advisors 25 - - - 25 0.0%
Validea Capital Management 23 - - - 23 0.0%
Reality Shares 17 - - - 17 0.0%
QuantShares - - - 16 16 0.0%
Huntington Strategy Shares 14 - - - 14 0.0%
LocalShares 12 - - - 12 0.0%
Innovator Management 10 - - - 10 0.0%
ETF Managers Capital - 6 - - 6 0.0%
Total 1,733,042 342,464 55,435 13,933 2,144,874 100.0%
Current Week AUM ($ Million)
Source: Deutsche Bank, Bloomberg Finance LP, FactSet
Page 11
27 April 2015
US ETF Weekly Research
Deutsche Bank Securities Inc. Page 11
ETP – Net Cash Flows
Investment Focus
Figure 25: ETP Net Cash flows ($ Million) by Investment Focus – Equity
Investment Focus - Equity Net
Cashflow
% of
AUM
Net
Cashflow
% of
AUM
Net
Cashflow
% of
AUM
Strategy 759 0.8% 466 0.5% 10,254 12.1%
Sector (645) -0.2% (1,964) -0.8% (136) -0.1%
Style (125) 0.0% 40 0.0% 6,914 2.4%
Thematic 23 0.1% (99) -0.3% 2,896 8.4%
Regional 3,264 1.0% 3,754 1.2% 39,719 15.9%
Country 2,935 1.6% 1,933 1.1% 20,431 13.6%
Size 2,242 0.4% 1,376 0.3% (33,183) -6.1%
Total 8,453 0.5% 5,506 0.3% 46,894 2.9%
Current Week Prev. Week YTD
Source: Deutsche Bank, Bloomberg Finance LP, FactSet
Figure 26: Net Cash flows ($ Million) by Investment Focus – Fixed Income
Investment Focus - Fixed Income Net
Cashflow
% of
AUM
Net
Cashflow
% of
AUM
Net
Cashflow
% of
AUM
Sovereign 369 0.6% 1,451 2.3% 4,905 8.1%
Sub-Sovereign 65 0.2% 215 0.7% 2,107 7.8%
Corporates (294) -0.2% 605 0.4% 13,622 10.5%
Overall 291 0.4% (309) -0.5% 3,983 6.3%
Sovereign & Corporates (153) -0.6% 63 0.2% 1,622 6.8%
Collateralized Debt 24 0.3% 255 3.2% 225 2.8%
Total 300 0.1% 2,279 0.7% 26,465 8.5%
Current Week Prev. Week YTD
Source: Deutsche Bank, Bloomberg Finance LP, FactSet
Figure 27: ETP Net Cash flows ($ Million) by Investment Focus – Commodity
Investment Focus - Commodity Net
Cashflow
% of
AUM
Net
Cashflow
% of
AUM
Net
Cashflow
% of
AUM
Precious Metals 201 0.5% 188 0.4% 1,549 3.7%
Energy (148) -2.4% (272) -4.5% 2,624 82.3%
Agriculture 0 0.0% (8) -0.8% (103) -8.7%
Overall 19 0.4% (66) -1.3% (543) -9.0%
Industrial Metals 3 1.5% - 0.0% (13) -5.8%
Total 75 0.1% (157) -0.3% 3,514 6.7%
Current Week Prev. Week YTD
Source: Deutsche Bank, Bloomberg Finance LP, FactSet
Page 12
27 April 2015
US ETF Weekly Research
Page 12 Deutsche Bank Securities Inc.
Sub Segment
Figure 28: ETP Net Cash flows ($ Million) by Investment Focus Sub Segment – Equity
Investment Focus
Sub Segment - Equity
Net
Cashflow
% of
AUM
Net
Cashflow
% of
AUM
Net
Cashflow
% of
AUM
Country
US Broad 1,946 2.6% 296 0.4% 6,601 9.6%
Developed non-US 700 1.1% 1,192 1.9% 10,685 22.1%
Emerging Country 289 0.7% 446 1.1% 3,145 9.4%
Regional
Asia Pacific 129 1.1% 26 0.2% 1,825 19.3%
Emerging Markets 593 0.6% 581 0.6% (517) -0.6%
Europe 463 0.8% 1,855 3.4% 20,843 64.6%
Global 175 1.3% 157 1.2% (1,005) -7.2%
Global ex-US 1,903 1.5% 1,136 0.9% 18,573 17.7%
Sector
Global 28 0.3% 25 0.3% 1,005 13.3%
Global ex-US 76 0.8% 97 1.0% 621 7.2%
Other Sector 13 0.5% 18 0.8% (100) -4.4%
US (761) -0.3% (2,104) -0.9% (1,662) -0.7%
Size
Large Cap 1,704 0.5% 1,920 0.5% (39,103) -9.6%
Mid Cap 308 0.4% (114) -0.2% 4,163 6.5%
Small Cap 231 0.3% (430) -0.6% 1,757 2.5%
Style
Growth (74) -0.1% 56 0.1% 4,315 4.5%
Value 64 0.1% 122 0.1% 2,344 2.6%
Dividend (116) -0.1% (138) -0.1% 254 0.3%
Strategy
Short (0) 0.0% (22) -0.8% 122 4.6%
Leveraged (290) -1.9% (444) -2.8% (1,546) -10.1%
Leveraged Short 126 2.6% 191 4.1% 960 20.8%
Quantitative 488 1.3% 332 0.9% 7,210 25.1%
Fundamental 358 1.1% 384 1.1% 2,956 9.8%
Active 76 2.3% 24 0.7% 552 19.3%
Thematic
Sustainability 29 0.8% 18 0.5% 4 0.1%
Commodities (75) -0.4% (167) -0.8% 1,129 5.6%
Other Theme 69 0.5% 50 0.4% 1,762 16.1%
Total 8,453 0.5% 5,506 0.3% 46,894 2.9%
YTDCurrent Week Prev. Week
Source: Deutsche Bank, Bloomberg Finance LP, FactSet
Page 13
27 April 2015
US ETF Weekly Research
Deutsche Bank Securities Inc. Page 13
Figure 29: ETP Net Cash flows ($ Million) by Investment Focus Sub Segment – Fixed Income
Investment Focus
Sub Segment - Fixed Income
Net
Cashflow
% of
AUM
Net
Cashflow
% of
AUM
Net
Cashflow
% of
AUM
Overall
Overall 291 0.4% (309) -0.5% 3,983 6.3%
Corporates
Financials 1 0.1% - 0.0% 22 1.5%
Overall (295) -0.2% 605 0.4% 13,600 10.6%
Industrials - 0.0% - 0.0% - 0.0%
Utilities - 0.0% - 0.0% 0 0.4%
Sovereign
Overall 369 0.6% 1,451 2.3% 4,905 8.1%
Sovereign & Corporates
Overall (153) -0.6% 63 0.2% 1,622 6.8%
Sub-Sovereign
Local Governments 37 0.2% 122 0.7% 1,709 11.3%
Foreign Sovereigns 28 0.2% 92 0.8% 400 3.5%
Agency - 0.0% - 0.0% (2) -0.3%
Collateralized Debt
MBS 24 0.3% 255 3.2% 225 2.8%
Covered Bonds - 0.0% - 0.0% - 0.0%
Total 300 0.1% 2,279 0.7% 26,465 8.5%
YTDCurrent Week Prev. Week
Source: Deutsche Bank, Bloomberg Finance LP, FactSet
Page 14
27 April 2015
US ETF Weekly Research
Page 14 Deutsche Bank Securities Inc.
Figure 30: ETP Net Cash flows ($ Million) by Investment Focus Sub Segment – Commodity
Investment Focus
Sub Segment - Commodity
Net
Cashflow
% of
AUM
Net
Cashflow
% of
AUM
Net
Cashflow
% of
AUM
Overall
Overall 19 0.4% (66) -1.3% (543) -9.0%
Agriculture
Overall - 0.0% (9) -1.0% (79) -7.5%
Corn (2) -2.3% - 0.0% (25) -22.7%
Soybean - 0.0% - 0.0% (5) -41.9%
Energy
Overall - 0.0% 3 2.4% 6 4.6%
Crude Oil (165) -3.2% (283) -5.5% 2,472 109.5%
Gasoline - 0.0% - 0.0% 47 114.5%
Heating Oil - 0.0% - 0.0% 2 64.6%
Natural Gas 21 2.8% 8 1.1% 96 12.8%
Industrial Metals
Overall 3 1.5% - 0.0% (12) -5.5%
Copper - 0.0% - 0.0% (1) -29.6%
Precious Metals
Overall (3) -1.0% - 0.0% (120) -29.0%
Gold 139 0.4% 182 0.5% 1,720 4.9%
Palladium - 0.0% - 0.0% (30) -7.6%
Platinum (11) -1.9% - 0.0% (11) -1.9%
Silver 76 1.3% 6 0.1% (10) -0.2%
Total 80 0.1% (157) -0.3% 3,512 6.7%
Prev. Week YTDCurrent Week
Source: Deutsche Bank, Bloomberg Finance LP, FactSet
Page 15
27 April 2015
US ETF Weekly Research
Deutsche Bank Securities Inc. Page 15
Issuer
Figure 31: ETP Net Cash flows ($ Million) by Issuer
Issuer Net
Cashflow
% of
AUM
Net
Cashflow
% of
AUM
Net
Cashflow
% of
AUM
Vanguard 2,949 0.6% 2,020 0.4% 29,266 6.9%
BlackRock 2,707 0.3% 1,279 0.2% 35,093 4.6%
Deutsche AWM 1,240 8.0% 1,043 7.1% 11,210 254.7%
First Trust 659 1.6% 499 1.3% 5,762 17.4%
State Street 656 0.2% 853 0.2% (34,921) -7.7%
Charles Schwab 336 1.1% 242 0.8% 4,437 16.5%
WisdomTree 265 0.4% 1,754 3.0% 17,148 43.7%
Guggenheim Investments 111 0.4% 363 1.2% 2,115 7.4%
FactorShares 49 8.7% 23 4.3% 471 418.7%
Global X Funds 34 0.9% 20 0.5% 339 9.2%
PIMCO 31 0.3% 26 0.2% (57) -0.5%
ALPS 29 0.2% 19 0.2% 620 5.4%
AlphaMark Advisors 25 0.0% - 0.0% 25 n.a
DirexionShares 24 0.3% (115) -1.3% 340 4.2%
AdvisorShares Trust 16 1.2% 0 0.0% 79 6.3%
Fidelity Investments 15 0.5% 21 0.7% 370 13.4%
Van Eck Funds 13 0.1% (143) -0.6% 2,049 10.0%
KraneShares 12 6.4% (12) -5.9% (99) -37.0%
Millington Securities 9 0.6% 4 0.3% 270 23.4%
Recon Capital 8 24.0% - 0.0% 18 73.7%
Exchange Traded Concepts 8 0.3% 10 0.4% 267 12.3%
Innovator Management 8 307.0% - 0.0% 10 n.a
Compass EMP 6 3.0% (2) -0.9% 58 43.2%
ArrowShares 6 2.4% (0) 0.0% 79 51.2%
JPMorgan 5 3.1% 6 3.4% 107 184.5%
Emerging Global Shares 3 0.2% 11 0.6% 51 3.1%
Cambria Funds 3 0.6% 2 0.4% 74 21.0%
ARK Investment Management 2 6.0% - 0.0% 10 36.5%
Empowered Funds 1 2.3% - 0.0% 30 117.0%
Reality Shares 1 7.4% - 0.0% 9 106.6%
Etfis Capital 1 1.1% 16 19.3% 83 675.9%
Teucrium Trading 0 0.0% 1 1.2% (24) -16.6%
Columbia Management - 0.0% 2 6.4% 2 6.6%
Precidian - 0.0% - 0.0% - 0.0%
QuantShares - 0.0% - 0.0% 7 75.6%
Huntington Strategy Shares - 0.0% - 0.0% (5) -25.8%
Highland Capital - 0.0% 2 0.6% 8 2.5%
Horizons ETFs - 0.0% - 0.0% 40 95.9%
VelocityShares - 0.0% - 0.0% (14) -10.7%
LocalShares - 0.0% - 0.0% 2 16.5%
Renaissance Capital - 0.0% - 0.0% (1) -3.8%
Franklin Templeton Investments - 0.0% - 0.0% 2 9.1%
Calamos Investments - 0.0% - 0.0% 1 1.9%
Validea Capital Management - 0.0% 1 6.3% 15 238.5%
ETF Managers Capital - 0.0% - 0.0% 6 n.a
Lattice Strategies - 0.0% 3 3.1% 81 n.a
Revenue Shares (3) -0.2% 2 0.1% 113 12.0%
IndexIQ Advisors (3) -0.2% 4 0.3% 13 1.0%
GreenHaven Funds (5) -1.8% 1 0.4% (2) -0.8%
CSOP Asset Management (8) -2.8% (38) -13.1% 196 n.a
FlexShares (8) -0.1% 7 0.1% 185 2.2%
ETF Securities (14) -0.6% - 0.0% (118) -4.7%
PowerShares (18) 0.0% 118 0.1% 202 0.2%
United States Commodity Funds (110) -2.5% (170) -3.9% 1,366 48.9%
ProShares (186) -0.7% (211) -0.8% 593 2.4%
Total 8,877 0.4% 7,663 0.4% 77,982 3.9%
Current Week Prev. Week YTD
Source: Deutsche Bank, Bloomberg Finance LP, FactSet
Page 16
27 April 2015
US ETF Weekly Research
Page 16 Deutsche Bank Securities Inc.
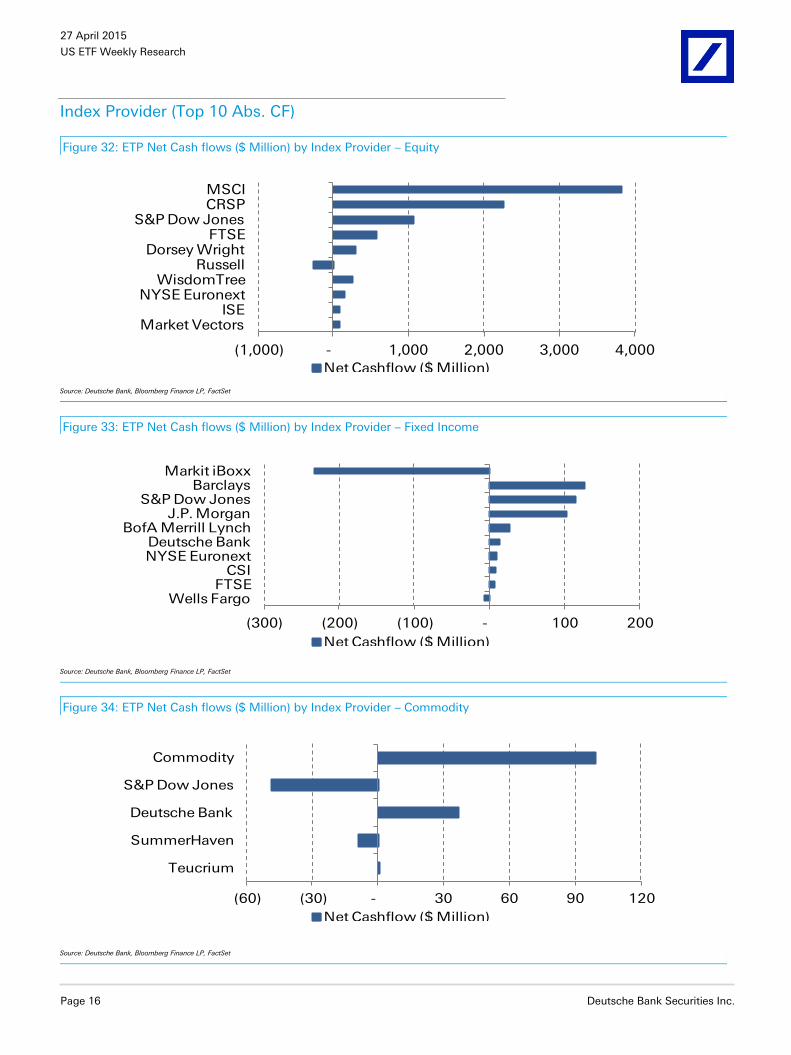
Index Provider (Top 10 Abs. CF)
Figure 32: ETP Net Cash flows ($ Million) by Index Provider – Equity
(1,000) - 1,000 2,000 3,000 4,000
Market VectorsISE
NYSE EuronextWisdomTree
RussellDorsey Wright
FTSES&P Dow Jones
CRSPMSCI
Net Cashflow ($ Million)
Source: Deutsche Bank, Bloomberg Finance LP, FactSet
Figure 33: ETP Net Cash flows ($ Million) by Index Provider – Fixed Income
(300) (200) (100) - 100 200
Wells FargoFTSE
CSINYSE EuronextDeutsche Bank
BofA Merrill LynchJ.P. Morgan
S&P Dow JonesBarclays
Markit iBoxx
Net Cashflow ($ Million)
Source: Deutsche Bank, Bloomberg Finance LP, FactSet
Figure 34: ETP Net Cash flows ($ Million) by Index Provider – Commodity
(60) (30) - 30 60 90 120
Teucrium
SummerHaven
Deutsche Bank
S&P Dow Jones
Commodity
Net Cashflow ($ Million)
Source: Deutsche Bank, Bloomberg Finance LP, FactSet
Page 17
27 April 2015
US ETF Weekly Research
Deutsche Bank Securities Inc. Page 17
Underlying Index/Security
Figure 35: ETP inflows ($ Million) by Underlying Index
Equity (Top 10)
Figure 36: ETP outflows ($ Million) by Underlying Index
Equity (Top 10)
0 500 1,000 1,500 2,000 2,500
MSCI ACWI ex USA
MSCI EAFE IMI
S&P Retail Select Industry
S&P Energy Select Sector
Nasdaq Biotechnology
MSCI Emerging Markets
MSCI Japan
MSCI EAFE US Dollar Hedged Net
CRSP US Total Market
S&P 500
Inflow ($ Million)
(400) (300) (200) (100) -
Russell 2000
Dow Jones Industrial Average
MSCI Switzerland 25/50
S&P Homebuilders Select Industry
Nasdaq 100
S&P Financials Select Sector
S&P Industrial Select Sector
S&P Oil & Gas Exploration & Production …
S&P Health Care Select Sector
Dow Jones U.S. Real Estate
Outflow ($ Million)
Figure 37: ETP inflows ($ Million) by Underlying Index
Fixed Income (Top 10)
Figure 38: ETP outflows ($ Million) by Underlying Index
Fixed Income
0 50 100 150 200 250
Barclays Intermediate U.S. Corporate
S&P U.S. Preferred Stock
Barclays U.S. 5-10 Year Corporate …
Barclays US Aggregate Bond
Barclays U.S. 1-3 Year Treasury Bond
J.P. Morgan EMBI Global Core
Markit iBoxx USD Liquid …
Barclays U.S. 7-10 Year Treasury …
Barclays U.S. 20+ Year Treasury …
Barclays U.S. Aggregate Float …
Inflow ($ Million)
(400) (300) (200) (100) 0
Barclays Managed Money Municipal Short …
Barclays Global Treasury Ex-US Capped
Barclays U.S. Short Treasury Bond
Barclays U.S. Treasury Inflation-Protected …
Barclays 1-3 Year Global Treasury ex-US …
Barclays High Yield Very Liquid
Barclays Global Aggregate ex-USD Float …
Barclays US Floating Rate Note < 5 Years
Barclays U.S. 1–5 Year Government/Credit …
Markit iBoxx USD Liquid High Yield
Outflow ($ Million)
Figure 39: ETP inflows ($ Million) by Underlying
Index/Security – Commodity
Figure 40: ETP outflows ($ Million) by Underlying
Index/Security – Commodity (Top 10)
0 30 60 90 120 150
Dow Jones - UBS Commodity
Teucrium Wheat
S&P GSCI Total Return
Deutsche Bank Liquid Comm - Opt Yield Ind Met ER
Deutsche Bank Liquid Comm - Opt Yield Oil ER
Natural Gas Futures Contracts
Deutsche Bank Liquid Commodity
Commodity - Silver
Commodity - Gold
Inflow ($ Million)
(150) (120) (90) (60) (30) -
Teucrium Corn
Commodity - Precious Metals
Coal futures contracts
Summerhaven Dynamic Commodity
Commodity - Platinum
Dow Jones - UBS Crude Oil Sub-Index
West Texas Intermediate Light
Outflow ($ Million)
Source: Deutsche Bank, Bloomberg Finance LP, FactSet
Page 18
27 April 2015
US ETF Weekly Research
Page 18 Deutsche Bank Securities Inc.
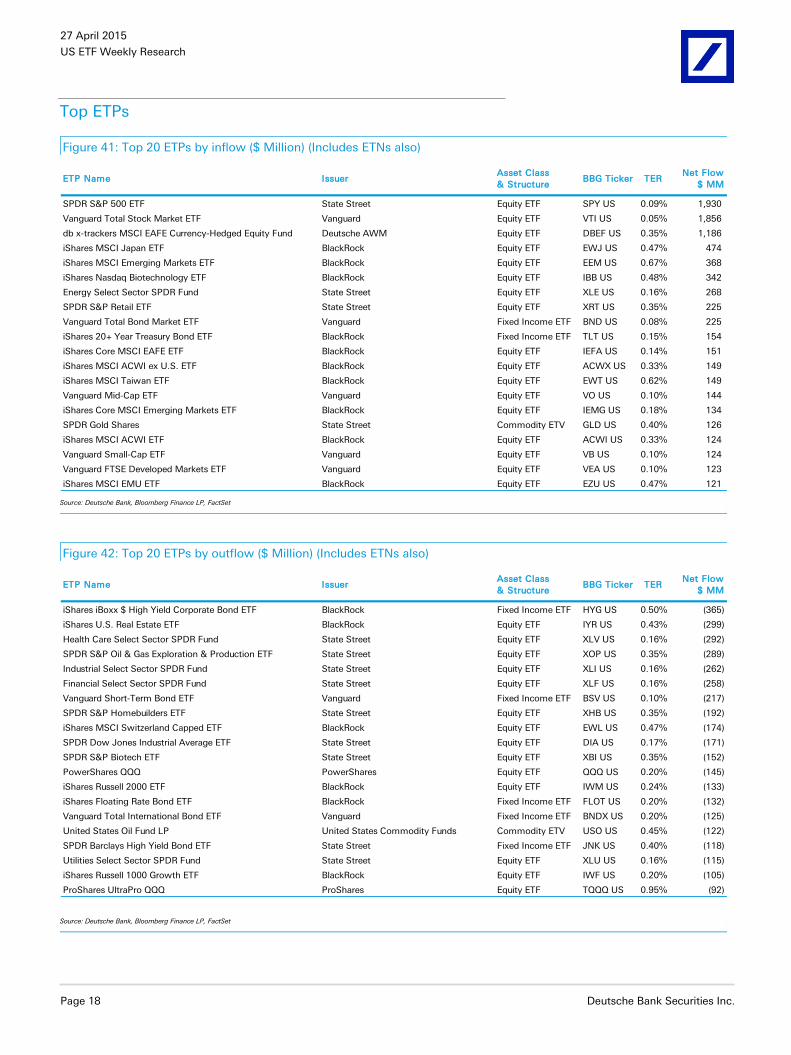
Top ETPs
Figure 41: Top 20 ETPs by inflow ($ Million) (Includes ETNs also)
ETP Name IssuerAsset Class
& StructureBBG Ticker TER
Net Flow
$ MM
SPDR S&P 500 ETF State Street Equity ETF SPY US 0.09% 1,930
Vanguard Total Stock Market ETF Vanguard Equity ETF VTI US 0.05% 1,856
db x-trackers MSCI EAFE Currency-Hedged Equity Fund Deutsche AWM Equity ETF DBEF US 0.35% 1,186
iShares MSCI Japan ETF BlackRock Equity ETF EWJ US 0.47% 474
iShares MSCI Emerging Markets ETF BlackRock Equity ETF EEM US 0.67% 368
iShares Nasdaq Biotechnology ETF BlackRock Equity ETF IBB US 0.48% 342
Energy Select Sector SPDR Fund State Street Equity ETF XLE US 0.16% 268
SPDR S&P Retail ETF State Street Equity ETF XRT US 0.35% 225
Vanguard Total Bond Market ETF Vanguard Fixed Income ETF BND US 0.08% 225
iShares 20+ Year Treasury Bond ETF BlackRock Fixed Income ETF TLT US 0.15% 154
iShares Core MSCI EAFE ETF BlackRock Equity ETF IEFA US 0.14% 151
iShares MSCI ACWI ex U.S. ETF BlackRock Equity ETF ACWX US 0.33% 149
iShares MSCI Taiwan ETF BlackRock Equity ETF EWT US 0.62% 149
Vanguard Mid-Cap ETF Vanguard Equity ETF VO US 0.10% 144
iShares Core MSCI Emerging Markets ETF BlackRock Equity ETF IEMG US 0.18% 134
SPDR Gold Shares State Street Commodity ETV GLD US 0.40% 126
iShares MSCI ACWI ETF BlackRock Equity ETF ACWI US 0.33% 124
Vanguard Small-Cap ETF Vanguard Equity ETF VB US 0.10% 124
Vanguard FTSE Developed Markets ETF Vanguard Equity ETF VEA US 0.10% 123
iShares MSCI EMU ETF BlackRock Equity ETF EZU US 0.47% 121
Source: Deutsche Bank, Bloomberg Finance LP, FactSet
Figure 42: Top 20 ETPs by outflow ($ Million) (Includes ETNs also)
ETP Name IssuerAsset Class
& StructureBBG Ticker TER
Net Flow
$ MM
iShares iBoxx $ High Yield Corporate Bond ETF BlackRock Fixed Income ETF HYG US 0.50% (365)
iShares U.S. Real Estate ETF BlackRock Equity ETF IYR US 0.43% (299)
Health Care Select Sector SPDR Fund State Street Equity ETF XLV US 0.16% (292)
SPDR S&P Oil & Gas Exploration & Production ETF State Street Equity ETF XOP US 0.35% (289)
Industrial Select Sector SPDR Fund State Street Equity ETF XLI US 0.16% (262)
Financial Select Sector SPDR Fund State Street Equity ETF XLF US 0.16% (258)
Vanguard Short-Term Bond ETF Vanguard Fixed Income ETF BSV US 0.10% (217)
SPDR S&P Homebuilders ETF State Street Equity ETF XHB US 0.35% (192)
iShares MSCI Switzerland Capped ETF BlackRock Equity ETF EWL US 0.47% (174)
SPDR Dow Jones Industrial Average ETF State Street Equity ETF DIA US 0.17% (171)
SPDR S&P Biotech ETF State Street Equity ETF XBI US 0.35% (152)
PowerShares QQQ PowerShares Equity ETF QQQ US 0.20% (145)
iShares Russell 2000 ETF BlackRock Equity ETF IWM US 0.24% (133)
iShares Floating Rate Bond ETF BlackRock Fixed Income ETF FLOT US 0.20% (132)
Vanguard Total International Bond ETF Vanguard Fixed Income ETF BNDX US 0.20% (125)
United States Oil Fund LP United States Commodity Funds Commodity ETV USO US 0.45% (122)
SPDR Barclays High Yield Bond ETF State Street Fixed Income ETF JNK US 0.40% (118)
Utilities Select Sector SPDR Fund State Street Equity ETF XLU US 0.16% (115)
iShares Russell 1000 Growth ETF BlackRock Equity ETF IWF US 0.20% (105)
ProShares UltraPro QQQ ProShares Equity ETF TQQQ US 0.95% (92)
Source: Deutsche Bank, Bloomberg Finance LP, FactSet
Page 19
27 April 2015
US ETF Weekly Research
Deutsche Bank Securities Inc. Page 19
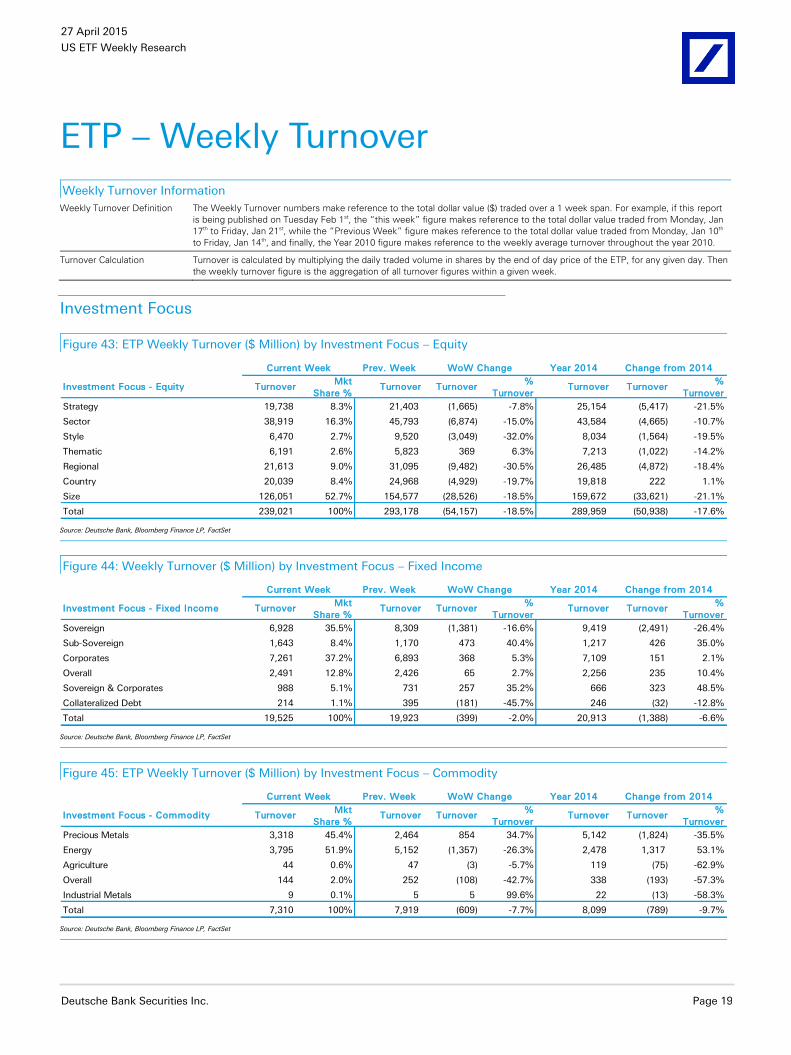
ETP – Weekly Turnover
Weekly Turnover Information
Weekly Turnover Definition The Weekly Turnover numbers make reference to the total dollar value ($) traded over a 1 week span. For example, if this report
is being published on Tuesday Feb 1st, the “this week” figure makes reference to the total dollar value traded from Monday, Jan
17th to Friday, Jan 21st, while the “Previous Week” figure makes reference to the total dollar value traded from Monday, Jan 10th
to Friday, Jan 14th, and finally, the Year 2010 figure makes reference to the weekly average turnover throughout the year 2010.
Turnover Calculation Turnover is calculated by multiplying the daily traded volume in shares by the end of day price of the ETP, for any given day. Then
the weekly turnover figure is the aggregation of all turnover figures within a given week.
Investment Focus
Figure 43: ETP Weekly Turnover ($ Million) by Investment Focus – Equity
Prev. Week Year 2014
Investment Focus - Equity TurnoverMkt
Share %Turnover Turnover
%
Turnover Turnover Turnover
%
Turnover
Strategy 19,738 8.3% 21,403 (1,665) -7.8% 25,154 (5,417) -21.5%
Sector 38,919 16.3% 45,793 (6,874) -15.0% 43,584 (4,665) -10.7%
Style 6,470 2.7% 9,520 (3,049) -32.0% 8,034 (1,564) -19.5%
Thematic 6,191 2.6% 5,823 369 6.3% 7,213 (1,022) -14.2%
Regional 21,613 9.0% 31,095 (9,482) -30.5% 26,485 (4,872) -18.4%
Country 20,039 8.4% 24,968 (4,929) -19.7% 19,818 222 1.1%
Size 126,051 52.7% 154,577 (28,526) -18.5% 159,672 (33,621) -21.1%
Total 239,021 100% 293,178 (54,157) -18.5% 289,959 (50,938) -17.6%
Change from 2014WoW ChangeCurrent Week
Source: Deutsche Bank, Bloomberg Finance LP, FactSet
Figure 44: Weekly Turnover ($ Million) by Investment Focus – Fixed Income
Prev. Week Year 2014
Investment Focus - Fixed Income TurnoverMkt
Share %Turnover Turnover
%
Turnover Turnover Turnover
%
Turnover
Sovereign 6,928 35.5% 8,309 (1,381) -16.6% 9,419 (2,491) -26.4%
Sub-Sovereign 1,643 8.4% 1,170 473 40.4% 1,217 426 35.0%
Corporates 7,261 37.2% 6,893 368 5.3% 7,109 151 2.1%
Overall 2,491 12.8% 2,426 65 2.7% 2,256 235 10.4%
Sovereign & Corporates 988 5.1% 731 257 35.2% 666 323 48.5%
Collateralized Debt 214 1.1% 395 (181) -45.7% 246 (32) -12.8%
Total 19,525 100% 19,923 (399) -2.0% 20,913 (1,388) -6.6%
Change from 2014Current Week WoW Change
Source: Deutsche Bank, Bloomberg Finance LP, FactSet
Figure 45: ETP Weekly Turnover ($ Million) by Investment Focus – Commodity
Prev. Week Year 2014
Investment Focus - Commodity TurnoverMkt
Share %Turnover Turnover
%
Turnover Turnover Turnover
%
Turnover
Precious Metals 3,318 45.4% 2,464 854 34.7% 5,142 (1,824) -35.5%
Energy 3,795 51.9% 5,152 (1,357) -26.3% 2,478 1,317 53.1%
Agriculture 44 0.6% 47 (3) -5.7% 119 (75) -62.9%
Overall 144 2.0% 252 (108) -42.7% 338 (193) -57.3%
Industrial Metals 9 0.1% 5 5 99.6% 22 (13) -58.3%
Total 7,310 100% 7,919 (609) -7.7% 8,099 (789) -9.7%
WoW Change Change from 2014Current Week
Source: Deutsche Bank, Bloomberg Finance LP, FactSet
Page 20
27 April 2015
US ETF Weekly Research
Page 20 Deutsche Bank Securities Inc.
Sub Segment
Figure 46: ETP Weekly Turnover ($ Million) by Investment Focus Sub Segment – Equity
Prev. Week Year 2014
Investment Focus
Sub Segment - EquityTurnover
Mkt
Share %Turnover Turnover
%
Turnover Turnover Turnover
%
Turnover
Country
US Broad 1,653 0.7% 1,772 (119) -6.7% 1,684 (31) -1.8%
Developed non-US 6,168 2.6% 6,370 (202) -3.2% 5,565 603 10.8%
Emerging Country 12,218 5.1% 16,826 (4,608) -27.4% 12,569 (351) -2.8%
Regional
Asia Pacific 734 0.3% 894 (160) -17.9% 515 219 42.5%
Emerging Markets 10,030 4.2% 14,956 (4,926) -32.9% 15,592 (5,562) -35.7%
Europe 4,041 1.7% 5,165 (1,124) -21.8% 3,031 1,011 33.3%
Global 454 0.2% 559 (105) -18.8% 499 (45) -9.0%
Global ex-US 6,353 2.7% 9,521 (3,168) -33.3% 6,848 (495) -7.2%
Sector
Global 410 0.2% 288 122 42.4% 231 179 77.2%
Global ex-US 356 0.1% 255 101 39.5% 196 159 81.1%
Other Sector 94 0.0% 143 (49) -34.4% 108 (14) -13.0%
US 38,059 15.9% 45,107 (7,048) -15.6% 43,048 (4,989) -11.6%
Size
Large Cap 109,856 46.0% 130,362 (20,507) -15.7% 130,692 (20,837) -15.9%
Mid Cap 2,957 1.2% 3,267 (310) -9.5% 3,929 (972) -24.7%
Small Cap 13,238 5.5% 20,948 (7,710) -36.8% 25,051 (11,812) -47.2%
Style
Growth 2,553 1.1% 4,010 (1,457) -36.3% 3,096 (543) -17.5%
Value 2,072 0.9% 3,179 (1,107) -34.8% 2,732 (660) -24.2%
Dividend 1,845 0.8% 2,331 (486) -20.8% 2,206 (361) -16.4%
Strategy
Short 420 0.2% 529 (109) -20.7% 838 (418) -49.9%
Leveraged 11,523 4.8% 12,624 (1,101) -8.7% 13,524 (2,001) -14.8%
Leveraged Short 4,929 2.1% 5,129 (200) -3.9% 8,069 (3,140) -38.9%
Quantitative 1,414 0.6% 1,586 (172) -10.9% 988 426 43.1%
Fundamental 1,339 0.6% 1,425 (86) -6.0% 1,621 (282) -17.4%
Active 113 0.0% 110 3 2.9% 115 (2) -1.9%
Thematic
Sustainability 127 0.1% 150 (23) -15.5% 162 (35) -21.4%
Commodities 5,662 2.4% 5,287 375 7.1% 6,689 (1,027) -15.4%
Other Theme 402 0.2% 385 17 4.4% 363 40 11.0%
Total 239,021 100.0% 293,178 (54,157) -18.5% 289,959 (50,938) -17.6%
Change from 2014Current Week WoW Change
Source: Deutsche Bank, Bloomberg Finance LP, FactSet
Page 21
27 April 2015
US ETF Weekly Research
Deutsche Bank Securities Inc. Page 21
Figure 47: ETP Weekly Turnover ($ Million) by Investment Focus Sub Segment – Fixed Income
Prev. Week Year 2014
Investment Focus
Sub Segment - Fixed IncomeTurnover
Mkt
Share %Turnover Turnover
%
Turnover Turnover Turnover
%
Turnover
Overall
Overall 2,491 12.8% 2,426 65 2.7% 2,256 235 10.4%
Corporates
Financials 21 0.1% 26 (5) -20.2% 24 (3) -10.8%
Overall 7,239 37.1% 6,866 373 5.4% 7,082 157 2.2%
Industrials 0 0.0% 0 (0) -30.0% 3 (3) -93.8%
Utilities 1 0.0% 0 0 79.6% 1 0 14.8%
Sovereign
Overall 6,928 35.5% 8,309 (1,381) -16.6% 9,419 (2,491) -26.4%
Sovereign & Corporates
Overall 988 5.1% 731 257 35.2% 666 323 48.5%
Sub-Sovereign
Local Governments 517 2.6% 525 (7) -1.4% 405 113 27.8%
Foreign Sovereigns 1,119 5.7% 637 482 75.7% 800 319 39.9%
Agency 6 0.0% 8 (2) -24.8% 13 (6) -49.3%
Collateralized Debt
MBS 214 1.1% 395 (181) -45.7% 245 (31) -12.8%
Covered Bonds 0 0.0% - 0 n.a. 0 (0) -86.8%
Total 19,525 100% 19,923 (399) -2.0% 20,913 (1,388) -6.6%
Current Week WoW Change Change from 2014
Source: Deutsche Bank, Bloomberg Finance LP, FactSet
Page 22
27 April 2015
US ETF Weekly Research
Page 22 Deutsche Bank Securities Inc.
Figure 48: ETP Weekly Turnover ($ Million) by Investment Focus Sub Segment – Commodity
Prev. Week Year 2014
Investment Focus
Sub Segment - CommodityTurnover
Mkt
Share %Turnover Turnover
%
Turnover Turnover Turnover
%
Turnover
Overall
Overall 144 2.0% 252 (108) -42.7% 338 (193) -57.3%
Agriculture
Overall 37 0.5% 39 (2) -4.7% 88 (51) -57.9%
Corn 5 0.1% 4 1 16.7% 25 (21) -81.6%
Soybean 1 0.0% 0 0 104.4% 1 (0) -36.8%
Energy
Overall 8 0.1% 5 3 69.3% 16 (7) -46.7%
Crude Oil 3,378 46.2% 4,712 (1,335) -28.3% 1,297 2,081 160.4%
Gasoline 11 0.1% 13 (3) -21.2% 6 5 84.7%
Heating Oil 0 0.0% 0 (0) -17.8% 0 (0) -52.4%
Natural Gas 398 5.4% 421 (23) -5.5% 1,159 (761) -65.7%
Industrial Metals
Overall 9 0.1% 5 5 100.6% 22 (13) -58.1%
Copper 0 0.0% 0 0 20.9% 0 (0) -71.5%
Precious Metals
Overall 9 0.1% 6 3 55.3% 18 (9) -52.0%
Gold 2,816 38.5% 2,090 726 34.7% 4,297 (1,481) -34.5%
Palladium 12 0.2% 7 5 72.5% 24 (11) -48.3%
Platinum 28 0.4% 14 14 98.2% 23 5 21.4%
Silver 454 6.2% 347 106 30.6% 781 (327) -41.9%
Total 7,310 100% 7,919 (609) -7.7% 8,099 (789) -9.7%
Current Week WoW Change Change from 2014
Source: Deutsche Bank, Bloomberg Finance LP, FactSet
Page 23
27 April 2015
US ETF Weekly Research
Deutsche Bank Securities Inc. Page 23
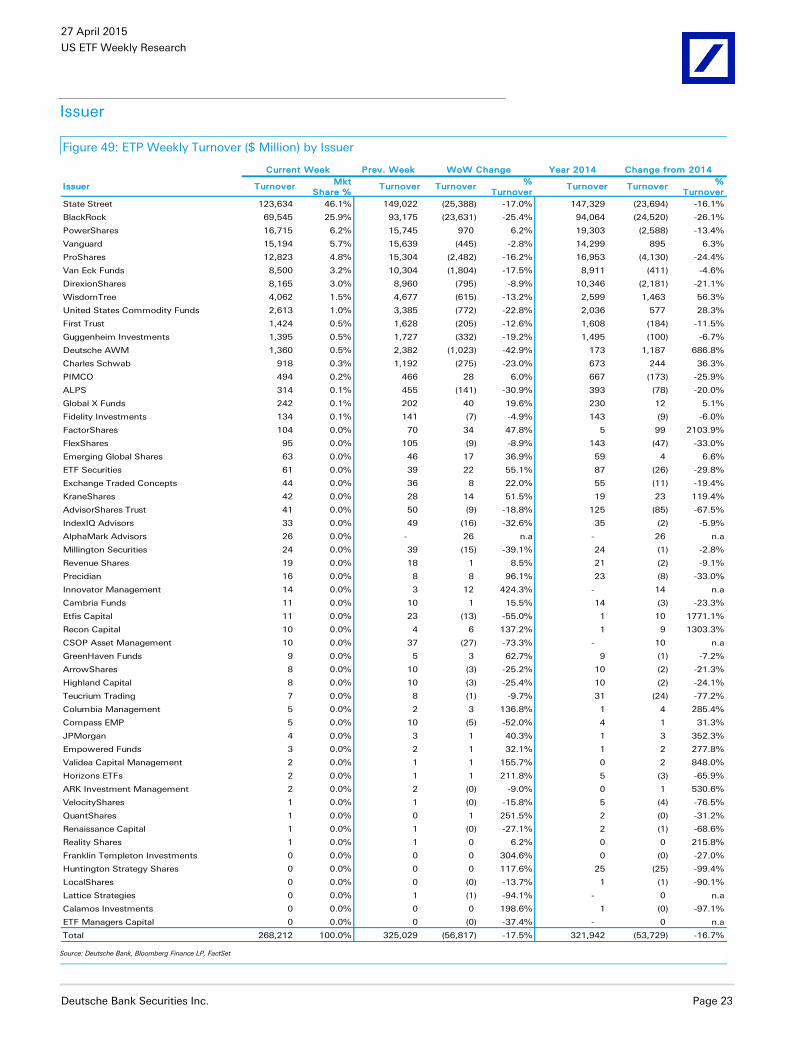
Issuer
Figure 49: ETP Weekly Turnover ($ Million) by Issuer
Prev. Week Year 2014
Issuer TurnoverMkt
Share %Turnover Turnover
%
Turnover Turnover Turnover
%
Turnover
State Street 123,634 46.1% 149,022 (25,388) -17.0% 147,329 (23,694) -16.1%
BlackRock 69,545 25.9% 93,175 (23,631) -25.4% 94,064 (24,520) -26.1%
PowerShares 16,715 6.2% 15,745 970 6.2% 19,303 (2,588) -13.4%
Vanguard 15,194 5.7% 15,639 (445) -2.8% 14,299 895 6.3%
ProShares 12,823 4.8% 15,304 (2,482) -16.2% 16,953 (4,130) -24.4%
Van Eck Funds 8,500 3.2% 10,304 (1,804) -17.5% 8,911 (411) -4.6%
DirexionShares 8,165 3.0% 8,960 (795) -8.9% 10,346 (2,181) -21.1%
WisdomTree 4,062 1.5% 4,677 (615) -13.2% 2,599 1,463 56.3%
United States Commodity Funds 2,613 1.0% 3,385 (772) -22.8% 2,036 577 28.3%
First Trust 1,424 0.5% 1,628 (205) -12.6% 1,608 (184) -11.5%
Guggenheim Investments 1,395 0.5% 1,727 (332) -19.2% 1,495 (100) -6.7%
Deutsche AWM 1,360 0.5% 2,382 (1,023) -42.9% 173 1,187 686.8%
Charles Schwab 918 0.3% 1,192 (275) -23.0% 673 244 36.3%
PIMCO 494 0.2% 466 28 6.0% 667 (173) -25.9%
ALPS 314 0.1% 455 (141) -30.9% 393 (78) -20.0%
Global X Funds 242 0.1% 202 40 19.6% 230 12 5.1%
Fidelity Investments 134 0.1% 141 (7) -4.9% 143 (9) -6.0%
FactorShares 104 0.0% 70 34 47.8% 5 99 2103.9%
FlexShares 95 0.0% 105 (9) -8.9% 143 (47) -33.0%
Emerging Global Shares 63 0.0% 46 17 36.9% 59 4 6.6%
ETF Securities 61 0.0% 39 22 55.1% 87 (26) -29.8%
Exchange Traded Concepts 44 0.0% 36 8 22.0% 55 (11) -19.4%
KraneShares 42 0.0% 28 14 51.5% 19 23 119.4%
AdvisorShares Trust 41 0.0% 50 (9) -18.8% 125 (85) -67.5%
IndexIQ Advisors 33 0.0% 49 (16) -32.6% 35 (2) -5.9%
AlphaMark Advisors 26 0.0% - 26 n.a - 26 n.a
Millington Securities 24 0.0% 39 (15) -39.1% 24 (1) -2.8%
Revenue Shares 19 0.0% 18 1 8.5% 21 (2) -9.1%
Precidian 16 0.0% 8 8 96.1% 23 (8) -33.0%
Innovator Management 14 0.0% 3 12 424.3% - 14 n.a
Cambria Funds 11 0.0% 10 1 15.5% 14 (3) -23.3%
Etfis Capital 11 0.0% 23 (13) -55.0% 1 10 1771.1%
Recon Capital 10 0.0% 4 6 137.2% 1 9 1303.3%
CSOP Asset Management 10 0.0% 37 (27) -73.3% - 10 n.a
GreenHaven Funds 9 0.0% 5 3 62.7% 9 (1) -7.2%
ArrowShares 8 0.0% 10 (3) -25.2% 10 (2) -21.3%
Highland Capital 8 0.0% 10 (3) -25.4% 10 (2) -24.1%
Teucrium Trading 7 0.0% 8 (1) -9.7% 31 (24) -77.2%
Columbia Management 5 0.0% 2 3 136.8% 1 4 285.4%
Compass EMP 5 0.0% 10 (5) -52.0% 4 1 31.3%
JPMorgan 4 0.0% 3 1 40.3% 1 3 352.3%
Empowered Funds 3 0.0% 2 1 32.1% 1 2 277.8%
Validea Capital Management 2 0.0% 1 1 155.7% 0 2 848.0%
Horizons ETFs 2 0.0% 1 1 211.8% 5 (3) -65.9%
ARK Investment Management 2 0.0% 2 (0) -9.0% 0 1 530.6%
VelocityShares 1 0.0% 1 (0) -15.8% 5 (4) -76.5%
QuantShares 1 0.0% 0 1 251.5% 2 (0) -31.2%
Renaissance Capital 1 0.0% 1 (0) -27.1% 2 (1) -68.6%
Reality Shares 1 0.0% 1 0 6.2% 0 0 215.8%
Franklin Templeton Investments 0 0.0% 0 0 304.6% 0 (0) -27.0%
Huntington Strategy Shares 0 0.0% 0 0 117.6% 25 (25) -99.4%
LocalShares 0 0.0% 0 (0) -13.7% 1 (1) -90.1%
Lattice Strategies 0 0.0% 1 (1) -94.1% - 0 n.a
Calamos Investments 0 0.0% 0 0 198.6% 1 (0) -97.1%
ETF Managers Capital 0 0.0% 0 (0) -37.4% - 0 n.a
Total 268,212 100.0% 325,029 (56,817) -17.5% 321,942 (53,729) -16.7%
Current Week WoW Change Change from 2014
Source: Deutsche Bank, Bloomberg Finance LP, FactSet
Page 24
27 April 2015
US ETF Weekly Research
Page 24 Deutsche Bank Securities Inc.
Index Provider Underlying Index/Security
Figure 50: ETP Weekly Turnover ($ Million) by Index
Provider – Equity (Top 10)
Figure 51: ETP Weekly Turnover ($ Million) by Underlying
Index – Equity (Top 10)
0 30,000 60,000 90,000 120,000 150,000
CSI
CRSP
WisdomTree
NYSE Euronext
Market Vectors
FTSE
Russell
Nasdaq OMX
MSCI
S&P Dow Jones
Turnover ($ Million)
- 20,000 40,000 60,000 80,000 100,000
S&P Health Care Select Sector
MSCI EAFE
FTSE China 25
Dow Jones Industrial Average
S&P Energy Select Sector
NYSE Arca Gold Miners
MSCI Emerging Markets
Russell 2000
Nasdaq 100
S&P 500
Turnover ($ Million)
Figure 52: ETP Weekly Turnover ($ Million) by Index
Provider – Fixed Income
Figure 53: ETP Weekly Turnover ($ Million) by Underlying
Index – Fixed Income (Top 10)
0 3,000 6,000 9,000 12,000 15,000
Wells Fargo
Morningstar
Accretive Asset Management
NYSE Euronext
Deutsche Bank
BofA Merrill Lynch
J.P. Morgan
S&P Dow Jones
Markit iBoxx
Barclays
Turnover ($ Million)
- 1,000 2,000 3,000 4,000 5,000
Barclays U.S. Treasury Inflation Protected …
Treasury Bill
J.P. Morgan EMBI Global Core
Barclays US Aggregate Bond
Barclays U.S. 1–5 Year …
Barclays High Yield Very Liquid
Barclays U.S. Aggregate Float Adjusted
Markit iBoxx USD Liquid Investment Grade
Markit iBoxx USD Liquid High Yield
Barclays U.S. 20+ Year Treasury Bond
Turnover ($ Million)
Figure 54: ETP Weekly Turnover ($ Million) by Index
Provider – Commodity
Figure 55: ETP Weekly Turnover ($ Million) by Underlying
Index/Security – Commodity (Top 10)
0 1,000 2,000 3,000 4,000 5,000 6,000
Bloomberg
Teucrium
Thomson Reuters
SummerHaven
Deutsche Bank
S&P Dow Jones
Commodity
Turnover ($ Million)
- 500 1,000 1,500 2,000 2,500 3,000
Commodity - Platinum
Brent Crude Oil Future
Deutsche Bank Liquid Commodity Div …
Deutsche Bank Liquid Comm - Opt Yield …
Deutsche Bank Liquid Commodity
Natural Gas Futures Contracts
Commodity - Silver
Dow Jones - UBS Crude Oil Sub-Index
West Texas Intermediate Light
Commodity - Gold
Turnover ($ Million)
Source: Deutsche Bank, Bloomberg Finance LP, FactSet
Page 25
27 April 2015
US ETF Weekly Research
Deutsche Bank Securities Inc. Page 25
Top ETPs
Figure 56: Top 20 ETPs by Weekly Turnover ($ Million) (Includes ETNs also)
ETP Name IssuerAsset Class
& StructureBBG Ticker TER
Turnover
$ MM
SPDR S&P 500 ETF State Street Equity ETF SPY US 0.09% 85,681
PowerShares QQQ PowerShares Equity ETF QQQ US 0.20% 14,710
iShares Russell 2000 ETF BlackRock Equity ETF IWM US 0.24% 11,757
iShares MSCI Emerging Markets ETF BlackRock Equity ETF EEM US 0.67% 7,259
Energy Select Sector SPDR Fund State Street Equity ETF XLE US 0.16% 4,816
iShares China Large-Cap ETF BlackRock Equity ETF FXI US 0.74% 4,270
SPDR Dow Jones Industrial Average ETF State Street Equity ETF DIA US 0.17% 4,219
iShares 20+ Year Treasury Bond ETF BlackRock Fixed Income ETF TLT US 0.15% 3,970
iShares MSCI EAFE ETF BlackRock Equity ETF EFA US 0.33% 3,696
Market Vectors Gold Miners ETF Van Eck Funds Equity ETF GDX US 0.52% 3,479
Health Care Select Sector SPDR Fund State Street Equity ETF XLV US 0.16% 2,991
iShares Core S&P 500 ETF BlackRock Equity ETF IVV US 0.07% 2,882
iPath S&P 500 VIX Short-Term Futures ETN Barclays Bank Alternative ETN VXX US 0.89% 2,847
iShares U.S. Real Estate ETF BlackRock Equity ETF IYR US 0.43% 2,731
SPDR Gold Shares State Street Commodity ETV GLD US 0.40% 2,688
iShares MSCI Brazil Capped ETF BlackRock Equity ETF EWZ US 0.62% 2,623
SPDR S&P Oil & Gas Exploration & Production ETF State Street Equity ETF XOP US 0.35% 2,519
Financial Select Sector SPDR Fund State Street Equity ETF XLF US 0.16% 2,396
Utilities Select Sector SPDR Fund State Street Equity ETF XLU US 0.16% 2,391
iShares Nasdaq Biotechnology ETF BlackRock Equity ETF IBB US 0.48% 2,369
Source: Deutsche Bank, Bloomberg Finance LP, FactSet
Figure 57: Top 20 ETPs by Weekly Turnover Change ($ Million) (Includes ETNs also)
ETP Name IssuerAsset Class
& StructureBBG Ticker TER
Turnover
Change
$ MM
SPDR S&P 500 ETF State Street Equity ETF SPY US 0.09% (20,803)
iShares Russell 2000 ETF BlackRock Equity ETF IWM US 0.24% (7,769)
iShares MSCI Emerging Markets ETF BlackRock Equity ETF EEM US 0.67% (4,314)
iPath S&P 500 VIX Short-Term Futures ETN Barclays Bank Alternative ETN VXX US 0.89% (2,370)
iShares China Large-Cap ETF BlackRock Equity ETF FXI US 0.74% (2,184)
Energy Select Sector SPDR Fund State Street Equity ETF XLE US 0.16% (1,876)
iShares MSCI EAFE ETF BlackRock Equity ETF EFA US 0.33% (1,507)
Financial Select Sector SPDR Fund State Street Equity ETF XLF US 0.16% (1,422)
PowerShares QQQ PowerShares Equity ETF QQQ US 0.20% 1,299
Market Vectors Russia ETF Van Eck Funds Equity ETF RSX US 0.63% (1,224)
VelocityShares Daily Inverse VIX Short-Term ETN Credit Suisse Alternative ETN XIV US 1.35% (1,191)
ProShares Ultra VIX Short-Term Futures ETF ProShares Alternative ETV UVXY US 0.95% (1,091)
db x-trackers MSCI EAFE Currency-Hedged Equity Fund Deutsche AWM Equity ETF DBEF US 0.35% (1,040)
iShares 1-3 Year Treasury Bond ETF BlackRock Fixed Income ETF SHY US 0.15% (981)
SPDR S&P Retail ETF State Street Equity ETF XRT US 0.35% (842)
Market Vectors Oil Services ETF Van Eck Funds Equity ETF OIH US 0.35% (813)
iShares Russell 1000 Growth ETF BlackRock Equity ETF IWF US 0.20% (766)
iShares Core MSCI EAFE ETF BlackRock Equity ETF IEFA US 0.14% (731)
United States Oil Fund LP United States Commodity Funds Commodity ETV USO US 0.45% (723)
SPDR Gold Shares State Street Commodity ETV GLD US 0.40% 716
Source: Deutsche Bank, Bloomberg Finance LP, FactSet
Page 26
27 April 2015
US ETF Weekly Research
Page 26 Deutsche Bank Securities Inc.
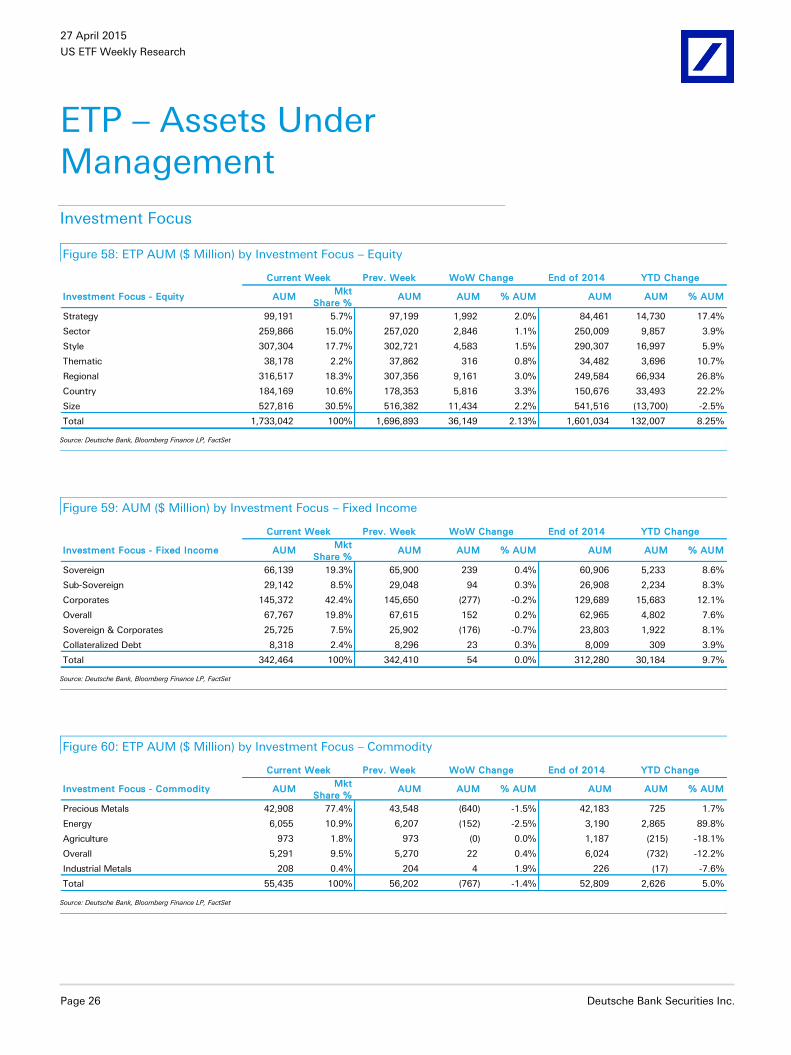
ETP – Assets Under Management
Investment Focus
Figure 58: ETP AUM ($ Million) by Investment Focus – Equity
Prev. Week End of 2014
Investment Focus - Equity AUMMkt
Share % AUM AUM % AUM AUM AUM % AUM
Strategy 99,191 5.7% 97,199 1,992 2.0% 84,461 14,730 17.4%
Sector 259,866 15.0% 257,020 2,846 1.1% 250,009 9,857 3.9%
Style 307,304 17.7% 302,721 4,583 1.5% 290,307 16,997 5.9%
Thematic 38,178 2.2% 37,862 316 0.8% 34,482 3,696 10.7%
Regional 316,517 18.3% 307,356 9,161 3.0% 249,584 66,934 26.8%
Country 184,169 10.6% 178,353 5,816 3.3% 150,676 33,493 22.2%
Size 527,816 30.5% 516,382 11,434 2.2% 541,516 (13,700) -2.5%
Total 1,733,042 100% 1,696,893 36,149 2.13% 1,601,034 132,007 8.25%
Current Week WoW Change YTD Change
Source: Deutsche Bank, Bloomberg Finance LP, FactSet
Figure 59: AUM ($ Million) by Investment Focus – Fixed Income
Prev. Week End of 2014
Investment Focus - Fixed Income AUMMkt
Share % AUM AUM % AUM AUM AUM % AUM
Sovereign 66,139 19.3% 65,900 239 0.4% 60,906 5,233 8.6%
Sub-Sovereign 29,142 8.5% 29,048 94 0.3% 26,908 2,234 8.3%
Corporates 145,372 42.4% 145,650 (277) -0.2% 129,689 15,683 12.1%
Overall 67,767 19.8% 67,615 152 0.2% 62,965 4,802 7.6%
Sovereign & Corporates 25,725 7.5% 25,902 (176) -0.7% 23,803 1,922 8.1%
Collateralized Debt 8,318 2.4% 8,296 23 0.3% 8,009 309 3.9%
Total 342,464 100% 342,410 54 0.0% 312,280 30,184 9.7%
Current Week WoW Change YTD Change
Source: Deutsche Bank, Bloomberg Finance LP, FactSet
Figure 60: ETP AUM ($ Million) by Investment Focus – Commodity
Prev. Week End of 2014
Investment Focus - Commodity AUMMkt
Share % AUM AUM % AUM AUM AUM % AUM
Precious Metals 42,908 77.4% 43,548 (640) -1.5% 42,183 725 1.7%
Energy 6,055 10.9% 6,207 (152) -2.5% 3,190 2,865 89.8%
Agriculture 973 1.8% 973 (0) 0.0% 1,187 (215) -18.1%
Overall 5,291 9.5% 5,270 22 0.4% 6,024 (732) -12.2%
Industrial Metals 208 0.4% 204 4 1.9% 226 (17) -7.6%
Total 55,435 100% 56,202 (767) -1.4% 52,809 2,626 5.0%
YTD ChangeCurrent Week WoW Change
Source: Deutsche Bank, Bloomberg Finance LP, FactSet
Page 27
27 April 2015
US ETF Weekly Research
Deutsche Bank Securities Inc. Page 27
Sub Segment
Figure 61: ETP AUM ($ Million) by Investment Focus Sub Segment – Equity
Prev. Week End of 2014
Investment Focus
Sub Segment - EquityAUM
Mkt
Share % AUM AUM % AUM AUM AUM % AUM
Country
US Broad 78,350 4.5% 75,167 3,183 4.2% 68,974 9,376 13.6%
Developed non-US 65,315 3.8% 63,418 1,897 3.0% 48,295 17,019 35.2%
Emerging Country 40,505 2.3% 39,769 736 1.8% 33,407 7,098 21.2%
Regional
Asia Pacific 12,567 0.7% 12,256 311 2.5% 9,433 3,134 33.2%
Emerging Markets 97,912 5.6% 95,380 2,532 2.7% 88,836 9,077 10.2%
Europe 57,191 3.3% 55,832 1,359 2.4% 32,277 24,915 77.2%
Global 13,677 0.8% 13,256 421 3.2% 13,919 (242) -1.7%
Global ex-US 135,170 7.8% 130,631 4,539 3.5% 105,119 30,051 28.6%
Sector
Global 9,017 0.5% 8,854 164 1.8% 7,542 1,475 19.6%
Global ex-US 9,912 0.6% 9,783 130 1.3% 8,609 1,303 15.1%
Other Sector 2,430 0.1% 2,370 60 2.5% 2,292 138 6.0%
US 238,507 13.8% 236,013 2,494 1.1% 231,565 6,942 3.0%
Size
Large Cap 381,070 22.0% 371,954 9,117 2.5% 408,333 (27,262) -6.7%
Mid Cap 71,498 4.1% 70,373 1,125 1.6% 63,680 7,818 12.3%
Small Cap 75,247 4.3% 74,055 1,192 1.6% 69,503 5,744 8.3%
Style
Growth 107,720 6.2% 105,653 2,067 2.0% 96,950 10,770 11.1%
Value 95,726 5.5% 94,623 1,103 1.2% 91,712 4,014 4.4%
Dividend 103,858 6.0% 102,444 1,414 1.4% 101,645 2,213 2.2%
Strategy
Short 2,596 0.1% 2,646 (50) -1.9% 2,641 (45) -1.7%
Leveraged 15,597 0.9% 15,253 344 2.3% 15,294 303 2.0%
Leveraged Short 4,862 0.3% 4,957 (96) -1.9% 4,625 237 5.1%
Quantitative 37,950 2.2% 36,912 1,037 2.8% 28,769 9,180 31.9%
Fundamental 34,723 2.0% 34,090 633 1.9% 30,269 4,454 14.7%
Active 3,464 0.2% 3,341 124 3.7% 2,863 601 21.0%
Thematic
Sustainability 3,690 0.2% 3,619 71 2.0% 3,455 236 6.8%
Commodities 21,200 1.2% 21,247 (47) -0.2% 20,071 1,129 5.6%
Other Theme 13,288 0.8% 12,996 293 2.3% 10,957 2,332 21.3%
Total 1,733,042 100% 1,696,893 36,149 2.1% 1,601,034 132,007 8.2%
Current Week WoW Change YTD Change
Source: Deutsche Bank, Bloomberg Finance LP, FactSet
Page 28
27 April 2015
US ETF Weekly Research
Page 28 Deutsche Bank Securities Inc.
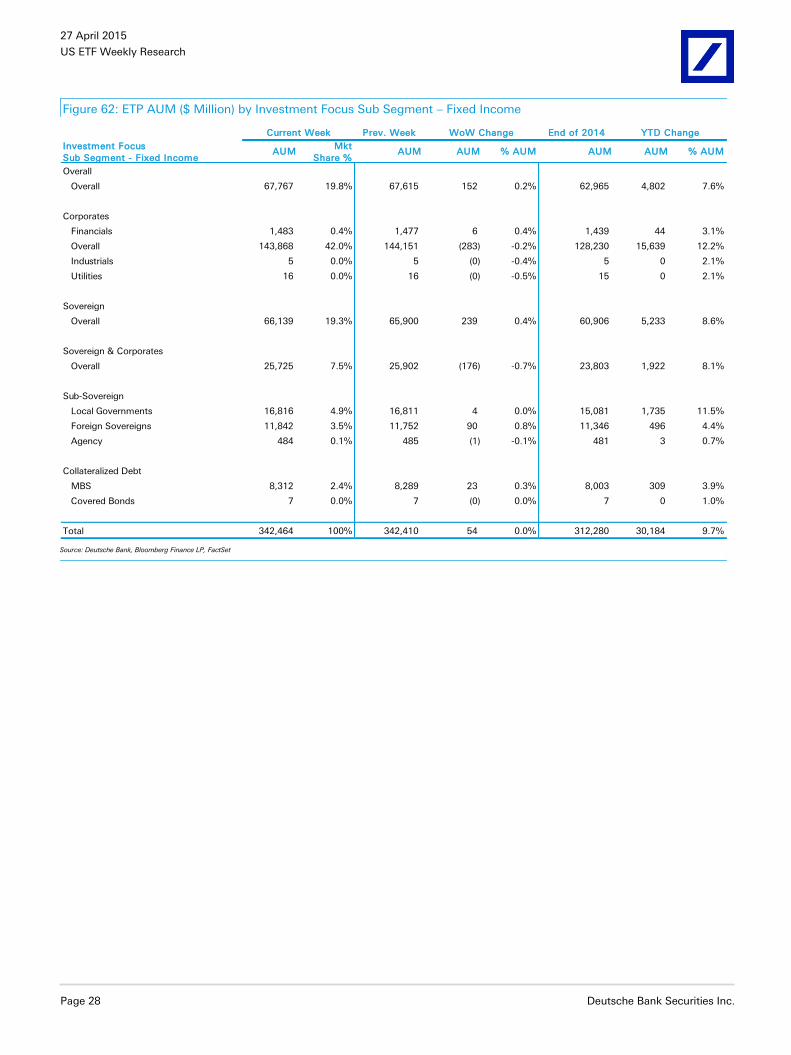
Figure 62: ETP AUM ($ Million) by Investment Focus Sub Segment – Fixed Income
Prev. Week End of 2014
Investment Focus
Sub Segment - Fixed IncomeAUM
Mkt
Share % AUM AUM % AUM AUM AUM % AUM
Overall
Overall 67,767 19.8% 67,615 152 0.2% 62,965 4,802 7.6%
Corporates
Financials 1,483 0.4% 1,477 6 0.4% 1,439 44 3.1%
Overall 143,868 42.0% 144,151 (283) -0.2% 128,230 15,639 12.2%
Industrials 5 0.0% 5 (0) -0.4% 5 0 2.1%
Utilities 16 0.0% 16 (0) -0.5% 15 0 2.1%
Sovereign
Overall 66,139 19.3% 65,900 239 0.4% 60,906 5,233 8.6%
Sovereign & Corporates
Overall 25,725 7.5% 25,902 (176) -0.7% 23,803 1,922 8.1%
Sub-Sovereign
Local Governments 16,816 4.9% 16,811 4 0.0% 15,081 1,735 11.5%
Foreign Sovereigns 11,842 3.5% 11,752 90 0.8% 11,346 496 4.4%
Agency 484 0.1% 485 (1) -0.1% 481 3 0.7%
Collateralized Debt
MBS 8,312 2.4% 8,289 23 0.3% 8,003 309 3.9%
Covered Bonds 7 0.0% 7 (0) 0.0% 7 0 1.0%
Total 342,464 100% 342,410 54 0.0% 312,280 30,184 9.7%
Current Week WoW Change YTD Change
Source: Deutsche Bank, Bloomberg Finance LP, FactSet
Page 29
27 April 2015
US ETF Weekly Research
Deutsche Bank Securities Inc. Page 29
Figure 63: ETP AUM ($ Million) by Investment Focus Sub Segment – Commodity
Prev. Week End of 2014
Investment Focus
Sub Segment - CommodityAUM
Mkt
Share % AUM AUM % AUM AUM AUM % AUM
Overall
Overall 5,291 9.5% 5,270 22 0.4% 6,024 (732) -12.2%
Agriculture
Overall 866 1.6% 864 3 0.3% 1,042 (176) -16.9%
Corn 74 0.1% 79 (5) -6.4% 109 (34) -31.5%
Soybean 6 0.0% 6 (0) 0.0% 12 (6) -47.0%
Energy
Overall 151 0.3% 148 3 2.1% 140 11 7.8%
Crude Oil 5,054 9.1% 5,197 (142) -2.7% 2,257 2,797 123.9%
Gasoline 102 0.2% 99 4 3.7% 41 62 151.8%
Heating Oil 6 0.0% 6 0 2.4% 3 3 85.0%
Natural Gas 740 1.3% 752 (12) -1.6% 748 (8) -1.1%
Industrial Metals
Overall 206 0.4% 203 4 1.9% 223 (16) -7.3%
Copper 2 0.0% 2 (0) -0.6% 3 (1) -35.1%
Precious Metals
Overall 294 0.5% 304 (10) -3.4% 413 (119) -28.8%
Gold 35,841 64.7% 36,322 (480) -1.3% 34,841 1,001 2.9%
Palladium 356 0.6% 358 (1) -0.4% 399 (43) -10.7%
Platinum 557 1.0% 585 (28) -4.7% 611 (53) -8.7%
Silver 5,859 10.6% 5,980 (120) -2.0% 5,920 (61) -1.0%
Total 55,434 100% 56,196 (762) -1.4% 52,809 2,625 5.0%
Current Week WoW Change YTD Change
Source: Deutsche Bank, Bloomberg Finance LP, FactSet
Page 30
27 April 2015
US ETF Weekly Research
Page 30 Deutsche Bank Securities Inc.
Issuer
Figure 64: ETP AUM ($ Million) by Issuer
Prev. Week End of 2014
Issuer AUMMkt
Share % AUM AUM % AUM AUM AUM % AUM
BlackRock 833,741 38.9% 821,441 12,300 1.5% 760,357 73,384 9.7%
Vanguard 477,465 22.3% 467,887 9,578 2.0% 426,665 50,801 11.9%
State Street 430,861 20.1% 425,066 5,795 1.4% 455,256 (24,394) -5.4%
PowerShares 101,199 4.7% 99,047 2,152 2.2% 96,764 4,435 4.6%
WisdomTree 61,314 2.9% 60,377 937 1.6% 39,280 22,034 56.1%
First Trust 41,212 1.9% 39,991 1,221 3.1% 33,202 8,010 24.1%
Charles Schwab 32,700 1.5% 31,906 795 2.5% 26,922 5,779 21.5%
Guggenheim Investments 31,620 1.5% 31,207 413 1.3% 28,403 3,217 11.3%
ProShares 25,508 1.2% 25,357 151 0.6% 25,059 449 1.8%
Van Eck Funds 23,531 1.1% 23,521 10 0.0% 20,461 3,070 15.0%
Deutsche AWM 16,961 0.8% 15,468 1,493 9.7% 4,402 12,559 285.3%
ALPS 11,938 0.6% 11,811 128 1.1% 11,480 458 4.0%
PIMCO 11,747 0.5% 11,725 23 0.2% 11,682 65 0.6%
FlexShares 8,864 0.4% 8,772 91 1.0% 8,389 475 5.7%
DirexionShares 8,830 0.4% 8,705 125 1.4% 8,090 740 9.1%
United States Commodity Funds 4,293 0.2% 4,429 (136) -3.1% 2,794 1,499 53.7%
Global X Funds 4,158 0.2% 4,033 125 3.1% 3,706 452 12.2%
Fidelity Investments 3,245 0.2% 3,173 72 2.3% 2,757 488 17.7%
Exchange Traded Concepts 2,531 0.1% 2,501 30 1.2% 2,171 360 16.6%
ETF Securities 2,344 0.1% 2,405 (62) -2.6% 2,532 (188) -7.4%
Emerging Global Shares 1,796 0.1% 1,781 14 0.8% 1,634 161 9.9%
Millington Securities 1,449 0.1% 1,424 25 1.7% 1,154 295 25.6%
IndexIQ Advisors 1,384 0.1% 1,381 3 0.2% 1,338 46 3.4%
AdvisorShares Trust 1,354 0.1% 1,338 17 1.3% 1,266 88 7.0%
Revenue Shares 1,099 0.1% 1,086 13 1.2% 948 151 15.9%
FactorShares 635 0.0% 559 76 13.6% 112 523 465.2%
Cambria Funds 444 0.0% 436 8 1.9% 354 91 25.6%
Highland Capital 323 0.0% 323 0 0.1% 312 11 3.4%
CSOP Asset Management 269 0.0% 280 (12) -4.2% - 269 n.a
GreenHaven Funds 251 0.0% 256 (5) -2.0% 267 (16) -5.8%
ArrowShares 241 0.0% 233 8 3.3% 155 86 55.5%
KraneShares 205 0.0% 185 20 10.7% 268 (63) -23.6%
Compass EMP 198 0.0% 190 8 4.3% 135 63 46.6%
JPMorgan 179 0.0% 170 9 5.2% 58 120 207.3%
VelocityShares 116 0.0% 114 2 1.8% 127 (11) -8.8%
Teucrium Trading 108 0.0% 111 (3) -2.9% 147 (39) -26.7%
Precidian 101 0.0% 98 2 2.1% 86 14 16.4%
Etfis Capital 98 0.0% 96 2 2.1% 12 86 702.6%
Lattice Strategies 83 0.0% 82 1 1.5% - 83 n.a
Horizons ETFs 82 0.0% 81 1 1.0% 41 41 98.5%
Empowered Funds 60 0.0% 58 2 3.4% 26 34 130.8%
Recon Capital 44 0.0% 35 9 25.3% 25 19 77.1%
Columbia Management 39 0.0% 38 1 1.6% 35 4 11.9%
ARK Investment Management 39 0.0% 36 3 8.3% 26 13 47.4%
Renaissance Capital 31 0.0% 31 0 1.5% 29 2 6.1%
Franklin Templeton Investments 30 0.0% 30 0 0.0% 27 3 9.2%
Calamos Investments 29 0.0% 29 1 2.5% 27 3 9.4%
AlphaMark Advisors 25 0.0% - 25 n.a - 25 n.a
Validea Capital Management 23 0.0% 22 0 1.7% 6 16 260.7%
Reality Shares 17 0.0% 16 1 8.0% 8 9 107.0%
QuantShares 16 0.0% 16 0 0.1% 9 7 73.8%
Huntington Strategy Shares 14 0.0% 14 0 1.4% 19 (4) -22.1%
LocalShares 12 0.0% 11 0 2.2% 9 2 24.5%
Innovator Management 10 0.0% 2 8 307.5% - 10 n.a
ETF Managers Capital 6 0.0% 6 0 0.0% - 6 n.a
Total 2,144,874 100.0% 2,109,394 35,480 1.7% 1,979,035 165,839 8.4%
YTD ChangeCurrent Week WoW Change
Source: Deutsche Bank, Bloomberg Finance LP, FactSet
Page 31
27 April 2015
US ETF Weekly Research
Deutsche Bank Securities Inc. Page 31
Index Provider
Underlying Index/Security
Figure 65: ETP AUM ($ Million) by Index Provider –
Equity (Top 10)
Figure 66: ETP AUM ($ Million) by Underlying Index –
Equity (Top 10)
0 200,000 400,000 600,000 800,000
Market Vectors
Morningstar
NYSE Euronext
WisdomTree
Nasdaq OMX
CRSP
Russell
FTSE
MSCI
S&P Dow Jones
AUM ($ Million)
- 100,000 200,000 300,000
MSCI US REIT
Russell 1000 Growth
Russell 2000
MSCI Emerging Markets
Nasdaq 100
S&P MidCap 400
FTSE Emerging
CRSP US Total Market
MSCI EAFE
S&P 500
AUM ($ Million)
Figure 67: ETP AUM ($ Million) by Index Provider – Fixed
Income
Figure 68: ETP AUM ($ Million) by Underlying Index –
Fixed Income
0 50,000 100,000 150,000 200,000 250,000
NYSE Euronext
FTSE
Wells Fargo
Deutsche Bank
J.P. Morgan
Accretive Asset Management
BofA Merrill Lynch
S&P Dow Jones
Markit iBoxx
Barclays
AUM ($ Million)
- 10,000 20,000 30,000
Barclays U.S. 1-5 Year Corporate
Barclays U.S. 1-3 Year Credit Bond
Barclays High Yield Very Liquid
S&P U.S. Preferred Stock
Barclays U.S. Treasury Inflation …
Barclays U.S. 1–5 Year …
Markit iBoxx USD Liquid High Yield
Markit iBoxx USD Liquid Investment Grade
Barclays US Aggregate Bond
Barclays U.S. Aggregate Float Adjusted
AUM ($ Million)
Figure 69: ETP AUM ($ Million) by Index Provider –
Commodity
Figure 70: ETP AUM ($ Million) by Underlying
Index/Security – Commodity
0 10,000 20,000 30,000 40,000 50,000
Bloomberg
Teucrium
Thomson Reuters
SummerHaven
S&P Dow Jones
Deutsche Bank
Commodity
AUM ($ Million)
- 10,000 20,000 30,000 40,000
Natural Gas Futures Contracts
Deutsche Bank Liquid Comm - Opt Yield …
S&P GSCI Total Return
Deutsche Bank Liquid Commodity Div …
London Gold Market Fixing Price/USD
Dow Jones - UBS Crude Oil Sub-Index
West Texas Intermediate Light
Deutsche Bank Liquid Commodity
Commodity - Silver
Commodity - Gold
AUM ($ Million)
Source: Deutsche Bank, Bloomberg Finance LP, FactSet
Page 32
27 April 2015
US ETF Weekly Research
Page 32 Deutsche Bank Securities Inc.
Top ETPs
Figure 71: Top 20 ETPs by AUM ($ Million) (Includes ETNs also)
ETP Name IssuerAsset Class
& StructureBBG Ticker TER
AUM
$ MM
SPDR S&P 500 ETF State Street Equity ETF SPY US 0.09% 182,947
iShares Core S&P 500 ETF BlackRock Equity ETF IVV US 0.07% 70,594
iShares MSCI EAFE ETF BlackRock Equity ETF EFA US 0.33% 60,624
Vanguard Total Stock Market ETF Vanguard Equity ETF VTI US 0.05% 58,281
Vanguard FTSE Emerging Markets ETF Vanguard Equity ETF VWO US 0.15% 50,643
PowerShares QQQ PowerShares Equity ETF QQQ US 0.20% 40,319
iShares MSCI Emerging Markets ETF BlackRock Equity ETF EEM US 0.67% 33,691
Vanguard S&P 500 ETF Vanguard Equity ETF VOO US 0.05% 31,875
iShares Russell 2000 ETF BlackRock Equity ETF IWM US 0.24% 29,727
iShares Russell 1000 Growth ETF BlackRock Equity ETF IWF US 0.20% 29,683
SPDR Gold Shares State Street Commodity ETV GLD US 0.40% 28,226
Vanguard REIT ETF Vanguard Equity ETF VNQ US 0.10% 28,030
Vanguard FTSE Developed Markets ETF Vanguard Equity ETF VEA US 0.10% 27,491
Vanguard Total Bond Market ETF Vanguard Fixed Income ETF BND US 0.08% 27,044
iShares Russell 1000 Value ETF BlackRock Equity ETF IWD US 0.21% 26,168
iShares Core S&P Mid-Cap ETF BlackRock Equity ETF IJH US 0.15% 26,000
iShares Core U.S. Aggregate Bond ETF BlackRock Fixed Income ETF AGG US 0.08% 24,276
iShares iBoxx $ Investment Grade Corporate Bond ETF BlackRock Fixed Income ETF LQD US 0.15% 22,656
Vanguard Dividend Appreciation ETF Vanguard Equity ETF VIG US 0.10% 20,793
WisdomTree Europe Hedged Equity Fund WisdomTree Equity ETF HEDJ US 0.58% 20,261
Source: Deutsche Bank, Bloomberg Finance LP, FactSet
Figure 72: Top 20 ETPs by AUM Change ($ Million) (Includes ETNs also)
ETP Name IssuerAsset Class
& StructureBBG Ticker TER
AUM
Change
$ MM
SPDR S&P 500 ETF State Street Equity ETF SPY US 0.09% 5,060
Vanguard Total Stock Market ETF Vanguard Equity ETF VTI US 0.05% 2,773
PowerShares QQQ PowerShares Equity ETF QQQ US 0.20% 1,499
db x-trackers MSCI EAFE Currency-Hedged Equity Fund Deutsche AWM Equity ETF DBEF US 0.35% 1,345
iShares Core S&P 500 ETF BlackRock Equity ETF IVV US 0.07% 1,324
iShares MSCI EAFE ETF BlackRock Equity ETF EFA US 0.33% 1,208
Vanguard FTSE Emerging Markets ETF Vanguard Equity ETF VWO US 0.15% 1,126
iShares MSCI Emerging Markets ETF BlackRock Equity ETF EEM US 0.67% 953
iShares MSCI Japan ETF BlackRock Equity ETF EWJ US 0.47% 864
Vanguard FTSE Developed Markets ETF Vanguard Equity ETF VEA US 0.10% 701
Vanguard S&P 500 ETF Vanguard Equity ETF VOO US 0.05% 671
iShares Russell 1000 Growth ETF BlackRock Equity ETF IWF US 0.20% 588
iShares Nasdaq Biotechnology ETF BlackRock Equity ETF IBB US 0.48% 515
Technology Select Sector SPDR Fund State Street Equity ETF XLK US 0.16% 498
WisdomTree Japan Hedged Equity Fund WisdomTree Equity ETF DXJ US 0.48% 433
Vanguard Growth ETF Vanguard Equity ETF VUG US 0.10% 385
iShares MSCI Taiwan ETF BlackRock Equity ETF EWT US 0.62% 379
iShares Core S&P Mid-Cap ETF BlackRock Equity ETF IJH US 0.15% 370
SPDR Gold Shares State Street Commodity ETV GLD US 0.40% (361)
Vanguard FTSE Europe ETF Vanguard Equity ETF VGK US 0.12% 349
Source: Deutsche Bank, Bloomberg Finance LP, FactSet
Page 33
27 April 2015
US ETF Weekly Research
Deutsche Bank Securities Inc. Page 33
Appendix A: How we define ETPs
Exchange-Traded Products (ETPs)
We define an exchange-traded product (ETP) as a secure (funded or collateralized)
open-ended delta-one exchange-traded equity or debt instrument with no embedded
optionality and market-wide appeal to investors. This includes exchange traded funds,
exchange-traded commodities (Europe) and exchange-traded vehicles (US).
The figure below provides a summary of our current coverage universe by region and
structure type as on 31 December 2014.
The vast majority of instruments are ETFs (97%, 3,906 products, $2,641bn) with the
remainder being ETCs (0.7%, 451 products, $20.4bn) in Europe and ETVs (2.1%, 70
products, $56.7bn) in the US.
Figure 73: ETP Coverage Universe Summary
Region Products US$ Mil. % Products US$ Mil. % Products US$ Mil. %
US 1,450 1,979,179 72.7% 1,380 1,922,462 70.6% 70 56,717 2.1%
Europe 1,869 459,225 16.9% 1,418 438,870 16.1% 451 20,355 0.7%
Asia Pacific 674 201,756 7.4% 659 201,354 7.4% 15 405 0.0%
RoW 454 81,059 3.0% 449 77,846 2.9% 5 3,213 0.1%
Global 4,447 2,721,220 100.0% 3,906 2,640,532 97.0% 541 80,691 3.0%
ETPs ETFs ETC/Vs
Source: Deutsche Bank, Bloomberg Finance LP, Reuters
Exchange-Traded Funds (ETFs, 97%)
US (71%): Fund structures that issue shares that are traded on an exchange much the
same way as equities. ETFs indexed to equity and fixed income benchmarks are
registered under the investment company act of 1940. Only physical index replication
techniques are permissible by this legislation while synthetic replication is not allowed.
Europe (16%): Fund structures that issue units or shares that are traded on an exchange
much the same way as equities. The vast majorities of European ETFs are UCITS III
compliant and are primarily domiciled in Dublin and Luxemburg. The Undertakings for
Collective Investment in Transferable Securities (UCITS) are a set of European Union
directives that aim to allow collective investment schemes to operate freely throughout
the EU on the basis of a single authorization from one member state. Both physical and
synthetic index replication is permissible by UCITS and funds are allowed to track
equity, fixed income as well as diversified commodity indices.
Asia (7%): Both European and US ETFs are cross sold into the Asian market.
Exchange-Traded Collateralized Instruments (3%)
Exchange-Traded Commodities (ETCs, 1%)
In Europe as UCITS III does not permit the creation of funds tracking non diversified
commodity indices (for example wheat or oil), exchange-traded products that track
single commodity profiles are issued under the EU Prospectus Directive in two
structures that have become widely known as exchange-traded commodities (ETCs).
ETCs can either be physically backed or they can be issued through a bankruptcy
remote special purpose vehicle (SPV). Both forms utilize offshore domiciles, such as
Jersey, and are classed as debt instruments. Physically-backed ETCs are fully backed
with securities that closely resemble the composition of a product’s benchmark index.
Page 34
27 April 2015
US ETF Weekly Research
Page 34 Deutsche Bank Securities Inc.
SPV structures are collateralized by assets that could bear no resemblance to those of
their respective benchmark index and replicate their index return through a total return
swap structure or by holding other derivative instruments such as futures. In the vast
majority of cases, both types of ETCs are fully collateralized with secure assets such as
money market instruments, government bonds and gold. For more information, please
refer to our research report issued on March 11 2010 titled ‘The race for assets in the
European Exchange-Traded Products Market”.
Exchange-traded vehicles (ETVs, 2%)
This terminology typically refers to grantor trusts that exist in the US market. These
instruments track primarily commodity benchmarks. They differ from ETFs in that they
are registered under the Securities Act of 1933 and not the Investment Company Act of
1940, hence they are not classed as funds. Vehicles that replicate commodity
benchmarks, more often known as pools, and funds targeting alternative index returns
are formed under the Commodities Exchange Act and are listed under the 33 Securities
Act, and report under 34 Corporate Act.
Page 35
27 April 2015
US ETF Weekly Research
Deutsche Bank Securities Inc. Page 35
The authors of this report wish to acknowledge the contribution made by
Alfonso Delgado Valdivia, an employee of Evalueserve, a third party provider to
Deutsche Bank of offshore research support services.
Page 36
27 April 2015
US ETF Weekly Research
Page 36 Deutsche Bank Securities Inc.
Appendix 1
Important Disclosures
Additional information available upon request
*Prices are current as of the end of the previous trading session unless otherwise indicated and are sourced from local exchanges via Reuters, Bloomberg and other vendors . Other information is sourced from Deutsche Bank, subject companies, and other sources. For disclosures pertaining to recommendations or estimates made on securities other than the primary subject of this research, please see the most recently published company report or visit our global disclosure look-up page on our website at http://gm.db.com/ger/disclosure/DisclosureDirectory.eqsr
Analyst Certification
The views expressed in this report accurately reflect the personal views of the undersigned lead analyst(s). In addition, the undersigned lead analyst(s) has not and will not receive any compensation for providing a specific recommendation or view in this report. Sebastian Mercado
Equity rating key Equity rating dispersion and banking relationships
Buy: Based on a current 12- month view of total share-holder return (TSR = percentage change in share price from current price to projected target price plus pro-jected dividend yield ) , we recommend that investors buy the stock. Sell: Based on a current 12-month view of total share-holder return, we recommend that investors sell the stock Hold: We take a neutral view on the stock 12-months out and, based on this time horizon, do not recommend either a Buy or Sell. Notes:
1. Newly issued research recommendations and target prices always supersede previously published research. 2. Ratings definitions prior to 27 January, 2007 were:
Buy: Expected total return (including dividends) of 10% or more over a 12-month period Hold: Expected total return (including dividends) between -10% and 10% over a 12-month period Sell: Expected total return (including dividends) of -10% or worse over a 12-month period
49 % 49 %
2 %
56 %40 %
28 %0
100
200
300
400
500
600
Buy Hold Sell
North American Universe
Companies Covered Cos. w/ Banking Relationship
Page 37
27 April 2015
US ETF Weekly Research
Deutsche Bank Securities Inc. Page 37
Regulatory Disclosures
1.Additional Information
Information on ETFs is provided strictly for illustrative purposes and should not be deemed an offer to sell or a
solicitation of an offer to buy shares of any fund that is described in this document. Consider carefully any fund's
investment objectives, risk factors, and charges and expenses before investing. This and other information can be found
in the fund's prospectus. Prospectuses about db X-trackers funds and Powershares DB funds can be obtained by calling
1-877-369-4617 or by visiting www.DBXUS.com. Read prospectuses carefully before investing. Past performance is not
necessarily indicative of future results. Investing involves risk, including possible loss of principal. To better understand
the similarities and differences between investments, including investment objectives, risks, fees and expenses, it is
important to read the products' prospectuses. Shares of ETFs may be sold throughout the day on an exchange through
any brokerage account. However, shares may only be redeemed directly from an ETF by authorized participants, in very
large creation/redemption units. Transactions in shares of ETFs will result in brokerage commissions and will generate
tax consequences. ETFs are obliged to distribute portfolio gains to shareholders. Deutsche Bank may be an issuer,
advisor, manager, distributor or administrator of, or provide other services to, an ETF included in this report, for which it
receives compensation. db X-trackers and Powershares DB funds are distributed by ALPS Distributors, Inc. The opinions
expressed are those of the authors and do not necessarily reflect the views of DB, ALPS or their affiliates.
Aside from within this report, important conflict disclosures can also be found at https://gm.db.com/equities under the
"Disclosures Lookup" and "Legal" tabs. Investors are strongly encouraged to review this information before investing.
2. Short-Term Trade Ideas
Deutsche Bank equity research analysts sometimes have shorter-term trade ideas (known as SOLAR ideas) that are
consistent or inconsistent with Deutsche Bank's existing longer term ratings. These trade ideas can be found at the
SOLAR link at http://gm.db.com.
Page 38
27 April 2015
US ETF Weekly Research
Page 38 Deutsche Bank Securities Inc.
Additional Information
The information and opinions in this report were prepared by Deutsche Bank AG or one of its affiliates (collectively
"Deutsche Bank"). Though the information herein is believed to be reliable and has been obtained from public sources
believed to be reliable, Deutsche Bank makes no representation as to its accuracy or completeness.
Deutsche Bank may consider this report in deciding to trade as principal. It may also engage in transactions, for its own
account or with customers, in a manner inconsistent with the views taken in this research report. Others within
Deutsche Bank, including strategists, sales staff and other analysts, may take views that are inconsistent with those
taken in this research report. Others within Deutsche Bank, including strategists, sales staff and other analysts, may take
views that are inconsistent with those taken in this report. Deutsche Bank issues a variety of research products,
including fundamental analysis, equity-linked analysis, quantitative analysis and trade ideas. Recommendations
contained in one type of communication may differ from recommendations contained in others, whether as a result of
differing time horizons, methodologies or otherwise.
Analysts are paid in part based on the profitability of Deutsche Bank AG and its affiliates, which includes investment
banking revenues.
Opinions, estimates and projections constitute the current judgment of the author as of the date of this report. They do
not necessarily reflect the opinions of Deutsche Bank and are subject to change without notice. Deutsche Bank has no
obligation to update, modify or amend this report or to otherwise notify a recipient thereof if any opinion, forecast or
estimate contained herein changes or subsequently becomes inaccurate. This report is provided for informational
purposes only. It is not an offer or a solicitation of an offer to buy or sell any financial instruments or to participate in any
particular trading strategy. Target prices are inherently imprecise and a product of the analyst’s judgment. The financial
instruments discussed in this report may not be suitable for all investors and investors must make their own informed
investment decisions. Prices and availability of financial instruments are subject to change without notice and
investment transactions can lead to losses as a result of price fluctuations and other factors. If a financial instrument is
denominated in a currency other than an investor's currency, a change in exchange rates may adversely affect the
investment. Past performance is not necessarily indicative of future results. Unless otherwise indicated, prices are
current as of the end of the previous trading session, and are sourced from local exchanges via Reuters, Bloomberg and
other vendors. Data is sourced from Deutsche Bank, subject companies, and in some cases, other parties.
Macroeconomic fluctuations often account for most of the risks associated with exposures to instruments that promise
to pay fixed or variable interest rates. For an investor who is long fixed rate instruments (thus receiving these cash
flows), increases in interest rates naturally lift the discount factors applied to the expected cash flows and thus cause a
loss. The longer the maturity of a certain cash flow and the higher the move in the discount factor, the higher will be the
loss. Upside surprises in inflation, fiscal funding needs, and FX depreciation rates are among the most common adverse
macroeconomic shocks to receivers. But counterparty exposure, issuer creditworthiness, client segmentation, regulation
(including changes in assets holding limits for different types of investors), changes in tax policies, currency
convertibility (which may constrain currency conversion, repatriation of profits and/or the liquidation of positions), and
settlement issues related to local clearing houses are also important risk factors to be considered. The sensitivity of fixed
income instruments to macroeconomic shocks may be mitigated by indexing the contracted cash flows to inflation, to
FX depreciation, or to specified interest rates – these are common in emerging markets. It is important to note that the
index fixings may -- by construction -- lag or mis-measure the actual move in the underlying variables they are intended
to track. The choice of the proper fixing (or metric) is particularly important in swaps markets, where floating coupon
rates (i.e., coupons indexed to a typically short-dated interest rate reference index) are exchanged for fixed coupons. It is
also important to acknowledge that funding in a currency that differs from the currency in which coupons are
denominated carries FX risk. Naturally, options on swaps (swaptions) also bear the risks typical to options in addition to
the risks related to rates movements.
Derivative transactions involve numerous risks including, among others, market, counterparty default and illiquidity risk.
The appropriateness or otherwise of these products for use by investors is dependent on the investors' own
circumstances including their tax position, their regulatory environment and the nature of their other assets and
Page 39
27 April 2015
US ETF Weekly Research
Deutsche Bank Securities Inc. Page 39
liabilities, and as such, investors should take expert legal and financial advice before entering into any transaction similar
to or inspired by the contents of this publication. The risk of loss in futures trading and options, foreign or domestic, can
be substantial. As a result of the high degree of leverage obtainable in futures and options trading, losses may be
incurred that are greater than the amount of funds initially deposited. Trading in options involves risk and is not suitable
for all investors. Prior to buying or selling an option investors must review the "Characteristics and Risks of Standardized
Options”, at http://www.optionsclearing.com/about/publications/character-risks.jsp. If you are unable to access the
website please contact your Deutsche Bank representative for a copy of this important document.
Participants in foreign exchange transactions may incur risks arising from several factors, including the following: ( i)
exchange rates can be volatile and are subject to large fluctuations; ( ii) the value of currencies may be affected by
numerous market factors, including world and national economic, political and regulatory events, events in equity and
debt markets and changes in interest rates; and (iii) currencies may be subject to devaluation or government imposed
exchange controls which could affect the value of the currency. Investors in securities such as ADRs, whose values are
affected by the currency of an underlying security, effectively assume currency risk.
Unless governing law provides otherwise, all transactions should be executed through the Deutsche Bank entity in the
investor's home jurisdiction.
United States: Approved and/or distributed by Deutsche Bank Securities Incorporated, a member of FINRA, NFA and
SIPC. Non-U.S. analysts may not be associated persons of Deutsche Bank Securities Incorporated and therefore may not
be subject to FINRA regulations concerning communications with subject company, public appearances and securities
held by the analysts.
Germany: Approved and/or distributed by Deutsche Bank AG, a joint stock corporation with limited liability incorporated
in the Federal Republic of Germany with its principal office in Frankfurt am Main. Deutsche Bank AG is authorized under
German Banking Law (competent authority: European Central Bank) and is subject to supervision by the European
Central Bank and by BaFin, Germany’s Federal Financial Supervisory Authority.
United Kingdom: Approved and/or distributed by Deutsche Bank AG acting through its London Branch at Winchester
House, 1 Great Winchester Street, London EC2N 2DB. Deutsche Bank AG in the United Kingdom is authorised by the
Prudential Regulation Authority and is subject to limited regulation by the Prudential Regulation Authority and Financial
Conduct Authority. Details about the extent of our authorisation and regulation are available on request.
Hong Kong: Distributed by Deutsche Bank AG, Hong Kong Branch.
Korea: Distributed by Deutsche Securities Korea Co.
South Africa: Deutsche Bank AG Johannesburg is incorporated in the Federal Republic of Germany (Branch Register
Number in South Africa: 1998/003298/10).
Singapore: by Deutsche Bank AG, Singapore Branch or Deutsche Securities Asia Limited, Singapore Branch (One Raffles
Quay #18-00 South Tower Singapore 048583, +65 6423 8001), which may be contacted in respect of any matters
arising from, or in connection with, this report. Where this report is issued or promulgated in Singapore to a person who
is not an accredited investor, expert investor or institutional investor (as defined in the applicable Singapore laws and
regulations), they accept legal responsibility to such person for its contents.
Japan: Approved and/or distributed by Deutsche Securities Inc.(DSI). Registration number - Registered as a financial
instruments dealer by the Head of the Kanto Local Finance Bureau (Kinsho) No. 117. Member of associations: JSDA,
Type II Financial Instruments Firms Association, The Financial Futures Association of Japan, and Japan Investment
Advisers Association. Commissions and risks involved in stock transactions - for stock transactions, we charge stock
commissions and consumption tax by multiplying the transaction amount by the commission rate agreed with each
customer. Stock transactions can lead to losses as a result of share price fluctuations and other factors. Transactions in
foreign stocks can lead to additional losses stemming from foreign exchange fluctuations. We may also charge
commissions and fees for certain categories of investment advice, products and services. Recommended investment
strategies, products and services carry the risk of losses to principal and other losses as a result of changes in market
and/or economic trends, and/or fluctuations in market value. Before deciding on the purchase of financial products
Page 40
27 April 2015
US ETF Weekly Research
Page 40 Deutsche Bank Securities Inc.
and/or services, customers should carefully read the relevant disclosures, prospectuses and other documentation.
"Moody's", "Standard & Poor's", and "Fitch" mentioned in this report are not registered credit rating agencies in Japan
unless Japan or "Nippon" is specifically designated in the name of the entity. Reports on Japanese listed companies not
written by analysts of DSI are written by Deutsche Bank Group's analysts with the coverage companies specified by DSI.
Some of the foreign securities stated on this report are not disclosed according to the Financial Instruments and
Exchange Law of Japan.
Malaysia: Deutsche Bank AG and/or its affiliate(s) may maintain positions in the securities referred to herein and may
from time to time offer those securities for purchase or may have an interest to purchase such securities. Deutsche Bank
may engage in transactions in a manner inconsistent with the views discussed herein.
Qatar: Deutsche Bank AG in the Qatar Financial Centre (registered no. 00032) is regulated by the Qatar Financial Centre
Regulatory Authority. Deutsche Bank AG - QFC Branch may only undertake the financial services activities that fall
within the scope of its existing QFCRA license. Principal place of business in the QFC: Qatar Financial Centre, Tower,
West Bay, Level 5, PO Box 14928, Doha, Qatar. This information has been distributed by Deutsche Bank AG. Related
financial products or services are only available to Business Customers, as defined by the Qatar Financial Centre
Regulatory Authority.
Russia: This information, interpretation and opinions submitted herein are not in the context of, and do not constitute,
any appraisal or evaluation activity requiring a license in the Russian Federation.
Kingdom of Saudi Arabia: Deutsche Securities Saudi Arabia LLC Company, (registered no. 07073-37) is regulated by the
Capital Market Authority. Deutsche Securities Saudi Arabia may only undertake the financial services activities that fall
within the scope of its existing CMA license. Principal place of business in Saudi Arabia: King Fahad Road, Al Olaya
District, P.O. Box 301809, Faisaliah Tower - 17th Floor, 11372 Riyadh, Saudi Arabia.
United Arab Emirates: Deutsche Bank AG in the Dubai International Financial Centre (registered no. 00045) is regulated
by the Dubai Financial Services Authority. Deutsche Bank AG - DIFC Branch may only undertake the financial services
activities that fall within the scope of its existing DFSA license. Principal place of business in the DIFC: Dubai
International Financial Centre, The Gate Village, Building 5, PO Box 504902, Dubai, U.A.E. This information has been
distributed by Deutsche Bank AG. Related financial products or services are only available to Professional Clients, as
defined by the Dubai Financial Services Authority.
Australia: Retail clients should obtain a copy of a Product Disclosure Statement (PDS) relating to any financial product
referred to in this report and consider the PDS before making any decision about whether to acquire the product. Please
refer to Australian specific research disclosures and related information at
https://australia.db.com/australia/content/research-information.html
Australia and New Zealand: This research, and any access to it, is intended only for "wholesale clients" within the
meaning of the Australian Corporations Act and New Zealand Financial Advisors Act respectively.
Additional information relative to securities, other financial products or issuers discussed in this report is available upon
request. This report may not be reproduced, distributed or published by any person for any purpose without Deutsche
Bank's prior written consent. Please cite source when quoting.
Copyright © 2015 Deutsche Bank AG
Page 41
David Folkerts-Landau Group Chief Economist
Member of the Group Executive Committee
Raj Hindocha Global Chief Operating Officer
Research
Marcel Cassard Global Head
FICC Research & Global Macro Economics
Richard Smith and Steve Pollard Co-Global Heads Equity Research
Michael Spencer Regional Head
Asia Pacific Research
Ralf Hoffmann Regional Head
Deutsche Bank Research, Germany
Andreas Neubauer Regional Head
Equity Research, Germany
Steve Pollard Regional Head
Americas Research
International Locations
Deutsche Bank AG
Deutsche Bank Place
Level 16
Corner of Hunter & Phillip Streets
Sydney, NSW 2000
Australia
Tel: (61) 2 8258 1234
Deutsche Bank AG
Große Gallusstraße 10-14
60272 Frankfurt am Main
Germany
Tel: (49) 69 910 00
Deutsche Bank AG
Filiale Hongkong
International Commerce Centre,
1 Austin Road West,Kowloon,
Hong Kong
Tel: (852) 2203 8888
Deutsche Securities Inc.
2-11-1 Nagatacho
Sanno Park Tower
Chiyoda-ku, Tokyo 100-6171
Japan
Tel: (81) 3 5156 6770
Deutsche Bank AG London
1 Great Winchester Street
London EC2N 2EQ
United Kingdom
Tel: (44) 20 7545 8000
Deutsche Bank Securities Inc.
60 Wall Street
New York, NY 10005
United States of America
Tel: (1) 212 250 2500