Gerard E. Welch, Ashlie B. McVetta, Mark A. Stevens, and Samuel A. Howard Glenn Research Center, Cleveland, Ohio Paul W. Giel ASRC Aerospace Corporation, Cleveland, Ohio Ali A. Ameri The Ohio State University, Columbus, Ohio Waiming To University of Toledo, Toledo, Ohio Gary J. Skoch and Douglas R. Thurman U. S. Army Research Laboratory, Glenn Research Center, Cleveland, Ohio Variable-Speed Power-Turbine Research at Glenn Research Center NASA/TM—2012-217605 July 2012
Transcript
Gerard E. Welch, Ashlie B. McVetta, Mark A. Stevens, and Samuel A. HowardGlenn Research Center, Cleveland, Ohio
Paul W. GielASRC Aerospace Corporation, Cleveland, Ohio
Ali A. AmeriThe Ohio State University, Columbus, Ohio
Waiming ToUniversity of Toledo, Toledo, Ohio
Gary J. Skoch and Douglas R. ThurmanU. S. Army Research Laboratory, Glenn Research Center, Cleveland, Ohio
Variable-Speed Power-Turbine Research at Glenn Research Center
NASA/TM—2012-217605
July 2012
NASA STI Program . . . in Profile
Since its founding, NASA has been dedicated to the advancement of aeronautics and space science. The NASA Scientific and Technical Information (STI) program plays a key part in helping NASA maintain this important role.
The NASA STI Program operates under the auspices of the Agency Chief Information Officer. It collects, organizes, provides for archiving, and disseminates NASA’s STI. The NASA STI program provides access to the NASA Aeronautics and Space Database and its public interface, the NASA Technical Reports Server, thus providing one of the largest collections of aeronautical and space science STI in the world. Results are published in both non-NASA channels and by NASA in the NASA STI Report Series, which includes the following report types: • TECHNICAL PUBLICATION. Reports of
completed research or a major significant phase of research that present the results of NASA programs and include extensive data or theoretical analysis. Includes compilations of significant scientific and technical data and information deemed to be of continuing reference value. NASA counterpart of peer-reviewed formal professional papers but has less stringent limitations on manuscript length and extent of graphic presentations.
• TECHNICAL MEMORANDUM. Scientific
and technical findings that are preliminary or of specialized interest, e.g., quick release reports, working papers, and bibliographies that contain minimal annotation. Does not contain extensive analysis.
• CONTRACTOR REPORT. Scientific and
technical findings by NASA-sponsored contractors and grantees.
• CONFERENCE PUBLICATION. Collected papers from scientific and technical conferences, symposia, seminars, or other meetings sponsored or cosponsored by NASA.
• SPECIAL PUBLICATION. Scientific,
technical, or historical information from NASA programs, projects, and missions, often concerned with subjects having substantial public interest.
• TECHNICAL TRANSLATION. English-
language translations of foreign scientific and technical material pertinent to NASA’s mission.
Specialized services also include creating custom thesauri, building customized databases, organizing and publishing research results.
For more information about the NASA STI program, see the following:
• Access the NASA STI program home page at http://www.sti.nasa.gov
• E-mail your question to [email protected] • Fax your question to the NASA STI
Information Desk at 443–757–5803 • Phone the NASA STI Information Desk at 443–757–5802 • Write to:
STI Information Desk NASA Center for AeroSpace Information 7115 Standard Drive Hanover, MD 21076–1320
Gerard E. Welch, Ashlie B. McVetta, Mark A. Stevens, and Samuel A. HowardGlenn Research Center, Cleveland, Ohio
Paul W. GielASRC Aerospace Corporation, Cleveland, Ohio
Ali A. AmeriThe Ohio State University, Columbus, Ohio
Waiming ToUniversity of Toledo, Toledo, Ohio
Gary J. Skoch and Douglas R. ThurmanU. S. Army Research Laboratory, Glenn Research Center, Cleveland, Ohio
Variable-Speed Power-Turbine Research at Glenn Research Center
NASA/TM—2012-217605
July 2012
National Aeronautics andSpace Administration
Glenn Research Center Cleveland, Ohio 44135
Prepared for the68th Annual Forum and Technology Display (Forum 67)sponsored by the American Helicopter Society (AHS)Fort Worth, Texas, May 1–3, 2012
Acknowledgments
This effort is conducted under the NASA Fundamental Aeronautics Program, Subsonic Rotary Wing Project. The authors thank M. Suchezky of Williams International, L.L.C. and A. Ford, M. Bloxham, S. Gegg, and E. Turner of Rolls-Royce North American Technologies and Rolls-Royce Corporation for their contributions, and insights shared, during the VSPT contracts referenced herein. Special thanks to R.J. Boyle (retired from NASA) and Dr. M.D. Hathaway (NASA) for their early contributions in setting the VSPT research vector. Thanks to C. Snyder (NASA) for providing LCTR concept-engine performance numbers.
Available from
NASA Center for Aerospace Information7115 Standard DriveHanover, MD 21076–1320
National Technical Information Service5301 Shawnee Road
Alexandria, VA 22312
Available electronically at http://www.sti.nasa.gov
Trade names and trademarks are used in this report for identification only. Their usage does not constitute an official endorsement, either expressed or implied, by the National Aeronautics and
Space Administration.
This work was sponsored by the Fundamental Aeronautics Program at the NASA Glenn Research Center.
Level of Review: This material has been technically reviewed by technical management.
This report contains preliminary findings, subject to revision as analysis proceeds.
NASA/TM—2012-217605 1
Variable-Speed Power-Turbine Research at Glenn Research Center
Gerard E. Welch, Ashlie B. McVetta, Mark A. Stevens, and Samuel A. Howard National Aeronautics and Space Administration
Glenn Research Center Cleveland, Ohio 44135
Paul W. Giel
ASRC Aerospace Corporation Cleveland, Ohio 44135
Ali A. Ameri
The Ohio State University Columbus, Ohio 43210
Waiming To
University of Toledo Toledo, Ohio 43606
Gary J. Skoch and Douglas R. Thurman
U.S. Army Research Laboratory Glenn Research Center Cleveland, Ohio 44135
Abstract
The main rotors of the NASA Large Civil Tilt-Rotor (LCTR) notional vehicle operate over a wide speed-range, from 100 percent at takeoff to 54 percent at cruise. The variable-speed power turbine (VSPT) offers one approach by which to effect this speed variation. VSPT aerodynamics challenges include high work factors at cruise, wide (40° to 60°) incidence-angle variations in blade and vane rows over the speed range, and operation at low Reynolds numbers. Rotordynamics challenges include potential responsiveness to shaft modes within the 50 percent VSPT speed-range. A research effort underway at NASA Glenn Research Center, intended to address these key aerodynamic and rotordynamic challenges, is described. Conceptual design and 3-D multi-stage RANS and URANS analyses, conducted internally and under contract, provide expected VSPT sizing, stage-count, performance and operability information, and maps for system studies. Initial steps toward experimental testing of incidence-tolerant blading in a transonic linear cascade are described, and progress toward development/improvement of a simula-tion capability for multistage turbines with low Reynolds number transitional flow is summarized. Preliminary ro-tordynamics analyses indicate that viable concept engines with 50 percent VSPT shaft-speed range. Assessments of potential paths toward VSPT component-level testing are summarized.
Nomenclature AN2 product of annulus area and shaft-speed squared
Cp 𝑝0,1−𝑝12𝜌𝑈
2 , local pressure coefficient
Cptot 𝑝0,1−𝑝0𝑝0,1−𝑝2
, local total-pressure coefficient cx axial chord h0 total specific enthalpy i, ides incidence, design incidence k turbulent kinetic energy kl laminar kinetic energy N power-turbine shaft speed N* N/N100%, fraction of 100 percent speed Nu Nusselt number PRTT overall total-pressure ratio p0, p total and static pressure Recx Reynolds number based on axial chord s blade pitch, or specific entropy T0 total temperature TRTT overall total-temperature ratio Tu turbulence intensity u (ux, uθ, ur), absolute velocity U blade speed at pitchline Xpk-pk vibration amplitude, peak-to-peak Z 𝑠
𝑐𝑥
𝜌𝑢𝑥(uθ,1−uθ,2)𝑝0,𝑟,1−𝑝2
, Zweifel loading parameter
α, β absolute and relative flow angles ηTT adiabatic efficiency (total-to-total) ρ density ψ ∆h0/U2, work factor ϕ ux/U, flow coefficient ω �̅�0,1−�̅�0,2
�̅�0,1−�̅�2, loss coefficient (area-averaged)
ω specific dissipation rate of turbulence
NASA/TM—2012-217605 2
Subscripts c corrected to standard day r relative conditions 1, 2 Blade-row inlet, blade-row exit 4.5 power turbine inlet
Introduction The vertical takeoff and landing (VTOL) and Mach 0.5
cruise capability of the NASA Large Civil Tilt-Rotor (LCTR, (Refs. 1 and 2) Figure 1) is envisaged to increase throughput in the national airspace (Refs. 1 and 3). A key challenge of the LCTR is the variation in main-rotor tip-speed from 650 ft/s (100 percent N*) at sea-level VTOL to 350 ft/s (54 percent N*) at 28 k-ft cruise as required to minimize mission fuel-burn. The variable-speed power-turbine (VSPT), driving the rotor through a fixed gear-ratio transmission, provides one approach for effecting this wide speed variation. The VSPT approach is used in the V-22 where the output speed of the AE1107 engine varies speed in the range 80 percent < N*
≤ 100 percent (Ref. 3). The LCTR mission evidently widens the operational speed range of the main rotor, drive system, and VSPT power-shaft (54 percent ≤ N*≤ 100 percent) considerably.
Key Technical Challenges The VSPT research effort at NASA Glenn Research Center
(GRC) is intended to address key aerodynamic and mechani-cal (rotordynamic) challenges of the VSPT. The aerodynamic challenges include attainment of high turbine efficiency at high work factor, management of loss levels over a large (60°) incidence variation in all blade rows associated with the shaft-speed change, and operation at low Reynolds numbers with attendant sensitivity of transitional flow (Ref. 4). The loss levels in the transitional flow fields of low-pressure turbines (LPTs) operating at cruise altitudes (with Re < 100 k) are known to be impacted strongly by wake-induced unsteadiness (Ref. 5) as well. The mechanical challenges are associated with the required avoidance or management of responsive shaft, blade, and casing modes at critical speeds within the operational speed range of the VSPT shaft (Ref. 6).
While the VSPT approach to speed change is the subject of this paper, the main-rotor speed variation could alternatively be accomplished by using a two-speed (reduction gear-ratio) transmission (Ref. 7) (shifting) with a fixed-speed power turbine. The turbine of the two-speed transmission option shares the aerodynamic challenges associated with low-Re number operation and the need to avoid residence at shaft critical speeds during the shift maneuvers (Ref. 8). The distinguishing turbine benefits of the two-speed shifting option are associated with the ability to run the power turbine, throughout the mission, at the higher shaft speed of takeoff (100 percent N*) with minimal incidence variation. Operation at the takeoff shaft-speed with design-intent air angles enables
Figure 1.—NASA Large Civil Tilt-Rotor notional vehicle (Ref. 1).
higher cruise and takeoff efficiency levels, achievable at lower design-point work factors, in lower weight, reduced stage-count turbine designs.
Research Approach The VSPT technical challenges have motivated a research
(Ref. 4) effort at GRC related to VSPT aerodynamics, ro-tordynamics, and component-level testing. These research activities were conducted internal to GRC and through contracted efforts with industry.
The aerodynamics research elements include: i. VSPT requirements and conceptual design. Execute con-
ceptual design of a VSPT to meet LCTR mission/engine requirements at the meanline level, to establish representative blade row performance levels and VSPT performance maps.
ii. Detailed design of incidence-tolerant blading. Conduct 3-D aero-design (computational) of incidence-tolerant rotor, vane, and EGV blade shapes using flow angles from the meanline analyses.
iii. Transonic cascade testing of 2-D sections. Test 2-D sections of the 3-D VSPT incidence-tolerant blading in GRC transonic linear cascade at LCTR-relevant Mach numbers, Reynolds numbers, incidence angle variations (>55°).
iv. Transition sub-model assessment/implementation. De-velop a validated 3-D unsteady RANS simulation capability for unsteady low-Re transitional flows in multistage VSPT blade rows.
The rotordynamics research element addresses mechanical
challenges associated with operation of a VSPT, with intent to identify potential constraints imposed on the aerodynamic design by mechanical issues associated with variable speed—for example, growth in shaft radius to meet torque capacity requirements and to manage responsiveness to shaft critical speeds (rotordynamics).
NASA/TM—2012-217605 3
Finally, the component test element is to assess potential in-house and external test vehicles for component level VSPT experimentation.
Content An overview of progress to-date on the research elements
outlined above is provided herein. The paper includes sections related to VSPT conceptual aerodynamic design and analysis, experimental testing of incidence-tolerant blading, computa-tional methods, rotordynamics, and an assessment of potential VSPT component test paths. A summary is provided at the conclusion of the paper.
VSPT Conceptual Aerodynamic Design and Analysis
The conceptual design and analysis of VSPTs for the LCTR mission was conducted by NASA and through NASA Re-search and Technologies for Aerospace Propulsion Systems (RTAPS) contracts with Williams Int., L.L.C. (Ref. 9) and Rolls-Royce North American Technologies (Refs. 10 and 11). The intent of the RTAPS efforts were to develop a conceptual design of the VSPT for the LCTR application to a level required to emerge the key technical challenges—both aerodynamic and rotordynamic—to identify research required to overcome these challenges, and to define a path forward, and the test-plan, for a VSPT component-level test.
NASA, Williams International (WI) (Ref. 9) and Rolls-Royce North American Technologies (RR-NAT) (Ref. 10) arrived at a 4-stage VSPT design to meet the LCTR mission and engine cycle provided by the NASA engine performance group. Rolls-Royce carried out a second effort using a higher mass-flow-rate, growth AE1107C engine cycle, which led to a 3.5-stage configuration (Ref. 11). In all studies, the VSPT requirements were met without the use of variable geometry.
The turbine requirements of the VSPT concept design effort are provided below, followed by key findings from each conceptual design and aerodynamic analysis efforts by NASA and industry.
VSPT Requirements The NASA LCTR notional vehicle (Figure 1) is envisaged
to be a 90 passenger aircraft with 100,000 lbf takeoff gross weight. There are two engines per nacelle (and main rotor), currently conceived to be of the 7500 shp-class level. Two key LCTR mission points are 2 k-ft takeoff/hover and 28 k-ft, Mach 0.5 cruise. At takeoff, the main rotor and VSPT operate at 100 percent N*, while at cruise the rotors and VSPT are slowed to 54 percent N*. The LTRC engine requirements were established with the NASA engine performance group (Ref. 12). The corresponding VSPT requirements for the key takeoff and cruise operating points are provided in Table I.
TABLE I.—VSPT REQUIREMENTS AT KEY FLIGHT POINTS OF LCTR MISSION (REF. 12)
Flight point Altitude
VSPT shaft-speed (N/N100%) Main-rotor tip-speed
Takeoff 2k-ft 100%
650 ft/s
Cruise 28 k-ft 54%
350 ft/s Power, shp 4593 2328 Mass flow rate, lbm/s 22.03 12.22 Specific power (Btu/lbm) 147 135 Inlet temperature (T0,4.5), R 2204 1812 Inlet pressure (p0,4.5), psia 58.0 26.76 PRTT 4.04 5.34 Corrected flow, lbm/s 11.51 12.54 Corrected speed (Nc/Nc,100%), % 102.3 60.8 Aft-stage unit-Re (in-1)* 70,000/in. 45,000/in.
*Based on static conditions at last stage rotor with exit relative Mach number of 0.7.
NASA Aerodynamic Design and Aero Analysis VSPT Conceptual Design
The NASA conceptual aero-design approach for a 4-stage VPST of the LCTR application was outlined earlier (Refs. 4 and 13). The design air-angles were set at the cruise operating condition (54 percent N*) where Reynolds numbers were lowest and work factors (∆h0/U2) were highest. Maximum vane and blade-row incidence levels were as high as negative 60° at takeoff (100 percent N*). The turbine flow path, number of stages, and design air angles were determined using F. Huber’s meanline design and off-design codes, which are constituents of the AFRL Turbine Design and Analysis System (TDAAS) (Ref. 14). The aerodynamic loading levels of the vanes (Zweifel coefficient) were set near unity so as to be consistent with operation with transitional flow (Ref. 15) and required incidence tolerance. The stage reaction levels were set near 0.45 and flow coefficients, ux/U, at cruise were set near unity. The stage work splits were based on trades between optimum efficiency and management of maximum turning per stage. The rotors were tip-shrouded and leakage flows were neglected. Huber’s off-design code (Ref. 14) (meanline) was used to assess off-design operation.
The design- (54 percent N*, cruise) and off-design (100 percent N*, takeoff) performance levels are spotted on the modified Smith Chart of Figure 2. AN2 levels, 47.7×10⁹ rpm2∙in2 at 15,000 rpm takeoff speed, were based on strength-of-materials for anticipated turbine materials at the operating conditions of the LCTR VSPT. The average work factors from industry conceptual designs (Refs. 9, 10, and 16) are shown as well. The impact of adding a stage, from 3-stages to 4-stages, on efficiency corresponding to design work factor is evident. The gained VSPT efficiency at the higher stage count would be expected to come at the cost of increased weight to the VSPT. The sensitivity of the LCTR to the turbine weight and efficiency makes the stage count selection a deep trade that will aim to optimize the VSPT efficiency and weight, for optimal life, cost, and fuel burn.
NASA/TM—2012-217605 4
Figure 2.—Modified Smith chart showing meanline predicted design-point
efficiency as a function of work factor for 3- and 4-stage VSPT meanline designs (Refs. 9, 10, 13, and 16) compared to Smith (Ref. 17) and Oates (Ref. 18) correlations and AMDCKO methodology (Refs. 19 to 21). Calculated performance levels at the off-design takeoff (100 percent N*) are also shown.
The off-design efficiency level, corresponding to takeoff
operation with strongly negative incidence (e.g., –60°) in all blade rows, is predicted (Figure 2) by meanline analyses (Refs. 4, 9, 10, 13, and 16) to be higher than that at design-point where work factor is highest (Refs. 4 and 13). The overall loss levels are lower at the reduced work factors and aerodynamic loading levels, Z, of takeoff. The profile loss component—associated with boundary-layer and shocks—at negative incidence is near that of the higher loaded design air angles (see Ref. 4) whereas the secondary-flows and leakage flows (3-D) predicted at the lower aerodynamic loading levels of off-design are substantially lower than at the on-design cruise condition. The impact of this counterintuitive efficiency increase as the turbine unloads biases the selected VSPT design speed toward the cruise speed (54 percent N*).
3-D Blading Design
The predicted loss levels at off-design are strongly dependent on the loss correlations in the meanline tool used (Refs. 9, 10, and 13). Therefore a 3-D CFD study of a representative embed-ded 1.5-stage (Rotor 1, Stator 2, and Rotor 2, Figure 3) of the 4-stage NASA VSPT was conducted to verify the efficiency versus speed trend of the meanline code held when 3-D flow structures (see Figure 3 and Figure 4) were present. The 3-D aero-design of the blading for the 1.5-stage (R1/S2/R2) of the present study was described in detail earlier (Ref. 13). R1 and R2 were shrouded, and leakage flows were neglected. With
Figure 3.—Computed contours of axial velocity and stream-
lines in R1 and R2 at the 100% N* off-design take-off point (reproduced from Ref. 22).
design air angles from the meanline design code, the AFRL Turbine Design and Analysis System (TDAAS (Ref. 14)) was used to design, optimize, and stack 2-D airfoil sections, at hub, midspan, and tip, into a 3-D blade geometry. The chordwise-location of maximum loading was influenced by the findings of Gier et al. (Ref. 15) concerning efficiency, Re-lapse, and sensitivity to incidence in low pressure turbines designed for
Figure 4.—Computed contours of entropy at the blade-row
exit planes from (a) LEO RANS/mixing-plane and (b) time-averaged, average-passage (TA/AP) URANS calculations at design point (54 percent N*, 28 k-ft cruise).
low-Re operation. The 2-D sections (provided in Ref. 13) were stacked on their center of gravity along a radial stacking axis. No dihedral was considered, though the benefits of 3-D aerodynamic design, in managing the secondary flow fields, is well documented (Ref. 5).
Efficiency/Speed Trend Verification
Using the embedded 1.5-stage geometry, 3-D RANS/mixing-plane computations were conducted using the NASA SWIFT (Ref. 22) code at the cruise (54 percent N*, 28 k-ft) and takeoff (100 percent N*, 2 k-ft) conditions. The meanline and 3-D simulations were found to agree in terms of the variation of efficiency with VSPT operating speed. Consistent with meanline analyses, the blade-row loss levels were generally found to be lower at the off-design conditions where, though operating with 40° to 60° of negative incidence, the blade rows are unloaded. An exception to this general trend of higher efficiency at off-design was found in Rotor 2, attributable to the impact of the 3-D pressure-side cove vortex. This finding may push future rotor airfoil designs toward thicker sections that admit less of a cove separation. En-hancement of the meanline secondary loss model for rotors at extreme negative incidence, to account for increased loss due to such 3-D structures, may be warranted as well.
The agreement between 3-D RANS computations and the meanline both corroborated the incidence correlation of the meanline code—with the exception of R2 deficiency noted above—and supported the conceptual design approach that established the design speed at the lowest operating shaft speed (54 percent N*, cruise). In practice, the specific VSPT design speed is expected to be strongly biased toward the cruise shaft-speed, and selected so as to minimize mission fuel burn.
Impact of Unsteadiness—URANS Simulations
The RANS/mixing-plane analysis (Ref. 13) was extended to 3-D unsteady RANS (URANS) in an effort to assess the influence of unsteadiness associated with blade-row interac-tion on the design- and off-design aerodynamic performance of a VSPT for the NASA LCTR (Ref. 23). The extension was motivated by the potential impact on VSPT performance of flow physics not accounted for in mixing-plane analyses: additional entropy production associated with the unsteady forcing of the vortical structures (e.g., the pressure-side cove R2 of Figure 3); spatiotemporally resolved loss production associated with wake transport and stretching (Ref. 24); transport of streamwise vorticity to/from blade rows and associated impact of vorticity associated with secondary flow field of one blade row on the instantaneous and time-mean flow fields of downstream blade rows (Ref. 25); and, the deterministic vortical forcing of transitional boundary-layers by wakes from upstream blade rows (Refs. 26 and 27). The computations of the RANS/mixing-plane study (Ref. 13) were repeated using the commercially available WAND and LEO grid and flow solvers (Ref. 28) in both RANS/mixing-plane and sector-periodic URANS mode. Results from the RANS/mixing-plane and time-averaged, average-passage (TA/AP) URANS results are provided in Figure 4 where the blade row exit contours of the solutions are compared at the cruise conditions.
R1exit
R2exit
S2exit
R1exit
R2exit
S2exit
NASA/TM—2012-217605 6
The agreement between the time-averaged/URANS and the RANS/mixing-plane solutions was excellent. The unsteadiness due to blade-row interaction was found to degrade work and efficiency levels in Rotor 2, which was most impacted by the upstream blade rows of the embedded R1/S2/R2 1.5-stage simulation. Quantification of the efficiency degradation (approximately 1 point) associated with unsteadiness, vis-à-vis comparison of efficiency predicted using the RANS/mixing-plane and sector-periodic URANS computations, was unfortu-nately rendered inconclusive by a mixing-plane issue encoun-tered (see Ref. 23). The trend of efficiency with changing VSPT shaft speed from the URANS simulation, from 54 percent N* (28 k-ft, cruise) to 100 percent N* (2 k-ft, takeoff), agreed with the corresponding trends from the two RANS/mixing-plane codes (SWIFT and LEO) and the meanline codes (Ref. 14) used for turbine design.
Williams International Aerodynamic Design and Analysis (Ref. 9)
VSPT Conceptual Design
In the Williams International (WI) RTAPS effort (Ref. 9), the shaft-speed at which to design the VSPT was determined through a sensitivity study of mission fuel burn versus the design speed. Turbine efficiencies were calculated using a meanline tool proprietary to WI with loss correlations rooted in
the open literature (consistent with AMDCKO (Refs. 19 to 21). The results are reproduced in Figure 5 where it was found that the minimum fuel burn was achieved when the design point was set at approximately 70 percent N* (as opposed to the 54 percent N* argued in the NASA work above). The trade between high and low flow coefficient ( Uux /=φ ) turbine designs—i.e., low/high turning versus high/low Mach numbers (Figure 5)—high and low work factor, ∆h0/U2, designs, and number of stages was also investigated. The conclusions were as follows (Ref. 9): i.) there was no compelling evidence found at the meanline level to support a preferred selection of flow coeffi-cient (Figure 5); ii.) of 3- and 4-stage designs, all 15000 rpm at 100 percent N*, a high work-factor (lower radius) 4-stage design was optimal in terms of mission fuel burn.
3-D Blading Design
A 3-D aero design was executed for the eight blade rows of the 4-stage VSPT, based on a meanline design at a 75 percent N* (Ref. 9). Three 2-D sections were stacked for each of the eight blade rows. The 3-D sections were created using a WI interactive design tool for blade geometry, structural analysis, 2-D aero, and 3-D stacking. Design iterations were analyzed in a 3-D multistage Euler/RANS/mixing-plane solver (VORTEX) in Euler mode, and final designs were assessed using 3-D RANS/mixing-plane with k−ω turbulence modeling in VORTEX.
Figure 5.—Mission fuel burn as a function of VSPT design speed, showing
insets for turbine designs at low and high flow coefficient (Ref. 9).
NASA/TM—2012-217605 7
The embedded third stage vane (S3) and blade (R3) blade were analyzed using the steady VORTEX flow solver to assess the impact of turbulence sub-model selection and blade thickness distributions. The shaft speed, N*, was varied at a fixed stage pressure ratio. Regarding blade thickness, the intuition is that larger radius leading edges (and resultant blade thicknesses) afford incidence-tolerance, which must the traded against higher loss levels associated with higher through-flow Mach numbers. The study examined whether a thin blade (lower Mach numbers) might improve turbine efficiency over a traditional WI blade design, or whether admittance of a pressure-side cove separations at off-design, and subsequent centrifuging in thinned rotor blades (cf. NASA Rotor 2 of Figure 3), would outweigh gains. The thinner blades were not found to offer overall benefit over traditional blade thickness (area) schedules (Ref. 9).
Assessment of Performance/Speed Trend
A key finding of the WI study is reproduced in Figure 6, where efficiency of a 1.5-stage (R2/S2/R3) embedded stage, computed using the 3-D RANS/mixing plane VORTEX solver is provided. The inlet conditions and pressure ratio of the embedded 1.5-stage of WI were held constant as speed was changed. The computed efficiency versus speed trend of the WI meanline tool and the 3-D computations are in qualitative agreement except that the roll-off in efficiency at negative incidence is more severe in the meanline than in the CFD. The
efficiency at cruise is again found (see Fig. 2) to be lower than that at takeoff (extreme off-design). This finding corroborates the embedded 1.5-stage results reported by NASA (Ref. 13 and 23), which are also plotted on Figure 6 The CFD results support the argument that the WI design-point speed (here 75 percent of takeoff speed) might optimally be further reduced, giving stronger bias to cruise operation.
Rolls-Royce North American Technologies Aerodynamic Design and Analysis
RR-NAT was awarded two NASA RTAPS contracts for an incidence-tolerant blade design effort (Ref. 10) and a VSPT study effort (Ref. 11) which paralleled the WI effort described above.
VSPT Conceptual Design
In the blade design contract (Ref. 10), meanline analyses were used to determine that a 4-stage turbine was preferred to meet the LCTR engine requirements for the NASA mission provided. The meanline analysis was influenced by lessons learned from RR-NAT work done under subcontract to Boeing in a separate NASA contract (Ref. 29) and an early NASA concept design (Ref. 4). The VSPT was tailored to maintain matched stage flow coefficients near unity, effectively keeping axial Mach numbers below 0.5 through the four stages and balancing the stage work factors.
Figure 6.—Variation of computed efficiency with speed for Williams Int. embedded
1.5-stage and NASA embedded 1.5-stage of 4-stage VSPTs for the LCTR mission.
Figure 7.—Computed midspan loss as a function of inlet
relative air angle for Rotor 2 of 4-stage VSPT for LCTR application (Ref. 11), showing VSPT incidence-tolerant blade as inset.
Incidence-Tolerant Blade Design (Ref. 10)
The second rotor (R2) of the RR-NAT 4-stage was selected as a representative embedded bladerow, both in terms of design turning and incidence range requirements between cruise and takeoff, for a 3-D blade design. Through-flow analysis was conducted using an RR-NAT axisymmetric streamline-curvature/radial-equilibrium solver. The 2-D streamline solution provided boundary conditions for subse-quent 3-D design of R2.
An incidence-tolerant midspan section was shape-optimized using the AIRFOILOPT code, which has been in use at RR-NAT (formerly Allison Engine Company) for decades. A generic blade was first optimized at the cruise (design angles). New optimized airfoils shapes were then obtained at discrete inlet flow angle increments between cruise and takeoff (hover), with axial Mach number held constant. After traverse the full range of incidence, the midspan section was re-optimized at the cruise (design) condition. The loss bucket for the midspan section is provided in Figure 7 with the takeoff (hover, β1 = –2°) and cruise (β1 = +40°) inlet angles noted. A 100 percent N* operating condition (β1 = –11°) corresponding to cruise altitudes is also noted. The coordinates of the final profile (inset in Figure 7) were delivered to NASA for subse-quent testing in the transonic linear cascade as described in the following section.
Hub, midspan, and tip-sections were radially stacked on their center of gravity and were analyzed using 3-D RANS
computations in ADPAC (Ref. 30) as an isolated bladerow. The computations were used to analyze the impact of altitude, turbine pressure ratio, and shaft-speed change. Consistent with the findings illustrated in Figure 6, Rotor 2 efficiency was found to increase by two points in moving from the cruise to takeoff operating condition (Ref. 11).
Experimental Testing of Incidence-Tolerant Blading
The GRC Transonic Turbine Blade Cascade (see Figure 8) has been used to obtain detailed flow and heat transfer data on a wide variety of turbine blade geometries. The tunnel opera-tional capabilities (see Figure 9) enable testing at relevant LPT relative Mach numbers (0.6 < M2 < 1) and inlet turbulence intensities (0.3 percent < Tu < 15 percent), over an order-of-magnitude range of Re, and wide range of inlet flow (and incidence) angle settings (–17° < β1 < +70°). The cascade has been used previously to acquire heat transfer data sets (Ref. 31). In the present effort, heat transfer rates have proven to be an effective marker for transitional flows of importance to VSPT blading.
E3 Tip-Section Tests Aerodynamic tests of a 2-D tip section of a NASA/GE
Energy Efficient Engine (E3) blade (Ref. 32) were performed as an initial step to get detailed code and model assessment data relevant to a VSPT. Midspan data were obtained 8.6 percent cx downstream of the blade trailing edge over three blade passages and include total pressure, Mach number, and flow angle. A five-hole pneumatic probe was used, following the methodology described elsewhere (Ref. 33). Sample total pressure data are shown in Figure 10 at +4.1° and +19.1° incidence angles. The incidence angle is defined based on a design-intent β1 = +29.7°. The design inlet Reynolds number is Recx,1 = 6.83 × 10⁵ and the design pressure ratio is 1.441 giving an isentropic exit Mach number of M2,i = 0.74. Other conditions were chosen to obtain as low a Reynolds number as possible within the operating envelope of the facility (Figure 9). The left side of each peak in Figure 10 corresponds to the pressure side of the wake while the right sides correspond to the suction sides. For i = +4.1°, the wake widths and depths grow with decreasing Reynolds number but all share the same linear suction surface profile. At a more highly loaded condition of i = +19°, the suction sides show significant thickening at lower Reynolds numbers, indicative of rapid boundary layer growth brought about by incipient separation. These effects are anticipated for VSPT blading as well, making this an appropriate test case for predictive model validation.
NASA/TM—2012-217605 9
Figure 8.—Schematic drawing of the GRC transonic linear cascade, recently
modified for testing incidence-tolerant blading for VSPT.
Figure 9.—GRC transonic linear cascade operating map defined by
flow boundaries, showing VSPT and previous heat transfer and aerodynamic test points.
NASA/TM—2012-217605 10
(a) +4.1° incidence
(b) +19.1° incidence
Figure 10.—Aero survey data acquired in the NASA transonic linear cascade at midspan of E3 blading at design pressure ratio and varying Reynolds number, for two inlet flow angles.
Incidence-Tolerant VSPT Blade Tests During the past year, the cascade facility (NASA CW-22)
was modified significantly to extend the range of flow angle setting so as to accommodate high negative incidence testing of relevance to VSPT blading. The tunnel was re-baselined using the E3 blading by repeating the test points at various inlet flow angles, including the positive incidence angles described in the previous section.
The midspan section of the incidence-tolerant VSPT rotor blading (Figure 7 inset) developed under the RTAPS contract with RR-NAT (Ref. 10) is currently being tested in the modified facility. Loss buckets of the type shown in Figure 7 are being generated for a parametric range of Reynolds numbers. Wake data were acquired 7.0 percent cx downstream of the VSPT blade trailing edge using a 5-hole probe. A 3-hole boundary-layer probe was used in the region below 4.2 percent of span from the endwall.
(a) Recx,2 = 0.212×10⁶, M2,i = 0.35
(b) Recx,2 = 2.120×10⁶, M2,i = 0.72
Figure 11.—Aero survey data acquired in the NASA transonic linear cascade at midspan of the RR-NAT designed VSPT blading at various Reynolds numbers, pressure ratios, and inlet flow angles.
Total pressure coefficient data are shown in Figure 11 at the
minimum and maximum Reynolds number conditions and over a wide range of inlet (and incidence) angles; β1 = +40.0° (i = +5.8°, cruise), β1 = –2.5° (i = –36.7°, takeoff), and β1 = –11.8° (i = –46.0°, max. incidence). The pressure surface is on the left side of the wakes while the suction surface is on the right. The data clearly show the effects of angle and flow condition on the pressure and suction surface wakes, again making this an appropriate test case for predictive model validation. Midspan data are being acquired at other inlet angles and flow conditions in order to give a more complete assessment of the losses. Full-span data (endwall to midspan) were also acquired at the lowest Reynolds numbers achievable at the design blade pressure ratio (M2 = 0.72) and at incidence-angles corresponding to the cruise (i = +5.8° design-point) and takeoff incidence levels (i = –36.7°).
NASA/TM—2012-217605 11
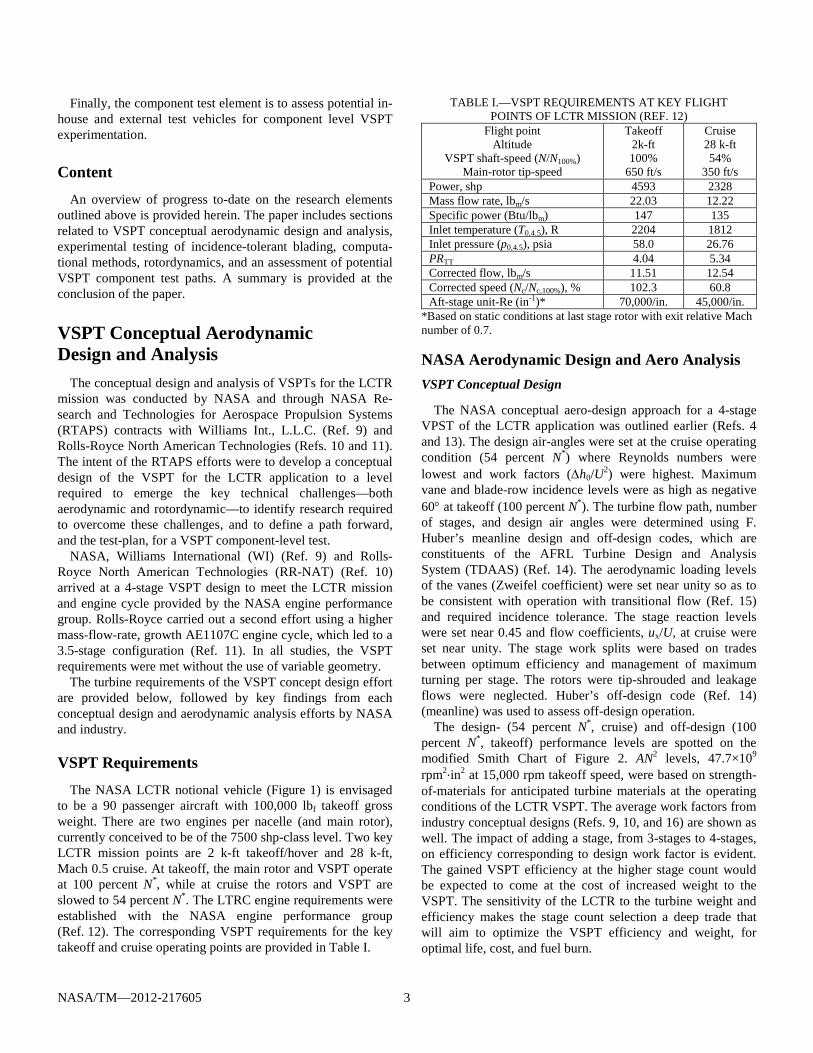
The incidence-tolerant VSPT blades were instrumented with static pressure taps to provide blade loading data to be corre-lated with the loss measurements. The majority of the pressure taps were located at midspan, but taps were also located at 10, 15, and 30 percent span. The center measurement blade was instrumented most densely, and the suction and pressure surfaces of adjacent blades were instrumented to verify periodicity. Sample blade loading data are shown in Figure 12 for two flow conditions. The loading diagram in Figure 12(b) shows a large cove separation region on the front portion of the pressure surface which leads to the thickening of the pressure surface wake shown in the wake measurements of Figure 11(a) at β1 = –11.8°. Conversely, the loading diagram in Figure 12(a) indicates attached flow everywhere, leading to the relatively narrow wakes shown in Figure 11(b). The loading measurements, when analyzed with the wake meas-urements, provide for a more complete interpretation of the effects of incidence and flow conditions.
Figure 12.—Static pressure blade loading from the incidence-tolerant VSPT blading at various Reynolds numbers, pressure ratios, and inlet flow angles.
Computational Methods The unit Reynolds numbers of the LCTR VSPT aft-stages
are near 50k/in. The low Reynolds number operation admits transitional flow fields with significant laminar regions which are subject to separation induced transition to turbulent flow. The transitional flow is sensitive to the deterministic buffeting of wakes from upstream blade rows (Refs. 5, 26, and 27). Thus, in addition to the difficulty of predicting 3-D transition-al flow fields computationally due to turbulence/transition sub-model limitations, the impact of unsteadiness must be included in accurate predictions of turbine performance. The large incidence swings of the VSPT add an additional compli-cation and degree of complexity to the problem as well. An internal effort (Ref. 34) to down-select and validate an accurate turbulence/transition model for RANS computations, and for subsequent implementation in an unsteady RANS (URANS) solver for multistage turbine calculations, is reported in this section.
Turbulence Model for Transitional Flow Fields Following a year-long investigation of various turbulence
modeling approaches suitable for LPT flow fields, the Walters and Leylek (Refs. 35 and 36) model was implemented in the NASA RANS code GlennHT (Ref. 37). The Walters-Leylek (W-L) model is a three-equation (k-ω-kl), model which accounts for the laminar kinetic energy, kl, portion of the total intensity of unsteadiness and its natural growth, admitting a mechanism for natural and bypass transition in the RANS sub-model. The model implementation and verification is described in detail elsewhere (Ref. 38). The new code capabil-ity was assessed by comparisons of 2-D heat transfer for textbook (Ref. 39) flat plate flow fields and with transition heat transfer data sets obtained from experiments in the NASA transonic linear cascade (Ref. 31). The wall heat transfer data sets were used because heat transfer rates (Nu) provide a strong blade-surface marker for transitional flows. Upon ensuring the satisfactory performance of the transition model for test cases, the flow solver with the improved transition model is used to compute the losses.
Steady-State Heat Transfer Assessments The results of 2-D and 3-D computations of blade heat
transfer and comparison with experimental data for the GE2 blade pack (Ref. 31) are shown in Figure 13 to Figure 15 (reproduced from Ref. 38). The GE2 blade is an extruded 2-D section of a high-turning (127°) power-turbine blade. The data were obtained in the GRC transonic tunnel at two Recx,2 while the pressure ratio (and M2) was held constant.
NASA/TM—2012-217605 12
Figure 13.—Two-dimensional computation of Nusselt number against data of Giel et al. (Ref. 31), at
Recx,2 = 375k.
Figure 14.—Two-dimensional computation of Nusselt number against data of Giel et al. (Ref. 31), at
Recx,2 = 621k.
Figure 15.—Three-dimensional computation of Nusselt number and comparison with data from Giel
et al. (Ref. 31), Recx,2 = 375k.
NASA/TM—2012-217605 13
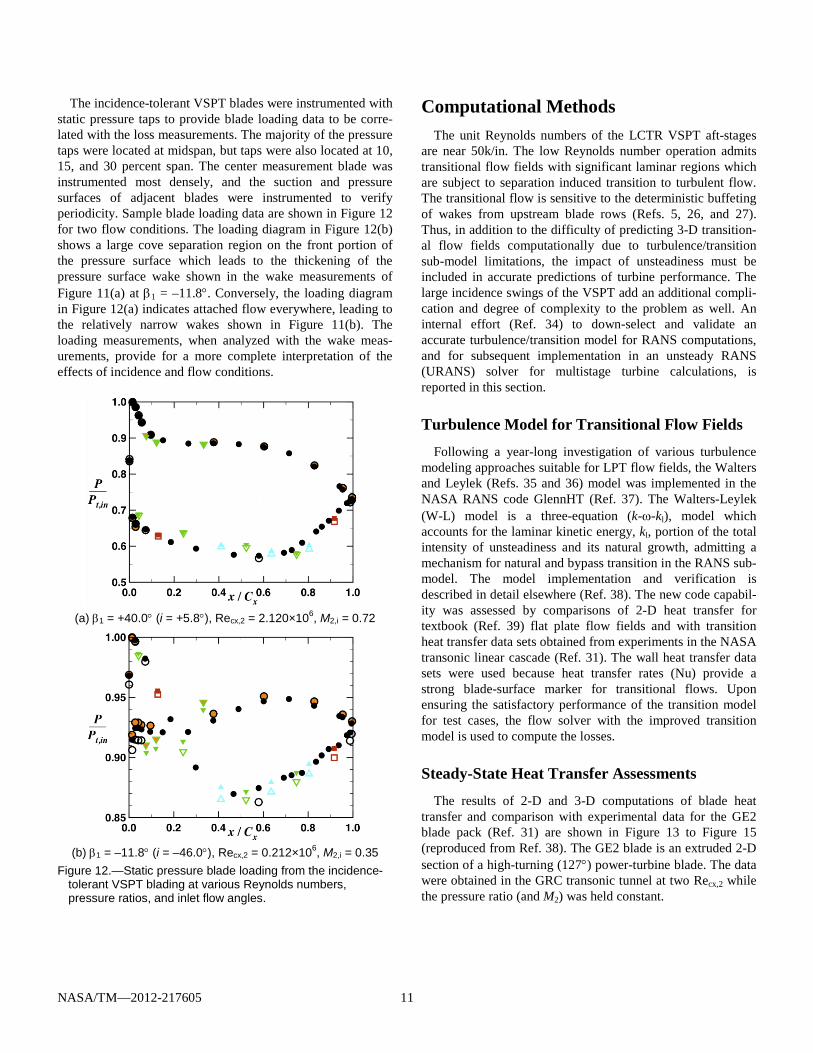
Figure 16.—Comparison of measured1 (symbols) and computed (curves) total-
pressure coefficients at inlet flow angles, α (in deg.), and corresponding incidence angles (parenthesis, in deg.) through VSPT-relevant range of –47° < i-ides < +20° for E3 tip-section blading (Recx,1 = 83k).
The computed heat transfer rates of the 2-D RANS/W-L
computation are in excellent agreement experimental data on the suction side, but heat transfer rates on the pressure-side are under-predicted. The root-cause for the disagreement on the pressure side has not yet been determined. It is noted that the cascade flow field is highly three-dimensional: the inlet boundary layer on each endwall is approximately 15 percent of span and the aspect ratio of the blade pack is less than unity; combined with the high turning of the GE2 cascade, the degree of agreement with 2-D calculations was unexpected.
The 3-D computations for the same cascade are provided in Figure 15. A comparison of the computational and experi-mental data indicates that the impact of the strong secondary-flow fields and associated high aerodynamic blockage levels may be overestimated by the simulation. The location of transition onset is, nonetheless, well predicted at the three spanwise measurement locations.1
Computations of Wake Profiles and Loss in Steady-State Cascade
The agreement for transition between CFD predictions and data from the GE2 cascade test is considered to be quite good. The GlennHT code with the W-L turbulence/transition model was further exercised to compute loss as a function of inci- 1The data were obtained by A. McVetta and P. Giel, 2011; to be published in AIAA Joint Propulsion Conference, July 2012.
dence for a cascade composed of E3 tip-section blading. Data were again obtained in the GRC transonic linear cascade as described in the previous section. Experimental data from exit surveys with 3-hole p0 probes were used for verification over a wide (detail) range of incidence angles, exit Mach numbers, and Reynolds numbers. Results for M2 = 0.34 and Recx,1 = 83k are provided here. For the computations, Tu = 1 percent and the inlet boundary layer thickness is 49 percent of half-span.
A comparison of computed and measured midspan total-pressure coefficients is provided in Figure 16. The total-pressures are acquired at an axial station 8.6 percent cx downstream of the trailing edge of the cascade. The incidence angle is defined based on a design-intent β1 = +29.7°. Inte-grated wake deficits (loss) are highest at the positive incidence angles. Interestingly, the agreement between CFD and data is best at extreme positive (most loaded) and negative (unloaded) flow angles; the disagreement in wake depths at the near-design inlet angle (β1 = +33.8°, i-ides = +4.1) is substantial and unexplained at this time.
Cross-passage contours of Cptot for incidence angles of ap-proximately –65°, –15°, +10° and +30° are shown in Figure 17 and iso-surfaces of Cptot are provide in Figure 18. The results in Figure 17 and Figure 18 were carried out at M2 = 0.35 and Recx,1 = 100 k. Note that only hub to the midspan symmetry plane is shown. The total-pressure deficits can be identified for each case. The highest loss regions are associated with the vortex cores. This is especially true at the higher positive incidence
NASA/TM—2012-217605 14
Figure 17.—Total-pressure loss contours (half-
span) of E3 tip-section blading from (clockwise from top-left) for approximate incidences of (a) –65°, (b) –15°, (c) +10°, and (d) +30° (from Ref. 38). Note contour scale change.
Figure 18.—Iso-surfaces of computed loss coefficient of E3 tip-
section blading over half-span for approximate incidence angles of a.) –65°, b.) –25°, c.) +10°, and d.) +30° (from Ref. 38).
angles at which loading and secondary flows are highest. Corresponding flow field structures are provided in Figure 18 in terms of iso-surfaces of total-pressure coefficient. The patterns of Cptot follow, for the most part, the vortical struc-tures highlighted by the iso-surfaces. The contour levels are chosen to illuminate the flow structures, and the iso-surfaces are colored by density to allow better visualization.
For Case (a) with extreme negative incidence, the largest loss near the endwall is due to the interaction of endwall
boundary layer and the merged horseshoe/passage vortex system, which stays near the endwall due to the unloading of the blades (Figure 17(a)). The mid-passage increase in loss for Case (a) is due to large flow separation on the pressure side (cove separation) which starts up as a spanwise vortex but turns into a streamwise vortex near midspan. For the other three cases, the midspan loss may be attributed to the suction side leg of horseshoe vortex. High loss is reflected as a bulge in the loss contours in the wake of Case (b). This is highlight-ed by the better formed local maxima for Cases (c) and (d), and is due to the combined effect of horseshoe and passage vortices. As the loading increases with the incidence, the magnitude and extent of the high loss region increases.
Integrated Results Using computed wake profiles at spanwise sections between
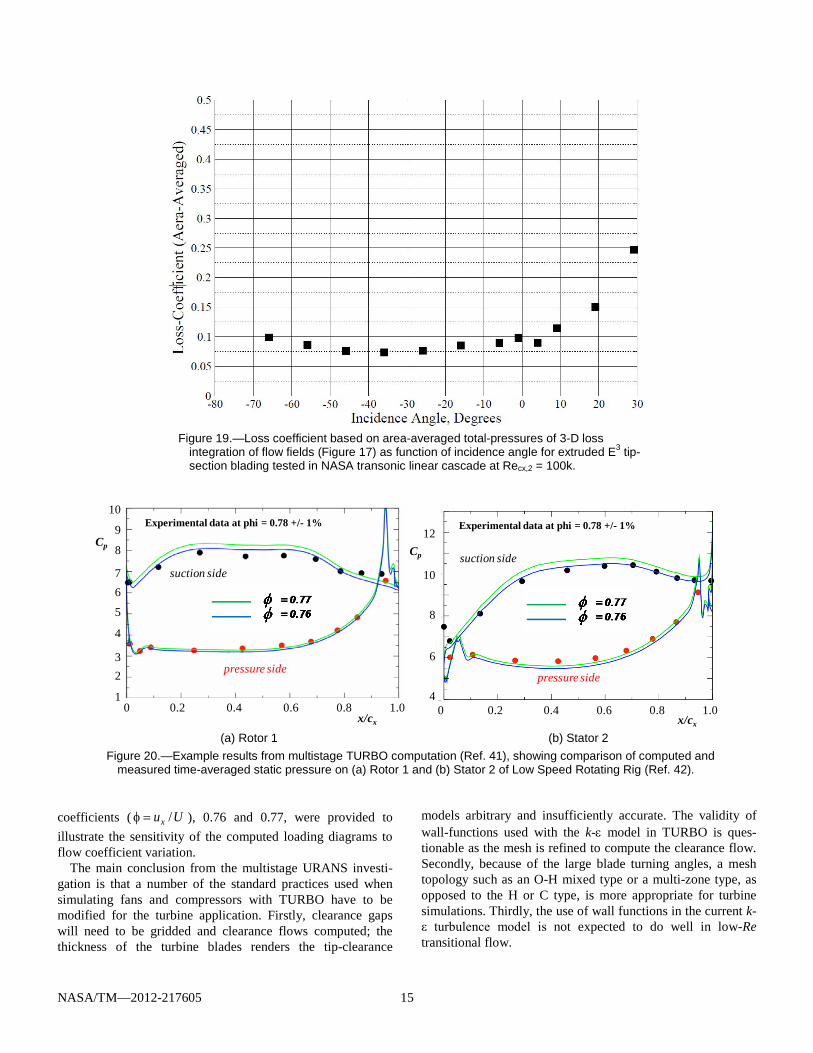
endwall and midspan, loss coefficients based on area-averaged total-pressures were calculated (Figure 19). The resulting loss bucket for the E3 tip-section blading has extensive (70°) range of incidence at design-point loss levels.
Multistage Turbine Simulations With intent to improve in-house multistage turbine simula-
tion capability, a NASA supported unsteady turbomachinery code, TURBO (Ref. 40), is currently under further develop-ment and evaluation in support of multistage simulation capability for VSPTs with transitional flow. The code im-provements were to be implemented in a two-part approach. Firstly, TURBO was to be run against documented multistage turbine geometry so that the mechanics of single-passage per bladerow, phase-lag simulations could be exercised and refined (Ref. 41). Secondly, the W-L turbulence/transition sub-model (Refs. 35 and 36) described above was to be implemented in the TURBO code. The model improvements are described in this section.
Application to Low-Speed Rotating Rig TURBO (Ref. 40) is a 3-D unsteady RANS (URANS) mul-
ti-blade-row, multi-block aero code; the code has been applied to-date primarily to compression systems. As reported earlier (Ref. 41), an assessment of code performance was conducted using the United Technologies Corporation (UTC) large scale rotating rig (LSRR) in 1.5-stage (S1/R1/S2) turbine configura-tion (Ref. 42). The multistage URANS computations were performed in single-passage per blade-row, phase-lag mode. The simulation details and related analysis are documented elsewhere (Ref. 41). Example time-averaged results are provided in Figure 20, where measured and computed time-averaged loading diagrams on Rotor 1 and Stator 2 of the LSRR are compared and were found to be in acceptable agreement (Ref. 41). Computed results for two flow
a. b.
c.d.
c. d.
b. a.
NASA/TM—2012-217605 15
Figure 19.—Loss coefficient based on area-averaged total-pressures of 3-D loss
integration of flow fields (Figure 17) as function of incidence angle for extruded E3 tip-section blading tested in NASA transonic linear cascade at Recx,2 = 100k.
(a) Rotor 1 (b) Stator 2
Figure 20.—Example results from multistage TURBO computation (Ref. 41), showing comparison of computed and measured time-averaged static pressure on (a) Rotor 1 and (b) Stator 2 of Low Speed Rotating Rig (Ref. 42).
coefficients ( Uux /=φ ), 0.76 and 0.77, were provided to illustrate the sensitivity of the computed loading diagrams to flow coefficient variation.
The main conclusion from the multistage URANS investi-gation is that a number of the standard practices used when simulating fans and compressors with TURBO have to be modified for the turbine application. Firstly, clearance gaps will need to be gridded and clearance flows computed; the thickness of the turbine blades renders the tip-clearance
models arbitrary and insufficiently accurate. The validity of wall-functions used with the k-ε model in TURBO is ques-tionable as the mesh is refined to compute the clearance flow. Secondly, because of the large blade turning angles, a mesh topology such as an O-H mixed type or a multi-zone type, as opposed to the H or C type, is more appropriate for turbine simulations. Thirdly, the use of wall functions in the current k-ε turbulence model is not expected to do well in low-Re transitional flow.
0 0.2 0.4 0.6 0.8 1.0x/cx
Experimental data at phi = 0.78 +/- 1%
Cp
23
5
10
suction side
pressure side
1
4
67
8
9
0 0.2 0.4 0.6 0.8 1.0x/cx
Experimental data at phi = 0.78 +/- 1%
Cp
4
6
8
10
12
suction side
pressure side
NASA/TM—2012-217605 16
Implementation of Walters-Leylek Model in TURBO
The 3-equation W-L turbulence/transitional-flow model (Refs. 35 and 36) described above was implemented in TURBO and is being evaluated currently against heat transfer data from the linear cascade experiments with GE2 blading (Ref. 31) in which the Reynolds numbers are sufficiently low to admit transitional flow. As in the GlennHT implementation described in the previous section, integration to the wall, without the use of wall functions permitted (and warranted) with the W-L model, and therefore the y+ ~ 1 or less at the first point from the wall in future URANS computations.
Rotordynamics At the initiation of the VSPT research effort, there existed
uncertainty about the feasibility of the concept related to the rotordynamic behavior of a multiple-rotor engine operating over a wide speed range (54 to 100 percent of takeoff speed). The source of uncertainty was related to the ability to manage rotor vibration response at operating speeds, and while traversing critical speeds during ramp-up/ramp-down. A rotordynamic feasibility analysis was launched in order to assess the impact of the variable speed concept on an engine in the 7500 shp-class suited for the NASA LCTR. The study (Ref. 6), summarized in this section, was focused on rotor natural frequencies (critical speeds), stability, and steady-state unbalance response of the concept engine with intent to determine the plausibility of the VSPT concept in this size class.
NASA Assessment of Rotordynamics A rotordynamic model of the notional engine was devel-
oped using geometry from a concept engine (Ref. 43) devel-oped for NASA’s Large Civil Tilt Rotor (LCTR2) concept vehicle. The front-drive engine model consists of three rotors: a high-speed (33,000 rpm) high-pressure compressor rotor (HP), a moderate-speed (27,500 rpm) low-pressure compres-sor rotor (LP), and a lower speed (8,100 to 15,000 rpm) VSPT rotor. The size and mass of the various stages, and the overall layout of the engine, were taken from the system study analysis for the engine (Ref. 43).
The rotordynamic model was developed in a commercially available rotordynamics software package that uses a finite element-based, 1-D (axisymmetric), lumped-parameter method to simulate the geometry. A schematic of the three rotor model of the notional engine is provided in Figure 21. A detailed analysis of the feasibility of the concept engine is provided elsewhere (Ref. 6), and a summary of the analyses and findings is given here.
Critical Speed Analysis
An important aspect of any rotating system is the existences of natural frequencies of the rotating structure that can be excited by various sources and potentially lead to failure. Traditionally, aero engines have been designed with relatively fixed-speed power turbine rotors during nominal operation. These rotor systems need to accelerate up to nominal speed, so clearly natural frequencies must be understood; nonetheless, the narrow operational speed range of the typical rotorcraft PT shaft eases the difficulty with which critical speeds can be avoided during steady-state operation. The addition of varia-ble-speed capability in the power turbine complicates the avoidance of natural frequencies in the operating speed range. The larger the operating speed range, the more rotor modes are spanned and may need to be avoided.
For the current VSPT research effort, the rotordynamic model (Figure 21) was exercised to iterate towards a design that eliminated critical speeds from the operating speed range of the PT rotor. In addition, the critical speeds of the LP and HP rotors were calculated to quantify the margin between the critical speed frequencies and the running speed of the respective rotor. No iteration was done on the LP or HP rotors, but the response of the HP and LP rotors could be refined as warranted during detailed design.
A Campbell Diagram for the rotordynamics of the three spools of the notional LCTR engine is provided in Figure 22. The natural frequencies/modes of the three rotors are plotted as a function of rotor speed. The first-engine-order (1EO) line is denoted 1X and represents a synchronous excitation (usually unbalance). The diagram can be used to identify the speeds at which an excitation force—in this case the synchro-nous unbalance force—coexists with the natural frequencies of the various rotors. The intersections of the 1X line with the natural frequencies define the critical speeds or “crossings.” To ensure robust mechanical design, the 1X crossings within the VSPT shaft operating range were avoided; as indicated in Figure 22, there are no 1EO intersections in the power turbine operating range, or near the LP rotor and HP rotor design points.
In order to achieve the desired critical speed behavior, sev-eral iterations on the PT rotor design were required. Addition-al optimization is possible, but may require modifications to the geometry of the LP and HP rotors, and is left to detailed design. In more detailed efforts, higher engine-order crossings may need to be considered as well, as well variations in HP- and LP-shaft speeds over the mission. Nonetheless, feasibility from the standpoint of critical speeds was demonstrated by the preliminary level analysis (Ref. 6).
NASA/TM—2012-217605 17
Figure 21.—Rotordynamic model of 3-spool, front drive concept engine for
NASA LCTR application.
Figure 22.—Campbell Diagram for three rotors of the LCTR concept engine.
NASA/TM—2012-217605 18
Stability Analysis
Stability is an important consideration in aero-engines in which relatively lightweight rotors, spin at relatively high speeds and power, with relatively low damping. This combina-tion of factors can result in an unsafe system susceptible to instability within the operating range. For the conceptual LCTR2 engine, stability could not be analyzed rigorously because the details of the bearings, bearing supports, and housing are unknown; nonetheless, to estimate susceptibility of the design to instability, a simplified stability assessment was undertaken. An artificial amount of damping is added to each bearing support. The amount of damping was incrementally increased at each bearing location until all three rotors of the engine were stable up to their respective maximum operating speeds. In this manner, rather than assessing whether the system was stable with a known amount of damping, the amount of damping needed to achieve stability was determined. Since the required levels of damping were found to be consistent with those of similar applications, stability of the conceptual design was deemed achievable. A detailed description of the stability analysis is provided in Reference 6.
Unbalance Response
Unbalance response sets the rotor balance requirements to ensure that rotor system displacements remain within allowa-ble limits, both at full-speed steady-state operation and during resonance crossings during speed-up and speed-down events. While passing through resonances, the amplitude of motion at the rotor components must not exceed the transient clearances or rubs will occur. Additionally, industry standards for acceptable vibration amplitudes at operating speed must be met, and bearing reaction forces while traversing resonances must be assessed.
To assess the viability of the current conceptual design, a typical new-machine unbalance specification was applied to the rotordynamic model, and the response was calculated over the speed range for each rotor and compared to the accepted industry standard (Ref. 44). The resulting peak-to-peak displacement amplitudes (Xpk-pk) calculated for the PT rotor at low and high speeds, and the industry specification are provided in Table II. Since the unbalance response amplitude was found to be less than the standard allowable displace-ments, this design is considered to be viable from the stand-point of balance considerations. Details of the unbalance response analysis are provided in Reference 6.
TABLE II.—VIBRATION AMPLITUDE FOR
VSPT OF LCTR CONCEPT ENGINE Speed,
rpm Xpk-pk at front
bearing location, mm
Xpk-pk at rear bearing location,
mm
Allowable pk-pk amplitude,
mm 8100 5.08×10⁻⁴ 8.89×10⁻³ 2.11×10⁻²
15000 3.81×10⁻³ 8.64×10⁻³ 1.13×10⁻²
Industry Assessments of Rotordynamics of LCTR Engines
RR-NAT Assessment In the NASA RTAPS study contract by RR-NAT (Ref. 11),
a growth version of an existing front-drive two-spool AE1107C engine was modified to meet the LCTR require-ments. A third stage was added to the VSPT to extend the operational speed-range of the turbine. A revised model of the AE1107C was created for use in the rotordynamics analysis. Subsequently modifications were made to the VSPT concept engine, including PT shaft thickening and modifications to the aft PT bearing placement, and the shaft attachment (from PT disk 1 to 2) in an effort to modify the response and frequency placement of potential responsive modes. The predicted bearing loads for a 1-mm out-of-balance (imbalance response analysis) for the AE1107C baseline and the modified 3-stage VSPT variants, HP and PT rotors, were compared. The bearing loads of the two engine configurations were in close agreement; RR-NAT concluded that the modified AE1107C engine configuration with incorporated VSPT technology is rotordynamically viable (Ref. 11).
Williams International Assessment
An aft-drive engine configuration concept was proposed by WI for the LCTR mission. The VSPT shaft emanates from the aft of the engine, as in the P&WC PT6 turboprop engine, to drive a transmission of fixed reduction gear-ratio. An ad-vantage of this approach is a shorter shaft, relative to shafts of the more common front-drive engine configurations, which could strongly reduce torque and rotordynamics issues. The configuration holds potential engine protection advantages as well. Disadvantages are associated with the need to turn the ambient intake and hot exhaust streams by 180°. The WI analysis was not carried out to a level of detail required to assess the placement of critical modes of the concept engine, however the implication is that the aft-drive configuration offers flexibility in terms of the shaft diameter selection and configuration to achieve required critical speed margins (Ref. 9).
Summary of Rotordynamic Assessments The conclusion from the NASA in-house and engine com-
pany studies is that rotordynamically viable mechanical designs for the VSPT of the LCTR class engine are achieva-ble. The more common front-drive system of the 7500 shp-class engine will likely operate with a supercritical rotor in which VSPT shaft criticals are within the VSPT shaft-speed range. Related rotor-rotor interactions will need to be avoided by mode placement away from steady-state operating points, and responses during transient crossings managed by incorpo-ration of suitable damping levels and shaft thicknesses. The
NASA/TM—2012-217605 19
aft-drive configuration may admit a subcritical VSPT-shaft solution in which all VSPT-shaft modes are above the engine running range.2 If a subcritical configuration (short, large diameter shaft) were achievable, and the aft-drive configura-tion proves compatible with aerodynamic, heat load, and packaging constraints, the approach would eliminate VSPT criticals and interactions with other rotor modes within the VSPT running range.
VSPT Component Testing Potential at GRC
The results from an assessment of potential paths to compo-nent VSPT component in-house testing at GRC, informed by findings from the VSPT study contracts with RR-NAT (Ref. 11) and WI (Ref. 9), are summarized in this section.
Two in-house approaches to VSPT component testing were considered (Ref. 45): i.) experimental testing would be conducted in an existing power turbine of a T700 engine located in the GRC Engine Components Research Laboratory (ECRL); or, ii.) a new VSPT component rig would be installed in the new single-spool turbine test facility (W-6) at GRC. The objective of the assessment study was to determine the level of compatibility that exists between each research facility and the
2Note that the analysis and discussion provided in the Wil-liams Int. study contract neither supported nor refuted the supposition that a subcritical VSPT shaft may be enabled by the aft-drive configuration.
VSPT component research needs. Preliminary research requirements were defined and the experimental assets available in each facility were examined to determine which approach would provide a greater return on the time and funds to be invested in VSPT experimentation.
Instrumented T700 PT in ECRL The Engine Component Research Laboratory (ECRL) of
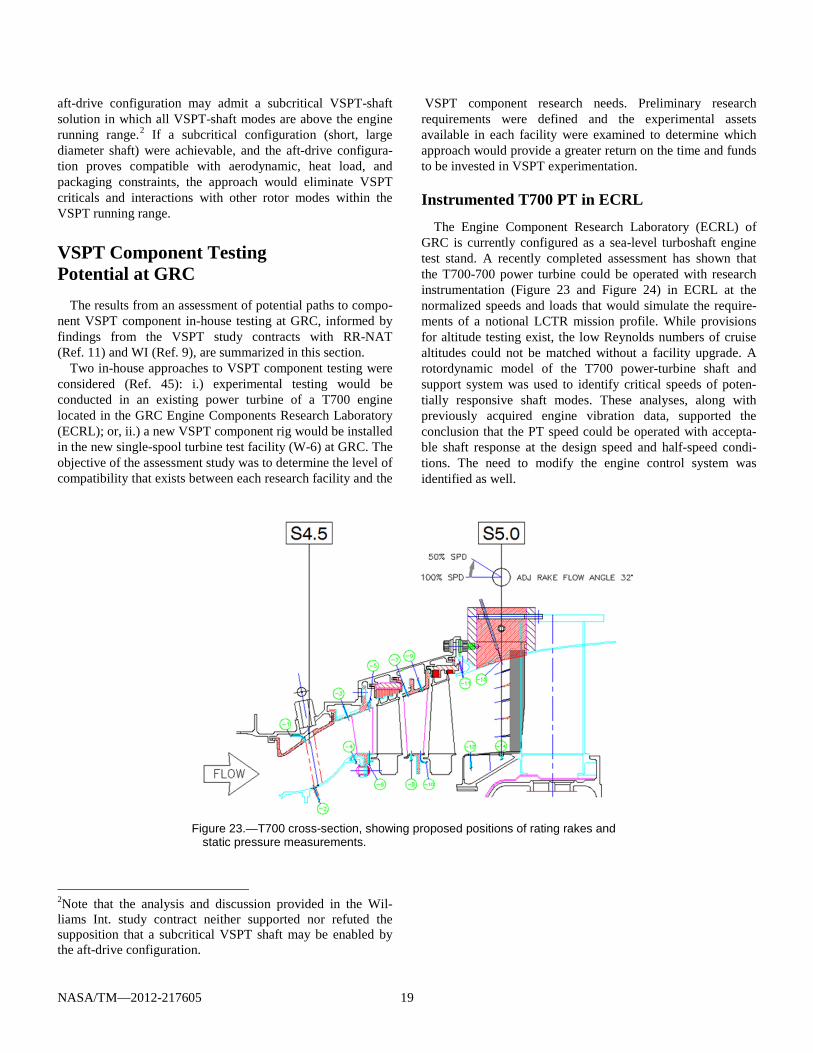
GRC is currently configured as a sea-level turboshaft engine test stand. A recently completed assessment has shown that the T700-700 power turbine could be operated with research instrumentation (Figure 23 and Figure 24) in ECRL at the normalized speeds and loads that would simulate the require-ments of a notional LCTR mission profile. While provisions for altitude testing exist, the low Reynolds numbers of cruise altitudes could not be matched without a facility upgrade. A rotordynamic model of the T700 power-turbine shaft and support system was used to identify critical speeds of poten-tially responsive shaft modes. These analyses, along with previously acquired engine vibration data, supported the conclusion that the PT speed could be operated with accepta-ble shaft response at the design speed and half-speed condi-tions. The need to modify the engine control system was identified as well.
Figure 23.—T700 cross-section, showing proposed positions of rating rakes and
static pressure measurements.
NASA/TM—2012-217605 20
Figure 24.—T700 flat layout showing position of total-temperature and pressure elements and swirl
angle capability of downstream rake (Ref. 45).
An instrumentation plan was developed to provide for measurements within the power turbine that would include overall performance measurements (T0/p0 rakes at S4.5 and S5.0 of Figure 23) and inter-stage static pressure measure-ments, as well as provisions for radial surveys of total pres-sure, total temperature and flow angle (5-hole probe) at the power turbine exit (Station 5.0 of Figure 24). Testing could begin after routine maintenance and safety upgrades to the facility were completed and the aforementioned instrumenta-tion was installed in the T700 power turbine module. These tasks could be performed concurrently and were estimated to take roughly 1.5 years to complete at a relatively low initial cost. As the existing power turbine would be used, this approach would provide data to calibrate analytical and design methods but not to evaluate a specific VSPT design.
VSPT Component Rig in Single-Spool Turbine Facility
The GRC W-6 Single-Spool Turbine Facility (Figure 25) has heated (warm) inlet conditions (940 °F max) and mass-flow-rate (27 lbm/s max) and pressure (50 psia max.) range suitable for testing components that are full-scale, or are scaled-up, as favorable for detailed measurements of flow profiles and performance. The GRC lab altitude exhaust (2 psia) system would accommodate mission-relevant varia-tions in Reynolds number within current facility capabilities. Heated secondary air supply systems are available as well. Intake flow rates are measured with a calibrated venturi and torque is measured using a stand-alone torque meter. Power transmission and absorption is through a reduction gear-box to
a synchronous generator (Figure 25) with tight speed control vis-à-vis the lab-wide variable frequency system. The W-6 facility will not become available until 2014 due to completion schedule and initial check-out and baseline testing commit-ments.
As part of the VSPT study contracts, Rolls-Royce NAT and Williams Int. each developed a plan for a cost-effective test approach to conduct component-level research for the LCTR-relevant VSPT. The approach included a research and instru-mentation plan, test plan, schedule, and cost estimate. In both studies, the proposed approach was to test a multistage (3.5- or 4-stage) VSPT at scale in the NASA W-6 facility. The experiments would accommodate a multistage VSPT designed to match LCTR engine Mach number, pressure and tempera-ture ratios, and flight Reynolds number requirements. A notional 4-stage test article installation in W-6 and perfor-mance rating instrumentation layout from the WI VSPT study contract (Ref. 9) is provided in Figure 26.
Assessment Results Both the ECRL/T700 engine facility and the W-6 turbine
facility were found to be viable options for VSPT experi-ments. The initial time and funding requirements to prepare an experiment in ECRL were estimated to be less than for the W-6 facility, provided the existing T700 power turbine was retained. Using information documented in the VSPT study contracts(Refs. 9 and 11), the initial cost of the W-6 compo-nent approach was estimated to be three to four times higher than the ECRL/T700 approach (using the existing T700 power turbine), and the estimated weekly facility operating costs
NASA/TM—2012-217605 21
Figure 25.—Schematic diagram of the GRC W-6 Single Spool Turbine Facility.
Figure 26.—Williams International 4-stage LCTR VSPT component in GRC W-6 single-spool
air supply;40 psig Combustion Air(clean, dry, ambient temperature)
gearbox
sync.machine
Turbine Test Article
work platform forsecondary air circuits
air heaters
flow measurementventuri
to AltitudeExhaustat 26” Hg
flow
flow
Temperature Probes
Tt/Pt Rakes
NASA Drive SystemPressure taps on all stagesSurrounding Vane AirfoilsOn Inner and Outer Flowpaths
Clearance Rub Pins
Mate Rig toDrive System
Mate Facility Collector
Existing Facility Instrumentation –speed, torque, exit gas conditions, health.
NASA/TM—2012-217605 22
were roughly equal. The T700 engine approach would constitute a first step toward verification of the operational capability of the engine and power-absorber over the 50 percent speed range and of the ability to acquire research-quality data from the instrumented power turbine module when integrated in the engine. The PT module would need to be modified/replaced with a compatible VSPT module in a subsequent step. The W-6 facility was found to provide better access for research instrumentation and would permit re-searchers to evaluate a full-scale power turbine to support the specific aerodynamic research objectives. The W-6 facility is currently the preferred candidate for future VSPT component-level aerodynamic research experiments.
Conclusions The variable-speed power turbine (VSPT) research effort at
GRC was reviewed. In-house and engine-company conceptual design studies have indicated that the VSPT for the NASA LCTR mission will be a 3.5- to 4.5-stage, fixed geometry turbine, dependent in part on the final power requirements and engine power-to-weight-flow levels. Nominal turbine speed operation of 8100 rpm < N < 15000 rpm would correspond to the 54 percent < N* < 100 percent speed requirement. On- and off-design steady and unsteady 3-D multistage computations completed to-date corroborate meanline analyses in terms of expected increase in turbine efficiency between the cruise (54 percent N*) to takeoff (100 percent N*) flight points. The off-design correlations of the meanline tools are critical for such concept studies and improvements at the extreme negative incidence levels are deemed warranted. The VSPT perfor-mance maps and insights generated from the VSPT concept design studies and analyses are informing system studies intended to refine the NASA LCTR mission.
Initial experimental results for incidence-tolerant blading tested over a range of VSPT relevant incidence angles were generated in the recently modified NASA transonic linear cascade. The presented results demonstrate that tunnel capability spans the wide range of Reynolds numbers needed to test blading from fully turbulent to transitional flow conditions.
Implementation of the Walters-Leylek turbulence model into in-house 3-D RANS and URANS solvers was described. The W-L model is found to predict accurately the critical suction-side transition, based on comparisons with steady-state heat transfer data previously obtained in the transonic linear cascade. Validation using unsteady data from a high-speed multistage component rig remains for future work.
Conceptual design level rotordynamics analyses, conducted in-house and through the VSPT study contracts with industry, indicate that rotor-dynamically viable engine concepts are obtainable for the 7500 shp-class engine with VSPT.
Finally, two paths to engine testing using internal assets were explored and found to be viable. The preferred path to
component test is the use of a turbine test facility with mission Reynolds number test capability, such as the NASA W-6 Single-Spool Turbine Facility.
References 1. Johnson, W., Yamauchi, G. K., and Watts, M. E.,
“NASA Heavy Lift Rotorcraft Systems Investigation,” NASA/TP—2005-213467, Sep. 2005.
2. Acree, C. W., Hyeonsoo, Y., and Sinsay, J. D., “Perfor-mance Optimization of the NASA Large Civil Tiltrotor,” Proc. Int. Powered Lift Conf., Jul. 2008.
3. Wilkerson, J. B. and Smith, R. L., “Aircraft System Analysis of Technology Benefits to Civil Transport Ro-torcraft,” NASA/CR–2009-214594, Jun. 2009.
4. Welch, G. E., “Assessment of Aerodynamic Challenges of a Variable-Speed Power Turbine for Large Civil Tilt-Rotor Application,” Proc. AHS Int. 66th Ann. Forum, May, 2010; also NASA/TM—2010-216758, Aug. 2010.
5. Hourmouziadis, J., “Aerodynamic Design of Low Pres-sure Turbines,” in Blading Design for Axial Tur-bomachines, AGARD-LS-167, 1989, pp. 8-1 to 8-40.
6. Howard, S. A., “Rotordynamic Feasibility of a Concep-tual Variable-Speed Power Turbine Propulsion System for Large Civil Tilt-Rotor Applications,” Proc. AHS Int. 68th Ann. Forum, TX, May 2012; also NASA/TM—2012-217134, May 2012.
7. Stevens, M. A., Handschuh, R. F., Lewicki, D. G., “Var-iable/Multispeed Rotorcraft Drive System Concepts,” NASA/TM—2009-215456; also ARL-TR-4728, Mar. 2009.
8. Litt, J. S., Edwards, J. M., DeCastro, J. A., “A Sequential Shifting Algorithm for Variable Rotor Speed Control,” NASA/TM—2007-214842, June, 2007; also, ARL–TR–4086, June 2007.
9. Suchezky, M., “Variable-speed power turbine for the Large Civil Tilt Rotor,” NASA/CR—2012-217424, Feb. 2012.
10. Ford, A., Turner, E., Bloxham, M., Gegg, S., King, B., Harris, C., Bell, M., Eames, D., “Variable-Speed Power-Turbine Component Research Plan,” NASA/CR—2012-217423, Feb. 2012.
11. Ford, A., Bloxham, M., Turner, E., Clemens, E., Gegg, S., “Design Optimization of Incidence-Tolerant Blading Relevant to Large Civil Tilt-Rotor Power Turbine Appli-cations,” NASA/CR—2011-217016, 2012.
12. Snyder, C. A. and Thurman, D. R., “Gas Turbine Char-acteristics for a Large Civil Tilt-Rotor (LCTR),” Proc. AHS Int. 65th Ann. Forum, May 2009; also NASA/TM—2010-216089, Feb, 2010.
13. Welch, G. E., “Computational Assessment of the Aero-dynamic Performance of a Variable-Speed Power Tur-bine for Large Civil Tilt-Rotor Application,” Proc. AHS Forum 67, May 2011; also NASA/TM—2011-217124, Nov. 2011.
14. Clark, J. P., Koch, P. J., Ooten, M. K., Johnson, J. J., Dagg, J., McQuilling, M. W., Huber, F, and Johnson, P.
NASA/TM—2012-217605 23
D., “Design of Turbine Components to Answer Research Questions in Unsteady Aerodynamics and Heat Trans-fer,” AFRL-RZ-WP-TR-2009-2180, Sep. 2009.
15. Gier, J., Franke, M., Hübner, N. and Shröder, T., “De-signing LP Turbines for Optimized Airfoil Lift,” J. Tur-bomachinery, 132, Jul. 2010, pp. 031008-1 to -12.
16. D′Angelo, M., “Wide Speed Range Turboshaft Study,” NASA/CR—1995-198380, Aug. 1995.
17. Smith, S. F., “A Simple Correlation of Turbine Efficien-cy,” J. Royal Aero. Soc., 69, 1965, pp. 467-470.
18. Oates, G. C, Aerothermodynamics of Aircraft Engine Components, AIAA Education Series, 1985.
19. Ainley, D. G. and Mathieson, G. C. R., “A Method of Performance Estimation for Axial-Flow Turbines,” Aer-onautical Research Council (ARC), R&M 2974, 1957.
20. Dunham, J. and Came, P. M., “Improvements to the Ain-ley-Mathieson Method of Turbine Performance Predic-tion,” J. Eng. for Power, Jul. 1970, pp. 252-256.
21. Kacker S. C., and Okapuu. U., “A Mean Line Prediction Method for Axial Flow Turbine Efficiency,” J. Eng. Power, 104, Jan. 1982, pp. 111-119.
22. Chima, R. V., “Calculation of Multistage Turbomachin-ery Using Steady Characteristic Boundary Conditions,” AIAA-98-0968, Jan. 1998; also NASA/TM—1998–206613, Jan. 1998.
23. Welch, G. E., “Computational Study of the Impact of Unsteadiness on the Aerodynamic Performance of a Var-iable-Speed Power Turbine,” AIAA-2012-937, Jan. 2012; also NASA/TM—2012-217425, 2012.
24. Rose, M., Schüpbach, P., Mansour, M., “The Thermody-namics of Wake Blade Interaction in Axial Flow Tur-bines: Combined Experimental and Computational Study,” ASME GT2009-59655, Jun. 2009.
25. Adamczyk, J. J., “Model Equation for Simulating Flows in Multistage Turbomachinery,” ASME GT1985-226, 1985.
26. Haselbach, F., Schiffer, H.-P., Horsman, M., Dressen, S., Harvey, N., and Read, S., “The Application of Ultra High Lift Blading in the BR715 LP Turbine,” J. Tur-bomachinery, 124, Jan. 2002, pp. 45-51.
27. Halstead, D. E., Wisler, D. C., Okishii, T. H., Walker, G. J., Hodson, H. P, Shin, H-W., “Boundary Layer Devel-opment in Axial Compressors and Turbines: Part 3 of 4—LP Turbines,” J. Turbomachinery, 119, 1997, p. 225.
28. Ni, R-H, Humber, W., Fan, G., Johnson, P. D, Downs, J., Clark, J. P., Koch, P. J., “Conjugate Heat Transfer Anal-ysis of a Film-Cooled Turbine Vane,” ASME GT2011-45920, Jun. 2011.
29. Robuck, M., Wilkerson, J., Zhang, Y., Snyder, C., Nordstrom, C., “Design Study of Propulsion and Drive Systems for the Large Civil Tiltrotor (LCTR2) Ro-torcraft,” Proc. AHS 67th Ann. Forum, May 2011.
30. Hall, E. J., and Delaney, R. A., “Investigation of Ad-vanced Counter-rotation Blade Configuration Concepts for High Speed Turboprop Systems: Task V - ADPAC User's Manual,” NASA/CR—1995-195472, 1995.
31. Giel, P. W., Boyle, R. J., and Bunker, R. S., “Measure-ments and Predictions of Heat Transfer on Rotor Blades
in a Transonic Turbine Cascade,” J. Turbomachinery, 126, Jan. 2004, pp. 110-121.
32. Timko, L. P., “Energy Efficient Engine High Pressure Turbine Component Test Performance Report,” NASA/CR—1984-168289, 1984.
33. Giel, P. W., Thurman, D. R., Lopez, I., Boyle, R. J., VanFossen, G. J., Jett, T. A., Camperchioli, W. P., La, H., “Three-Dimensional Flow Field Measurements in a Tran-sonic Turbine Cascade,” ASME 96-GT-113, Jun, 1996; al-so NASA/TM—1996-107388 and ARL-TR-1252.
34. Ameri, A. A., “Implementation of a Transition Model in a NASA Code and Validation using Heat Transfer Data on a Turbine Blade,” NASA/CR—2012-217436, 2012.
35. Walters, D. K., Leylek, J. H., “A New Model for Bound-ary Layer Transition Using a Single-Point RANS Ap-proach,” ASME Journal of Turbomachinery, 126, (1), 2004, p. 193.
36. Walters, D. K., Leylek, J. H., “Computational Fluid Dynamics Study of Wake-Induced Transition on a Com-pressor-Like Flat Plate,” ASME Journal of Tur-bomachinery, 127, (1), 2005, p. 52.
37. Steinthorsson, E., Liou, M.S., and Povinelli, L.A., “De-velopment of an Explicit Multiblock/Multigrid Flow Solver for Viscous Flows in Complex Geometries,” AIAA-93- 2380, 1993.
38. Ameri, A. A., “Use of Transition Modeling to Enable the Computation of Losses for Variable-Speed Power Tur-bine,” ASME GT2012-69591, Jul. 2012; also NASA/CR—2012-217435, 2012.
39. Incropera, F. P. and DeWitt, D. P., Fundamentals of Heat Transfer, Wiley, NY, 1981.
40. Chen, J. P. and Briley, W. R., “A Parallel Flow Solver for Unsteady Multiple Blade Row Turbomachinery Sim-ulations,” ASME GT2001-0348, Jun, 2001.
41. To, W. M., “Unsteady Aero Computation of a 1-1/2 Stage Large Scale Rotating Turbine”, NASA/CR—2012-217438, 2012.
42. Dring, R.P., Fair, M.F., Joslyn, H.D., Power, G.D., and Verdon, J.M., “The Effect of Inlet Turbulence and Ro-tor/Stator Interactions on the Aerodynamics and Heat Transfer of a Large Scale Rotating Rig Turbine Model, Vol. I – Final Report,” NASA/CR—1987-4079, 1987.
43. Snyder, C.A., and Thurman, D.R.: “Effects of Gas Tur-bine Component Performance on Engine and Rotary Wing Vehicle Size and Performance,” NASA/TM—2010-216907, Nov. 2010.
44. International Standard ISO 1940-1:2003/Cor. 1:2005(E), International Organization for Standardization, Switzer-land, 2005, p. 11.
45. Skoch, G. J., Griffin, T. A., Stevens, M. A., Howard, S. A., Welch, G. E., and Giel, P. W., “Assessment of Vari-able-Speed Power-Turbine Component Test Capability at NASA Glenn Research Center,” NASA/TM—2012-217422, 2012.
REPORT DOCUMENTATION PAGE Form Approved OMB No. 0704-0188
The public reporting burden for this collection of information is estimated to average 1 hour per response, including the time for reviewing instructions, searching existing data sources, gathering and maintaining the data needed, and completing and reviewing the collection of information. Send comments regarding this burden estimate or any other aspect of this collection of information, including suggestions for reducing this burden, to Department of Defense, Washington Headquarters Services, Directorate for Information Operations and Reports (0704-0188), 1215 Jefferson Davis Highway, Suite 1204, Arlington, VA 22202-4302. Respondents should be aware that notwithstanding any other provision of law, no person shall be subject to any penalty for failing to comply with a collection of information if it does not display a currently valid OMB control number. PLEASE DO NOT RETURN YOUR FORM TO THE ABOVE ADDRESS. 1. REPORT DATE (DD-MM-YYYY) 01-07-2012
2. REPORT TYPE Technical Memorandum
3. DATES COVERED (From - To)
4. TITLE AND SUBTITLE Variable-Speed Power-Turbine Research at Glenn Research Center
7. PERFORMING ORGANIZATION NAME(S) AND ADDRESS(ES) National Aeronautics and Space Administration John H. Glenn Research Center at Lewis Field Cleveland, Ohio 44135-3191
8. PERFORMING ORGANIZATION REPORT NUMBER E-18186
9. SPONSORING/MONITORING AGENCY NAME(S) AND ADDRESS(ES) National Aeronautics and Space Administration Washington, DC 20546-0001
10. SPONSORING/MONITOR'S ACRONYM(S) NASA
11. SPONSORING/MONITORING REPORT NUMBER NASA/TM-2012-217605
12. DISTRIBUTION/AVAILABILITY STATEMENT Unclassified-Unlimited Subject Categories: 02, 01, 03, 07, 34, and 09 Available electronically at http://www.sti.nasa.gov This publication is available from the NASA Center for AeroSpace Information, 443-757-5802
13. SUPPLEMENTARY NOTES
14. ABSTRACT The main rotors of the NASA Large Civil Tilt-Rotor (LCTR) notional vehicle operate over a wide speed-range, from 100 percent at takeoff to 54 percent at cruise. The variable-speed power turbine (VSPT) offers one approach by which to effect this speed variation. VSPT aerodynamics challenges include high work factors at cruise, wide (40° to 60°) incidence-angle variations in blade and vane rows over the speed range, and operation at low Reynolds numbers. Rotordynamics challenges include potential responsiveness to shaft modes within the 50 percent VSPT speed-range. A research effort underway at NASA Glenn Research Center, intended to address these key aerodynamic and rotordynamic challenges, is described. Conceptual design and 3-D multistage RANS and URANS analyses, conducted internally and under contract, provide expected VSPT sizing, stage-count, performance and operability information, and maps for system studies. Initial steps toward experimental testing of incidence-tolerant blading in a transonic linear cascade are described, and progress toward development/improvement of a simulation capability for multistage turbines with low Reynolds number transitional flow is summarized. Preliminary rotordynamics analyses indicate that viable concept engines with 50 percent VSPT shaft-speed range. Assessments of potential paths toward VSPT component-level testing are summarized.15. SUBJECT TERMS Turbine aerodynamics; Rotordynamics; Turbine cascade; CFD; Gas turbine engine
16. SECURITY CLASSIFICATION OF: 17. LIMITATION OF ABSTRACT UU
18. NUMBER OF PAGES
30
19a. NAME OF RESPONSIBLE PERSON STI Help Desk (email:[email protected])
a. REPORT U
b. ABSTRACT U
c. THIS PAGE U
19b. TELEPHONE NUMBER (include area code) 443-757-5802
Standard Form 298 (Rev. 8-98)Prescribed by ANSI Std. Z39-18