Virtual groundwater transfers from overexploited aquifers in the United States Landon Marston a , Megan Konar a,1 , Ximing Cai a , and Tara J. Troy b a Department of Civil and Environmental Engineering, University of Illinois at Urbana–Champaign, Urbana, IL 61801; and b Department of Civil and Environmental Engineering, Lehigh University, Bethlehem, PA 18015 Edited by Susan Hanson, Clark University, Worcester, MA, and approved May 26, 2015 (received for review January 8, 2015) The High Plains, Mississippi Embayment, and Central Valley aquifer systems within the United States are currently being overexploited for irrigation water supplies. The unsustainable use of groundwater resources in all three aquifer systems intensified from 2000 to 2008, making it imperative that we understand the consumptive processes and forces of demand that are driving their depletion. To this end, we quantify and track agricultural virtual groundwater transfers from these overexploited aquifer systems to their final destination. Specifically, we determine which US metropolitan areas, US states, and international export destinations are currently the largest con- sumers of these critical aquifers. We draw upon US government data on agricultural production, irrigation, and domestic food flows, as well as modeled estimates of agricultural virtual water contents to quantify domestic transfers. Additionally, we use US port-level trade data to trace international exports from these aquifers. In 2007, virtual groundwater transfers from the High Plains, Mississippi Embayment, and Central Valley aquifer systems totaled 17.93 km 3 , 9.18 km 3 , and 6.81 km 3 , respectively, which is comparable to the capacity of Lake Mead (35.7 km 3 ), the largest surface reservoir in the United States. The vast majority (91%) of virtual groundwater transfers remains within the United States. Importantly, the cereals produced by these overexploited aquifers are critical to US food security (contributing 18.5% to domestic cereal supply). Notably, Japan relies upon cereals produced by these overexploited aquifers for 9.2% of its domestic cereal supply. These results highlight the need to understand the teleconnections between distant food de- mands and local agricultural water use. teleconnections | groundwater depletion | virtual water | trade | food security G lobalization has strengthened and expanded connections between socioeconomic systems and distant resources, by enabling consumer demand in one location to be fulfilled with production and resource use in another. The distant interactions between people and places are commonly referred to as “tele- connections” (1), which represent a specific case of the complex interactions that arise between coupled human and natural systems (2). These nonlocal interactions are increasingly widespread and lead to unanticipated outcomes with profound implications for resource consumption and sustainability (3). The global food trade system is a clear example of a teleconnected system that connects local resource use with distant consumer demands. Agricultural production is a particularly water-intensive sector of the economy (4–6), such that trade of agricultural products connects local water use for irrigation to the end consumer of the commodity, in a “virtual water trade” (7, 8). In this paper, we seek to understand how distant food demands are linked with nonsustainable local agricultural water use. Groundwater plays a critical and ubiquitous role in human society (9), providing an estimated 36, 42, and 27% of global domestic, agricultural, and industrial water uses, respectively (10). Population growth, socioeconomic development (4, 9), and, to a lesser extent, climate change (4, 11), are expected to increase future demand for groundwater resources. Unsustainable groundwater withdrawals will limit future groundwater availability (12–15), with implications for food security (16), because ∼40% of global irrigated agriculture relies upon groundwater. Importantly, ∼42% of irrigated agriculture in the United States, one of the largest food producers and the largest exporter globally, depends on groundwater (17). Further- more, groundwater depletion will affect the ability of urban areas, over half of which are located in water scarce basins (18), to meet normal water demands and cope with climate variability, against which groundwater acts as a buffer (9). The Central Valley (CV), High Plains (HP), and Mississippi Embayment (ME) aquifer systems (mapped in Fig. 1) enable ag- ricultural production that is critical to local economies and con- tributes to US and global food security. In 2007, roughly one-fifth of the $300 billion agricultural industry in the United States came from these aquifer regions (19, 20). The lands overlying the CV (52,000 km 2 ), HP (450,000 km 2 ), and ME (202,000 km 2 ) make up 8% of US land area yet comprise 16% of US cropland. More than 17 million people live within the boundaries of these three aquifers. In addition, 25.7% of all US irrigation and livestock withdrawals and 61.1% of all groundwater irrigation and livestock withdrawals come from these three aquifers (17). Despite their importance, these aquifers are being managed unsustainably; 67% of US groundwater depletion from 1900 to 2008 and 93% of groundwater depletion from 2000 to 2008 is attributed to these three aquifers (21). Much is understood about local food production and ground- water use in the HP, CV, and ME aquifer systems. It is now imperative to begin to evaluate the consumption side of the story and determine where these resources are being demanded if we are to better understand opportunities to slow their over- exploitation (22). To this end, we comprehensively quantify and trace virtual groundwater transfers from these aquifers to their destination of final use. To our knowledge, this is the first time this has been done and represents an important first step in Significance Irrigated agriculture is contributing to the depletion of the Cen- tral Valley, High Plains, and Mississippi Embayment aquifer sys- tems. Agricultural production within these aquifer regions comprises a significant portion of the domestic and international cereal supply; thus, potential food security implications arise if production significantly decreases to bring groundwater with- drawals within sustainable limits. For the first time to our knowl- edge, this study tracks and quantifies the food and embodied groundwater resources from these aquifer systems to their final destination and determines the major US cities, US states, and countries that are currently most reliant upon them. Tracing vir- tual groundwater transfers highlights the role of distant de- mands on local groundwater sustainability and the fact that aquifer depletion must be considered within its global context. Author contributions: L.M., M.K., X.C., and T.J.T. designed research; L.M. and M.K. per- formed research; L.M. analyzed data; and L.M., M.K., X.C., and T.J.T. wrote the paper. The authors declare no conflict of interest. This article is a PNAS Direct Submission. Freely available online through the PNAS open access option. 1 To whom correspondence should be addressed. Email: [email protected]. This article contains supporting information online at www.pnas.org/lookup/suppl/doi:10. 1073/pnas.1500457112/-/DCSupplemental. www.pnas.org/cgi/doi/10.1073/pnas.1500457112 PNAS | July 14, 2015 | vol. 112 | no. 28 | 8561–8566 SUSTAINABILITY SCIENCE
Transcript
Virtual groundwater transfers from overexploitedaquifers in the United StatesLandon Marstona, Megan Konara,1, Ximing Caia, and Tara J. Troyb
aDepartment of Civil and Environmental Engineering, University of Illinois at Urbana–Champaign, Urbana, IL 61801; and bDepartment of Civil andEnvironmental Engineering, Lehigh University, Bethlehem, PA 18015
Edited by Susan Hanson, Clark University, Worcester, MA, and approved May 26, 2015 (received for review January 8, 2015)
The High Plains, Mississippi Embayment, and Central Valley aquifersystems within the United States are currently being overexploitedfor irrigation water supplies. The unsustainable use of groundwaterresources in all three aquifer systems intensified from 2000 to 2008,making it imperative that we understand the consumptive processesand forces of demand that are driving their depletion. To this end,we quantify and track agricultural virtual groundwater transfersfrom these overexploited aquifer systems to their final destination.Specifically, we determine which US metropolitan areas, US states,and international export destinations are currently the largest con-sumers of these critical aquifers. We draw upon US governmentdata on agricultural production, irrigation, and domestic food flows,as well as modeled estimates of agricultural virtual water contentsto quantify domestic transfers. Additionally, we use US port-leveltrade data to trace international exports from these aquifers. In2007, virtual groundwater transfers from the High Plains, MississippiEmbayment, and Central Valley aquifer systems totaled 17.93 km3,9.18 km3, and 6.81 km3, respectively, which is comparable to thecapacity of Lake Mead (35.7 km3), the largest surface reservoir inthe United States. The vast majority (91%) of virtual groundwatertransfers remains within the United States. Importantly, the cerealsproduced by these overexploited aquifers are critical to US foodsecurity (contributing 18.5% to domestic cereal supply). Notably,Japan relies upon cereals produced by these overexploited aquifersfor 9.2% of its domestic cereal supply. These results highlight theneed to understand the teleconnections between distant food de-mands and local agricultural water use.
Globalization has strengthened and expanded connectionsbetween socioeconomic systems and distant resources, by
enabling consumer demand in one location to be fulfilled withproduction and resource use in another. The distant interactionsbetween people and places are commonly referred to as “tele-connections” (1), which represent a specific case of the complexinteractions that arise between coupled human and natural systems(2). These nonlocal interactions are increasingly widespread andlead to unanticipated outcomes with profound implications forresource consumption and sustainability (3). The global food tradesystem is a clear example of a teleconnected system that connectslocal resource use with distant consumer demands. Agriculturalproduction is a particularly water-intensive sector of the economy(4–6), such that trade of agricultural products connects local wateruse for irrigation to the end consumer of the commodity, in a“virtual water trade” (7, 8). In this paper, we seek to understandhow distant food demands are linked with nonsustainable localagricultural water use.Groundwater plays a critical and ubiquitous role in human society
(9), providing an estimated 36, 42, and 27% of global domestic,agricultural, and industrial water uses, respectively (10). Populationgrowth, socioeconomic development (4, 9), and, to a lesser extent,climate change (4, 11), are expected to increase future demand forgroundwater resources. Unsustainable groundwater withdrawalswill limit future groundwater availability (12–15), with implications
for food security (16), because ∼40% of global irrigated agriculturerelies upon groundwater. Importantly, ∼42% of irrigated agriculturein the United States, one of the largest food producers and thelargest exporter globally, depends on groundwater (17). Further-more, groundwater depletion will affect the ability of urban areas,over half of which are located in water scarce basins (18), to meetnormal water demands and cope with climate variability, againstwhich groundwater acts as a buffer (9).The Central Valley (CV), High Plains (HP), and Mississippi
Embayment (ME) aquifer systems (mapped in Fig. 1) enable ag-ricultural production that is critical to local economies and con-tributes to US and global food security. In 2007, roughly one-fifth ofthe $300 billion agricultural industry in the United States camefrom these aquifer regions (19, 20). The lands overlying the CV(52,000 km2), HP (450,000 km2), and ME (202,000 km2) make up8% of US land area yet comprise 16% of US cropland. More than17 million people live within the boundaries of these three aquifers.In addition, 25.7% of all US irrigation and livestock withdrawals and61.1% of all groundwater irrigation and livestock withdrawals comefrom these three aquifers (17). Despite their importance, theseaquifers are being managed unsustainably; 67% of US groundwaterdepletion from 1900 to 2008 and 93% of groundwater depletionfrom 2000 to 2008 is attributed to these three aquifers (21).Much is understood about local food production and ground-
water use in the HP, CV, and ME aquifer systems. It is nowimperative to begin to evaluate the consumption side of the storyand determine where these resources are being demanded ifwe are to better understand opportunities to slow their over-exploitation (22). To this end, we comprehensively quantify andtrace virtual groundwater transfers from these aquifers to theirdestination of final use. To our knowledge, this is the first timethis has been done and represents an important first step in
Significance
Irrigated agriculture is contributing to the depletion of the Cen-tral Valley, High Plains, and Mississippi Embayment aquifer sys-tems. Agricultural production within these aquifer regionscomprises a significant portion of the domestic and internationalcereal supply; thus, potential food security implications arise ifproduction significantly decreases to bring groundwater with-drawals within sustainable limits. For the first time to our knowl-edge, this study tracks and quantifies the food and embodiedgroundwater resources from these aquifer systems to their finaldestination and determines the major US cities, US states, andcountries that are currently most reliant upon them. Tracing vir-tual groundwater transfers highlights the role of distant de-mands on local groundwater sustainability and the fact thataquifer depletion must be considered within its global context.
Author contributions: L.M., M.K., X.C., and T.J.T. designed research; L.M. and M.K. per-formed research; L.M. analyzed data; and L.M., M.K., X.C., and T.J.T. wrote the paper.
The authors declare no conflict of interest.
This article is a PNAS Direct Submission.
Freely available online through the PNAS open access option.1To whom correspondence should be addressed. Email: [email protected].
This article contains supporting information online at www.pnas.org/lookup/suppl/doi:10.1073/pnas.1500457112/-/DCSupplemental.
the evaluation of consumption flows of critical groundwater re-sources. In this paper, we use high-resolution empirical data ondomestic food transfers within the United States in 2007 (23, 24)and link this with port-level data on international exports (25).Additionally, we use national statistics on agricultural production(19) and irrigation (17) and modeled estimates of virtual watercontent (26, 27) to quantify virtual transfers of critical ground-water resources (refer to Materials and Methods and SI Materialsand Methods). This approach enables us to identify the locationsthat are most responsible for—and currently most reliant upon—depletion of the HP, CV, and ME aquifers.
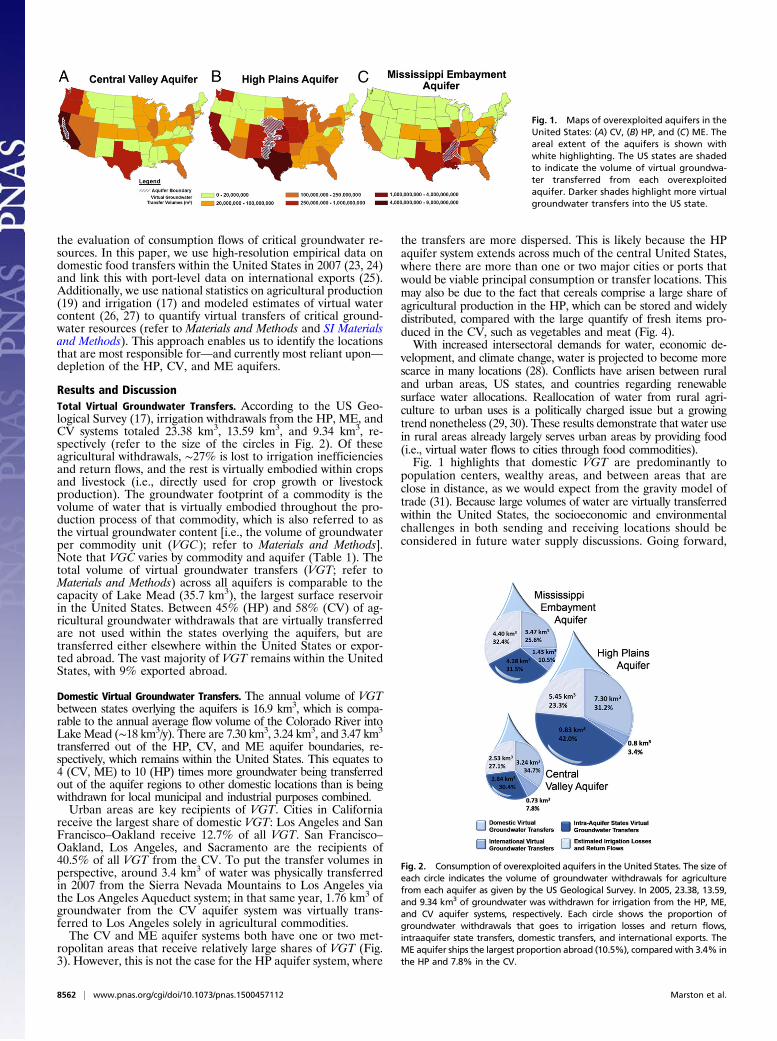
Results and DiscussionTotal Virtual Groundwater Transfers. According to the US Geo-logical Survey (17), irrigation withdrawals from the HP, ME, andCV systems totaled 23.38 km3, 13.59 km3, and 9.34 km3, re-spectively (refer to the size of the circles in Fig. 2). Of theseagricultural withdrawals, ∼27% is lost to irrigation inefficienciesand return flows, and the rest is virtually embodied within cropsand livestock (i.e., directly used for crop growth or livestockproduction). The groundwater footprint of a commodity is thevolume of water that is virtually embodied throughout the pro-duction process of that commodity, which is also referred to asthe virtual groundwater content [i.e., the volume of groundwaterper commodity unit (VGC); refer to Materials and Methods].Note that VGC varies by commodity and aquifer (Table 1). Thetotal volume of virtual groundwater transfers (VGT; refer toMaterials and Methods) across all aquifers is comparable to thecapacity of Lake Mead (35.7 km3), the largest surface reservoirin the United States. Between 45% (HP) and 58% (CV) of ag-ricultural groundwater withdrawals that are virtually transferredare not used within the states overlying the aquifers, but aretransferred either elsewhere within the United States or expor-ted abroad. The vast majority of VGT remains within the UnitedStates, with 9% exported abroad.
Domestic Virtual Groundwater Transfers. The annual volume of VGTbetween states overlying the aquifers is 16.9 km3, which is compa-rable to the annual average flow volume of the Colorado River intoLakeMead (∼18 km3/y). There are 7.30 km3, 3.24 km3, and 3.47 km3
transferred out of the HP, CV, and ME aquifer boundaries, re-spectively, which remains within the United States. This equates to4 (CV, ME) to 10 (HP) times more groundwater being transferredout of the aquifer regions to other domestic locations than is beingwithdrawn for local municipal and industrial purposes combined.Urban areas are key recipients of VGT. Cities in California
receive the largest share of domestic VGT: Los Angeles and SanFrancisco–Oakland receive 12.7% of all VGT. San Francisco–Oakland, Los Angeles, and Sacramento are the recipients of40.5% of all VGT from the CV. To put the transfer volumes inperspective, around 3.4 km3 of water was physically transferredin 2007 from the Sierra Nevada Mountains to Los Angeles viathe Los Angeles Aqueduct system; in that same year, 1.76 km3 ofgroundwater from the CV aquifer system was virtually trans-ferred to Los Angeles solely in agricultural commodities.The CV and ME aquifer systems both have one or two met-
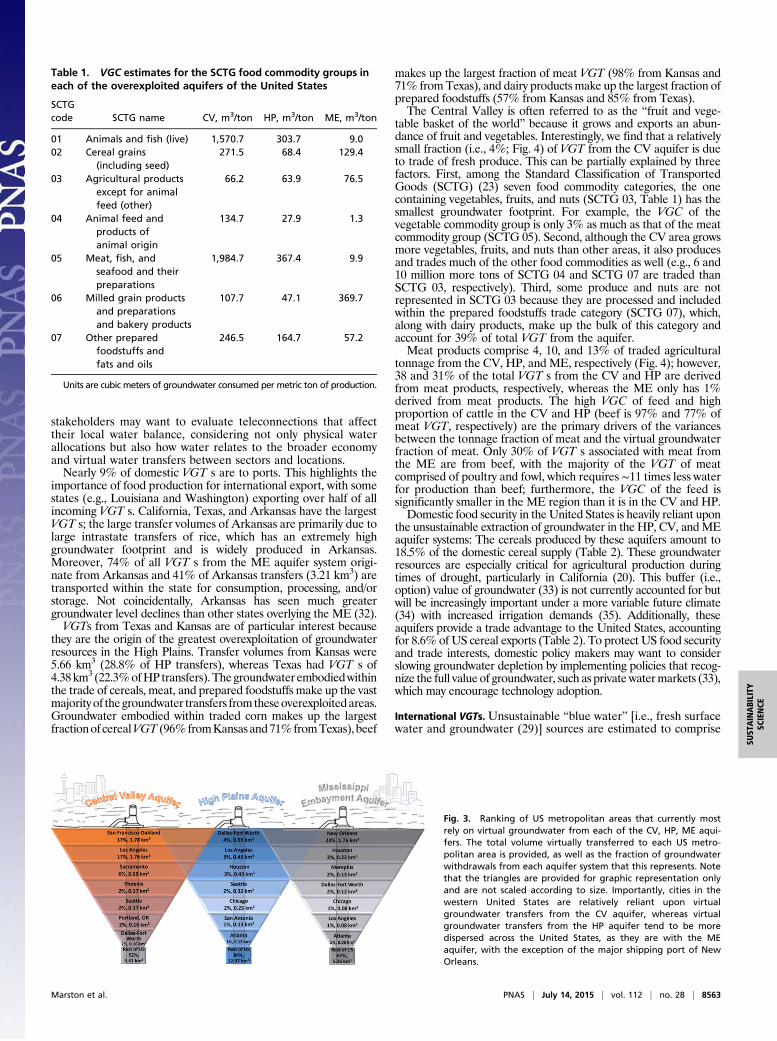
ropolitan areas that receive relatively large shares of VGT (Fig.3). However, this is not the case for the HP aquifer system, where
the transfers are more dispersed. This is likely because the HPaquifer system extends across much of the central United States,where there are more than one or two major cities or ports thatwould be viable principal consumption or transfer locations. Thismay also be due to the fact that cereals comprise a large share ofagricultural production in the HP, which can be stored and widelydistributed, compared with the large quantify of fresh items pro-duced in the CV, such as vegetables and meat (Fig. 4).With increased intersectoral demands for water, economic de-
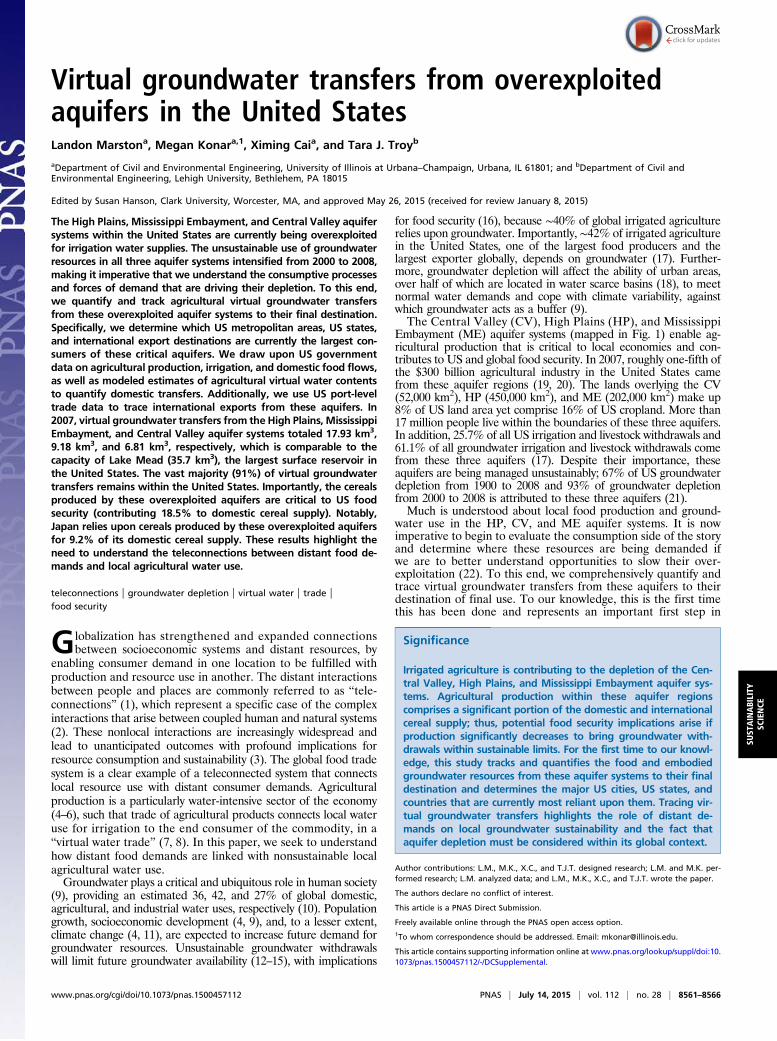
velopment, and climate change, water is projected to become morescarce in many locations (28). Conflicts have arisen between ruraland urban areas, US states, and countries regarding renewablesurface water allocations. Reallocation of water from rural agri-culture to urban uses is a politically charged issue but a growingtrend nonetheless (29, 30). These results demonstrate that water usein rural areas already largely serves urban areas by providing food(i.e., virtual water flows to cities through food commodities).Fig. 1 highlights that domestic VGT are predominantly to
population centers, wealthy areas, and between areas that areclose in distance, as we would expect from the gravity model oftrade (31). Because large volumes of water are virtually transferredwithin the United States, the socioeconomic and environmentalchallenges in both sending and receiving locations should beconsidered in future water supply discussions. Going forward,
Fig. 1. Maps of overexploited aquifers in theUnited States: (A) CV, (B) HP, and (C) ME. Theareal extent of the aquifers is shown withwhite highlighting. The US states are shadedto indicate the volume of virtual groundwa-ter transferred from each overexploitedaquifer. Darker shades highlight more virtualgroundwater transfers into the US state.
Fig. 2. Consumption of overexploited aquifers in the United States. The size ofeach circle indicates the volume of groundwater withdrawals for agriculturefrom each aquifer as given by the US Geological Survey. In 2005, 23.38, 13.59,and 9.34 km3 of groundwater was withdrawn for irrigation from the HP, ME,and CV aquifer systems, respectively. Each circle shows the proportion ofgroundwater withdrawals that goes to irrigation losses and return flows,intraaquifer state transfers, domestic transfers, and international exports. TheME aquifer ships the largest proportion abroad (10.5%), compared with 3.4% inthe HP and 7.8% in the CV.
8562 | www.pnas.org/cgi/doi/10.1073/pnas.1500457112 Marston et al.
stakeholders may want to evaluate teleconnections that affecttheir local water balance, considering not only physical waterallocations but also how water relates to the broader economyand virtual water transfers between sectors and locations.Nearly 9% of domestic VGT s are to ports. This highlights the
importance of food production for international export, with somestates (e.g., Louisiana and Washington) exporting over half of allincoming VGT s. California, Texas, and Arkansas have the largestVGT s; the large transfer volumes of Arkansas are primarily due tolarge intrastate transfers of rice, which has an extremely highgroundwater footprint and is widely produced in Arkansas.Moreover, 74% of all VGT s from the ME aquifer system origi-nate from Arkansas and 41% of Arkansas transfers (3.21 km3) aretransported within the state for consumption, processing, and/orstorage. Not coincidentally, Arkansas has seen much greatergroundwater level declines than other states overlying the ME (32).VGTs from Texas and Kansas are of particular interest because
they are the origin of the greatest overexploitation of groundwaterresources in the High Plains. Transfer volumes from Kansas were5.66 km3 (28.8% of HP transfers), whereas Texas had VGT s of4.38km3 (22.3%ofHPtransfers).Thegroundwater embodiedwithinthe trade of cereals, meat, and prepared foodstuffs make up the vastmajorityof thegroundwater transfers fromtheseoverexploitedareas.Groundwater embodied within traded corn makes up the largestfractionof cerealVGT (96%fromKansasand71%fromTexas), beef
makes up the largest fraction of meat VGT (98% from Kansas and71% fromTexas), and dairy products make up the largest fraction ofprepared foodstuffs (57% from Kansas and 85% from Texas).The Central Valley is often referred to as the “fruit and vege-
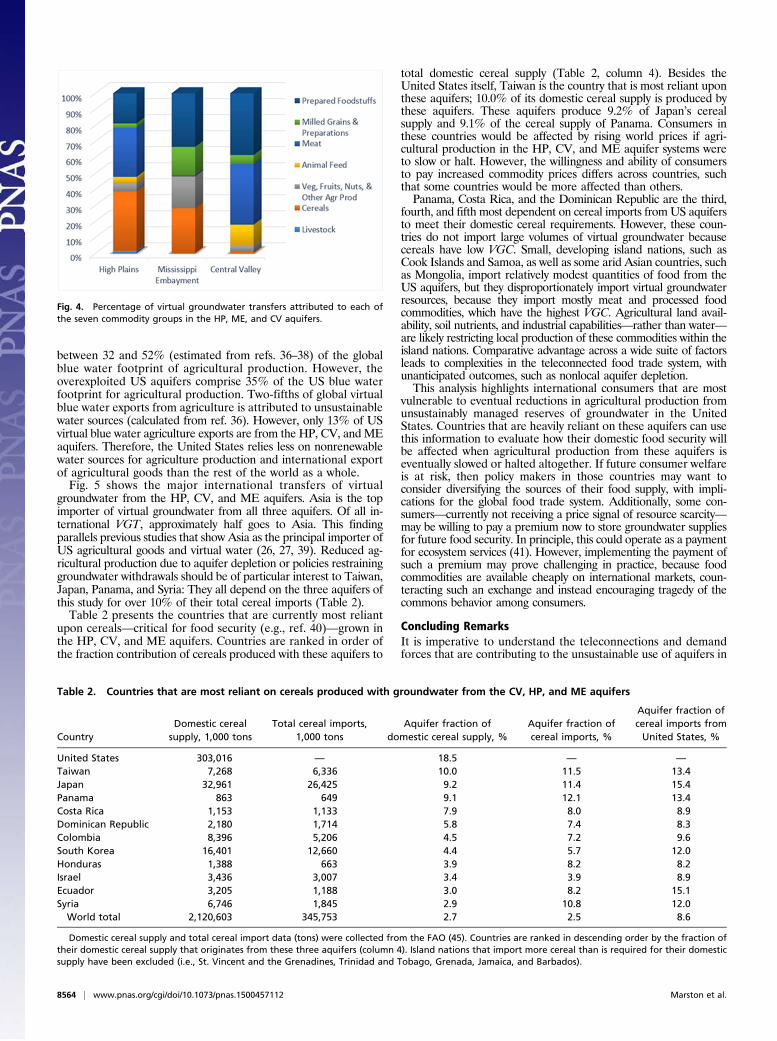
table basket of the world” because it grows and exports an abun-dance of fruit and vegetables. Interestingly, we find that a relativelysmall fraction (i.e., 4%; Fig. 4) of VGT from the CV aquifer is dueto trade of fresh produce. This can be partially explained by threefactors. First, among the Standard Classification of TransportedGoods (SCTG) (23) seven food commodity categories, the onecontaining vegetables, fruits, and nuts (SCTG 03, Table 1) has thesmallest groundwater footprint. For example, the VGC of thevegetable commodity group is only 3% as much as that of the meatcommodity group (SCTG 05). Second, although the CV area growsmore vegetables, fruits, and nuts than other areas, it also producesand trades much of the other food commodities as well (e.g., 6 and10 million more tons of SCTG 04 and SCTG 07 are traded thanSCTG 03, respectively). Third, some produce and nuts are notrepresented in SCTG 03 because they are processed and includedwithin the prepared foodstuffs trade category (SCTG 07), which,along with dairy products, make up the bulk of this category andaccount for 39% of total VGT from the aquifer.Meat products comprise 4, 10, and 13% of traded agricultural
tonnage from the CV, HP, and ME, respectively (Fig. 4); however,38 and 31% of the total VGT s from the CV and HP are derivedfrom meat products, respectively, whereas the ME only has 1%derived from meat products. The high VGC of feed and highproportion of cattle in the CV and HP (beef is 97% and 77% ofmeat VGT, respectively) are the primary drivers of the variancesbetween the tonnage fraction of meat and the virtual groundwaterfraction of meat. Only 30% of VGT s associated with meat fromthe ME are from beef, with the majority of the VGT of meatcomprised of poultry and fowl, which requires ∼11 times less waterfor production than beef; furthermore, the VGC of the feed issignificantly smaller in the ME region than it is in the CV and HP.Domestic food security in the United States is heavily reliant upon
the unsustainable extraction of groundwater in the HP, CV, andMEaquifer systems: The cereals produced by these aquifers amount to18.5% of the domestic cereal supply (Table 2). These groundwaterresources are especially critical for agricultural production duringtimes of drought, particularly in California (20). This buffer (i.e.,option) value of groundwater (33) is not currently accounted for butwill be increasingly important under a more variable future climate(34) with increased irrigation demands (35). Additionally, theseaquifers provide a trade advantage to the United States, accountingfor 8.6% of US cereal exports (Table 2). To protect US food securityand trade interests, domestic policy makers may want to considerslowing groundwater depletion by implementing policies that recog-nize the full value of groundwater, such as private watermarkets (33),which may encourage technology adoption.
International VGTs. Unsustainable “blue water” [i.e., fresh surfacewater and groundwater (29)] sources are estimated to comprise
Fig. 3. Ranking of US metropolitan areas that currently mostrely on virtual groundwater from each of the CV, HP, ME aqui-fers. The total volume virtually transferred to each US metro-politan area is provided, as well as the fraction of groundwaterwithdrawals from each aquifer system that this represents. Notethat the triangles are provided for graphic representation onlyand are not scaled according to size. Importantly, cities in thewestern United States are relatively reliant upon virtualgroundwater transfers from the CV aquifer, whereas virtualgroundwater transfers from the HP aquifer tend to be moredispersed across the United States, as they are with the MEaquifer, with the exception of the major shipping port of NewOrleans.
Table 1. VGC estimates for the SCTG food commodity groups ineach of the overexploited aquifers of the United States
SCTGcode SCTG name CV, m3/ton HP, m3/ton ME, m3/ton
01 Animals and fish (live) 1,570.7 303.7 9.002 Cereal grains
(including seed)271.5 68.4 129.4
03 Agricultural productsexcept for animalfeed (other)
Units are cubic meters of groundwater consumed per metric ton of production.
Marston et al. PNAS | July 14, 2015 | vol. 112 | no. 28 | 8563
SUST
AINABILITY
SCIENCE
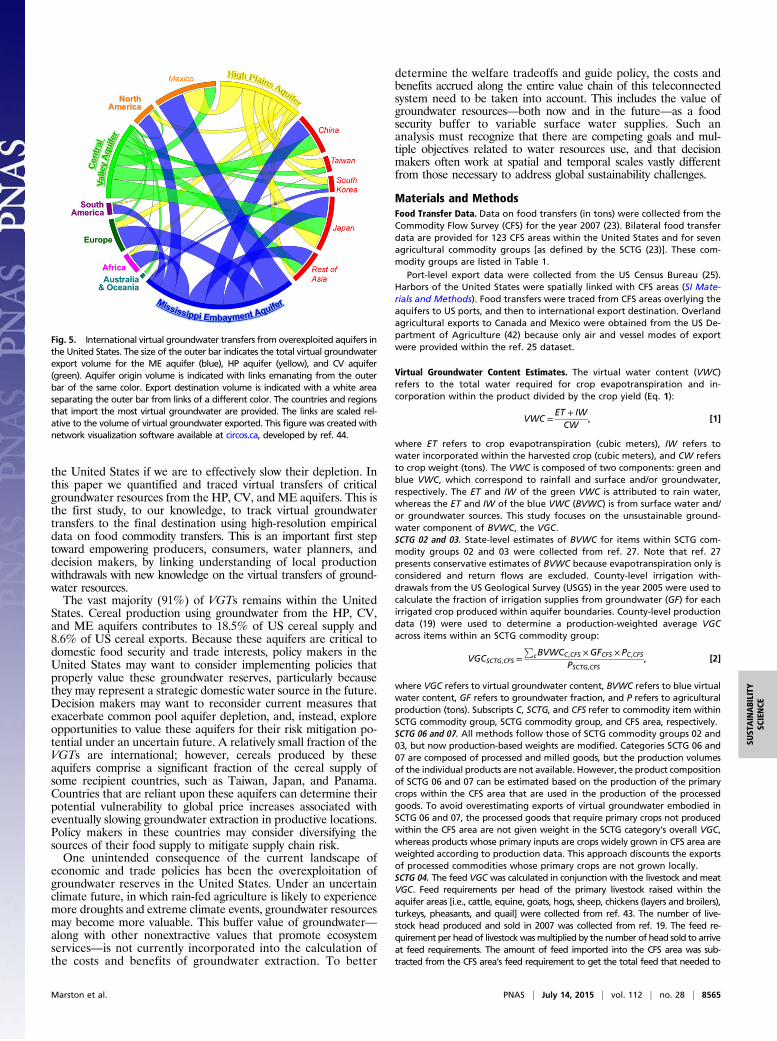
between 32 and 52% (estimated from refs. 36–38) of the globalblue water footprint of agricultural production. However, theoverexploited US aquifers comprise 35% of the US blue waterfootprint for agricultural production. Two-fifths of global virtualblue water exports from agriculture is attributed to unsustainablewater sources (calculated from ref. 36). However, only 13% of USvirtual blue water agriculture exports are from the HP, CV, andMEaquifers. Therefore, the United States relies less on nonrenewablewater sources for agriculture production and international exportof agricultural goods than the rest of the world as a whole.Fig. 5 shows the major international transfers of virtual
groundwater from the HP, CV, and ME aquifers. Asia is the topimporter of virtual groundwater from all three aquifers. Of all in-ternational VGT, approximately half goes to Asia. This findingparallels previous studies that show Asia as the principal importer ofUS agricultural goods and virtual water (26, 27, 39). Reduced ag-ricultural production due to aquifer depletion or policies restraininggroundwater withdrawals should be of particular interest to Taiwan,Japan, Panama, and Syria: They all depend on the three aquifers ofthis study for over 10% of their total cereal imports (Table 2).Table 2 presents the countries that are currently most reliant
upon cereals—critical for food security (e.g., ref. 40)—grown inthe HP, CV, and ME aquifers. Countries are ranked in order ofthe fraction contribution of cereals produced with these aquifers to
total domestic cereal supply (Table 2, column 4). Besides theUnited States itself, Taiwan is the country that is most reliant uponthese aquifers; 10.0% of its domestic cereal supply is produced bythese aquifers. These aquifers produce 9.2% of Japan’s cerealsupply and 9.1% of the cereal supply of Panama. Consumers inthese countries would be affected by rising world prices if agri-cultural production in the HP, CV, and ME aquifer systems wereto slow or halt. However, the willingness and ability of consumersto pay increased commodity prices differs across countries, suchthat some countries would be more affected than others.Panama, Costa Rica, and the Dominican Republic are the third,
fourth, and fifth most dependent on cereal imports fromUS aquifersto meet their domestic cereal requirements. However, these coun-tries do not import large volumes of virtual groundwater becausecereals have low VGC. Small, developing island nations, such asCook Islands and Samoa, as well as some arid Asian countries, suchas Mongolia, import relatively modest quantities of food from theUS aquifers, but they disproportionately import virtual groundwaterresources, because they import mostly meat and processed foodcommodities, which have the highest VGC. Agricultural land avail-ability, soil nutrients, and industrial capabilities—rather than water—are likely restricting local production of these commodities within theisland nations. Comparative advantage across a wide suite of factorsleads to complexities in the teleconnected food trade system, withunanticipated outcomes, such as nonlocal aquifer depletion.This analysis highlights international consumers that are most
vulnerable to eventual reductions in agricultural production fromunsustainably managed reserves of groundwater in the UnitedStates. Countries that are heavily reliant on these aquifers can usethis information to evaluate how their domestic food security willbe affected when agricultural production from these aquifers iseventually slowed or halted altogether. If future consumer welfareis at risk, then policy makers in those countries may want toconsider diversifying the sources of their food supply, with impli-cations for the global food trade system. Additionally, some con-sumers—currently not receiving a price signal of resource scarcity—may be willing to pay a premium now to store groundwater suppliesfor future food security. In principle, this could operate as a paymentfor ecosystem services (41). However, implementing the payment ofsuch a premium may prove challenging in practice, because foodcommodities are available cheaply on international markets, coun-teracting such an exchange and instead encouraging tragedy of thecommons behavior among consumers.
Concluding RemarksIt is imperative to understand the teleconnections and demandforces that are contributing to the unsustainable use of aquifers in
Table 2. Countries that are most reliant on cereals produced with groundwater from the CV, HP, and ME aquifers
Domestic cereal supply and total cereal import data (tons) were collected from the FAO (45). Countries are ranked in descending order by the fraction oftheir domestic cereal supply that originates from these three aquifers (column 4). Island nations that import more cereal than is required for their domesticsupply have been excluded (i.e., St. Vincent and the Grenadines, Trinidad and Tobago, Grenada, Jamaica, and Barbados).
Fig. 4. Percentage of virtual groundwater transfers attributed to each ofthe seven commodity groups in the HP, ME, and CV aquifers.
8564 | www.pnas.org/cgi/doi/10.1073/pnas.1500457112 Marston et al.
the United States if we are to effectively slow their depletion. Inthis paper we quantified and traced virtual transfers of criticalgroundwater resources from the HP, CV, and ME aquifers. This isthe first study, to our knowledge, to track virtual groundwatertransfers to the final destination using high-resolution empiricaldata on food commodity transfers. This is an important first steptoward empowering producers, consumers, water planners, anddecision makers, by linking understanding of local productionwithdrawals with new knowledge on the virtual transfers of ground-water resources.The vast majority (91%) of VGTs remains within the United
States. Cereal production using groundwater from the HP, CV,and ME aquifers contributes to 18.5% of US cereal supply and8.6% of US cereal exports. Because these aquifers are critical todomestic food security and trade interests, policy makers in theUnited States may want to consider implementing policies thatproperly value these groundwater reserves, particularly becausethey may represent a strategic domestic water source in the future.Decision makers may want to reconsider current measures thatexacerbate common pool aquifer depletion, and, instead, exploreopportunities to value these aquifers for their risk mitigation po-tential under an uncertain future. A relatively small fraction of theVGTs are international; however, cereals produced by theseaquifers comprise a significant fraction of the cereal supply ofsome recipient countries, such as Taiwan, Japan, and Panama.Countries that are reliant upon these aquifers can determine theirpotential vulnerability to global price increases associated witheventually slowing groundwater extraction in productive locations.Policy makers in these countries may consider diversifying thesources of their food supply to mitigate supply chain risk.One unintended consequence of the current landscape of
economic and trade policies has been the overexploitation ofgroundwater reserves in the United States. Under an uncertainclimate future, in which rain-fed agriculture is likely to experiencemore droughts and extreme climate events, groundwater resourcesmay become more valuable. This buffer value of groundwater—along with other nonextractive values that promote ecosystemservices—is not currently incorporated into the calculation ofthe costs and benefits of groundwater extraction. To better
determine the welfare tradeoffs and guide policy, the costs andbenefits accrued along the entire value chain of this teleconnectedsystem need to be taken into account. This includes the value ofgroundwater resources—both now and in the future—as a foodsecurity buffer to variable surface water supplies. Such ananalysis must recognize that there are competing goals and mul-tiple objectives related to water resources use, and that decisionmakers often work at spatial and temporal scales vastly differentfrom those necessary to address global sustainability challenges.
Materials and MethodsFood Transfer Data. Data on food transfers (in tons) were collected from theCommodity Flow Survey (CFS) for the year 2007 (23). Bilateral food transferdata are provided for 123 CFS areas within the United States and for sevenagricultural commodity groups [as defined by the SCTG (23)]. These com-modity groups are listed in Table 1.
Port-level export data were collected from the US Census Bureau (25).Harbors of the United States were spatially linked with CFS areas (SI Mate-rials and Methods). Food transfers were traced from CFS areas overlying theaquifers to US ports, and then to international export destination. Overlandagricultural exports to Canada and Mexico were obtained from the US De-partment of Agriculture (42) because only air and vessel modes of exportwere provided within the ref. 25 dataset.
Virtual Groundwater Content Estimates. The virtual water content (VWC)refers to the total water required for crop evapotranspiration and in-corporation within the product divided by the crop yield (Eq. 1):
VWC =ET + IWCW
, [1]
where ET refers to crop evapotranspiration (cubic meters), IW refers towater incorporated within the harvested crop (cubic meters), and CW refersto crop weight (tons). The VWC is composed of two components: green andblue VWC, which correspond to rainfall and surface and/or groundwater,respectively. The ET and IW of the green VWC is attributed to rain water,whereas the ET and IW of the blue VWC (BVWC) is from surface water and/or groundwater sources. This study focuses on the unsustainable ground-water component of BVWC, the VGC.SCTG 02 and 03. State-level estimates of BVWC for items within SCTG com-modity groups 02 and 03 were collected from ref. 27. Note that ref. 27presents conservative estimates of BVWC because evapotranspiration only isconsidered and return flows are excluded. County-level irrigation with-drawals from the US Geological Survey (USGS) in the year 2005 were used tocalculate the fraction of irrigation supplies from groundwater (GF) for eachirrigated crop produced within aquifer boundaries. County-level productiondata (19) were used to determine a production-weighted average VGCacross items within an SCTG commodity group:
VGCSCTG,CFS =P
cBVWCC,CFS ×GFCFS ×PC,CFSPSCTG,CFS
, [2]
where VGC refers to virtual groundwater content, BVWC refers to blue virtualwater content, GF refers to groundwater fraction, and P refers to agriculturalproduction (tons). Subscripts C, SCTG, and CFS refer to commodity item withinSCTG commodity group, SCTG commodity group, and CFS area, respectively.SCTG 06 and 07. All methods follow those of SCTG commodity groups 02 and03, but now production-based weights are modified. Categories SCTG 06 and07 are composed of processed and milled goods, but the production volumesof the individual products are not available. However, the product compositionof SCTG 06 and 07 can be estimated based on the production of the primarycrops within the CFS area that are used in the production of the processedgoods. To avoid overestimating exports of virtual groundwater embodied inSCTG 06 and 07, the processed goods that require primary crops not producedwithin the CFS area are not given weight in the SCTG category’s overall VGC,whereas products whose primary inputs are crops widely grown in CFS area areweighted according to production data. This approach discounts the exportsof processed commodities whose primary crops are not grown locally.SCTG 04. The feed VGC was calculated in conjunction with the livestock and meatVGC. Feed requirements per head of the primary livestock raised within theaquifer areas [i.e., cattle, equine, goats, hogs, sheep, chickens (layers and broilers),turkeys, pheasants, and quail] were collected from ref. 43. The number of live-stock head produced and sold in 2007 was collected from ref. 19. The feed re-quirement per head of livestockwasmultiplied by the number of head sold to arriveat feed requirements. The amount of feed imported into the CFS area was sub-tracted from the CFS area’s feed requirement to get the total feed that needed to
Fig. 5. International virtual groundwater transfers from overexploited aquifers inthe United States. The size of the outer bar indicates the total virtual groundwaterexport volume for the ME aquifer (blue), HP aquifer (yellow), and CV aquifer(green). Aquifer origin volume is indicated with links emanating from the outerbar of the same color. Export destination volume is indicated with a white areaseparating the outer bar from links of a different color. The countries and regionsthat import the most virtual groundwater are provided. The links are scaled rel-ative to the volume of virtual groundwater exported. This figure was created withnetwork visualization software available at circos.ca, developed by ref. 44.
Marston et al. PNAS | July 14, 2015 | vol. 112 | no. 28 | 8565
be produced within the CFS area. The vast majority of required feed (97%) wasproduced locally. It was assumed that SCTG 04 consists of the same feed composi-tion as the feed required for livestock inside the CFS area. To determine VGC offeed, the required tonnage of each crop within the feed composition was multi-plied by its VGC and then summed to get the total volume of virtual groundwaterof feed. The total virtual groundwater volume attributed to feed was divided bythe total tonnage of the feed crops to get the feed VGC for each CFS area.SCTG 01 and 05. The volume of virtual groundwater of the required feed wasdivided by the total tonnage of livestock to get the feed component of theVGCof animal production within each CFS area. The required water for drinking andfor servicing of livestock (from ref. 43) was multiplied by the fraction that wastaken from groundwater (17) to get the amount of groundwater used per head ofeach animal. This was then multiplied by the number of each animal sold in 2007(19) to get the volume of groundwater required for drinking and servicing for eachanimal type. The required groundwater volume for each animal typewas summedand then divided by the total animal tonnage to get the component of theanimal production VGC within each CFS area attributed to drinking andservicing. This was added to the corresponding VGC of feed production toarrive at the total VGC for all livestock sold from within the CFS areaboundaries. The VGCs differ between SCTG 01 and SCTG 05 because thevirtual groundwater volume is divided by the live animal tonnage for SCTG01, whereas it is divided by the edible fraction (per ref. 26) for SCTG 05. Inthis way, the VGC corresponding to SCTG 01 and SCTG 05 are weighted bythe tonnage sold or butchered of each animal type within the CFS area:
VGCSCTG,CFS =ðFRCFS − FICFSÞ×VGCSCTG04,CFS
PSCTG,CFS
+P
CWRC,CFS ×GFCFS × PC,CFSPSCTG,CFS
+P
CSRC,CFS ×GFCFS × PC,CFSPSCTG,CFS
,[3]
where FR refers to feed requirement (tons), FI refers to imported feed (tons),WR refers to livestock water requirement (cubic meters per ton), and SRrefers to livestock servicing requirement (cubic meters per ton). All otheracronyms and subscripts follow those above.
VGTs. The food transfer data were multiplied by the virtual groundwatercontent to arrive at virtual groundwater transfers:
VGTSCTG,O,D =VGCSCTG,O × FTSCTG,O,D, [4]
where VGT indicates virtual groundwater transfer (cubic meters), VGC in-dicates virtual groundwater content (cubic meters per ton), and FT indicatesfood transfers (tons). Subscripts SCTG, O, and D indicate food commoditygroup, origin CFS area, and destination, respectively. In this way, VGT vol-umes are tracked from aquifer areas to their final destination.
ACKNOWLEDGMENTS. Jimmy Chang contributed to the data processing in-volved in this study as an undergraduate researcher in M.K.’s group; we thankthe Research Experience for Undergraduates Program in the Civil and Envi-ronmental Engineering Department at the University of Illinois at Urbana–Champaign for his support. We thank Kathy Baylis, Tami Bond, Nick Brozovic,Kelly Caylor, Tatyana Deryugina, Don Fullerton, Hope Michelson, IgnacioRodriguez-Iturbe, and Praveen Kumar for feedback. L.M. is thankful forsupport from the Department of Defense through the National DefenseScience & Engineering Graduate Fellowship Program (32 CFR 168a), USNational Science Foundation Grant CBET-0747276, and the Environmen-tal Hydrology and Hydraulic Engineering Group Fellowship of the Civiland Environmental Engineering Department at the University of Illinoisat Urbana–Champaign.
1. Seto KC, et al. (2012) Urban land teleconnections and sustainability. Proc Natl Acad SciUSA 109(20):7687–7692.
2. Liu J, et al. (2013) Framing sustainability in a telecoupled world. Ecol Soc 18(2):26.3. Liu J, et al. (2015) Systems integration for global sustainability. Science 347(6225):
1258832.4. Vörösmarty CJ, Green P, Salisbury J, Lammers RB (2000) Global water resources: vul-
nerability from climate change and population growth. Science 289(5477):284–288.5. Hoekstra AY, Chapagain AK (2008) Globalization of Water: Sharing the Planet’s
Freshwater Resources (Blackwell, Oxford), Vol 8, p 224.6. Hoff H (2009) Global water resources and their management. Curr Opin Environ
Sustain 1(2):141–147.7. Allan J (1998) Virtual water: A strategic resource global solutions to regional deficits.
Ground Water 36(4):545–546.8. Hoekstra AY, Hung P (2005) Globalisation of water resources: International virtual
water flows in relation to crop trade. Glob Environ Change 15(1):45–56.9. Konikow LF, Kendy E (2005) Groundwater depletion: A global problem.Hydrogeol J 13(1):
317–320.10. Döll P, et al. (2012) Impact of water withdrawals from groundwater and surface water
on continental water storage variations. J Geodyn 59:143–156.11. Döll P (2009) Vulnerability to the impact of climate change on renewable ground-
water resources: A global-scale assessment. Environ Res Lett 4:035006.12. Gleick PH, Palaniappan M (2010) Peak water limits to freshwater withdrawal and use.
Proc Natl Acad Sci USA 107(25):11155–11162.13. Wada Y, et al. (2010) Global depletion of groundwater resources. Geophys Res Lett
37:L20402.14. Gleeson T, Wada Y, Bierkens MFP, van Beek LPH (2012) Water balance of global
aquifers revealed by groundwater footprint. Nature 488(7410):197–200.15. Castle SL, et al. (2014) Groundwater depletion during drought threatens future water
security of the Colorado River Basin. Geophys Res Lett 41(16):5904–5911.16. Hanjra Ma, Qureshi ME (2010) Global water crisis and future food security in an era of
climate change. Food Policy 35(5):365–377.17. United States Geological Survey (2014) Estimated Use of Water in the United States
(US Geological Survey, Reston, VA). Available at water.usgs.gov/watuse/data/2005/index.html. Accessed November 3, 2014.
18. Richter BD, et al. (2013) Tapped out: How can cities secure their water future? WaterPolicy 15(3):335–363.
19. United States Department of Agriculture (2014) National Agricultural Statistics Service(Washington, DC). Available at www.nass.usda.gov. Accessed November 3, 2014.
20. Scanlon BR, et al. (2012) Groundwater depletion and sustainability of irrigation in theUS High Plains and Central Valley. Proc Natl Acad Sci USA 109(24):9320–9325.
21. Konikow LF (2013) Groundwater Depletion in the United States (1900–2008). Scien-tific Investigations Report 2013-5079 (US Geological Survey, Reston, VA).
22. Zhao X, et al. (2015) Physical and virtual water transfers for regional water stressalleviation in China. Proc Natl Acad Sci USA 112(4):1031–1035.
23. United State Census Bureau (2014) Commodity Flow Survey (US Census Bureau,Washington, DC). Available at www.census.gov/econ/cfs. Accessed November 3, 2014.
24. Lin X, Dang Q, Konar M (2014) A network analysis of food flows within the UnitedStates of America. Environ Sci Technol 48(10):5439–5447.
25. United State Census Bureau (2014) USA Trade Online (US Census Bureau, Washington,DC). Available at https://usatrade.census.gov/. Accessed November 3, 2014.
26. Mekonnen M, Hoekstra AY (2012) A global assessment of the water footprint of farmanimal products. Ecosystems (N Y) 15(3):401–415.
27. Mekonnen M, Hoekstra AY (2010) The green, blue and grey water footprint of cropsand derived crop products. Hydrol Earth Syst Sci 15:1577–1600.
28. Gleick PH (2003) Global freshwater resources: Soft-path solutions for the 21st century.Science 302(5650):1524–1528.
29. Falkenmark M, Molden D (2008) Wake up to realities of river basin closure. Int JWater Resour Dev 24(2):201–215.
30. Molle F, Berkoff J (2009) Cities vs. agriculture: A review of intersectoral water re-allocation. Nat Resour Forum 33(1):6–18.
31. Tinbergen J (1962) An analysis of world trade flows. Shaping the World Economy:Suggestions for an International Economic Policy, ed Tinbergen J (Twentieth CenturyFund, New York).
32. Clark B, Hart R, Gurdak J (2011) Groundwater availability of the Mississippi Embay-ment. USGS Professional Paper 1785 (US Geological Survey, Reston, VA.
33. Qureshi ME, et al. (2012) Factors determining the economic value of groundwater.Hydrogeol J 20(5):821–829.
34. Taylor RG, et al. (2013) Groundwater and climate change. Nature Climate Change3(4):322–329.
35. Zhang X, Cai X (2013) Climate change impacts on global agricultural water deficit.Geophys Res Lett 40(6):1111–1117.
36. Hanasaki N, Inuzuka T, Kanae S, Oki T (2010) An estimation of global virtual waterflow and sources of water withdrawal for major crops and livestock products using aglobal hydrological model. J Hydrol (Amst) 384(3-4):232–244.
37. Vörösmarty CJ, et al. (2005) Fresh water. Ecosystems and Human Well-Being: CurrentState and Trends: Findings of the Condition and Trends Working Group, eds Hassan R,Scholes R, Ash N (Island, Washington, DC), pp 165–207.
38. Rost S, et al. (2008) Agricultural green and blue water consumption and its influenceon the global water system. Water Resour Res 44:W09405.
39. Konar M, et al. (2011) Water for food: The global virtual water trade network. WaterResour Res 47:W05520.
40. Foley JA, et al. (2011) Solutions for a cultivated planet. Nature 478(7369):337–342.41. Naeem S, et al. (2015) Environment and development. Get the science right when
paying for nature’s services. Science 347(6227):1206–1207.42. United States Department of Agriculture (2014) Global Agricultural Trade System
(USDA, Washington, DC). Available at apps.fas.usda.gov/gats/default.aspx. AccessedDecember 13, 2014.
43. Chapagain A, Hoekstra AY (2003) Virtual Water Flows Between Nations in Relation toTrade in Livestock Products. UNESCO-IHE Research Report Series No. 13 (UNESCO-IHE,Delft, The Netherlands).
44. Krzywinski M, et al. (2009) Circos: An information aesthetic for comparative geno-mics. Genome Res 19(9):1639–1645.
45. Food and Agriculture Organization (2014) FAOSTAT on-line database (Food andAgriculture Organization, Rome). Available at faostat3.fao.org/home/E. AccessedDecember 13, 2014.
8566 | www.pnas.org/cgi/doi/10.1073/pnas.1500457112 Marston et al.