I I I I I I I I I I I p I I 1EI i i i ECORO COPY PPT» »OM --~ —vsässr- (INTERIM REPORT) C0PV NR - SCIM -A METER FOR MEASURING THE PERFORMANCE OF SPEECH COMMUNICATION SYSTEMS TECHNICAL DOCUMENTARY REPORT NO. ESD-TDR-64-674 COPIES OCTOBER 1964 Kar! D. Kryter Jay H. Ball figTI PROCESSED D DDC TAB D PROJ OFFICER D ACCESSJON MASTER FILE D DATE, ESTI CONTROL NR. AL 45135 CY NR. OF- i- -era « e~?£ SCIENCE S LABORATORY ELECTRONIC SYSTEMS DIVISION AIR FORCE SYSTEMS COMMAND UNITED STATES AIR FORCE L.G. Hanscom Field, Bedford, Massachusetts Project 2808, Task 280802 (Prepared under Contract No. AF 19 (MR\ OAAD L » . » Cambridge, Massachusetts.? < 628 )" 2 ^3 by Bolt Beranek and Newman Inc., •ßUkKbf^
Transcript
I I I I I I I I
I I I p I I 1EI
i i i
ECORO COPY PPT» »OM --~
—vsässr- (INTERIM REPORT) C0PV NR -
SCIM -A METER FOR MEASURING THE PERFORMANCE
OF SPEECH COMMUNICATION SYSTEMS
TECHNICAL DOCUMENTARY REPORT NO. ESD-TDR-64-674
COPIES
OCTOBER 1964
Kar! D. Kryter Jay H. Ball
figTI PROCESSED
D DDC TAB D PROJ OFFICER
D ACCESSJON MASTER FILE
D
DATE,
ESTI CONTROL NR. AL 45135
CY NR. OF- i- -era
« e~?£ SCIENCES LABORATORY ELECTRONIC SYSTEMS DIVISION AIR FORCE SYSTEMS COMMAND
UNITED STATES AIR FORCE L.G. Hanscom Field, Bedford, Massachusetts
Project 2808, Task 280802
(Prepared under Contract No. AF 19 (MR\ OAAD L » . » Cambridge, Massachusetts.? <628)"2^3 by Bolt Beranek and Newman Inc.,
•ßUkKbf^
DDC AVAILABILITY
Qualified requesters may obtain copies from Defense Documentation Center (DDC). Orders will be expedited If placed through the librarian or other person designated to request docu- ments from DDC*
DISSEMINATION NOTICE
Copies available at Office of Technical Services, Department of Commerce«
LEGAL NOTICE
When US Government drawings, specifications or other data are used for any purpose other than a definitely related government procurement operation, the government thereby incurs no responsibility nor any obligation whatsoever; and the fact that the government may have formulated, furnished, or in any way supplied the said draw- ings, specifications, or other data is not to be regarded by implication or otherwise as in any manner licensing the holder or any other person or conveying any rights or permission to manufacture, use, or sell any patented invention that may in any way be related thereta. QTHER ^^
Do not return this copy. Retain or destroy.
ESD-TDR-64-674
(INTERIM REPORT)
SCIM — A METER FOR MEASURING THE PERFORMANCE
OF SPEECH COMMUNICATION SYSTEMS
TECHNICAL DOCUMENTARY REPORT NO. ESD-TDR-64-674
OCTOBER 1964
Karl D. Kryter Jay H. Ball
DECISION SCIENCES LABORATORY ELECTRONIC SYSTEMS DIVISION AIR FORCE SYSTEMS COMMAND
UNITED STATES AIR FORCE L. G. Hanscom Field, Bedford, Massachusetts
Project 2808, Task 280802
(Prepared under Contract No. AF 19 (628)-2463 by Bolt Beranek and Newman Inc. , Cambridge, Massachusetts.)
FOREWORD
This technical report presents the results of a study performed by Bolt, Beranek and Newman, Inc., Cambridge, Massachusetts, on Air Force Contract AF 19(628)-2U63- This contract was initiated under Project 2808, "Psychoacoustic Standards in Voice Communication System Evaluation," Task 28o802. This task was monitored under the direction of the Decision Sciences Laboratory, Mr. Stephen E. Stuntz, ESRHA.
ESD-TDR-64-674
TABLE OP CONTENTS
Page
SECTION 1 INTRODUCTION 1
SECTION 2 GENERAL RELATIONS BETWEEN INTELLIGIBILITY AND PHYSICAL CHARACTERISTICS OP SPEECH 3
SECTION 3 SCIM 15
SECTION 4 TEST RESULTS 28
SECTION 5 FUTURE DEVELOPMENTS 34
REFERENCES 36
DOCUMENT CONTROL DATA - R+D 37
ILLUSTRATIONS
Fig, 1 Showing Four Curves Relating Different Measures of Speech Level to Frequency (after Dunn and White?) 5
2 Threshold Shift Due to a 350-450 cps Masking Noise at 85 dB Overall Sound Pressure Level (after Carter and Kryter°) 6
Work Sheet for the Calculation of the Articu- lation Index (Al). Speech Spectrum Plotted is the Long-Term RMS of Speech Plus 12 dB, the Dashed Curve is the Spread-of-Masking to be Expected from the Octave Band of Noise that is Plotted on the Curve (see Ref. 2) 8
Showing the Increase in RMS Speech Power as a Function of Clipping when Clipped Level is Raised to Clipping Reference Level (after Wathen-Dunn and Lipke?) 10
Comparison of Obtained and Predicted Test Scores for Broad-Band Speech in the Presence of Narrow Bands of Noise Set at Various Intensity Levels (after Miller8) 12
ESD-TDR-64-674
TABLE OP CONTENTS (cont'd) Page
Pig. 6 Comparison of Obtained and Predicted Test Scores for Speech Passed through a Bandpass Filter and Heard in the Presence of Broad- Band Negatively Sloped Spectrum Noise Set at Various Intensity Levels (after Egan and Wiener9) 13
7 Relation between AI and Various Measures of Speech Intelligibility (after French and Steinberg1 and Miller0) 14
8 Photo of Signal Generator 16
9 Simplified Block Diagram of Signal Generator. 17
10 Test Signal Sequence 18
11 Photo of Analyzer 20
12 Simplified Block Diagram of Analyzer 21
13 SCI Multiplier vs. Frequency Shift 27
14 Showing the Maximum, Minimum and Average Values of the Deviation of Five Measured SCI's from the Calculated AI*s at S/N Ratios from -10 dB to +22 dB 29
15 Showing Percent MR Test Scores as a Function of SCI for Laboratory Speech Systems, AF H-F SSB, and Microwave Radio Systems (see Table 1) 32
SCIM -- A METER FOR MEASURING THE PERFORMANCE
OF SPEECH COMMUNICATION SYSTEMS
ABSTRACT
Two major theories have emerged that attempt to relate in a
quantitative way the physical characteristics of a speech com-
munication system and the intelligibility of speech as perceived
by a crew of trained listeners.
The more widely used theory is the basis for the "Articulation
Index" (AI) formulated in 19^7 by N. R. French and J. C. Stein-
berg of the Bell Telephone Laboratories. This theory holds
that the signal (speech)-to-noise ratio (in 20 narrow frequency
bands) of a communication system will, when properly weighted
and summed, provide an AI value that is directly related to the
intelligibility of speech heard over that system.
A second theoretical approach to this problem is embodied in the
Pattern Correspondence Index (PCI) machine proposed by J.C.R.
Licklider in 1956. This instrument determines the correlation
in the frequency and time domains between the speech input to a
communication system and the speech output of that system.
The subject of the present paper is an electronic device called
SCIM (Speech Communication Index Meter) that is designed primarily
in terms of the Articulation Index theory; however, SCIM accom-
modates additional factors affecting speech that are not involved
in the original procedures for calculating AI. The SCIM signal
generator generates a 3-second signal burst, which is fed to the
electrical input of the system under test; within 12 seconds the
SCIM analyzer, located at the receiving station, calculates and
displays an index, ranging from .00 to .99* which reflects the
ability of that system to transmit intelligible speech.
iii
Although devices based on similar principles have been previously
developed, SCIM measures several parameters affecting the per-
formance of a speech system differently than previous instruments.
SCIM was designed to be relatively small, have small power re-
quirements, be capable of remote digital readout, and contain
other features to make it suitable for field, fixed station or
laboratory use.
The results of SCIM measurements and actual speech intelligibility
tests obtained from a variety of communication systems and
operating conditions will be presented.
REVIEW AND APPROVAL
This tec pport has been reviewed^nd is approved.
/ JOS^T^BEidS^'^T^ ROY MORGAN P Chief, Applications division Colonel, USAF Decision Sciences Laboratory
etc.) and (2) the objective monitoring of the performance of
communication systems during actual operations or under
simulated operational conditions.
The task, of course, has been made difficult because, physi-
cally, the speech has such complex and dynamic characteristics,
and secondly because the information content of the speech
signal, as perceived by the human listener, is not always
simply related to the physical nature of the speech signal,
at least insofar as our present methods of physical analysis
would indicate.
Speech intelligibility or speech articulation tests provide,
when properly used, a reasonably accurate and valid procedure
for measuring differences in the performance of communications
equipment and systems. However, these psychological tests,
which usually require laboratory conditions for their admin-
istration and specially trained crews of talkers and listeners,
are costly and time-consuming, and, in most cases, cannot be
readily applied to the measurement of speech systems under
"real life" operational conditions.
Nevertheless, from 30 odd years of laboratory research with
speech intelligibility and articulation tests, there has
-1-
emerged a rather extensive set of facts about the relation
between measurable physical characteristics of the received
speech signal, including the noise, if any, present with the
speech and the understandability of speech as perceived by
listeners. Various investigators have attempted to use this
knowledge to develop methods of system evaluation that avoid
the speech testing process per se, but yet provide a measure
that is interpretable in terms of speech understandability.
One outcome of this latter effort has been the development
of methods for calculating from physical measurements of a
communication system what the intelligibility of speech
should be over that system; a secondary outcome has been the
design of electronic test devices which, when applied to a
speech communication system, automatically evaluate the per-
formance of that speech system.
The purposes of the present paper are: (l) to outline briefly
the theory and scientific basis for the design of one such
test instrument (called the Speech Communication Index Meter,
"SCIM") for measuring the performance of speech communication
systems; (2) a description of the SCIM device; and (3) a
comparison of the measurements achieved by the SCIM instrument
for a variety of speech communication systems with the results
of speech intelligibility tests obtained for the same systems.
-2-
SECTION 2
GENERAL RELATIONS BETWEEN INTELLIGIBILITY AND PHYSICAL
CHARACTERISTICS OF SPEECH
Two major theories have emerged that attempt to relate in a
quantitative way the physical characteristics of a speech
communication system and the intelligibility of speech as
perceived by a crew of trained listeners.
The more widely used theory is the basis for the "Articulation
Index" (Al) formulated in 19^7 by N. R. French and J. C.
Steinberg of the Bell Telephone Laboratories. This theory
holds that the speech-to-noise ratio, in 20 narrow frequency
bands, of a communication system will provide an AI value
that is directly related to the intelligibility of speech
heard over that system.
A second theoretical approach to this problem is embodied
in the Pattern Correspondence Index (PCI) machine proposed
by J. C. R. Licklider in 1956. This instrument determines
the correlation in the frequency and time domains between
the speech input to a communication system and the speech
output of that system.
SCIM is designed primarily in terms of the Articulation Index
theory; however, SCIM accommodates additional factors affect-
ing speech that are not Involved in the original procedures
for calculating AI.
-3-
In order to explain the Articulation Index, it is necessary
to describe some of the general characteristics of the speech
signal and of masking by noise.
Figure 1 shows the variations in the pressure of conversa-
tional speech measured over short, l/8-second intervals of
time (l/8 second was chosen because it represents the average
duration of individual speech sounds) as a function of fre-
quency. The graph is plotted in terms of the pressure per
cycle; we see that speech contains energy over the frequency
range from at least 100 to 7000 cps and that the range of
pressures is in excess of 30 dB over this entire frequency
range. This range of pressures is the range found among
individual speech sounds when the speech is uttered at a
supposedly normal constant level of effort. It does not
represent the range between weak talking or shouting, or
amongst different talkers. This figure demonstrates the
complex and dynamic nature of the speech signal.
Masking. A factor which enters into the calculation of AI
is the masking effect of noise; noise containing sufficient
energy, at a given point on the frequency scale, can mask or
prevent the reception of speech components not only in the
same frequency region, but also frequency components of
speech that lie above and below the frequency components of
the noise. Upward spread-of-masking, in which a low-frequency
tone or noise masks a higher frequency portion of the speech
spectrum, is far more severe than downward spread-of-masking,
in which the masking tone is higher in frequency than the
signal of interest. Figure 2 illustrates the effect of this ?T spread-of-masking" phenomenon upon the perception of pure
tones.
-4-
Ul Q_
100
*
200
Re 0.0002Mbor
500 1000 2000 FREQUENCY(cps)
5000
FIG.l SHOWING FOUR CURVES RELATING DIFFERENT MEASURES OF SPEECH LEVEL TO FREQUENCY (AFTER DUNN AND WHITE5)
Peak instantaneous pressures
\- Speech peaks
Long-time rms pressures
J—Speech minima
10000
00
80
CD Q 60
I
i
X If)
o X if) LU or X
40
20
0
-20
c u i CT rvi ir Tr*
NARROW BAND NOISE
THRESHOLD SHIFT DUE TO WHITE NOISE FLOOR
SENSATION LEVEL OF THE MASKING NOISE
7 ^
/
/
/
I
i /^ \
i «^-
./
\ . «
f i
x^
V J x w^
20 56789 2 3 456789
100 1000 FREQUENCY IN CYCLES PER SECOND
5 6 7 8 9 10,000
FIG.2 THRESHOLD SHIFT DUE TO A 350-450 CPS MASKING NOISE AT 85 DB OVERALL SOUND PRESSURE LEVEL (AFTER CARTER AND KRYTER6)
Figure 2 shows that a narrow band of noise centered at 400 cps
would mask information around 800 cps as effectively as a
band of noise centered at 800 cps but of 18 dB less amplitude
than the band centered at 400 cps; it would also mask infor-
mation at l600 cps to much the same degree as would a -30 dB
band of noise located at l600 cps.
Calculation of the Articulation Index. As previously mentioned,
the AI of a speech communications link is normally calculated
by measuring the speech-to-noise (S/N) ratio in a number of
frequency bands; the AI is defined as the weighted sum of
these S/N ratios. There are two fundamental restrictions
placed upon the calculated AI -- namely, that it can never be
less than 0.00 and that it may never exceed 1.00. To implement
the former restriction, we assume that all measured S/N ratios
less than -12 dB are equal to -12 dB; and, since the band-
weighting functions are derived so that the AI equals 1.00
when the S/N ratio in all bands is +18 dB, we assume that all
S/N ratios in excess of +18 dB are equal to +18 dB. Figure 3
illustrates the general concept and work sheet utilized for
the calculation of AI. In Fig. 3 the speech spectrum is
divided into 20 narrow bands; these bands have been chosen
so that each band contributes equally to speech intelligibility.
Also, it is seen that speech at very weak and very intense
levels does not contribute to intelligibility because it ex-
ceeds the limits of the normal ear.
On Fig. 3, we have sketched the speech spectrum that might be
present at the listener's ear from a typical speech system
along with an octave band of masking noise that is also pre-
sumed to be mixed with the speech at the listener's ear. Note
that the masking spectrum, due to the aforementioned upward
-7-
I 00
100 200
*Re 0.0002 ^bar
500 1000 FREQUENCY (cps)
2000 5000 10000
FIG.3 WORK SHEET FOR THE CALCULATION OF THE ARTICULATION INDEX (Al). SPEECH SPECTRUM PLOTTED IS THE LONG-TERM RMS OF SPEECH PLUS 12DB, THE DASHED CURVE IS THE SPREAD-OF-MASKING TO BE EXPECTED FROM
spread-of-masking of the noise exceeds, at the higher fre- 2
quencies the actual noise spectrum. The AI is calculated
by taking the S/N ratios between the plotted speech
spectrum (long-term rms plus 12 dB) and the noise or mask-
ing spectrum, whichever is the greater for each of the
20 bands, weighting proportionately each S/N ratio so that
+30 dB equals 1.00 and 0 dB equals 0, summing the result
and dividing by 20.
Frequency shift. The AI must be corrected for factors other
than noise that affect intelligibility. One such factor is
frequency shift. If a single sideband ratio receiver is not
tuned precisely to the carrier frequency of the transmitter,
the detected speech signal will appear shifted upwards or
downwards by an amount equal to the mismatch between the
transmitted carrier frequency and the receiver local oscil-
lator frequency. While upward shifts in the speech spectrum
of 100 cps or more can be tolerated, a downward shift of
50 cps can have a devastating effect upon the intelligibility
of the speech.
The correction factor to be applied because of the presence of
frequency shift will be shown in a later figure.
Peak clipping. Peak clipping is still another factor which
enters into the calculation of AI. Figure 4 shows the in-
crease (over undipped speech of the same peak amplitude) in
the long-term rms pressure of peak-clipped speech as a func-
tion of the amount of clipping and subsequent reamplification
-9-
AMOUNT OF PEAK-CLIPPING AND POST-CLIPPING AMPLIFICATION IN DB (PEAK AMPLITUDE DEFINED BY O.OOI PROBABILITY LEVEL IN DISTRIBUTION OF INSTANTANEOUS AMPLITUDES)
FIG.4 SHOWING THE INCREASE IN RMS SPEECH POWER AS A FUNCTION OF CLIPPING WHEN CLIPPED LEVEL IS RAISED TO CLIPPING REFERENCE LEVEL (AFTER WATHEN-DUNN AND LIPKE7)
-10-
required to restore the undipped peak levels. Peak clipping
must be taken into account when calculating AI because the intel-
ligibility of speech is, to a first approximation, proportional
to the long-term rms signal-to-noise ratio and not to the peak
S/N ratio.
Validity of AI. The validity of the AI concept has been well
established for a wide variety of speech communication systems.
Some of the results of the application of the AI calculation
procedure to speech systems for which speech intelligibility
test scores were available are presented in Pigs. 5 and 6.
Figure 7 shows the relation between AI and different types of
speech test materials. It is to be noted that the percentage
of test items correctly perceived is dependent not only on the
speech material -- nonsense syllables, words, or sentences -- but also the size of the message set, whether, for example, the
test vocabulary consisted of a 1000, 256, or 32 "PB" (so-called
phonetically balanced) words.
-11-
0.4 0.6 ARTICULATION INDEX
FIG.5 COMPARISON OF OBTAINED AND PREDICTED TEST SCORES FOR BROAD-BAND SPEECH IN THE PRESENCE OF NARROW BANDS OF NOISE SET AT VARIOUS INTENSITY LEVELS (AFTER MILLER8)
-12-
100
o Lü tr £80 o CO LLJ
CD <
>- CO
LU CO
UJ CO
60
40
UJ u LU CL
20
^m\
A fiX
>x*^"
• ■ ■
X
/l
7 NOISE SPECTRUM "B"
FILTER PASS BAND
NO. i • 130-9200 CPS N0.2 x 340-3900 NO. 3 O 550-2500
F ^
^
NO. 5
1
V
550-
1 1
1500
1 I 1 0 0.2 0.4 0.6
ARTICULATION INDEX 0.8 1.0
FIG.6 COMPARISON OF OBTAINED AND PREDICTED TEST SCORES FOR SPEECH PASSED THROUGH A BANDPASS FILTER AND HEARD IN THE PRESENCE OF A BROAD-BAND NEGATIVELY SLOPED SPECTRUM NOISE SET AT VARIOUS INTENSITY LEVELS (AFTER EGAN AND WIENER9)
-13-
100
o er Lü er
i
Q O o 00 er Lü Q 70
90
80
CO LÜ CJ>
LU co
er o CO Q er o
60
50
40
^30 CO LU _J CD
« 20
>- CO
10
0
-TEST VOCABULARY LIMITED T0 32 PB WORDS
SENTE NCES-
\ PB WORDS (1000 DIFFERENT WORDS)
MOM-^FM^F ^Yl 1 ARI FQ IN U IM JLINOL J ILLMDLLJ
(1000 DIFFERENT SYLLABLES)
\
-TEST VOCABULARY LIMITED T0 256 PB WORDS
NOTE: THESE RELATIONS ARE APPROXIMATE, THEY DEPEND UPON Skll 1 OF TAI KFRS AND
LISTEN ERS
0 0.1 0.2 0.3 0.4 0.5 0.6 0.7 ARTICULATION INDEX
0.8 0.9 1.0
FIG.7 RELATION BETWEEN Al AND VARIOUS MEASURES OF SPEECH INTELLIGIBILITY (AFTER FRENCH AND STEINBERG1 AND MILLER«)
-14-
SECTION 3
SCIM
Although the AI procedure is objective, it requires tedious
calculations from physical data about speech systems that are
not always easily obtained.
The Speech Communication Index Meter is an electronic device
which automatically calculates, albeit in a somewhat simplified
fashion, the AI of any given speech system. There has been at
least one previous instrument built on similar principles.
General Electronics Laboratories Inc. of Cambridge, Massachu-
setts, designed and built for the U. S. Army an instrument
called the Voice Interference Analysis Set (VIAS) which also
estimates the AI of speech systems. VIAS differs, however, in
a number of respects from SCIM, both in the type of signals
utilized for system testing and in the processing and analysis
of these signals.
Signal generator. The SCIM signal generator, shown in Figs.
8 and 9, located at the transmitting terminal of the link
under test normally presents for transmission a continuous
1 kc calibration tone. When the START button is depressed,
the signal generator synchronizes itself, resulting in a maxi-
mum delay of one second before the beginning of the test
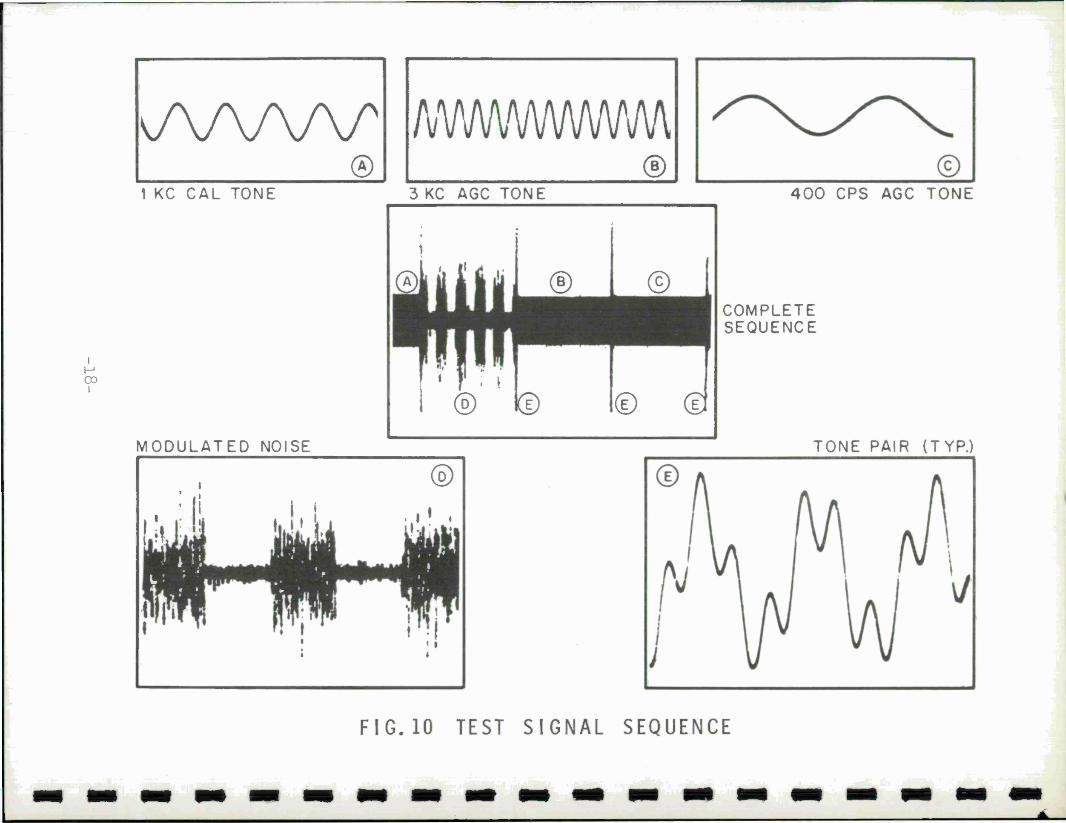
sequence shown in Fig. 10.
The sequence begins with the replacement of the 1000 cps cali-
bration tone by a 30-millisecond sync burst. The burst consists
of the sum of a 600 cps sine wave and a 2000 cps sine wave; the
function of the burst is, of course, to signal the analyzer that
the test sequence has begun.
Following the sync burst there appears a "speech" signal, pro-
duced by square-wave modulating a shaped-spectrum random noise
-15-
i
FIG. 8 PHOTO OF SIGNAL GENERATOR
I
NOISE SOURCE
SPECTRUM SHAPING FILTER
SYNC. GENERATOR
MODULATOR
3 KC OSCILLATOR
I KC OSCILLATOR
■O 6
7L
400 CPS OSCILLATOR
SIGNAL OUT TO SYSTEM UNDER TEST
FIG.9 SIMPLIFIED BLOCK DIAGRAM OF SIGNAL GENERATOR
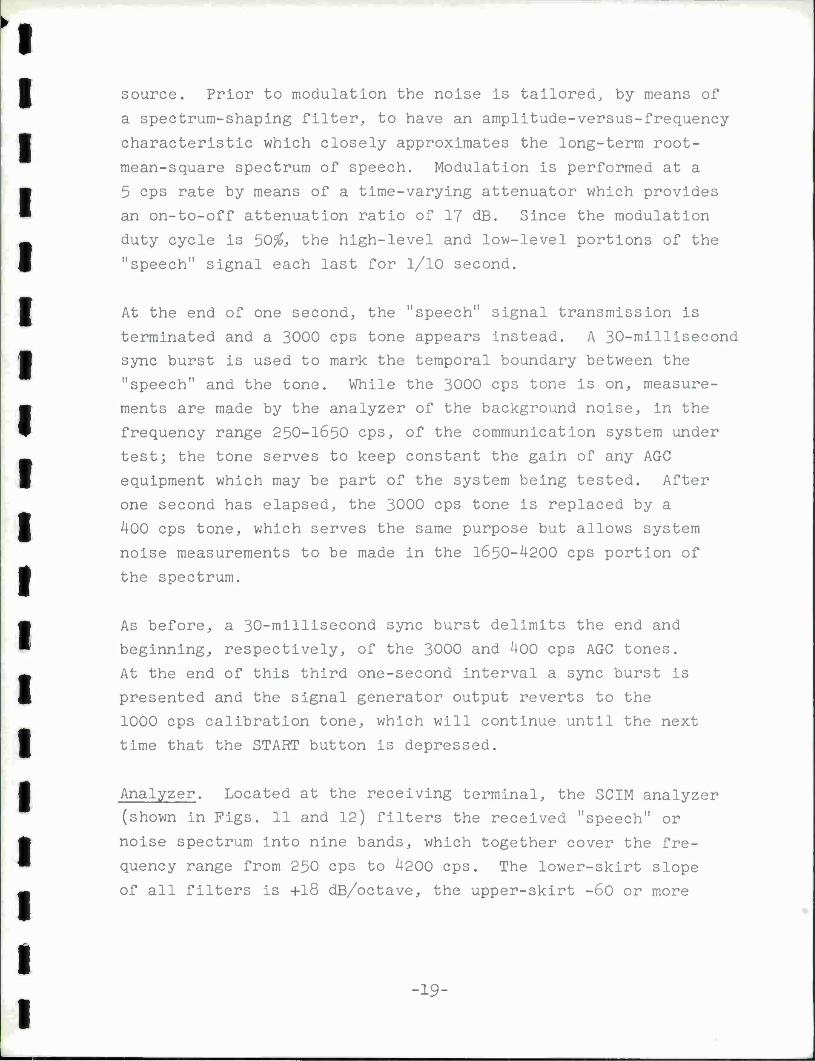
source. Prior to modulation the noise is tailored, by means of
a spectrum-shaping filter, to have an amplitude-versus-frequency
characteristic which closely approximates the long-term root-
mean-square spectrum of speech. Modulation is performed at a
5 cps rate by means of a time-varying attenuator which provides
an on-to-off attenuation ratio of 17 dB. Since the modulation
duty cycle is 50%, the high-level and low-level portions of the
"speech" signal each last for 1/10 second.
At the end of one second, the "speech" signal transmission is
terminated and a 3000 cps tone appears instead. A 30-millisecond
sync burst is used to mark the temporal boundary between the
"speech" and the tone. While the 3000 cps tone is on, measure-
ments are made by the analyzer of the background noise, in the
frequency range 250-1650 cps, of the communication system under
test; the tone serves to keep constant the gain of any AGC
equipment which may be part of the system being tested. After
one second has elapsed, the 3000 cps tone is replaced by a
400 cps tone, which serves the same purpose but allows system
noise measurements to be made in the 1650-4200 cps portion of
the spectrum.
As before, a 30-millisecond sync burst delimits the end and
beginning, respectively, of the 3000 and 400 cps AGC tones.
At the end of this third one-second interval a sync burst is
presented and the signal generator output reverts to the
1000 cps calibration tone, which will continue until the next
time that the START button is depressed.
Analyzer. Located at the receiving terminal, the SCIM analyzer
(shown in Figs. 11 and 12) filters the received "speech" or
noise spectrum into nine bands, which together cover the fre-
quency range from 250 cps to 4200 cps. The lower-skirt slope
of all filters is +18 dB/octave, the upper-skirt -60 or more
-19-
FIG.11 PHOTO OF ANALYZER
-20-
RECEIVED SIGNAL IN FROM SYSTEM UNDER TEST
I r\3
CLOCK
SYNC. DETECTOR
INTEGRATOR CONTROL
BANDPASS FILTERS AND INTEGRATORS DETECTORS
NO.l
TO 'INTEGRATORS
TO INTEGRATORS
COMMUTATOR CONTROL
u
]-l is
^H
NO.9 H
FREQUENCY TRANSLATION DETECTOR
LOG NETWORKS
9S
9N
.TO COMMUTATORS
FREQUENCY TRANSLATION CORRECTOR
VOLTAGE-TO- FREQUENCY CONVERTER
DECADE COUNTER
DIGITAL DISPLAY
713
FIG.12 SIMPLIFIED BLOCK DIAGRAM OF ANALYZER
dB per octave; these slopes were chosen specifically to approxi-
mate the inverse of the idealized spread-of-masking curve.*
The output of each filter is detected and fed to a "speech" and
a noise integrator. The integrators are of the operational-
amplifier/feedback-capacitor type, and provide true time inte-
gration of the unipolar detector output signals. The "integrate/
hold" and "clear" functions are controlled by reed relays mounted
directly on each integrator printed circuit board.
The "speech" integrators are enabled during the one-second in-
terval in which the "speech" signal is produced by the signal
generator. At the end of this one-second period, integration
ceases and the final value of the integral is held. The value
stored in the "speech" integrators, it should be noted, is
really the integral of the detected "speech" plus system noise.
During the following one-second interval, the noise integrators
for the first five bands are enabled. Since no "speech" is
transmitted at this time, the final voltage stored in these
integrators is proportional to the noise alone. The frequency
of the AGC tone during this interval, the reader will recall,
is 3000 cps; this frequency is greatly attenuated by all of
the filters in bands 1 through 5, so that the presence of the
tone does not affect the measurements made in these bands.
At the end of this second one-second interval, the band 1-5
noise integrators are switched to the "hold" mode, and in the
* The spread-of-masking function is dependent upon both the fre- quency and level of the masking noise; for the purposes of SCIM we have chosen an approximation which in our opinion, is suitable for use with typical communications systems. This idealized spread-of-masking curve falls off above the frequency of the masking noise at a rate of 18 dB per octave; the masking effect at frequencies below that of the masking noise is considered to be negligible.
-22-
I I I
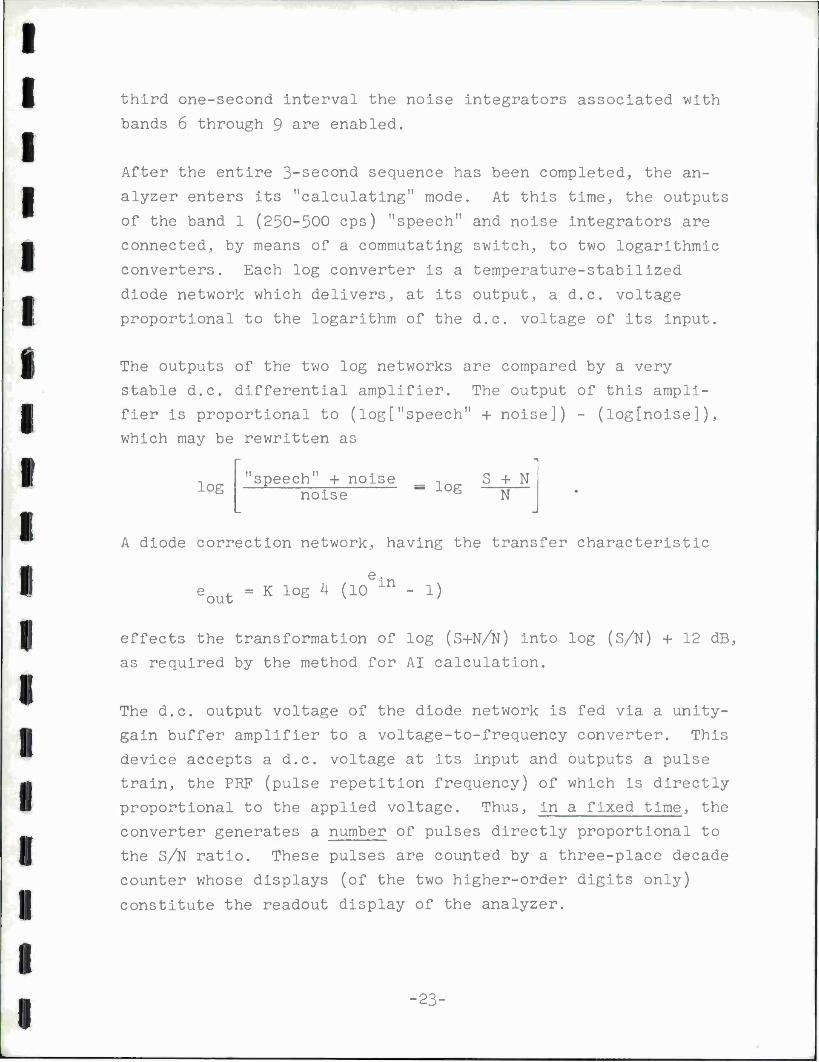
third one-second interval the noise integrators associated with
bands 6 through 9 are enabled.
After the entire 3-second sequence has been completed, the an-
alyzer enters its "calculating" mode. At this time, the outputs
of the band 1 (250-500 cps) "speech" and noise integrators are
connected, by means of a commutating switch, to two logarithmic
converters. Each log converter is a temperature-stabilized
diode network which delivers, at its output, a d.c. voltage
proportional to the logarithm of the d.c. voltage of its input.
The outputs of the two log networks are compared by a very
stable d.c. differential amplifier. The output of this ampli-
fier is proportional to (log["speech" + noise]) - (log[noise]),
which may be rewritten as
log "speech" + noise , S + N noise " log N
A diode correction network, having the transfer characteristic
eout = K los 4 (1° ln " X)
effects the transformation of log (S+N/N) into log (S/N) + 12 dB,
as required by the method for AI calculation.
The d.c. output voltage of the diode network is fed via a unity-
gain buffer amplifier to a voltage-to-frequency converter. This
device accepts a d.c. voltage at its input and outputs a pulse
train, the PRF (pulse repetition frequency) of which is directly
proportional to the applied voltage. Thus, in a fixed time, the
converter generates a number of pulses directly proportional to
the S/N ratio. These pulses are counted by a three-place decade
counter whose displays (of the two higher-order digits only)
constitute the readout display of the analyzer.
-23-
After dwelling for one second on the outputs of the band 1
"speech" and noise integrators, the commutator is advanced
one step, thereby connecting the outputs of the corresponding
band 2 integrators to the two log converters. After another
one-second dwell interval has elapsed (during which time the
decade counter adds to its previous total a number proportional
to the S/N ratio in band 2) the commutator examines the band 3
integrators, etc. When the commutator comes to rest in posi-
tion 10, the S/N ratios of all nine analyzer bands have been
totalized; the number displayed is the Speech Communication
Index (SCI), and is defined as
9 SCI - Y" [20 log (S/N)i + 12 dB]
i=l
The theory behind the Articulation Index requires that, in the
calculation of AI, all S/N ratios in excess of +18 dB be con-
sidered equal to +18 dB. The reason for this boundary condi-
tion is simply that the contribution to intelligibility of any
given band improves as the S/N ratio improves and reaches its
maximum value at an S/N ratio of +18 dB. Larger S/N ratios,
therefore, cannot further improve the intelligibility, and
should not contribute to the total AI in an amount greater
than that corresponding to a +18 dB S/N ratio.
The AI theory also requires that S/N ratios less than -12 dB
(corresponding to zero contribution to intelligibility) be
considered equal to -12 dB. The reasoning is, of course, just
the converse of the argument given above for the limiting of
S/N ratios in excess of +18 dB.
The boundary conditions described above are imposed in the
analyzer by the d.c. differential amplifier. Its circuitry is
such that its output cannot rise above +18 volts. Since this
-24-
output level has a scale factor of 1 dB/volt, an 18 volt output
corresponds to an 18 dB S+N/N [or (S/N)] ratio; after the
"addition" of 12 dB by the diode correction network, this cor-
responds to the upper limit of the required 30 dB range.
The amplifier also serves to impose the lower boundary limit;
since its output must always be > 0 volts (i.e., > 0 dB).
A complete measurement run, including three seconds of "speech"
and AGC tone transmissions and nine seconds of "calculation"
time may take as little as 11 seconds, since the first second
of calculation time can be coincident with the third second of
transmission from the signal generator.
Analyzer sync detector. The analyzer sync detection system con-
sists of two filters, centered at 600 cps and 2 kc, respectively,
whose outputs are detected and ANDed together. Whenever both
sync tones are found to be present, a relay is actuated which
advances a cam-operated rotary stepping switch. This switch,
in turn, provides sequentially the commands for the analyzer to
clear all integrators, integrate "speech," integrate noise,
begin calculation, etc.
The analyzer control system also contains a timing mechanism
for the commutator, which sequentially connects the logarithmic
attenuator inputs to the outputs of successive pairs of inte-
grators.
Prior to an actual measurement run, the frequency of the 1 kc
calibration tone is measured by means of a special discriminator
filter. The filter output is detected and compared with the
detected input to the discriminator. The difference between
these two d.c. voltages is a measure of the mismatch between
the transmitter carrier frequency and the receiver local
oscillator frequency.
-25-
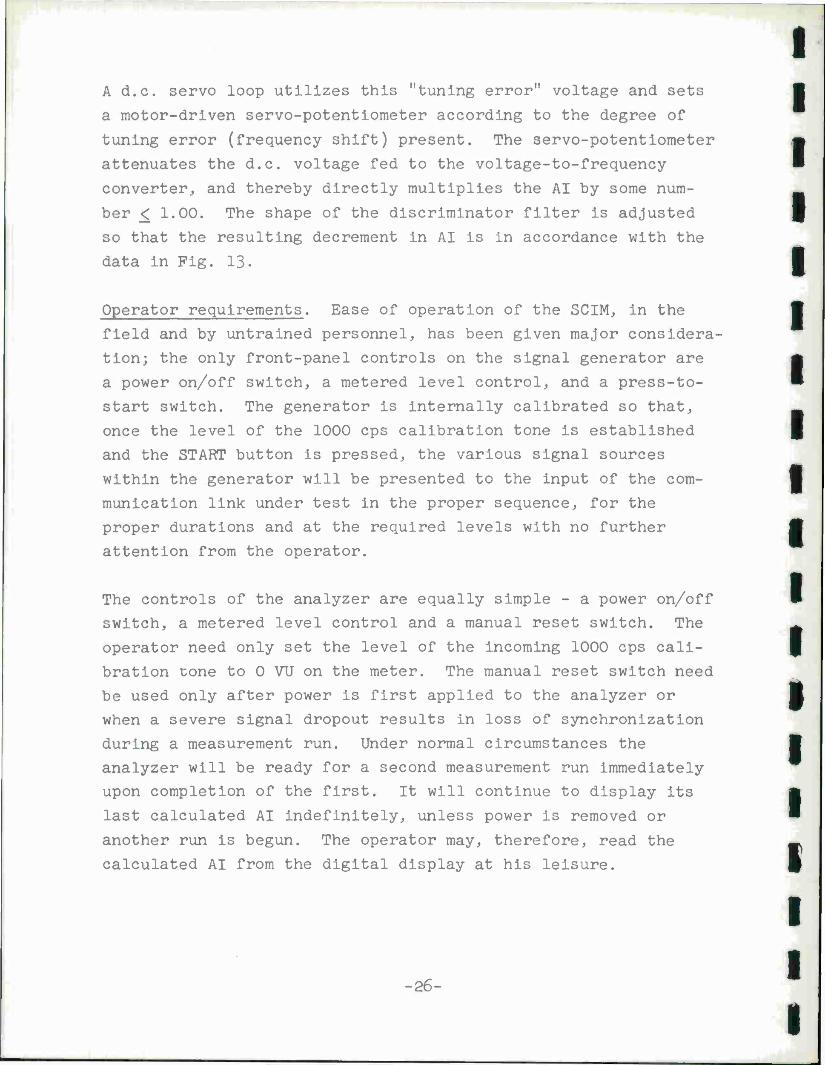
A d.c. servo loop utilizes this "tuning error" voltage and sets
a motor-driven servo-potentiometer according to the degree of
tuning error (frequency shift) present. The servo-potentiometer
attenuates the d.c. voltage fed to the voltage-to-frequency
converter, and thereby directly multiplies the AI by some num-
ber < 1.00. The shape of the discriminator filter is adjusted
so that the resulting decrement in AI is in accordance with the
data in Fig. 13.
Operator requirements. Ease of operation of the SCIM, in the
field and by untrained personnel, has been given major considera-
tion; the only front-panel controls on the signal generator are
a power on/off switch, a metered level control, and a press-to-
start switch. The generator is internally calibrated so that,
once the level of the 1000 cps calibration tone is established
and the START button is pressed, the various signal sources
within the generator will be presented to the input of the com-
munication link under test in the proper sequence, for the
proper durations and at the required levels with no further
attention from the operator.
The controls of the analyzer are equally simple - a power on/off
switch, a metered level control and a manual reset switch. The
operator need only set the level of the incoming 1000 cps cali-
bration tone to 0 VU on the meter. The manual reset switch need
be used only after power is first applied to the analyzer or
when a severe signal dropout results in loss of synchronization
during a measurement run. Under normal circumstances the
analyzer will be ready for a second measurement run immediately
upon completion of the first. It will continue to display its
last calculated AI indefinitely, unless power is removed or
another run is begun. The operator may, therefore, read the
calculated AI from the digital display at his leisure.
-26-
I ro
i
LU
en
i.i
0.9
0.8
0.7
0.6
0-5 -80
AVERAGE OF THREE MEASUREMENTS
A DETECTOR OFF O DETECTOR ON
-60 -40 -20 0 20 FREQUENCY TRANSLATION IN CPS
40 60 80
FIG.13 SCI MULTIPLIER vs. FREQUENCY SHIFT
SECTION 4
TEST RESULTS
There are two criteria that can be used for evaluating the
accuracy and reliability of SCIM — (l) how well "SCI's" for
a variety of speech systems agree with AI!s calculated in
accordance with the 20-band method for calculated AI; (2) how
well the SCI's, for the systems being evaluated, predict the
intelligibility of speech as measured with typical psycho-
acoustic test methods.
SCI vs AI. Figure 14 illustrates the agreement between cal-
culated AIfs and SCI's as measured by SCIM when the S/N ratio
present in an otherwise "high-fidelity" speech system was
systematically varied. It is seen in this figure that except
for values below about 0.4, SCIM estimates the calculated AI
within + .02 of its true value; below 0.4 the disagreement
increases to approximately + .04. Thus, for at least the
system and noise conditions represented in Pig. 14, an average
of one, or perhaps two, readings of SCIM would provide an SCI
that has nearly exactly the same AI as would be found by the
standard calculation procedures.
SCI vs speech test scores. A series of psychoacoustic tests
were conducted on a wide variety of speech systems in order
to determine the relation between SCI and measured speech
intelligibility. For these tests a listening crew of eight
high school and college students were used. The speech tests,
"Modified Rhyme" (MR) were recorded at the output of the
various systems and noise conditions to be evaluated; these
recordings were then administered to the listening crew in
-28-
0.2
i ro
i
Q UJ
_J <
C/) 3
o if)
Q UJ
<
0.1
-0.1
-0.2
AVERAGE OF FIVE READINGS
MAXIMUM
-0.3 -12 -8 -4048
SIGNAL-TO-NOISE RATIO IN DB 12 20
FIG.14 SHOWING THE MAXIMUM, M I N I MUM AND AVERAGE VALUES OF THE DEVIATION OF FIVE MEASURED SCI'S FROM THE CALCULATED Al 'S AT S/N RATIOS FROM-10 DB TO + 22 DB
accordance with an experimental design that more or less ran-
domized the order in which the different systems and conditions
were tested. Two 50-word MR for each of two male talkers were
given at each test condition. The listeners wore earphones and
were seated in a soundproofed room. All noise conditions were
achieved by electrically mixing, at the output of the speech
transmission system, the speech with a white noise that had
been passed through a 4400 cps low-pass filter. The signal-
to-noise ratios (S/N) were measured on a VU meter. The peak
VU meter readings, in the absence of the masking noise, were
averaged for a sample of the test words. The speech signal
was then turned off and the level of the noise adjusted until
the VU meter had the same value as the average found for the
peaks of speech in the absence of the noise; the S/N was then
said to be 0 dB, if the noise exceeded the average speech
peaks by 5 dB, the S/N was called -5 dB, and so forth.
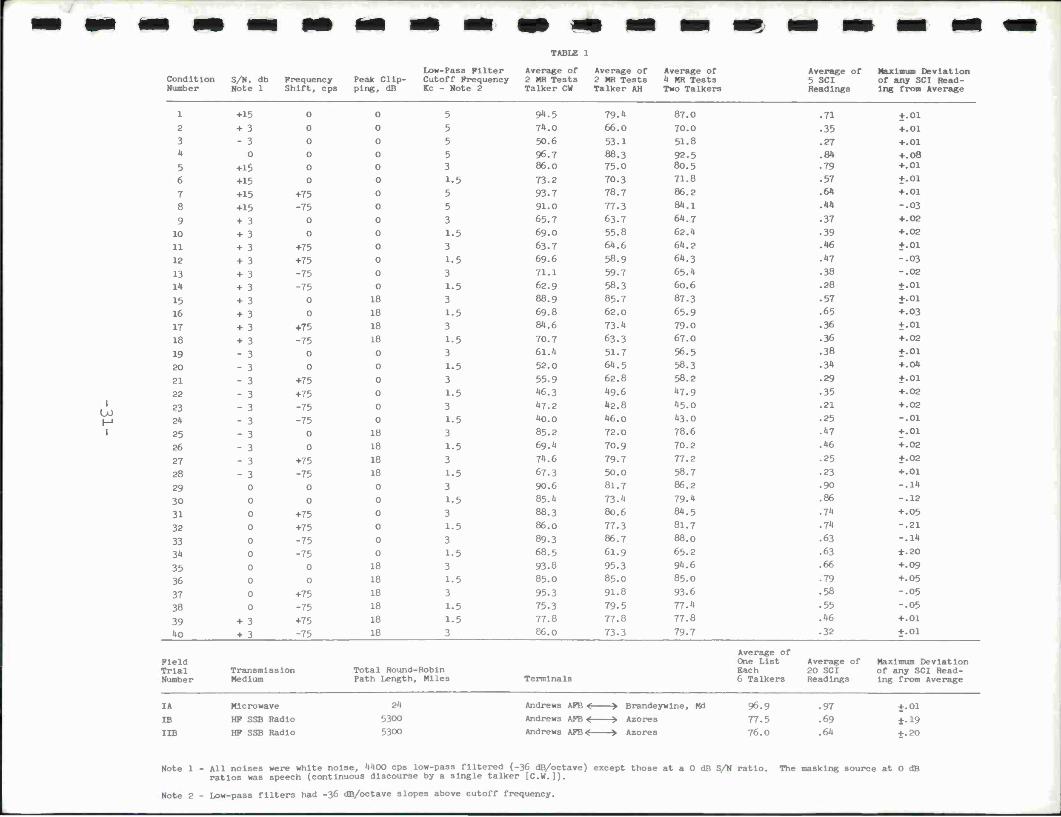
Five SCI's were measured with SCIM for each of the test con-
ditions. The results of the speech tests and the SCI measure-
ments are presented in Table 1, and the averages, for most of
these results, in Fig. 15.
Figure 15 shows that (except for certain of the 75 cps fre-
quency shift with peak clipping conditions) the measured SCI
values predict the test scores within + about 10 percentage
points. This amount of deviation (when leaving out some of
the 75 cps frequency shift conditions) compares reasonably
well with the range of differences between calculated AI and
measured intelligibility, as shown in previous studies given
in Figs. 5 and 6.
-30-
Condition Number
S/N, db Note 1
Frequency Shift, cps
Peak Clip- ping, dB
Low-Pass Filter Cutoff Frequency Kc - Note 2
Average of Average of Average of 2 MR Tests 2 MR Tests 4 MR Tests Talker CW Talker AH Two Talkers
9*».5 79.4 87.0
74.0 66.0 70.0
50.6 53.1 51.8
96.7 88.3 92.5 86.0 75-0 80.5
73.2 70.3 71.8
93.7 78.7 86.2
91.0 77.3 84.1
65.7 63.7 64.7
69.0 55.8 62.4
63.7 64.6 64.2
69.6 58.9 64.3
71.1 59.7 65.4
62.9 58.3 60.6
88.9 85.7 87.3
69.8 62.0 65.9
84.6 73.4 79.0
70.7 63.3 67.0
61.4 51.7 56.5
52.0 64.5 58.3
55.9 62.8 58.2
46.3 49.6 47.9
47.2 42.8 45.0
40.0 46.0 43.0
85.2 72.0 78.6
69.4 70.9 70.2
74.6 79.7 77.2
67.3 5O.0 58.7
90.6 81.7 86.2
85.4 73.4 79.4
88.3 8o.6 84.5
86.0 77.3 81.7
89.3 86.7 88.0
68.5 61.9 65.2
93.8 95.3 94.6
85.0 85.0 85.0
95.3 91.8 93.6
75.3 79.5 77.4
77.8 77.8 77.8
86.0 73.3 79.7
Average of 5 SCI Readings
Maximum Deviation of any SCI Read- ing from Average
Note 1 - All noises were white noise, 4400 cps low-pass filtered (-36 dB/octave) except those at a 0 dB S/N ratio. The masking source at 0 dB ratios was speech (continuous discourse by a single talker [CW. ]).
A ANDREWS AFB AZORES (5300 MILES TOTAL) HF SSB RADIO ROUND-ROBIN
D ANDREWS AFB-BRANDYWINE, M D. ( 24 Ml LES TOTAL) MICROWAVE ROUND- ROBIN
▲ LABORATORY SIMULATIONS INCLUDING ± 75 CPS FREQUENCY SHIFT AND I8DB PEAK CLIPPING
0 0.10 0.20 0.30 0.40 0.50 0.60 0.70
SPEECH COMMUNICATION INDEX (SCI)
0.80 0.90 .00
FIG.15 SHOWING PERCENT MR TEST SCORES AS A FUNCTION OF SCI FOR LABORATORY SPEECH SYSTEMS, AF H-F SSB, AND MICROWAVE RADIO SYSTEMS. (SEE TABLE 1)
It is not possible to determine, from these tests, the source
of the "error" causing this range of differences -- whether
it lies with SCIM or with the speech tests. The speech tests
themselves have an unreliability, for the number here admin-
istered, not much smaller than the range of differences found
between SCI and measured intelligibility.
However, SCI can be expected to represent only an approxima-
tion to what the true capability of a system is for trans-
mitting speech. For one thing, the use of only nine filters
in the analysis set does not provide the fineness of spectrum
analysis that would be necessary to insure extreme accuracy,
and the other characteristics of the SCIM system (designed
to correct or account for, in addition to frequency-amplitude
irregularities in a transmission system, spread-of-masking
effects, frequency shift, and amplitude distortion) represent
somewhat idealized engineering averages for evaluating the
effects of the variables involved.
All in all, it would appear that, except for certain condi-
tions involving frequency shifts in excess of 60 cps or so
when combined with peak clipping, SCIM gives an index measure-
ment that can be used for evaluating a wide variety of speech
systems and listening conditions that is nearly as "accurate"
as calculated AI and/or measured percent of several MR speech
tests administered to a crew of 8 trained listeners.
-33-
SECTION 5
FUTURE DEVELOPMENTS
We are planning to make certain additions to SCIM in order to
make it a more general and useful instrument:
1. A provision will be provided in future instruments
for a digital printout so that a printed record of the SCI
value, time of day, date, etc., will be provided either with,
or remotely from, the SCIM analyzer unit.
2. Acoustic couplers ("artificial heads") will be
developed for use with SCIM. The "heads" will be such that
a microphone or headset, earphone or loudspeaker can be
attached to or placed near the head as would be the case
when the system was being used by a person. The "head" at
the transmitter end of the system would provide the SCIM
signal acoustically to the microphone or mouthpiece of the
system being tested and the "head" at the receiving end
would pick up by a microphone in an artificial ear on the
"head" the received signal for analysis purposes. When the
artificial heads are used, the SCIM will, of course, measure
the total system ambient noise conditions at both the micro-
phone and earphone or loudspeaker positions, as well as the
characteristics of the microphone and earphone.
3. Provisions will be provided so that SCIM can be
used either in its present form, that is, supplying the input
and output electrically to the system and/or acoustically;
thus one can measure the performance of the system, including
the microphone, earphone and ambient noise conditions inde-
pendently of the electrical transmission and noise character-
istics of the system.
-3*-
4. Certain modifications are being contemplated that will
permit SCIM to operate in time in a more automatic fashion than
now possible.
-35-
REFERENCES
1. French, N. R. and J. C. Steinberg. "Factors Governing the Intelligibility of Speech Sounds/' J. Acoust. Soc. Am. 1£, 90-119 (1947).
2. Kryter, K. D., "Methods for the Calculation and Use of the Articulation Index/' J. Acoust. Soc. Am. ^4, I689- 1697 (1962).
3. "American Standard Method for Measurement of Monosyllabic Word Intelligibility, S3.2-I96O," American Standards Association, New York, New York.
4. "Psychoacoustic Speech Tests: A Modified Rhyme Test," Tech. Documentary Report No. ESD-TDR-63-403, Decision Sciences Lab., ESD, AF Systems Command, L. G. Hanscom Field, Bedford, Mass., Project No. 7684, prepared by Bolt Beranek and Newman Inc. under Contract No. AF 19(628)-382 (1963).
5. Dunn, H. K. and S. D. White, "Statistical Measurements on Conversational Speech," J. Acoust. Soc. Am. 11_, 278- 288 (1940).
6. Carter, N. L. and K. D. Kryter, "Masking of Pure Tones and Speech," J. Auditory Research 2, 66-98 (1962).
7. Wathen-Dunn, W. and D. W. Lipke, "On the Power Gained by Clipping Speech," J. Acoust. Soc. Am. 30, 36-40 (1958).
8. Miller, G. A.. "The Masking of Speech," Psychol. Bull. 44, 105-129 (1947).
9. Egan, J. P. and F. M. Wiener, "On the Intelligibility of Bands of Speech in Noise," J. Acoust. Soc. Am. 18, 435- 441 (1946). —
-36-
Security Classification
DOCUMENT CONTROL DATA • R&D (Security classification ol title, body ot abstract and indexing annotation mull be entered when the overall report ia classified)
1 QRIGINATIN G ACTIVITY (Corporate author)
Bolt Beranek and Newman Incorporated. Cambridge, Massachusetts
2« REPORT SECURITY C L ASSI FIC A TION
Unclassified 26 GROUP GROl
n/a
3 REPORT TITLE
SCIM— A Meter for Measuring the Performance of Speech Communication Systems
4 DESCRIPTIVE NOTES (Type ol report end incluaive dates)
Interim Report 5 AUTHORfSJ (Lett name, first name, initial)
Kryter, Karl D., Ball, Jay H.
6 REPORT DATE
October 1964 7# TOTAL NO. OF PAGE«
38 7b. NO. OF REPS
9
8a CONTRACT OR GRANT NO.
AF19(628)-2463 b. PROJECT NO.
2808
• a. ORIGINATOR'S REPORT NUMBERfS)
ESD-TDR-64-674
• b. OTHER REPORT NOf5j (A ny other numb»re that ma irtj this report
signed
BBN Report No. 1166
10. AVAILABILITY/LIMITATION NOTICES
Qualified requesters may obtain from DDC. Copies available from OTS
11. SUPPLEMENTARY NOTES
None
12. SPONSORING MILITARY ACTIVITY Decision Sciences Laboratory,Electronic Systems Division, Air Force Systems Command, USAF , L. G. Hanscom Field, Bedford, Mass,, 0I731
13 ABSTRACT TWQ major tneories have emerged that attempt to relate in a quantitative way
the physical characteristics of a speech communication system and the intelligibility of speech as perceived by a crew of trained listeners. The more widely used theory is the basis for the "Articulation Index" (Al) formulated in I947 by N. R. French and J. C. Steinberg of the Bell Telephone Laboratories. This the- ory holds that the signal (speech) -to-noise ratio (in 20 narrow frequency bands) of a communication system will, when properly weighted and summed, provide an Al value that is directly related to the intelligibility of speech heard over that system. A second theoretical approach to this problem is embodied in the Pattern Correspondence Index (PCI) machine proposed by J. C. R. Licklider in I956. This instrument determines the correlation in the frequency and time domains between the speech input to a communi- cation system and the speech output of that system. The subject of the present paper is an electronic device called SCIM (Speech Communication Index Meter) that is designed pri- marily in terms of the Articulation Index theory; however, SCIM accommodates additional factors affecting speech that are not involved in the original procedures for calculating Al. The SCIM signal generator generates a 3-second signal burst, which is fed to the electrical input of the system under test; within 12 seconds the SCIM analyzer, located at the receiving station, calculates and displays an index, ranging from .00 to .99, which reflects the
ability of that system to transmit intelligible speech.
DD FORM 1 JAN 64 1473 -37-
Security Classification
Security Classification u.
KEY WORDS LINK A LINK B
ROLE
LINK C
Psychoacoustics Speech Speech Transmission Human Engineering
INSTRUCTIONS
1. ORIGINATING ACTIVITY: Enter the name and address of the contractor, subcontractor, grantee, Department of De- fense activity or other organization (corporate author) issuing the report.
2a. REPORT SECURITY CLASSIFICATION: Enter the over- all security classification of the report. Indicate whether "Restricted Data" is included. Marking is to be in accord- ance with appropriate security regulations.
26. GROUP: Automatic downgrading is specified in DoD Di- rective 5200.10 and Armed Forces Industrial Manual. Enter the group number. Also, when applicable, show that optional markings have been used for Group 3 and Group 4 as author- ized.
3. REPORT TITLE: Enter the complete report title in all capital letters. Titles in all cases should be unclassified. If a meaningful title cannot be selected without classifica- tion, show title classification in all capitals in parenthesis immediately following the title.
4. DESCRIPTIVE NOTES: If appropriate, enter the type of report, e.g., interim, progress, summary, annual, or final. Give the inclusive dates when a specific reporting period is covered. 5. AUTHOR(S): Enter the name(s) of authoKs) as shown on or in the report. Entei last name, first name, middle initial. If military, show rank end branch of service. The name of the principal feUtho« is an absolute minimum requirement
6. REPORT DATE: Enter the date of the report as day, month, year; or month, year. If more than one date appears on the report, use date of publication.
7a. TOTAL NUMBER OF PAGES: The total page count should follow normal pagination procedures, i.e., enter the number of pages containing information. 76. NUMBER OF REFERENCES: Enter the total number of references cited in the report. 8a. CONTRACT OR GRANT NUMBER: If appropriate, enter the applicable number of the contract or grant under which the report was written. 86, 8c, & 8d. PROJECT NUMBER: Enter the appropriate military department identification, such as project number, subproject number, system numbers, task number, etc
9a. ORIGINATOR'S REPORT NUMBER(S): Enter the offi- cial report number by which the document will be identified and controlled by the originating activity. This number must be unique to this report. 96. OTHER REPORT NUMBER(S): If the report has been assigned any other report numbers (either by the originator or by the sponsor), also enter this number(s).
10. AVAILABILITY/LIMITATION NOTICES: Enter any lim- itations on further dissemination of the report, other than those
imposed by security classification, using standard statements such as:
(1) "Qualified requesters may obtain copies of this report from DDC"
(2) "Foreign announcement and dissemination of this report by DDC is not authorized."
(3) "U. S. Government agencies may obtain copies of this report directly from DDC. Other qualified DDC users shall request through
(4) "U. S. military agencies may obtain copies of this report directly from DDC Other qualified users shall request through
M
(5) "All distribution of this report is controlled. Qual- ified DDC users shall request through
If the report has been furnished tc the Office of Technical Services, Department of Commerce, for sale to the public, indi- cate this fact and enter the price, if known.
11. SUPPLEMENTARY NOTES: Use for additional explana- tory notes.
12. SPONSORING MILITARY ACTIVITY: Enter the name of the departmental project office or laboratory sponsoring (pay- ing (or) the research and development. Include address.
13. ABSTRACT: Enter an abstract giving a brief and factual summary of the document indicative of the report, even though it may also appear elsewhere in the body of the technical re- port. If additional space is required, a continuation sheet shall be attached.
It is highly desirable that the abstract of classified reports be unclassified. Each paragraph of the abstract shall end with an indication of the military security classification of the in- formation in the paragraph, represented as (TS), (S). (C), or (U).
There is no limitation on the length of the abstract. How- ever, the suggested length is from 150 to 225 words.
14. KEY WORDS: Key words are technically meaningful terms or short phrases that characterize a report and may be used as index entries for cataloging the report. Key words must be selected so that no security classification is required. Identi- fiers, such as equipment model designation, trade name, military project code name, geographic location, may be used as key words but will be followed by an indication of technical con- text. The assignment of links, rules, and weights is optional


![[ Toolkit For ] Spinal Cord Independence Measure III (SCIM III)scireproject.com/wp-content/uploads/SCIM_Toolkit... · 2021. 1. 4. · Once the SCIM III or the SCIM-SR has been done](https://static.documents.pub/doc/80x56/60a8bf5213010d728d66147c/-toolkit-for-spinal-cord-independence-measure-iii-scim-iii-2021-1-4-once.jpg)


