Water Governance in Spain and Risk Management. José-Ángel Rodríguez-Cabellos Head of the Planning Office Guadiana River Agency (Confederación Hidrográfica del Guadiana) MINISTRY FOR AGRICULTURE AND FISHERIES, FOOD AND ENVIRONMENT WORLD BANK Workshop on water security – Sofia, Bulgaria 18 th - 19 th September 2017
Transcript
Water Governance in Spain and Risk Management.
José-Ángel Rodríguez-CabellosHead of the Planning Office
Guadiana River Agency (Confederación Hidrográfica del Guadiana)
MINISTRY FOR AGRICULTURE AND FISHERIES, FOOD AND ENVIRONMENT
WORLD BANKWorkshop on water security –
Sofia, Bulgaria 18th-19th September 2017
INDEX
1. WATER GOVERNANCE IN SPAIN
1.1. HYDROLOGY AND USE OF WATER
1.2. RIVER BASIN AUTHORITIES
2. RISK MANAGEMENT PLANNING
2.1. CLIMATE CHANGE IN PLANNING
2.2. WATER MANAGEMENT PLAN
2.3. SPECIAL DROUGHT PLAN
2.4. FLOOD MANAGEMENT PLAN
Supe
rficia
lGroundw
ater Both
5,000 hm3
Urban water supply
demand
1.500 hm3
25,000 hm3
TOTAL DEMAND
31.500 hm3
Water Demands
Industry demand
Agriculture demand
Surface 505.990 km2
Annual average precipitation 684 mm
Annual average runoff 110.000 hm3
Precipitation & Natural water resourcesSpain has singularities within the EU:
• Segura Basin 365 mm/year,• Almería: 196 mm/year
South east more similar to Northern Africa
1. WATER GOVERNANCE IN SPAIN1.1. HIDROLOGY AND USE OF WATER
1. WATER GOVERNANCE IN SPAIN1.2. RIVER BASIN AUTHORITIES
2. RISK MANAGEMENT PLANNING.
25 Water Basin Districts = 25 Water Management Plans /Drought Plans/Flood Plans
Planning: Key issue for water management
More than ten main Planning Processes in
Spain since last third of the XIX century.
Planning objectives:
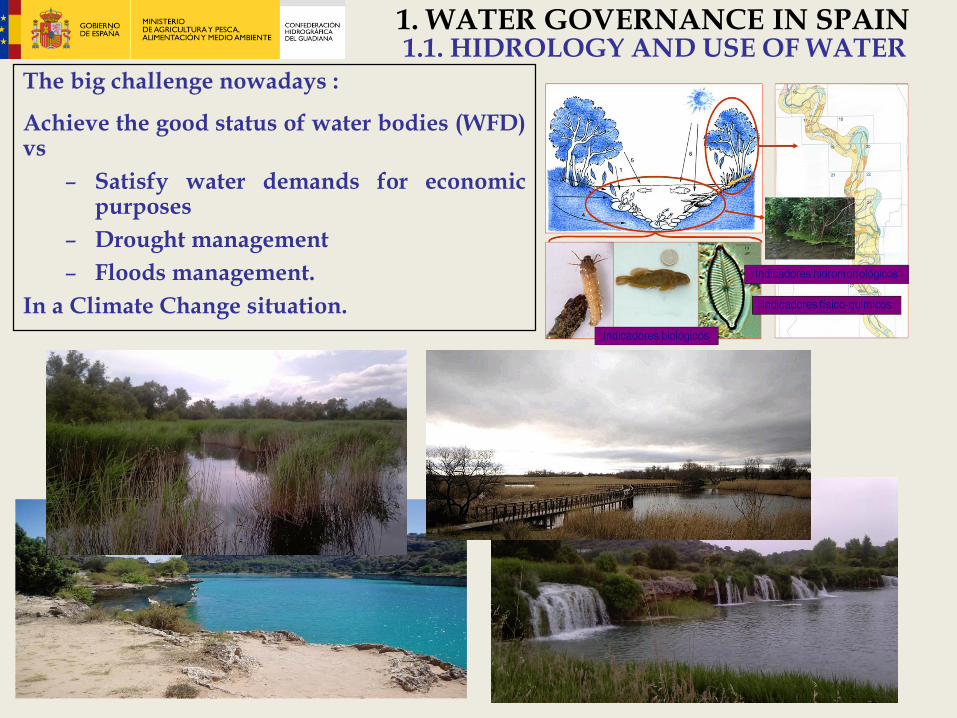
1. Achievement of water bodies good status and HPD protection (new environmental objectives from WFD)
2. Satisfaction of water demands (traditional Spanish Water Planning objective)
3. Balance between: economic development and environmental protection
4. Mitigation of the effects of floods and droughts
Different Plans:
1. WATER MANAGEMENT PLANS (Water Framework Directive & Spanish Water Law)
2. SPECIAL DROUGHT PLANS (Spanish Water Law)
3. FLOOD PLANS (Flood Directive)
2. RISK MANAGEMENT PLANNING.
2.1.CLIMATE CHANGE IN PLANNING.
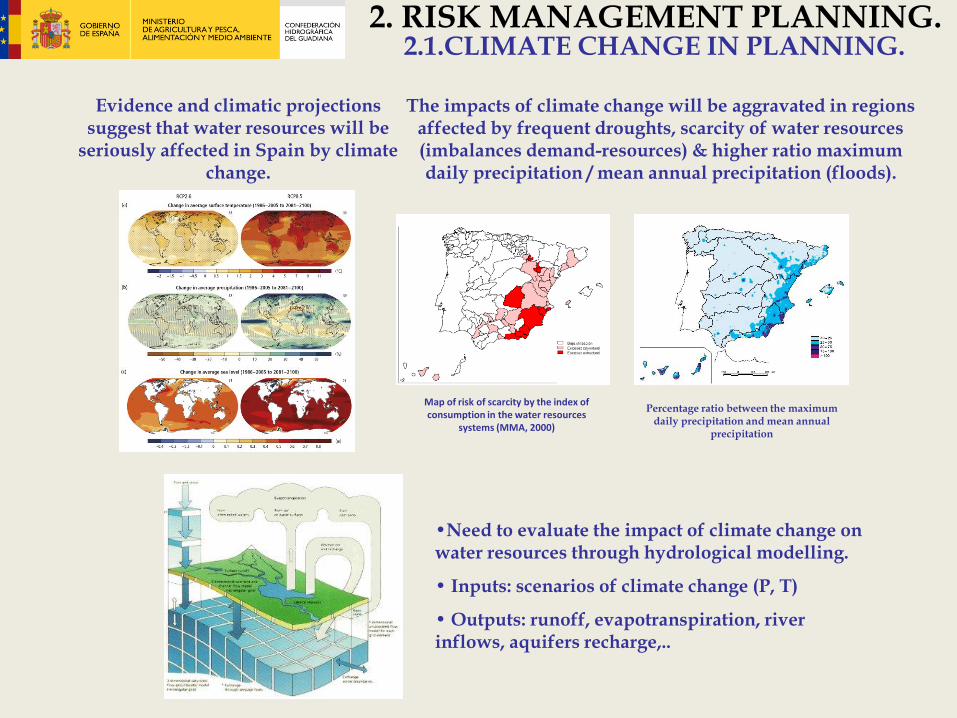
Evidence and climatic projections suggest that water resources will be
seriously affected in Spain by climate change.
The impacts of climate change will be aggravated in regions affected by frequent droughts, scarcity of water resources (imbalances demand-resources) & higher ratio maximum daily precipitation / mean annual precipitation (floods).
Map of risk of scarcity by the index of consumption in the water resources
systems (MMA, 2000)
•Need to evaluate the impact of climate change on water resources through hydrological modelling.
• Inputs: scenarios of climate change (P, T)
• Outputs: runoff, evapotranspiration, river inflows, aquifers recharge,..
2. RISK MANAGEMENT PLANNING.
Percentage ratio between the maximum daily precipitation and mean annual
precipitation
• Study of potential effects of climate change on:o Water resources in a natural regimeo Water demands (irrigation, urban supply and industry)o Available water resources in the water resources systems.o Max Precipitation & Flows evolutiono Ecological status of water bodies.
The National Plan of Adaptation to CC
• Scenarios of the National Plan• Impacts:
• model SIMPA, ARMA, etc.• Inputs: climate scenarios• Outputs:✓ monthly maps of river inflows, aquifers recharge,
evapotranspiration, (resolution of 1 km x 1km) ✓ evolution of the annual runoff. Reduction of
runoff:▪ scenario A2: 8% in 2011-2040, 16% in 2041-2070
and 28% in 2071-2100. ▪ scenario B2: 8%, 11% and 14%.
✓ water demand increase of crops:▪ scenario A2: 3%, 6% and 12%▪ scenario B2: 5%, 6% and 7%.
✓ droughts: uncertainties but increase in intensity and frequency (>2 years B2 worse at the end of c. XXI, >3 years A2 worse the second half of c. XXI)
✓ floods: no evidence of increase of maximum daily precipitation (MXP maps)
Precipitation 1969
Evapotransp. potential 1969
Humidity soil 1969
Recharge aquifer 1969
Evapotranspiration 1969
Volume aquifer 1969
runoff groundwater 1969
runoff superficial 1969 runoff total 1969
Scenario of emissions A2 (red); B2 (blue). Average of projections in thick line. Source: CEDEX(2010)
Variation of the average of runoff (%) period 2011-2040,
projections A2. Source: CEDEX(2010)
Current Water Exploitation Index (WEI)
Water Exploitation Index (WEI) 2041-2070 Scenario
A2
2.1.CLIMATE CHANGE IN PLANNING.2. RISK MANAGEMENT PLANNING.
STRATEGIC ENVIRONMENTA
L ASSESMENTPROGRAMME OF
MEASURES
WATER MANAGEMENT
PLAN
PUBLIC PARTICIPATION
• Status of water bodies (monitoring network)
• Economic studies (economic importance of water use, cost recovery, cost-effectiveness, cost-benefit)
• Study of:o pressures, o impacts, status,
• Program of measures and • Water bodies objectives (good status)
2.2. WATER MANAGEMENT PLANNING2. RISK MANAGEMENT PLANNING.
• Study of water resources surface and groundwater (availability)
• Restrictions to achieve good status• Study of water demand, and balances
(water allocation) (current and future according CC)
• It will estimate the balance between the foresee available water and predictable demands, according climate change scenarios.
• Strategic Environmental Assessment
• Public participation throughout the process
• Environmental Flows
• From “crisis management” (emergency) to “risk
management” (planning)
• Trigger: drought 1991-1995
– Economic impact in irrigation: Alicante 34 M€; Valencia 19
M€; Murcia 18 M€; Castellón 8 M€.
– Employment impact: more than 2 million; lost wages, 84 M€.
– Restrictions (Seville).
• Law 10/2001 of the National Hydrological Plan.
Drought management.
– Establishing a comprehensive global system
of indicators.
– Development of Drought Management Plans.
Objectives: • To reduce the frequency and intensity of droughts’ negative impacts (environmental, social
and economic).
• Articulate and coordinate all issues related to: control, monitoring, follow-up system, riskassessment, decision making, implementation of measures.
Development of SDP (1)
• Analysis of water resources (according WMP).
• Analysis of water uses and water demands (according WMP).
• Characterization and analysis of historical droughts.
2.3. SPECIAL DROUGHT PLAN2. RISK MANAGEMENT PLANNING.
– helpful to progressive implementation of measures
• Thresholding.
• Measures
TYPES OF MITIGATION MEASURES
Status Normal Pre-alert Alert Emergency
Objective PlanningInformation
-controlConservation Restrictions
Type of measure
Strategic Tactics Emergency
• Strategic measures long term actions, included in theRiver Basin Management Plan (new infrastructures,modernization of irrigation areas, etc.)
• Tactic measures short term actions (informationcampaign, increase monitoring (quantity & WB status) andabstraction control, reduce irrigation quotas, additionalresources, etc.)
• Emergency measures extraordinary actions adapted toaffected areas and to gravity of the situation. (hardrestrictions for uses, additional resources, rights exchange,monitoring & control, cancelation of fees, environmentalflows reduction, etc.)
2.3. SPECIAL DROUGHT PLAN2. RISK MANAGEMENT PLANNING.
0,5
VmaxVmin0
0,5
1
Vmed
Percentage ratio between the maximum daily precipitation and mean annual precipitation
Losses due to floods over 800 million euros per year.
Compensations paid by the Insurance Compensation Consortium (flood damage)
Preliminary flood risk assessment
Floods are natural phenomena which cannot be prevented,
Geographical areas which could be flooded according to the following scenarios (input CAUMAX according CC/ DTM like LIDAR / Models: IBER, HEC):
• High probability: T=10 years
• Medium probability: T=100 years
• Low probability: T=500 years
Flood hazard maps
For each scenario:
• The extent of the flood;
• Water depths or water levels, as appropriate.
• When appropriate, the flow velocity or the relevant water flow.
http://sig.magrama.es/snczi/
Flood risk maps
Contents:- Inhabitants potentially affected- Type of economic activity of the area potentially affected- Points of interest (potential pollutant installations, heritage,
infrastructures, civil protection facilities, etc.)- Protected areas (abstraction for human consumption, recreational
waters, Natura 2000 sites)
Crossed information define damage in terms of economic, social & environmental losses
Flood risk management plans
1. Increasing awareness and improving self-protection strategies.
2. Enhancing coordination of all stakeholders involved. Responsibility is a shared among all administrations and society.
3. Improving the understanding of flood phenomena,
4. Improve flood forecasting and early warning systems.
General objectives in Spain:
5. Enhance land-use and urban planning policies in flood areas.
6. Reduction of flood risk: enhancement infiltration, giving rivers more space, modification or removal of structures with an impact.
7. Improving resilience and reducing vulnerability of goods in floodplain.
8. Enhancing or maintaining, the good status of water bodies by the improvement of their hydro morphological conditions (WFD).