Page 1
WATER MANAGEMENT OF KASE RIVER BASIN INCLUDING DAM
RESERVOIR EFFECTS ON HYDROLOGICAL PROCESS AND WATER
QUALITY
September 2012
Department of Engineering Systems and Technology
Graduate School of Science and Engineering
Saga University
JAPAN
CINDY JEANE SUPIT
Page 2
WATER MANAGEMENT OF KASE RIVER BASIN INCLUDING DAM
RESERVOIR EFFECTS ON HYDROLOGICAL PROCESS AND WATER
QUALITY
by
CINDY JEANE SUPIT
A dissertation submitted to the Department of Engineering Systems and Technology,
Graduate School Of Science and Engineering, Saga University in partial fulfillment of the
requirements for the degree of Doctor of Engineering
Department of Engineering Systems and Technology
Graduate School of Science and Engineering
Saga University
JAPAN
September 2012
Page 3
THESIS EXAMINATION COMMITTEE
Professor Koichiro OHGUSHI Department of Civil Engineering and Architecture
Saga University
JAPAN
Professor Kenichi KOGA Department of Civil Engineering and Architecture
Saga University
JAPAN
Professor Hiroyuki ARAKI Institute of Lowland and Marine Research
Saga University
JAPAN
Professor Hiroyuki YAMANISHI Institute of Lowland and Marine Research
Saga University
JAPAN
Page 4
Cindy Jeane Supit Page i
ABSTRACT
Water project construction such as dams is one of the major activities in basin
development and utilization. The reservoirs are usually located in the headstream with large
storage capacity for main function of water storage, water supply and flood control. The
impact of water projects on river hydrology, surrounding environment and ecology are
important topics in river basin management and environmental protection.
Meiji government has succeeded the rule of previous water custom. After the Second
World War and rapid economical growth, the government needed big projects of water resource
development. That is why integrated approach such as environmental issues is necessary.
Nowadays, there is a trend to establish a basic law of water circulation in Japan and it
becomes urgent to consider the development and application of analyzing tools.
On the other hand, Kase River basin's infrastructure is preceded based on National
Comprehensive Water Resources Plans. Kase River dam is one of the results of this plan.
Although it is difficult to integrate and manage a multipurpose Kase River dam and irrigation
purpose Hokuzan dam under present system, it may be a meaningful question to validate their
significance with engineering point of view for consideration of future water resources policy.
Moreover, there has been an open channel network that is a creek network in Saga Plain.
This network could supplement a lack of water for irrigation and also could store the water
when flood occurred. However after completion of water supply facilities, the creek network
was used only for irrigation or drainage, and shortage of water discharge caused eutrophication
in open channel by much nutrient supply and polluted sediment settled down the channel. To
improve this water environment of the creek network in the plain needs water quantity to some
extent. The function of dam reservoir for restraining sediment transport including the nutrient
causing the eutrophication in the downstream open channel is expected. How the upstream dam
reservoirs are utilized is directly or indirectly related to water quantity and quality in the
downstream area. Therefore, it is quite important to consider the integrated management of dam
reservoir in the watershed from the engineering point of view.
There is no integrated management of multiple dams whose manager are different. The
objectives of this research are to assess the potential effects of dam reservoir on river flow
Page 5
Cindy Jeane Supit Page ii
regime and water quality in Kase River basin using SWAT (Soil and Water Assessment Tool)
model and to consider how to manage these dams synthetically.
Through this research, the model has shown to be able to simulate the hydrological process
and water quality in Kase River basin. The existences of Hokuzan dam reservoir and Kase
River dam reservoir in this area resulted in reductions in annual and peak stream flow rates in
the watershed because of the storage of dams. Wide surface areas of reservoirs can evaporate
higher than natural channels. These dams seem to result in decrease of average annual discharge
by 3.68 % from only Hokuzan dam scenario, and decrease 4.49 % from the no dam scenario.
Dams are expected as the positive ecological instruments for holding back the sediment
that contain nutrient to harmful the downstream area. The existence of the reservoirs at Kase
River dam and Hokuzan dam have effects on stream nutrient transport. TN and TP export
became lower when the both reservoirs were made in the watershed because nutrient retention
can be caused by long water resident time in the impoundment of dam reservoirs which result in
decreasing 9.18 % and 11.31% respectively in annual nutrient load for Kase River at
Kanjinbashi.
Tributary source loadings by stream flow into the Kase River dam reservoir are also
estimated using the SWAT model, and the results show that the greatest source of pollutant
transport into Kase River dam reservoir are from Nakahara Fork, and paddy fields contribute
significant amounts of all nutrients to stream reaches. The future potential change of stream and
nutrient transport gave the clue to be suggested for integrated water resources management in
Kase River basin.
A developed management tool for water resources seems to be a new approach to water
environment improvement in Kase River basin. Integrated water management of Kase River
basin including management of multiple dam’s reservoir shows possibility for satisfaction of
water quantity demand both in the irrigation period and non irrigation period. This integrated
water management also gives feasibility for water supply to prevent eutrophication at the creek
network downstream.
This research will be a useful step for the future integrated basin management and expected
as the foundation for the sustainable development of Saga City in the future.
Keywords: water management, hydrological process, water quality, Kase River Basin
Page 6
Cindy Jeane Supit Page iii
ACKNOWLEDGEMENTS
Praise to the Lord Jesus Christ, He is my strength and shelter. It would not have been possible to
write this doctoral thesis without the help and support of the kind people around me, to only
some of whom it is possible to give particular mention here.
This thesis would not have been possible without the help, support and patience of my supervisor,
Prof. Koichiro Ohgushi, the good advice, and support has been invaluable on both an academic
and a personal level, for which I am extremely grateful.
Deep gratitude is expressed to the members of the examination committee of this dissertation,
Professor Kenichi Koga, Department of Civil Engineering and Architecture, Saga University,
Professor Hiroyuki Araki, Institute of Lowland and Marine Research, Saga University, and
Professor Hiroyuki Yamanishi, Institute of Lowland and Marine Research, Saga University, for
their kind encouragements and critical suggestion for improving this research work.
A special thank you goes to Universiy of Sam Ratulangi Manado and Indonesian Government
for providing DIKTI scholarship, also my sincere thanks to Mr. Takeshi Noguchi and Dr.
Masahiro Tezuka, for valuable support in setting and analyzing. Thanks are also extended to
Jeffry Sumarauw, Torry Dundu and all students in Professor Ohgushi Laboratory for their
friendly behaviors. And also thanks to SWAT community for kind suggestion and discussion
times and all Indonesians who live in Saga.
Last but not least, I am deeply grateful to my parents for their honest support. The continuous
assistance given by my beloved husband Rommy Posma Leke to complete this thesis work is
greatly appreciated. And for my sweetie daughters, Rachel and Lovely whose provide endless
inspiration and happiness.
Page 7
Cindy Jeane Supit Page iv
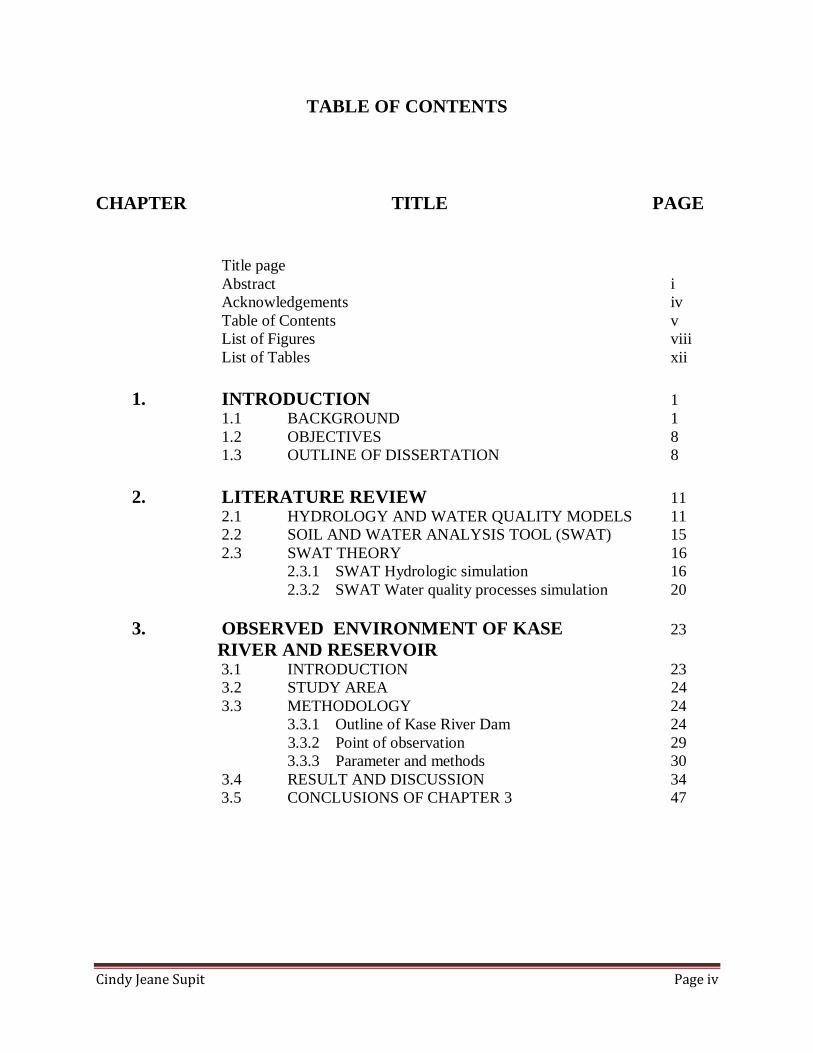
TABLE OF CONTENTS
CHAPTER TITLE PAGE
Title page
Abstract i
Acknowledgements iv
Table of Contents v
List of Figures viii
List of Tables xii
1. INTRODUCTION 1 1.1 BACKGROUND 1
1.2 OBJECTIVES 8
1.3 OUTLINE OF DISSERTATION 8
2. LITERATURE REVIEW 11 2.1 HYDROLOGY AND WATER QUALITY MODELS 11
2.2 SOIL AND WATER ANALYSIS TOOL (SWAT) 15
2.3 SWAT THEORY 16
2.3.1 SWAT Hydrologic simulation 16
2.3.2 SWAT Water quality processes simulation 20
3. OBSERVED ENVIRONMENT OF KASE 23
RIVER AND RESERVOIR 3.1 INTRODUCTION 23
3.2 STUDY AREA 24
3.3 METHODOLOGY 24
3.3.1 Outline of Kase River Dam 24
3.3.2 Point of observation 29
3.3.3 Parameter and methods 30
3.4 RESULT AND DISCUSSION 34
3.5 CONCLUSIONS OF CHAPTER 3 47
Page 8
Cindy Jeane Supit Page v
4. DAM RESERVOIR EFFECTS 48
ON ANNUAL AND PEAK FLOW RATES
IN KASE RIVER BASIN 4.1 INTRODUCTION 48
4.2. METHODS AND MATERIAL 49
4.2.1 Study area and model input data 49
4.2.2 Model calibration and validation 53
4.2.3 Dam scenarios 56
4.3 RESULTS AND DISCUSSION 58
4.3.1 Effect of dam reservoir 58
on annual stream flow
4.3.2 Effect of dam reservoir 59
on peak stream flow
4.4 CONCLUSIONS OF CHAPTER 4 61
5. DAM RESERVOIR EFFECTS 62
ON RIVERINE NUTRIENT TRANSPORT
IN KASE RIVER BASIN 5.1 INTRODUCTION 62
5.2 METHODOLOGY 63
5.2.1 Methods 63
5.2.2 Data source 64
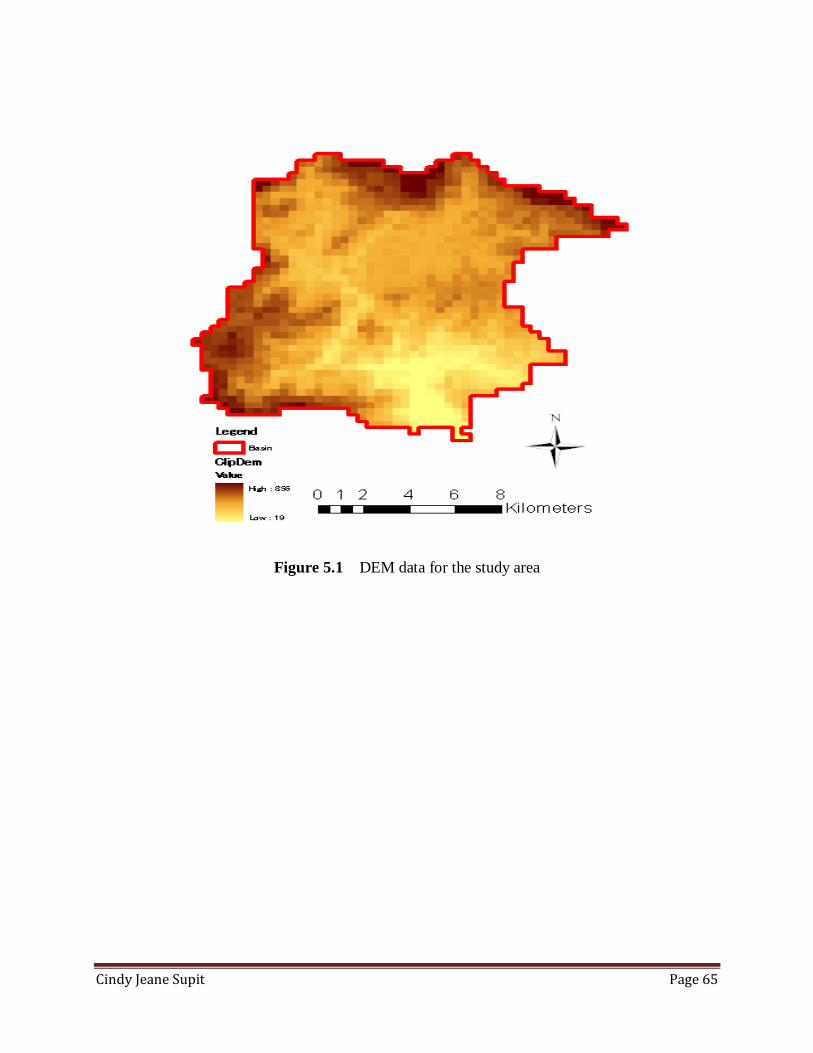
5.2.2.1 Topographic data 64
5.2.2.2 Land use data 66
5.2.2.3 Soil data 67
5.2.2.4 Weather data 68
5.2.2.5 Hydrological data 69
5.2.2.6 Dam data 70
5.2.2.7 Water quality data 71
5.2.3 Model calibration 71
5.3 RESULTS AND DISCUSSIONS 73
5.4 CONCLUSIONS OF CHAPTER 5 77
6. ESTIMATION OF NUTRIENT SOURCE 78
LOADING INTO THE NEW KASE RIVER DAM
6.1 INTRODUCTION 78
6.2 METHODOLOGY 78
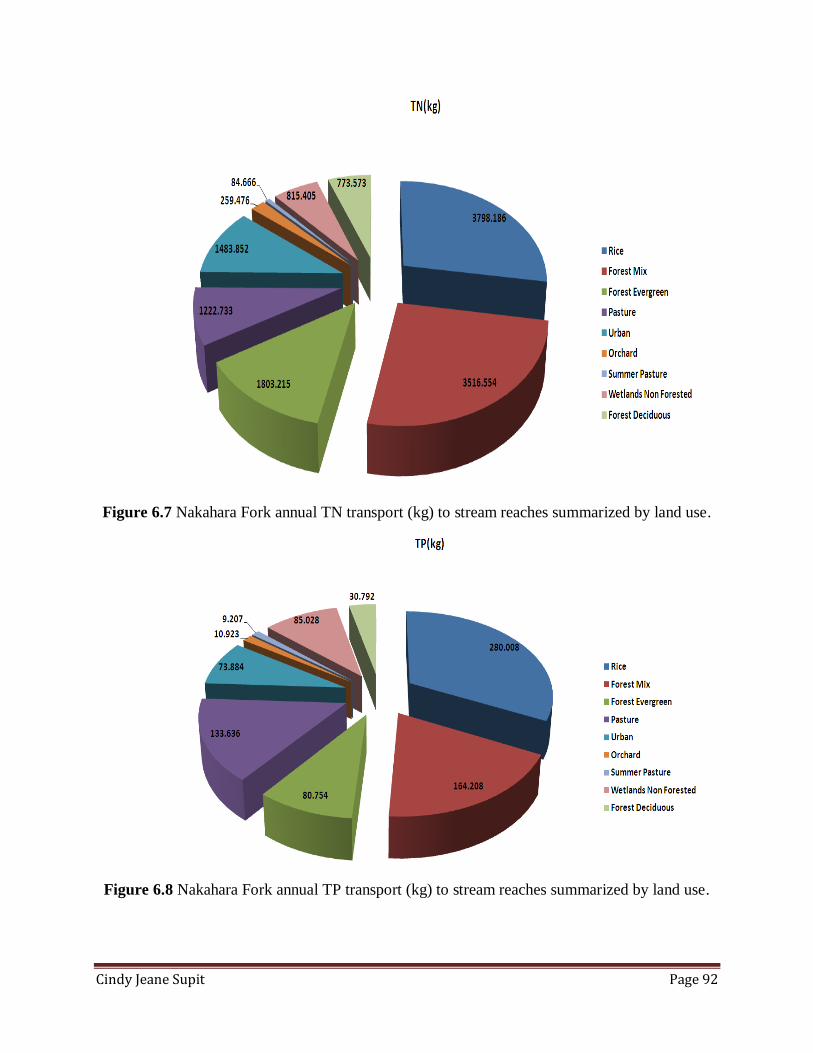
6.3 RESULTS AND DISCUSSIONS 89
6.3.1 Evaluation of landuse and area 89
characteristics of the watershed
6.3.2 Evaluation of tributary stream nutrient transport 89
6.4 CONCLUSIONS OF CHAPTER 6 93
Page 9
Cindy Jeane Supit Page vi
7. WATER RESOURCES MANAGEMENT BY 95
MODELING OF DAMS OPERATION
IN KASE RIVER BASIN 7.1 INTRODUCTION 95
7.2 METHODOLOGY 96
7.2.1 Study area and model input data 99
7.2.2 Model selection and improvement 104
7.3 RESULT AND DISCUSSION 107
7.3.1 Model evaluation 107
7.3.2 Management dam operation 110
7.4 CONCLUSIONS OF CHAPTER 7 114
8. CONCLUSIONS 116 8.1 CONCLUSIONS 116
8.2 SUGGESTIONS 118
REFERENCES 119
Page 10
Cindy Jeane Supit Page vii
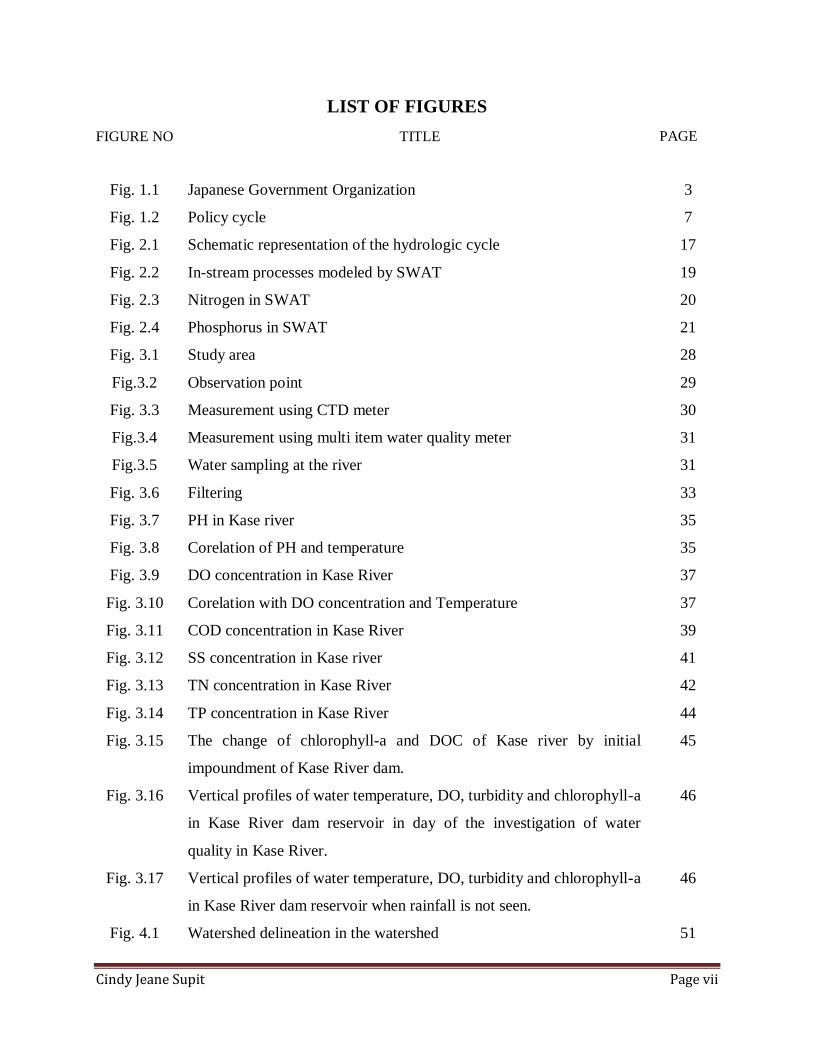
LIST OF FIGURES
FIGURE NO TITLE PAGE
Fig. 1.1 Japanese Government Organization 3
Fig. 1.2 Policy cycle 7
Fig. 2.1 Schematic representation of the hydrologic cycle 17
Fig. 2.2 In-stream processes modeled by SWAT 19
Fig. 2.3 Nitrogen in SWAT 20
Fig. 2.4 Phosphorus in SWAT 21
Fig. 3.1 Study area 28
Fig.3.2 Observation point 29
Fig. 3.3 Measurement using CTD meter 30
Fig.3.4 Measurement using multi item water quality meter 31
Fig.3.5 Water sampling at the river 31
Fig. 3.6 Filtering 33
Fig. 3.7 PH in Kase river 35
Fig. 3.8 Corelation of PH and temperature 35
Fig. 3.9 DO concentration in Kase River 37
Fig. 3.10 Corelation with DO concentration and Temperature 37
Fig. 3.11 COD concentration in Kase River 39
Fig. 3.12 SS concentration in Kase river 41
Fig. 3.13 TN concentration in Kase River 42
Fig. 3.14 TP concentration in Kase River 44
Fig. 3.15 The change of chlorophyll-a and DOC of Kase river by initial
impoundment of Kase River dam.
45
Fig. 3.16 Vertical profiles of water temperature, DO, turbidity and chlorophyll-a
in Kase River dam reservoir in day of the investigation of water
quality in Kase River.
46
Fig. 3.17 Vertical profiles of water temperature, DO, turbidity and chlorophyll-a
in Kase River dam reservoir when rainfall is not seen.
46
Fig. 4.1 Watershed delineation in the watershed 51
Page 11
Cindy Jeane Supit Page viii
FIGURE NO TITLE PAGE
Fig.4.2 Land use map of study area 52
Fig. 4.3 Soil map of study area 53
Fig.4.4 Simulated and observed discharges in Kanjinbashi outlet (calibration:
2008, validation: 2009)
55
Fig.4.5 Model performances of simulated and observed discharges in
Kanjinbashi outlet
55
Fig. 4.6 Simulation of annual discharge of the Kase River basin at Kanjinbashi
outlet under the scenarios
57
Fig. 4.7 Simulation of average monthly discharge for 2008-2009 at Kanjinbashi
outlet under the scenarios
57
Fig. 4.8 Change in average annual peak flow rate in Kanjinbashi 59
Fig. 5.1 DEM data for the study area 65
Fig. 5.2 Watershed delineation in the study area 66
Fig. 5.3 Spatial data soil map 68
Fig. 5.4 Comparison on simulated and observed discharge
in Kanjinbashi outlet during 2008-2009
69
Fig. 5.5 Model performance of simulated and observed discharge
in Kanjinbashi outlet
70
Fig. 5.6 Observed and simulated daily load (N kg) during 2008-2009 in
Kanjimbashi outlet
74
Fig. 5.7 Model performances of observed and simulated TN loads in
Kanjimbashi outlet.
74
Fig. 5.8 Observed and simulated daily load (P kg) during 2008-2009 in
Kanjinbashi outlet
75
Fig. 5.9 Model performances of observed and simulated TP loads in
Kanjimbashi outlet.
75
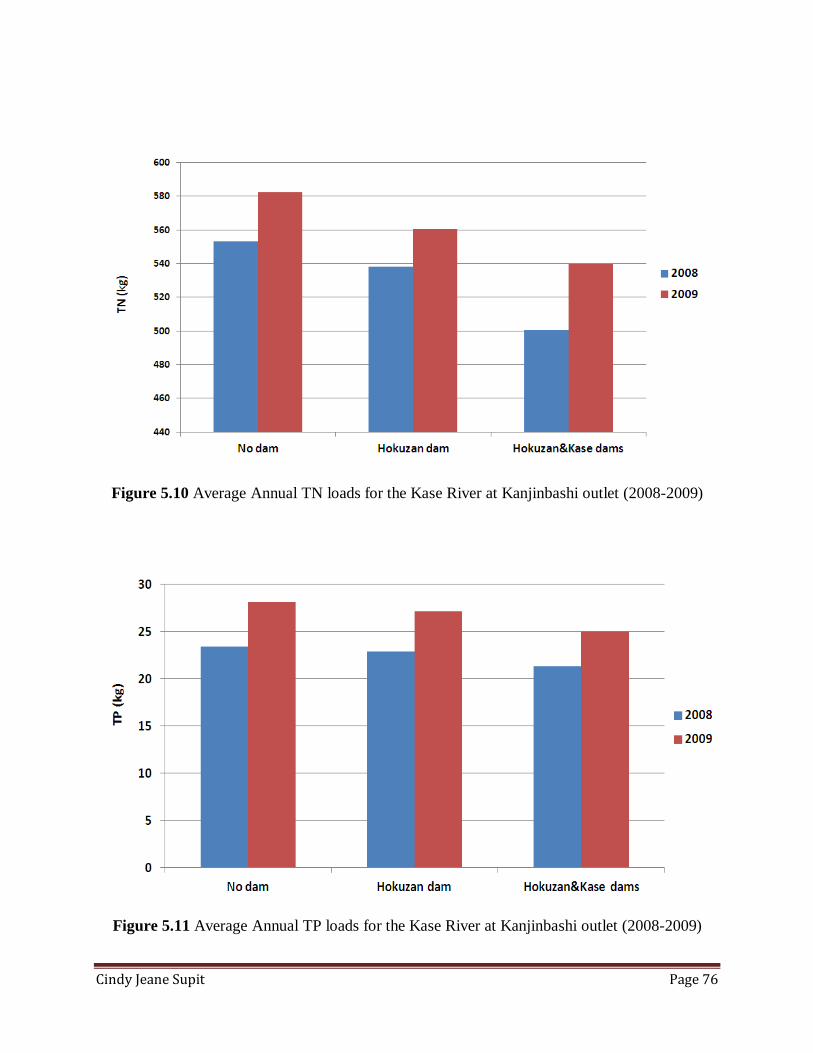
Fig. 5.10 Average Annual TN loads for the Kase River at Kanjinbashi outlet
(2008-2009)
76
Page 12
Cindy Jeane Supit Page ix
FIGURE NO TITLE PAGE
Fig. 5.11 Average Annual TP loads for the Kase River at Kanjinbashi outlet
(2008-2009)
76
Fig. 6.1 Watershed delineation in SWAT model 80
Fig. 6.2 Area characteristics of subwatersheds. 81
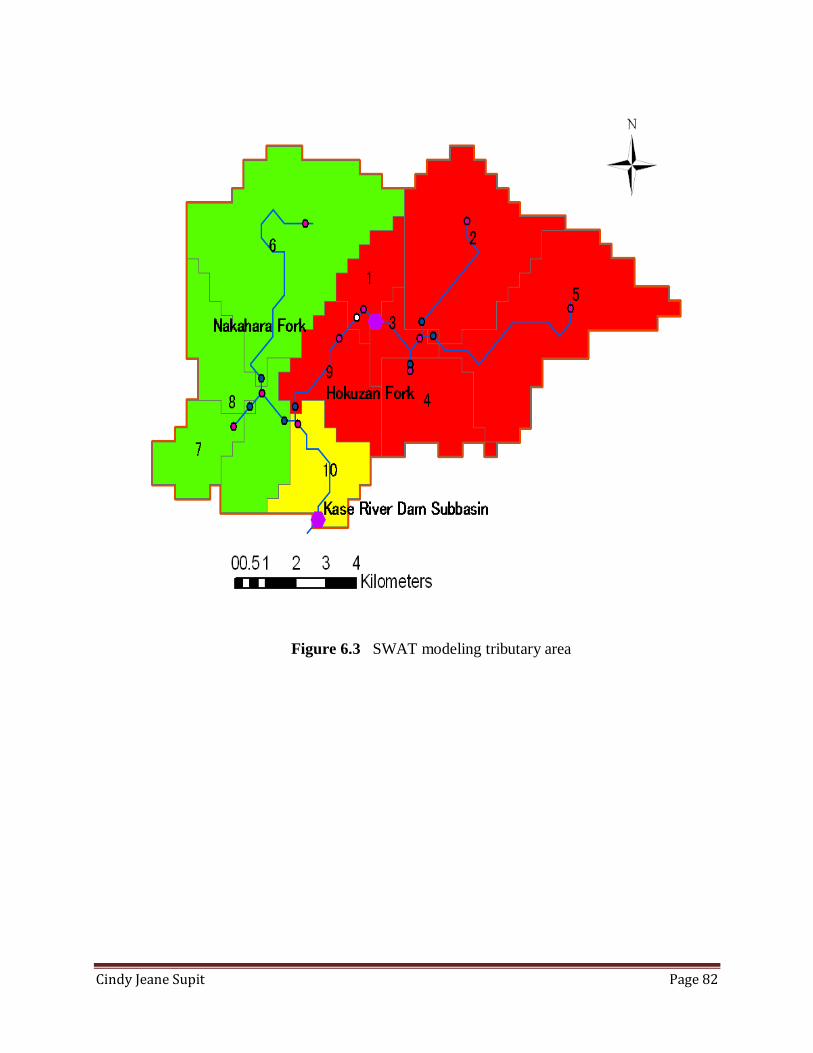
Fig. 6.3 SWAT modeling tributary area 82
Fig. 6.4 Land use area in the watershed 83
Fig. 6.5 Hokuzan Fork annual TN transport (kg) to stream reaches summarized
by land use.
91
Fig. 6.6 Hokuzan Fork annual TP transport (kg) to stream reaches summarized
by land use.
91
Fig. 6.7 Nakahara Fork annual TN transport (kg) to stream reaches summarized
by land use.
92
Fig. 6.8 Nakahara Fork annual TP transport (kg) to stream reaches summarized
by land use.
92
Fig. 7.1 Feature of an impoundment dam 99
Fig. 7.2 Location of Kase River basin 101
Fig. 7.3 Study area information 101
Fig. 7.4 Water management in Saga 102
Fig. 7.5 Water use in the basin 103
Fig. 7.6 Fukuoka DEM 105
Fig. 7.7 Kumamoto DEM 105
Fig. 7.8 Merge of Fukuoka DEM and Kumamoto DEM 106
Fig. 7.9 Watershed delineation in the watershed 106
Fig. 7.10 Land use map of study area 107
Fig. 7.11 Soil map of study area 108
Fig. 7.12 Hydrologic Response Unit analysis in SWAT 108
Fig. 7.13 Water Diversion point at the study area 109
Fig. 7.14 Observed and simulated discharge simulation 111
Page 13
Cindy Jeane Supit Page x
FIGURE NO TITLE PAGE
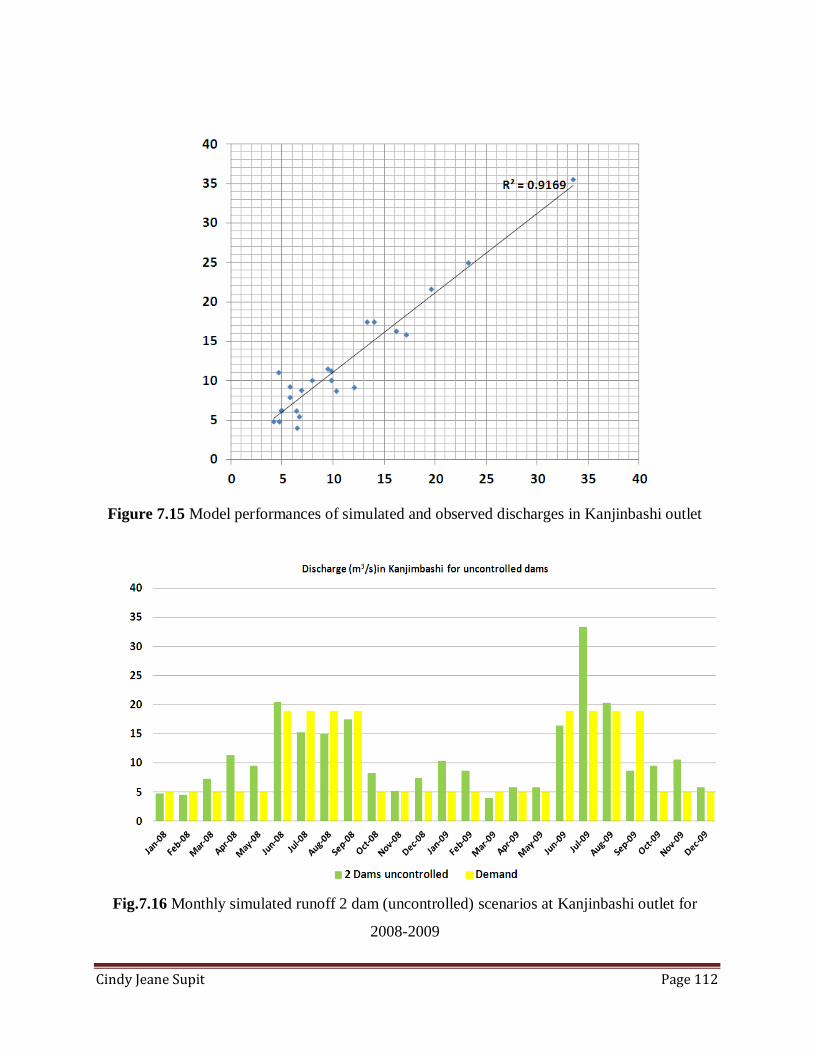
Fig. 7.15 Model performances of simulated and observed discharges in
Kanjinbashi outlet
112
Fig. 7.16 Monthly simulated runoff 2 dam (uncontrolled) scenarios at
Kanjinbashi outlet for 2008-2009
112
Fig. 7.17 Monthly simulated runoff 2 dam (controlled) scenarios at Kanjinbashi
outlet for 2008-2009
113
Fig. 7.18 Average annual Water Balance of Kase River basin 114
Page 14
Cindy Jeane Supit Page xi
LIST OF TABLES
TABLE NO TITLE PAGE
Table3.1 Description of Kase River dam 25
Table 3.2 Time table of Kase River construction 26
Table 3.3 Assorted parameters of water quality 32
Table 3.4 Environmental Standards qualification of River and Lake 33
Table 3.5 Environmental standard of PH 34
Table 3.6 Environmental standard of DO 36
Table3.7 Environmental standard of COD 38
Table 3.8 Environmental standard of SS 40
Table 3.9 Environmental standard of TN 41
Table 3.10 Environmental standard of TP 43
Table 4.1 Parameter and its ranges used in the model calibration 54
Table 4.2 Description of dams in Kase river basin 56
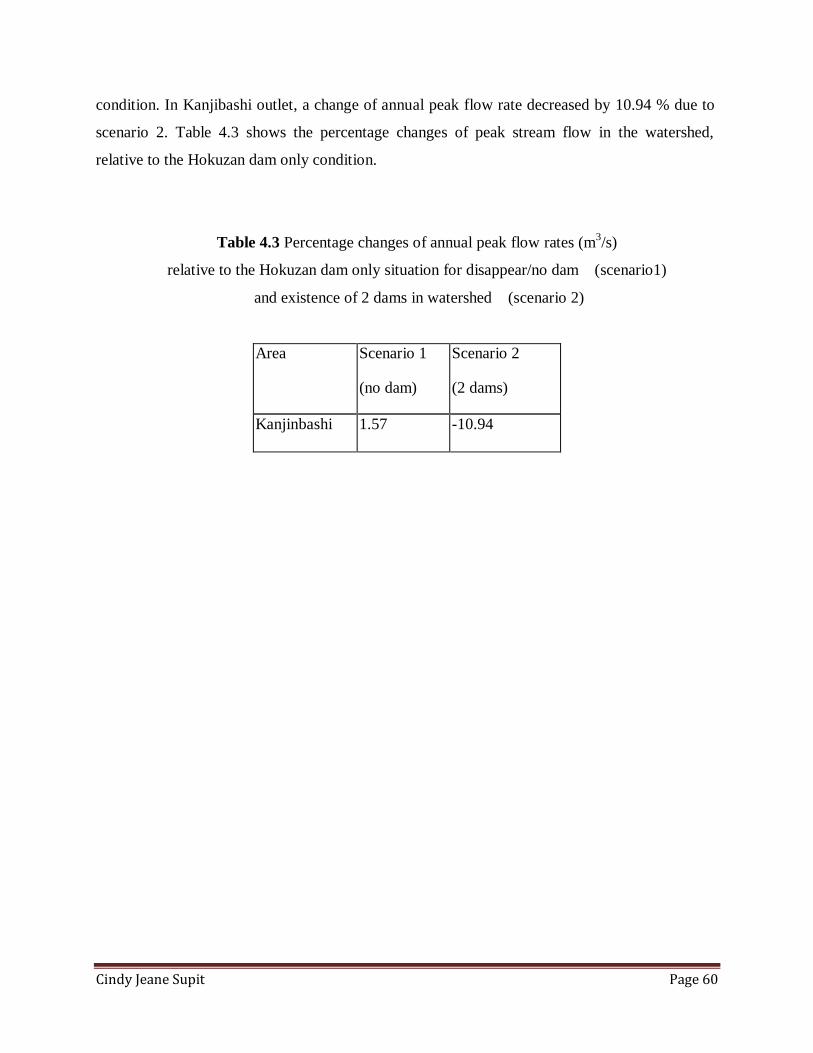
Table 4.3 Percentage changes of annual peak flow rates (m3/s)
relative to the Hokuzan dam only situation for disappear/no
dam (scenario1) and existence of 2 dams in watershed
(scenario 2)
60
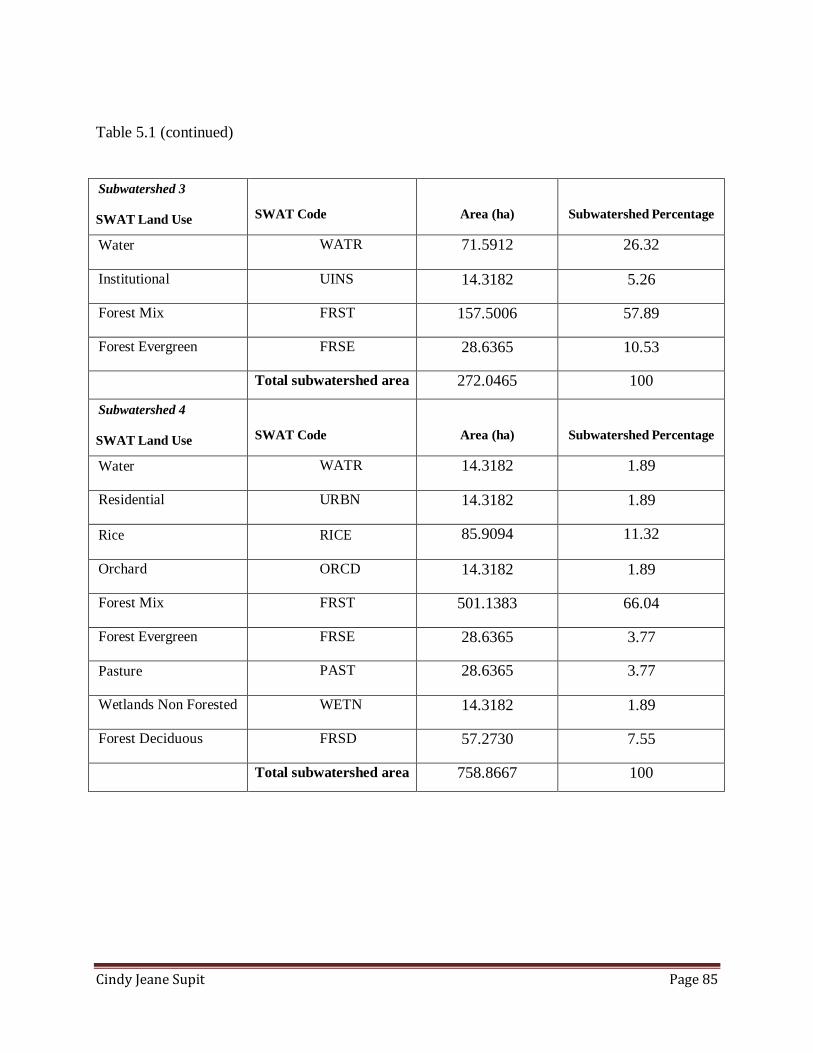
Table 5.1 Land use conversion from original land use classes to SWAT
classes
67
Table 5.2 Parameters used in the model calibration 72
Table 6.1 Tributary nutrient load 83
Table 6.2 Subwatershed land use and area characteristics 84
Table 6.3 Subwatershed annual pollutant transport (kg) to stream reaches
summarized by land use
90
Table 7.1 Parameter used in the model calibration 109
Table 7.2 Description of dams in Kase river basin 111
Table 7.3 The minimum outflow rate option of dams (m3/s) 113
Page 15
Cindy Jeane Supit Page 1
Chapter 1
INTRODUCTION
1.1. BACKGROUND
Japan has relatively high precipitation and plenty of water resources per square meter of
its territory, compared to the global standard. However, river flows largely fluctuate throughout
the year; high in the spring to summer season, and low in other periods. On the other hand, the
amount of water for domestic and industrial uses does not fluctuate as largely as the river flow.
In order to secure stable water supply, water resources development facilities such as dams have
been constructed, so that the required amount of water is made available in all seasons of the
year. Currently 789 multipurpose dams and 1,878 single-purpose dams have been constructed in
Japan (MLIT; http://www.mlit.go.jp).
History of water project in Japan
Japan is the first nation in the Asian Monsoon zone to achieve modern industrialization and it
did this in the relatively short period of about 100 years, beginning in the late nineteenth century
(MLIT; http://www.mlit.go.jp). Koga et al. (2000) draw the timeline of water project in Japan
The Meiji Restoration (Meiji Ishin)
A possession of farm lands was approved but the water; especially river water was
recognized as a public and managed by the nation. This goes to a custom, such as common
water rights. At the same time, in order to response the demand of electricity for urbanization
and industrialization, a major advance was done for hydroelectric power generation segment.
After World War II
A farmland reform by GHQ was implemented. However, food production was increased by the
nation. The demand of water for domestic, industrial, and agricultural water lead to promote the
comprehensive development of water resources such as multipurpose dams.
Page 16
Cindy Jeane Supit Page 2
A period of rapid economic growth
In 1957, the law of specific multipurpose dam was enforced. In 1961, the law of promotion
on water resource development was enforced. In this time Central government was establish,
and the centralized bureaucracy systems started. After the second war and rapid economical
growth, the government needed big project. On the other hand, as a water administration itself,
an administrative reform to divide water management into three ministry of Japan was started in
1957. The competent authorities of water are the Ministry of Health and Welfare for water
supply, the Ministry of International Trade and Industry for water for industry, and the Ministry
of Agriculture, Forestry and Fisheries for irrigation water. A vertical divide into each competent
ministry proceeded and an integrated water management in Japan was delayed. In the present,
there is a sign to establish the water basic law
Water resources management in Japan
Murakuni et.al.( 2006) Characterized the water resources management in Japan by
describing the government`s role and the legal framework as the overall planning of water
resources in Japan. Moreover this paper identified that water resources development in Japan
has evolved as both economic and population growth by increasing demands on Japan’s fresh
water resources over the past 50 years. In addition, Japan has periodically suffered from severe
water shortages, and the government policies combined with supporting institutional and legal
frameworks, as well as enforcement, seem to have effectively addressed the water resources
problem. Figure 1.1 shows the Japanese Government Organization which the national
government formulates and implements comprehensive policies such as those for water
resources development, the administration of waterworks, and the protection of water
quality, and the local governments take charge of operation, maintenance and management of
waterworks, water treatment facilities, and water utilities.
Page 17
Cindy Jeane Supit Page 3
Figure 1.1. Japanese Government Organization( Murakuni et al.2006).
Page 18
Cindy Jeane Supit Page 4
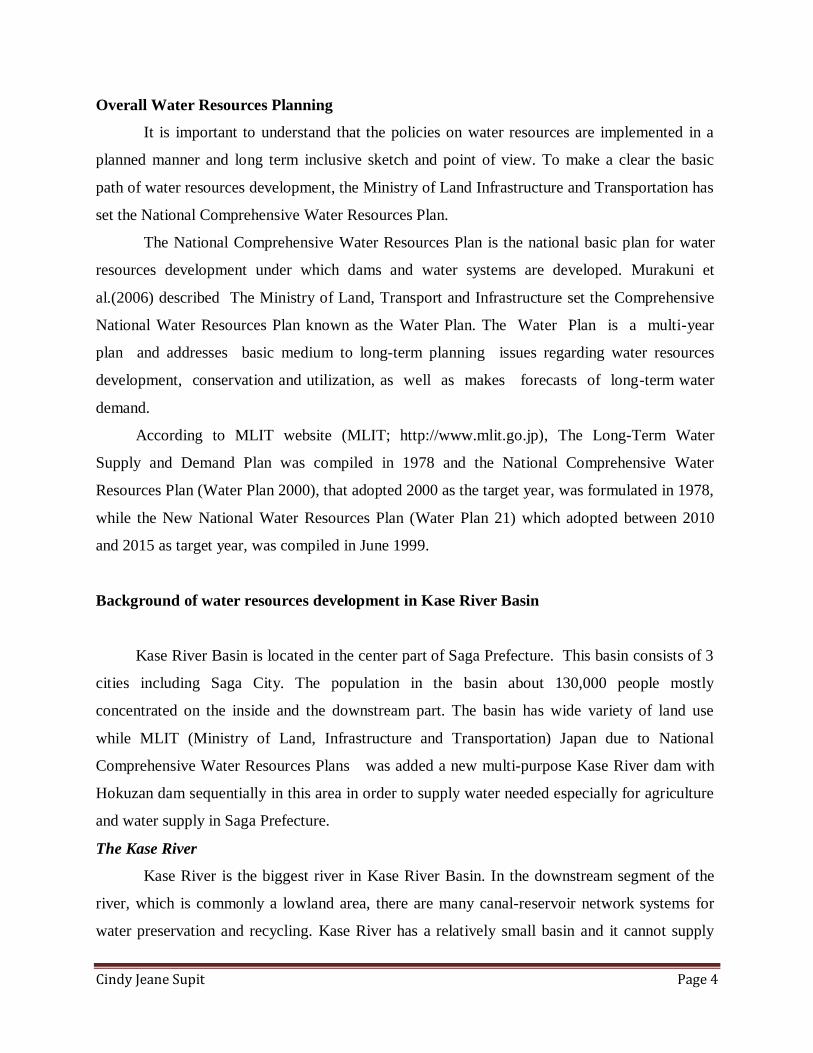
Overall Water Resources Planning
It is important to understand that the policies on water resources are implemented in a
planned manner and long term inclusive sketch and point of view. To make a clear the basic
path of water resources development, the Ministry of Land Infrastructure and Transportation has
set the National Comprehensive Water Resources Plan.
The National Comprehensive Water Resources Plan is the national basic plan for water
resources development under which dams and water systems are developed. Murakuni et
al.(2006) described The Ministry of Land, Transport and Infrastructure set the Comprehensive
National Water Resources Plan known as the Water Plan. The Water Plan is a multi-year
plan and addresses basic medium to long-term planning issues regarding water resources
development, conservation and utilization, as well as makes forecasts of long-term water
demand.
According to MLIT website (MLIT; http://www.mlit.go.jp), The Long-Term Water
Supply and Demand Plan was compiled in 1978 and the National Comprehensive Water
Resources Plan (Water Plan 2000), that adopted 2000 as the target year, was formulated in 1978,
while the New National Water Resources Plan (Water Plan 21) which adopted between 2010
and 2015 as target year, was compiled in June 1999.
Background of water resources development in Kase River Basin
Kase River Basin is located in the center part of Saga Prefecture. This basin consists of 3
cities including Saga City. The population in the basin about 130,000 people mostly
concentrated on the inside and the downstream part. The basin has wide variety of land use
while MLIT (Ministry of Land, Infrastructure and Transportation) Japan due to National
Comprehensive Water Resources Plans was added a new multi-purpose Kase River dam with
Hokuzan dam sequentially in this area in order to supply water needed especially for agriculture
and water supply in Saga Prefecture.
The Kase River
Kase River is the biggest river in Kase River Basin. In the downstream segment of the
river, which is commonly a lowland area, there are many canal-reservoir network systems for
water preservation and recycling. Kase River has a relatively small basin and it cannot supply
Page 19
Cindy Jeane Supit Page 5
enough water for the water demand of the river basin and of the Saga city. Especially in the
downstream segment of the river, the farmers had to control the water level as high as their
canal-reservoir and creek canals. Since the downstream area of Kase River is lowland or delta,
after the irrigation period, when the water is low, the potential eutrophication can occurred
caused by the remaining nutrient settled in the creek. Furthermore, due to the change of lifestyle
and population growth, the water quality tends to decrease. Currently the demand of water for
preventing eutrophication at the open channel in downstream area is 5 m3/s, and a discharge
over 18.6 m3/s in the irrigation period are the values that must be reach to meet the needs of
community.
Irrigation agricultural in the lower part of Kase River, Japan suffered severe situation in
terms of water management. Though Kase River is the biggest in Kase River basin, it has a
relatively small basin. The water demand mainly for irrigation/ agriculture purpose is larger than
the potential water supply. Especially in the downstream part of the river, the mainly serious
concern is how to obtain and keep the water inside the district. That condition brought about
unique water reserve and recycle system. Since Kase River runs at the lowest place in the area, it
was impossible to develop a normal irrigation system with the free-flow open canal. During land
preparation period in spring, huge water usage for irrigation starts from the higher stream of the
river to the downstream area.
Creek canals
The month of June is the start of rainy season, and the amount of precipitation gives
supplemental water for rice plant. Rice plant is very dependent on the quantity of rain. Because
water shortage hits agricultural activity repeatedly, farmers had been extending canal-reservoir
networks, so called creek canals in the area to continue the water from small stream and use it
again and again.
The water in the creek will be scooped again to the paddy field by bucket and water wheel
with human power. Almost all agricultural areas are facing to the creek and mainly of irrigated
water return to the creek. The water in the creek is to be used again and again. To minimize
water shortage as well as the labor work to take the water into the paddy field, farmers keep the
water level of the creek as high as possible (Yoshioka T, 2004).
Page 20
Cindy Jeane Supit Page 6
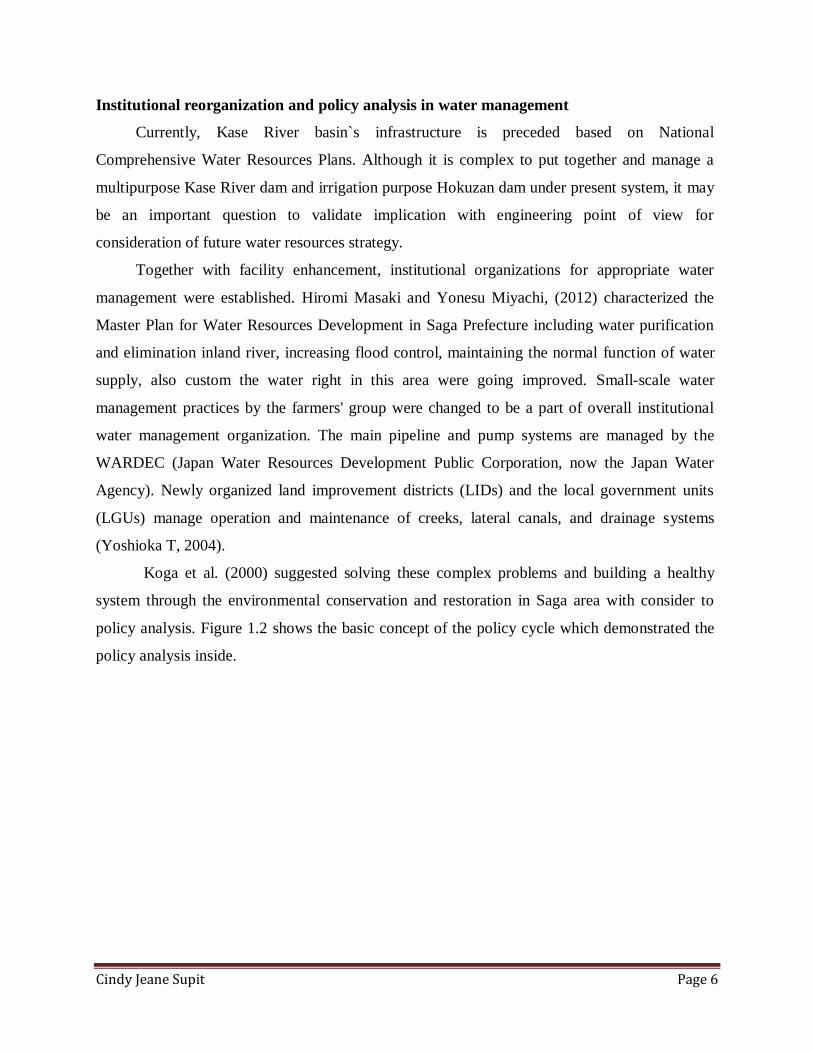
Institutional reorganization and policy analysis in water management
Currently, Kase River basin`s infrastructure is preceded based on National
Comprehensive Water Resources Plans. Although it is complex to put together and manage a
multipurpose Kase River dam and irrigation purpose Hokuzan dam under present system, it may
be an important question to validate implication with engineering point of view for
consideration of future water resources strategy.
Together with facility enhancement, institutional organizations for appropriate water
management were established. Hiromi Masaki and Yonesu Miyachi, (2012) characterized the
Master Plan for Water Resources Development in Saga Prefecture including water purification
and elimination inland river, increasing flood control, maintaining the normal function of water
supply, also custom the water right in this area were going improved. Small-scale water
management practices by the farmers' group were changed to be a part of overall institutional
water management organization. The main pipeline and pump systems are managed by the
WARDEC (Japan Water Resources Development Public Corporation, now the Japan Water
Agency). Newly organized land improvement districts (LIDs) and the local government units
(LGUs) manage operation and maintenance of creeks, lateral canals, and drainage systems
(Yoshioka T, 2004).
Koga et al. (2000) suggested solving these complex problems and building a healthy
system through the environmental conservation and restoration in Saga area with consider to
policy analysis. Figure 1.2 shows the basic concept of the policy cycle which demonstrated the
policy analysis inside.
Page 21
Cindy Jeane Supit Page 7
Figure 1.2.Policy cycle (Koga et al.in Narumol, 2004)
With the increase in water demand and interest, water system becomes more complicated
than in the past time. To evaluate the proposed alternatives, various analyses from academic
analysis are required in policy analysis. As a result many kinds of academic analysis are
necessary. According to technological development, computer model become one of effective
analytical tool for water management.
Managing water resources in this area is an important research topic in the integrated
basin management to provide a new approach to water environment improvement. A
demand for sufficiently water for agricultural purposed in the irrigation period and prevent
harmful nutrient effects at open channel in the downstream area are urgent issues to answer
community needs.
Kase River dam and Hokuzan dam are expected as an answer of people in lower area
which need water supply for their needs sufficiently, also Kase River dam and Hokuzan dam
can be expected act as the positive environmental features for hold back the nutrient transport to
downstream area. The current research on the impact of water projects on river flow and
the surrounding environment of multiple dams and optimizing modeling of dams operation are
rare. This study is to provide a view of the potential impacts of dam reservoir on river flow
Page 22
Cindy Jeane Supit Page 8
regime and water quality for a mountain dam watershed in Kase River basin and to develop a
dam management tool to manage water resources in this area using SWAT (Soil and Water
Assessment Tool) model
Several studies have analyzed a single dam impoundment impact focus on river flow
regime (Moore et al, 1969; Yang et al, 2008; Betnarek et al, 2001; Berkamp et al. 2008). Some
studies have investigated impoundment interacts with stream nutrient dynamics in the river
system. The main probability is that the impoundment will act as net nutrient sinks in river
systems (Alexander et al., 2002; Dixit et al., 2000; Ejsmontkarabin et al., 1993; Kling et al.,
2000; Maurer et al., 1995). Maurer et al. (1995) found that a large, eutrophic natural lake in
Minnesota was still an active net annual sink for both nitrogen (N) and phosphorus (P)
despite consistent sedimentation over the last century.
There are few researches on water management including the effects of dam reservoir on
hydrological process and water quality of multiple dams.
This research is to better understand the potential impact of dam reservoir on river flow
regime and water quality through Kase river systems by studying dam’s impoundment at the
Kase River basin scale within the context of their existence, and to develop a management tool
for water resources in study area. Because it is not practical to actually create or remove dams at
various locations within the study watersheds, a watershed hydrologic model is used to simulate
these changes and forecast outcome. The results of the simulation are proposed as a tool for
environmental management toward a sustainable development in this basin.
OBJECTIVES
This research is to assess the potential impacts of dam reservoir on river flow regime and
water quality, and to develop a management tool of dam reservoirs for water resources in Kase
River basin
1.2. OUTLINE OF DISSERTATION
This dissertation is composed of eight chapters, which are briefly outlined below.
Page 23
Cindy Jeane Supit Page 9
Chapter 1: This chapter discusses the introduction of this study. It mentions the problem
statement, and the expected outcome of this research. Concept of water resources management in
Japan and Saga area are reviewed. Also the background on water resources planning and the
policy analysis are summarized to give an idea on water management in Kase River basin.
Chapter 2: The chapter summarizes literature regarding various model of hydrology and
water quality model. It discusses an overview of SWAT model and how the model simulates the
hydrology and water quality processes.
Chapter 3: This chapter presents the observation of the history water quality change in
Kase River basin and discuses the water quality parameter at every point investigation from
Oozeki, Furuyu, Kanjinbashi, and Kasebashi. The observation of reservoir water quality for the
initial impoundment also discussed.
Chapter 4: This chapter describes the prediction of dam reservoir on annual and peak flow
rates in the study area. To describe effects on annual and peak stream watershed discharge from
various presented dam, scenarios were run, using the calibrated model. The set of scenarios
tested the impact of the existence or nonexistence of reservoirs in the watersheds. It discusses
also the evaluation of the model efficiency to simulate the streamflow.
Chapter 5: This chapter discusses the dam reservoir effects on riverine nutrient transport
in the study area. It gives a better understanding on effects of damming the river on riverine
nitrogen (N) and phosphorus (P) export. The scenario of absence-existence the reservoirs also
have done to assess the effects of impoundment in Hokuzan dam reservoir and Kase River dam
reservoir.
Chapter 6: This chapter presents the estimating of tributary nutrient source loading into
the new Kase River dam reservoir in watershed scale and provides a discussion of methodology
to examine tributary nutrient source.It discusses the tributary source of nutrient from upstream of
Kase dam reservoir, and assorted upstream land cover.
Page 24
Cindy Jeane Supit Page 10
Chapter 7: This chapter discusses the management dam operation for developing the water
resources in the study area; also the setup of the model to have the target simulation is presented.
Chapter8: This chapter summarizes and discusses the finding from the previous chapters.
It also highlights the implications of the study along with suggestions for a future research
Page 25
Cindy Jeane Supit Page 11
Chapter 2
LITERATURE REVIEW
The chapter is divided in three parts. The first part focuses on summarizes literature
regarding hydrology and water quality models, the second part focuses on SWAT general
information, and the last is about SWAT theory
2.1. HYDROLOGY AND WATER QUALITY MODELS
Models are representations of systems or processes. Some models are actually miniature
physical representation of natural systems. Sometimes, series of equations are used to represent
the systems, thus forming mathematical models. The number, form, and interconnections of
these equations in a model can range from very simple to highly sophisticated. The equations
within the mathematical models can be produced from basic physical laws or from statistical
analysis of observed data (empirical equations). (Butcher, 2008)
In the recent years, with the rapid development of computational capabilities and
algorithms a huge number of models have been presented such as MIKE, BASINS, WASP,etc.
Basically, hydrology and water quality models can be categorized into two types of models:
kinetics and time series analysis models. Kinetic models deal with all the physical- chemical
processes that happen in the watershed such as: rainfall, erosion, and nitrification and
denitrification .etc. On the other hand, the time series analysis models only concern the
relationship between the data in different time and location without looking into the
physical – chemical processes occurring in the watershed.
In this study Soil and Water Analysis Tool, a physical – based model, was used. Hence,
the general theoretical considerations of nutrient processes are necessarily to be reviewed.
SWAT theory can be fundamentally found in the SWAT Theory (Neitsch et al,2002), brief
explanations were implemented in the following sections as the basic background of the
model configuration.
The next segment reviewed some hydrologic and water quality models. The review was
generalized from previous studies (Lal et al, 1994; Babel et al, 2004).
Page 26
Cindy Jeane Supit Page 12
The Hydrological Simulation Program – FORTRAN (HSPF), a development of Stanford
watershed model IV (Johnson et al, 2003), simulates watershed hydrology and sediment yield.
Data requirements for HSPF are extensive. HSPF is a continuous simulation model and requires
continuous data (generally hourly rainfall is required) to drive the simulations. The watershed is
divided into land segments and stream channel segments. HSPF has been applied to the
68,000 square mile watershed draining to Chesapeake Bay (Lal et al, 1994). Although the
watershed can be subdivided, the land segments are normally large enough to require
considerable lumping of inputs. HSPF uses such information as the time history of rainfall,
temperature, solar intensity, and parameters related to land use patterns, soil characteristics,
and agricultural practices to simulate the processes that occur in a watershed. The initial result
of an HSPF simulation is a time history of the quantity and quality of water transported over the
land surface and through various soil zones down to the groundwater aquifers. Runoff flow rate,
sediment loads, nutrients, pesticides, toxic chemicals and other quality constituent concentrations
can be predicted. The model then takes these results and information about the receiving water
channels in the watershed and simulates the processes that occur in these channels. This part of
the simulation produces a time history of water quantity and quality at any point in the watershed.
The Chemicals, Runoff, and Erosion from Agricultural Management Systems
(CREAMS) (Lal et al, 1994) model is a physically based, daily simulation model that estimates
runoff, erosion/sediment transport, plant nutrient, and pesticide yield from field- sized areas. The
hydrologic component consists of two options. When only daily rainfall data are available to the
user, the SCS curve number model is used to estimate surface runoff. If hourly or breakpoint
rainfall data are available, an infiltration-based model is used to simulate runoff. Both methods
estimate percolation through the root zone of the soil. The erosion component maintains
elements of the USLE, but includes sediment transport capacity for overland flow. A channel
erosion/deposition feature of the model permits consideration of concentrated flow within a field.
Impoundments are treated in the erosion component also. The plant nutrient submodel of
CREAMS has a nitrogen component that considers mineralization, nitrification, and
denitrification processes. Plant uptake is estimated, and nitrate leached by percolation out the
root zone is calculated. Both the nitrogen and phosphorus parts and the nutrient component use
enrichment ratios to estimate that portion the two nutrients transported with sediment. The
pesticide component considers foliar interception, degradation, and washoff, as well as
Page 27
Cindy Jeane Supit Page 13
adsorption, desorption, and degradation in the soil. This method, like the nutrient model, uses
enrichment ratios and portioning coefficients to calculate the separate sediment and water
phases of pesticide loss. The CREAMS model is applicable for a field having (1) a single land
use; (2) relative homogeneous soils; (3) spatially uniform rainfall; and (4) a single management
system, such as terraces. Normally a field is less than 100 ha. CREAMS can estimate the impact
management systems, such as planting dates, cropping systems, irrigation scheduling, and tillage
operations, have on sediment and nutrient movement. The model is also useful in long-term
simulations for pesticide screening of management systems.
AGNPS is an event based, distributed parameter computer simulation model
developed by the Agricultural Research Service (ARS) in cooperation with the Minnesota
Pollution Control Agency and the Soil Conservation Service. The model subdivides the
watershed into uniform grids called "cells". Potential pollutants are routed through cells in a
stepwise manner, proceeding from the headwaters of the watershed to the outlet. The model can
be used to predict runoff volume, peak flow, as well as sediment, nutrient, and pesticide yields
for single storm events at any point in a given watershed. The nutrients considered include
nitrogen (N) and phosphorus (P), both essential plant nutrients and major contributors to surface
water pollution. In addition, the model considers point sources of water, sediment, nutrients, and
chemical oxygen demand (COD) from animal feedlots, and springs. Basic model components of
AGNPS include hydrology, erosion and sediment and chemical transport. Model components use
equations and methodologies that have been well established and are extensively used by
agencies such as the USDA Natural
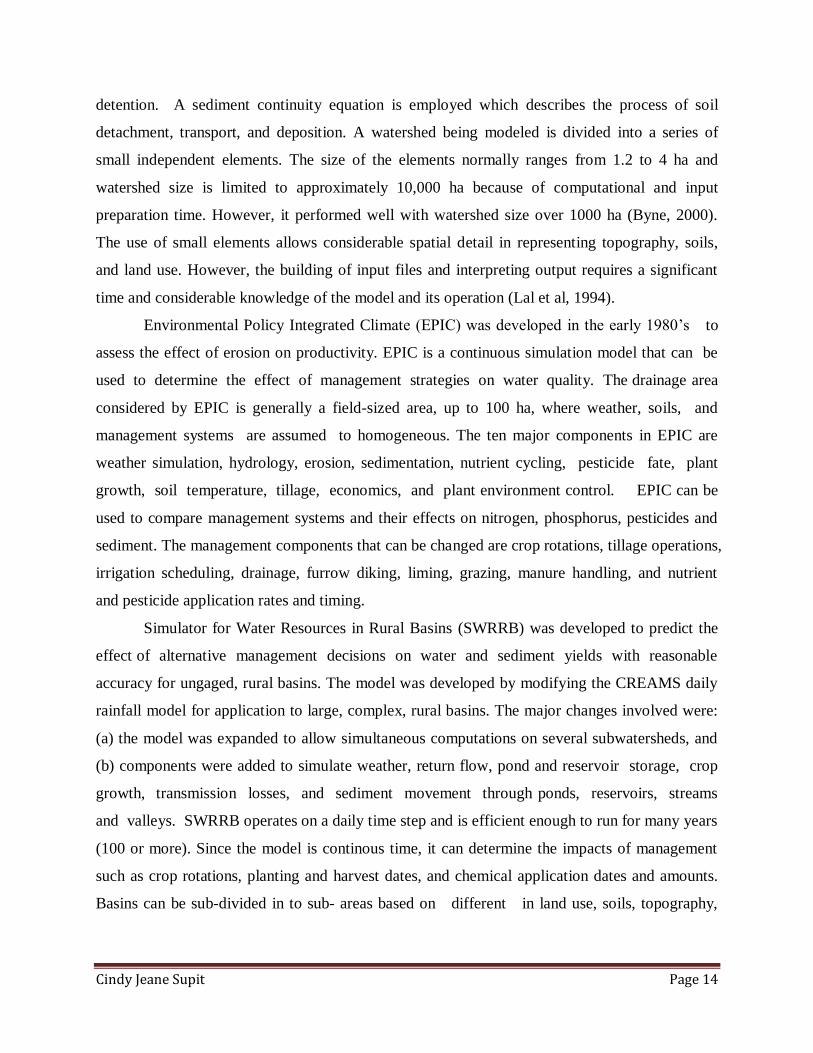
ANSWERS-2000 (Byne, 2000) is a continuous simulation, distributed parameter model.
It was developed upon the hypothesis that at every point in a watershed there exists a
relationship between water flow rates and the factors that govern them, and that these can be
related to processes in the watershed such as erosion or chemical movement. The point concept
is relaxed to square cells of uniform size, for which arbitrary changes of parameter values for a
single element have a negligible influence upon the response of the watershed. Parameter values
may vary in an unrestricted fashion so that any degree of spatial variability may be
represented. The individual elements act together as a composite system because their hydrology
is interrelated, and the outflow from one element becomes the inflow to another. Hydrology
model components include rainfall interception, infiltration, surface detention, and surface
Page 28
Cindy Jeane Supit Page 14
detention. A sediment continuity equation is employed which describes the process of soil
detachment, transport, and deposition. A watershed being modeled is divided into a series of
small independent elements. The size of the elements normally ranges from 1.2 to 4 ha and
watershed size is limited to approximately 10,000 ha because of computational and input
preparation time. However, it performed well with watershed size over 1000 ha (Byne, 2000).
The use of small elements allows considerable spatial detail in representing topography, soils,
and land use. However, the building of input files and interpreting output requires a significant
time and considerable knowledge of the model and its operation (Lal et al, 1994).
Environmental Policy Integrated Climate (EPIC) was developed in the early 1980’s to
assess the effect of erosion on productivity. EPIC is a continuous simulation model that can be
used to determine the effect of management strategies on water quality. The drainage area
considered by EPIC is generally a field-sized area, up to 100 ha, where weather, soils, and
management systems are assumed to homogeneous. The ten major components in EPIC are
weather simulation, hydrology, erosion, sedimentation, nutrient cycling, pesticide fate, plant
growth, soil temperature, tillage, economics, and plant environment control. EPIC can be
used to compare management systems and their effects on nitrogen, phosphorus, pesticides and
sediment. The management components that can be changed are crop rotations, tillage operations,
irrigation scheduling, drainage, furrow diking, liming, grazing, manure handling, and nutrient
and pesticide application rates and timing.
Simulator for Water Resources in Rural Basins (SWRRB) was developed to predict the
effect of alternative management decisions on water and sediment yields with reasonable
accuracy for ungaged, rural basins. The model was developed by modifying the CREAMS daily
rainfall model for application to large, complex, rural basins. The major changes involved were:
(a) the model was expanded to allow simultaneous computations on several subwatersheds, and
(b) components were added to simulate weather, return flow, pond and reservoir storage, crop
growth, transmission losses, and sediment movement through ponds, reservoirs, streams
and valleys. SWRRB operates on a daily time step and is efficient enough to run for many years
(100 or more). Since the model is continous time, it can determine the impacts of management
such as crop rotations, planting and harvest dates, and chemical application dates and amounts.
Basins can be sub-divided in to sub- areas based on different in land use, soils, topography,
Page 29
Cindy Jeane Supit Page 15
and climate. SWRRB has been validated on basins up to 500 square kilometers (Lal et al, 1994).
Since SWRRB allows a limited number of subareas, some lumping of inputs is required.
2.2. SOIL AND WATER ANALYSIS TOOL (SWAT)
Soil and Water Assessment Tool (SWAT) is a river basin, or watershed scale model
developed by Dr. Jeff Arnold in 1985 for the USDA Agricultural Research Service. SWAT
was developed to predict the impact of land management practices on water, sediment and
agricultural chemical yields in large complex watersheds with varying soils, land use and
management conditions over long periods of time. ArcSWAT, a version of SWAT integrated
with a Geographic Information System (Winchell, 2007) allows the user to prepare SWAT input
and run the model within the framework of ArcGIS (Winchell, 2007).
SWAT is a continuous time, long-term yield spatially discrete model. The model is not
designated for single-event flood routing. Compared to other modeling environment, SWAT has
some unique features (Neitsch, 2002):
SWAT is process based. Rather than incorporating regression equations to describe the
relationship between input and output variables, SWAT requires specific information about
weather, soil properties, and topography, vegetation, and land management practices
occurring in the watershed. The physical processes associated with water movement,
sediment, crop growth, nutrient cycling, etc. are directly modeled by SWAT using input data.
SWAT uses readily available inputs. While SWAT can be used to study more specialized
processes such as bacteria transport, the minimum data required to make a run are
commonly available from the government agencies, such as precipitation and temperature
data.
SWAT is computationally efficient. Simulation of very large basin or a variety of
management strategies can be performed without excessive investment of time or money.
SWAT enables users to study long-term impacts. Many of the problems currently addressed
by users involve the gradual buildup of the pollutants and the impact on downstream water
bodies. To study these types of problems, results are needed from runs without output
spanning several decades. (Neitsch, 2002)
Page 30
Cindy Jeane Supit Page 16
SWAT can be used to simulate a single watershed or a system of multiple
hydrologically connected watersheds. Each watershed is first divided into subbasins and
then in hydrologic response units (HRUs) based on the land use and soil distributions. The
key procedures of SWAT are:
Load or select the ArcSWAT extension
Delineate the watershed and define the HRUs
(Optional) Edit SWAT databases
Define the weather data
Apply the default input files writer
(Optional) Edit the default input files
Set up (requires specification of simulation period, PET calculation method, etc.)
and run SWAT
(Optional) Apply a calibration tool
(Optional) Analyze, plot and graph SWAT output
2.3. SWAT THEORY
The SWAT theory was generalized from SWAT Theoretical Documentation ( Neitsch, 2002)
2.3.1 SWAT Hydrologic simulation
SWAT allows a number of different physical processes to be simulated in a watershed.
For modeling purposes, a watershed may be partitioned into a number of subwatersheds or
subbasins. The use of subbasins in a simulation is particularly beneficial when different areas of
the watershed are dominated by land uses or soils dissimilar enough in properties to impact
hydrology. By partitioning the watershed into subbasins, the user is able to reference different
areas of the watershed to one another spatially. No matter what type of problem studied with
SWAT, water balance is the driving force behind everything that happens in the watershed. To
accurately predict the movement of pesticides, sediments or nutrients, the hydrologic cycle as
simulated by the model must conform to what is happening in the watershed
Page 31
Cindy Jeane Supit Page 17
The hydrologic cycle as simulated by SWAT is based on the water balance equation:
)1.2()(1
0 gwseepasurf
t
i
dayt QwEQRSWSW
where SWt is the final soil water content (mm H2O), SW0 is the initial soil water content
on day i (mm H2O), t is the time (days), Rday is the amount of precipitation on day i (mm H2O),
Qsurf is the amount of surface runoff on day i (mm H2O), Ea is the amount of evapotranspiration
on day i (mm H2O), wseep is the amount of water entering the vadose zone from the soil profile
on day i (mm H2O), and Qgw is the amount of return flow on day i (mm H2O). The land phase of
the hydrologic cycle, depicted in Figure 2.1.
The subdivision of the watershed enables the model to reflect differences in
evapotranspiration for various crops and soils. Runoff is predicted separately for each HRU
and routed to obtain the total runoff for the watershed. This increases accuracy and gives a
much better physical description of the water balance.
Figure 2.1.Schematic representation of the hydrologic cycle in SWAT (Neitsch et al. 2002).
Page 32
Cindy Jeane Supit Page 18
The climate of a watershed provides the moisture and energy inputs that control the water
balance and determine the relative importance of the different components of the hydrologic
cycle. The climatic variables required by SWAT consist of daily precipitation,
maximum/minimum air temperature, solar radiation, wind speed and relative humidity. The
model allows values for daily precipitation, maximum/minimum air temperatures, solar radiation,
wind speed and relative humidity to be input from records of observed data or generated during
the simulation.
Surface runoff volume is computed using a modification of the SCS curve number method
(USDA Soil Conservation Service, 1972) or the Green & Ampt infiltration method (Green and
Ampt, 1911). In the curve number method, the curve number varies non-linearly with the
moisture content of the soil. The curve number drops as the soil approaches the wilting point and
increases to near 100 as the soil approaches saturation. The Green & Ampt method requires
sub-daily precipitation data and calculates infiltration as a function of the wetting front matric
potential and effective hydraulic conductivity. Water that does not infiltrate becomes surface
runoff. SWAT includes a provision for estimating runoff from frozen soil where a soil is defined
as frozen if the temperature in the first soil layer is less than 0°C. The model increases runoff for
frozen soils but still allows significant infiltration when the frozen soils are dry.
Peak runoff rate predictions are made with a modification of the rational method. In brief,
the rational method is based on the idea that if a rainfall of intensity i begins instantaneously and
continues indefinitely, the rate of runoff will increase until the time of concentration, tc, when all
of the subbasin is contributing to flow at the outlet. In the modified Rational Formula, the peak
runoff rate is a function of the proportion of daily precipitation that falls during the subbasin tc,
the daily surface runoff volume, and the subbasin time of concentration. The proportion of
rainfall occurring during the subbasin tc is estimated as a function of total daily rainfall using a
stochastic technique. The subbasin time of concentration is estimated using Manning’s
Formula considering both overland and channel flow.
Ponds are water storage structures located within a subbasin which intercepts surface
runoff. The catchment area of a pond is defined as a fraction of the total area of the subbasin.
Ponds are assumed to be located off the main channel in a subbasin and will never receive water
from upstream subbasins. Pond water storage is a function of pond capacity, daily inflows and
Page 33
Cindy Jeane Supit Page 19
outflows, seepage and evaporation. Required inputs are the storage capacity and surface area of
the pond when filled to capacity.
Two types of channels are defined within a subbasin: the main channel and
tributary channels. Tributary channels are minor or lower order channels branching off the main
channel within the subbasin. Each tributary channel within a subbasin drains only a portion of
the subbasin and does not receive groundwater contribution to its flow. All flow in the tributary
channels is released and routed through the main channel of the subbasin. SWAT uses the
attributes of tributary channels to determine the time of concentration for the subbasin.
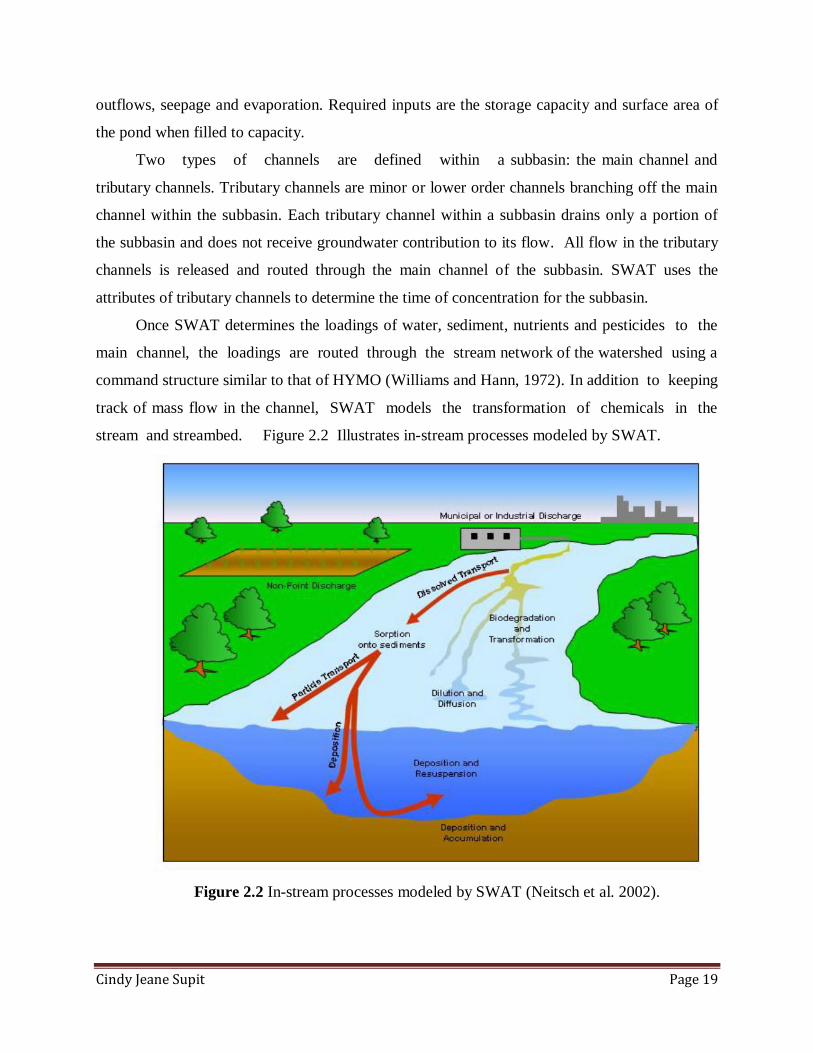
Once SWAT determines the loadings of water, sediment, nutrients and pesticides to the
main channel, the loadings are routed through the stream network of the watershed using a
command structure similar to that of HYMO (Williams and Hann, 1972). In addition to keeping
track of mass flow in the channel, SWAT models the transformation of chemicals in the
stream and streambed. Figure 2.2 Illustrates in-stream processes modeled by SWAT.
Figure 2.2 In-stream processes modeled by SWAT (Neitsch et al. 2002).
Page 34
Cindy Jeane Supit Page 20
2.3.2 SWAT Water quality processes simulation
SWAT tracks the movement and transformation of several forms of nitrogen and
phosphorus in the watershed. In the soil, transformation of nitrogen from one form to another is
governed by the nitrogen cycle as depicted in Figure 2.3. The transformation of phosphorus in
the soil is controlled by the phosphorus cycle shown in Figure 2.4. Nutrients may be introduced
to the main channel and transported downstream through surface runoff and lateral subsurface
flow.
The different processes modeled by SWAT in the HRUs and the various pools of nitrogen
in the soil are depicted in Figure 2.3. Plant use of nitrogen is estimated using the supply and
demand approach. In addition to plant use, nitrate and organic N may be removed from the soil
via mass flow of water. Amounts of NO3-N contained in runoff, lateral flow and percolation are
estimated as products of the volume of water and the average concentration of nitrate in the layer.
Organic N transport with sediment is calculated with a loading function developed by McElroy
et al. (1976) and modified by Williams and Hann (1978) for application to individual runoff
events. The loading function estimates the daily organic N runoff loss based on the concentration
of organic N in the top soil layer, the sediment yield, and the enrichment ratio. The enrichment
ratio is the concentration of organic N in the sediment divided by that in the soil.
Figure 2.3. Nitrogen in SWAT (Neitsch et al. 2002).
Page 35
Cindy Jeane Supit Page 21
The different processes modeled by SWAT in the HRUs and the various pools of
phosphorus in the soil are depicted in Figure 2.4. Plant use of phosphorus is estimated using the
supply and demand approach. In addition to plant use, soluble phosphorus and organic P may be
removed from the soil via mass flow of water. Phosphorus is not a mobile nutrient and
interaction between surface runoff with solution P in the top 10 mm of soil will not be complete.
The amount of soluble P removed in runoff is predicted using solution P concentration in the top
10 mm of soil, the runoff volume and a partitioning factor. Sediment transport of P is simulated
with a loading function as described in organic N transport.
Figure 2.4. Phosphorus in SWAT (Neitsch et al. 2002).
Nutrient transformations in the stream are controlled by the in-
stream water quality component of the model. The in-stream kinetics used in SWAT for nutrient
routing are adapted from QUAL2E (Brown and Barnwell, 1987). The model tracks nutrients
dissolved in the stream and nutrients adsorbed to the sediment. Dissolved nutrients are
transported with the water while those sorbed to sediments are allowed to be deposited
with the sediment on the bed of the channel.
A simple model for nitrogen and phosphorus mass balance inside the reservoir was taken
from Chapra (1997). The model assumes: 1) the lake is completely mixed; 2) phosphorus is
the limiting nutrient; and, 3) total phosphorus is a measure of the lake trophic status. The
Page 36
Cindy Jeane Supit Page 22
first assumption ignores lake stratification and intensification of phytoplankton in the epilimnon.
The second assumption is generally valid when non-point sources dominate and the third
assumption implies that a relationship exists between total phosphorus and biomass. The
phosphorus mass balance equation includes the concentration in the lake, inflow, outflow and
overall loss rate.
Page 37
Cindy Jeane Supit Page 23
CHAPTER 3
OBSERVED ENVIRONMENT OF KASE RIVER AND RESERVOIR
3.1 INTRODUCTION
Kyushu Island is the southernmost of the four major islands in the Japanese Archipelago.
Saga Prefecture is located in the northern part of this Kyushu Island. It has enjoyed many
exchanges with other Asian countries since ancient times, evidence of which can be witnessed at
the numerous historical sites in the region. Saga is blessed with natural beauty. In the north is the
Genkai Sea and in the south, the Ariake Sea. In addition, the Sefuri Mountain Range is located in
the north of the Prefecture and the vast Saga Plains in the south. Saga has so many things to offer
visitors, with its natural beauty, rich history, plentiful hot springs and exciting festivals.
The Ariake Sea, with a maximum tidal range of 6 m, is a shallow sea whose bottom is made
of sandy mud and its water is a mixture of seawater flowing from the outer sea and fresh river
water. Sandy mud and rich nutrients flow into the sea from the rivers and the bay is shallow for a
long distance from the shore. Therefore, on full or new moon nights, a vast flat land can be seen.
Kase river basin is located in the center part of Saga prefecture The basin has wide variety of
land use while MLIT (Ministry of Land Infrastructure and Transport) Japan due to National
Comprehensive Water Resources Plans was added Kase river dam sequentially with Hokuzan
dam in this area in order to supply water needed especially for agriculture and water supply in
Saga Prefecture.
However the benefit derived from constructed dam reservoirs is frequently changed in the
quality of water. The natural vegetation changed into water area when the reservoir is created.
Actually, Kase river dam is expected as an important water resources facility for Saga
prefecture. This prefecture has a big of arable land and has a regional granary for supply rice in
Kyushu Island, Japan. Also dams in this basin are expected to answer the water demand in the
downstream area both in the quantity and quality of water.
This study is to observe environmental and water quality change before and after dam
construction work along the Kase River and the reservoir.
Page 38
Cindy Jeane Supit Page 24
3.2 STUDY AREA
Kase river basin is placed in the inside part of Saga prefecture that consists of 3 cities including
Saga city. The population in the basin about 130,000 people mostly concentrated on the inside
and the downstream part. There are some key traffic facilities inside the basin, JR Nagasaki
mainline, Kyushu Transversal Expressway and National roads. The basin has wide variety of
potential nutrient loading with different land use while MLIT (Ministry of Land Infrastructure
and Transport) Japan due to National Comprehensive Water Resources Plans was build a dam
in this area in order to supply water needed especially for agriculture and water supply in Saga
Prefecture.
Kase river dam construction is started in December 1992 with the area of store water 270 ha, and
has been impounding start in October 2010.
Upstream of the basin there is a dam called Hokusan dam constructed in March 1957 for
agricultural purpose only.
Kase river dam is an important water resources facility for Saga prefecture. This prefecture has a
big of arable land and has a regional granary for supply rice in Kyushu Island, Japan.
3.3 METHODOLOGY
3.3.1 Outline of Kase River dam
The Kyushu region maintenance bureau is constructing Kase River dam to the upstream of
Kase River part (right downstream of the Hokuzan dam), The Ministry of Land, Infrastructure
and Transport direct control in a gravity concrete dam under construction. The parameter is
shown in Table 3.1.
The functions of Kase River dam are generate hydroelectric power, flood control, supply
water to urban area, environmental conservation, industry uses, agricultural purpose, and provide
recreational area.
Page 39
Cindy Jeane Supit Page 25
Table 3.1 Description of Kase River dam
Position 33
0 23’ 22” N
130 0 13’01” E
River Kase River
Dam model Gravity concrete dam
Height 97.0m
Crest length 480.0m
Volume of dam 1,220,000m3
Drainage area 368.0m3
Surface area 270.0ha
Total reservoir capacity 71,000,000m3
Active storage capacity 68,000,000m3
Flood control capacity 17,500,000m3
Use capacity 50,500.000m3
Page 40
Cindy Jeane Supit Page 26
Table 3.2 Time table of Kase River dam construction
Year Month Transition of plan
1966 Preliminary investigation beginning
1973 April The start of the survey implementation plan (established research
firm Kasegawa Dam)
1988 April Kasegawa dam construction project undertaken (installation
Kasegawa Dam Construction Office)
1990 April Dam Environmental Impact Statement-publication inspection
Kasegawa
1992 January Basic plan Kasegawa notice Dam
1992 December Embarked on road construction for construction
1993 March Based on the Law Concerning Special Measures for Water
Source Area determination "plan for water resources "
1994 March Road construction started with replacement
1995 January Loss compensation agreement signed standard
1999 July Line with the start of services Kurinami city road replacement
2001 April Alternative land reclamation complete neighborhood
2003 July Embarked on a temporary drainage tunnel construction
2004 March Basic plan change notice dam Kase River
2005 February Commutation start of construction contracts and construction
Kase River dam body (stage one)
2005 June Ogushi line with the start of services Kurinami city road
replacement
2005 September
(Kurinami ~ Furuyu approach path), No. 323 national highway
replacement part with the start of services start body dam
foundation excavation
Page 41
Cindy Jeane Supit Page 27
Table 3.2 (continued)
Year Month Transition of plan
2006 November No. 323 national highway stretch in service with replacement
(Ohno ~ Kurinami)
2007 March All lines in service Kurinami Mise prefectural road with
replacement
2007 May Basic digging worker completion
2007 June Dam Kase River basic plan change notice (Part 2)
2007 October Dam body concrete placement start Kase River
2008 March All lines in service start radio sound storehouse months
replacement with small cities and provinces
2008 April Cornerstone ceremony dam Kase River
2009 March Commutation for the main construction starting in secondary
dam
2009 December Dam body concrete placement is complete Kase River
2010 October Start of the impounding
Page 42
Cindy Jeane Supit Page 28
Figure 3.1 Study area
Page 43
Cindy Jeane Supit Page 29
3.3.2 Point of observation
In the this study, the investigation point was set from upstream of Kase River dam to the
downstream, and it was named St.1-4 from the upstream Ozeki, Furuyu, Kanjinbashi and
Kasebashi sequentially.
Figure 3.2 Observation point
Page 44
Cindy Jeane Supit Page 30
3.3.3 Parameters and methods
In this study, the water quality measurement and the obtaining water with a small CTD
meter and the multi item water quality meter were done by the various place point, the water
taken home was filtered, and the nutritive salt was analyzed with the spectrum absorbance meter
for SS.
The water quality measurement with a multi item water quality meter and a small CTD
meter was done in the location.
Figure 3.3 Measurement using CTD meter
Page 45
Cindy Jeane Supit Page 31
Figure 3.4 Measurement using multi item water quality meter
Figure 3.5 Water sampling at the river
Page 46
Cindy Jeane Supit Page 32
Parameters of the water quality are shown in Table 3.3. Moreover, the adaptability of the
purpose of use according to environmental standards in the river, lakes and marshes is shown
in Table 3.4.
Table 3.3 Assorted parameters of water quality
Item Unit Explanation Measuring instrument
machine
pH Power of the concentration of the hydrogen ion
Multi item water quality meter
DO mg/L Oxygen that has melted in water Multi item water
quality meter
COD mg/L Typical index that shows water pollution
Spectrum absorbance meter
SS mg/L The insoluble matter in water Filtration
NH4-N mg/L Nitrogen ammonium salt or in
ammonia contained in water
Spectrum
absorbance meter
NO2-N mg/L
Product on the way of degradative
process by aerobic microorganism soil
and in water
It generates it by reducing the nitrate.
Spectrum
absorbance meter
NO3-N mg/L Ultimately product resolved by aerobic
microorganism soil and in water
Spectrum
absorbance meter
T-N mg/L Gross weight of nitrogenous substance Spectrum
absorbance meter
T-P mg/L Gross weight of phosphorus compound Spectrum
absorbance meter
Page 47
Cindy Jeane Supit Page 33
Figure 3.6 Filtering
Table 3.4 Environmental standards qualification of River and Lake/Marshes
(Environmental Agency, Japan 1992)
Pattern \ item River Lakes and marshes
AA
Water supply class 1, conservation of
natural environment, and uses listed in
A-E
Water supply class 1,
conservation of natural
environment, and uses listed in
A-C
A
Water supply class 2, fishery class 1,
bathing and uses listed in B-E
Water supply class 2and 3,
fishery class 2, bathing and
uses listed in B-C
B
Water supply class 3, fishery class 2,
and uses listed in C-E
Fishery class 3, industrial
water class1, agricultural
water, and uses listed in C
C
Fishery class 3, industrial water class1,
and uses listed in D-E
Industry water class 2 and
conservation of environment
D Industrial water class 2, agricultural
water and uses listed in E
E Industry water class 3 and
conservation of environment
Page 48
Cindy Jeane Supit Page 34
3.4 RESULTS AND DISCUSSION
pH
pH is a measure of the acidity or alkalinity of water. It is measured by using a multi item
water quality meter to see the change of increased acidity or alkalinity. pH varies naturally
within streams as a result of photosynthesis. The pH scale ranges from 0 to 14:
Acidic: 0 to 6.9
Neutral: 7
Alkaline: 7.1 to 14
Moreover, because the pH influences the chemical reaction in water, the value of the pH
becomes an important factor in which the water quality change in the stream water.
Table 3.5 Environmental standard of pH (Environmental Agency, Japan 1992)
Waters \
pattern
AA A B C D E
River From 6.5 to 8.5 From 6.0 to 8.5
Lakes and
marshes From 6.5 to 8.5
6.0 or more
8.5 or less
The change of the pH density in Ozeki (St.1), Furuyu (St.2), Kanjimbashi (St.3), and
Kasebashi (St.4) point is shown in Figure 3.7 for 30 years. It is tend to increase with four points
every year. It is not easy to think the influence of the dam construction work about the
substantial change by not being seen with Furuyu (St.2) located right downstream of Kase
River dam though a rapid increase is seen for 1998-2000 and for 1993-1994 in Kasebashi (St.4)
point in Kanjinbashi (St.3) and Kasebashi (St.4) point. Kase River dam is completed in 1992,
and, as a result, there is a possibility of originating the fact that the detention period was
postponed. The reason of the decreasing in 1998 was not found.
Figure 3.8 shows the correlation of the water temperature and the pH every year.
Page 49
Cindy Jeane Supit Page 35
Figure 3.7 pH in Kase river
Figure 3.8 Corelation of pH and temperature
Page 50
Cindy Jeane Supit Page 36
DO (dissolved oxygen)
DO (Dissolved Oxygen) is the amount of oxygen in water, to a degree, shows its overall
health. That is, if oxygen levels are high, one can presume that pollution levels in the water
are low. Conversely, if oxygen levels are low, one can presume there is a high oxygen demand
and that the body of water is not of optimal health.
Apart from indicating pollution levels, oxygen in water is required by aquatic fauna for
survival. In conditions of no or low oxygen availability, fish and other organisms will die.
DO is used as a pollution indicator of water in the river, lakes and marshes, and the sea area.
Table 3.6 Environmental standard of DO (Environmental Agency, Japan 1992)
Waters \
pattern
AA A B C D E
River 7.5 or more 7.5 or more 5 or more 5 or more 2 or more 2 or more
Lakes and
marshes
7.5 or more 7.5 or more 5 or more 2 or more ― ―
The change of the DO in Ozeki (St.1), Furuyu (St.2),Kanjinbashi (St.3), and Kasebashi
(St.4) point is shown in Figure 3.9 for 30 years. It is show that the graph tend to increaseat
every point though it is slow. Especially, the increase speed of 1992-2002 years in Kasebashi
(st.4) is earlier than that of other points. It is thought that the influence of Kase River dam at
the beginning of mission is stronger because the change is not seen in Furuyu (St.2) and
Kanjinbashi (St.3) though it starts road works for the construction of Kase River dam in 1992.
The reason for the measurement day is that only winter in this though a very high value has
gone out in Furuyu (St.2) point of 1986. The mean value in the various place point is 10.60
mg/L and 10.19mg/L for Furuyu (St.2) and Oozeki (St.1) 10.37 mg/L for Kanjinbashi (St.3)
and 10.66 mg/L at Kasebashi (St.4), and the entire mean value is 10.46mg/L. The maximum
value is 13.13mg/L measured with Furuyu (St.2) in 1986, and minimum value is 9.03mg/L of
Kanjinbashi (St.3) in 1984.
Page 51
Cindy Jeane Supit Page 37
Figure 3.9 DO concentration in Kase River
Figure 3.10 Correlation of DO concentration and Temperature
Page 52
Cindy Jeane Supit Page 38
Table 3.7 Environmental standard of COD (Environmental Agency, Japan 1992)
Waters \ pattern AA A B C
Lakes and marshes 1 or less 3 or less 5 or less 8 or less
COD (chemical oxygen demand)
COD(chemical oxygen demand) is an indicator of organics in the water, ussualy used in
conjungtion with BOD. Organic levels decrease with distance away from the source. In a
standing water body such as dam reservoir or a lake, currents are generally not powerful
enough to transport large amount of organics. In a moving water body, the saprotophic
organism break down the organics during transportation away from the source. Hence, there is
a decline in the oxygen demand and an increase of dissolved oxygen in the water.
The change of the COD in Ozeki (St.1), Furuyu (St.2), Kanjinbashi (St.3), and Kasebashi
(St.4) is shown in Figure 3.11 for 30 years. Four points and rises are seen in 1992. It rises
rapidly in Kasebashi (St.4) though Ozeki (St.1), Furuyu (St.2), and Kanjinbashi (St.3) are
gradual changes. It is not easy to think that it is a cause because a high value has gone out for
the long term, and it is high after the restoration is completed though the investigation and the
excavation of Ishibi start. The numerical value is not steady to this dissatisfied though great
fluctuations are seen in Ozeki (St.1) in the 80's volume of data. The maximum value is
4.6mg/L of Kasebashi (St.4) in 2000, and minimum value is 1.3mg/L Ozeki (St.1) in 1991 and
1986.
A high value is often occurred in Kasebashi (St.4) after 1994, and the substantial change is
not seen in other points.
Page 53
Cindy Jeane Supit Page 39
Figure 3.11 COD concentration in Kase River
SS (amount of suspended solid)
SS(suspended solids) is an indication of the amount of erosion that took place nearby or
upstream. This parameter would be the most significant measurement as it would depict the
effective and compliance of control measure e.g. riparian reserve along the waterways. The
series of sediment-induced changes that can occur in the water body may change the
composition of an aquatic community. A large volume of suspended sediment will reduce light
penetration, thereby suppressing photosynthetic activity or phytoplankton and algae. This leads
to fewer photosynthetic organisms available to serve as food source for many invertebrates. As
a result, overall invertebrate numbers may also decline, which may then lead to decreased fish
population.
Page 54
Cindy Jeane Supit Page 40
Table 3.8 Environmental standard of SS (Environmental Agency, Japan 1992)
Waters \
pattern AA A B C D E
River 25 or less 50 or less 100
Or less
Floating
matter
such as
garbage
should
not be
observed.
Lakes and
marshes
1 or
less 5 or less
15 or
less
Floating matter such as
garbage should not be
observed..
The change of SS in Ozeki (St.1), Furuyu (St.2), Kanjimbashi (St.3), and Kasebashi (St.4)
is shown in Figure 3.12 for 30 years. The width of the change narrows after 1998 when the
gravel mining in the minister management district was prohibited, and the numerical value has
lowered though it changed greatly until 1980-1997 in Ozeki (St.1), Kanjimbashi (St.3), and
Kasebashi (St.4) located from Kase River dam to the downstream, too. In addition, after 2005
when the commutation had been begun, most changes were not seen. An immediate originating
is uncertain. In the mean value in the various place point, the entire average is 7.3mg/L. In the
maximum value, 27.0mg/L of Furuyu (St.2) and minimum value are 2.5mg/L Ozeki (St.1) in
2000.
Page 55
Cindy Jeane Supit Page 41
Figure 3.12 SS concentration in Kase river
T-N (total nitrogen)
Total nitrogen refers only to those amounts of nitrogen that gives rise to nitrate/nitrite ions.
Total nitrogen is the sum of nitrate (NO3), nitrite (NO2), organic nitrogen, and ammonia (all
expressed as N). The supply source of the nitrogen to the river includes the inflow, agricultural
activity, the household sewage, etc.
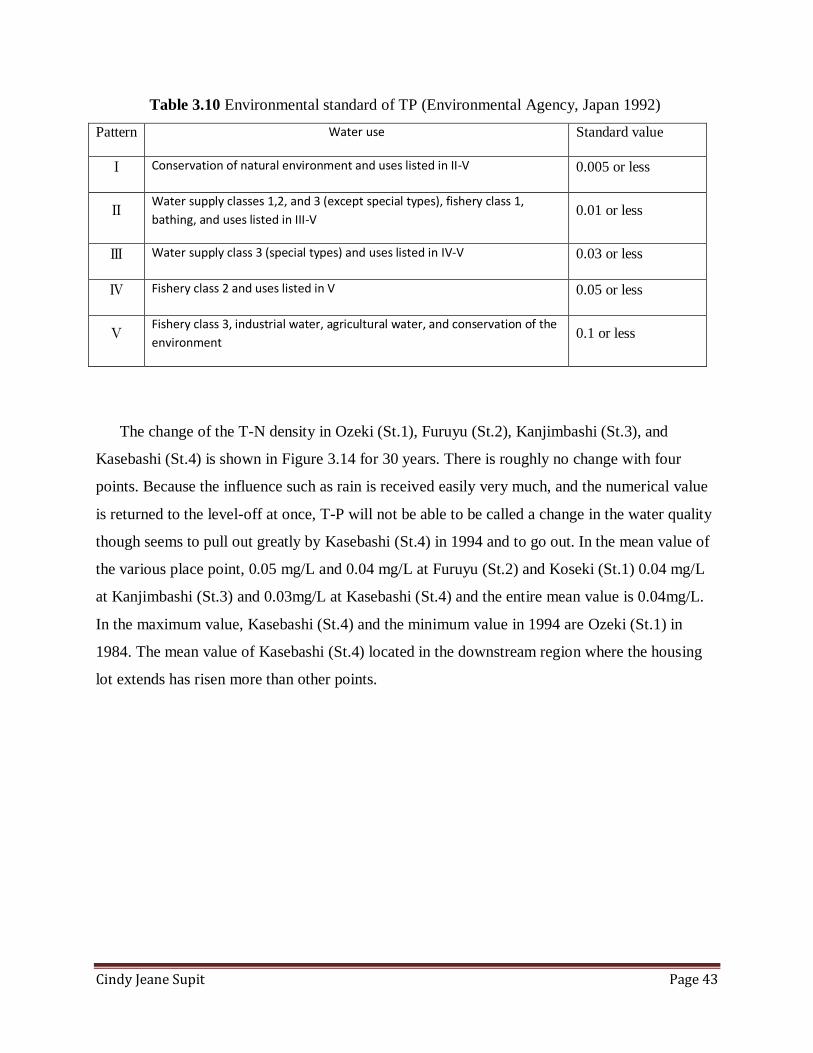
Table 3.9 Environmental standard of TN (Environmental Agency, Japan 1992)
Pattern Water use Standard value
Ⅰ Conservation of natural environment and uses listed in II-V 0.1 or less
Ⅱ Water supply classes 1,2, and 3 (except special types), fishery class 1,
bathing, and uses listed in III-V 0.2 or less
Ⅲ Water supply class 3 (special types) and uses listed in IV-V 0.4 or less
Ⅳ Fishery class 2 and uses listed in V 0.6 or less
Ⅴ Fishery class 3, industrial water, agricultural water, and conservation
of the environment 1 or less
Page 56
Cindy Jeane Supit Page 42
The change of the T-N density in Ozeki (St.1), Furuyu (St.2), Kanjinbashi (St.3), and
Kasebashi (St.4) is shown in Figure 3.13 for 30 years. It has descended gradually, and it seems to
have been changing into the rise with four points in 1996-1998. Only the difference before and
behind 0.2mg/L is repeated, and a difficult point under the influence of rain whether catch when
greatly moving in this because it is a range with the possibility of changing enough though
changes seem to be larger than other points in Ozeki (St.1) that is the point of the uppermost
stream and Kasebashi (St.4) of the downstream point. The maximum value is 1.55mg/L of
Kasebashi (St.4) in 1980, and minimum value is 0.45mg/L of Kasebashi (St.4) in 1996.
.
Figure 3.13 TN concentration in Kase River
T-P (total phosphorus)
The gross weight of phosphorus in various forms is called total phosphorus. Excessively
scattered in the soil, the forest, and the farmland that flows out by the overexploitation as a load
source of phosphorus. The loading dose has been decreased from occupying the load with big
phosphorus in a synthetic detergent by converting to soap and making a synthetic detergent no
phosphorus about the household effluent. River systems, with their associated impoundment
of dams and stream components, provide much opportunity for nutrients to be transformed and
removed as they are transported through the watershed.
Page 57
Cindy Jeane Supit Page 43
Table 3.10 Environmental standard of TP (Environmental Agency, Japan 1992)
Pattern Water use Standard value
Ⅰ Conservation of natural environment and uses listed in II-V 0.005 or less
Ⅱ Water supply classes 1,2, and 3 (except special types), fishery class 1,
bathing, and uses listed in III-V 0.01 or less
Ⅲ Water supply class 3 (special types) and uses listed in IV-V 0.03 or less
Ⅳ Fishery class 2 and uses listed in V 0.05 or less
Ⅴ Fishery class 3, industrial water, agricultural water, and conservation of the
environment 0.1 or less
The change of the T-N density in Ozeki (St.1), Furuyu (St.2), Kanjimbashi (St.3), and
Kasebashi (St.4) is shown in Figure 3.14 for 30 years. There is roughly no change with four
points. Because the influence such as rain is received easily very much, and the numerical value
is returned to the level-off at once, T-P will not be able to be called a change in the water quality
though seems to pull out greatly by Kasebashi (St.4) in 1994 and to go out. In the mean value of
the various place point, 0.05 mg/L and 0.04 mg/L at Furuyu (St.2) and Koseki (St.1) 0.04 mg/L
at Kanjimbashi (St.3) and 0.03mg/L at Kasebashi (St.4) and the entire mean value is 0.04mg/L.
In the maximum value, Kasebashi (St.4) and the minimum value in 1994 are Ozeki (St.1) in
1984. The mean value of Kasebashi (St.4) located in the downstream region where the housing
lot extends has risen more than other points.
Page 58
Cindy Jeane Supit Page 44
Figure 3.14 TP concentration in Kase River
Dam Reservoir water quality
Figure 3.15 shows the change of chlorophyll-a and DOC of Kase river by initial
impoundment of Kase River dam. Reservoir level of 19 October 2010 flooding test began was
245E.Lm. Reservoir level is elevated in high-rainfall period of July 2011 until May 2011, and
water level reached 286.1ELm.
Chlorophyll fluorescence intensity change during the study period was not in st.1. On the other
hand, in the st.2, rising from the October 2010 when flooding test began, a survey of April 26
had reached 14.44. Chlorophyll fluorescence intensity in st.1 and st.2 after the start of the test
was always higher in flooded time. DOC concentration, the change of 1.76 ppm during the
survey period will record the maximum value on October 25, 2010 immediately after the
flooding, and then was hanging in st.1. On the other hand, in the st.2, has always remained
higher than st.1 after 24 November 2010 when flooding. Possible increase in the concentration of
chlorophyll fluorescence intensity and DOC after flooding in st.2 was attributed to the growth of
algae in the reservoir.
Figure 3.16 shows Vertical profiles of water temperature, DO, turbidity and chlorophyll-a in
Kase River dam reservoir in day of the investigation of water quality in Kase River. The result
shows a high value and a maximum of about 180 ppb in the surface concentration of chlorophyll
Page 59
Cindy Jeane Supit Page 45
a reservoir dam on 26 April 2011. It had become a higher value than the maximum value of
about 40 ppb on 11 July 2011 (about 5 times). Figure 3.17 shows the vertical distribution of
reservoir water quality of a long day of rain-free period at the most each month from January to
August 2011.
Result shows that Chlorophyll a increase from January through May, and was down from June.
From this change, seasonal variation can be seen.
Figure 3.15 The change of chlorophyll-a and DOC of Kase river by initial impoundment of
Kase River dam.
Page 60
Cindy Jeane Supit Page 46
Figure 3.16 Vertical profiles of water temperature, DO, turbidity and chlorophyll-a in Kase
River dam reservoir in day of the investigation of water quality in Kase River.
Figure 3.17 Vertical profiles of water temperature, DO, turbidity and chlorophyll-a in Kase
River dam reservoir when rainfall is not seen.
0
10
20
30
40
50
0 5 10 15 20turbidity(mg/l)
0
10
20
30
40
50
0 100 200chlorophyll-a(ppb)
2011/4/26
2011/7/11
0
10
20
30
40
50
0 10 20 30
0
10
20
30
40
50
0 5 10 15 20DO(mg/l)
de
pth
(m
)
de
pth
(m
)
de
pth
(m
)
de
pth
(m
)
water temperature(℃)
0
10
20
30
40
50
0 10 20 30
0
10
20
30
40
50
0 5 10 15 20DO(mg/l)
0
10
20
30
40
50
0 5 10 15 20turbidity(mg/l)
0
10
20
30
40
50
0 100 200chlorophyll-a (ppb)
2011/1/16
2011/2/7
2011/3/13
2011/4/18
2011/5/20
2011/6/4
2011/7/15
2011/8/5
de
pth
(m
)
de
pth
(m
)
de
pth
(m
)
de
pth
(m
)
water temperature(℃)
Page 61
Cindy Jeane Supit Page 47
3.5 CONCLUSIONS
From the observation, the results show that the water quality of Kase River basin is
generally as good. The conditions in the periods after dam construction indicate that river water
quality impairment do exist, but not much and still meet the environmental qualification. The
replenishment of Kase River Dam reservoir with the Hokuzan dam reservoir in the basin has less
affected to change the water quality along the river due to the good implementation of pollution
control in this area. Measurements of SS show that the concentration begins to settle down since
the gravel mining is prohibited in 1998 and the fluctuation tend to decrease.
The effects of dam impoundment appear through the impoundment of dam running. Dam
reservoir at the surface of April 26, 2011 showed a high value and a maximum concentration of
chlorophyll a about 180 ppb. On the other hand, it is considered in the July 11, has become a
maximum value of approximately 40ppb, and cause chlorophyll fluorescence intensity values
showed a high point in st.2 after those days. It was found that increasing concentrations of
chlorophyll a is caused by algae growth in the Kase River dam reservoir, and gives a changing of
the water quality downstream. Possible flooding of the reservoir dam is likely to have an
influence on the water quality at the downstream area.
It will be necessary to continue investigating in the future because Kase River dam’s
examination pounding just still started, the detention period becomes long and the potential
substantial change could happen to the aquatic environment.
Page 62
Cindy Jeane Supit Page 48
Chapter 4
DAM RESERVOIR EFFECTS ON ANNUAL AND PEAK FLOW RATES IN
KASE RIVER BASIN
4.1 INTRODUCTION
Kase River Basin in Saga Prefecture is currently facing a large scale environmental
change. A new multi-purpose Kase River Dam has been constructed sequentially with an
agricultural dam already built in the previous by MAFF (Ministry of Agriculture, Forestry and
Fisheries) Japan. Forest and agricultural areas have been changed from artificial coniferous
forest and rice field to water area.
Estimating the impact of water resources project such as dam to hydrological flow is one
of the most important topics in a river basin management. (Yang et al. 2008; Horne et al. 2004).
A study of the impact of water projects is important for river basin management and
environmental protection (Nislow et al. 2002, Bartholow et al. 2004)
The resultant hydrological alterations caused by reservoirs may include changes in flood
frequency and magnitude, reduction in overall flow, increased or decreased summer base flows,
and altered timing of releases, with a consequently wide range in effects on riverine ecology
(Petts 1984).
The SWAT model has been used to estimate the effects of dam reservoirs on annual and
peak stream flow rates in Kase River, Japan. The watershed area is set up 197.735 km2 that
accounts for 54% of the entire area of the Kase River Basin. The model was calibrated and
validated for stream discharge data from 2008-2009 by using Nash-Sutcliffe to model performed
evaluation. Simulated data from the model for the period 2008 - 2009 were used in order to
investigate the response of stream flow to dam reservoir in Kase River basin. Using sensitivity
analysis dominant parameters affecting water flow, the four most sensitive parameters of flow
were selected and adjusted. The results of this study enhance the understanding of stream flow
consequences of dam reservoirs associated with impoundment, while these estimates could aid a
decision maker to optimize water supply and demand and further water quality management in
this basin.
Page 63
Cindy Jeane Supit Page 49
4.2 METHODS AND MATERIAL
ArcSWAT 2009 version of the SWAT model is used as a main tool in this study. This
version integrates the newest version of Soil and Water Assessment Tool. The SWAT is a river
basin or watershed, scale model developed to predict the impact of land management practices
on water, sediment, and agriculture chemical yields in large, complex watersheds with varying
soil, land use, and management conditions over long periods of time (Arnold et.all 1998). This
model was chosen because it was physically based and computationally efficient (Neitsch, 2002).
The SWAT model uses the SCS curve number procedure to calculate the runoff volume under
different soil types and land uses. The SCS curve number equation is:
)1.4()(
)( 2
SIR
IRQ
aday
aday
surf
Where Qsurf is the accumulated runoff or rainfall excess (mm); Rday is the rainfall depth for
the day (mm); Ia is the initial abstractions, which includes surface storage, interception, and
infiltration prior to runoff (mm); and S is the retention parameter (mm). The retention parameter
varies spatially due to changes in soil, land use, management, and slope and temporally due to
changes in soil water content. The retention parameter is defined as:
)2.4(25425400
CN
S
where CN is the curve number for the day.
The peak runoff rate is the maximum runoff flow rate that occurs with a given rainfall
event. The peak runoff rate is an indicator of the erosive power of a storm and is used to predict
sediment loss. SWAT calculates the peak runoff rate with a modified rational method.
In Japan, the SWAT has been applied to mountain area with enormous success (Somura et al.
2009).
4.2.1 Study area and model input data
Kase River Basin is located in the center part of Saga Prefecture. This basin consists of 3
cities including Saga City. The population in the basin about 130,000 people mostly
concentrated on the inside and the downstream part. The basin has wide variety of land use
while MLIT (Ministry of Land, Infrastructure and Transportation) Japan due to National
Page 64
Cindy Jeane Supit Page 50
Comprehensive Water Resources Plans was added a new multi-purpose dam in this area in
order to supply water needed especially for agriculture and water supply in Saga Prefecture.
Kase River flows through Saga Plain and pours into the Ariake Sea. The length of Kase River is
about 57 km, with catchment area about 368 km2. Kase River dam construction is started in
December 1992 with the surface area of the reservoir 270 ha, and has started a first impounding
in October 2010. Upstream of the new dam there is a dam called Hokuzan dam constructed
in March 1957 for agricultural purpose only. Kase River dam is an important water resources
facility for Saga Prefecture. This prefecture has a big of arable land and has a regional granary
for supply rice in Kyushu Island, Japan.
The SWAT was set up for the basin upstream area of 197.74 km2 that accounts for 54% of
the entire area of the Kase River basin in Japan. Figure 4.1 shows the watershed was
automatically delineated and divided by SWAT into 23 sub watersheds where Hokuzan dam had
constructed and Kase dam have been impounded. The DEM was taken from Nippon-III 50 m
grid elevation of digital map, land use map in 2007 obtained from the Ministry of Land
Infrastructure and Transportation Japan, and detailed soil map was clipped from National Land
Survey Division, Land and Water Bureau of MLIT`s website and used as the GIS input data for
the model simulation. Figure 4.2 and Figure 4.3 respectively show the land use and soil map of
the study area. Hourly observed weather data (temperature, humidity, solar radiation) from Saga
Meteorological Observatory were applied in order to calculate the potential evapotranspiration
(PET) using Penman-Monteith`s method. Daily observed discharge data were taken by the
Ministry of Land Infrastructure and Transportation (MLIT) (2008-2009) for the analysis.
Page 65
Cindy Jeane Supit Page 51
Figure 4.1 Watershed delineation in the watershed with 2 dams, 3 precipitation stations and
Saga meteorological observatory
Page 66
Cindy Jeane Supit Page 52
Figure 4.2 Land use map of study area
Page 67
Cindy Jeane Supit Page 53
Figure 4.3 Soil map of study area
4.2.2 Model Calibration and validation
Calibration and validation were performed since the model accuracies within a watershed
are requisite for a semi-distributed model such as the SWAT. Due to available data, a period
from January 2008 to December 2008 was used for the calibration and the stream flows in 2009
at the Kanjinbashi stations located just in the downstream of the new dam were applied for
validation. Prior to calibration, 4 most sensitive parameters: CN2, GWQMN, Alpha_BF, and
Sol_AWC, were selected and adjusted manually based on previous SWAT research in Japan
mountains area. Table 4.1 gives the range over which each parameter was varied and a more
complete definition of the parameters. Figure 4.4 shows the calibration and validation result for
flow at the watershed during 2008~2009. Although there were some discrepancies between the
Page 68
Cindy Jeane Supit Page 54
observations and simulations, overall the simulated daily flows coordinated well with the
observed flows (R²=0.917 and Nash-Sutcliffe (1970) NSI=0.882). The R2 value is a marker of
strength from the correlation between the observed and simulated values. The NSI value is
commonly used in modeling figures and marks how closely the simulated versus observed data
points resembles the 1:1 line. The ranges of NSI value is between minus infinity and one.
Values that are less than or closely to zero for R2 and NSI, marks model performance is poor
and unacceptable, and values equals to one indicates the model prediction is perfect. Our
simulations perform sufficiently acceptable of the model
Table 4.1 Parameter and its ranges used in the model calibration
Name Definition Model
Range
File name
CN2 SCS moisture condition
II curve number for
pervious areas
±25% .mgt
GWQMN Threshold water level in
shallow aquifer for base
flow
0 to 5000 .gw
ALPHA_BF Base flow recession
constant
0 to 1 .gw
Sol_AWC Available water capacity
of the soil layer
±25% .sol
Page 69
Cindy Jeane Supit Page 55
Figure 4.4 Simulated and observed discharges in Kanjinbashi outlet (calibration: 2008,
validation: 2009)
Figure 4.5 Model performances of simulated and observed discharges in Kanjinbashi outlet
Page 70
Cindy Jeane Supit Page 56
4.2.3 Dam scenarios
To describe effects on annual and peak stream basin discharge from various presented
dam reservoir, scenarios were run, using the calibrated model. The set of scenarios tested the
impact of the existence or nonexistence of reservoirs in the watersheds. The scenarios were
carried out with Hokuzan dam but no Kase River dam , with both Hokuzan dam and Kase dam,
and with all the dams in watershed disappeared or no dams.
The Hokuzan dam operates on a temporal schedule, according to the agricultural
management of watershed. In the wet/rainy period, the reservoir collects water and the water
level increases. In the irrigation period of tenth of June to tenth of October or when the
discharge water volume reaches to 15 m3/s at Kawakami water head, the water in the dam is
released to meet the demand of agricultural resources in the Saga Plain at the lower reach.
According on the available data and the necessary inputs of the SWAT, the following
characteristic indicators of the dam were set up: the surface area of reservoir when filled to the
emergency spillway, surface area of reservoir when filled to the principal spillway, volume of
water held in reservoir when filled to the emergency spillway, and volume of water held in the
reservoir when filled to the principal spillway.
Table 4.2 Description of dams in Kase river basin
Dam Hokuzan dam Kase River dam
Service Date 1957 2010
Height(m) 59.3 97
Dam Volume
(m3)
145,000 1,220,000
Eff. Capacity
(m3)
22,000,000 68,000,000
Storing Water
Area(ha)
200 270
Catchment
area(ha)
5,463 12,840
Page 71
Cindy Jeane Supit Page 57
Figure 4.6 Simulation of annual discharge of the Kase River basin at Kanjinbashi outlet under
the scenarios
Figure 4.7 Simulation of average monthly discharge for 2008-2009 at Kanjinbashi outlet under
the scenarios
Page 72
Cindy Jeane Supit Page 58
4.3 RESULTS AND DISCUSSION
4.3.1 Effect of dam reservoirs on annual stream flow
As predictable, the presence of dam reservoirs resulted in reductions in annual flow in
the watershed. The results also showed that the existence of Hokuzan dam reservoir and Kase
River dam reservoir in the watershed caused greater reductions in stream flow than did the only
Hokuzan dam reservoir.
These dams seem to, result in decrease of average annual discharge by 3.68% from the only
Hokuzan dam scenario, and a decrease of 4.49 % from the disappeared dam scenario. Figure 4.5
show annual discharge of Kase River basin for 2008-2009 at Kanijnbashi outlet under the
scenarios. In 2008, the annual discharge decrease from 2738.9 m3/s when no dam in the
watershed, became lower at 2691.7 m3/s when only added the Hokuzan dam, and 2494.9 m
3/s
when all dams appear. The outcome show in 2009, the annual discharge also became lower from
3964.3 m3/s (no dam) to 3955.2 m
3/s (only Hokuzan dam) and 3907.02 m
3/s (Hokuzan dam and
Kase dam).
The decrease of stream discharge from this alteration may be attributed to the fact that dams that
divert water to offstream uses such as irrigation and urban uses (multi-purpose), especially out
of basin diversions, will reduce the total downstream flow (Collier et al, 1995). Excessive dams
and floodgate operations have change dramatically the flow regimes and shift peaking time (J.
Xia, et al. 2005). In addition, reservoir area has a higher rate of water loss by large evaporation
than natural stream does. Wide surface areas of reservoirs can evaporate higher than natural
channels. Average monthly evapotranspiration rates from Hokuzan dam area is 36.01 mm,
larger than 17.34 mm in Kanjimbashi area.
These effects on decrease of streamflow by increased number of dams in the watershed
are particularly strong in the wet period from June to July, because precipitation is abundant
in the wet period and temperatures are high enough to support high evaporation. Therefore, as
shown in Fig. 4.7 the stream flow rates in June decreased from 22.085 m3/s when there is no
dam scenario to 21.24 m3/s for only Hokuzan dam existence and 18.46 m
3/s for Kase River dam
and Hokuzan dam existences. Decreases in discharge also occur in the periods after the wet
period. The quite lower decrease in discharge in the August period resulting from hot
temperatures in this month. In August, stream flow rates decrease from 18.89 m3/s when no
Page 73
Cindy Jeane Supit Page 59
dam scenario, to 18.75 m3/s for only Hokuzan dam scenario and 17.32 m
3/s when all the dams
appear. Also in September a decrease from 13.56 m3/s (no dam), to 13.35 m
3/s and 13.05 m
3/s
when Hokuzan dam was constructed and all the dams appear respectively. In dry period the
effect not obvious. In February stream flow rates decrease from average 7.2 m3/s (no dam) to
7.05 m3/s and 6.63 m
3/s in only 1 dam and 2 dams exist scenarios respectively.
Fig.4.8 Change in average annual peak flow rate in Kanjinbashi
4.3.2 Effect of dam reservoirs on peak stream flow
Figure 4.8 shows the average annual peak flow rates at Kanjinbashi outlet, under the
presence-absence scenarios. In this figure shows changes of annual peak flow in different
existence-absence dam in Kanjinbashi point which is the outlet of watershed model. In each
group, annual peak discharges from three scenarios are shown. From Figure 4.8, I have found
differences in watershed peak flow in Kanjinbashi among the scenarios. In 2008-2009 average
annual peak flow for no dam scenario is 30.72 m3/s, while for Hokuzan dam only scenario and
Hokuzan dam with Kase dam scenario are 30.245 m3/s and 26.93 m
3/s respectively.A decrease
of Kanjinbashi peak flow indicate that the effect of dam construction is seen in the lowering
peak flow at downstream of watershed. Peak flow rates in Kanjinbashi decreased by 1.57%
when the Hokuzan dam and Kase River dam were removed from the Hokuzan dam only
Page 74
Cindy Jeane Supit Page 60
condition. In Kanjibashi outlet, a change of annual peak flow rate decreased by 10.94 % due to
scenario 2. Table 4.3 shows the percentage changes of peak stream flow in the watershed,
relative to the Hokuzan dam only condition.
Table 4.3 Percentage changes of annual peak flow rates (m3/s)
relative to the Hokuzan dam only situation for disappear/no dam (scenario1)
and existence of 2 dams in watershed (scenario 2)
Area Scenario 1
(no dam)
Scenario 2
(2 dams)
Kanjinbashi 1.57 -10.94
Page 75
Cindy Jeane Supit Page 61
4.4 CONCLUSIONS OF CHAPTER 4
The constructions of a dam reservoir will have consequences on the nature of environment.
The existences of Hokuzan dam reservoir and Kase River dam reservoir in this area resulted in
reductions in annual and peak stream flow rates in the watershed because of the storage of
dams. Wide surface areas of reservoirs can evaporate higher than natural channels. Dam
reservoirs in Kase River basin have changed the stream flow regimes.
These dams seem to , result in decrease of average annual discharge by 3.68 % from only
Hokuzan dam scenario, and decrease 4.49 % from the disappeared dam scenario. Dams in Kase
River basin also have changed the peak flow rates based on results at the Kanjinbashi which is
the outlet of watershed model. Peak flow rates in 2008-2009 decrease by 10.49 % when Hokuzan
dam and Kase dam were added from only Hokuzan dam scenario and a decrease of 1.57 % when
Hokuzan dam was added from no dam condition.
The effects on decrease of annual stream flow are larger in the wet period from June to July
and in dry period such as February the effect are not obvious.
The SWAT model successfully passed the scenarios exercises considering annual and peak
stream flow rates outputs. Result shows the simulations perform sufficiently acceptable of the
model with coefficient determination = 0.917 and Nash Sutcliffe = 0.882.
However, further research is required in order to confirm the clarifying of the model with
respect to dam construction impacts on water quality in the basin. A key objective of this study
was to calibrate and validate the SWAT model for running the scenarios to better understand
the influence of impoundments over the stream hydrology.
Considering this research, the result model is able to use for making a first preliminary
assessment of the prospective impacts of dams reservoir in Kase river basin. The results in this
study show a test of the sensitivity of hydrology to an exacting feature of the ecosystem
dynamics. Nevertheless, this is a first step which provides a move toward into how basin
responds to dam reservoir associated with impoundment and will be more accommodating when
analyzing relations between dam reservoir, water quality and hydrology.
Page 76
Cindy Jeane Supit Page 62
Chapter 5
DAM RESERVOIR EFFECTS ON RIVERINE NUTRIENT TRANSPORT
IN KASE RIVER BASIN
5.1 INTRODUCTION
Japan is the first nation in the Asian Monsoon zone to achieve modern industrialization
and it did this in the relatively short period of about 100 years, beginning in the late nineteenth
century. Dams in Japan supported social and economic development that preceded
modernization and have been viewed as symbols of modernization and of social vitality that
utilizes nature. However since the 1980s, dam projects have concerned criticism from the
community, because their substantial impacts on the social order and the natural environment are
becoming obvious (JCOLD, 2009).
River systems, with their associated impoundment of dams and stream components,
provide much opportunity for nutrients to be transformed and removed as they are transported
through the watershed. This nutrient transport through the river network and eventually to
a receiving body of water has broad implications for eutrophication, drinking water
suitability, recreational activities, and fishery harvests. Nutrient processing in stream reaches,
especially in headwater streams, has been shown to have an important influence on river
nitrogen (N) (Webster et al., 2003) and phosphorus (P) dynamics and export (Smith et al.,
2005).
Furthermore, there has been an open channel network, which is a creek network in Saga
Plain. This network could supplement a lack of water for irrigation and also could store the
water when flood occurred. However after completion of water supply facilities, the creek
network was used only for irrigation or urban drainage and shortage of water discharge caused
eutrophication of water by too much nutrient supply and polluted sediment settled down the
channel. To improve this water environment of the creek network in the plain needs water
quantity to some extent. The function of dam reservoir for restraining sediment transport
including the nutrient causing the eutrophication in the downstream open channel is expected.
Therefore, it is quite important to consider the positive function of dam reservoir in the
Page 77
Cindy Jeane Supit Page 63
watershed as the environmental agent to prevent the harmful nutrient transport to the
downstream area.
Dams are estimated as the positive ecological instruments for holding back the sediment
that contain nutrient to harmful the downstream area. The existence of the reservoirs at Kase
River dam and Hokuzan dam predicted to helpful the watershed from the pollutant hazard that
has effects to stream nutrient transport. TN and TP export likely became lower when the both
reservoirs were made in the watershed
The objective of this study is to illustrate the impact of dam reservoirs on nutrient transport
through river system at Kase River Basin scale. These estimates give a potential strategy to
manage future downstream nutrient and water resources in Kase River basin.
5.2 METHODOLOGY
5.2.1 Methods
SWAT is a river basin or watershed, scale model developed to predict the impact of land
management practices on water, sediment, and agriculture chemical yields in large, complex
watersheds with varying soil, land use, and management conditions over long periods of time
(Arnold et.all 1998). ArcSWAT 2009, a third-party software extension to ArcGIS, is used as an
interface between ArcGIS and the SWAT model. Spatial data (DEM, soil and land use) is used
in the preprocessing phase and fed into the SWAT model through the interface. Climate,
precipitation, stream flow and water quality data were sourced and prepared according to SWAT
input requirements. This model was chosen because it is computationally efficient and enables
to study long impact (Neitsch, 2002).
The watershed is defined by the main watershed outlet as chosen by the user, which
is the mouth of river. The watershed is then subdivided into subwatersheds. The modeler can
define as many or as few subwatersheds as desired according to the level of spatial
resolution that is reasonable. Each subwatershed is then further divided into a number of
Hydrologic Response Units (HRU) based on unique combinations of land use and land
cover (LULC) and soil types within the subwatershed. These HRUs are not spatially defined
within the subwatershed; they are simply accounting categories which represent the total area
of the unique LULC and soil type they represent within a subwatershed. HRU-scale processes
Page 78
Cindy Jeane Supit Page 64
are simulated separately for each HRU and then aggregated up to the subwatershed scale by a
weighted average.
N and P dynamics are modeled explicitly by SWAT in both the terrestrial and
water routing phases. In the terrestrial phase, nutrients can be taken up by plants based on
the supply of the nutrients and demand by the plants, or the nutrients can be transported via
the mass flow of water (Neitsch et al., 2002). This transport of N and P can eventually
lead to the N and P entering a stream channel through surface runoff or lateral sub-surface
flow. Once nutrients enter the stream channel, SWAT uses nutrient routing relationships adapted
from QUAL2E (Brown and Barnwell, 1987), giving the model a thorough representation
of in-stream N and P processing and removal mechanisms.
5.2.2 Data source
5.2.2.1 Topographic data
ArcSWAT 2009 uses DEM data to automatically delineate the watershed into several
hydrological connected sub watersheds. In this paper, DEM data with resolution of 50 meter
were used. The DEM was taken from Nippon-III of digital map; the watershed was then divided
into 23 sub watersheds in the SWAT model. Figure 5.1 and Figure 5.2 show DEM data which
used for this study and watershed delineation in the study area respectively.
Page 79
Cindy Jeane Supit Page 65
Figure 5.1 DEM data for the study area
Page 80
Cindy Jeane Supit Page 66
Figure 5.2 Watershed delineation in the study area
5.2.2.2 Land use data
Kase River Basin has wide variety of land use while MLIT (Ministry of Land,
Infrastructure and Transportation) Japan due to National Comprehensive Water Resources Plans
was added a new multi-purpose dam in this area in order to supply water needed especially for
agriculture and water supply in Saga Prefecture. Land use data of 2007 were applied and these
land use types in the study area were reclassified using SWAT land use classes. The land use
classes were converted from original land use classes to SWAT classes and defined using a look
up table. Table 5.1 shows the land uses conversion from original land uses classes to SWAT
classes.
Page 81
Cindy Jeane Supit Page 67
Table 5.1 Land use conversion from original land use classes to SWAT classes
Original land use classes Corresponding SWAT
classes SWAT Code
Park green space Commercial UCOM
River, Lake, Pond Water WATR
Road and Railway Transportation UTRN
Resident Residential
URBN
Communal facilities Institutional UINS
Factory, power plant Industrial UIDU
Rice field Rice RICE
Orchard Orchard ORCD
Natural coniferous forest Forest evergreen FRSE
Artificial coniferous
forest
Forest mix FRST
Moorland Pasture PAST
Cut over land Summer pasture SPAS
Collapse ground Wetlands non forested WETN
5.2.2.3 Soil data
Detailed soil map was clipped from National Land Survey Division, Land and Water
Bureau of MLIT`s website and was used as the GIS input data for the model simulation. Land
use and soil data in WGS 1984 UTM Zone 52N projected were loaded into the ArcSWAT 2009
to determine the area and hydrologic parameters of each land-soil category simulated within each
sub watershed. Figure 5.3 shows the soil data used in this study.
Page 82
Cindy Jeane Supit Page 68
Figure 5.3. Spatial data soil map
5.2.2.4 Weather data
SWAT required climate data to provide the moisture and energy inputs that control the
water balance and determine the relative importance of the different component of the hydrology
cycle. Hourly observed weather data (temperature, humidity, solar radiation) from Saga
Meteorological Observatory were applied in order to calculate the potential evapotranspiration
(PET) using Penman-Monteith`s method.
Page 83
Cindy Jeane Supit Page 69
5.2.2.5 Hydrological data
Daily observed discharge data were taken by MLIT (2008-2009) for the analysis the
SWAT model. Available data from January to December, 2008 were used for the calibration and
the stream flows in 2009 at the Kanjinbashi station located just in the downstream of the new
dam were applied for validation. Figure 5.4 and 5.5 show comparison on simulated and observed
discharge with the coefficient correlation = 0.917 and Nash-Sutcliffe index = 0.882.
Figure 5.4 Comparison on simulated and observed discharge
in Kanjinbashi outlet during 2008-2009
Page 84
Cindy Jeane Supit Page 70
Figure 5.5 Model performance of simulated and observed discharge
in Kanjinbashi outlet
5.2.2.6 Dam data
According on the available data and the necessary inputs of the SWAT, the following
characteristic indicators of the dam were set up: the surface area of reservoir when filled to the
emergency spillway, surface area of reservoir when filled to the principal spillway, volume of
water held in reservoir when filled to the emergency spillway, and volume of water held in the
reservoir when filled to the principal spillway. The Hokuzan dam operates on a temporal
schedule, according to the agricultural management of watershed. In the wet/rainy period, the
reservoir collects water and the water level increases. In the irrigation period of tenth of June to
tenth of October or when the discharge water volume reaches to 15 m3/s at Kawakami water
head, the water in the dam is released to meet the demand of agricultural resources in the Saga
Plain at the lower reach.
Page 85
Cindy Jeane Supit Page 71
5.2.2.7 Water quality data
Data on the nutrient parameters were observed by MLIT. In this study, the data 2008-2009
are used for calibrating the SWAT model. Kanjinbashi point represents the point outlet of the
whole watershed.
5.2.3 Model Calibration
Almost all SWAT applications in the literature utilize R2
and Nash Sutcliffe to evaluate
model performance. R2 is a commonly used statistical measure that indicates the percentage of
variance in measured data accounted for by the variance in the simulated data. Nash Sutcliffe
is more common in the modeling literature and indicates how closely the plot of measured
versus simulated data points resembles the 1:1 line. Values that are less than or near zero for
R2 and Nash Sutcliffe indicate model performance is poor and thus unacceptable, and values
of unity would indicate perfect model prediction (Santhi et al., 2001). It is generally
understood in SWAT applications that R2 and Nash Sutcliffe values greater than 0.5 indicate
the model prediction is satisfactory or acceptable (Moriasi et al.,2007).
The hydrology calibration was done in previous study and figure 5.4 and figure 5.5 show
comparison on simulated and observed discharge with the coefficient determination = 0.917 and
Nash-Sutcliffe index = 0.882. Water quality model parameters were then manually calibrated
based on sensitivity analysis result. 4 sensitive parameters: NPERCO, PPERCO, PHOSKD, and
BIOMIX, were selected and adjusted manually, and table 5.2 shows the parameters used in the
model calibration.
Page 86
Cindy Jeane Supit Page 72
Table 5.2 Parameters used in the model calibration
Parameters Name Definition File name
Hydrology
CN2 SCS moisture condition
II curve number for
pervious areas
.mgt
GWQMN Base flow recession
constant
.gw
ALPHA_BF Available water capacity
of the soil layer
.gw
Sol_AWC Threshold water level in
shallow aquifer for base
flow
.sol
Water quality
NPERCO Nitrogen percolation
coefficient
.bsn
PPERCO Phosphorus percolation
coefficient
.bsn
PHOSKD Phosphorus soil
partitioning coefficient
.bsn
BIOMIX Biological mixing
efficient
.mgt
Page 87
Cindy Jeane Supit Page 73
5.3. RESULTS AND DISCUSSIONS
The developed model was tried to run using model input and physical parameters as
described above. The outcome showed that the presence of Hokuzan dam and Kase River dam
caused reductions in nutrient transport in the watershed.
The higher output of TN and TP occurred in summer and lower output occurred in winter.
The highest measured value for TN occurred in July 2009 by 1018 kg and the lowest value is
from December 2009 by 223.876 kg. For TP loads, the highest measured value is 54 kg occurred
also in July 2009, and the lowest is 2.09 kg in January 2008. The higher value in summer was
related with the agriculture activity and due to plenty of external nutrient was carried by high
runoff and flowed along the river, that will enhance nutrient load.
Model under prediction of nutrient transport loads during summer months due to the
model’s limitation in predict the amount of nutrient in the reservoir related to simply mix-well of
nutrient and not consider to stratification inside the reservoir. Although there are some
discrepancies of model, but overall the predictions are quite well with coefficient determination
(R2)=0.753 and Nash Sutcliffe = 0.751 for TN, and for TP with coefficient determination = 0.819
and Nash Sutcliffe = 0.796. Figure 5.5 and 5.6 Show the observed and simulated TN and TP load
in Kanjinbashi outlet.
Changes in the presence and absence of dams in watershed model produced impacts on
magnitudes of nutrient loads. Presence and absence scenarios clearly supported the hypothesis
that dam reservoirs in the Kase River watershed reduce N and P river exports. Results also
showed that the 2 dams in the Kase River watershed caused reductions in nutrient export.
In 2008, annual TN loads decrease from 553.07 kg when there is no dam in watershed to
became lower 538.27 kg when added the Hokuzan dam reservoir, and 500.29 kg when Hokuzan
and Kase River dam reservoirs added into the watershed. In 2009, also there are reductions in TN
transport from 582.46 kg (no dam) to 560.41 kg (Hokuzan dam reservoir) and 539.74 (Hokuzan
and Kase River dam reservoirs). Average annual river export of TN over the time period 2008-
2009 was lower by 9.18 % when Hokuzan dam reservoir and Kase River reservoir were made in
the watershed, and became lower by 5.64 % when Kase River dam reservoir was added from
only Hokuzan dam reservoir exist in the watershed. Annual TP loads in 2008 decrease from 23.4
Page 88
Cindy Jeane Supit Page 74
kg when there is no dam in watershed to became lower 22.8 kg when added the Hokuzan dam
reservoir, and 21.3 kg when Hokuzan and Kase River dam reservoirs added into the watershed.
In 2009, reductions in TP transport from 28.1 kg (no dam) to 27.1 kg (Hokuzan dam reservoir)
and 24.9 (Hokuzan and Kase River dam reservoirs). Average annual TP export in 2008-2009
decrease by 11.31 % when Hokuzan dam and Kase dam exist in the watershed and a decrease of
8.03 % when Kase River dam was added from only Hokuzan dam condition.
Figure 5.6 Observed and simulated daily load (N kg) during 2008-2009 in Kanjimbashi outlet.
Figure 5.7 Model performances of observed and simulated TN loads in Kanjimbashi outlet.
Page 89
Cindy Jeane Supit Page 75
Figure 5.8 Observed and simulated daily load (P kg) during 2008-2009 in Kanjinbashi outlet
Figure 5.9 Model performances of observed and simulated TP loads in Kanjimbashi outlet.
Page 90
Cindy Jeane Supit Page 76
Figure 5.10 Average Annual TN loads for the Kase River at Kanjinbashi outlet (2008-2009)
Figure 5.11 Average Annual TP loads for the Kase River at Kanjinbashi outlet (2008-2009)
Page 91
Cindy Jeane Supit Page 77
5.4. CONCLUSIONS OF CHAPTER 5
The creation of dam reservoir affects water quality along the river. Multiple dam
reservoirs in Kase River basin have changed the nutrient transport by decreasing of total nitrogen
and total phosphorus export relative to downstream area.
The higher output of TN and TP occurred in summer (June to September) and lower
output occurred in winter. This was related with the agriculture activity and due to plenty of
external nutrient was carried by high runoff and flowed along the river, that will enhance nutrient
load.
Changes in the presence and absence of dams in watershed model produced impacts on
magnitudes of nutrient loads. Presence and absence scenarios clearly supported the hypothesis
that multiple dam reservoirs in the Kase River watershed reduce N and P river exports. Average
annual river export of TN over the time period 2008-2009 was lower by 9.18 % when Hokuzan
dam reservoir and Kase River reservoir were made in the watershed, and became lower by
5.64 % when Kase River dam reservoir was added from only Hokuzan dam reservoir exist in the
watershed. Average annual TP export in 2008-2009 decrease by 11.31 % when Hokuzan dam
and Kase dam exist in the watershed and a decrease of 8.03 % when Kase River dam was added
from only Hokuzan dam condition.
Calibration of models for Kase River Basin resulted in satisfactory statistical measure.
Model under prediction of nutrient transport loads during summer months due to the model’s
limitation in predict the amount of nutrient transport from the reservoirs related to simply mix-
well of nutrient and not consider to stratification inside the reservoir. Although there are some
discrepancies of model, but overall the predictions are quite well with coefficient determination
(R2)=0.753 and Nash Sutcliffe = 0.751 for TN, and for TP with coefficient determination = 0.819
and Nash Sutcliffe = 0.796. The SWAT model successfully passed the scenarios exercises
considering stream flow and nutrient rates output.
Dam reservoirs are estimated as the positive ecological instrument for holding back the
sediment that contain nutrient to harmful the downstream area. The presence of Hokuzan dam
reservoir and Kase River dam reservoir would be the good environmental agent for management
pollution control in Kase River basin.
Page 92
Cindy Jeane Supit Page 78
Chapter 6
ESTIMATION OF NUTRIENT SOURCE LOADING INTO THE NEW
KASE RIVER DAM
6.1 INTRODUCTION
Tributary stream flows can transfer great amounts of sediment and associated pollutants to
receiving water bodies both seasonally and annually. Therefore, when considering the total
loading of pollutants to Kase River Dam these potential contributions must be considered.
Computer simulation of rainfall and runoff provides a very useful methodology to examine
tributary pollutant contributions. This study is to estimate the nutrient export into the new Kase
River Dam reservoir, and provides a discussion of the SWAT methodology to examine tributary
nutrient source.
The Kase River Dam watershed is entirely located within Saga Prefecture, Japan, and is
surrounded by the upstream section of the Kase River Basin Forest. Created in 2010, the
reservoir is an impoundment of the Kase River at the upstream section. The Kase River flows
through the basin, and pour the water into Ariake Sea. Kase River Dam is a multipurpose dam
that provides storage for irrigation water, flood control protection, hydroelectric power
generation, and also for recreational services.
The population in the Kase River basin about 130,000 people mostly concentrated on the
inside and the downstream part. Currently land uses in the Kase Dam watershed are artificial
coniferous forest and rice field. The land cover for the region was extracted from the Ministry of
Land Infrastructure and Transport (MLIT) Japan (MLIT; http://www.mlit.go.jp).
6.2 METHODOLOGY
Nonpoint source loadings by stream flow to the Kase River Dam were estimated using
ArcSWAT 2009. The SWAT model was developed to predict the impact of land management
practices, such as vegetative changes, reservoir management, groundwater withdrawals, and
water transfer, on water, sediment, and agricultural chemical yields in large complex watersheds
Page 93
Cindy Jeane Supit Page 79
with varying soils, land use, and management conditions over long periods of time. SWAT
simulates hydrology, pesticide and nutrient cycling, erosion, and sediment transport. The model
was developed by modifying the Simulator for Water Resources in Rural Basins (SWRRB)
(Arnold et al., 1990) and the Routing Outputs to Outlet (ROTO) (Arnold, 1990) models for
application to large, complex rural basins. SWRRB is a distributed version of the field-scale
CREAMS model, and SWAT is an extended and improved version of SWRRB.
The ArcSWAT 2009 requires digital elevation data (DEM), land use/land cover, soils,
and meteorological data. Digital elevation data was taken from Nippon-III 50 m grid elevation
of digital map.
After computing watershed topographic parameters, ArcSWAT 2009 uses land cover and
soils data in an overlay process to assign soil parameters and SCS curve numbers. The land cover
for the watershed area was taken from the MLIT. Soils information was clip from the MLIT
website for Saga Prefecture.
Hydrologic Response Units (HRU) step was done in the modeling application. An HRU
consists of a unique combination of land use/land cover and soil characteristics, and thus
represents areas of similar hydrologic response. This step resulted in a highly detailed land use
and soil SWAT database, containing many HRUs, which in turn represents a very heterogeneous
watershed.
For run the simulation, SWAT requires daily precipitation, temperature, relative humidity,
solar radiation, and wind speed data. ArcSWAT will search and find the station closest to the
mean center of each subwatershed, and assign that station’s meteorological parameters to the
subwatershed. Daily precipitation data were downloaded from the Japan Meteorological Agency
(JMA) website for the Furuyu, Kanjimbashi, and Gonggenyama stations. Daily data are
available for these stations from January 1979 to December 2010. Temperature, relative
humidity, solar radiation, and wind speed were taken from Saga Meteorological Observatory
from 1979 to 2010.
The SWAT model produces (HRU) reports that describe the annual contribution of runoff,
sediment, and associated pollutants from individual HRUs to subwatershed stream reaches.
These HRU data may be used to provide information about the source area contribution to the
overall pollutant loading from the watershed.
Page 94
Cindy Jeane Supit Page 80
Figure 6.1 Watershed delineation in SWAT model
Page 95
Cindy Jeane Supit Page 81
Figure 6.2 Area characteristics of subwatersheds.
Page 96
Cindy Jeane Supit Page 82
Figure 6.3 SWAT modeling tributary area
Page 97
Cindy Jeane Supit Page 83
Figure 6.4 Land use area in the watershed
Table 6.1 Tributary nutrient load
Hokuzan Fork Nakahara Fork
Area (ha) 5829.2 4137.8
Total Nitrogen 13,757.6 8319.1
Total Phosphorus 868.4 580.7
TN/area 2.36 2.01
TP/area 0.149 0.140
Page 98
Cindy Jeane Supit Page 84
Table 6.2 Subwatershed land use and area characteristics
Subwatershed 1
SWAT Land Use
SWAT Code
Area (ha)
Subwatershed Percentage
Rice RICE 85.9094 20
Forest Mix FRST 257.7283 60
Forest Evergreen FRSE 71.5912 16.67
Pasture PAST 14.3182 3.33
Total subwatershed area 429.5471 100
Subwatershed 2
SWAT Land Use
SWAT Code
Area (ha)
Subwatershed Percentage
Rice RICE 200.4553 11.76
Forest Mix FRST 1002.2767 58.82
Forest Evergreen FRSE 143.1824 8.40
Pasture PAST 85.9094 5.04
Commercial UCOM 28.6365 1.68
Water WATR 57.2730 3.36
Transportation UTRN 28.6365 1.68
Residential URBN 14.3182 0.84
Institutional UINS 14.3182 0.84
Wetlands Non Forested WETN 71.5912 4.2
Forest Deciduous FRSD 57.2730 3.36
Total subwatershed area 1703.8703 100
Page 99
Cindy Jeane Supit Page 85
Table 5.1 (continued)
Subwatershed 3
SWAT Land Use
SWAT Code
Area (ha)
Subwatershed Percentage
Water WATR 71.5912 26.32
Institutional UINS 14.3182 5.26
Forest Mix FRST 157.5006 57.89
Forest Evergreen FRSE 28.6365 10.53
Total subwatershed area 272.0465 100
Subwatershed 4
SWAT Land Use
SWAT Code
Area (ha)
Subwatershed Percentage
Water WATR 14.3182 1.89
Residential URBN 14.3182 1.89
Rice RICE 85.9094 11.32
Orchard ORCD 14.3182 1.89
Forest Mix FRST 501.1383 66.04
Forest Evergreen FRSE 28.6365 3.77
Pasture PAST 28.6365 3.77
Wetlands Non Forested WETN 14.3182 1.89
Forest Deciduous FRSD 57.2730 7.55
Total subwatershed area 758.8667 100
Page 100
Cindy Jeane Supit Page 86
Table 5.1 (continued)
Subwatershed 5
SWAT Land Use
SWAT Code
Area (ha)
Subwatershed Percentage
Rice RICE 171.8189 9.23
Forest Mix FRST 1116.8226 60
Forest Evergreen FRSE 229.0918 12.31
Pasture PAST 14.3182 0.77
Commercial UCOM 14.3182 0.77
Transportation UTRN 57.2730 3.08
Residential URBN 14.3182 0.77
Industrial UIDU 28.6365 1.54
Wetlands Non Forested WETN 57.2730 3.08
Forest Deciduous FRSD 128.8641 6.92
Orchard ORCD 14.3182 0.77
Summer Pasture SPAS 14.3182 0.77
Total subwatershed area 1861.3709 100
Page 101
Cindy Jeane Supit Page 87
Table 5.1 (continued)
Subwatershed 6
SWAT Land Use
SWAT Code
Area (ha)
Subwatershed Percentage
Rice RICE 272.0465 11.05
Forest Mix FRST 1832.7345 74.42
Forest Evergreen FRSE 114.5459 4.65
Pasture PAST 128.8641 5.23
Transportation UTRN 28.6365 1.16
Residential URBN 28.6365 1.16
Wetlands Non Forested WETN 14.3182 0.58
Forest Deciduous FRSD 28.6365 1.16
Orchard ORCD 14.3182 0.58
Total subwatershed area 2462.7369 100
Subwatershed 7
SWAT Land Use
SWAT Code
Area (ha)
Subwatershed Percentage
Rice RICE 85.9094 16.22
Forest Mix FRST 300.6830 56.76
Forest Evergreen FRSE 100.2277 18.92
Pasture PAST 28.6365 5.41
Forest Deciduous FRSD 14.3182 2.70
Total subwatershed area 529.7748 100
Page 102
Cindy Jeane Supit Page 88
Table 5.1 (continued)
Subwatershed 8
SWAT Land Use
SWAT Code
Area (ha)
Subwatershed Percentage
Rice RICE 200.4553 17.50
Forest Mix FRST 658.6390 57.50
Forest Evergreen FRSE 114.5459 10
Pasture PAST 171.8189 15
Total subwatershed area 1145.4591 100
Subwatershed 9
SWAT Land Use
SWAT Code
Area (ha)
Subwatershed Percentage
Rice RICE 114.5459 14.29
Forest Mix FRST 558.4113 69.64
Forest Evergreen FRSE 28.6365 3.57
Pasture PAST 57.2730 7.14
Forest Deciduous FRSD 42.9547 5.36
Total subwatershed area 801.8213 100
Subwatershed 10
SWAT Land Use
SWAT Code
Area (ha)
Subwatershed Percentage
Water WATR 14.3182 2.13
Forest Mix FRST 357.9560 53.19
Forest Evergreen FRSE 100.2277 14.89
Pasture PAST 200.4553 29.79
Total subbasin area 672.9572 100
Page 103
Cindy Jeane Supit Page 89
6.3. RESULTS AND DISCUSSIONS
6.3.1 Evaluation of land use and area characteristics of the watershed
Figure 6.1 shows the subwatersheds delineated by the ArcSWAT and used in this study.
Figure 6.2 and Table 6.1 lists the respective land use and area characteristics of each of these
subwatersheds. The result shows that the subwatershed 6 area is the largest area in the Kase
River Dam watershed, draining 2462.7369 hectares and representing 23 percent of the total
watershed area. The second and third largest areas are subwatershed 5 and 2 drain 1861.3709
hectares and 1703.8703 hectares, respectively, and account for approximately 17 percent and 16
percent of total watershed area, respectively. Combined, subwatersheds 1,2,3,4,5, and
subwatershed 9 represent Hokuzan Fork and combined subwatershed 6,7, and subwatershed 8
represent Nakahara Fork (Figure 6.3). These area will used for following tributary source
nutrient loading analysis. The dominant land use types in these subwatersheds are Forest Mix,
Rice Field, and Forest Evergreen representing 63.39, 11.44, and 9.02 percent of the cover in the
watershed (Figure 6.4).
6.3.2 Evaluation of tributary stream nutrient transport
The SWAT model produces (HRU) reports that describe the annual contribution of runoff,
sediment, and associated pollutants from individual HRUs to subwatershed stream reaches.
These HRU data may be used to provide information about the source area contribution to the
overall pollutant loading from the watershed
For each subwatershed, SWAT produces reports that describe the total annual transport by
runoff of sediment and associated pollutants into the subwatershed stream reach from unique
combinations of land use and soil type. Estimates of Total Nitrogen and Total Phosporus are
made. Table 6.2 summarizes the nutrient transport according to land cover and land use for each
tributary area. Urban area including Residential, Transportation, Commercial, Institutional, and
Industrial are modeled as a mix of impervious area.
Page 104
Cindy Jeane Supit Page 90
Table 6.3 Subwatershed annual pollutant transport (kg) to stream reaches
summarized by land use
Hokuzan Fork
Land Use
Total Nitrogen
Total Phosporus
Rice 3798.186 280.008
Forest Mix 3516.554 164.208
Forest Evergreen 1803.215 80.754
Pasture 1222.733 133.636
Urban 1483.852 73.884
Orchard 259.476 10.923
Summer Pasture 84.666 9.207
Wetlands Non Forested 815.405 85.028
Forest Deciduous 773.573 30.792
Total 13757.66 868.44
Nakahara Fork
Land Use
Total Nitrogen
Total Phosporus
Rice 2947.970 221.297
Forest Mix 2565.911 153.651
Forest Evergreen 1305.980 69.486
Pasture 949.294 100.756
Urban 251.071 14.291
Orchard 68.412 3.904
Wetlands Non Forested 96.862 10.471
Forest Deciduous 133.626 6.892
Total 8319.13 580.75
Page 105
Cindy Jeane Supit Page 91
Figure 6.5 Hokuzan Fork annual TN transport (kg) to stream reaches summarized by land use.
Figure 6.6 Hokuzan Fork annual TP transport (kg) to stream reaches summarized by land use.
Page 106
Cindy Jeane Supit Page 92
Figure 6.7 Nakahara Fork annual TN transport (kg) to stream reaches summarized by land use.
Figure 6.8 Nakahara Fork annual TP transport (kg) to stream reaches summarized by land use.
Page 107
Cindy Jeane Supit Page 93
Figure 6.5 and Figure 6.6 show the Hokuzan Fork annual TN and TP transport to stream
reaches summarized by land use, while Figure 6.7 and Figure 6.8 show the Nakahara Fork`s
annual TN and TP transport to its stream reaches. Total Nitrogen (TN) consists of organic
nitrogen and dissolved inorganic nitrogen. Total Phosphorus (TP) consists of organic phosphorus,
sediment phosphorus, and dissolved phosphorus. The total amount of nutrients transported from
a source to a stream reach is governed by subwatershed area. Table 6.2 shows that the greatest
pollutant transport of TN and TP into tributary streams occurs in the Hokuzan Fork area. The
Hokuzan Fork area is the big contributor of nutrients to its stream reaches in the Kase River Dam,
simply because of its large size (55 percent of total watershed area).
The transport of nutrients to stream reaches is much lower in the Nakahara Fork area (TN
8319.13 kg and TP 580.75 kg). Subwatersheds 6, 7 and subwatershed 8, which inside the
Nakahara Fork contribute relatively little to their respective stream reaches.
The results also shows that the greatest sources of pollutant transport to stream reaches are
from Rice field and Forest Mix, which dominate the Kase River Dam watershed. Rice field is
seen to contribute significant amounts of all nutrients to stream reaches; this is due to the
agricultural activity from this landuse.
The third and fourth most contributions of total nitrogen to stream reaches occur from
Forest Evergreen (1803.215 kg) and Urban (1483.852 kg), while Pasture (133.636 kg) and Forest
Evergreen (80.754 kg) contribute total phosphorus respectively.
6.4. CONCLUSIONS OF CHAPTER 6
The SWAT model simulation between 2000 and 2010 indicated that various potential
landuse sources exist within the Kase River Dam area. Considering the total loading of
pollutants to Kase River Dam, the potential contributions of tributary must be considered. The
tributary loadings are related to landuse activities that occur in the watershed, include
agricultural, forest and urban area. .
The greatest pollutant transport of TN and TP into tributary streams occurs in the Hokuzan
Fork area. The Hokuzan Fork area is the big contributor of nutrients to its stream reaches in the
Kase River Dam, simply because of its large size (55 % of total watershed area).
Page 108
Cindy Jeane Supit Page 94
The transport of nutrients to stream reaches is much lower in the Nakahara Fork area with
TN 8319.13 kg and TP 580.75 kg respectively. Subwatersheds 6, 7 and subwatershed 8, which
inside the Nakahara Fork contribute relatively little to their respective stream reaches.
The outcome shows that the greatest sources of pollutant transport to stream reaches are
from Rice field and Forest Mix, which dominate the Kase River Dam watershed. Rice field is
seen to contribute significant amounts of all nutrients to stream reaches; this is due to the
agricultural activity from this landuse.
The third and fourth most contributions of total nitrogen to stream reaches occur from
Forest Evergreen and Urban, while Pasture and Forest Evergreen contribute total phosphorus
respectively.
Page 109
Cindy Jeane Supit Page 95
Chapter 7
WATER RESOURCES MANAGEMENT BY MODELING OF DAM
OPERATION IN KASE RIVER BASIN
7.1 INTRODUCTION
Currently, dams are an important means to meet water and energy needs and support
economic development (Sule 1988; Mugabe et al. 2003; Feder 2004; Xie 2004; Wei et al.
2009). Nearly 50,000 large dams, defined as storage capacity of >1 million cubic meters, have
been constructed all over the world by the end of year 1998. Research on management of dam
which increase the positive effects and to meet water demand while decreasing the negative
effects, is a major goal of dam management.
Dam design and operation typically focuses on its social functions, such as flood control,
electricity generation, water supply, irrigation, and aquaculture (WCD 2000). Along with
increased human activities in Kase River basin the demand of water have become more
apparent in recent years.
Kase River Basin is located in the center part of Saga Prefecture. This basin consists of 3
cities including Saga City. The population in the basin about 130,000 people mostly
concentrated on the inside and the downstream part. The basin has wide variety of land use
while MLIT (Ministry of Land, Infrastructure and Transportation) Japan due to National
Comprehensive Water Resources Plans was added a new multi-purpose Kase River dam with
Hokuzan dam sequentially in this area in order to supply water needed especially for agriculture
and water supply in Saga Prefecture.
In addition, there has been an open channel network, which is a creek network in Saga Plain.
This network could enhancement a need of water for irrigation and also could store up the water
when flood occurred. However after achievement of water supply facilities, the creek network
was used only for irrigation or urban drainage and shortage of water discharge caused
eutrophication of water by too much nutrient supply and polluted sediment settled down the
channel. To improve this water environment of the creek network in the plain needs water
quantity to some extent. The function of dam reservoir for restraining sediment transport
including the nutrient causing the eutrophication in the downstream open channel is expected.
Page 110
Cindy Jeane Supit Page 96
How the upstream dam reservoirs are utilized is directly or indirectly related to water quantity
and quality in the downstream area.
For that reason, it is fairly essential to reflect on the integrated management of dam reservoir
in this watershed. Managing the water resources in this area became an important topic in the
integrated basin management to provide a new approach to water environment
improvement.
This basin is very unique with high regulated since some water management such as the
water diversion from downstream of Hokuzan dam to Ayunose was done in this area. A water
demand for sufficiently quantity by 5 m3/s to prevent eutrophicationat the creek network
downstream, and a discharge of 18.6 m3/s for irrigation period are urgent issue to answer
community needs.
The purpose of this study is to develop a water management tool of dams operation, at the
basin scale, based on SWAT.
Soil and Water Assessment Tool (SWAT) is a river basin, or watershed, scale model with
strong physical mechanism developed by Jeff Arnold for the American Ministry of Agriculture
Research Bureau (Arnold et al. 1998; Neitsch et al. 2002). There are some specific models
that contributed significantly to the development of SWAT, such as CREAMS (Chemicals,
Runoff, and Erosion from Agricultural Management Systems) (Knisel 1980), GLEAMS
(Groundwater Loading Effects on Agricultural Management Systems) (Leonard et al. 1987),
EPIC (Erosion-Productivity Impact Calculator) (Williams et al. 1984), and QUAL2E
(Enhanced Stream Water Quality Model) (Brown and Barnwell 1987). SWAT is easy to use
and has been applied to watersheds in many countries and regions (Santhi et al. 2006).
This research will provide the technical support for water management improvement for
integrated basin management in Kase River Catchment. Moreover, it will be the foundation for
the sustainable development of Saga City in the future.
7.2 METHODOLOGY
In order to develope the water management tools of dams operation, at the basin scale, it
is necessary to recognize the problem that facing in this area, also the water management such as
the diversion of water which done inside the watershed. Our research framework is that: Firstly,
distributed hydrological and water quality model are developed including the diversion of water
Page 111
Cindy Jeane Supit Page 97
was setup and dam operation is considered, also the model parameters are calibrated in order
to well simulated the process under current situation. Secondly, based on the calibrated model
the management model of dams, which will be developed to reach objective. Finally the result
of dam’s management can be assessed.
ArcSWAT 2009 version of the SWAT model is used as a main tool in this study. SWAT is
a basin or watershed scale model with strong physical mechanism. It has been widely applied in
Canada and North America (Fontaine et al. 2002). In Japan, the SWAT has been applied to
mountain area with enormous success (Somura et al. 2009).
It is demonstrated and agreed that SWAT is well established because of its flexibility and
suitability for hydrological simulation in complex basins and water resources management.
SWAT has a reservoir module, in which the reservoir is treated as an independent unit to be
added in the corresponding subbasin. Therefore, it is appropriate for simulating the influence of
the hydrological cycle in a region with reservoirs, such as our study basin.
This version integrates the newest version of Soil and Water Assessment Tool. The
SWAT is a river basin or watershed, scale model developed to predict the impact of land
management practices on water, sediment, and agriculture chemical yields in large, complex
watersheds with varying soil, land use, and management conditions over long periods of time
(Arnold et.all 1998). This model was chosen because it was physically based and
computationally efficient (Neitsch, 2002).
The hydrologic cycle of the SWAT model is based on the water balance equation, which
considers the unsaturated zone and shallow aquifer above the impermeable layer as a unit.
The previous water balance equation is given for more detail information. The hydrologic cycle
as simulated by SWAT is based on the water balance equation:
)1.7()(1
0 gwseepasurf
t
i
dayt QwEQRSWSW
where SWt is the final soil water content (mm H2O), SW0 is the initial soil water content
on day i (mm H2O), t is the time (days), Rday is the amount of precipitation on day i (mm H2O),
Qsurf is the amount of surface runoff on day i (mm H2O), Ea is the amount of evapotranspiration
on day i (mm H2O), wseep is the amount of water entering the vadose zone from the soil profile
on day i (mm H2O), and Qgw is the amount of return flow on day i (mm H2O).
Page 112
Cindy Jeane Supit Page 98
The SWAT model uses the SCS curve number procedure to calculate the runoff volume
under different soil types and land uses. The SCS curve number equation is:
)2.7()(
)( 2
SIR
IRQ
aday
aday
surf
Where Qsurf is the accumulated runoff or rainfall excess (mm); Rday is the rainfall depth for
the day (mm); Ia is the initial abstractions, which includes surface storage, interception, and
infiltration prior to runoff (mm); and S is the retention parameter (mm). The retention parameter
varies spatially due to changes in soil, land use, management, and slope and temporally due to
changes in soil water content. The retention parameter is defined as:
)3.7(25425400
CN
S
where CN is the curve number for the day.
The volume of outflow calculated using one of four different methods: measured daily outflow,
measured monthly outflow, average annual release rate for uncontrolled reservoir, controlled
outflow with target release.
When measured monthly outflow (IRESCO = 1) is chosen as the method to calculate reservoir
outflow, the user must provide a file with the average daily outflow rate for every month the
reservoir is simulated in the watershed. The volume of outflow from the reservoir is then
calculated using equation
V flowout = 86400 ⋅ qout (7.4)
where Vflowout is the volume of water flowing out of the water body during the day (m3 ), and
qout is the outflow rate (m3/s).
When the average annual release rate (IRESCO = 0) is chosen as the method to calculate
reservoir outflow, the reservoir releases water whenever the reservoir volume exceeds the
principal spillway volume, Vpr.
Page 113
Cindy Jeane Supit Page 99
Figure 7.1 Feature of an impoundment dam(Neitsch,2005)
7.2.1 Study area and model input data
Kase River Basin is located in the center part of Saga Prefecture. This basin consists of 3
cities including Saga City. The population in the basin about 130,000 people mostly
concentrated on the inside and the downstream part. The basin has wide variety of land use
while MLIT (Ministry of Land, Infrastructure and Transportation) Japan due to National
Comprehensive Water Resources Plans was added a new multi-purpose dam in this area in
order to supply water needed especially for agriculture and water supply in Saga Prefecture.
Kase River flows through Saga Plain and pours into the Ariake Sea. The length of Kase River is
about 57 km, with catchment area about 368 km2. Kase River dam construction is started in
December 1992 with the surface area of the reservoir 270 ha, and has started a first impounding
in October 2010. Upstream of the new dam there is a dam called Hokuzan dam constructed
in March 1957 for agricultural purpose only. Just downstream of Hokuzan dam, the water is
diverted to Ayunose (Figure 7.2). The Hokuzan dam operates on a temporal schedule, according
to the agricultural management of watershed. In the wet/rainy period, the reservoir collects
water and the water level increases. In the irrigation period of tenth of June to tenth of October
Page 114
Cindy Jeane Supit Page 100
or when the discharge water volume reaches to 15 m3/s at Kawakami water head, the water in
the dam is released to meet the demand of agricultural resources in the Saga Plain at the lower
reach. Kase River dam is an important water resources facility for Saga Prefecture. This
prefecture has a big of arable land and has a regional granary for supply rice in Kyushu Island,
Japan.
The SWAT was set up for the basin upstream area of 197.74 km2 that accounts for 54% of
the entire area of the Kase River basin in Japan. Figure 7.9 shows the watershed was
automatically delineated and divided by SWAT into 23 sub watersheds where Hokuzan dam had
constructed and Kase dam have been impounded. The DEM was taken from Nippon-III 50 m
grid elevation of digital map, land use map in 2007 obtained from the Ministry of Land
Infrastructure and Transportation Japan, and detailed soil map was clipped from National Land
Survey Division, Land and Water Bureau of MLIT`s website and used as the GIS input data for
the model simulation. Figure 7.10 and Figure 7.11 respectively show the land use and soil map
of the study area. Hourly observed weather data (temperature, humidity, solar radiation) from
Saga Meteorological Observatory were applied in order to calculate the potential
evapotranspiration (PET) using Penman-Monteith`s method. Daily observed discharge data
were taken by the Ministry of Land Infrastructure and Transportation (MLIT) (2008-2009) for
the analysis.
Page 115
Cindy Jeane Supit Page 101
Figure 7.2 Location of Kase River basin
Figure 7.3 Study area information
Page 116
Cindy Jeane Supit Page 102
Figure 7.4 Water management in Saga (Koga et.al. 2000)
Page 117
Cindy Jeane Supit Page 103
Figure 7.5 Water use in the basin (Koga et.al. 2000)
Page 118
Cindy Jeane Supit Page 104
7.2.2 Model Selection and improvement
The Arc-Geographic Information System interface of the SWAT2009 version (Di Luzio and
Arnold 2004) was used to develop the SWAT model of Kase River Catchment. SWAT has a
reservoir module, in which the reservoir is treated as an independent unit to be added in the
corresponding subbasin. Therefore, it is appropriate for simulating the influence of the
hydrological cycle in a region with reservoirs, such as our study basin.
The catchment was divided into 23 sub-basins according to hydrologic stations, the position
of dams, the water diversion point, and the discharge zones. The sub-basin threshold area
was 500 ha. Kanjimbashi was selected as the outlet of the whole basin. The hydrologic
response unit (HRU), which is a unique combination of soil and land use overlay in the sub-
basins (Neitsch et al.2002), is the minimum calculative smallest unit of hydrologic process.
With a threshold value of 5% for land use and soil types, the total number of HRUs was 356
(Fig. 7.3).
Moreover, water diversion that supply water in pipe to Ayunose in the catchment was
added in the model as point source outlet and developed a data based on information from
the water use in this diversion (figure 7.5). For run the first simulation Hokuzan dam and Kase
River dam have no monitoring data, As a result, I selected the average annual release rate
for uncontrolled reservoir method (IRESCO = 0) in their control files (*.res), and
modified the reservoir’s design data including reservoir surface area (RES_ESA) and
volume of water (RES_EVOL) as the water level reaches the emergency spillway and surface
area of reservoir (RES_PSA), and volume of water (RES_PVOL) in their control files (*.res).
The further simulations were done by adjusting the minimum monthly outflow. As a result,
I set the outflow simulation code to the measured monthly outflow (IRESCO = 1) in their
control files (*.res), generate and added the minimum monthly outflow rate and read into
SWAT for run the simulation.
Page 119
Cindy Jeane Supit Page 105
Figure 7.6 Fukuoka DEM
Figure 7.7 Kumamoto DEM
Page 120
Cindy Jeane Supit Page 106
Figure 7.8 Merge of Fukuoka DEM and Kumamoto DEM
Figure 7.9 Watershed delineation in the watershed with 2 dams, 3 precipitation stations
Page 121
Cindy Jeane Supit Page 107
7.3 RESULTS AND DISCUSSION
7.3.1 Model evaluation
Four sensitive parameters that may have a potential influence on river flow was
selected (Table 7.1) (Arnold et al. 1998; Eckhardt and Arnold 2001; Lenhart et al. 2002; van
Griensven et al. 2006; Bärlund et al. 2007). The ranges of these parameters were
obtained from the SWAT manual (Neitsch et al. 2002). The hydrologic parameters were
calibrated to match the simulated and observed monthly flow data at Kanjinbashi outlet
from 2008 to2009. Several evaluation indices, including correlation determination (R2), and
Nash–Sutcliffe coefficient, were used to evaluate the model performance (Romanowicz et al.
2005) (Table 7.1). For the runoff simulation, if the correlation coefficient and NSEC coefficient
are ≤0.0, the model prediction is considered “unacceptable or poor.” If the correlation
coefficient and NSEC coefficient are 1.0, the model prediction is considered “perfect.” Each of
these categories followed the criteria used by Santhi et al. (2001). The result simulation show
sufficient acceptable of the model with coefficient determination = 0.917, and Nash Sutcliffe =
0.882.
Figure 7.10 Land use map of study area
Page 122
Cindy Jeane Supit Page 108
Figure 7.11 Soil map of study area
Figure 7.12 Hydrologic Response Unit analysis in SWAT
Page 123
Cindy Jeane Supit Page 109
Figure 7.13 Water Diversion point at the study area
Table 7.1 Parameter used in the model calibration
Name Definition File name
CN2 SCS moisture condition
II curve number for
pervious areas
.mgt
Sol_K Saturated hydrolic
conductivity of first layer
.sol
ESCO Soil Evaporation
compensation coefficient
.hru
Sol_AWC Available water capacity
of the soil layer
.sol
Page 124
Cindy Jeane Supit Page 110
7.3.2 Management dam operation
Currently the demand of water for preventing eutrophication at the open channel in
downstream area is 5 m3/s, and a discharge over 18.6 m
3/s in the irrigation period are the values
that must be reach to meet the needs of community. The simulations were done by adjusting the
minimum monthly outflow rate. Year 2008 and 2009 are selected to analyze the management
operation of dams of the SWAT model. The management option of Hokuzan dam is as
follows: minimum outflow rate by 5m3/s before the irrigation period, minimum outflow rate
19 m3/s in the irrigation period, and minimum outflow rate 5 m
3/s after the irrigation period.
The management option of Kase River dam is as follows: minimum outflow rate by
5m3/s before the irrigation period, minimum outflow rate 19 m
3/s in the irrigation period, and
minimum outflow rate 5 m3/s after the irrigation period.
Conclusively, with the water discharge over 5 m3/s of dams before and after the
irrigation period enhanced the fluvial fluidity and was useful to prevent the accumulation of
pollutant or nutrient at the creek network, which would have decreased the water quality.
Moreover, increasing water discharge during the irrigation period ensured the flood control
safety during the flooding season and satisfied the demand for agriculture purpose.
The operation of dams involves always keeping them closed in the non flood season
to store water for irrigation. The quantity of usable water resources is problem in Saga Plain
since water demand 5 m3/s for preventing eutrophication at the creek network and 18.6 m
3/s are
more than available natural supply. During the flood season, however, Hokuzan dam usually
open to discharge water for flood irrigation.
By the scenario for uncontrolled dam minimum outflow rate, the water resources quantity
was not satisfied along the years. In January, February, July, August and September for 2008,
and March, September for 2009, the stream flow not enough to meet the demand for
downstream area, which need more supply water.
By scenario analysis for controlled the minimum outflow rate from Hokuzan dam and
Kase River dam, the water resources quantity improved and satisfied the demand water of 5
m3/s for the creek network downstream area and also 18.6 m
3/s for agriculture purpose after
the implementation of water management operation of dams. The runoff increased in the non
irrigation season to increase fluidity of rivers and improve water quality, while runoff will be
reached in irrigation season to satisfy the demand for that time.
Page 125
Cindy Jeane Supit Page 111
Table7.2 Description of dams in Kase river basin
Dam Hokuzam dam Kase River dam
Service Date 1957 2010
Height(m) 59.3 97
Dam Volume
(m3)
145,000 1,220,000
Eff. Capacity
(m3)
22,000,000 68,000,000
Storing Water
Area(ha)
200 270
Catchment
area(ha)
5,463 12,840
Figure 7.14 Observed and simulated discharge simulation
Page 126
Cindy Jeane Supit Page 112
Figure 7.15 Model performances of simulated and observed discharges in Kanjinbashi outlet
Fig.7.16 Monthly simulated runoff 2 dam (uncontrolled) scenarios at Kanjinbashi outlet for
2008-2009
Page 127
Cindy Jeane Supit Page 113
Fig.7.17 Monthly simulated runoff 2 dam (controlled) scenarios at Kanjinbashi outlet for
2008-2009
Table 7.3 The minimum outflow rate option of dams (m3/s)
Dam reservoir Before
irrigation
period
Irrigation
period
After irrigation
period
Hokuzan Dam 5 19 5
Kase Dam 5 19 5
Page 128
Cindy Jeane Supit Page 114
Fig.7.18 Average annual Water Balance of Kase River basin
7.4 CONCLUSIONS OF CHAPTER 7
Managing water resources is an important research topic in the integrated basin
management and will provide a new approach to water environment improvement. In this
study, the water management operation of dams done with the SWAT model. The simulation
for managing water resources was done by adjusting the minimum outflow rate in reservoir
module and read into SWAT.
By the scenario for uncontrolled dam minimum outflow rate, the water resources quantity
was not satisfied along the years.
By scenario analysis for controlled the minimum outflow rate from Hokuzan dam and Kase
River dam, the water resources quantity improved and satisfied the demand water of 5 m3/s for
preventing eutrophication at the creek network downstream area and also 18.6 m3/s for
agriculture purpose after the implementation of water management operation of dams.
Page 129
Cindy Jeane Supit Page 115
The management option of Hokuzan dam is as follows: minimum outflow rate by 5
m3/s before the irrigation period, minimum outflow rate 19 m
3/s in the irrigation period, and
minimum outflow rate 5 m3/s after the irrigation period.
The management option of Kase River dam is as follows: minimum outflow rate by 5
m3/s before the irrigation period, minimum outflow rate 19 m3/s in the irrigation period, and
minimum outflow rate 5 m3/s after the irrigation period.
Conclusively, with the water discharge over 5 m3/s of dams before and after the
irrigation period enhanced the fluvial fluidity and was useful to prevent the accumulation of
pollutant or nutrient at the creek network, which would have decreased the water quality.
Moreover, increasing water discharge over 18.6 m3/s during the irrigation period ensured the
flood control safety during the flooding season and satisfied the demand for agriculture
purpose.
The management of dam operation at the basin scale answers the demand of water for 5 m3/s
for preventing eutrophication problem at the creek network downstream area and the discharge
over 18.6 m3/s for irrigation, using the reservoir operation module of SWAT model. It will
purpose in Kase River Catchment in Saga, Japan.
Although this paper still a preliminary study, and the results were not very satisfying
due to limitations in available observation data, this model provides technical support
and reference for water management operation of dams and will be a very useful method for
future integrated basin improvement.
Page 130
Cindy Jeane Supit Page 116
Chapter 8
CONCLUSIONS
8.1 CONCLUSIONS
The following results are obtained from this research:
The development and application of computational models for water management are
necessary to apply for improving water resources development in Kase River basin. With
technological development, the computational model becomes the important device in analyzing
the water management problem and evaluation of policy. Impact of water resources development
projects is essential to address in the policy analysis.
From the observation, the results show that the water quality of Kase River basin is
generally as good. The conditions in the periods after dam construction indicate that river water
quality impairment do exist, but not much and still meet the environmental qualification. The
replenishment of Kase River Dam reservoir with the Hokuzan dam reservoir in the basin has less
affected to change the water quality along the river due to the good implementation of pollution
control in this area. The investigation found that increasing concentrations of chlorophyll a is
caused by algae growth in the Kase River dam reservoir, and gives a changing of the water
quality downstream. Possible flooding of the reservoir dam is likely to have an influence on the
water quality at the downstream area.
The constructions of a dam reservoir will have consequences on the nature of environment.
The existence of Hokuzan dam and Kase River dam in this area resulted in reductions in annual
and peak stream flow rates in the watershed. Dam reservoirs in Kase River basin have changed
the stream flow regimes. These dams seem to , result in decrease of average annual discharge by
3.68 % from only Hokuzan dam scenario, and decrease 4.49 % from the disappeared dam
scenario. Dams in Kase River basin also have changed the peak flow rates based on results at the
Kanjinbashi which is the outlet of watershed model. Peak flow rates in 2008-2009 decrease by
10.49 % when Hokuzan dam and Kase dam were added from only Hokuzan dam scenario and a
decrease of 1.57 % when Hokuzan dam was added from no dam condition. The effects on
Page 131
Cindy Jeane Supit Page 117
decrease of annual stream flow are larger in the wet period from June to July and in dry period
such as February the effect are not obvious.
The creation of dam reservoir affects water quality along the river. Multiple dam reservoirs
in Kase River basin have changed the nutrient transport by decreasing of total nitrogen and total
phosphorus export relative to downstream area. The function of dam reservoir for restraining
sediment transport including the nutrient causing the eutrophication in the downstream open
channel is expected. The higher output of TN and TP occurred in summer (June to September)
and lower output occurred in winter. This was related with the agriculture activity and due to
plenty of external nutrient was carried by high runoff and flowed along the river, that will
enhance nutrient load. Changes in the presence and absence of dams in watershed model
produced impacts on magnitudes of nutrient loads. Presence and absence scenarios clearly
supported the hypothesis that multiple dam reservoirs in the Kase River watershed reduce N and
P river exports. Average annual river export of TN over the time period 2008-2009 was lower by
9.18 % when Hokuzan dam reservoir and Kase River reservoir were made in the watershed, and
became lower by 5.64 % when Kase River dam reservoir was added from only Hokuzan dam
reservoir exist in the watershed. Average annual TP export in 2008-2009 decrease by 11.31 %
when Hokuzan dam and Kase dam exist in the watershed and a decrease of 8.03 % when Kase
River dam was added from only Hokuzan dam condition. Dams can act as a positive ecological
agent by holding back the sediment that contain nutrient which can harmful the downstream area.
The SWAT model simulation between 2000 and 2010 indicated that various potential
landuse sources exist within the Kase River Dam area. Considering the total loading of
pollutants to Kase River Dam, the potential contributions of tributary must be considered. The
tributary loadings are related to landuse activities that occur in the watershed, include
agricultural, forest and urban area. The greatest pollutant transport of TN and TP into tributary
streams occurs in the Hokuzan Fork area. The Hokuzan Fork area is the big contributor of
nutrients to its stream reaches in the Kase River Dam, simply because of its large size (55 % of
total watershed area). The transport of nutrients to stream reaches is much lower in the Nakahara
Fork area with TN 8319.13 kg and TP 580.75 kg respectively. Subwatersheds 6, 7 and
subwatershed 8, which inside the Nakahara Fork contribute relatively little to their respective
stream reaches. The outcome shows that the greatest sources of pollutant transport to stream
reaches are from Rice field and Forest Mix, which dominate the Kase River Dam watershed.
Page 132
Cindy Jeane Supit Page 118
Rice field is seen to contribute significant amounts of all nutrients to stream reaches; this is due
to the agricultural activity from this landuse.
Managing water resources is an important research topic in the integrated basin
management and will provide a new approach to water environment improvement. In this
study, the water management operation of dams done with the SWAT model. The simulation
for managing water resources was done by adjusting the minimum outflow rate in reservoir
module and read into SWAT. By the scenario for uncontrolled dam minimum outflow rate, the
water resources quantity was not satisfied along the years. By scenario analysis for controlled
the minimum outflow rate from Hokuzan dam and Kase River dam, the water resources quantity
improved and satisfied the demand water of 5 m3/s for preventing eutrophication at the creek
network downstream area and also 18.6 m3/s for agriculture purpose after the implementation of
water management operation of dams.
It will propose in Kase River Catchment in Saga, Japan. Although this paper still a
preliminary study, and the results were not very satisfying due to limitations in available
observation data, this model provides technical support and reference for water resources
operation of dams and will be a very useful method for future integrated basin
improvement.
8.2 SUGGESTIONS
Some issues still need to be addressed for better assessment of dam reservoir impacts.
Coupling the SWAT model and a hydrodynamics model inside the reservoir to solve the
dissolution problem from mud sediment in the reservoir which may affect water quality in
downstream should be done in the next step. More effort should be invested in the analyses for
better optimizing the water resources in the future. This will provide necessary data to extract the
real improvement for sustainability of water use.
Page 133
Cindy Jeane Supit Page 119
REFERENCES
1. Arnold, J.G., Srinivasan, R., Muttiah, R.S., Williams, J.R., 1998. Large area hydrologic
modeling and assessment – Part 1: model development. Journal of the American Water
Resources Association 34 (1), 73–89.2) 1998
2. Bartholow JM, Campbell SG, Flug M. Predicting the thermal effects of dam removal on the
Klamath River [J]. Environmental Management, 2004
3. Berkamp G, McCartney M, Dugan P, et al. Dams, ecosystem functions and environmental
restoration, WCD thematic review environmental issues II.1. Cape Town: the World
Commission on Dams, 2000.
4. Bednarek AT. Undamming rivers: a review of the ecological impacts of dam removal.
Environmental Management, 2001
5. Hayes, D. F.,Labadie, J. W. & Sanders,T. G..Enhancing water quality in hydropower
system operations. Water Resources Research, 1998
6. Horne BD, Rutherford ES, Wehrly KE. Simulating effects of hydro-dam alteration on
thermal regime and wild steelhead recruitment in a stable-flow Lake Michigan tributary.
River Research and Applications, 20 (2): 185-203. 2004
7. Japan Commission on Large Dams. Dams in Japan: Past, Present and Future. The
Nederlands: CRC Press, 2009.
8. Nash, J.E., Sutcliffe, J.V., River flow forecasting through conceptual models: Part 1 – a
discussion of principles. Journal of Hydrology 10 (3), 282–290. 1970.
9. National Land Survey Division, Land and Water Bureau of Ministry of Land, Infrastructure,
Transport and Tourism (2007), http://tochi.mlit.go.jp/tockok/index.html
10. Neitsch, S.L., Arnold, J.G., Kiniry, J.R., Williams, J.R. King, K.W. Soil and Water
Assessment Tool Theoretical Documentation: Version 2000. Agricultural Research
Service, Temple, Texas, 2002.
11. Nislow KH, Magilligan FJ, Fassnacht H, Bechtel D, Ruesink A. Effects of dam
impoundment on the flood regime of natural floodplain communities in the upper
Connecticut river. J Am Water Resour Assoc 38(6):1533–1548. 2002
12. Somura. H, Hoffman.D, Arnold. J, Application of the SWAT Model to the Hii River Basin,
Shimane Prefecture, Japan, 4th International SWAT Conference.2009
Page 134
Cindy Jeane Supit Page 120
13. Supit C, Ohgushi K, Prediction of dam construction impacts on annual and peak flow rates
in Kase River Basin. Annual Journal of Hydraulic Engineering, JSCE, Vol.56, 2012
14. Xia J, Wang ZG, et al. An integrated assessment method of water quality & quantity applied
to evaluation of available water resources. Journal of Natural Resources, 2005
15. Yang T, Zhang Q, Chen YD, Tao X, Xu CY, Chen X. A spatial assessment of hydrologic
alteration caused by dam construction in the middle and lower Yellow River, China.
Hydrol Process 22(18):3829–3843. 2008
16. Brown, L.C., Barnwell, T.O., 1987. The Enhanced Water Quality Models QUAL2E and
QUAL2E-UNCAS Documentation and User Manual. EPA/600/3-87/007, USEPA.
17. Moriasi, D.N. et al, 2007. Model evaluation guidelines for systematic quantification of
accuracy in watershed simulations. Transactions of the Asabe 50 (3), 885–900.
18. Santhi, C. et al, 2001. Validation of the SWAT model on a large river basin with point and
nonpoint sources. Journal of the American Water Resources Association 37 (5), 1169–1188.
19. Smith, D.R., Haggard, B.E., Warnemuende, E.A., Huang, C., 2005. Sediment phosphorus
dynamics for three tile fed drainage ditches in Northeast Indiana. Agricultural Water
Management
20. Webster, J.R. et al, 2003. Factors affecting ammonium uptake in streams – an inter-biome
perspective. Freshwater Biology 48 (8), 1329–1352.
21. USDA Soil Conservation Service. 1983. National Engineering Handbook Section 4
Hydrology, Chapter 19.
22. Green, W.H. and G.A. Ampt. 1911. Studies on soil physics, 1. The flow of air and water
through soils. Journal of Agricultural Sciences 4:11-24.
23. Williams, J.R. and R.W. Hann. 1972. HYMO, a problem-oriented computer language for
building hydrologic models. Water Resour. Res. 8(1):79-85
24. Williams, J.R. and R.W. Hann. 1978. Optimal operation of large agricultural watersheds
with water quality constraints. Texas Water Resources Institute, Texas A&M Univ., Tech.
Rept. No. 96.
25. McElroy, A.D., S.Y. Chiu, J.W. Nebgen, A. Aleti, and F.W. Bennett. 1976. Loading
functions for assessment of water pollution from nonpoint sources. EPA document EPA
600/2-76-151. USEPA, Athens, GA.
26. Chapra, S.C. 1997. Surface water-quality modeling. McGraw-Hill, Boston.
Page 135
Cindy Jeane Supit Page 121
27. Goldman, H.L. and A.J. Horne, Limnology, Mc-Graw Hill, New York, 1983.
28. Williams, G.P., and M.G. Wolman, Downstream effects of dams in alluvial rivers, US
Geological Survey, Professional Paper, 1286, 1984.
29. Petts, G.E., Impounded Rivers: Perspectives for Ecological Management, John Wiley and
Sons, New York, 1984.
30. Kondolf, G.M., and W.V.G. Matthews, Management of coarse sediment in regulated rivers
of California. University of California Water Resources Center, Riverside, Report
No.80,1993.
31. Moore, C.M., Effects of small structures on peak flows, in: Moore W.L. and C.W. Morgan,
Effects of Watershed Changes on Streamflow, University of Texas Press, Austin, 101-117,
1969.
32. Morris, G.L. and J. Fan, Reservoir Sedimentation Handbook, McGraw-Hill, New York, 1997.
33. Collier, M., R.H. Webb, and J.C. Schmidt, Dams and rivers: a primer on the downstream
effects of dams. US Geological Survey Circular 1126, 94 pp, 1996.
34. Alexander, R.B., Elliott, A.H., Shankar, U., McBride, G.B. Estimating the sources and
transport of nutrients in the Waikato River Basin, New Zealand. Water Resources Research
38, 2002
35. Dixit, A.S., Hall, R.I., Leavitt, P.R., Quinlan, R., Smol, J.P. Effects of sequential
depositional basins on lake response to urban and agricultural pollution: a palaeoecological
analysis of the Qu’Appelle Valley, Saskatchewan, Canada. Freshwater Biology, 2000.
36. Ejsmontkarabin, J., Weglenska, T., Wisniewski, R.J. The effect of water-flow rate on
zooplankton and its role in phosphorus cycling in small impoundments. Water Science
and Technology, 1993
37. Kling, G.W., Kipphut, G.W, Miller, M.M., O’Brien, W.J., 2000. Integration of lakes
and streams in a landscape perspective: the importance of material processing on spacial
patterns and temporal coherence. Freshwater Biology , 2000.
38. Maurer, W.R., Claflin, T.O., Rada, R.G., Rogala, J.T. Volume loss and mass-balance for
selected physicochemical constituents, Regulated River, 1995.
39. Stanley, E.H., Doyle, M.W. A geomorphic perspective on nutrient retention following dam
removal. Bioscience, 2002.
40. Lal R., Stewart B. A. (1994), Soil processes and Water Quality: CRC Press Inc.
Page 136
Cindy Jeane Supit Page 122
41. Babel, M. S., Najim, M. M. M. and R. Loof (2004). “Assessment of AGNPS for a
Watershed in Tropical Environment”, Journal of Environmental Engineering,
ASCE.130(9), 1032-1041.
42. Johnson M. S., Coon W. F., Mehta V. K., Steenhuisa T. S., Brooks E. S., Boll J.
(2003).Application of two hydrologic models with different runoff mechanisms to a hillslope
dominated watershed in the northeastern US: a comparison of HSPF and SMR. Journal of
Hydrology, 284, 57–76
43. Byne W. (2000), Predicting sediment detachment and channel scour in the process-based
planning model ANSWERS-2000. Master Thesis. Virginia Polytechnic Institute and State
University
44. Nietsch S.L., Arnold J.G; and Srinivasan R.(2005), SWAT (Soil and Water Assessment
Tool) User Manual
45. Winchell. M., Arnold, J.G., and Srinivasan R . Soil and Water Assessment Tool User`s
Guide. Agricultural Research Service, Temple, Texas, 2007.
46. USDA Soil Conservation Service.. National Engineering Handbook Section 4 Hydrology,
1972.
47. Miyake, Y., Akiyama, T.(2011). Impacts of water storage dams on substrate characteristics
and stream invertebrate assemblages. Journal of Hydro-environment Research 6 (2012)
137-144.
48. Koga, K. and team. A Summary of the Report by the Meeting for the Study of Water
Circulation and Conservation in Saga Region. (2000).
49. Yoshioka T. Water reuse and recycling for irrigation for diversified cropping
system.Extension bulletin 546. (2004).
50. Masaki, H and Miyachi Y, Synthetic study of facilities for water resources development in
Saga Plain. (2012).
51. Murakuni S, Water Resources Management in Japan. Policy, Institutional and Legal Issues,
World Bank Analytical and Advisory Assistance program. (2006).
52. Narumol V, Integrated water quality analysis for water management in the chikugo basin
and the Ariake Sea. (2004).
Page 137
Cindy Jeane Supit Page 123
APPENDIX A
LAND COVER PARAMETER
FOREST EVERGREEN
Page 138
Cindy Jeane Supit Page 124
ORCHARD
Page 139
Cindy Jeane Supit Page 125
PASTURE
Page 140
Cindy Jeane Supit Page 126
FOREST MIXED
Page 141
Cindy Jeane Supit Page 127
SUMMER PASTURE
Page 142
Cindy Jeane Supit Page 128
WATER
Page 143
Cindy Jeane Supit Page 129
WETLAND FORESTED
Page 144
Cindy Jeane Supit Page 130
WETLANDS NON FORESTED
Page 145
Cindy Jeane Supit Page 131
APPENDIX B
SOIL COMPONENT PARAMETERS
BROWN FOREST SOIL
Page 146
Cindy Jeane Supit Page 132
CLAY
Page 147
Cindy Jeane Supit Page 133
COARSE GRAY LOWLAND
Page 148
Cindy Jeane Supit Page 134
DRY BROWN FOREST
Page 149
Cindy Jeane Supit Page 135
FINE GLEY
Page 150
Cindy Jeane Supit Page 136
GRAY LOWLAND
Page 151
Cindy Jeane Supit Page 137
GRAY LOWLAND FINE
Page 152
Cindy Jeane Supit Page 138
IMMATURE SOIL
Page 153
Cindy Jeane Supit Page 139
LITHOSOLS
Page 154
Cindy Jeane Supit Page 140
YELLOW BROWN FOREST
Page 155
Cindy Jeane Supit Page 141
YELLOW DRY BROWN FOREST
Page 156
Cindy Jeane Supit Page 142
YELLOW SOIL