40
1 Intro to Financial Management of the Organisation Week 3 Analysing and interpreting financial statements

1
Intro to Financial Management of the Organisation
Week 3Analysing and interpreting
financial statements

2
Two out of Three Balance Sheet Records financial position of the
company/business Where wealth is stored At one point in time
Profit & Loss Account Records value of sales generated over the period Records value of business expenditure incurred How wealth is created Covers a reporting period (usually 1 year)

3
Qualifications
Profit is not the same as cash Lots of sales on credit = Large
profit But also lots of bills/liabilities Bills require cash If no cash can’t pay bills Overtrading can equal insolvency

4
Solvency
The financial ability to pay debts when they become due.
The solvency of a company tells an investor whether a company can pay its debts
5
Impact on Financial Reporting
Cash Flow Statements
Ratio Analysis

6
Cash Flow Statement Financial document detailing the exchange of cash
between a business and the outside world The flow is categorized as:
flow "in" from Operations(cash the company made by selling goods and services)
flow "in" from Financing(cash the company raised by selling stocks and bonds)
flow "out" to Investing(cash the company spent investing in its future growth)
7
Cash Flow Statement Each of these flows can actually flow
both ways. Investors like to see that the company
can cover its spending with cash from operations, without having to turn to financing.
The cash flow statement also has to reconcile the net effect of these flows with the difference in its cash holdings at the beginning and end dates of the reporting period

8
Financial Reporting Standard 1 Introduced 1991 – Revised November 1997 Objectives Report the cash generation and cash
absorption for a period by highlighting the significant components of cash flow in a way that facilitates comparison with the cash flow performance of different businesses
To assist in assessment of
Liquidity Solvency Financial adaptability

9
Somerfield’s CFS y/e 28/4/2001

10
Bank Balances 2000 & 2001
238.3 – 130.1 = 108.2
So it reconciles!

11
Mechanics of Cash Flow Statements
Methods of Calculation Direct Indirect
Both are addressed in 2 parts Net cash flows from operations Cash flows from all other sources Operating activities are the trading activities of the
company So does this mean that the operating profit (or
loss) that a company reports is equivalent to the cash flow from operations?

12
Somerfield – operating loss
13
Mechanics of Cash Flow Statements
As profit is not the same as cash, then No.
We need to establish just what the cash inflow from operations is

14
Direct method OPERATING ACTIVITIES
CASH RECEIVED FROM CUSTOMERS XXX CASH PAID TO SUPPLIERS (XXX) CASH PAID TO AND ON BEHALF OF EMPLOYEES (XXX) OTHER CASH PAYMENTS (XXX) NET CASH INFLOW/(OUTFLOW) FROM OPERATING ACTIVITIES XXX

15
Indirect method OPERATING ACTIVITIES OPERATING PROFIT XXX DEPRECIATION CHARGES XXX LOSS FROM SALE OF TANGIBLE FIXED ASSETS XXX PROFIT FROM SALE OF (XXX) TANGIBLE FIXED ASSETS INCREASE / DECREASE IN STOCKS (XXX) / XXX INCREASE / DECREASE IN DEBTORS (XXX) / XXX INCREASE / DECREASE IN CREDITORS XXX / (XXX)
NET CASH INFLOW/(OUTFLOW) FROM OPERATING ACTIVITIES XXX / (XXX)

16
Mechanics of Cash Flow Statements
The direct method would be totally accurate
It shows the specific sources of operating cash receipts and payments which may be useful in assessing future cash flows
The indirect method is by far the more common
It highlights differences between operating profit and net cash flows from operating activities

17
The mechanics in practice
Hound Ltd
18
Review The cash flow statement : Uses information contained in the other two
statements rearranged to provide an insight into the flow of cash through the business over the course of the year.
Reconciles this movement to changes in the cash position of the business
It helps users understand how a business has generated its cash where it has applied it provides a basis for appraising the future
solvency of the business

19
Ratios Mathematical formulae that simplify
financial information for the non-financial specialist whose responsibility is to understand, analyse, and act upon reported financial information
Advantages of ratios Trends Comparison Extrapolation

20
Liquidity Ratios Current ratio Current assets Current liabilities Means : There are sufficient current assets to cover
current Liabilities as they fall due
Acid test ratio Current assets (less stock) Current liabilities Means : Coverage of current liabilities by “liquid”
assets
Ratios are often expressed as percentages Liquidity ratios usually are not

21
Somerfield BS extract

22
2001 liquidity ratios for Somerfield
Current ratio 576.4 = 1 : 0.88 651.6 Quick (acid test) ratio 576.4 – 329.9 = 1 : 0.38 651.6
In short for every £1 of current liabilities (bills to be paid) Somerfield has 88p of assets to pay them with!
As stock takes a while to convert to cash If we ignore that then Somerfield has only 38p of “liquid”
assets to pay every £1 of short term liabilities. Is this desperate?

23
Tesco 2003

24
Tesco 2003 liquidity ratios
Current ratio 2440 = 1 : 0.45 5372 Quick (acid test) ratio 2440 – 1140 = 1 : 0.24 5372

25
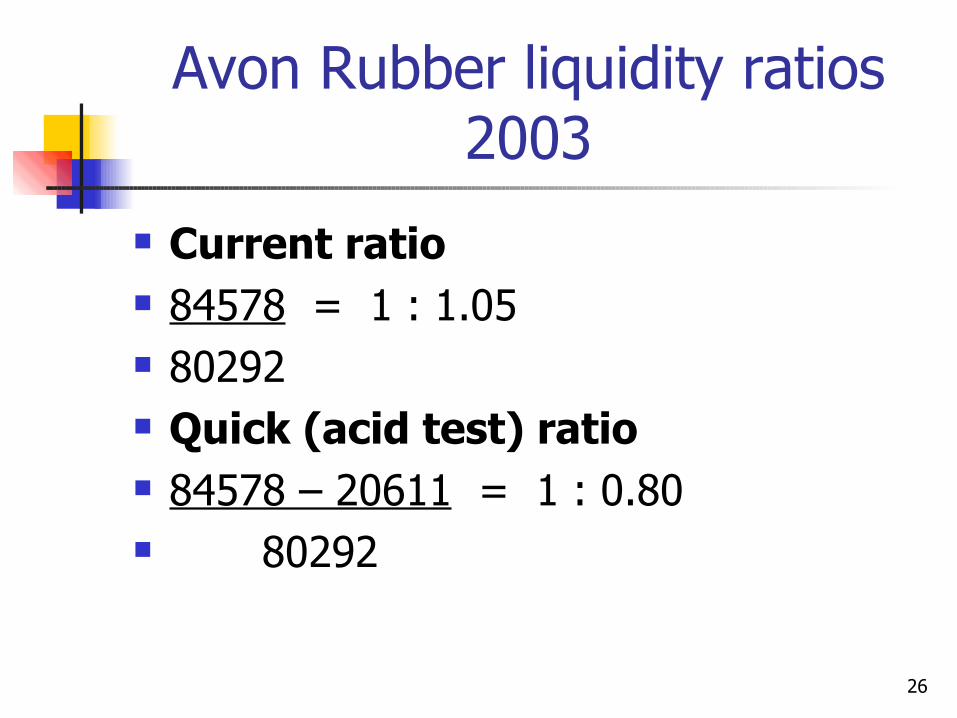
Avon Rubber plc 2003
26
Avon Rubber liquidity ratios 2003
Current ratio 84578 = 1 : 1.05 80292 Quick (acid test) ratio 84578 – 20611 = 1 : 0.80 80292

27
Conclusions Somerfield not that bad Industry type is important – “average” ratios
will vary depending on the type of business The size of a business is made irrelevant as we
are not interested in total figures in the accounts but the relationship between one part of the accounts and another
The numbers on the face of the accounts can tell us some things but
We need techniques to supplement this information
Think who are these accounts aimed at?

28
Conclusions
These ratios would be important to Suppliers – can they pay me? Lenders – can they pay interest?
Why do they want a loan? Employees – is my job safe? Competitors – benchmarks and
comparisons

29
Do ratios give you the full story? Well, no but they provide another dimension. Also its how you INTERPRET them.
Levels of interpretation (from essay experience)
(1) Calculated ratios (2) 1 and said this is good/bad (3) 1 & 2 and compared over time or to
competitor/industry average (4) All the above and provided explanation of
WHY changes have occurred

30
Level 4 example – general Gross Profit Margin Gross profit X 100 Sales Means : Difference between sales and cost
of sales and therefore profitability in buying or producing and selling goods.
There are a range of potential reasons why the gross profit margin might change….

31
Level 4 example – specific Changes in ratios could point to all sorts of
things going on under the surface Chaiman’s statement Executives’ reviews Notes to the accounts Can all provide a source of information to help
interpret the results of ratios Hence “ratio analysis” Financial press and the internet can also
provide up to date information to support analysis

32
Stock turnover period Average stock held X 365 Cost of sales Means : The average time stock is being
kept for. What’s Hot : The shorter time, the better. Means less funds being tied up
in stock. Note often the average stock is not used but
simply the stock figure in the balance sheet

33
Somerfield Stock & Cost of Sales
Stock in Balance Sheet 2000 – 372.6 2001 – 329.9
Cost of Sales from P&L 2000 – 5415.5 2001 – 4523.5

34
Applying the ratios
2001 4523.5 = 13.7 times in the year 329.9 2000 5415.5 = 14.5 times in the year 372.6

35
Diagnosis
Clearly deteriorating Why? Is management aware? Are they doing anything about it?

36
Prognosis Stock availability
When basic items are not available on the shelves, it is frustrating for any shopper. For Kwik Save’s target market, who keep relatively small stocks at home, it is particularly frustrating and encourages them to shop elsewhere. We have sharply increased the availability of everyday and promotional items through improvements in distribution and stores’ internal replenishment procedures.
During October, we reappraised the frozen food lines that we stock, simplifying the offer to ensure high availability and good presentation for the most popular products. This worked well, and we are now applying the same principles elsewhere in the store – making ranges simpler and more disciplined while still providing the choice that today’s consumers require.
We are also increasing the focus on brands, taking Kwik Save back to its roots by offering the biggest brands at lowest prices.
To give customers a lower-cost choice we have been offering Somerfield own-label products, but this has confused many customers. We are phasing this policy out, replacing all Somerfield lines with value alternatives by this Autumn.

37
Prognosis Investing behind the scenes We are investing in our IT and distribution systems to achieve
higher availability and service to stores at lower cost.
Our IT strategy is to simplify and clarify our systems – focusing investment initially on updating our distribution and Kwik Save store systems. By June this year, all Kwik Save units were linked into our store IT system.
During the year we opened a completely rebuilt and enlarged distribution depot near York. The depot is over 500,000 sq ft in size and handles ambient, chilled and frozen products. It is operated by an outsourced logistics specialist. The new year will see the increasing use of multi-temperature vehicles, significantly increasing both depot and store productivity. In the South West we outsourced some of our logistics operations, ensuring that staff transferred to the outsourcing organisations on equivalent terms.

38
Did it work?
Calculating ratios for the next 2 years
2002 report – 13.9 times per year 2003 report – 15.6 times per year
39
None the wiser, but better informed
Well that’s great I’m glad I came along. Most text books give you formulae for
ratios, right? So all I need is a list of formulae (like
the one helpfully attached to the handout), a balance sheet and a P&L account and away I go?
Not quite……

40
Some terms in the text books aren’t found in published accounts
Book - Sales Accounts - Turnover or sometimes retailers use sales to mean
turnover including VAT, then show turnover. You want turnover.
Book - Credit sales/credit purchases Accounts - Not reported – use turnover or purchases Hang about, I can’t find “purchases” True, it might not be there, use cost of sales??!! Hang about, I can’t find cost of sales either… Look in the notes. Against almost every line in BS and P&L there is a note
number. Always look to the notes for more explanation Eg In BS creditors – you will need “trade creditors” which is just
one class of creditors The detail will be in the notes


