WELCOME The South Florida GIS Expo is an annual conference sponsored by the Palm Beach Countywide GIS Forum. The South Florida GIS Expo serves as a way to foster collaboraon, GIS coordinaon, networking, educaon and training for the rapidly expanding professional GIS Community in the South Florida Region. The 2012 South Florida GIS Expo represents our 19th year of organizing and facilitang this regional GIS conference. South Florida GIS Expo Commiee 2012 South Florida GIS Expo October 11th - 12th, 2012 Palm Beach County Convenon Center 650 Okeechobee Boulevard West Palm Beach, FL 33401 Phone:(561) 366-3000 Fax:(561) 366-3001
Transcript
WELCOME
The South Florida GIS Expo is an annual conference sponsored by the Palm Beach Countywide GIS Forum. The South Florida GIS Expo serves as a way to foster collaboration, GIS coordination, networking, education and training for the rapidly expanding professional GIS Community in the South Florida Region. The 2012 South Florida GIS Expo represents our 19th year of organizing and facilitating this regional GIS conference.
South Florida GIS Expo Committee2012 South Florida GIS Expo
October 11th - 12th, 2012Palm Beach County Convention Center
650 Okeechobee BoulevardWest Palm Beach, FL 33401
Phone:(561) 366-3000 Fax:(561) 366-3001
2
SPECIAL ACTIVITIES
Registration - Thursday ( 7:30 a.m to 4:00 p.m. ) Friday ( 8:00 a.m. to 3:00 p.m. )
Continental Breakfast - Thursday ( 7:30 a.m. to 8:15 a.m.) Friday ( 8:00 a.m. to 8:30 a.m. )
Exhibit Hall* - Thursday ( 12:00 p.m. to 5:00 p.m.) Friday ( 8:00 a.m. to 3:30 p.m.)
Lunch - Thursday ( 12:30 p.m. to 2:00 p.m. ) Friday ( 12:00 p.m. to 1:00 p.m. ) Light lunch available in the Exhibit Hall
Job Board - Thursday and Friday ( 9:00 a.m. to 4:00 p.m. ) Resumes and vacancies can be posted on the Job Board in the Foyer by Registration.
Poster Exhibits - Thursday and Friday Categories for posters to be displayed throughout the Expo include Best Project Presentation, Best Analytical Presentation and Student Poster. Judging of posters will take place Thursday between 4:00 and 5:00 p.m. Winners will be announced at the Friday 9:30 a.m. break.
There will also be a separate Best of Show Poster voted on by Conference attendees and announced at the afternoon break on Friday.
* Note: The Exhibit Hall will open for exhibitor set-up only on Thursday from 7:30 a.m. until 11:30 p.m.
3
7:30 8:15 8:30 9:45 12:30 2:00 3:15 4:15 5:00
Room 2A
Reg
istr
atio
n O
pens
/ C
ontin
enta
l Bre
akfa
stW
elco
me
Key
note
Exih
ibit
Hal
l Ope
ns /
Lunc
h in
the
Exih
ibit
Hal
l
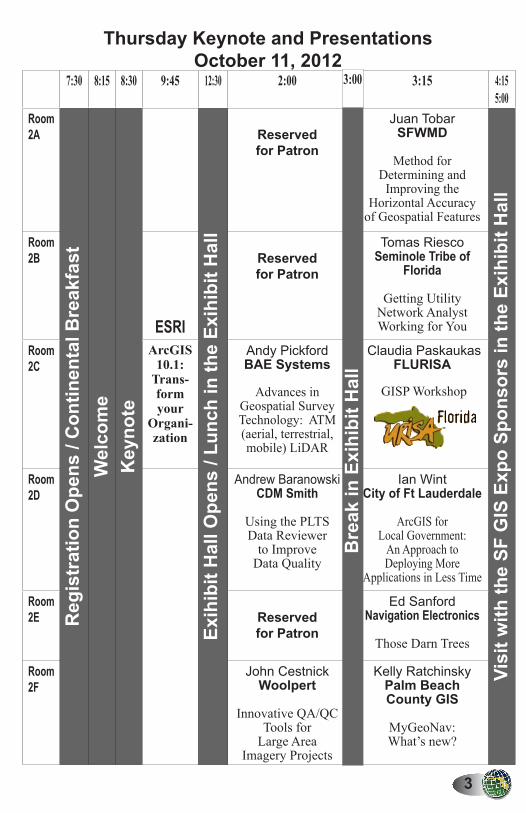
Reservedfor Patron
Juan TobarSFWMD
Method for
Determining and Improving the
Horizontal Accuracy of Geospatial Features
Visi
t with
the
SF G
IS E
xpo
Spon
sors
in th
e Ex
ihib
it H
all
Room 2B
ESRI
Reservedfor Patron
Tomas RiescoSeminole Tribe of
Florida
Getting Utility Network Analyst Working for You
Room 2C
ArcGIS 10.1:
Trans-form your
Organi-zation
Andy PickfordBAE Systems
Advances in Geospatial Survey Technology: ATM (aerial, terrestrial, mobile) LiDAR
Claudia PaskaukasFLURISA
GISP Workshop
Room 2D
Andrew BaranowskiCDM Smith
Using the PLTS Data Reviewer
to Improve Data Quality
Ian WintCity of Ft Lauderdale
ArcGIS for Local Government:
An Approach to Deploying More
Applications in Less Time
Room 2E Reserved
for Patron
Ed SanfordNavigation Electronics
Those Darn Trees
Room 2F
John CestnickWoolpert
Innovative QA/QC Tools for
Large Area Imagery Projects
Kelly RatchinskyPalm Beach County GIS
MyGeoNav: What’s new?
Thursday Keynote and PresentationsOctober 11, 2012
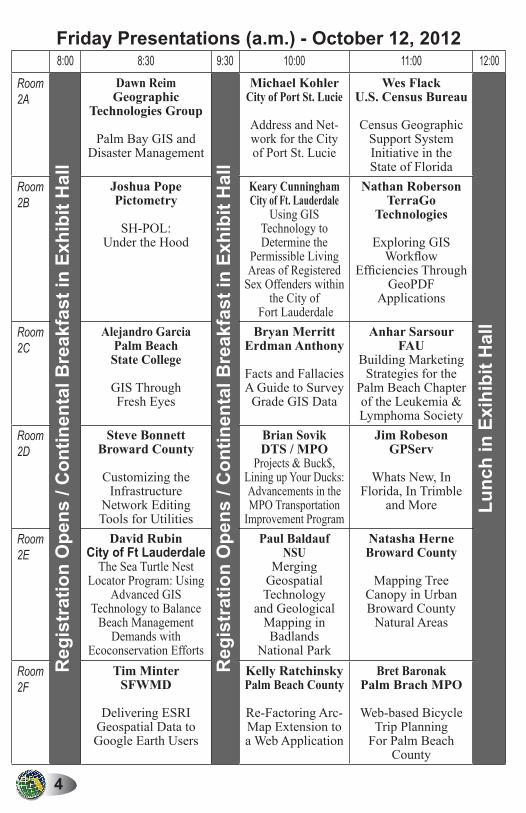
Address and Net-work for the City of Port St. Lucie
Wes FlackU.S. Census Bureau
Census Geographic Support System Initiative in the State of Florida
Lunc
h in
Exi
hibi
t Hal
l
Room 2B
Joshua PopePictometry
SH-POL: Under the Hood
Keary CunninghamCity of Ft. Lauderdale
Using GIS Technology to Determine the
Permissible Living Areas of Registered
Sex Offenders within the City of
Fort Lauderdale
Nathan RobersonTerraGo
Technologies
Exploring GIS Workflow
Efficiencies Through GeoPDF
Applications
Room 2C
Alejandro GarciaPalm Beach State College
GIS Through Fresh Eyes
Bryan MerrittErdman Anthony
Facts and Fallacies A Guide to Survey
Grade GIS Data
Anhar Sarsour FAU
Building Marketing Strategies for the
Palm Beach Chapter of the Leukemia & Lymphoma Society
Room 2D
Steve BonnettBroward County
Customizing the Infrastructure
Network Editing Tools for Utilities
Brian SovikDTS / MPO
Projects & Buck$, Lining up Your Ducks: Advancements in the MPO Transportation
Improvement Program
Jim RobesonGPServ
Whats New, In Florida, In Trimble
and More
Room 2E
David RubinCity of Ft Lauderdale
The Sea Turtle Nest Locator Program: Using
Advanced GIS Technology to Balance
Beach Management Demands with
Ecoconservation Efforts
Paul BaldaufNSU
Merging Geospatial Technology
and Geological Mapping in Badlands
National Park
Natasha HerneBroward County
Mapping Tree Canopy in Urban Broward County
Natural Areas
Room 2F
Tim MinterSFWMD
Delivering ESRI Geospatial Data to Google Earth Users
Kelly Ratchinsky Palm Beach County
Re-Factoring Arc-Map Extension to a Web Application
Bret BaronakPalm Brach MPO
Web-based Bicycle Trip Planning
For Palm Beach County
5
Friday Presentations (p.m.) - October 12, 20121:00 2:00 3:00 3:30
Room 2A
David RafaidusPalm Beach County
GIS Mapping & Community Services
James BartonChen Moore
Florida Utility User Group
Bre
ak in
Exi
hibi
t Hal
l
Christine SchluterBruce Harris & Associates
Using 3-D Buildings to Enhance GIS Datasets
Room 2B
Tim Scharff City of Sunrise
Fire Station Service Area Analysis – GIS
Puts I.S. in ISO Review
Scott BurtonBroward Sheriff’s
Office
Leveraging &Extending the Reach
of eGIS for Public Safety
Antonios Marsellos University of Florida
A River Flood Study of the Mohawk River in New York Using GIS and LiDAR
Room 2C
Eric HouseholderOdessey
Geospatial/SFWMD
GIS Education through
Field Expeditions
FLURISA Meeting
FLURISA
GIS Karaoke
Room 2D
Curt HintonGTG
Crowd Sourcing and Citizen Engagement
Irene DeGrootTown of Davie
Town of Davie Embraces GIS
Technology
Heather VolmerCoastal Planning &
Engineering
Online GIS for Improved Project Management
Room 2E
Eudel CeperoFDOT District Six
Environmental Contamination
Screening Application (CSA)
Katie Lelis Broward County
GIS For Non-GIS - Creating Toolsets
for Managers Using Python and
ModelBuilder
Mark NelsonJones, Edmunds
& Associates
Water is Money WATR-IS
Room 2F
Craig RobinsonLattitude
Geographics Group
Using ‘Workflow Modeling’ for
Purpose Built Web GIS Solutions
Yao YanSFWMD
Geographically Weight Regression (GWR):
A Better Geostatistical Approach to Model Sediment Quality
of Lake Okeechobee
Hentong WeiMetric Engineering
Quick Develop and Build Cross-platform Native
Mobile GIS Apps
6
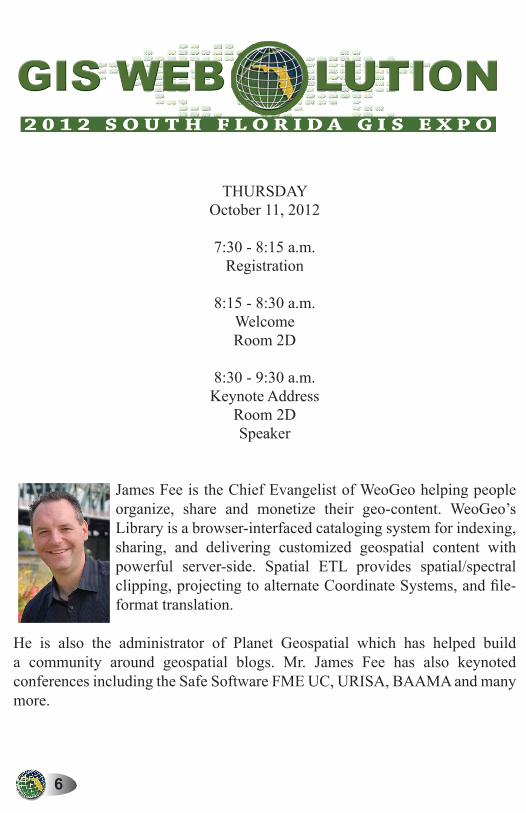
THURSDAYOctober 11, 2012
7:30 - 8:15 a.m.Registration
8:15 - 8:30 a.m.WelcomeRoom 2D
8:30 - 9:30 a.m.Keynote Address
Room 2DSpeaker
James Fee is the Chief Evangelist of WeoGeo helping people organize, share and monetize their geo-content. WeoGeo’s Library is a browser-interfaced cataloging system for indexing, sharing, and delivering customized geospatial content with powerful server-side. Spatial ETL provides spatial/spectral clipping, projecting to alternate Coordinate Systems, and file-format translation.
He is also the administrator of Planet Geospatial which has helped build a community around geospatial blogs. Mr. James Fee has also keynoted conferences including the Safe Software FME UC, URISA, BAAMA and many more.
ArcGIS continues to evolve and offer new ways for you to meet the needs of your organization. In this session, you will learn how the ArcGIS system at 10.1 helps you make the most of your GIS investment.
We will use some examples from South Florida to show how to use the ArcGIS system, especially ArcGIS Online, to spread the use of GIS in your organization and beyond.
Have you ever wondered about LiDAR data? Where it came from? How it is collected? How accurate it is? What to do with it? This session will hopefully answer these questions and more.
One of the fastest growing segments of the geospatial industry is obtaining as built digital data. We will discuss in this presentation the basics of collecting LiDAR digital data, from the air, the ground and from four wheels.
You will be brought through a quick review of the science behind LiDAR and the accuracies (or inaccuracies) of the data. Discussion will be centered around the different “tools in the tool box”, Aerial LiDAR, Terrestrial LiDAR and Mobile LiDAR, and how they can be used in combinations to provide the client the deliverable they desire.
10
October 11, 2012 2:00 p.m. – 3:00 p.m. (cont.)
Using PLTS to Improve Data QualityAndrew Baranowski, GISP, GIS Specialist – CDM SmithRoom 2D
The Production Line Toolset PLTS extension provides a suite of tools that increases the efficiency of the quality assurance process. This presentation will introduce you to the the PLTS Data Reviewer and how it can be used to facilitate Quality Assurance.The GIS Data Reviewer can be used to select a Random Sample Batch based on a specific level of quality for inspection.
These slides present the tools provided by the PLTS Data Reviewer to review the selected sample and document the results of the inspection. This presentation will also introduce the Reviewer Batch Job Manager tool and demonstrate how to set up batch QA checks to perform 100% automated checks for duplicate geometry, topology errors, geometry and attribute issues.
Reserved for PatronRoom 2E
Innovative QA/QC Tools for Large Area Imagery ProjectsJohn Cestnick, PSM, Surveyor & Mapper – Woolpert, Inc.Room 2F As a provider of digital aerial mapping services, Woolpert produces and delivers very large data sets to various clients across the nation. As the number of projects grew, and as the deliverable size of these projects grew, it became increasingly difficult to manage a properly coordinated QA/QC review with clients. From lessons learned, a more efficient method was needed to accelerate the QA/QC review process for these large area projects.
This presentation will focus on the challenges and the objectives of a properly defined QA/QC process. It will also discuss and demonstrate the technology and innovative approaches now being provided to clients to properly QA/QC large aerial datasets. SmartView Connect, a web-based QA/QC review application developed by Woolpert, will be demonstrated.
11
October 11, 2012 3:15 p.m. – 4:15 p.m.
A Method for Determining and Improving the Horizontal Accuracy of Geospatial FeaturesJuan Tobar, Science Supervisor – South Florida Water Management DistrictShakir Ahmed, Geographer - South Florida Water Management DistrictRoom 2A
Many data sets stewarded by geospatial professionals are spatially correlated derivatives of higher accuracy data sets such as parcels and road networks. This article documents the use of the Buffer-Overlay method of Goodchild and Hunter (1997) to determine and improve the horizontal accuracy of geospatial features.
The method relies on a comparison with a representation of higher accuracy, and estimates the percentage of the total length of the higher accuracy representation that is within a specified distance of the lower accuracy representation. The method is then extended using topological operators to extract and replace lower accuracy representations with those of higher accuracy.
Getting Utility Network Analyst Working for YouTomas Riesco, GIS Specialist – Seminole Tribe of FloridaRoom 2B
This presentation will demonstrate how the Seminole Tribe of Florida started from the ground up building its Utility data with emphasis on using Utility Network tools, out of the box functionality and the Add-Ins from ESRI for Water and Wastewater. With the use of these tools, the Seminole Tribe of Florida has been able to build a solid utility network on which smarter business decisions can be made.
ArcGIS for Local Government: An Approach to Deploying More Applications in Less TimeIan Wint - City of Fort LauderdaleRoom 2D
Many local governments face the challenge of delivering GIS services with limited staff amid budgetary constraints. A growing demand from the public to gain access to government information intensifies the challenges. Today’s constituents seek quick access to information on the web and on mobile devices. The City of Fort Lauderdale has embraced Esri’s templates as a solution to assist in overcoming this challenge. The ArcGIS for Local Government initiative, with its application templates and underlying database model, is central to this direction taken by Fort Lauderdale.
This presentation will take the audience through Fort Lauderdale’s experience implementing the ArcGIS for Local Government initiative. It builds on a previous presentation at Esri’s User Conference’s plenary session and one held at the Broward County GIS Users Group. It further explores recommended approaches to both application implementation and the adoption of the data model.
Those Darn TreesEd Sanford, Mapping Sales Representative - Navigation Electronics, IncRoom 2E Canopy is an ever-present challenge. GNSS capabilities have improved dramatically increasing our use of this amenity. To best manage your assets, you have to know what assets you have and where they are located. Can GNSS be effective under canopy? What kind of results would a user expect? Use of GNSS in asset inventory and resource mapping driven by improved tools for geospatial data management and also by economic drivers.
Funding woes have pressed both public and private entities to seek better manage-ment of existing assets as replacement cycles for infrastructure are getting longer. Come join us!
13
October 11, 2012 3:15 p.m. – 4:15 p.m. (cont.)
MyGeoNav: What’s new?Kelly Ratchinsky, Countywide GIS Coordinator – Palm Beach County ISS/GIS Service BureauRoom 2F
This presentation will recap what myGeoNav is, how it works, and then focus on some of the new functions and layers, like Census demographics, that have been added over the past year.
14
October 12, 2012 Presentations
8:30 - 9:30:00 a.m.
Palm Bay GIS and Disaster ManagementDawn Reim - Geographic Technologies GroupCrystal Phillips-Mustain, GIS Specilalist - Geographic Technologies GroupRoom 2A
In the event of a natural or man-made disaster, emergency management agencies must effectively utilize a wide range of toolsets in order to respond and recover. In recent years, no tool set has been more powerful than GIS. GIS applications have dramatically improved response efforts by allowing optimal visualization of the affected communities, all the while, streamlining the process of assessing damage and reporting to FEMA.
Palm Bay, Florida has implemented GIS tools to assist in disaster response, disaster recovery, and situational awareness. An Esri based Mobile Disaster Assessment and Recovery Tool (M-Dart) and a Command Center GIS (CCGIS) have both been implemented to assist the City in disaster preparedness and recovery. GIS solutions are a necessity for any FOC or EOC.
The mobility of GIS through MDART coupled with the geo-analytical tools of CCGIS offer Palm Bay situational awareness that’s both strategic and tactical.
SH-POL: Under the HoodJoshua Pope, Regional Technical Manager - PictometryCarl Decator, Regional Technical Manager - PictometryRoom 2B
Pictometry offers a Self-Hosted web application to deploy oblique imagery with GIS data via the web. The application has many uses and has been deployed in a wide range of environments. The management console is web based and is easily accessed causing the need for thick client installations and node management to evaporate. While the whole system is stored and driven via a database, not much is known why or how the data is stored in the tables.
This session will be an interactive session discussing the database and how setting s are stored. The session will also address tips and tricks for the management of SH-POL that are not available in the web interface.
15
October 12, 2012 Presentations
8:30 - 9:30:00 a.m. (cont.)
GIS Through Fresh EyesAlejandro Garcia - Palm Beach State CollegeCasey Reardon - Palm Beach State CollegeRoom 2C
My teammates and I are only beginning to learn about GIS. We would like to show our progress in this field through the individual projects each of us will be working on whether individually or in subgroups. These projects will range from environmental issues to other aspects of GIS.
Customizing the Infrastructure Network: Editing Tools for UtilitiesSteve Bonnett, GIS manager - Broward County Water/Wastewater ServicesRoom 2D
The Infrastructure Network Editing toolbars contain a series of custom editing and reporting tools that improve the editing experience for those who work with infrastructure data such as water and sewer systems. The tools include the following capabilities: automatically connect service meters, sewer cleanouts and hydrants to mains via service connections and laterals, isolate valves for water main breaks, and report tracing results along a utility network. It also includes an editor extension called the Attribute Assistant. The Attribute Assistant allows the editor to use a series of pre-defined methods to automatically populate attributes when updating and/or adding new features to the geodatabase.
Some examples are: extracting addresses from parcels when placing a point feature inside the parcel, populating the size of the valve when it is placed on a pipe, auto populating date fields, getting manhole IDs when a gravity main is snapped to it for upstream/downstream nodes, and automatically extracting X/Y coordinates when a point is placed on the map. This demonstration will show how these tools can be easily customized for your organization’s data model.
16
October 12, 2012 Presentations
8:30 - 9:30:00 a.m. (cont.)
The Sea Turtle Nest Locator Program: Using advanced GIS technology to Balance Beach Management Demands with Ecoconservation EffortsDavid Rubin, GISP - City of Fort LauderdaleRoom 2E
Many cities face the challenge of balancing the needs of protecting a tourist economy with the need to protect endangered ecosystems. Innovations in GIS have allowed for the integration of advanced technology and ecoconservation. In the past 4 years, the City of Fort Lauderdale, in partnership with Broward County, has developed a program model focused on balancing the efficacy of mechanical beach cleaning with the imperative to protect sea turtle nests. The Sea Turtle Nest Locator Program utilizes a Trimble GeoExplorer sub-meter GPS, ArcGIS Mobile, and ArcGIS Desktop to collect and analyze data used to identify and re-establish sea turtle nests in the event of natural or man-made disturbance.
The program has resulted in improved efficiency in mechanical beach cleaning and increased ecopreservation of sea turtle nests. Due to its success, the program model has been adopted by other beach cleaning services within Broward County and is being implemented in several municipalities. The presentation will explain the program model, give examples of how the model has been put into use on Fort Lauderdale Beach and describe the use of ArcGIS Mobile, and ArcGIS Desktop as tools in providing GIS services within beach management programs.
Delivering ESRI Geospatial Data to Google Earth UsersTim Minter, GIS Enterprise Architect - South Florida Water Management DistrictRoom 2F
When the South Florida Water Management District’s Assistant Executive Director said, “I want ePermitting customers to see what I see in Google Earth,” his Regulatory and Information Technology teams leapt into action. The District manages its geospatial data for enterprise discovery and use in its Enterprise GIS Data Library, a data warehousing system based on Esri technology and geospatial data formats. Available ArcGIS Server licensing enabled a solution design that minimized custom application development to deliver content from the existing data streams to external Google Earth users.
This presentation shares the story of what we did and how we did it. If you would like to experience the resulting solution prior to the presentation and participate with questions and discussion, then please visit http://my.sfwmd.gov/ePermitting; check out the Google Earth information in the “Did you know?’ section; and try out the system to see how it works.
17
October 12, 2012 Presentations
10:00 – 11:00 a.m.
Address and Network for the City of Port St. LucieMichael Kohler - City of Port St. LucieRoom 2A
The City of Port St. Lucie has been engaged in a year long project to create a street network and address database. The system can be used by many different applications and city functions to provide a standard level of accuracy and uniformity to address information, make it easier to maintain the database and to provide a network for analysis. The project involves matching address records from a SQL database to points in a GeoDatabase. Address points are also related to the parcel they are located in and to the street segment they fall upon. Tools have been developed to streamline workflows for establishing relationships between points and other features. Tools have also been created to assist in the population of the data needed to create a network and address locators.
A major improvement in the address management process was to create an ArcMap application to create, delete, modify, or produce reports on specific addresses. This application will be ported to the internet to allow city staff and residents to produce the required documents for permits and other address verification needs. This presentation will include design, development and implementation of this project.
Using GIS Technology to Determine the Permissible Living Areas of Registered Sex Offenders within the City of Fort LauderdaleKeary Cunningham - City of Fort LauderdaleAshok Verma, GISP, GIS Specialist - City of Fort LauderdaleRoom 2B
In 2005 the Florida Legislature passed the “Jessica Lunsford Act,” which strength-ened the State’s effort to control the threat of child sexual victimization. As a result, in 2007 the City of Fort Lauderdale also increased its control and passed an ordinance making it unlawful for any Registered Sexual Offenders and Sexual Predators from living within 1400 feet of any school where the majority of the students attending are less than 16 years of age, designated public school bus stops, child day care facilities, and parks.
In order to establish the permissible living areas for sex offenders, the City of Fort Lauderdale’s GIS Division developed several procedures to create, maintain, and disseminate GIS data to assist with the Fort Lauderdale Police Department’s enforcement efforts.
Ashok Verma and Keary Cunningham with the City of Fort Lauderdale’s GIS Division will discuss this project including how the evolution of GIS technology has greatly improved procedures over the past 5 years since the ordinance was passed.
18
October 12, 2012 Presentations
10:00 – 11:00 a.m. (cont.)
Facts and Fallacies – A Guide to Survey Grade GIS DataBryan Merritt, LS/PSM, Corporate Manager - Erdman AnthonyRoom 2C
Do you wonder how accurate (or inaccurate) survey grade data really is? Should you be comfortable with GPS vertical results you’re getting? Are you aware of the all the factors that affect GPS accuracy? Have you incorporated Survey Grade Data into your projects? So how does survey grade GIS data really help you, both spatially and in your pocket?
This session will answer these questions and more. We will explain some of the facts and fallacies of survey grade data. You will be brought through a quick review of the science behind GPS and the accuracies (or inaccuracies) of vertical data obtained with GPS. Our discussion will revolve around local RTK networks, the effects of atmosphere, multipath, geoids, equipment limitations and more.
We will follow this with a series of Case Studies that will show where accurate sur-vey data has been integrated into existing GIS databases for storm water modeling and planning purposes. The proper field methodologies for acquiring accurate verti-cal data will be discussed along with a review of vertical control and their respective error tolerances. The conclusion of the session will center around a Cost Benefit Analysis as well as the concept of unit pricing for data acquisition.
19
October 12, 2012 Presentations
10:00 – 11:00 a.m. (cont.)
Projects & Buck$, Lining up Your Ducks: Advancements in the MPO Transportation Improvement ProgramBrian Sovik, Director of GIS -Transportation Solutions - DTSRoom 2D
Metropolitan Planning Organizations must develop a Transportation Improvement Program (TIP): This entails the development of a fiscally-constrained program based on the long-range transportation plan designed to serve the area’s goals, using spending, regulating, operating, management and financial tools.
In 2011 an asynchronous, Internet-based, GIS enabled system for the TIP was launched for each Metropolitan Planning Organization (MPO) within Florida’s District 4 Region. This presentation will briefly cover the history and importance of the TIP. This presentation will include live demonstrations of the Palm Beach County MPO TIPVue Application. Capabilities to be shared include GIS, reports, document libraries, and the RSS feed.
20
October 12, 2012 Presentations
10:00 – 11:00 a.m. (cont.)
Merging Geospatial Technology and Geological Mapping in Badlands National Park Paul Baldauf, Ph.D., Associate Professor - Nova Southeastern UniversityEric Householder, Senior Scientist - South Florida Water Management DistrictRoom 2E
Presentation Overview:The goal of this study is to advance our understanding of the Geologic landscape development in the Badlands National Park, South Dakota through GIS-assisted analysis of landforms within the park. Although dominated by erosional features, numerous depositional features offer insights into recent changes in the region, including climate change. Depositional features include landslides, grass-covered sand dunes, loess deposits, cliff top eolian deposits, and sod tables. In this first phase of the project, using data gathered in three field seasons, we created a digital base map of Badlands National Park in ESRI’s ArcGIS using field gathered vector data and raster imagery. This project is part of a larger effort by Nova Southeastern University (NSU) to create research opportunities for undergraduate students. Related projects include volcanic hazards analysis in Banos, Ecuador and water quality investigations of the NSU campus in Davie, Florida.
Methods:Vector point, line and polygon data were gathered with the use of both Trimble and Garmin GPS units, together with field notes, drawings and hyperlinked digital images at specific landslide locations. After gathering and importing the field data, a geodatabase and specific feature classes were created and overlaid on high resolution imagery. Analysis was then performed on the layers to create distinct spatial and temporal boundaries based on geologic beds and historic activity. This state of the art digital map allows the map user greater access to spatial/ geologic information and interpretation of the field area than a traditional geologic map.
21
October 12, 2012 Presentations
10:00 – 11:00 a.m. (cont.)
Re-Factoring ArcMap Extension to a Web ApplicationKelly Ratchinsky, Countywide GIS Coordinator - Palm Beach County ISSNick Uhren - Palm Beach County EngineeringRoom 2F
We will go over our move from an ArcGIS 9.3 Extension to Web Application that utilizes a combination of web, ArcGIS Server and oracle technologies to manage both GIS and business data in an attempt to reduce dependencies on 3rd party software development lifecycles.
22
October 12, 2012 Presentations
11:00 a.m. – 12:00 p.m.
Census Geographic Support System Initiative in the State of Florida Wes Flack - U.S. Census BureauRoom 2A
The Census Bureau’s Geographic Support System Initiative (GSS-I) is an integrated program of improved address coverage, continual spatial feature updates, and enhanced quality assessment and measurement. A critical component of the GSS-I is our plan to engage in ongoing and continuous geographic data sharing partnerships with state, regional, and local governmental agencies. Our greatest challenge will be acquiring and processing address data received from thousands of local governments, and using that data to update the Census Bureau’s Master Address File and Topologically Integrated Geographic Encoding and Referencing System (MAF/TIGER) on an ongoing basis. We are currently developing new tools and processes to complete this work in a way that minimizes the burden on local governments.
A major goal of the GSS-I is to facilitate a targeted, rather than complete, address canvassing field operation for the 2020 Census, which will significantly reduce the cost of the Census. This presentation will provide an update on the implementation of the GSS-I, including the status of test counties in the state of Florida. We will also provide a review of new Census data products and tools that may be of interest to GIS professionals.
Geospatial information has become essential to many analysis and decision-making processes. As organizations place greater reliance on geospatial information, the need to share georeferenced maps, imagery, audio, video, geoforms, Web services and other information will continue to increase.
This presentation will highlight how any user, regardless of their level of training or access to sophisticated GIS, can to compactly integrate, share and dynamically up-date geospatial information in connected or offline environments through GeoPDF applications. Attendees will discover the latest tools to facilitate geospatial collabo-ration within the enterprise, between organizations and disparate systems, peer-to-peer, to the field and back.
This presentation will illustrate how anyone, anywhere can harness the power of geospatial information.
23
October 12, 2012 Presentations
11:00 a.m. – 12:00 p.m. (cont.)
Building Marketing Strategies for the Palm Beach Chapter of the Leukemia & Lymphoma Society Using GIS Technology Anhar Sarsour, Student- Florida Atlantic UniversityEric Llufrio, Student- Florida Atlantic UniversityRoom 2C
The Leukemia & Lymphoma Society (LLS) is the world’s largest voluntary health agency dedicated to curing blood cancer. The Palm Beach Chapter requested our assistance in organizing its membership data to help in advertising efforts. We concentrated on the LLS program - Team in Training (TNT) - the world’s largest endurance sports training program and the number one fundraising arm of LLS. Since TNT relies on participants to raise funds for their cause, our goal in this project was to assist LLS in enhancing the effectiveness of their advertising efforts using Geographic Information System (GIS) technology.
GIS is a helpful mapping tool that stores, manages, and analyzes geospatial data. LLS Excel spreadsheet membership data was linked to a second set of data in a GIS obtained from the Florida Geographic Data Library (FGDL) for the study area encompassing parts of Palm Beach, Martin, and St. Lucie counties. The two sets of data were linked using the common parameter of zip code numbers. ArcGIS was used to create fifteen GIS maps showing the geographical distribution of such parameters as the number of participants, percentage of participants to the total number of participants, median age, and mean income for each zip code. Color coding shows areas where (which zip codes) there are higher concentrations of participants, leads, etc., and the characteristics of the areas of high concentration. Selected analyses of the maps showed that simple marketing strategies could be constructed.
Whats New, In Florida, In Trimble and MoreJim Robeson - GPServ, Inc.Room 2D
Jim Robeson of GPServ, Inc. will provide updates on valuable changes in GPS/GNSS Networks in Florida, Datum’s changes and some insight into new direction for Trimble and ESRI products. We will discuss exciting news on the front of free services to all Floridians and new directions for GPS/GNSS and Trimble Navigation.
24
October 12, 2012 Presentations
11:00 a.m. – 12:00 p.m. (cont.)
Mapping Tree Canopy in Urban Broward County Natural AreasNatasha Herne, Natural Resource Specialist - Broward CountyRoom 2E
This presentation describes the use of both infrared imagery and LiDAR for the determination of tree canopy. Both technologies have challenges and limitations. Infrared imagery and Normalized Digital Vegetation Index (NDVI) captures the chlorophyll content of all live vegetation making it difficult to differentiate between canopy and understory. Additionally with this technology, dormant trees (with no leaves) like cypress stands are not included giving inaccurate estimates of the total tree canopy coverage. By combining NDVI with LiDAR the results of tree canopy coverage are better defined.
This presentation demonstrates the results of using both technologies to estimate the tree canopy cover for West Creek Pineland Nature Preserve as a pilot project for the computer based determination of fractional tree coverage for Urban Broward County.
Web-based Bicycle Trip Planning for Palm Beach CountyHenry Hochmair, Assistant Professor - University of FloridaBret Baronak, Senior Planner - Palm Beach MPORoom 2F
As part of overall non-motorized transportation planning efforts , and specifically to promote the use of bicycles as alternative means of transportation, Palm-Beach MPO funded the development of a Web-based trip planner for cyclists.
This online trip planner, which is developed within the ArcGIS Server environment using ESRI JavaScript API and the ArcGIS JavaScript extension for the Google Maps API, offers several routing options, including shortest, fastest, and simplest route.
The computations are achieved through the ArcGIS Network Analyst extension with customized turn tables and network data from NAVTEQ’s Navstreets dataset. This presentation demonstrates among others how restricted driving maneuvers (i.e., turn restrictions) and traffic lights were integrated into the routing algorithm and the Network dataset through ArcObjects programming. It also presents some of the Google mashup GIS functionality used, such as Street View, which is provided as a function to virtually follow the computed route. A live demonstration of the online bicycle trip planner will be given.
25
October 12, 2012 Presentations
1:00 – 2:00 p.m.
GIS Mapping & Community ServicesDavid Rafaidus, Senior Planner - Palm Beach County Dept. of Community ServicesChannell Wilkins, Director - Palm Beach County Dept. of Community ServicesRoom 2A
This presentation will describe how GIS will be used as one of the key components in assisting professionals within health & human services to leverage data with analysis so that staff can assess community needs, measure outcomes and deliver services more efficiently.
Discover how the Palm Beach County Department of Community Services collaborated with ISS to create a web page where staff can easily query, analyze, visualize and map community information.
Learn how social service administrators are implementing GIS as a tool to make in-formed decisions as demands for the provision and access to health and human service resources increase.
Understand why GIS is becoming more imperative for social service personnel to relate client data with geographic information, communicate with decisions makers and estab-lish priorities.
Fire Station Service Area Analysis – GIS Puts I.S. in ISO ReviewTim Scharff, GISP, GIS Manager - City of SunriseRoom 2B
Earlier this year, the Insurance Service Office (ISO) collected information and evaluated Sunrise Fire Rescue in an effort to rate the city’s fire fighting capability. The ISO rating is dependent on factors such as fire station distribution, firefighting apparatus and equipment, personnel, water supply, hydrant locations, and inspection and maintenance records for hydrants.
During the review process, ISO asked for maps showing 1.5- and 2.5-mile buffers around each fire station as the engine drives. GIS was used to perform service area analyses, helped put I.S. in the ISO review, and was a key part of the city receiving a class “2” rating.
26
October 12, 2012 Presentations
1:00 – 2:00 p.m. (cont.)
GIS Education through Field ExpeditionsEric Householder, Senior Scientist - South Florida Water Management DistrictJames Gammack Clark, Instructor - Florida Atlantic UniversityRoom 2C
This presentation will overview and highlight a unique way of teaching/learning GIS and Geospatial Technology using field expeditions. Students learn the basics of GIS/GPS and Remote Sensing along with field data collection and spatial analysis by applying what they learn immediately in such unique ecosystems as Rivers, Coral Reefs, Rainforests and Wetlands.
Odyssey Geospatial has held training expeditions in Belize, Costa Rica and most recently the Florida Keys and the Dry Tortugas.
Crowd Sourcing and Citizen EngagementCurt Hinton, GISP, CEO - Geographic Technologies GroupRoom 2D
As GIS professionals we have to stay on top of industry trends and demands from citizens. Citizens and their organizations are demanding transparency and applica-tions which allow citizen engagement and interactivity. This session will discuss some of the latest trends in the industry and showcase some of the latest tools. GIS centric tools for citizen engagement will be detailed to include 311 and Public Safety citizen engagement. These tools elevate a GIS program from the back room to the centerpiece of a government’s citizen outreach.
27
October 12, 2012 Presentations
1:00 – 2:00 p.m. (cont.)
Environmental Contamination Screening Application (CSA)Eudel Cepero, GIS Coordinator - Florida Department of TransportationAmit Hazra, Senior GIS Analyst - ATKINSRoom 2E
The CSA is a custom web-based application that streamlines the environmental Contamination Screening and drainage design coordination effort. The CSA enables FDOT District 6 environmental project managers, drainage engineers, and specialists to screen project corridors and drainage designs to determine contamination sites impacting projects; delineate any contaminated risk areas located within project limits, identify any proposed drainage structure(s) located within a contaminated risk area, identify and list the contaminated site(s) that will potentially need an Environmental Level II assessment, and generate dewatering permit radio map reports. Benefits of using the CSA:Provides an early awareness of any potential contamination concerns on the project corridor at any phase of the project
At a glance gives a visual snapshot of any potential contamination concerns on the project corridor
Saves time to research the current environmental status of each property that are listed as potential impacts to the project
Avoids project delays to designers and construction activities due to contamination concerns/assessment
Provides information of any area in the project corridor that has potential dewatering constraints/limitations if applying for a dewatering permit.
28
October 12, 2012 Presentations
1:00 – 2:00 p.m. (cont.)
Using ‘Workflow Modeling’ for Purpose Built Web GIS SolutionsCraig Robinson, Account Manager - Latitude Geographics Group Ltd.Room 2F
The traditional web-GIS viewer has had its place over the years in disseminat-ing GIS data within your organization and to public constituents. Although the web-GIS viewer will continue to serve end users well, an evolution is occurring in spatial data delivery architecture and user design that will change the way GIS/IT administrators deliver applications, tools, and data to their end users.
The purpose of this session is to explore a workflow based approach to building and delivering web-GIS applications that specifically caters to business process within your organization. It will also offer a perspective on trends seen in relation to ArcGIS Server and REST technology, and client side visualization technologies such as Flex, Silverlight, and HTML5. (All of which you may already be consider-ing within the bounds of your ArcGIS Server projects).
Latitude Geographics offers a COTS application framework for ArcGIS Server called Geocortex Essentials, which is in use today by hundreds of agencies around the world in an array of market segments including local government and the oil and gas industry.
2:00 – 3:00 p.m.
Florida Utility User GroupJames Barton, P.E., Senior Engineer - Chen Moore and AssociatesRoom 2A
The Florida Utility User Group has invited GIS users specializing in utilities to participate in group discussions and training. We meet bi-monthly to discuss how to make your utility more efficient through the use of GIS. This year our objective was to assist users adapting to the new Local Government Model and using the water / sewer utility tools created by ESRI. This meeting will go over the results of the past year and chart a path for the upcoming year’s meetings. Please bring suggestions of what you would like to accomplish.
29
October 12, 2012 Presentations
2:00 – 3:00 p.m. (cont.)
Leveraging & Extending the Reach of eGIS for Public SafetyScott Burton, GIS Coordinator - Broward Sheriffs OfficeRoom 2B
One of government’s most important jobs is to protect its citizens from crime, terrorism, and natural disasters. Furthermore, it is expected to do so in an increasingly effective manner, to reduce costs, and to improve cooperation though collaborations, data sharing, and obtaining economies of scale by combining efforts.
This presentation shows the evolution of the Enterprise GIS built upon the Esri’s ArcGIS framework at the Broward Sheriff’s Office (BSO), a “full service” public safety agency. Based on the ArcGIS enterprise framework, BSO has extended both visualization and analytics throughout the chain of command from promoting faster response time through the use of mobile mapping to providing decision-making tools that promote operational effectiveness and situational awareness for both law enforcement and fire-rescue services via web-based and desktop GIS mapping solutions.
Learn how BSO has extended GIS in all facets of public safety to increase operational efficiencies and decision-making effectiveness. As part of the enterprise GIS effort, we will be announcing the creation of the South Florida GIS Public Safety Users Group open to public safety personnel, including GIS personnel who support their public safety customers.
FLURISA - Annual MeetingRoom 2C
Town of Davie Embraces GIS TechnologyIrene DeGroot, GISP, GIS Coordinator - Town of DavieDavid Holdstock and David Lyons- Geographic Technologies GroupRoom 2D
The Town of Davie developed and implemented a GIS Strategic Plan. That plan evolved over the past 4 years to what it is today. All town departments have access through an intranet viewer, the public is given geographic information via the inter-net and the Town’s emergency management is provided with a mobile solution. This presentation will provide an overview of the town’s GIS system, how it is embraced, how it evolved and how creative solutions are implemented.
30
October 12, 2012 Presentations
2:00 – 3:00 p.m. (cont.)
GIS For Non-GIS - Creating Toolsets for Managers Using Python and ModelBuilder Katie Lelis - Broward CountyRoom 2E
Spatial data is often used for decision making, presentations, and reporting. The newest additions to the NatureScape program are two custom toolsets, empowering managers to “do GIS” by quickly creating custom queries, summaries, and reports using easy pull-down menus. See how the toolsets were created using Python and ModelBuilder, and how they are used to individualize partner involvement in the programs.
NatureScape Broward is now in its tenth year and has evolved into a nationally awarded program. This presentation will emphasis the need for GIS flexibility over time, as programs change and evolve.
31
October 12, 2012 Presentations
2:00 – 3:00 p.m. (cont.)
Geographically Weight Regression (GWR): A Better Geostatistical Approach to Model Sediment Quality of Lake OkeechobeeYao Yan, Senior Geographer - South Florida Water Management DistrictRoom 2F
Lake Okeechobee is a large shallow lake with an area of about 1730 km2 and an average depth of 2.7 m. The lake contains a large area of phosphorus laden mud sedi-ments, which is one of the major environmental challenges the lake faces. Numerous studies have been conducted in the Lake to estimate the amounts of sediment nutri-ents, their distribution and changes over-time.
Geographically Weighted Regression (GWR) is a spatial regression method devel-oped by Foterhingham and Brundson (2000, 2002). GWR is a local spatial regression approach based on the “First Law of Geography” (Tobler, 1970) and implemented in ArcGIS 9.3.1 and newer versions. GWR tends to serve as a “microscope” that ampli-fies details of the data that are otherwise hidden. It can calibrate a multiple regression model that allows different relationships between the dependent and independent variables to exist at different locations in space (non-stationarity).
Sediment cores were taken at 170 sites throughout the lake in 1988, 1998 and 2006, respectively. Based on TP’s spatial auto-correlations and correlations with other vari-ables, GWR and other models (such as Kriging, Ordinary least-squared regression and Regression-Kriging models) were examined and implemented using ArcGIS ModelBuilder. According to the model accuracy (RMSE), the best two models were GWR (total Fe) and GWR (mud thickness and site elevation) since these models use both spatial auto-correlation and positive correlation between TP and indepen-dent variables. The validated GWR models were selected for final TP concentration mapping and TP weight calculations for all three data sets. The results indicate that TP weight increased about 38-44% from 1988 to 1998, and decreased about 32-34% from 1998 to 2006.
Key Words: Lake Okeechobee, Geographically Weight Regression (GWR), Model-Builder, TP
32
October 12, 2012 Presentations
3:30 – 4:30 p.m.
Using 3-D Buildings to Enhance GIS DatasetsChristine Schluter, GIS Customer Relations Manager - Bruce Harris and AssociatesRoom 2A
Creating, displaying and managing Condos and other 3D structures in a traditional 2-Dimensional environment can often present challenges for those working with these datasets. By using 3D GIS technologies to render these buildings users can get a much better perspective of spatial positioning while at the same time still have the ability to access associated databases which house attributes necessary for important decision making.
Plats containing dimensions of individual units were used to construct a 3D structure within a GIS that accurately represent interior units. This technology has benefits in several industries including property mapping and management, assessment and emergency management. This data format can be useful in displaying additional information such as relative locations of elevators and stairwells, that can benefit users who may rely on it for effective navigation within a building.
We will be looking at how these datasets are derived, current applications and discuss potential future applications of this technology.
33
October 12, 2012 Presentations
3:30 – 4:30 p.m. (cont.)
A River Flood Study of the Mohawk River in New York using GIS and LiDARAntonios Marsellos, Postdoctoral research associate/Lecturer - University of FloridaRoom 2B
The Mohawk River flows generally east through the Mohawk Valley before entering the Hudson River through the Erie Canal lock system that function as navigation control, however the structures sometimes restrict flow or water and/or ice. To evalu-ate and minimize water flood hazards it is required to determine flooding trigger levels (FTL). FTL is the maximum elevation value that water cannot continue to be restricted in the trunk stream before flooding occurs. In this study, a methodology (Foster & Marsellos, 2012) utilizing incremental volumetric and surface calculation from Triangluated Irregular Network (TIN) is made by GIS software and LiDAR data to determine the FTL values for the entire Mohawk River.
Implementation of 337,5 million LiDAR points yielded a very accurate Triangu-lated Irregular Network. Canopy points to were subtracted from the LiDAR classi-fied points to create bare-earth models and avoid possible pseudo-constructions on surface. The digitized Mohawk river polyline (175 km), where available LiDAR data exist, was split into 45 segments.
A simulated progressive flood was calculated in these segments. The segments are bounded by the existing lock stations and bridges. A reference plane was used as a simulated flood plane that was increasing every 0.1 m from the bottom of the river towards a maximum elevation value where flood affects residential areas. A model builder was used for incremental surface and volume calculation for each segment from a simulated flood level. The sudden change of the surface versus elevation marks the FTL in each segment. Surface and volume incremental calculation val-ues which show FTL values for each segment were plotted against length along the river. Those changes show that upstream water build up has been constrained in the preceding segment, and that is impossible to be restricted in the following segment which results in flooding.
There are three abrupt changes of FTL values along the river segments. One co-incides with the 2010 flood segment (Marsellos et al., 2010) and the other two are vulnerable for future flooding. Allowing the river to use the full floodplain at those segments may increase the FTL value and the water storage availability in the trunk stream prior to a flood hazard.
34
October 12, 2012 Presentations
3:30 – 4:30 p.m. (cont.)
FLURISA - GIS KaraokeAndrew Baranowski, GISP, South Central Executive - FLURISARoom 2C
We will set up a microphone and projector and have volunteers give five minute ignite presentatations. Volunteers will be solicited during the conference from people visiting the FLURISA booth. There will be a computer at the FLURISA booth that people can use to add their slides to the presentation. There will be a FLURISA representative to coach the presenters while they put together their slides. Each presenter will have a maximum of 6 slides with the first slide being the title and presenters name.
Online GIS for Improved Project ManagementHeather Volmer, GISP, GIS Analyst - Coastal Planning & EngineeringAngela Belden, Director of GIS and CAD Operations - Coastal Planning & EngineeringRoom 2D
GIS online services facilitate project management through increased collaboration between departments and personnel. GIS online services enable data sharing for non GIS personnel, on the fly reviews and field planning. The implementation of online services into the work flow improves GIS data quality by creating data standardization, file structure and data transparency.
Water is Money - WATR-ISMark Nelson, PE, GISP, Senior Engineer, Vice-President - Jones, Edmunds & Assoc.Karri Thomas - St. Johns County UtilitiesRoom 2E
Utilities are increasingly challenged with managing and maintaining their aging in-frastructure with fewer resources. Improving operational efficiencies and moving more of the work from reactive to preventative maintenance has become critical to meeting this challenge of doing more with less. St. Johns County Utility Department is achieving this goal through the implementation and effective use of an Enterprise Asset Management Solution (AMS). The thin-client browser-based AMS supports an array of business processes, including; work orders, inspections, and service re-quests, along with full map interaction, GIS-centric asset inventory, maintenance history, and reporting. This presentation will cover many of the aspects of the St. Johns County Utility Department’s AMS, including integration with other third party applications like their customer information system, AMR/AMI and SCADA. The AMS also serves as the central repository for water conservation related efforts, tracking and reporting program related costs and benefits (water savings).
35
October 12, 2012 Presentations
3:30 – 4:30 p.m. (cont.)
Quick Develop and Build Cross-platform Native Mobile GIS AppsHengtong Wei, P.E., GIS Systems Architect - Metric Engineering, Inc.Deepali Patil, GISP - Metric Engineering, Inc.Room 2F
Developing apps on mobile devices such as Smartphone, Tablet and Pad is becom-ing a topic from popular to inevitable for most GIS solution providers, as more and more needs are generated in this hot market. As a leader to the GIS market, ESRI has provided ArcGIS SDK for Smartphones and Tablets as the solution for mobile GIS. However, the development process could be called painful since developers have to face to multiple SDKs for different mobile platforms. In this presentation, a quick approach combines the advantages of both mobile web UI frameworks and open source mobile development build framework – PhoneGap, introduced as an alternative for mobile GIS application development. A summary of the presentation outline is as follows:
1. Background and awareness of the traditional native mobile development approach2. Introduction of the quick cross-platform approach 2.1. Introduction of ArcGIS Server Javascript API and Mobile Web GIS application development 2.2. Popular mobile web UI frameworks 2.3. Building native cross-platform mobile applications using PhoneGap 2.4. Putting everything together3. Development showcase using introduced approach4. Benefits & Challenges
THE 2012 SOUTH FLORIDA GIS EXPOCO-CHAIRSHeather Kostura
Josephine Rudd - Palm Beach County Solid Waste Authority
COMMITTEEPenny Anderson - Palm Beach County ISS
Andrew Baranowski - CDM SmithJurate Barkauskaite-Meister - Palm Beach County ISS
James Barton - Chen Moore and AssociatesChristine Benkly - Palm Beach County ISS
Tom Dobbs – Broward County Planning and RedevelopmentNellie Fernandez - Palm Beach Metropolitan Planning Organization
Sue Hohner - SFWMDGerry Gawaldo - PalmTran
Randal Krejcarek - City of Delray BeachPatrick Lockwitz - City of Deerfield Beach
Jennifer Marangos - Geo-ConnectionsBryan Merritt - Erdman Anthony
Bob Mickla - City of Delray BeachMelissa Moore - PBC Fire Rescue
Victoria Morrow - Broward County GIS Nestor Navarro - City of Wellington
David Rafaidus - Palm Beach County Community ServicesKelly Ratchinsky - Palm Beach County ISS
Todd Remmel - Palm Beach County Property Appraiser’s OfficeBrian Rock - Palm Beach County ISS
Iliana Saraiva - City of MiramarKara Schwartz - FDOT
Mark Sinkhorn - Palm Beach County Engineering & Public WorksDanny Thorpe - Palm Beach County Water Utilities
The EXPO Committee would like to thank theSouth Florida Water Management District