145
West Valley Connector Corridor ALTERNATIVES ANALYSIS REPORT FINAL | September 2014 Ontario International Airport Ontario Mills Rancho Cucamonga Metrolink Station Kaiser Permanente PARSONS
| Date post: | 06-Feb-2018 |
| Category: |
Documents |
| Upload: | duongkhuong |
| View: | 220 times |
| Download: | 2 times |
West Valley Connector CorridorALTERNATIVES ANALYSIS REPORTFINAL | September 2014
Ontario International Airport Ontario Mills Rancho CucamongaMetrolink Station
Kaiser Permanente
PARSONS

Omnitrans West Valley Connector Alternatives Analysis Report
Final Report September 2014
Prepared By: Parsons Transportation Group
Gruen Associates Iteris Inc.
Cambridge Systematics
The preparation of this report has been financed in part by a grant from the Federal Transit Administration, U. S. Department of Transportation. The contents of this report do not necessarily reflect
the official views or policy of the U. S. Department of Transportation.


OMNITRANS WEST VALLEY CONNECTOR ALTERNATIVE ANALYSIS REPORT i
TABLE OF CONTENTS
TABLE OF CONTENTS
1. INTRODUCTION .................................................................................................................................. 1-11.1 Background .............................................................................................................................................................. 1-11.2 Purpose and Organization of the Report ..................................................................................................... 1-81.3 Project Goal and Objectives .............................................................................................................................. 1-8
2. EXISTING CONDITIONS ...................................................................................................................... 2-12.1 Ridership ................................................................................................................................................................... 2-12.2 Bus Stops ................................................................................................................................................................... 2-32.3 Transit Service Characteristics ........................................................................................................................... 2-62.4 Traffic Conditions ................................................................................................................................................... 2-7
2.4.1 Route 61 Corridor ................................................................................................................................. 2-72.4.2 Forecasted Traffic Conditions ........................................................................................................ 2-23
2.5 Land Use ................................................................................................................................................................. 2-242.5.1 Existing Land Use ............................................................................................................................... 2-242.5.2 Land Use Plans and Policies ........................................................................................................... 2-30
2.6 Urban Design ........................................................................................................................................................ 2-332.6.1 Urban Design Character .................................................................................................................. 2-332.6.2 Transit-Oriented Development Potential ................................................................................. 2-42
2.7 Demographics ...................................................................................................................................................... 2-46
3. ALTERNATIVES ANALYSIS PROCESS AND CONCEPTUAL ALTERNATIVES ................................. 3-13.1 Local Bus Service .................................................................................................................................................... 3-23.2 Rapid Bus and Bus Rapid Transit Service ..................................................................................................... 3-33.3 Light Rail Transit Service ..................................................................................................................................... 3-63.4 Conceptual Screening Results .......................................................................................................................... 3-9
4. DEFINITION OF ALTERNATIVES ........................................................................................................ 4-14.1 No Build Alternative .............................................................................................................................................. 4-14.2 Transportation Systems Management (TSM) Alternative ...................................................................... 4-14.3 Build Alternatives ................................................................................................................................................... 4-1
4.3.1 Route 61 Alternatives .......................................................................................................................... 4-14.3.2 Hybrid Alternatives ............................................................................................................................ 4-11
4.4 Station Locations ................................................................................................................................................ 4-154.5 Sub Area Alignments ......................................................................................................................................... 4-18
5. COST ESTIMATES AND FUNDING SOURCES ................................................................................... 5-15.1 Conceptual Cost Estimates ................................................................................................................................ 5-15.2 Capital Cost Estimates ......................................................................................................................................... 5-15.3 Capital Funding Sources ..................................................................................................................................... 5-25.4 O&M Cost Estimates ............................................................................................................................................ 5-35.5 O&M Funding Sources ........................................................................................................................................ 5-3
6. EVALUATION OF ALTERNATIVES ...................................................................................................... 6-16.1 Ridership and Performance Results ................................................................................................................ 6-16.2 2035 Forecasted Ridership ................................................................................................................................. 6-36.3 Cost Effectiveness Evaluation ............................................................................................................................ 6-36.4 Evaluation Results .................................................................................................................................................. 6-4

ii OMNITRANS WEST VALLEY CONNECTOR ALTERNATIVE ANALYSIS REPORT
TABLE OF CONTENTS
7. STAKEHOLDER AND PUBLIC OUTREACH ........................................................................................ 7-17.1 Stakeholder Outreach Process ......................................................................................................................... 7-17.2 Public Outreach Meetings .................................................................................................................................. 7-1
7.2.1 Public Outreach Meetings ................................................................................................................. 7-27.2.2 Summary of Discussion ...................................................................................................................... 7-37.2.3 Rider Information Sessions ............................................................................................................... 7-37.2.4 Operator Information Sessions ........................................................................................................ 7-37.2.5 Community Survey ............................................................................................................................... 7-4
8. RECOMMENDED ALTERNATIVE ........................................................................................................ 8-18.1 Findings from the Evaluation ............................................................................................................................ 8-18.2 Recommended Alternative ................................................................................................................................ 8-28.3 Recommended Station Concept ...................................................................................................................... 8-58.4 Recommended Station Locations ................................................................................................................... 8-58.5 Project Ridership Statistics ................................................................................................................................. 8-68.6 Project Cost Estimates and Recommended Funding Strategy ............................................................ 8-78.7 Next Steps ................................................................................................................................................................. 8-8
8.7.1 Board Review and SCAG RTP ........................................................................................................... 8-88.7.2 Transition into Engineering Design and Environmental Studies ........................................ 8-8
8.8 Future Potential Improvements and Connections ................................................................................. 8-10
LIST OF FIGURES
Figure 1-1: Omnitrans Route 61 ................................................................................................................................................. 1-2Figure 1-2: Route 66 serving Foothill Boulevard in the West Valley ............................................................................ 1-3Figure 1-3: West Valley Connector Alignment ..................................................................................................................... 1-4Figure 1-4: Omnitrans Systemwide Plan with Route 61/ Holt Boulevard and Foothill Boulevard
Corridors ....................................................................................................................................................................... 1-6Figure 1-5: Omnitrans sbX Green Line BRT ............................................................................................................................ 1-7Figure 2-1: Omnitrans Annual Ridership by Route ............................................................................................................. 2-1Figure 2-2: Weekday Boardings by stop on Route 61 ....................................................................................................... 2-2Figure 2-3: Weekday Boardings by stop on Route 66 ....................................................................................................... 2-3Figure 2-4: Typical Existing Bus Stops ...................................................................................................................................... 2-5Figure 2-5: Signalized intersections on West Valley Connector Corridor .................................................................. 2-9Figure 2-6: Hourly Volumes on Holt Avenue in Pomona .............................................................................................. 2-12Figure 2-7: Hourly Volumes on Holt Boulevard in Montclair ....................................................................................... 2-13Figure 2-8: Hourly Volumes on the Western Portion of Holt Boulevard in Ontario ........................................... 2-15Figure 2-9: Hourly Volumes on the Eastern Portion of Holt Boulevard in Ontario ............................................. 2-16Figure 2-10: Hourly Volumes on Inland Empire Boulevard .......................................................................................... 2-16Figure 2-11: Hourly Volumes on Milliken Avenue ............................................................................................................ 2-18Figure 2-12: Hourly Volumes on Foothill Boulevard in Rancho Cucamonga ........................................................ 2-19Figure 2-13: Hourly Volumes on Foothill Boulevard in Fontana ................................................................................ 2-21Figure 2-14: Hourly Volumes on Northern Portion of Sierra Avenue ...................................................................... 2-22Figure 2-15: Hourly Volumes on Southern Portion of Sierra Avenue ...................................................................... 2-22Figure 2-16: Route 61 Existing Land Use ............................................................................................................................. 2-25Figure 2-17: West Valley Connector Existing Land Use ................................................................................................. 2-27Figure 2-18: West Valley Corridor Trip Attractors and Activity Centers .................................................................. 2-30Figure 2-19: Typical Cross-Section along Holt Avenue in the City of Pomona .................................................... 2-34

OMNITRANS WEST VALLEY CONNECTOR ALTERNATIVE ANALYSIS REPORT iii
TABLE OF CONTENTS
Figure 2-20: Typical Cross-Section along Holt Boulevard in the City of Montclair ............................................. 2-34Figure 2-21: Typical Cross-Section along Holt Boulevard in the City of Ontario ................................................. 2-35Figure 2-22: Typical Cross-Section along Inland Empire Boulevard in the City of Ontario ............................. 2-36Figure 2-23: Typical Cross-Section along Fourth Street in the City of Ontario .................................................... 2-36Figure 2-24: Typical Cross-Section along Milliken Avenue in the City of Ontario .............................................. 2-36Figure 2-25: Typical Cross-Section along Foothill Boulevard in the City of Rancho Cucamonga ................. 2-37Figure 2-26: Typical Cross-Section along San Bernardino Avenue in the County of San Bernardino
(unincorporated area) .......................................................................................................................................... 2-38Figure 2-27: Typical Cross-Section along San Bernardino Avenue in the City of Fontana .............................. 2-39Figure 2-28: Typical Cross-Section along Valley Boulevard in the City of Fontana ............................................ 2-40Figure 2-29: Typical Cross-Section along Sierra Avenue (south of Fontana Metrolink Station) in the
City of Fontana ........................................................................................................................................................ 2-40Figure 2-30: Typical Cross-Section along Foothill Boulevard in the City of Fontana ......................................... 2-41Figure 2-31: Typical Cross-Section along Sierra Avenue (north of Fontana Metrolink Station) in the
City of Fontana ........................................................................................................................................................ 2-42Figure 2-32: Basic TOD Diagram ............................................................................................................................................. 2-42Figure 2-33: TOD Concept ......................................................................................................................................................... 2-43Figure 2-34: Higher Intensity/Density Development Adjacent to the Fontana Transit Center ...................... 2-44Figure 2-35: Enhanced Pedestrian Streetscapes along High-Density Housing at Victoria Gardens in
Rancho Cucamonga .............................................................................................................................................. 2-44Figure 2-36: Potential Opportunity Sites at Foothill Boulevard and Milliken Avenue in the City of
Rancho Cucamonga .............................................................................................................................................. 2-45Figure 2-37: Recent High-Density, Mixed-Use Projects and Residential Projects in Pomona and
Ontario ....................................................................................................................................................................... 2-45Figure 2-39: City Population Forecasts ................................................................................................................................. 2-47Figure 2-40: City Employment Forecasts .............................................................................................................................. 2-47Figure 3-1: Alternatives Analysis Process ................................................................................................................................ 3-1Figure 3-2: Bus and BRT Implementation Ranges ............................................................................................................... 3-2Figure 3-3: Omnitrans’ 40’ Low Floor Vehicles ..................................................................................................................... 3-2Figure 3-4: Standard Omnitrans Local Bus Stop .................................................................................................................. 3-3Figure 3-5: Elements of BRT and Rapid Bus Service ........................................................................................................... 3-4Figure 3-6: BRT Station Components ....................................................................................................................................... 3-5Figure 3-7: Typical Light Rail Vehicle ........................................................................................................................................ 3-7Figure 3-8: Light Rail Station with Overhead Catenary System ..................................................................................... 3-8Figure 3-9: Average Capital Costs per Mile by Transit Mode ...................................................................................... 3-10Figure 3-10: Average O&M Costs ........................................................................................................................................... 3-11Figure 3-11: Capacity by Mode ................................................................................................................................................ 3-11Figure 4-1: Build Alternatives A and B ..................................................................................................................................... 4-3Figure 4-2: Build Alternative C .................................................................................................................................................... 4-4Figure 4-3: Build Alternative D .................................................................................................................................................... 4-5Figure 4-4: Build Alternative E ..................................................................................................................................................... 4-6Figure 4-5: Build Alternative F ..................................................................................................................................................... 4-7Figure 4-6: Build Alternatives G, H and I ................................................................................................................................. 4-8Figure 4-7: Build Alternative J ...................................................................................................................................................... 4-9Figure 4-8: Build Alternative K .................................................................................................................................................. 4-10Figure 4-9: Characteristics of the Initial Set of Alternatives .......................................................................................... 4-11Figure 4-10: Build Alternative L ................................................................................................................................................ 4-12Figure 4-11: Build Alternative M .............................................................................................................................................. 4-13

iv OMNITRANS WEST VALLEY CONNECTOR ALTERNATIVE ANALYSIS REPORT
TABLE OF CONTENTS
Figure 4-12: Build Alternative N .............................................................................................................................................. 4-14Figure 4-13: Existing Route 61 and Sub Area Segments A, B, C ................................................................................. 4-18Figure 4-14: Segment A Ontario Airport and Future Multimodal Transit Center Access ................................. 4-19Figure 4-15: Segment B Sub Area ........................................................................................................................................... 4-19Figure 4-16: Segment C Sub Area and Ontario Mills ...................................................................................................... 4-20Figure 4-17: Existing Route 61 on Sierra Avenue and South Fontana Transit Center ........................................ 4-21Figure 4-18: Sierra Avenue and South Fontana Transit Center Sub Area ............................................................... 4-22Figure 5-1: Conceptual Capital Cost Estimates ..................................................................................................................... 5-2Figure 5-2: Capital Funding Sources Conceptual Estimates ............................................................................................ 5-2Figure 5-3: Conceptual Annual O&M Cost Estimates ........................................................................................................ 5-3Figure 5-4: Conceptual O&M Cost Estimates ....................................................................................................................... 5-3Figure 6-1: Existing Daily Ridership for West Valley Connector Alternatives ........................................................... 6-5Figure 6-2: Capital Costs for West Valley Connector Alternatives ................................................................................ 6-6Figure 6-3: Annual O&M Costs for West Valley Connector Alternatives ................................................................... 6-6Figure 6-4: Total Cost per Rider for West Valley Connector Alternatives .................................................................. 6-7Figure 7-1: Printed Public Meeting Notice ............................................................................................................................. 7-2Figure 7-2: Public Feedback Survey .......................................................................................................................................... 7-5Figure 8-1: Recommended Alternative; West Valley Connector Rapid Service ....................................................... 8-2Figure 8-2: Recommended Sub Area Alignments ............................................................................................................... 8-3Figure 8-3: Recommended Rapid Bus Station Concept .................................................................................................... 8-5Figure 8-4: Future Potential Connections to the West Valley Connector Corridor ............................................. 8-12
LIST OF TABLES
Table 2-1: Route 61 Bus Stop Activity by Major Intersection/Activity Center .......................................................... 2-4Table 2-2: Route 61 Passenger Transfer Activity* ................................................................................................................ 2-6Table 2-3: January 2013 Hours and Vehicles by Day for Route 61 and 66 ............................................................... 2-7Table 2-4: Omnitrans Service Indicators ................................................................................................................................. 2-7Table 2-5: Typical Roadway Cross Sections by Segment of Route 61 ........................................................................ 2-8Table 2-6: Level of Service Ranges ............................................................................................................................................ 2-9Table 2-7: Arterial Segment Daily Capacity ........................................................................................................................... 2-9Table 2-8: Existing Traffic Operations Summary ............................................................................................................... 2-10Table 2-9: Future Year 2035 Traffic Volume Growth ....................................................................................................... 2-23Table 2-10: Activity Centers and Summary of Transit Supportive Land Use in the Cities’ Plans ................... 2-31Table 2-10: Route 61 Corridor Demographics ................................................................................................................... 2-46Table 4-1: Potential Station Locations .................................................................................................................................. 4-17Table 5-1: Conceptual Capital Cost Estimates ...................................................................................................................... 5-1Table 6-1: Travel Time Results ..................................................................................................................................................... 6-1Table 6-2: 2015 Ridership Results for the Alternatives ...................................................................................................... 6-2Table 6-3: Capital and O&M Cost Comparison .................................................................................................................... 6-4Table 8-1: Rapid Bus Opeeing Year Ridership Statistics ................................................................................................... 8-6Table 8-2: Opening Year Projected Ridership per Station Location ............................................................................. 8-7Table 8-3: Rapid Bus Conceptual Cost Estimate .................................................................................................................. 8-7Table 8-4: Rapid Bus Conceptual O&M Estimate ................................................................................................................ 8-8Table 8-5: Rapid Bus Conceptual Funding Sources ............................................................................................................ 8-8Table 8-6: Rapid Bus Conceptual Capital Costs and Funding Sources ................................................................... 8-11

OMNITRANS WEST VALLEY CONNECTOR ALTERNATIVE ANALYSIS REPORT v
TABLE OF CONTENTS
LIST OF APPENDICES
Appendix A – Transit Signal Priority Memo ............................................................................................................................... 1Appendix B – Land Use Plans and Policy Review Memo ...................................................................................................... 1Appendix C – Travel Demand Forecasting Memo ................................................................................................................... 1Appendix D – Conceptual Cost Estimates .................................................................................................................................. 1Appendix E – Public Outreach Memo .......................................................................................................................................... 1Appendix F – Conceptual Plans ...................................................................................................................................................... 3Appendix G – Environmental Screening Memo ....................................................................................................................... 5


OMNITRANS WEST VALLEY CONNECTOR ALTERNATIVE ANALYSIS REPORT 1-1
1 – INTRODUCTION
1. INTRODUCTION
This report details the Alternatives Analysis (AA) prepared for the West Valley Connector corridor, a newly identified transit corridor that includes portions of the Holt Boulevard/Route 61 and the West Foothill Boulevard/Route 66 transit corridors. The purpose of the West Valley Connector Corridor Alternatives Analysis Project is to evaluate alternatives for the introduction of premium transit services along the Holt Boulevard/Foothill Boulevard Corridor between the City of Pomona in Los Angeles County and the Cities of Montclair, Ontario, Rancho Cucamonga, and Fontana in San Bernardino County; and to identify the alternatives that best serve local transportation needs. The West Valley Connector corridor was identified during the development of the range of alternatives detailed in the report and serves a wider range of major destinations/activity centers than either of the individual corridors alone.
Omnitrans originally initiated an Alternatives Analysis for the Holt Boulevard/Route 61 corridor to determine the best way to implement improvements to Omnitrans’ highest-ridership route, the 61. The AA evaluates and screens alternative alignments, transit modes or technologies, and station locations. The AA process began in February 2013 and was funded through a Section 5339 AA planning grant under the previous transportation funding legislation - Safe, Accountable, Flexible, Efficient Transportation Equity Act: A Legacy for Users
While a formal, stand-alone Alternatives Analysis process is no longer required in the revised New/Small Starts program under the current transportation funding legislation - Moving Ahead for Progress in the 21
(SAFETEA-LU).
st
Omnitrans’ Route 61 runs east-west and serves the west portion of Omnitrans service area, including the communities of Fontana, Ontario, Rancho Cucamonga, and Montclair in San Bernardino County, and the city of Pomona in Los Angeles County. The corridor location is shown in Figure 1-1.
Century Act (MAP-21), Omnitrans followed a traditional AA approach in order to document the key elements and decisions that led to a preferred set of improvements for the corridor.
During the course of the AA study, multiple alternatives were developed via a multi-tier screening process in conjunction with project stakeholders and local jurisdictions, as detailed in later sections of this report. As a result of this process, route alignment alternatives were developed and relevant local plans and studies were reviewed and analyzed. One study, the Integrated Transit and Land Use Planning for the Foothill Boulevard/5th
1.1 Background
Street Transit Corridor, considered improvements along Omnitrans’ Route 66 on West Foothill Boulevard, as shown in Figure 1-2. Based on input from Omnitrans and the other stakeholders over the course of the AA study, multiple hybrid alignment alternatives were developed, including portions of Route 61 and a portion of Route 66 on Foothill Boulevard. This hybrid alignment is referred to as the West Valley Connector corridor as shown in Figure 1-3.
Omnitrans is the major public transportation provider in the San Bernardino Valley, with a service area of approximately 456 square miles, serving fifteen municipalities and many unincorporated areas of San Bernardino County. Omnitrans’ mission is to provide the San Bernardino Valley with comprehensive public mass transportation services that maximize customer use, comfort, safety, and satisfaction, while efficiently using financial and other resources, in an environmentally sensitive manner.

1-2 OMNITRANS WEST VALLEY CONNECTOR ALTERNATIVE ANALYSIS REPORT
1 – INTRODUCTION
Figu
re 1
-1: O
mni
tran
s Ro
ute
61

OMNITRANS WEST VALLEY CONNECTOR ALTERNATIVE ANALYSIS REPORT 1-3
1 – INTRODUCTION
Figu
re 1
-2: R
oute
66
serv
ing
Foot
hill
Boul
evar
d in
the
Wes
t V
alle
y

1-4 OMNITRANS WEST VALLEY CONNECTOR ALTERNATIVE ANALYSIS REPORT
1 – INTRODUCTION
Figu
re 1
-3: W
est
Val
ley
Conn
ecto
r A
lignm
ent
OMNITRANS WEST VALLEY CONNECTOR ALTERNATIVE ANALYSIS REPORT 1-5
1 – INTRODUCTION
In 2004 Omnitrans developed the Omnitrans Systemwide Plan that identified major transit corridors for potential improved service, and in 2010 updated the plan. SANBAG, the County Transportation Commission, included the corridors from the Systemwide Plan in its own San Bernardino County Long Range Transit Plan in 2010, as shown in Figure 1-4. The corridors were also included as strategic corridors in the 2012 Regional Transportation Plan/Sustainable Communities Strategy produced by the Southern California Association of Governments (SCAG), the region’s Metropolitan Planning Organizations.
The Omnitrans System-wide Plan and SANBAG Long Range Transit Plan determined that, based on the level and character of transit demand, the most appropriate technology for premium transit service in the 10 major corridors is Bus Rapid Transit (BRT). The Omnitrans Board of Directors approved a “brand” for the system as the San Bernardino Valley Express (sbX) bus rapid transit system. These sbX BRT corridors would provide:
• Distinct sbX branding, including station pylons and station design, line designations, and distinct marketing
• Frequent, limited stop service with station spacing approximately 1/2 to 1 mile; • A range of transit and roadway improvements including:
o dedicated lanes o transit signal priority (TSP) o queue jump lanes
• Specialized transit stations with level boarding, park-and-ride lots (where applicable), and kit-of-parts providing a range of passenger amenities
• Non-motorized transportation improvements including:
o Bike racks and lockers o Pedestrian and bicycle network improvements
• Specialized low-floor 60’ articulated vehicles, fueled with compressed natural gas (CNG) • Substantial investment in intelligent transportation system technology including:
o NexTrip bus arrival and departure information signage o Off-board fare collection o GPS vehicle tracking o On-board monitoring o Closed circuit (CCTV) security cameras

1-6 OMNITRANS WEST VALLEY CONNECTOR ALTERNATIVE ANALYSIS REPORT
1 – INTRODUCTION
Figure 1-4: Omnitrans Systemwide Plan with Route 61/
Holt Boulevard and Foothill Boulevard Corridors
Since the adoption of the Omnitrans System-wide Plan, Omnitrans has begun operation of the first sbX corridor, the Green Line (as depicted in Figure 1-4, and illustrated in Figure 1-5) on the E Street corridor, serving the cities of San Bernardino and Loma Linda. A 15.7-mile BRT corridor, it began revenue operation in April 2014, and includes 16 specialized transit stations, 5.4 miles of BRT center-running dedicated lanes plus 10.3 miles of BRT operating in mixed flow lanes, specialized 60 foot vehicles, TSP and intelligent transportation system technology, and all the amenities listed above. Omnitrans used a $75 million Small Starts grant and other Federal Transit Administration (FTA) funding, along with local funds, to support development of the E Street BRT corridor project.

OMNITRANS WEST VALLEY CONNECTOR ALTERNATIVE ANALYSIS REPORT 1-7
1 – INTRODUCTION
Figure 1-5: Omnitrans sbX Green Line BRT

1-8 OMNITRANS WEST VALLEY CONNECTOR ALTERNATIVE ANALYSIS REPORT
1 – INTRODUCTION
1.2 Purpose and Organization of the Report The West Valley Connector Alternatives Analysis report details the evaluation of alternatives for introduction of premium transit service that best serves transportation needs in a multi-step screening process. The development and screening of alternatives is intended to identify a project definition with the most appropriate improvements for the corridor.
The organization of this report is as follows:
• Chapter 2 Existing Conditions • Chapter 3 Alternatives Analysis Process and Conceptual Alternatives • Chapter 4 Definition of Alternatives • Chapter 5 Cost Estimates and Funding Sources • Chapter 6 Analysis of Alternatives • Chapter 7 Stakeholder and Public Outreach Process • Chapter 8 Recommended Alternative
1.3 Project Goal and Objectives As determined by the Project Development Team (PDT) described in detail in Section 7 of this report, the project goal of the West Valley Connector Corridor Alternatives Analysis (AA) study is to increase transit ridership in the corridor by providing a transit alternative that is more competitive with the automobile. The supporting objectives to achieve that goal include:
• Support city/community stakeholder goals and plans • Respond to population, employment and travel demand growth • Implement Omnitrans’ System-wide Transit Corridors Plan for the San Bernardino Valley • Provide premium transit service • Improve transit amenities and facilities to provide greater passenger comfort and safety. • Increase transit travel speed and reduce travel time/delay • Improve mobility and better serve multiple destinations • Reduce vehicle miles of travel (VMT) • Minimize negative impacts to traffic operations • Improve pedestrian and bicycle access to transit • Facilitate economic development and TOD opportunities

OMNITRANS WEST VALLEY CONNECTOR ALTERNATIVE ANALYSIS REPORT 2-1
2 – EXISTING CONDITIONS
2. EXISTING CONDITIONS
In this section, relevant existing conditions information is presented as a basis for alternatives studied. This section primarily focuses on the Holt Boulevard/Route 61 alignments because the Alternatives Analysis was originally intended to cover the Route 61 corridor (generally following Omnitrans’ existing local bus Route 61). Additional existing conditions information for Route 66 are detailed as a part of SANBAG’s 2013 Integrated Transit and Land Use Planning for the Foothill Boulevard/5th Street Transit Corridor Report.
Omnitrans’ Route 61 is depicted in Figure 1-1. The 20.4-mile route runs from the Pomona Transit Center on the west end along Holt Avenue in Pomona, through Montclair where Holt Avenue changes names to Holt Boulevard, to the Ontario Airport, along Inland Empire Boulevard and Milliken to Ontario Mills. The corridor continues east along Fourth Street/San Bernardino Avenue to the South Fontana Transit Center near Kaiser Hospital, then north along Sierra Avenue terminating at the Fontana Metrolink Station.
Route 61 crosses the western portion of the San Bernardino Valley in an east-west direction, providing one of three east-west transit options along with Route 66 on Foothill Boulevard and Route 67 on Baseline Road. From a historical perspective, along with Route 66, segments of Route 61 served the historical downtowns for many of the local jurisdictions in the area, with Holt Avenue/Boulevard as the major east-west transportation corridor.
2.1 Ridership Route 61 is the highest ridership route in Omnitrans’ system as shown in Figure 2-1, providing more than 1.86 million boardings in 2012 and approximately 5,800 boardings per average weekday. This represents approximately 11.5% of Omnitrans’ total system ridership.
Figure 2-1: Omnitrans Annual Ridership by Route

2-2 OMNITRANS WEST VALLEY CONNECTOR ALTERNATIVE ANALYSIS REPORT
2 – EXISTING CONDITIONS
Route 61 has consistently generated the highest ridership of all Omnitrans routes since 2006, when a route restructuring took effect. Since 2006, ridership in the corridor has remained the highest in all of Omnitrans’ service area and has remained steady, monthly and annually. Boardings on Route 61 are shown in Figure 2-2 and primarily centered on Holt Avenue in the city of Pomona and Holt Boulevard in Montclair and Ontario with ridership also boarding in Fontana on Sierra Avenue.
Figure 2-2: Weekday Boardings by stop on Route 61
Route 66 has moderate ridership, with the majority of boardings occurring at the route termini in Fontana and Montclair as shown in Figure 2-3. SANBAG’s Integrated Transit and Land Use Planning for the Foothill Boulevard/5th Street Transit Corridor Report details ridership patterns for Route 66.

OMNITRANS WEST VALLEY CONNECTOR ALTERNATIVE ANALYSIS REPORT 2-3
2 – EXISTING CONDITIONS
Figure 2-3: Weekday Boardings by stop on Route 66
2.2 Bus Stops Route 61 serves 92 local stops along the corridor in each direction, with an average of 4.5 stops per mile in each direction in the corridor. Table 2-1 illustrates the key activity centers/intersections along Route 61 with the highest number of average daily boardings and alightings. This route serves five (5) transfer centers that function as five of the top boarding and alighting locations.
Conditions of existing bus stops and the level of amenities provided vary depending on the jurisdiction and which entity built the bus stop. Bus stops are often built and maintained by developers as a condition of approval.
Generally, existing bus stops in the corridor reflect a low level of amenities, and some locations lack sidewalk connections and boarding areas for passenger boarding and alighting. Portions of the corridor including Holt Boulevard in Montclair, and Inland Empire Boulevard in Ontario provide higher levels of passenger amenities than other portions of the corridor including bus benches and shelters. Examples of existing bus stops in the corridor are shown in Figure 2-4.

2-4 OMNITRANS WEST VALLEY CONNECTOR ALTERNATIVE ANALYSIS REPORT
2 – EXISTING CONDITIONS
Table 2-1: Route 61 Bus Stop Activity by Major Intersection/Activity Center
Bus Stop Boardings Alightings Route 61 Total
1 Fontana Metrolink 877 859 1,736
2 Ontario Mills TC 861 808 1,669
3 Pomona Metrolink TransCenter 639 545 1,184
4 South Fontana TransCenter 389 415 804
5 Villages at Indian Hill 266 299 565
6 Holt at Ramona 247 219 466
7 Holt at San Antonio 220 218 438
8 Ontario TransCenter 224 204 428
9 Garey at Holt 194 155 349
10 Holt and Vineyard 134 171 305
11 Holt at Central 136 141 277
12 Holt At Mountain 108 129 237
13 Holt at Towne 171 65 236
14 Holt at Campus 108 123 231
15 Sierra at Merrill 77 110 187
16 Sierra At Randall 73 101 174
17 Holt and Monte Vista 88 79 167
18 Ontario Mills 79 69 148
19 San Bernardino at Citrus 77 58 135
20 Holt at Grove 56 72 128
Source: Omnitrans, (Sept-Oct 2012)
Transfer Locations Route 61 provides a vital link with connecting transit lines. Route 61 ranks second after Route 2 in transfers among all of Omnitrans’ routes. These transfers include several other Omnitrans bus routes, two Metrolink commuter rail lines (the San Bernardino Line and the Riverside Line), Foothill Transit Silver Streak BRT, and Foothill Transit local bus routes.
Route 61 provides access to the Fontana Metrolink Station and the Pomona Metrolink Station. The Fontana Metrolink Station currently provides 24,000 typical daily transfers and access to the San Bernardino Metrolink Line, the highest ridership Metrolink line in operation. The Pomona Metrolink Station provides commuter connections into Los Angeles County via the Metrolink Riverside Line or Foothill Transit Authority Silver Streak BRT Service. Southern California Regional Rail Authority (SCRRA), the agency that runs the Metrolink Commuter Rail Service, is studying providing additional service on the Riverside Line. Hybrid alignments discussed in section 4 would also provide access to the Rancho Cucamonga Metrolink station on the San Bernardino Line, the highest Metrolink ridership of all Metrolink stations.

OMNITRANS WEST VALLEY CONNECTOR ALTERNATIVE ANALYSIS REPORT 2-5
2 – EXISTING CONDITIONS
Omnitrans bus stops in the City of Pomona are shared stop locations with Foothill Transit routes and generally reflect a low level of amenities with the exception of higher ridership stops. This eastbound stop on Holt Avenue at San Antonio Avenue shows an ample sidewalk width and a bus stop sign.
Montclair bus stops typically provide a custom shelter, bus bench, trash can, and bus stop sign. Bus stops are typically set back from the sidewalk and the shelter pad is located within the landscaping area.
Bus stops on Holt Boulevard in the City of Ontario are in various configurations, typically with low levels of amenities. This bus stop located mid block west of Mountain Avenue is typical of stop locations and amenities along Holt Boulevard in Ontario, with poor sidewalk access and landscaping. A bus bench and boarding pad is provided. Bus stops on Inland Empire Boulevard are in good condition with high quality landscaping and provide a higher level of amenities including a bus bench and shelter.
Bus stops along San Bernardino Avenue in unincorporated San Bernardino County and Fontana provide low levels of passenger amenities. This stop at Beech Avenue lacks sidewalk connections and boarding pads, and is anticipated to be improved by the County in a planned streetscape improvement project for San Bernardino Avenue.
Figure 2-4: Typical Existing Bus Stops
Omnitrans also operates two transfer centers on Route 61, the recently completed Ontario Civic Center Transfer Center east of Euclid Avenue and the South Fontana Transfer Center located adjacent to the Kaiser Permanente Fontana Medical Center. Both of these sites serve as timed transfer points that serve multiple local bus routes. Route 61 provides the following opportunities for transfers:
• 8 Omnitrans routes and 1 Metrolink route at the Fontana transportation center • 4 Omnitrans routes at the South Fontana Transfer center
2-6 OMNITRANS WEST VALLEY CONNECTOR ALTERNATIVE ANALYSIS REPORT
2 – EXISTING CONDITIONS
• 4 Omnitrans routes at the Ontario Transfer Center • 10 Foothill Transit routes (including the Silver Streak BRT service) and 1 Metrolink route at the
Pomona Metrolink station • 2 Omnitrans
routes at the Ontario Mills
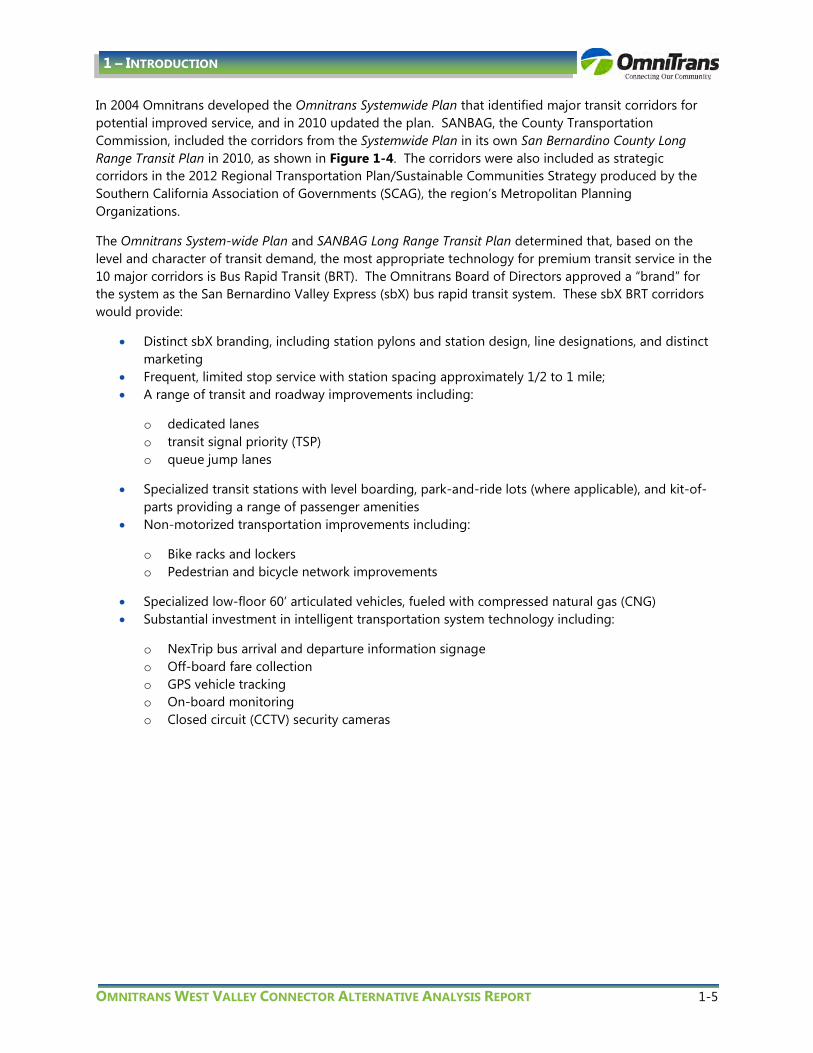
Table 2-2 summarizes the various bus routes that cross Route 61 and have significant numbers of transfers between the routes on a daily basis. Data collected during the 2011 Onboard, Access, and Omnilink Rider Study indicate that 71% of the transfers to Route 61 come from other Omnitrans routes; 23% come from Foothill Transit routes; 5% come from Metrolink; and 1% come from Riverside Transit Authority.
2.3 Transit Service Characteristics Route 61 operates from 4:20 AM to 11:08 PM, Monday through Friday, with 15-minute headways from 5:45 AM to 6:00 PM, and 30-minute headways before and after. Saturday service is from 5:55 AM to 10:04 PM, and Sunday service is from 6:05 AM to 7:49 PM but is offered on 15-minute headways throughout both days. Route 66 operates eastbound from 5:06 AM to 9:15 PM and westbound from 4:19 AM to 10:25 PM, Monday through Friday, with 15-minute headways from 6:24 AM to 6:24 PM, and 30-minute headways before and after. Saturday and Sunday service begins one hour later and ends 1-1/2 hours earlier than weekday service, and is offered on 30-minute headways throughout both days.
The current operating hours and number of buses by day of the week on Route 61 and Route 66 are shown in Table 2-3. Typical weekday peak hour travel time on Route 61 is one hour and 35 minutes eastbound, and one hour and 30 minutes westbound, for average bus travel speeds of 12.9 mph and 13.6 mph, respectively. Route 66 typical peak hour travel time is one hour and 12 minutes eastbound, and one hour westbound.
On –Time Performance Route 61 ranks 11th out of 27 Omnitrans fixed routes in on-time performance based on the overall on-time number. Route 66 ranks 16th out of 27 Omnitrans fixed routes in on-time performance based on the overall on-time number.
Table 2-2: Route 61 Passenger Transfer Activity*
Route
Average transfers per
day to Route 61 Primary Transfer Location(s)
14 4,006 Pomona Metrolink Station
63 2,275 Ontario Transfer Center and Mountain Ave
66 2,051 Fontana Metrolink Station
83 1,667 Ontario Transfer Center
80 1,415 Ontario Transfer Center and Mountain Ave
65 1,412 Holt Blvd at Central Ave
15 1,349 Fontana Metrolink Station
19 1,308 Fontana Metrolink Station
82 1,217 South Fontana Transfer Center
68 1,163 Holt Blvd at Ramona Ave
81 1,119 Ontario Transfer Center; Ontario Mills
10 1,066 Fontana Metrolink Station Source: Omnitrans, 2012.
*May include direct transfers or subsequent bus other than first use

OMNITRANS WEST VALLEY CONNECTOR ALTERNATIVE ANALYSIS REPORT 2-7
2 – EXISTING CONDITIONS
Service Indicators Service indicators for Route 61 are presented in Table 2-4. The rank shows how well the route compares to other routes in the Omnitrans fixed route network.
Table 2-3: January 2013 Hours and Vehicles by Day for Route 61 and 66
Route 61 Weekday Saturday Sunday
Service Time Span 4:20 - 23:08 5:55 - 22:04 6:05 - 19:49
Frequency (in minutes) 15 15 15 Revenue Hours 197.56 161.78 149.62
Non-revenue Hours 9.82 10.20 10.67 Daily Total Hours 207.38 171.98 160.29
Number of Buses 14 13 13 Cycle time/Recovery time 210 minutes/27 minutes
Route 66 Weekday Saturday Sunday
Service Time Span 4:19-23:15 5:46-22:15 5:51-19:26
Frequency (in minutes) 15/30 30 30 Number of Buses 11 6 6
Cycle time/Recovery time 165 minutes/26 minutes Source: Omnitrans, SANBAG Comprehensive Operational Analysis
Table 2-4: Omnitrans Service Indicators
Route 61 2012
Weekday 2012
All Days Fixed Route
All Day System Rank
Passengers per Hour 29.2 27.7 20.3 8th Passengers per Mile 2.33 2.17 1.98 7th
Passengers per Peak Vehicle 106,959 134,311 110,379 18th
Cost per Hour $85.68 $86.26 $91.45 14th
Cost per Mile $ 6.83 $6.75 $7.08 13th
Cost per Passenger $ 2.93 $ 3.11 $3.57 28th
Cost per Peak Vehicle $313,316 $418,083 $394,385 20th
Revenue per Passenger $ 0.94 $0.95 $0.85 3rd
Farebox Recovery Ratio (%) 30.40 32.20 21.81 6th
Revenue Miles 642,173 866,561 7,910,462 1st
Operating Expenses $4,386,424 $5,853,157 $56,002,684 1st
Fare Revenues $1,413,773 $1,777,773 $13,359,408 1st
2.4 Traffic Conditions
2.4.1 Route 61 Corridor Existing traffic conditions in the Route 61 corridor vary with some areas experiencing congestion; however the majority of the corridor experiences low levels of traffic congestion. Auto travel time estimates

2-8 OMNITRANS WEST VALLEY CONNECTOR ALTERNATIVE ANALYSIS REPORT
2 – EXISTING CONDITIONS
provided by Google Maps indicate an estimated 58 minute travel time ranging to 68 minutes in traffic, indicating variability in travel delay of approximately 17% during peak hours.
Given the multiple roadways and the five jurisdictions that the corridor passes through, the physical character of the roadways exhibits a wide range of variability, as shown in Table 2-5
Table 2-5: Typical Roadway Cross Sections by Segment of Route 61
Roadway Jurisdiction # Through
Lanes Median Island
Striped Median Parking
Speed Limit
Garey Pomona 4 N Y Y 30 MPH Holt Pomona 4 N Y Y 35 MPH Holt Montclair 4 Y N N 45 MPH Holt Ontario 4 N Y Y 50 MPH Vineyard Ontario 6 N Y N 45 MPH Airport Ontario 6 Y N N 50 MPH Archibald Ontario 8 Y N N 45 MPH Inland Empire Ontario 4 Y Y N 45 MPH Milliken Ontario 8 Y N N 50 MPH Fourth Rancho Cucamonga 6 Y N N 55 MPH San Bernardino Fontana 4 Y N N 55 MPH Juniper Fontana 2 N N Y 35 MPH Marygold Fontana 2 N Y Y 25 MPH Sierra Fontana 4 N Y Y 35 MPH
West Valley Connector Corridor Existing traffic conditions in the West Valley Connector corridor vary amongst the five jurisdictions, with some areas experiencing more congestion than others. The following sections provide a summary of the traffic operations methodology and roadway segment LOS (Level of Service) in the corridor. They also provide a thorough assessment of the existing roadway geometric conditions, traffic volumes, congestion, and traffic control devices, in each jurisdiction through the corridor, from west to east. Figure 2-5 illustrates the study area and signalized intersections within each jurisdiction along the route.

OMNITRANS WEST VALLEY CONNECTOR ALTERNATIVE ANALYSIS REPORT 2-9
2 – EXISTING CONDITIONS
Figure 2-5: Signalized intersections on West
Valley Connector Corridor
Traffic Operations Traffic operating conditions along the corridor were evaluated at several arterials by using the volume-to-capacity (V/C) ratio methodology based on the average daily traffic (ADT) and the arterial segment daily capacity. Table 2-6 presents the range of V/C ratios associated with each LOS grade.
The capacity is the estimated amount of traffic that a roadway can accommodate given the number of travel lanes available, the classification of the roadway (freeway, major or minor arterial, collector or local street), and the posted speed limit. Daily roadway capacity can vary between jurisdictions. Table 2-7 presents the two-way daily capacity used in this analysis which has been applied in other nearby jurisdictions.
Table 2-8 summarizes the existing LOS at the roadway segments along the proposed corridor. The roadways are generally operating at good levels of service other than the south stretch of Sierra Avenue in Fontana.
Table 2-6: Level of Service Ranges
Level of Service Volume-to-Capacity Ratio
(V/C)
A < 0.60 B >0.60 to 0.69
C >0.70 to 0.79
D >0.80 to 0.89
E >0.90 to 0.99
F > 1.00
Table 2-7: Arterial Segment Daily Capacity
Facility Type Two-Way Daily Capacity
(vehicles/day)
6-lane Divided 56,300 4-lane Divided 37,500

2-10 OMNITRANS WEST VALLEY CONNECTOR ALTERNATIVE ANALYSIS REPORT
2 – EXISTING CONDITIONS
Table 2-8: Existing Traffic Operations Summary
Jurisdiction Route Segment ADT
Volume Configuration Capacity V/C LOS
Pomona Holt Ave From Eleanor St to Towne Ave
25,517 4-lane Divided 37,500 0.68 B
Montclair Holt Blvd From Yosemite Dr to Monte Vista Ave
18,656 4-lane Divided 37,500 0.50 A
Ontario
Holt Blvd From Mountain Ave to San Antonio Ave
18,624 4-lane Divided 37,500 0.50 A
Holt Blvd From Grove Ave to Imperial Ave
26,586 4-lane Divided 37,500 0.71 C
Inland Empire Blvd
From Mercedes Ln to Ferrari Ln
9,351 6-lane Divided 56,300 0.17 A
Rancho Cucamonga
Milliken Ave From Jersey Blvd to Arrow Rte
30,334 6-lane Divided 56,300 0.54 A
Foothill Blvd From Rochester Ave to Day Creek Blvd
42,212 6-lane Divided 56,300 0.75 C
Fontana
Foothill Blvd From Citrus Ave to Oleander Ave
26,298 4-lane Divided 37,500 0.70 B
Sierra Ave From Valencia Ave to Orange Way
22,235 4-lane Divided 37,500 0.59 A
Sierra Ave From Valley Blvd to Kaiser Permanente Drwy
43,668 5-lane Divided1 46,900 0.93 E
1 = Three lanes in the southbound direction and two lanes in the northbound direction Existing roadway characteristics, traffic volumes, congestion, and signal control, by jurisdiction from west to east are presented below.
City of Pomona The proposed West Valley Connector Corridor would begin at the Pomona Metrolink Station at the Main Street/Commercial Street intersection in Pomona. The route would continue north on Main Street for a short distance and continue east on Monterey Avenue. Main Street is an undivided roadway, consisting of one lane in each direction. On-street parking is allowed on both sides of Main Street along the route. Monterey Avenue also consists of one lane in each direction, but is divided by a painted median. Main Street and Monterey Avenue are local streets within the Downtown Pomona district and do not provide the higher travel speeds of the rest of the corridor, but they best accommodate local circulation needs to access the transit station.

OMNITRANS WEST VALLEY CONNECTOR ALTERNATIVE ANALYSIS REPORT 2-11
2 – EXISTING CONDITIONS
The West Valley Connector route would run along Monterey Avenue for two blocks, then run north on Garey Avenue for another two blocks to the Holt Avenue intersection. Garey Avenue is considered a major roadway, with two lanes in each direction and on-street parking on both sides of the street. Garey Avenue provides direct access to I-10.
Along Holt Avenue, the proposed route would span approximately eight miles, of which approximately two miles are Pomona. Holt Avenue is also considered a major roadway, oriented in an east-west direction parallel to I-10. Through Pomona, Holt Avenue consists of two lanes in each direction and a painted center turn lane. On-street parking is permitted on both sides of the street along a wide curb lane, up to 23 feet in some locations. East of East End Avenue to the city boundary at Mills Avenue, a raised center median with some landscaping is provided. The posted speed limit along Holt Avenue is 35 miles per hour in both directions. The corridor includes a mix of street-facing retail storefronts and driveways to small shopping centers.
Traffic Control There are ten traffic signals located along the approximately two-mile stretch, resulting in a density of approximately five signals per mile. Significant intersections along the route that could potentially be locations with higher congestion include the Towne Avenue and Indian Hill Boulevard intersections. Neither intersection includes dedicated right-turn lanes in the eastbound or westbound directions, though dual eastbound left-turn lanes are provided at the Indian Hill Boulevard intersection. Both streets provide direct access to I-10.
The Pomona signal system utilizes the McCain QuicNet software. All signal controllers along the proposed corridor route are 170 E type, with the exception of the Monterey Avenue/Garey Avenue intersection which uses a 170 type signal controller. The signal controllers currently use a combination of copper and fiber communication.
Traffic Operations In Pomona, Holt Avenue carries approximately 25,500 daily vehicles on a typical weekday, based on counts collected in April 2014. Figure 2-6 summarizes the hourly fluctuation of eastbound and westbound traffic.
Eastbound traffic volumes along Holt Avenue reach peak morning levels during a two-hour period between 10:00 a.m. and 12:00 p.m., but steadily increase throughout the day. The two-hour period between 4:00 p.m. and 6:00 p.m. in the evening has the highest eastbound volumes of the day. Westbound traffic volumes along Holt Avenue reach peak levels during a two-hour period between 7:00 a.m. and 9:00 a.m. in the morning and during a three-hour period between 2:00 p.m. and 5:00 p.m. in the evening. With two lanes in each direction, the peak hour capacity of Holt Avenue is estimated to be between 1,500 to 1,700 vehicles per hour. This section of Holt Avenue is operating well below capacity.
Based on the four-lane divided roadway configuration, this daily volume would translate to an LOS B operation for the segment. The area between East End Avenue and the closely spaced intersections of Indian Hill Boulevard and Mills Avenue, which includes the Village at Indian Hill, generally consist of heavy turning movements at intersections and driveways causing congestion.

2-12 OMNITRANS WEST VALLEY CONNECTOR ALTERNATIVE ANALYSIS REPORT
2 – EXISTING CONDITIONS
Figure 2-6: Hourly Volumes on Holt Avenue in Pomona
City of Montclair The proposed West Valley Connector Corridor would continue along Holt Boulevard for a little over two miles within Montclair (Holt Avenue becomes Holt Boulevard at the city boundary). Holt Boulevard is classified as a major street, oriented in an east-west direction parallel to I-10. Through Montclair, Holt Boulevard consists of two lanes in each direction and a raised center median with landscaping. Similar to Pomona, on-street parking is permitted on both sides of the street along a wide curb lane, up to 23 feet in some locations. The posted speed limit along Holt Boulevard is 45 miles per hour in both directions. The corridor includes several driveways to small retail shopping centers.
Traffic Control There are six traffic signals located along the more than two mile stretch, resulting in a density of approximately three signals per mile. Both Monte Vista Avenue and Central Avenue provide direct access to I-10. The Monte Vista Avenue intersection does not have dedicated right-turn lanes in the eastbound or westbound directions, though the curb lane is
Ave

OMNITRANS WEST VALLEY CONNECTOR ALTERNATIVE ANALYSIS REPORT 2-13
2 – EXISTING CONDITIONS
wide enough to accommodate one. Dedicated right-turn lanes are included at the Central Avenue intersection along with dual left-turn lanes in both directions.
Traffic Operations Within Montclair, Holt Boulevard carries approximately 18,650 daily vehicles on a typical weekday, based on counts collected in April 2014 just west of Monte Vista Avenue. Figure 2-7 summarizes the hourly fluctuation of eastbound and westbound traffic.
Figure 2-7: Hourly Volumes on Holt Boulevard in Montclair
In both the eastbound and westbound directions, there is no pronounced morning peak, as volumes increase throughout the day to peak in the afternoon around 4:00 to 5:00 p.m. The eastbound peak volume is approximately 50% higher than the westbound. Based on the four-lane divided roadway configuration, this daily volume would translate to an LOS A operation for the segment.
City of Ontario The proposed West Valley Connector Corridor would continue along Holt Boulevard for approximately four and a half miles within Ontario. Holt Boulevard is classified as a principal arterial, oriented in an east-west direction parallel to I-10 through the majority of the route. On the eastern end, Holt Boulevard transitions directly into the I-10 eastbound on-ramp and westbound off-ramp at Guasti Road, where the West Valley Connector will turn off of Holt Boulevard. Holt Boulevard consists of two lanes in each direction with a two-way left-turn lane through the majority of the route. Between Sultana Avenue and Euclid Avenue, Holt Boulevard consists of three lanes in the westbound direction. On-street parking is generally permitted on both sides of the street along a wide curb lane, though it is prohibited in the vicinity of Vineyard Avenue on the east end. The posted speed limit along Holt Boulevard is 40 miles per hour in both directions west of Bon View Avenue, and transitions to 45 miles per hour east of Bon View
2-14 OMNITRANS WEST VALLEY CONNECTOR ALTERNATIVE ANALYSIS REPORT
2 – EXISTING CONDITIONS
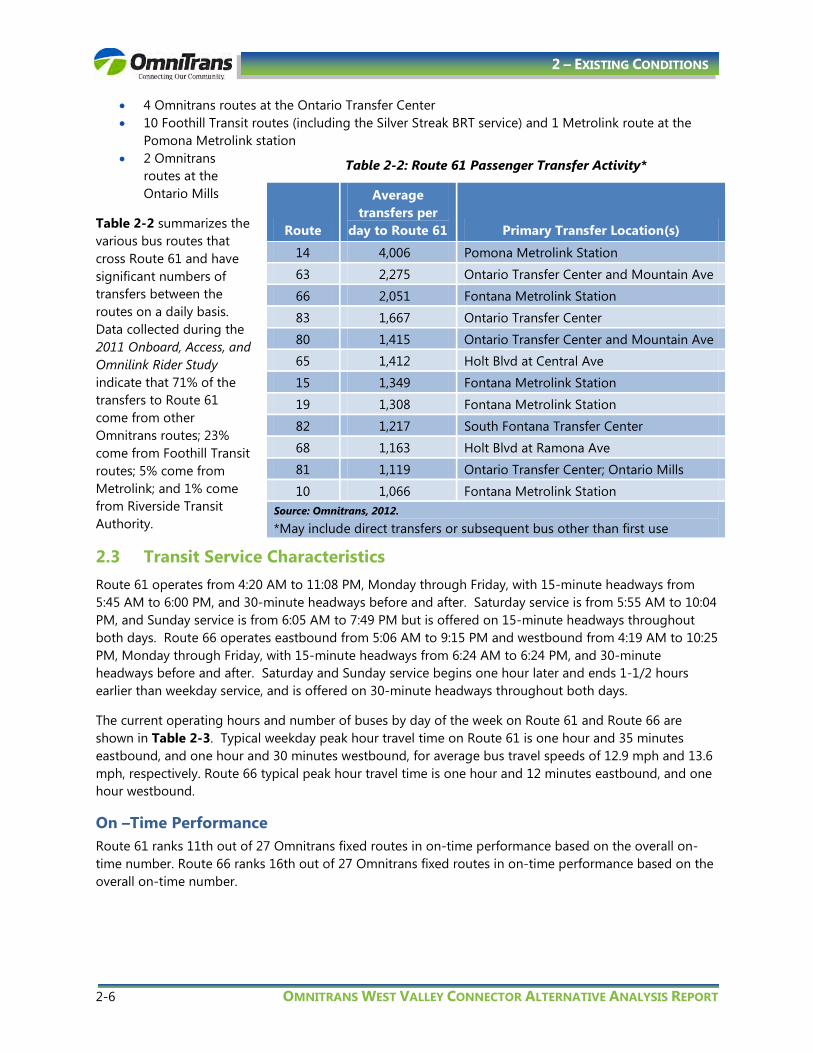
Avenue to Vineyard Avenue. The corridor includes street-facing retail storefronts west of Bon View Avenue. East of Bon View Avenue, Holt Boulevard serves mostly industrial or office uses.
The route would transition to Vineyard Avenue for a short distance to the Airport Drive intersection. Vineyard Avenue is a six-lane roadway with a two-way left-turn lane median. The route would then run along a one mile segment of Airport Drive between Vineyard Avenue and Archibald Avenue, directly serving Ontario International Airport patrons with a station between terminals 2 and 4 on Terminal Way. Airport Drive consists of three lanes in each direction with on-street parking prohibited.
The route would continue along Archibald Avenue from the Airport station to Inland Empire Boulevard, a distance of approximately half a mile. Archibald Avenue is classified as a principal arterial and provides direct access to I-10 via a single-point urban interchange. This segment consists of four lanes in each direction, with on-street parking prohibited.
From Archibald Avenue, the route would continue along Inland Empire Boulevard to Milliken Avenue, a distance of approximately 3.75 miles. Inland Empire Boulevard is classified as a secondary arterial, oriented in an east-west direction, with a posted speed limit of 45 miles per hour in both directions. Between Archibald Avenue and the vicinity of Haven Avenue, Inland Empire Boulevard consists of two lanes in each direction. Three lanes in each direction are provided between Haven Avenue and Milliken Avenue, with the route continuing east of Milliken Avenue serving Ontario Mills patrons along Mills Circle.
Milliken Avenue is classified as a principal arterial and is oriented in a north-south direction. Four lanes are provided in each direction as well as a raised landscaped median. The route would continue along Milliken Avenue for a short distance to the city boundary at Fourth Street.
Traffic Control The four and a half mile stretch of Holt Boulevard in Ontario includes twelve signalized intersections, resulting in a density of approximately two and a half signals per mile. Euclid Avenue and Vineyard Avenue are significant arterials, providing direct access to I-10. The Euclid Avenue intersection is wider than a typical intersection due to a 60 foot center median along Euclid Avenue. A dedicated right-turn lane is provided in the westbound direction. At Vineyard Avenue, dedicated right-turn lanes are provided in both directions along Holt Boulevard.
There are twelve traffic signals located along the 3.75 mile stretch of Inland Empire Boulevard, resulting in a density of approximately 3.2 signals per mile. Major intersections along Inland Empire Boulevard include the Haven Avenue and Milliken Avenue intersections. Both streets provide direct access to I-10. At Haven Avenue, office uses are located at three of the four corners of the intersection. Dual right-turn lanes are provided in the eastbound direction along with dual left-turn lanes. A free right-turn lane is provided in the westbound direction along with triple left-turn lanes.

OMNITRANS WEST VALLEY CONNECTOR ALTERNATIVE ANALYSIS REPORT 2-15
2 – EXISTING CONDITIONS
At the Milliken Avenue intersection with Inland Empire Boulevard, retail uses are located at all four corners, with the Ontario Mills located just east of Milliken Avenue. Frequent turn movements are to be expected due to mall traffic. Free right-turn lanes and dual left-turn lanes are provided in both directions of Inland Empire Boulevard at this intersection.
The Ontario signal system utilizes ASC2/3 software. The signal controllers along the proposed corridor route use NEMA type signal controllers. The signal controllers currently use a combination of copper, fiber, and radio communication.
Traffic Operations Within Ontario, Holt Boulevard carries between 18,600 and 26,600 daily vehicles on a typical weekday, based on counts collected in February 2013 at two segments. The western segment is between Mountain Avenue and San Antonio Avenue and the eastern segment is between Grove Avenue and Imperial Avenue. Figures 2-8 and 2-9 summarize the hourly fluctuation of eastbound and westbound traffic along the two segments.
At the western segment, traffic patterns are similar to Montclair in that volumes in both directions rise throughout the day to peak in the evening at 5:00 p.m., with the eastbound volume approximately 20% higher than the westbound. Based on the four-lane divided roadway configuration, the daily volume of 18,600 would translate to an LOS A operation for the segment.
At the eastern segment, traffic patterns are similar to many urban arterials with pronounced morning and afternoon peak periods. Also, the directionality is different than the segment to the west in that the westbound volume is consistently higher than the eastbound throughout the day.
Inland Empire Boulevard carries approximately 9,400 daily vehicles on a typical weekday, based on counts collected in April 2014 between Mercedes Lane and Ferrari Lane. Figure 2-10 summarizes the hourly fluctuation of eastbound and westbound traffic.
Figure 2-8: Hourly Volumes on the Western Portion of Holt Boulevard in Ontario

2-16 OMNITRANS WEST VALLEY CONNECTOR ALTERNATIVE ANALYSIS REPORT
2 – EXISTING CONDITIONS
Figure 2-9: Hourly Volumes on the Eastern Portion of Holt Boulevard in Ontario
Figure 2-10: Hourly Volumes on Inland Empire Boulevard
Eastbound traffic volumes along Inland Empire Boulevard are generally higher than westbound volumes, with the exception of the morning period between 6:00 to 9:00 a.m., with each reaching peak levels during

OMNITRANS WEST VALLEY CONNECTOR ALTERNATIVE ANALYSIS REPORT 2-17
2 – EXISTING CONDITIONS
mid-day and 5:00 p.m. Based on the six-lane divided roadway configuration, this daily volume would translate to an LOS A operation for the segment.
City of Rancho Cucamonga The proposed West Valley Connector Corridor would continue along Milliken Avenue for approximately two miles, within the City of Rancho Cucamonga, to the Foothill Boulevard intersection. Milliken Avenue, oriented in a north-south direction, is classified as a major divided arterial. Along this segment of Milliken Avenue, three lanes in each direction are provided as well as a raised landscaped median. The posted speed limit is 50 miles per hour in both directions. This segment serves mostly industrial or office uses, with on-street parking prohibited on both sides of the street.
Foothill Boulevard is also classified as a major divided arterial, oriented in an east-west direction. The proposed route would run approximately 2.4 miles between Milliken Avenue on the west and the city boundary on the east at East Avenue. Foothill Boulevard generally consists of three lanes in each direction including striped bike lanes, with some westbound segments between Etiwanda Avenue and East Avenue consisting of two lanes. The posted speed limit is 50 miles per hour in both directions on the western portion of the route and transitions to 55 miles per hour east of Cornwall Avenue. Foothill Boulevard provides direct access to I-15 via a partial cloverleaf interchange. On-street parking is prohibited on both sides of the street through Rancho Cucamonga. The corridor consists of mostly large retail shopping center uses.
Traffic Control Along the two mile stretch of Milliken Avenue, there are seven signalized intersections resulting in a density of approximately 3.5 signals per mile. Along the route, Fourth Street and Arrow Route could potentially be locations with higher vehicular delay. A dedicated right-turn lane is provided in the northbound direction at Fourth Street, as well as duel left-turn lanes in the northbound and southbound directions. Fourth Street provides direct access to I-15. At Arrow Route, dedicated right-turn lanes and dual left-turn lanes are provided in both directions on Milliken Avenue.
A high concentration of traffic signals is found along the 2.4 mile stretch of Foothill Boulevard within the city, thus potentially resulting in higher congestion. Significant intersections include the Day Creek Boulevard and I-15 Ramp intersections. The Day Creek Boulevard intersection includes large retail shopping centers at all four corners. A free right-turn lane is provided in the westbound direction along Foothill Boulevard and dual left-turn lanes are provided in both the eastbound and westbound directions.
In the eastbound direction on Foothill Boulevard at I-15, free right-turn lanes are provided onto the southbound direct on-ramp and further downstream onto the northbound loop on-ramp. Similarly in the westbound direction, free right-turn lanes are provided onto the northbound direct on-ramp and further downstream onto the southbound loop on-ramp.
The Rancho Cucamonga signal system utilizes Econolite software. The signal controllers currently use twisted pair communication.
Traffic Operations Within the City of Rancho Cucamonga, Milliken Avenue carries approximately 30,330 daily vehicles on a typical weekday, based on counts collected in April 2014. Figure 2-11 summarizes the hourly fluctuation of northbound and southbound traffic.

2-18 OMNITRANS WEST VALLEY CONNECTOR ALTERNATIVE ANALYSIS REPORT
2 – EXISTING CONDITIONS
Figure 2-11: Hourly Volumes on Milliken Avenue
Traffic patterns along Milliken Avenue closely resemble that of many urban arterials with the definitive morning and evening peak spikes in traffic, as well as the change in directionality with the southbound direction experiencing higher volume than the northbound in the morning but lower volume in the evening. Based on the six-lane divided roadway configuration, this daily volume would translate to an LOS A operation for the segment.
Within Rancho Cucamonga, Foothill Boulevard carries approximately 42,200 daily vehicles on a typical weekday, based on counts collected in April 2014 between Rochester Avenue and Day Creek Boulevard. Figure 2-12 summarizes the hourly fluctuation of eastbound and westbound traffic.

OMNITRANS WEST VALLEY CONNECTOR ALTERNATIVE ANALYSIS REPORT 2-19
2 – EXISTING CONDITIONS
Figure 2-12: Hourly Volumes on Foothill Boulevard in Rancho Cucamonga
Eastbound traffic volumes along Foothill Boulevard do not have an obvious peak period in the morning, as the volumes steadily increase throughout the day reaching peak levels at 5:00 p.m. Westbound volumes are lower than eastbound volumes overall, with the highest peak period occurring in the middle of the day between 11:00 a.m. and 1:00 p.m. Based on the six-lane divided roadway configuration, this daily volume would translate to an LOS C operation for the segment.
City of Fontana The proposed West Valley Connector corridor continues along Foothill Boulevard for approximately four and a half miles through Fontana. Foothill Boulevard is classified as a major highway, oriented in an east-west direction. Foothill Boulevard consists of three lanes of traffic in each direction and a raised median from the western city limits to Hemlock Avenue. A short segment of Foothill Boulevard, between Hemlock Avenue and Almeria Avenue is part of unincorporated San Bernardino County. This segment consists of two lanes in each direction with a two-way left-turn lane which transitions down to simply a striped double yellow line. East of Almeria Avenue, the corridor consists of three lanes in each direction until Tokay Avenue. Between Citrus Avenue and Sierra

2-20 OMNITRANS WEST VALLEY CONNECTOR ALTERNATIVE ANALYSIS REPORT
2 – EXISTING CONDITIONS
Avenue, Foothill Boulevard consists of two lanes in each direction with a two-way painted median and on-street parking provided via a wide curb lane. The posted speed limit is 55 miles per hour in both directions on the western portion of the route, transitions to 50 miles per hour, then to 45 miles per hour on the eastern portion between Almeria Avenue and Sierra Avenue.
Sierra Avenue is also classified as a major highway in Fontana. The proposed route would continue south on Sierra Avenue for approximately 2.25 miles, serving Downtown Fontana and the Transportation Center (Metrolink station), to Marygold Avenue. The route would traverse Marygold Avenue to Juniper Avenue to Valley Boulevard and back north on Sierra Avenue where it would terminate at the Kaiser Permanente Medical Center. Sierra Avenue consists of two lanes in each direction with a two-way left-turn lane median through the majority of the corridor. A raised median with landscaping is provided through the Downtown area between Arrow Boulevard and Orange Way, with on-street parking provided. The posted speed limit is 30 miles per hour through the northern part of the corridor and transitions to 35 miles per hour south of Merrill Avenue.
Traffic Control There are twelve traffic signals located along the four and a half mile stretch of Foothill Boulevard in Fontana, resulting in a density of approximately 2.7 signals per mile. Both Cherry Avenue and Citrus Avenue provide direct access to I-10, with Citrus Avenue providing access to SR-210 as well. Dedicated right-turn lanes and dual left-turn lanes are provided in the eastbound and westbound directions along Foothill Boulevard at Cherry Avenue. Dedicated right-turn lanes and single left-turn lanes are provided in the eastbound and westbound directions at Citrus Avenue.
A high concentration of traffic signals along the 2.3 mile stretch of Sierra Avenue can be found as a result of the type of area that the route runs through. The intersections at Arrow Boulevard, Valencia Avenue and Orange Way in the Downtown area are closely spaced and thus could be locations with queue backups. With the exception of the northbound approach at Orange Way, no dedicated right-turn lanes are provided along this stretch of Sierra Avenue. In addition, the intersection at Valley Boulevard would likely consist of higher congestion as large retail shopping centers are located at three corners of the intersection, with the Kaiser Permanente hospital located at the other corner. Valley Boulevard runs parallel and close to I-10, thus making it an alternate east-west route during peak periods of freeway congestion.
The Fontana signal system utilizes Econolite software. The signal controllers currently use a combination of fiber optic and leased copper line communication along Foothill Boulevard. Along Sierra Avenue, the controllers use fiber optic communication.
Traffic Operations Within Fontana, Foothill Boulevard carries approximately 26,300 daily vehicles on a typical weekday, based on counts collected in April 2014 just east of Citrus Avenue. Figure 2-13 summarizes the hourly fluctuation of eastbound and westbound traffic.

OMNITRANS WEST VALLEY CONNECTOR ALTERNATIVE ANALYSIS REPORT 2-21
2 – EXISTING CONDITIONS
Figure 2-13: Hourly Volumes on Foothill Boulevard in Fontana
Westbound traffic volumes along Foothill Boulevard are higher than eastbound volumes throughout the morning and into the mid-day. After 2:00 p.m., eastbound volumes increase to higher levels than the westbound volumes, which gradually decrease from their mid-day peak. The eastbound direction experiences a three-hour peak period in the afternoon from 3:00 p.m. to 6:00 p.m. Based on the four-lane divided roadway configuration, this daily volume would translate to a high LOS B or low LOS C operation for the segment.
Sierra Avenue carries between 22,200 and 43,700 daily vehicles on a typical weekday, based on counts collected in April 2014 at two segments. The northern segment is between Valencia Avenue and Orange Way in the Downtown area, and the southern segment is between the Kaiser Permanente driveway and Valley Boulevard adjacent to the Kaiser Permanente Medical Center. Figures 2-14 and 2-15 summarize the hourly fluctuation of northbound and southbound traffic along the two segments.
At the northern segment of Sierra Avenue, northbound and southbound traffic volume totals are roughly equal. Northbound volumes do not have a pronounced morning peak period, but rather gradually increase to a peak mid-day level at 12:00 p.m. and then again to a higher level at 4:00 p.m. Southbound volumes tend to follow the same morning pattern as the northbound volumes, but reach a peak level at 10:00 a.m. and maintain this volume until 3:00 p.m. Based on the four-lane divided roadway configuration, this daily volume would translate to an LOS A operation for the segment.
At the southern segment, northbound traffic volumes along Sierra Avenue are generally higher than the southbound volumes throughout the day. Northbound volumes gradually rise throughout the day, without a definitive morning peak period, reaching peak levels at 5:00 p.m. Similar to the northern segment, the southbound traffic volumes increase up to a four-hour afternoon peak period from 2:00 p.m. to 6:00 p.m. Based on the five-lane divided roadway configuration at this segment, with three southbound lanes and two northbound lanes, this daily volume would translate to an LOS E operation.

2-22 OMNITRANS WEST VALLEY CONNECTOR ALTERNATIVE ANALYSIS REPORT
2 – EXISTING CONDITIONS
Figure 2-14: Hourly Volumes on Northern Portion of Sierra Avenue
Figure 2-15: Hourly Volumes on Southern Portion of Sierra Avenue

OMNITRANS WEST VALLEY CONNECTOR ALTERNATIVE ANALYSIS REPORT 2-23
2 – EXISTING CONDITIONS
2.4.2 Forecasted Traffic Conditions Traffic growth is expected as a result of the build-out of the study area. This traffic growth would result in increased congestion from the levels described earlier in this section. Table 2-9 summarizes the growth in traffic along the corridor based on base year (2008) and horizon year (2035) model volumes.
Table 2-9: Future Year 2035 Traffic Volume Growth
Jurisdiction Route Segment
AM Peak Hour PM Peak Hour
2008 Volumes (2-way)
2035 Volumes (2-way)
% Change
2008 Volumes (2-way)
2035 Volumes (2-way)
% Change
Pomona Holt Ave From Towne Ave to Mills Ave
4,300 5,400 25.6% 8,400 9,600 14.3%
3,600 4,400 22.2% 7,200 8,500 18.1%
6,100 8,200 34.4% 11,200 13,8000 23.2%
Montclair Holt Blvd From Mills Ave to Benson Ave
3,600 4,500 25.0% 8,700 9,800 12.6%
3,300 4,400 33.3% 6,700 7,000 4.5%
2,700 4,000 48.1% 6,300 7,900 25.4%
Ontario
Holt Blvd Benson Ave to Mountain Ave
3,300 5,100 54.5% 7,100 11,100 56.3%
Holt Blvd
Mountain Ave to Euclid Ave
2,500 4,500 80.0% 5,400 9,800 81.5%
2,400 5,100 112.5% 5,200 10,800 107.7%
Euclid Ave to Grove Ave 2,700 7,500 177.8% 6,900 14,800 114.5%
3,100 8,100 161.3% 5,900 14,500 145.8%
Grove Ave to Vineyard Ave
4,300 10,500 144.2% 7,700 18,400 139.0%
Inland Empire Blvd
Archibald Ave to Haven Ave
900 1,400 55.6% 1,800 3,300 83.3%
Rancho Cucamonga
Milliken Ave Fourth St to Foothill Blvd
3,600 4,800 33.3% 6,800 8,600 26.5%
3,800 4,700 23.7% 6,600 8,000 21.2%
Foothill Blvd Milliken Ave to I-15 4,800 6,200 29.2% 8,800 11,300 28.4%
6,000 7,400 23.3% 10,4000 12,0000 15.4%
Fontana
Foothill Blvd East Ave to Cherry Ave 5,600 8,100 44.6% 8,800 14,200 61.4%
5,600 8,300 48.2% 9,200 13,9000 51.1%
Foothill Blvd Cherry Ave to Beech Ave
5,700 7,400 29.8% 9,000 12,600 40.0%
5,500 7,100 29.1% 8,600 12,3000 43.0%
Foothill Blvd Beech Ave to Citrus Ave 5,100 6,500 27.5% 7,900 10,600 34.2%
Foothill Blvd Citrus Ave to Sierra Ave 4,200 6,600 57.1% 6,800 10,600 55.9%
Sierra Ave Foothill Blvd to San Bernardino Ave
4,500 6,100 35.6% 6,800 9,200 35.3%
4,900 6,400 30.6% 7,600 9,700 27.6%
As shown in Table 2-9, one third of the roadway segments in the study area are projected to experience considerable growth in excess of 50%. Most notably, along Holt Boulevard, between Mountain Avenue and Vineyard Avenue in Ontario, traffic volumes are projected to more than double in both peak periods. In addition, the Sierra Avenue segment in Fontana was noted as the only segment showing unsatisfactory operations (LOS E) in existing conditions. With traffic growth in the area, this section of Sierra Avenue is expected to continue to operate below acceptable conditions.

2-24 OMNITRANS WEST VALLEY CONNECTOR ALTERNATIVE ANALYSIS REPORT
2 – EXISTING CONDITIONS
It is expected that as traffic volumes increase along the corridor as a result of development within the region, bus ridership would also increase. The expected increase in traffic volumes, particularly in areas of already existing congestion, may lead to reduced bus travel speeds and increased bus delay through the corridor. Some of the bus delay may be offset with transit signal priority (TSP) applications as discussed in Appendix A.
2.5 Land Use
2.5.1 Existing Land Use Land Use and Urban Design Segments The Route 61 Corridor is 20.4 miles long and has multiple discreet urban design conditions along its length. The corridor consists of six segments based on the city/county boundaries, as listed below:
• City of Pomona – 2.2-mile segment between Main Street at the Pomona Transit Center and Holt Avenue at Mills Avenue
• City of Montclair – 2.1-mile segment between Holt Boulevard at Mills Avenue and Holt Boulevard at Benson Avenue
• City of Ontario – 11.2-mile segment between Holt Boulevard at Benson Avenue and Fourth Street at Etiwanda Avenue
• City of Rancho Cucamonga – This segment between Fourth Street at Milliken Avenue and Fourth Street at Etiwanda Avenue matches with Ontario’s boundary along Fourth Street from Milliken Avenue to Etiwanda Avenue
• San Bernardino County (Unincorporated Area) – 3.3-mile segment between San Bernardino Avenue at Etiwanda Avenue to San Bernardino Avenue at Fontana Avenue (Fourth Street becomes San Bernardino Avenue)
• City of Fontana – 3.0-mile segment between San Bernardino Avenue at Fontana Avenue and Orange Way at the Fontana Metrolink Station
The West Valley Connector Corridor is 25.2 miles long, and has multiple discreet urban design conditions along its length. The corridor consists of five segments based on the City/County boundaries, as listed below:
• The segments for the City of Pomona and the City of Montclair are identical as described above for Route 61
• City of Ontario – 9.2-mile segment between Holt Boulevard at Benson Avenue and Fourth Street at Milliken Avenue
• City of Rancho Cucamonga – 3.5-mile segment between Fourth Street at Milliken Avenue and Foothill Boulevard at East Avenue
• City of Fontana – 8.2-mile segment between Foothill Boulevard at East Avenue and Sierra Avenue at Kaiser Permanente Medical Center
Figure 2-16 illustrates the existing land use patterns within the corridor for Route 61 for stations in San Bernardino County. The corridor contains a diverse collection of land use types, including significant destinations in commercial, public facilities/educational and industrial uses. Medium- and high-density residential uses are present in substantial clusters around Downtown Pomona, Ramona, Haven, Milliken and Sierra Avenues. The overall character of the corridor as it relates to existing land uses include 37.3% low density residential, 16.1% commercial, 14.9% vacant land/non-developed, 11% industrial, 6.4% medium-high density residential, 4.2% public facilities, 4.2% transportation, 2.4% office, 1.1% open space and recreation, 1% educational, 0.7% under construction, 0.6% agriculture, and 0.1% water.

OMNITRANS WEST VALLEY CONNECTOR ALTERNATIVE ANALYSIS REPORT 2-25
2 – EXISTING CONDITIONS
Figu
re 2
-16:
Rou
te 6
1 Ex
isti
ng L
and
Use

2-26 OMNITRANS WEST VALLEY CONNECTOR ALTERNATIVE ANALYSIS REPORT
2 – EXISTING CONDITIONS
Figure 2-17 illustrates the West Valley Connector Corridor, which also offers a wide variety of existing land uses along the corridor, including significant destinations, retail and office commercial, institutional, and public uses. Medium/high-density residential uses are clustered along the Holt Boulevard and Foothill Boulevard spine. This mixture is conducive to high transit activity between points along the corridor. As described below in section 2.6.2, local land use plans and policies in the cities of the corridor are supportive of establishing communities that integrate transit and other alternative modes of transportation into the fabric of planned development. The overall character of the corridor as it relates to existing land uses include 36.7% low-density residential, 16.9% vacant/non-developed, 15.9% commercial, 9.3% industrial, 6.6% medium-high density residential, 4.6% transportation, 3.9% public facilities, 2.4% office, 1.4% open space, 0.9% under construction, 0.8% educational, 0.6% agricultural, and 0.1% water & floodway.
City of Pomona Land Use Starting in the west, Pomona Metrolink Station/Transit Center is surrounded largely by medical and auto-related uses. Garey Avenue, the primary north-south arterial adjacent to the transit center, is considered the gateway into Pomona’s Downtown to the south, and is surrounded by civic uses, and commercial/retail properties. In addition to the Transit Center, the YMCA building on Garey Avenue anchors the area. Holt Avenue between Garey Avenue and Mills Avenue is primarily dominated by older retail and auto-related uses and passes by the Indian Hill Mall on the eastern end of Pomona.
City of Montclair Land Use Holt Boulevard between Mills Avenue and Benson Avenue is primarily dominated by older retail and auto-related uses.
City of Ontario Land Use Along Holt Boulevard on the east are numerous vacant lots and older commercial uses as one approaches historic downtown Ontario. A majority of vacant and underutilized parcels are located along the Corridor east of Sultana Avenue. As the Corridor approaches the airport, a few high density residential developments immediately east of Euclid Avenue (a major north-south arterial) have recently been constructed near downtown Ontario. Hospitality uses dominate the eastern edge of this segment along Holt Boulevard. The Ontario Convention Center and a number of hotels are located in the immediate vicinity of the Holt Boulevard and Vineyard Avenue intersection. These uses are complemented by surrounding restaurants, auto uses, and Ontario International Airport.
Airport Drive, along the northern edge of Ontario International Airport, is adjacent to airport parking lots and service roads to the south, and the railroad tracks to the north. Access to the airport is from Airport Drive and Archibald Avenue. The Guasti property, northeast of the airport entry, currently has vacant land surrounding the historic structures on site but is planned for future mixed-use development which will complement the airport uses. Along Archibald Avenue, there are vacant and industrial properties.
Inland Empire Boulevard is surrounded by multi-family residential developments on the north side and industrial and commercial uses on the south side. Inland Empire Boulevard, near Milliken Avenue, is dominated by restaurants, 5 to 10-story office towers and hotels with surface parking, the adjacent I-10 Freeway, Founder’s Garden, a large formal park dedicated to the founding of Ontario, and Ontario Mills, a major regional shopping center east of Milliken Avenue.

OMNITRANS WEST VALLEY CONNECTOR ALTERNATIVE ANALYSIS REPORT 2-27
2 – EXISTING CONDITIONS
Figu
re 2
-17:
Wes
t V
alle
y Co
nnec
tor
Exis
ting
Lan
d U
se

2-28 OMNITRANS WEST VALLEY CONNECTOR ALTERNATIVE ANALYSIS REPORT
2 – EXISTING CONDITIONS
City of Rancho Cucamonga Land Use The Route 61 corridor, on Milliken Avenue, between Inland Empire Boulevard and Fourth Street, is largely dominated by restaurants and retail. Milliken Avenue and Fourth Street to the I-15 Freeway is characterized by Ontario Mills, restaurants, and retail.
The West Valley Connector Corridor for Rancho Cucamonga runs adjacent to medium-high density multifamily residential along Milliken Avenue north of Fourth Street, with a focus on industrial, the Empire Lakes Golf Course, and the Rancho Cucamonga Metrolink Station on the west side of Milliken Avenue. There are commercial nodes at both ends of Milliken Avenue, at Milliken Avenue and Foothill Boulevard and Milliken and Fourth Street, comprising primarily of restaurants, strip retail, and hospitality uses. The west side of Milliken Avenue is characterized by industrial and commercial uses. Along Foothill Boulevard, planned communities include Victoria Gardens and Terra Vista with commercial uses comprising primarily of restaurants, commercial, small scale and big box retail. There is some multifamily and single-family housing along Foothill Boulevard, and undeveloped land.
County of San Bernardino Land Use The Route 61 corridor alignment begins on Fourth Street from the I-15 Freeway to Etiwanda Avenue. Fourth Street then becomes San Bernardino Avenue from Etiwanda Avenue to Cherry Avenue and is lined by large scale industrial buildings, vacant land, the West Valley Detention Center, and California Steel Industries. West of Cherry Avenue, San Bernardino Avenue is characterized by single-family residential neighborhoods, public facilities, and some industrial uses.
City of Fontana Land Use The Route 61 corridor alignment along San Bernardino Avenue from Fontana Avenue to Sierra Avenue is primarily single-family residential neighborhoods, public facilities (schools such as Fontana High School), and some commercial uses. There is some medium to high-density residential development, and commercial uses are concentrated at San Bernardino Avenue and Sierra Avenue. Kaiser Permanente Medical Center is the focus of a node of commercial on Sierra Avenue near Valley Boulevard. Sierra Avenue has retail development, auto related uses, and vacant/undeveloped land. Sierra Avenue between Ceres Avenue and the Metrolink railroad is fronted by newer high-density residential senior housing on both sides. The intersection of Sierra Avenue and Orange Avenue acts as a gateway entry into the Fontana Metrolink Station and the historic Downtown Fontana leading northward towards Fontana Civic Center and the Pacific Electric Bike Trail.
The West Valley Connector Corridor Alignment for Fontana begins from East End Avenue going eastward along Foothill Boulevard. General commercial/retail and auto-related activities are the primary uses, comprising of mechanic shops, restaurants, banks, and some small-scale and big-box retail. Vacant/undeveloped land dominates the corridor between Cherry Avenue and Citrus Avenue. East of Citrus Avenue, along Foothill Boulevard to Sierra Avenue are major streets lined with commercial uses with single family and medium and high-density housing behind the commercial.
Both corridors for Route 61 and West Valley Connector Corridor have a strong market for transit. This is due to the study corridor being home to several important employment, educational, and activity centers where public transit demand by workers, shoppers, students, visitors, and others is concentrated. The West Valley Connector Corridor adds Victoria Gardens as a potential destination to be connected to Ontario Mills, Ontario Airport, and Kaiser Permanente Medical Center and provides new direct connections between three Metrolink stations.
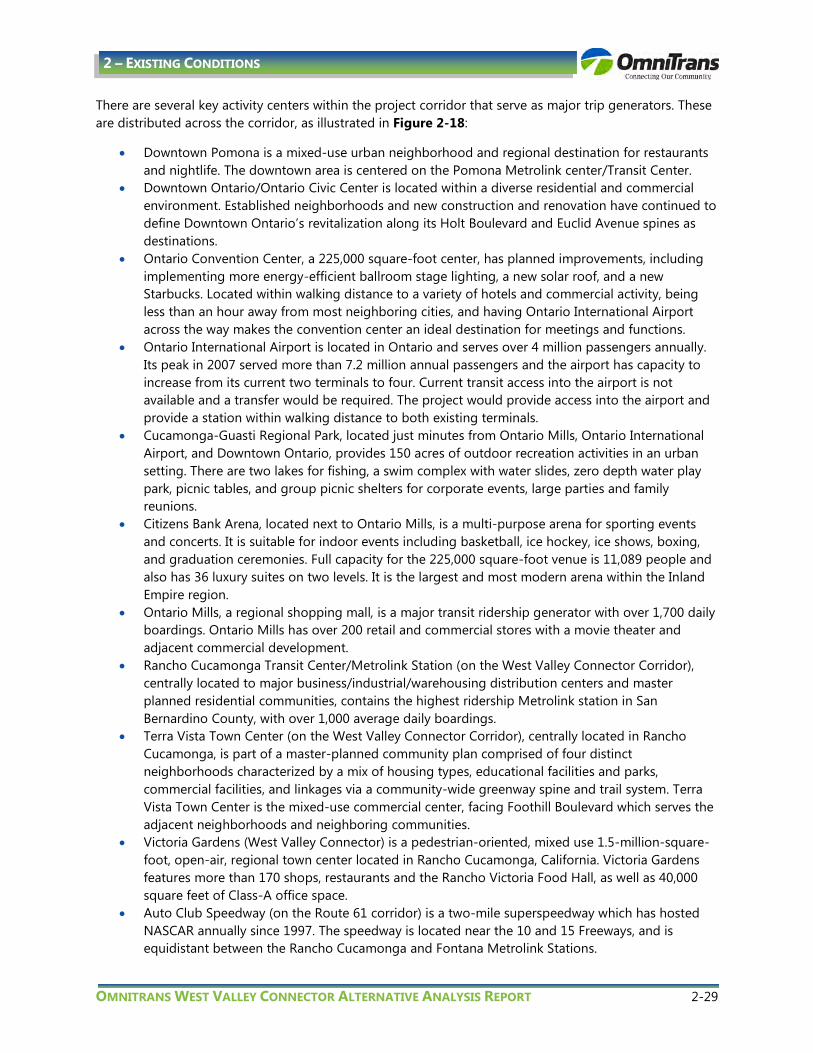
OMNITRANS WEST VALLEY CONNECTOR ALTERNATIVE ANALYSIS REPORT 2-29
2 – EXISTING CONDITIONS
There are several key activity centers within the project corridor that serve as major trip generators. These are distributed across the corridor, as illustrated in Figure 2-18:
• Downtown Pomona is a mixed-use urban neighborhood and regional destination for restaurants and nightlife. The downtown area is centered on the Pomona Metrolink center/Transit Center.
• Downtown Ontario/Ontario Civic Center is located within a diverse residential and commercial environment. Established neighborhoods and new construction and renovation have continued to define Downtown Ontario’s revitalization along its Holt Boulevard and Euclid Avenue spines as destinations.
• Ontario Convention Center, a 225,000 square-foot center, has planned improvements, including implementing more energy-efficient ballroom stage lighting, a new solar roof, and a new Starbucks. Located within walking distance to a variety of hotels and commercial activity, being less than an hour away from most neighboring cities, and having Ontario International Airport across the way makes the convention center an ideal destination for meetings and functions.
• Ontario International Airport is located in Ontario and serves over 4 million passengers annually. Its peak in 2007 served more than 7.2 million annual passengers and the airport has capacity to increase from its current two terminals to four. Current transit access into the airport is not available and a transfer would be required. The project would provide access into the airport and provide a station within walking distance to both existing terminals.
• Cucamonga-Guasti Regional Park, located just minutes from Ontario Mills, Ontario International Airport, and Downtown Ontario, provides 150 acres of outdoor recreation activities in an urban setting. There are two lakes for fishing, a swim complex with water slides, zero depth water play park, picnic tables, and group picnic shelters for corporate events, large parties and family reunions.
• Citizens Bank Arena, located next to Ontario Mills, is a multi-purpose arena for sporting events and concerts. It is suitable for indoor events including basketball, ice hockey, ice shows, boxing, and graduation ceremonies. Full capacity for the 225,000 square-foot venue is 11,089 people and also has 36 luxury suites on two levels. It is the largest and most modern arena within the Inland Empire region.
• Ontario Mills, a regional shopping mall, is a major transit ridership generator with over 1,700 daily boardings. Ontario Mills has over 200 retail and commercial stores with a movie theater and adjacent commercial development.
• Rancho Cucamonga Transit Center/Metrolink Station (on the West Valley Connector Corridor), centrally located to major business/industrial/warehousing distribution centers and master planned residential communities, contains the highest ridership Metrolink station in San Bernardino County, with over 1,000 average daily boardings.
• Terra Vista Town Center (on the West Valley Connector Corridor), centrally located in Rancho Cucamonga, is part of a master-planned community plan comprised of four distinct neighborhoods characterized by a mix of housing types, educational facilities and parks, commercial facilities, and linkages via a community-wide greenway spine and trail system. Terra Vista Town Center is the mixed-use commercial center, facing Foothill Boulevard which serves the adjacent neighborhoods and neighboring communities.
• Victoria Gardens (West Valley Connector) is a pedestrian-oriented, mixed use 1.5-million-square-foot, open-air, regional town center located in Rancho Cucamonga, California. Victoria Gardens features more than 170 shops, restaurants and the Rancho Victoria Food Hall, as well as 40,000 square feet of Class-A office space.
• Auto Club Speedway (on the Route 61 corridor) is a two-mile superspeedway which has hosted NASCAR annually since 1997. The speedway is located near the 10 and 15 Freeways, and is equidistant between the Rancho Cucamonga and Fontana Metrolink Stations.

2-30 OMNITRANS WEST VALLEY CONNECTOR ALTERNATIVE ANALYSIS REPORT
2 – EXISTING CONDITIONS
• Downtown Fontana (on the West Valley Connector Corridor) is surrounded by a vibrant mix of commercial, civic, and residential uses including destinations such as Downtown’s commercial core, Civic Center, Pacific Electric Bike Trail, and Fontana Transit Center.
• Fontana Transit Center/Metrolink Station, located in Downtown Fontana and adjacent to Santa Fe Park, is connected into the community, Downtown’s commercial core and other civic destinations. It serves as a Transit Plaza for area residents and visitors and functions as a destination within the City.
• Kaiser Permanente Fontana Medical Center is a 482,078 square-foot hospital located at Sierra Avenue and Valley Boulevard, across from the existing South Fontana Transit Center. The project would provide a station location immediately adjacent to the hospital.
Figure 2-18: West Valley Corridor Trip Attractors and Activity Centers
The activity centers summarized above are also outlined and organized by City/County in Table 2-10 in the following section.
2.5.2 Land Use Plans and Policies Existing plans for the cities of Pomona, Montclair, Ontario, Rancho Cucamonga, and Fontana and the County of San Bernardino were reviewed for relevance to the Route 61 and subsequent West Valley Connector Corridor. The information on the plans is summarized, cataloged and paraphrased within Appendix B. For more detailed information, refer to each jurisdiction’s individual plan, as well as zoning ordinance. Table 2-10 below briefly summarizes relevant urban design and mobility information by City/County and transit supportive land uses.

OMNITRANS WEST VALLEY CONNECTOR ALTERNATIVE ANALYSIS REPORT 2-31
2 – EXISTING CONDITIONS
Table 2-10: Activity Centers and Summary of Transit Supportive Land Use in the Cities’ Plans
Pomona Montclair Ontario Rancho Cucamonga
County of San
Bernardino Fontana
Activity Centers Adjacent to Corridor
• Pomona Transit Center • Downtown Pomona • Indian Hill Market Place
Shopping Center • Garfield Park
• Indian Hill Market Place Shopping Center
• Saratoga Park
• Ontario Civic Center • Downtown Ontario • Ontario Convention
Center • Ontario International
Airport • Future Multi-Modal
Transit Center • Citizens Bank Arena • Ontario Mills Mall • Cucamonga-Guasti
Regional Park
• Rancho Cucamonga Transit Center
• Metrolink Station • Empire Lakes Golf Course • Terra Vista Town Center • Victoria Gardens
Shopping Center • Victoria Gardens Cultural
Center
Auto Club Speedway
• Fontana Transit Center/Metrolink
• Downtown Fontana • Pacific Electric Bike
Trail • Kaiser Hospital • Jack Bulik Park
Transit Supportive Land Uses Planned around Proposed Stations
• Two out of the three station areas designed as transit nodes
• The area around the Pomona Transit Center allows for mixed-use up to 12 stories and a density between 80 and over 100 du/acre.
• The area around the Indian Hill station area allows for 6 stories max and 80 du/acre
Mixed Use encouraged in Holt Boulevard Specific Plan with densities ranging from 6-24 units/acre
The corridor passes through eight separate mixed-use designations with densities ranging from 14 to 125 units/acre, the most intensities designations in the city
The corridor passes through four separate mixed-use designations with densities ranging from 4 to 100 units/acre and an FAR range of 0.4-1.0
NA The West Valley Connector Corridor passes through Fontana’s Downtown and Commercial Cores designated with densities ranging from 7.7 to 24 units/acre and an FAR range of 0.1-1.0 for non-residential uses
Route for BRT Included in City General Plan
Holt Avenue designated as a Primary Local Transit Corridor
NA Holt Boulevard, Archibald Avenue, and Fourth Street Designated as BRT Corridors
Fourth Street: Primary Transit Corridor (BRT) Milliken Avenue: Secondary Transit Corridor (Regional Service) Foothill Boulevard: Primary Transit Corridor (BRT) until Victoria Gardens
NA NA
For the cities along the corridor most of the proposed station areas are planned for more intensive and dense mixed-use development, and in some cases the most intensive designations in the city. Table 2.5-1 summarizes transit supportive land uses along the corridor, is further detailed in each city’s Plans, which guide the land use and urban design of the West Valley Connector Corridor, and are described in more detail within Appendix B and include:
City of Pomona • General Plan
•
: Outlines Strategic Action Areas and approaches for achieving higher intensity, transit-oriented districts with activity centers, mixed-use pedestrian friendly environments. Downtown Pomona Specific Plan
•
: Encourages infill development and the creation of a vibrant Downtown atmosphere through the promotion of housing opportunities and mixed-use development. Pomona Corridors Specific Plan
City of Montclair
: Establishes a design framework and provides the planning tools for enhancing the economics, functionality and aesthetics of Garey Avenue, Holt Avenue, Mission Boulevard, and Foothill Boulevard.
• General Plan: Encourages, with the new Planned Development land use category, a cohesive development of a mix of land uses such as commercial, office, and residential uses.

2-32 OMNITRANS WEST VALLEY CONNECTOR ALTERNATIVE ANALYSIS REPORT
2 – EXISTING CONDITIONS
• Holt Boulevard Specific Plan
City of Ontario
: Creates policies to require master planning at key sites to employ a Mixed-use Planned Development concept and integrates access to parking, pedestrian, and transit facilities.
• General Plan
•
: Provides a vision for an “intense mixture of uses” with eight mixed-use designations and growth centers which will facilitate the use of transit and create hubs for community activity. Guasti Plaza Specific Plan
• : Incorporated into the General Plan as a Mixed-Use Designation.
Meredith International Centre Specific Plan
•
: Incorporated into the General Plan as a Mixed-Use Designation. Park Center Specific Plan, Amended as Ontario Festival Specific Plan
•
: Promotes mixed-use, commercial and residential development with varying intensities and commercial uses. R.H. Wagner Properties Specific Plan
•
: Proposes 1.7 million square feet of high-rise commercial development in an urban setting. Ontario Center Specific Plan
• : Incorporated into the General Plan as a Mixed-Use Designation.
Ontario Mills Specific Plan•
: Incorporated into the General Plan as a Mixed-Use Designation. The Exchange Specific Plan
•
: Integrates a mix of commercial and retail services, specialty shops and light industrial uses. Holt Boulevard Mobility and Streetscape Strategic Plan
City of Rancho Cucamonga
: Promotes the integration of multiple modes of transportation along Holt Boulevard, including a BRT concept.
• General Plan
•
: Offers, through mixed-use designations and areas, opportunities for intensely developed districts which combines commercial, office, residential, and community uses in areas with access of transit. Sub-Area 18 Specific Plan
•
: Provides for, as an amendment to the Rancho Cucamonga Industrial Area Specific Plan (IASP), a wider and more flexible range of uses than was provided in the Rancho Cucamonga IASP to include uses such as multiple-family residential, hotel/conference center, retail, restaurant, entertainment, and office to maximize the potential offered by the Rancho Cucamonga Metrolink Station. Foothill Boulevard Specific Plan
•
: Identified four planning subareas as districts and activity centers to enhance the historical significance of Route 66, and create a more vibrant urban character along Foothill Boulevard with an integrated regulatory set of land use, development standards, and design guidelines. Terra Vista Community Plan
•
: Consists of four distinct neighborhoods served by mixed-use commercial centers facing Foothill Boulevard, with adjacent medium-high-density to high-density housing to expand leisure, employment, and transit opportunities. Victoria Community Plan
•
: Defines areas for four residential villages, related support uses and a mass transit facility. Victoria Arbors and Victoria Gardens Master Plans
•
: Represents Area 4 (Victoria Lakes Village) of the Victoria Community Plan and promotes the vibrant mixed-use center (Victoria Gardens) of the Victoria Arbors community. Foothill Boulevard Visual Improvement Plan
•
: Shapes the public realm and establishes design concepts for streetscape improvements of Foothill Boulevard in Rancho Cucamonga. Rancho Cucamonga Foothill Boulevard BRT Corridor Study: Provides recommendations on regulatory documents to promote multi-modal travel, including transit, along Foothill Boulevard and identifies mixed-use opportunities.

OMNITRANS WEST VALLEY CONNECTOR ALTERNATIVE ANALYSIS REPORT 2-33
2 – EXISTING CONDITIONS
City of Fontana • General Plan
•
: Promotes an accessible Downtown and its proximity to rail with a broad range of new and infill housing opportunities, and aims to transform aging corridors into thriving boulevards by providing mixed-use development. Sierra Valley Boulevard Land Use Study
2.6 Urban Design
: Aims to improve land uses and integrate them with multi-modal transportation alternatives, improve community connectivity with Kaiser Permanente Fontana Medical Center, diversify housing opportunities, and enhance the pedestrian environment on Sierra Avenue and Valley Boulevard.
2.6.1 Urban Design Character The urban design character of the corridor varies widely depending on the existing activity centers, land uses, existing physical conditions of the major streets, pedestrian environment, and the relationship and scale of buildings and development to the streets. For detail as to physical and urban design conditions including typical street cross-sections, see Appendix B. A summary of the urban design character for each city/county segment follows:
Segment 1 – City of Pomona Along the corridor in Pomona, there are three major activity centers: the Pomona Transit Center, the Pomona Civic Center in downtown, and the Indian Hill Market Place Shopping Center. The Downtown and Pomona Metrolink/Transit Center areas are urban in character (up to five stories tall) and are relatively pedestrian friendly, as illustrated in Figure 2-19. Sidewalks on Garey Avenue and on Holt Avenue range 10 ft to 15 ft in width with street trees, parking at the curb, small-scale retail/commercial buildings located close to or at the sidewalk edges, providing visual interest. The east end of Holt Avenue has similar sidewalk widths and trees; however, the development pattern is more suburban with single-story buildings set back from the street with a large amount of surface parking in front, such as the older Indian Hill Place Shopping Center. Commercial Street and Main Street leading from the Transit Center have two travel lanes, and Garey Avenue and Holt Avenue have four travel lanes, plus a left turn lane. The General Plan calls for enhancing the pedestrian realm to transition from an auto-dominated atmosphere to intense mixed-use environments. Wide sidewalks are provided and are in good physical condition, including decorative and striped crosswalks and street trees. In addition, the General Plan introduces a tree-lined median, wider sidewalks and improved and/or additional crosswalks to form a safer pedestrian atmosphere. Bike lanes are not provided, but the General Plan proposes streetscape improvements to the open space network such as bikeways, along Holt Avenue, where appropriate.

2-34 OMNITRANS WEST VALLEY CONNECTOR ALTERNATIVE ANALYSIS REPORT
2 – EXISTING CONDITIONS
Figure 2-19: Typical Cross-Section along Holt Avenue in the City of Pomona
Segment 2 – City of Montclair Within the City of Montclair, development today has a suburban character, as illustrated in Figure 2-20, consisting of primarily one-story service commercial and auto-oriented uses and some two-story residential in clusters along the corridor. Holt Boulevard has four travel lanes, a landscaped median, parking at the curb, a narrow sidewalk at the curb, and some landscaping on private property. Buildings are generally set back from the street with surface parking between the sidewalk and the buildings. The Urban Design Framework for the Holt Boulevard Specific Plan includes various streetscape concepts and gateway node improvements for enhancing the overall pedestrian character of Holt Boulevard. Wide sidewalks are in good physical condition, including decorative and striped crosswalks and street trees. Bike lanes are not provided nor are they currently planned for Holt Boulevard, but the General Plan’s circulation policies do promote the development of a detailed bicycle route plan, which would include developing zoning standards requiring bike racks at public facilities and commercial centers.
Figure 2-20: Typical Cross-Section along Holt Boulevard in the City of Montclair
Segment 3 – City of Ontario The City of Ontario occupies approximately half of the Route 61/Holt and Route 61/Route 66 corridors. This segment has a wide spectrum of land uses and services with extensive investment in hospitality and

OMNITRANS WEST VALLEY CONNECTOR ALTERNATIVE ANALYSIS REPORT 2-35
2 – EXISTING CONDITIONS
commercial uses, taking advantage of the location near the Ontario International Airport. This segment includes the historic downtown and civic center of Ontario, the Ontario Convention Center, a planned multi-modal center near the Ontario Airport, Citizens Bank Arena, Ontario Mills and the Cucamonga-Guasti Regional Park.
The urban design character changes from west to east. From Benson Avenue to Grove Avenue along Holt Boulevard, commercial development is small scale with both multi-family and single-family north of Holt Boulevard and primarily industrial uses south of Holt Boulevard. West of Grove Avenue, the character changes with the airport to the south of Holt Boulevard and a concentration of large scale, newer offices, retail, major chain hotels, and public facilities, including the Convention Center and arena located on large blocks to the north of Holt Boulevard.
Major streets in Ontario are extremely wide, varying from 92-ft right-of-way on Holt Boulevard to the east to 125 ft on Inland Empire Boulevard and Fourth Street to 170 ft on Milliken Avenue, as illustrated in Figures 2-21 thru 2-24. Other than along Holt Boulevard in the historic Downtown area, on-street parking is not allowed and sidewalks are 8-ft to 12-ft wide with landscaping. Many of the major streets have landscaped medians. Buildings in the historic downtown area and along Euclid Avenue are located close to the sidewalks; however, other sub-segments with many new structures have large setbacks with parking in the front. One of the General Plan mobility policies looks to expand opportunities in the pedestrian and bike networks including consideration of utility easements, levees, drainage corridors, road rights-of-ways, medians and other potential options. Today, pedestrian and bike connectivity is generally good. Wide sidewalks are in good physical condition, including striped crosswalks and planted parkways. Bike lanes are not provided on Holt Boulevard, but the Mobility Element in the General Plan calls for both Class II bike lanes and a bicycle corridor along Inland Empire Boulevard, connecting to Ontario Mills. The Holt Boulevard Mobility and Streetscape Strategic Plan makes a recommendation for a both a bike lane and a bike route along Holt Boulevard.
Figure 2-21: Typical Cross-Section along Holt Boulevard in the City of Ontario

2-36 OMNITRANS WEST VALLEY CONNECTOR ALTERNATIVE ANALYSIS REPORT
2 – EXISTING CONDITIONS
Figure 2-22: Typical Cross-Section along Inland Empire Boulevard in the City of Ontario
Figure 2-23: Typical Cross-Section along Fourth Street in the City of Ontario
Figure 2-24: Typical Cross-Section along Milliken Avenue in the City of Ontario
Segment 4 – Rancho Cucamonga/Route 61 Alignment South of Fourth Street is Ontario Mills, a major regional shopping center, big-box retail, and a movie theater, and to the north of Fourth Street in the City of Rancho Cucamonga are relatively new hotels, industrial, and multi-family residential housing. Fourth Street, as illustrated in Figure 2-23 above, is a wide street with three lanes of traffic in each direction, a 125-ft right-of-way, a wide landscaped median and 12-ft to 13-ft sidewalks with large building setbacks with parking between the one and two-story buildings and the street. Fourth Street continues under the I-15 Freeway into a primarily industrial area to Etiwanda Avenue, containing the West Valley Detention Center and California Steel Industries. Pedestrian and bike connectivity is generally good. Wide sidewalks, continuous and meandering, are in good physical condition, including striped crosswalks and planted parkways. Bike lanes are generally provided on Fourth

OMNITRANS WEST VALLEY CONNECTOR ALTERNATIVE ANALYSIS REPORT 2-37
2 – EXISTING CONDITIONS
Street east of the 15 Freeway, and there are additional opportunities as designated in the General Plan. Fourth Street, in the General Plan’s Circulation Plan, is classified as a Major Divided Arterial which calls for 5-ft bike lanes. The Bicycle Plan also reinforces the Circulation Plan with Class II bike lanes designated for Fourth Street and provides incentives by reducing required on-site parking if bicycle storage and related facilities are provided.
Segment 4 – Rancho Cucamonga/West Valley Connector Alignment Segment 4, for the City of Rancho Cucamonga, West Valley Connector Corridor is primarily an industrial and service commercial/retail segment. This segment includes the Rancho Cucamonga Metrolink Station, the Empire Lakes Golf Course, Terra Vista Town Center, and Victoria Gardens Shopping Center and Cultural Center. Wide sidewalks, continuous and meandering, are in good physical condition, including striped crosswalks and planted parkways. Bike lanes are generally provided on Milliken Avenue and Foothill Boulevard, and there are additional opportunities as designated in the General Plan. Milliken Avenue, in the General Plan’s Circulation Plan, is classified as a Major Divided Arterial and a Major Divided Highway, which both call for 5-ft bike lanes. Foothill Boulevard, in the General Plan’s Circulation Plan, is classified as a Major Divided Arterial which calls for 5-ft bike lanes. The Bicycle Plan also reinforces the Circulation Plan with Class II bike lanes designated for Milliken Avenue and Foothill Boulevard, and provides incentives by reducing required on-site parking if bicycle storage and related facilities are provided.
Milliken Avenue, from Fourth Street to Foothill Boulevard, consists of the Empire Lakes Golf Course, multifamily housing and the Rancho Cucamonga Metrolink Station. There are commercial nodes at both ends of this sub-segment comprising primarily of restaurants, strip retail, and hospitality uses but is primarily characterized by industrial/commercial uses. The typical streetscape character includes three lanes of traffic in each direction within an approximate 140-ft right-of-way, planted center medians, wide meandering sidewalks and parkways (widths vary) with clusters of trees, and varying building setbacks with surface parking lots fronting this segment.
Foothill Boulevard consists of planned communities such as Victoria Gardens and Terra Vista, but commercial/retail uses dominate this sub-segment composed primarily of restaurants, banks, strip retail, and big box retail. There is also some multi-family and single-family housing, and an abundant amount of vacant/undeveloped land. The typical streetscape character, as illustrated in Figure 2-25, includes three lanes of traffic in each direction within an approximate 120-ft right-of-way, planted center median, wide meandering and continuous sidewalks and parkways (widths vary) with sparse clusters of trees, and varying building setbacks with surface parking lots fronting this segment.
Figure 2-25: Typical Cross-Section along Foothill Boulevard in the City of Rancho Cucamonga

2-38 OMNITRANS WEST VALLEY CONNECTOR ALTERNATIVE ANALYSIS REPORT
2 – EXISTING CONDITIONS
Segment 5 – San Bernardino County/Route 61 Alignment The San Bernardino County segment is composed primarily of industrial, two-story offices, and the Auto Club Speedway. Fourth Street becomes San Bernardino Avenue and the street cross-section, as illustrated in Figure 2-26, continues with 125 ft of right-of-way; however, there is a sidewalk on only one side of the street. San Bernardino Avenue primarily has one lane of traffic in each direction, parallel parking on both sides, an inconsistent pattern of existing and missing sidewalks and parkways, minimal street trees, and one-story building heights with varying setbacks. Pedestrian and bike connectivity is generally poor with sidewalks in poor physical condition and missing sidewalks in many cases. Bike lanes are not provided and there are minimal opportunities within the existing pavement and right-of-way widths. Potential streetscape enhancements should be explored to take advantage of destinations along this segment of San Bernardino Avenue which includes major industrial employment centers, the Auto Club Speedway, parks, and elementary schools.
Figure 2-26: Typical Cross-Section along San Bernardino Avenue in the County of San Bernardino
(unincorporated area)
Segment 6 – Fontana/Route 61 Alignment Segment 6, in the City of Fontana (Route 61 Corridor) is primarily a service commercial/retail segment. San Bernardino Avenue, as illustrated in Figure 2-27, and Citrus Avenue primarily consist of residential neighborhoods with sides of houses generally fronting San Bernardino Avenue and fronts of houses fronting Citrus Avenue. Schools and parks, vacant land, small industrial buildings, and strip retail nodes at Valley Boulevard and Citrus Avenue intersection are also present along this segment. The typical streetscape character includes two lanes of traffic in each direction within an approximate 88-ft to 100-ft right-of-way, wide sidewalks and parkways, minimal and inconsistent planting, parallel parking on both sides, regularly spaced tall power poles on the north side and shorter poles on the south side of San Bernardino Avenue, and a consistent pattern of 30-ft setbacks and one-story building heights. The General Plan’s Community Design Element and Land Use Vision emphasizes the importance of the City’s character and image as integrated with the public realm by creating a sense of place that fosters pedestrian accessibility, on foot or by bicycle, to complement Downtown Fontana and its neighboring destinations. Enhancing Fontana’s corridors, open space, bikeways, and trails networks is one way of achieving a pedestrian friendly environment. Today, pedestrian and bike connectivity is generally in good condition. Wide sidewalks are in good physical condition, including decorative and striped crosswalks and street trees. Bike lanes are not provided but a Class III bike route exists on San Bernardino Avenue

OMNITRANS WEST VALLEY CONNECTOR ALTERNATIVE ANALYSIS REPORT 2-39
2 – EXISTING CONDITIONS
between Cypress Avenue and Juniper Avenue. There are additional bicycle network opportunities as designated in the City’s General Plan. The Parks, Recreation, and Trails Element proposes Class II bike lanes for San Bernardino Avenue and Sierra Avenue. The Draft Sierra Valley Boulevard Land Use Study also reinforces the General Plan by designating Sierra Avenue and Citrus Avenue as planned Class II bikeways.
Figure 2-27: Typical Cross-Section along San Bernardino Avenue in the City of Fontana
Valley Boulevard, as illustrated in Figure 2-28, primarily consists of car dealerships and auto-related services, industrial equipment sales, vacant land, motels, strip retail node at Valley Boulevard and Citrus Avenue intersection and the Inland Empire Shopping Center adjacent to Sierra Avenue. The typical streetscape character includes two lanes of traffic in each direction within an approximate 100-ft right-of-way, and 14-ft center turning lane, inconsistent sidewalk and parkway conditions, numerous curb cuts, regularly spaced tall power poles on the north side, and an inconsistent pattern of building setbacks. There are typically one-story building heights along this sub-segment.

2-40 OMNITRANS WEST VALLEY CONNECTOR ALTERNATIVE ANALYSIS REPORT
2 – EXISTING CONDITIONS
Figure 2-28: Typical Cross-Section along Valley Boulevard in the City of Fontana
Sierra Avenue from Valley Boulevard to Fontana Metrolink Station, as illustrated in Figure 2-29, consists primarily of commercial/retail activities and is anchored by the northern gateway entry into the historic Downtown Fontana at the Metrolink Station and by the southern gateway entry into the City of Fontana, marked by Kaiser Permanente Medical Center and one of the largest local shopping concentrations centered around the Valley Boulevard and Sierra Avenue intersection. The typical streetscape character includes two lanes of traffic in each direction within an approximate 100-ft right-of-way, and a center turn lane, parallel parking on both sides, wide sidewalks with regularly spaced street trees, frequent curb cuts, varying building setbacks, and one-story building heights.
Figure 2-29: Typical Cross-Section along Sierra Avenue (south of Fontana Metrolink Station) in
the City of Fontana
Segment 6 – Fontana/West Valley Connector Alignment Segment 6, for the City of Fontana, the West Valley Connector alignment is primarily a service commercial/retail segment. This segment includes Downtown Fontana, Civic Center, the Fontana Metrolink Station, the Pacific Electric Bike Trail, and Kaiser Permanente. The General Plan’s Community Design Element and Land Use Vision emphasizes the importance of the City’s character and image as integrated with the public realm by creating a sense of place that fosters pedestrian accessibility, on foot

OMNITRANS WEST VALLEY CONNECTOR ALTERNATIVE ANALYSIS REPORT 2-41
2 – EXISTING CONDITIONS
or by bicycle, to complement Downtown Fontana and its neighboring destinations. Enhancing Fontana’s corridors, open space, bikeways, and trails networks is one way of achieving a pedestrian friendly environment. Today, pedestrian and bike connectivity is generally in good condition. Wide sidewalks are in good physical condition, including decorative and striped crosswalks and street trees. Bike lanes are not provided on Foothill Boulevard or Sierra Avenue but there are bicycle network opportunities as designated in the City’s General Plan. The Parks, Recreation, and Trails Element proposes Class II bike lanes for Sierra Avenue. The Draft Sierra Valley Boulevard Land Use Study also reinforces the General Plan by designating Sierra Avenue as a planned Class II bikeway.
Foothill Boulevard, as illustrated in Figure 2-30, primarily consists of single-family housing that does not front onto Foothill Boulevard, some auto-related commercial and small scale and big box retail uses, motels, and an abundant amount of vacant/undeveloped land. The typical streetscape character includes two lanes of traffic in each direction within an approximate 108-ft to 120-ft right-of-way and a center turning lane, an inconsistent pattern of existing and missing sidewalks, varying building setbacks with surface parking lots facing Foothill Boulevard.
Figure 2-30: Typical Cross-Section along Foothill Boulevard in the City of Fontana
Sierra Avenue is characterized by commercial/retail and civic activities. Sierra Avenue, from Foothill Boulevard, is surrounded by historic Downtown Fontana, Fontana’s Civic Center, the Pacific Electric Bike Trail, Fontana Metrolink Station/Santa Fe Park, and Kaiser Permanente. The typical streetscape character includes two lanes of traffic in each direction within an approximate 100-ft right-of-way, planted medians in Downtown Fontana, as illustrated in Figure 2-31, parallel parking on both sides, wide sidewalks with regularly spaced street trees, frequent curb cuts, and one-story buildings with varying setbacks.

2-42 OMNITRANS WEST VALLEY CONNECTOR ALTERNATIVE ANALYSIS REPORT
2 – EXISTING CONDITIONS
Figure 2-31: Typical Cross-Section along Sierra Avenue (north of Fontana Metrolink Station) in
the City of Fontana
2.6.2 Transit-Oriented Development Potential Experience in other parts of Southern California and the country has shown that concentrating development near transit, as illustrated in Figure 2-32, often called Transit-Oriented Development (TOD) or Transit Villages, is an effective way to shift more trips from automobiles to transit, improve air quality, and provide healthy living. TODs can serve as a catalyst for economic development and community improvements which focus on the new access provided by the transit service.
Figure 2-32: Basic TOD Diagram
This synergy between land use and transportation is a goal of the “livable communities,” “sustainable communities,” or “smart growth” philosophies. As illustrated in Figure 2-33, Smart growth can take the

OMNITRANS WEST VALLEY CONNECTOR ALTERNATIVE ANALYSIS REPORT 2-43
2 – EXISTING CONDITIONS
form of TODs in which a compact mix of uses are provided within pleasant walkable environments focused on transit stations. The Federal Transit Administration (FTA) recognizes the potential positive impacts of the establishment of transit-supportive land uses around transit facilities and evaluates projects based on their ability to generate ridership and economic development through land use changes.1
Figure 2-33: TOD Concept
The West Valley Connector Corridor station areas have excellent potential for TOD in the ½-mile station areas around the proposed stations on both the Route 61 and Route 61/66 routes due to the following:
• The West Valley Corridor has the highest ridership today along the existing bus routes, as illustrated in Figure 2-34, and will interconnect stations at a number of major activity centers and downtowns in the West Valley of San Bernardino County.
1 Omnitrans Transit Design Guidelines, prepared by Parsons and Gruen Associates, 2013, pg 191.

2-44 OMNITRANS WEST VALLEY CONNECTOR ALTERNATIVE ANALYSIS REPORT
2 – EXISTING CONDITIONS
Figure 2-34: Higher Intensity/Density Development
Adjacent to the Fontana Transit Center
• The majority of the cities along this corridor have General Plans and Specific Plans that include mixed-use development with some of the highest densities and intensities in these cities planned in the proposed station areas.
• Many of the cities are actively pursuing funding for improvements to creating more walkable environments in these station areas, as illustrated in Figure 2-35.
Figure 2-35: Enhanced Pedestrian Streetscapes along High-Density
Housing at Victoria Gardens in Rancho Cucamonga
• There is vacant and underutilized land in the ½-mile walkable areas around stations, as illustrated in Figure 2-36, that could be developed for more transit-supportive uses in the station areas.

OMNITRANS WEST VALLEY CONNECTOR ALTERNATIVE ANALYSIS REPORT 2-45
2 – EXISTING CONDITIONS
Figure 2-36: Potential Opportunity Sites at Foothill Boulevard and
Milliken Avenue in the City of Rancho Cucamonga
• Recently, there have been developers interested in projects around several of the key major activity areas, and some high-density, mixed-use and residential projects are under construction or planned in the corridor, as illustrated in Figure 2-37.
Figure 2-37: Recent High-Density, Mixed-Use Projects and
Residential Projects in Pomona and Ontario
• There are numerous studies and plans underway along the corridor to increase the potential for TOD, to develop implementation mechanisms, and to identify funding for TODs. For example, SANBAG and SCAG are undertaking a study of TODs around the San Bernardino County Metrolink stations which includes the Rancho Cucamonga and Fontana Metrolink stations and two key potential stops for the Omnitrans West Valley Connector Corridor. Recently, SANBAG and SCAG completed the Improvement to Transit Access for Cyclists and Pedestrians study (2012), which includes pedestrian improvements within ½ mile and bicycle improvements within 3 miles of the two Metrolink Stations.

2-46 OMNITRANS WEST VALLEY CONNECTOR ALTERNATIVE ANALYSIS REPORT
2 – EXISTING CONDITIONS
2.7 Demographics Omnitrans’ 2010 System-wide Transit Corridors Plan for the San Bernardino Valley identifies demographic information by corridor. As shown in Table 2-10, The Route 61 corridor population totals 154,329 persons, of whom 21.2% are low income (below the poverty line), although 11.3% of the households in the corridor have no automobile. Both of these measures are strong indicators of the transit-dependent population. The population is expected to grow to 214,337 by 2035, which is a 39% growth. The corridor employment totals 99,917 jobs which is expected to grow to 162,168 by 2035, which is a 62% growth rate. These growth rates will likely have a significant effect on travel in general, on traffic volumes and on transit ridership in the corridor. The corridor exhibits a higher percentage of minority population and multifamily housing when compared to the Omnitrans service area. The corridor also contains a slightly higher percentage of transit dependent and one-car households than Omnitrans service area, while containing a smaller percentage of 2 or more car vehicle households.
Total population and employment figures were gathered based on the SBTAM travel demand forecasting tool described in Appendix C. As shown in Figure 2-39 and Figures 2-40 Ontario is expected to have the highest rate of growth in both population and employment.
Route 61 Omnitrans
Service Area
Corridor Length Linear Miles2 20.4 Total Area Square Miles 35.5 488.5
Population (2006)
Persons 154,328 1,458,991
Persons/Total Square Mile 4,348 2,986
Persons/Residential Square Mile 13,689 9,566
Minority Population% Minority 79.30% 63.00%
Age
% 13 and Under 27.90% 25.40%
% 14 to 17 (High School Age) 6.80% 6.90%
% 18 to 24 (College Age) 11.60% 10.30%
% 65 and Over 6.20% 7.40%
Employment (2006)
% Below Poverty Line 21.20% 15.80%
Number of Jobs 99,916 555,357
Jobs/Square Mile 2,815 1,137
Mode to Work
% Using Public Transit 3.10% 2.20%
% Using Commuter Rail (Of All Workers) 0.40% 0.60%
% Carpool 24.20% 17.60%
% Drive Alone 66.70% 74.20%
Vehicle Ownership
% Zero-Vehicle Units 11.30% 8.40%
% One-Vehicle Units 35.60% 31.70%
% Two or More-Vehicle Units 53.00% 60.00%
Housing
% Multifamily 30.80% 24.50%
Housing Units / Total Acre 1.7 1.33
Housing Units / Residential Acre 5.11 3.93 Table 2-10: Route 61 Corridor Demographics

OMNITRANS WEST VALLEY CONNECTOR ALTERNATIVE ANALYSIS REPORT 2-47
2 – EXISTING CONDITIONS
0
50,000
100,000
150,000
200,000
250,000
300,000
350,000
Montclair Pomona Rancho Cucamonga
Ontario Fontana
2008 Population
2020 Population
2035 Population
0
50,000
100,000
150,000
200,000
250,000
Montclair Pomona Rancho Cucamonga
Ontario Fontana
2008 Employment
2020 Employment
2035 Employment
Figure 2-39: City Population Forecasts
Figure 2-40: City Employment Forecasts

2-48 OMNITRANS WEST VALLEY CONNECTOR ALTERNATIVE ANALYSIS REPORT
2 – EXISTING CONDITIONS
This Page Intentionally Left Blank.

OMNITRANS WEST VALLEY CONNECTOR ALTERNATIVE ANALYSIS REPORT 3-1
3 – ALTERNATIVES ANALYSIS PROCESS AND CONCEPTUAL ALTERNATIVES
3. ALTERNATIVES ANALYSIS PROCESS AND CONCEPTUAL ALTERNATIVES
This section details the alternatives that were analyzed for the introduction of premium transit service and to best serve local transportation needs in a multi-step screening process as shown in Figure 3-1. This process leads to a project definition with the most appropriate improvements for the corridor. The first step of the screening process includes development and analysis of a wide range of conceptual alternatives which are described in this chapter.
Figure 3-1: Alternatives Analysis Process
As described in Section 1.1, this report identifies potential improvements to portions of the Route 61/Holt Blvd. and Route 66/Foothill Blvd. corridors. These corridors are identified as bus rapid transit (BRT) corridors in Omnitrans’ System-wide Transit Corridors Plan for the San Bernardino Valley (2010) and SANBAG’s Long Range Transit Plan (2010). Both plans concluded that BRT technology is preferred for the ten-corridor system due to future levels of ridership demand, vehicle capacity, and operational costs, and lower capital cost compared with light rail.
BRT is the development of coordinated improvements to a bus transit system’s infrastructure, equipment, operations, and technology to provide a more attractive, high quality, high capacity bus service. These improvements can substantially upgrade bus system performance and match the quality of rail transit when implemented in appropriate settings. As shown in Figure 3-2, BRT is not a single type of transit improvement; rather it encompasses a variety of potential improvements, including buses using mixed flow or various types of dedicated lanes, transit signal improvements including synchronization and transit signal priority, and improved bus service on city arterial streets. BRT systems using arterial streets may include lanes reserved for the dedicated use of buses and street enhancements that speed buses and improve service. This incremental approach allows for flexibility in the location of improvements, and the range and therefore cost and construction intensity of the improvements.

3-2 OMNITRANS WEST VALLEY CONNECTOR ALTERNATIVE ANALYSIS REPORT
3 – ALTERNATIVES ANALYSIS PROCESS AND CONCEPTUAL ALTERNATIVES
Figure 3-2: Bus and BRT Implementation Ranges
Omnitrans operates local bus and BRT services in Omnitrans’ service area. For the West Valley Connector Alternatives Analysis, conceptual alternatives were defined based on modeling results including future levels of ridership in the corridor, travel characteristics, vehicle capacity, and capital and operational cost estimates provided in Omnitrans’ System-wide Transit Corridors Plan and SANBAG’s Long Range Transit Plan. Based on these characteristics local bus, bus rapid transit and light rail transit were initially considered reasonable conceptual modes for the corridor; Maglev, people movers, commuter rail, and other technologies were considered unreasonable.
3.1 Local Bus Service As part of Omnitrans’ current fixed route service, local bus service is provided in Route 61 and Route 66. Local bus service is operated primarily with 40’ buses every 15-60 minutes, depending on route ridership demand. Omnitrans’ latest fixed-route bus model is a 40’ low floor vehicle, shown in Figure 3-3. Bus stop amenities for local bus service are detailed in Omnitrans’ Transit Design Guidelines (2013) and typically include a standard bus stop sign and route information, bus bench, shelter and trash can. A standard local bus stop is shown in Figure 3-4.
Figure 3-3: Omnitrans’ 40’ Low Floor Vehicles

OMNITRANS WEST VALLEY CONNECTOR ALTERNATIVE ANALYSIS REPORT 3-3
3 – ALTERNATIVES ANALYSIS PROCESS AND CONCEPTUAL ALTERNATIVES
The current local bus service provided by Route 61 and 66 is presented in Section 4 as the No Build alternative, and represents the potential choice of leaving the service as is. Additionally, the transportation improvements proposed as part of the Transportation Systems Management (TSM) alternative in Section 4 would expand the level of local bus service
provided by the No Build alternative. Defining the TSM alternative requires limiting the future improvements to maximize service but with no major capital improvements. The TSM alternative is the next logical step up in service. This scenario assumes that if resources become available in the near future, priority should be given to improving frequency and improving local bus stop amenities. Headways would be reduced during the weekday peak to every 10 minutes, and increasing service hours before the AM Peak and after PM Peak. Service hours would be added on weekends to improve temporal coverage. Headways on Route 61 and 66 are currently 15 minutes between 5:45 AM and 6:00 PM, 30 minutes from 6:00 PM to 10:15 PM. These can be shortened to 10 minutes during daylight hours and 15 minutes at night. In addition, all existing bus stops in the corridor would provide shelters and information displays.
3.2 Rapid Bus and Bus Rapid Transit Service Rapid bus and BRT service encompass a wide range of available improvements intended to provide faster, more reliable service. As shown in Figure 3-2 Rapid bus service, sometimes referred to as BRT lite, generally includes specialized branding, Transit Signal Priority and intelligent transportation system improvements, queue jump lanes, limited stop service and enhanced stations. BRT typically provides these same elements, along with off-board fare collection, level boarding and further enhancements at stations, and dedicated lanes for some portion of the corridor. Figure 3-5 shows various elements of BRT and Rapid bus systems.
As shown in Figure 3-6, Rapid bus and BRT stations reflect a high level of amenities to create comfortable and convenient high quality facilities that serve as a unique brand to distinguish BRT service from local bus service, and provide a safe and secure area that creates a sense of place at station locations. These amenities are detailed in Omnitrans’ Transit Design Guidelines and include raised station platforms, bus pads, distinct canopy shelters with benches, a station pylon for signage, ticket vending machines, and improved lighting and landscaping.
Figure 3-4: Standard Omnitrans Local Bus Stop

3-4 OMNITRANS WEST VALLEY CONNECTOR ALTERNATIVE ANALYSIS REPORT
3 – ALTERNATIVES ANALYSIS PROCESS AND CONCEPTUAL ALTERNATIVES
Limited Stop Service – reducing the number of bus stops increases the speed and reliability of service, providing faster travel times competitive with automobiles.
Transit Signal Priority - Eliminates delays in bus service due to excessive waits at intersection signals.
Specialized Branding – providing a distinct and attractive brand, separate from local bus service, identifies the service as unique and promotes user awareness of the service. Branding is consistent for vehicles and stations.
Queue Jump Lanes – various types of queue jump lanes exist, and are intended to provide transit vehicles a head start over the rest of the traffic (a queue jump) by adding signage or an additional signal phase for transit vehicles.
Enhanced Stations (BRT Lite/Rapid Bus) – Metro Rapid service pictured to the left, provide low cost and enhanced stations that include attractive shelters and signage for passengers. These stations reduce vehicle dwell time at stops and promote the identity of the service.
Off-Board Fare Collection – Pre-purchasing of fares via ticket vending machines decreases dwell time and improves overall system efficiency.
Figure 3-5: Elements of BRT and Rapid Bus Service

OMNITRANS WEST VALLEY CONNECTOR ALTERNATIVE ANALYSIS REPORT 3-5
3 – ALTERNATIVES ANALYSIS PROCESS AND CONCEPTUAL ALTERNATIVES
Level Boarding – Similar to rail systems, low floor vehicles and taller station platforms that provide level boarding speeds up the boarding and disembarking processes, especially for wheelchair-bound passengers.
Enhanced stations (Enhanced Stations/BRT)- Similar to light rail stations, the BRT stations feature a wide range of improvements, designed to provide an attractive, secure environment and a permanency to attract new riders. The stations feature secure waiting areas, with specialized canopies, and multiple amenities including real-time vehicle information, variable message signs, landscaping and public art.
Dedicated Lanes – Separation of mixed flow traffic from transit vehicles via dedicated lanes, either converted bus-only lanes during peak hours or more permanent separated lanes, increases the speed and reliability of service and promotes the visibility and attractiveness of BRT service.
Figure 3-5: Elements of BRT and Rapid Bus Service (Cont’d)
Figure 3-6: BRT Station Components

3-6 OMNITRANS WEST VALLEY CONNECTOR ALTERNATIVE ANALYSIS REPORT
3 – ALTERNATIVES ANALYSIS PROCESS AND CONCEPTUAL ALTERNATIVES
Physical Constraints/Right-of-Way Requirements A field survey and available data have identified varying right-of-way widths along the corridor. The modal alternatives selected for further analysis will need to fit within existing right-of-way widths, or the acquisition of additional right-of-way will need to be considered. BRT and rapid bus are considered a flexible mode of transit because vehicles can operate in a combination of dedicated lanes and mixed-flow lanes (along with general-purpose traffic). This provides for a high level of flexibility in the design of the system, not requiring the use of dedicated lanes where multiple constraints in the ROW exist. As noted in the Omnitrans Transit Design Guidelines, 25-28 feet is the right-of-way width of dedicated BRT lane segments, however BRT can operate in mixed flow lanes as well.
BRT Capital Costs BRT systems generally have lower capital costs per mile than light rail transit systems; however BRT capital costs vary considerably, depending on the type of system built. Costs of BRT projects include the cost of the stations and structures, vehicles, park-and-ride facilities, and communication systems, and can include improvements to the roadway or intersections near stations when implemented on arterial streets. The type of facility the BRT operates on is generally the major variance in the costs of BRT systems, with lower costs generally associated with BRT corridors on arterial streets, and higher costs associated with dedicated or separate lanes for buses, either on the street or within a separated right of way. BRT on local streets in a mixed flow traffic environment would also include signal improvements to allow for transit signal priority and can result in modifications to the intersections or the roadway near stations. These types of BRT improvements on arterial streets can have the lowest cost per mile. METRO in Los Angeles, California completed the Wilshire Boulevard and Ventura lines at a cost of about $200,000 per mile in 2000. These two lines operate on major arterial streets, but without a dedicated right-of-way. The Rapid Bus improvements included in this cost were signal prioritization, improved stations, and real-time information systems.
BRT systems that operate in dedicated lanes, which are essentially separate lanes for buses, generally have the highest capital cost per mile, with Omnitrans experience at approximately $11.9 million per mile. These lanes provide faster travel times through congested areas, protect against transit service degradation in areas of substantial forecasted traffic growth, and provide a permanency to the system that can attract additional riders. Metro in Los Angeles is now constructing dedicated lane segments on Wilshire Boulevard, to further improve bus operations in that corridor.
BRT Operations and O&M Costs Standard Omnitrans vehicles could be used for BRT service, provided that specialized branding is used to differentiate the level of service typical of a BRT system. Additionally, larger, specialized vehicles, similar to the 60’ articulated vehicles purchased for the sbX Green Line system, could be used. Specialized BRT vehicles would be maintained at Omnitrans’ East Valley Facility, as well as at a potential new facility in the western portion of the valley, which is currently under consideration by Omnitrans. BRT operations and maintenance costs are higher than the standard local bus costs, due to specialized vehicles, substantial stations, maintenance of any dedicated lane segments, and increased frequency of the sbX service. Omnitrans’ local bus O&M cost is $89 per vehicle revenue hour and the estimate for BRT is $125 per vehicle revenue hour. The Omnitrans estimate for Rapid service is $105 per vehicle revenue hour – all considerably lower than the national averages (calculated based on Omnitrans’ current operating costs).
3.3 Light Rail Transit Service Light rail transit (LRT) typically operates on fixed rail with one or two vehicles. Vehicles can operate in mixed flow lanes, as a streetcar service or in a dedicated guideway in a LRT service. LRT is characterized by
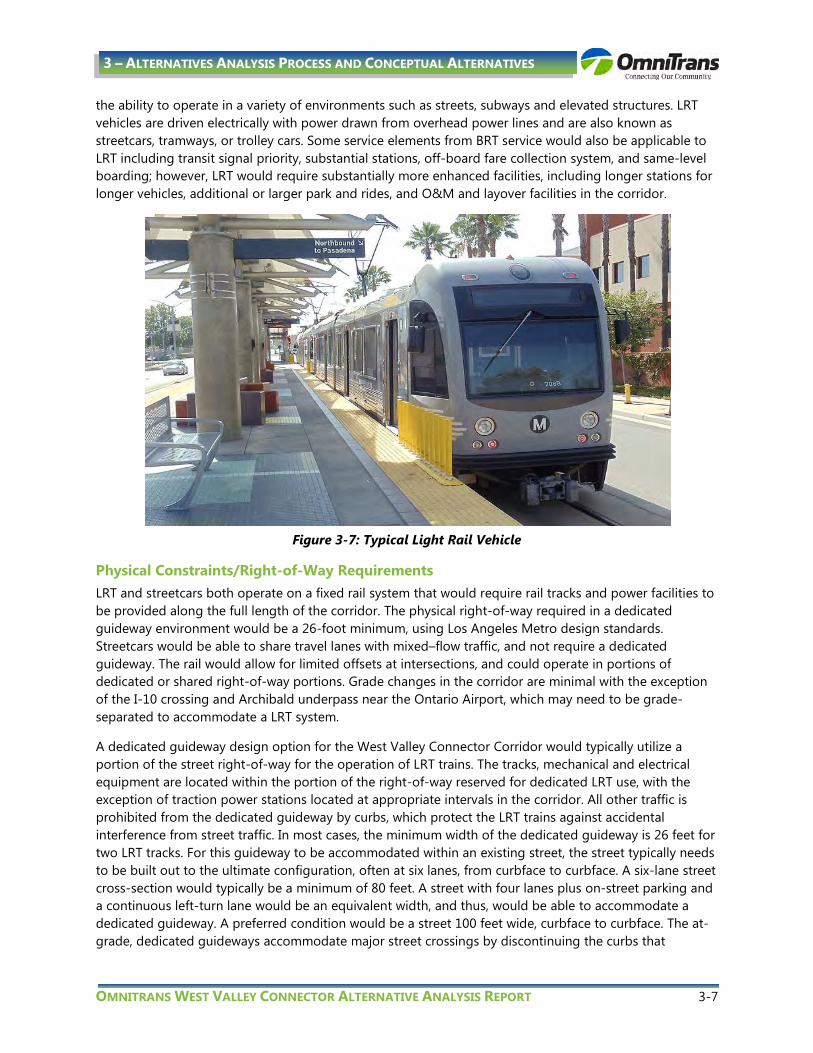
OMNITRANS WEST VALLEY CONNECTOR ALTERNATIVE ANALYSIS REPORT 3-7
3 – ALTERNATIVES ANALYSIS PROCESS AND CONCEPTUAL ALTERNATIVES
the ability to operate in a variety of environments such as streets, subways and elevated structures. LRT vehicles are driven electrically with power drawn from overhead power lines and are also known as streetcars, tramways, or trolley cars. Some service elements from BRT service would also be applicable to LRT including transit signal priority, substantial stations, off-board fare collection system, and same-level boarding; however, LRT would require substantially more enhanced facilities, including longer stations for longer vehicles, additional or larger park and rides, and O&M and layover facilities in the corridor.
Figure 3-7: Typical Light Rail Vehicle
Physical Constraints/Right-of-Way Requirements LRT and streetcars both operate on a fixed rail system that would require rail tracks and power facilities to be provided along the full length of the corridor. The physical right-of-way required in a dedicated guideway environment would be a 26-foot minimum, using Los Angeles Metro design standards. Streetcars would be able to share travel lanes with mixed–flow traffic, and not require a dedicated guideway. The rail would allow for limited offsets at intersections, and could operate in portions of dedicated or shared right-of-way portions. Grade changes in the corridor are minimal with the exception of the I-10 crossing and Archibald underpass near the Ontario Airport, which may need to be grade-separated to accommodate a LRT system.
A dedicated guideway design option for the West Valley Connector Corridor would typically utilize a portion of the street right-of-way for the operation of LRT trains. The tracks, mechanical and electrical equipment are located within the portion of the right-of-way reserved for dedicated LRT use, with the exception of traction power stations located at appropriate intervals in the corridor. All other traffic is prohibited from the dedicated guideway by curbs, which protect the LRT trains against accidental interference from street traffic. In most cases, the minimum width of the dedicated guideway is 26 feet for two LRT tracks. For this guideway to be accommodated within an existing street, the street typically needs to be built out to the ultimate configuration, often at six lanes, from curbface to curbface. A six-lane street cross-section would typically be a minimum of 80 feet. A street with four lanes plus on-street parking and a continuous left-turn lane would be an equivalent width, and thus, would be able to accommodate a dedicated guideway. A preferred condition would be a street 100 feet wide, curbface to curbface. The at-grade, dedicated guideways accommodate major street crossings by discontinuing the curbs that

3-8 OMNITRANS WEST VALLEY CONNECTOR ALTERNATIVE ANALYSIS REPORT
3 – ALTERNATIVES ANALYSIS PROCESS AND CONCEPTUAL ALTERNATIVES
separate the LRT guideway from adjacent traffic lanes. Modular, concrete panels pave the area alongside and between the rails to provide a smooth crossing within street intersections. Where desirable, the guideway can be constructed either above or below grade, as circumstances may warrant, but at a substantially higher cost. LRT makes scheduled stops at designated stations that are usually spaced one-half to one mile apart, depending upon local conditions and system requirements. Train speeds typically adhere to posted traffic limits and respond to prevailing conditions as safety dictates.
A shared guideway design option is frequently referred to as a streetcar. Streetcar operations permit vehicles to operate in a more constrained right-of-way than is required for a dedicated guideway. Modern streetcar vehicles and vintage trolley cars travel in a street traffic lane on tracks embedded at-grade, sharing the lane with other traffic. Between the double tracks, a discontinuous raised median is often used to create left turn pockets and allow tapers that transition into station platforms. Streetcar vehicles make scheduled stops at designated stations that are typically spaced one-quarter to three-quarters of a mile apart, depending upon local conditions and system requirements. Stations may be located more or less frequently, if desired. Train speeds adhere to posted traffic limits and are constrained by prevailing traffic conditions. Safety is paramount for successful streetcar operations. Streetcars typically travel at somewhat slower speeds than LRT vehicles utilizing a dedicated guideway.
Figure 3-8: Light Rail Station with Overhead Catenary System
In most cases, the minimum width of the total right-of-way for a shared guideway is the equivalent of a street that is four lanes, plus a continuous left-turn lane. The width of such a street is approximately 65 feet from curbface to curbface. A street with four lanes plus on-street parking would also be an example of where a streetcar operation in mixed flow lanes can be implemented. There are examples around the country where streetcars operate in narrower street rights-of-way. It is possible to operate streetcars within a two lane street (typically with on-street parking) having a width of 40 feet from curbface to curbface. This width limits design flexibility.

OMNITRANS WEST VALLEY CONNECTOR ALTERNATIVE ANALYSIS REPORT 3-9
3 – ALTERNATIVES ANALYSIS PROCESS AND CONCEPTUAL ALTERNATIVES
Capital Costs LRT costs vary considerably across systems and corridors. FTA’s capital cost database provides comparison costs for all projects funded by the FTA New Starts/Small starts program. Since the year 2000, there have been 18 at-grade light rail projects funded by the FTA with an average per mile cost of $67 million per mile with a minimum cost of $18 million and a high cost of $139 million per mile, in 2012 dollars. The wide range in costs is due to local conditions and the components of each line (i.e., tunnels, elevated structures, at-grade crossings, etc.). Included in the capital cost equation are stations, structures, signal systems, power systems, utility relocation, right-of-way maintenance, maintenance facilities and transit vehicles. For the West Valley Connector Corridor, LRT would operate in either at-grade dedicated guideway or in a shared configuration, with elevated structures or subways being prohibitively expensive given the length of the corridor and projected ridership in the Long Range Transit Plan and System-wide Transit Corridors Plan.
LRT Operations and O&M Costs LRT vehicles would require a new maintenance and layover facility, and would not be able to utilize Omnitrans existing bus facilities. Shared operations with Metrolink facilities in San Bernardino Valley may be possible; however, technical challenges would be presented due to overhead caternary requirements for the LRT and incompatibility with the diesel locomotives used by Metrolink. O&M costs for light rail are generally higher per vehicle revenue hour than local bus or BRT routes, averaging $248 per vehicle revenue hour.
3.4 Conceptual Screening Results BRT would allow the fixed-guideway elements to be implemented in limited select locations, whereas LRT or streetcar would require the selected technology to be implemented along the entire alignment of the street. An LRT or streetcar system on the West Valley Connector Corridor would also be prohibitively expensive to construct and would cause significant impacts to the local communities and adjacent developments. As shown in Figure 3-9 below, average capital costs for LRT are considerably higher than other modes analyzed in the conceptual screening process.
Construction of an LRT line along this corridor would require significant changes to the existing roadway network, elimination of on-street parking, significant reconstruction of most intersections due to limited offsets allowed by the fixed guideway, and additional, expensive right-of-way acquisition. While a BRT system located in dedicated lanes for portions of the corridor may have some similar issues, there would be little or no impact on areas where the BRT would run in mixed flow lanes. The cities involved with transit corridor studies and plans to date, have also supported BRT as the preferred technology option for improved transit service and most appropriate for the scale and character of the corridor.

3-10 OMNITRANS WEST VALLEY CONNECTOR ALTERNATIVE ANALYSIS REPORT
3 – ALTERNATIVES ANALYSIS PROCESS AND CONCEPTUAL ALTERNATIVES
Figure 3-9: Average Capital Costs per Mile by Transit Mode
The ridership forecasts identified in the System-wide Transit Corridors Plan forecast the future daily BRT boardings at 5,870 boardings for Route 61/Holt/4th
• Higher-than-needed rail vehicle capacity compared with the long-term ridership demand;
Street Corridor and 4,640 for Route 66/Foothill West Corridor. This indicates that ridership demand in the West Valley Connector Corridor is better suited for a more frequent, lower-capacity service than that offered by rail alternatives. Additionally, if a BRT system on West Valley Connector corridor were to run in dedicated lanes through the most congested areas of the corridor, the running times would be similar to, and therefore competitive with, those of an LRT system. In general, LRT would result in:
• Higher capital cost for rail, catenary systems, power substations, longer station platforms, maintenance facilities, and vehicles;
• Higher ROW requirements for LRT and need for the ultimate roadway build out as part of the project, and therefore higher cost;
• Higher operating and maintenance costs for rail than for BRT and only better cost effectiveness in corridors with much higher ridership;
• Requirement for a new O&M facility or electrification of a shared rail yard with Metrolink; and • Inconsistency of the rail technologies with regional and local plans.
Any rail alternative would require a new and separate facility specifically for the rail operations and maintenance, which would involve a significantly higher cost than continued use of Omnitrans’ existing Local Bus/BRT O&M facilities, as shown in Figure 3-10. Consequently, streetcar/LRT alternatives were dropped from further consideration for this analysis of the Holt Boulevard corridor. Local bus alternatives, including the No-Build, TSM and BRT alternatives, are considered potential improvement alternatives based on this screening, and are consistent with Omnitrans’ System-wide Transit Corridors Plan and SANBAG’s Long Range Transit Plan.
$65
$12 $11.9
$1.5 $-
$10
$20
$30
$40
$50
$60
$70
LRT BRT Omnitrans E Street BRT
Rapid
Average Capital Cost per Mile

OMNITRANS WEST VALLEY CONNECTOR ALTERNATIVE ANALYSIS REPORT 3-11
3 – ALTERNATIVES ANALYSIS PROCESS AND CONCEPTUAL ALTERNATIVES
Figure 3-10: Average O&M Costs
Omnitrans foresees a maximum demand of 50 riders per hour in 2013 and up to 80 riders per hour in 2035, so BRT has sufficient capacity for the demand now and in the future. As shown in Figure 3-11, rail has much higher vehicle capacity than needed for the ridership demand in Omnitrans’ Service Area; consequently, BRT, Rapid and local bus services are most appropriate to meet the expected demand. BRT and Rapid bus could provide enhanced/premium service in the ten corridors identified in the System-wide Transit Corridors Plan more cost effectively than other modes.
Figure 3-11: Capacity by Mode
$248
$159 $125
$145 $105
$135
$89
$-
$50
$100
$150
$200
$250
$300
LRT BRT Omnitrans E Street
BRT
Rapid Omnitrans Rapid
Local Bus Omnitrans Local Bus
Average O&M Cost per Vehicle Hour
350
175
90 90 60
0
50
100
150
200
250
300
350
400
LRT - 2 car LRT - 1 car BRT Rapid Local Bus
Vehicle Capacity by Mode

3-12 OMNITRANS WEST VALLEY CONNECTOR ALTERNATIVE ANALYSIS REPORT
3 – ALTERNATIVES ANALYSIS PROCESS AND CONCEPTUAL ALTERNATIVES
This Page Intentionally Left Blank.

OMNITRANS WEST VALLEY CONNECTOR ALTERNATIVE ANALYSIS REPORT 4-1
4 – DEFINITION OF ALTERNATIVES
4. DEFINITION OF ALTERNATIVES
Based on the conceptual screening process detailed in Section 3, alternatives were developed based on consultations with City staff and the Project Development Team. The set of alternatives considered and analyzed initially for the Route 61/Holt Boulevard Corridor and subsequently for the West Valley Connector Corridor included the existing local bus services as the No Build Alternative, a TSM alternative that increases local bus service, and 14 build alternatives that introduce various levels of rapid bus and/or BRT service.
4.1 No Build Alternative The No Build alternative is defined as the baseline alternative for comparison with the build alternatives, under the Moving Ahead for Progress in the 21st
4.2 Transportation Systems Management (TSM) Alternative
Century (MAP-21) Act. It represents the continuation of the existing local bus service in the corridor with 15-minute headways (total of 4 buses per hour in each direction). The 20.4-mile local Route 61 includes 92 bus stops in each direction (average spacing of 0.22 mile) and requires a peak hour travel time of 95 minutes in the eastbound direction and 90 minutes in the westbound direction. Route 61 operates eastbound from 4:48 AM to 10:24 PM and westbound from 4:20 AM to 11:08 PM, Monday through Friday, with 15-minute headways from 5:45 AM to 6:00 PM, and 30-minute headways before and after. Saturday and Sunday service begins two hours later and ends two hours earlier than weekday service, but is offered on 15-minute headways throughout both days. The 15.8-mile local Route 66 includes 72 bus stops in each direction (average spacing of 0.22 per mile) and requires a peak hour travel time of 72 minutes in the eastbound direction and 60 minutes in the westbound direction. Route 66 operates eastbound from 5:06 AM to 9:15 PM and westbound from 4:19 AM to 10:25 PM, Monday through Friday, with 15-minute headways from 6:24 AM to 6:24 PM, and 30-minute headways before and after. Saturday and Sunday service begins one hour later and ends 1-1/2 hours earlier than weekday service, and is offered on 30-minute headways throughout both days.
The TSM alternative is the first logical step up in service and is defined as a significant service improvement without major capital investment. For this corridor, it is defined as the continuation of the existing local bus services in the corridor but with improved headways at 10-minutes (total of 6 buses per hour in each direction) compared to the existing condition of 15-minute headways. The TSM alternative would include the same, existing local stops, the same span of service and the same travel time, but would increase the level of bus service by 50% over the existing condition, from 4 buses to 6 buses per hour.
4.3 Build Alternatives
4.3.1 Route 61 Alternatives A total of 14 build alternatives were developed to provide a sufficient range of options to understand the sensitivity of ridership and costs to the extent of dedicated bus-only lanes and other capital improvements in the corridor. All of the BRT alternatives assumed elements of BRT service, including limited stop service, branding, transit signal priority (TSP), upgraded stations with off-board fare collection and level boarding platforms, and queue jump lanes where required. Various segments of dedicated bus-only lanes and various station locations show up among the alternatives. Most of the build alternatives also included continuation of local route “shadow” service at 30-minute or 60-minute headways.

4-2 OMNITRANS WEST VALLEY CONNECTOR ALTERNATIVE ANALYSIS REPORT
4 – DEFINITION OF ALTERNATIVES
Detailed descriptions of each Build alternative are provided below, with corresponding figures on the following pages. A summary table describing the basic characteristics of each alternative is presented after the alternatives.
• Build Alternative A
•
is defined as the continuation of the existing Route 61 service at reduced headway (30-minute) plus 10-minute headway limited stop BRT service (total of 8 buses per hour), with 18 stations and all mixed flow operation through the 20.4-mile corridor, with no dedicated bus-only lane segments. Build Alternative B
•
is defined as the existing Route 61 service at reduced headway (30-minute) plus 10-minute headway limited stop BRT service (total of 8 buses per hour), with 18 stations and all dedicated bus-only lane operation throughout the 20.4-mile corridor. Build Alternative C
•
is defined as replacing the existing Route 61 service at 15-minute headway with 10-minute headway limited stop BRT service (total of 6 buses per hour), with approximately 30 stations (average spacing of 0.67 mile) and all mixed flow operation through the 20.4-mile corridor. Build Alternative D
•
is defined as the existing Route 61 service at reduced headway (30-minute) plus 10-minute headway limited stop BRT service (total of 8 buses per hour), with 18 stations and 10 miles of dedicated bus-only lane operation, with the remainder of the 20.4-mile corridor in mixed flow operation. The 10-mile dedicated lane segment extends from Holt/Benson to Fourth Street/I-15. Build Alternative E
•
is defined as the existing Route 61 service at reduced headway (30-minute) plus 10-minute headway limited stop BRT service (total of 8 buses per hour), with 18 stations and 5 miles of dedicated bus-only lane operation, with the remainder of the 20.4-mile corridor in mixed flow operation. The 5-mile dedicated lane segment extends from Holt/Benson to Holt/San Antonio and from Holt/Euclid to Holt/Vineyard (3.5 miles) and from Sierra/Marygold to Sierra/Orange Way (1.5 miles). Build Alternative F
•
is defined as the existing Route 61 service at reduced headway (30-minute) plus 10-minute headway limited stop BRT service (total of 8 buses per hour), with 18 stations and 3.5 miles of dedicated bus-only lane operation, with the remainder of the 20.4-mile corridor in mixed flow operation. The 3.5-mile dedicated lane segment extends from Holt/Benson to Holt/San Antonio and from Holt/Euclid to Holt/Vineyard. This dedicated lane segment is consistent with the City of Ontario’s Holt Boulevard Mobility and Streetscape Strategic Plan completed in March 2013. Build Alternatives G, H, and I
•
reflect an increase in station access similar to Alternative C, with various amounts of Route 61 service at 60-, 30- and 20-minutes for Alternatives G, H, I respectively, plus 10-minute BRT service with 30 stations and 3.5 miles of dedicated bus-only lanes. Build Alternative J
•
(Alt. C + D) is defined as Route 61 service with 30-minute headways plus 10-minute BRT service with 30 stations and 10 miles of dedicated bus-only lanes. Build Alternative K is similar to Alternative C; however it adds Route 61 service at 60-minute headway, which was not included in Alternative C. This alternative includes 10-minute BRT service with 30 stations and all mixed flow operation.
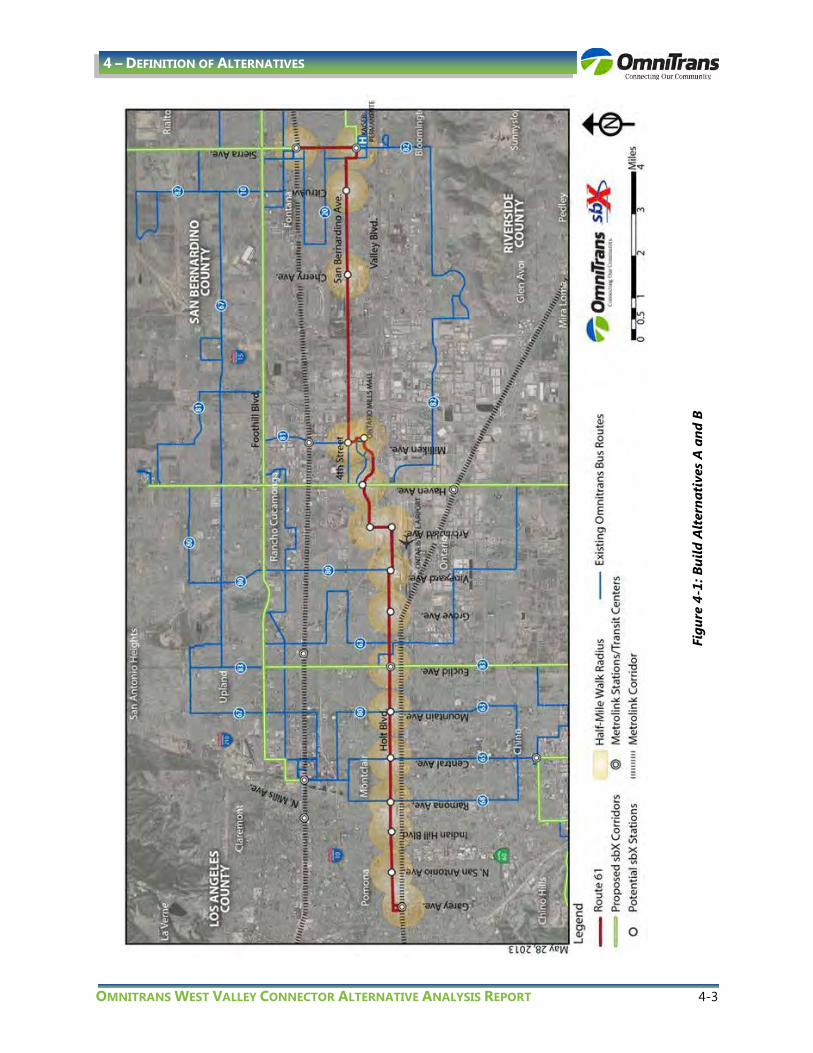
OMNITRANS WEST VALLEY CONNECTOR ALTERNATIVE ANALYSIS REPORT 4-3
4 – DEFINITION OF ALTERNATIVES
Figu
re 4
-1: B
uild
Alt
erna
tive
s A
and
B

4-4 OMNITRANS WEST VALLEY CONNECTOR ALTERNATIVE ANALYSIS REPORT
4 – DEFINITION OF ALTERNATIVES
Figu
re 4
-2: B
uild
Alt
erna
tive
C

OMNITRANS WEST VALLEY CONNECTOR ALTERNATIVE ANALYSIS REPORT 4-5
4 – DEFINITION OF ALTERNATIVES
Figu
re 4
-3: B
uild
Alt
erna
tive
D

4-6 OMNITRANS WEST VALLEY CONNECTOR ALTERNATIVE ANALYSIS REPORT
4 – DEFINITION OF ALTERNATIVES
Figu
re 4
-4: B
uild
Alt
erna
tive
E

OMNITRANS WEST VALLEY CONNECTOR ALTERNATIVE ANALYSIS REPORT 4-7
4 – DEFINITION OF ALTERNATIVES
Figu
re 4
-5: B
uild
Alt
erna
tive
F

4-8 OMNITRANS WEST VALLEY CONNECTOR ALTERNATIVE ANALYSIS REPORT
4 – DEFINITION OF ALTERNATIVES
Figu
re 4
-6: B
uild
Alt
erna
tive
s G
, H a
nd I

OMNITRANS WEST VALLEY CONNECTOR ALTERNATIVE ANALYSIS REPORT 4-9
4 – DEFINITION OF ALTERNATIVES
Figu
re 4
-7: B
uild
Alt
erna
tive
J

4-10 OMNITRANS WEST VALLEY CONNECTOR ALTERNATIVE ANALYSIS REPORT
4 – DEFINITION OF ALTERNATIVES
Figu
re 4
-8: B
uild
Alt
erna
tive
K

OMNITRANS WEST VALLEY CONNECTOR ALTERNATIVE ANALYSIS REPORT 4-11
4 – DEFINITION OF ALTERNATIVES
4.3.2 Hybrid Alternatives • Build Alternative L
•
is a hybrid alignment developed using Foothill Boulevard to traverse the eastern portion of the corridor instead of San Bernardino Avenue., based on discussions with project stakeholders and the local jurisdictions. This alternative includes Route 61 (on Holt Boulevard) and Route 66 (on Foothill Boulevard) local service at 60-minute headways plus 10-minute BRT service with 28 stations and all mixed flow operation. Segments of Route 61 and 66 not covered by the build alignment BRT service would operate on 30- and 20-minute headways, respectively. Build Alternative M
•
uses the hybrid alignment developed for Alternative L with Route 61 and Route 66 service at 60-minute headways plus 10-minute BRT service with 27 stations and 3.5 miles of dedicated lanes on Holt Boulevard. Segments of Route 61 and 66 not covered by the build alignment BRT service would operate on 30- and 20-minute headways, respectively. Build Alternative N
Figure 4-9 below summarizes the differences in the conceptual alternative characteristics.
uses the hybrid alignment developed for Alternative L with Route 61 and Route 66 service at 60-minutes plus 10-minute BRT service with 27 stations and 3.5 miles of dedicated lanes on Holt Boulevard and 3.0 miles of dedicated lanes on Foothill Boulevard. Segments of Route 61 and 66 not covered by the build alignment BRT service would operate on 30- and 20-minute headways, respectively.
Alternative Local Bus
Stops Route 61 headway
BRT Headway
BRT Stations
Miles of Dedicated Lanes (2-way)
Total Buses/Hour
Route 61 Alignment No build 92 15 0 0 0.0 4
TSM 92 10 0 0 0.0 6 A 92 30 10 18 0.0 8 B 92 30 10 18 20.4 8 C 92 0 10 30 0.0 6 D 92 30 10 18 10.0 8 E 92 30 10 18 5.0 8 F 92 30 10 18 3.5 8 G 92 60 10 30 3.5 7 H 92 30 10 30 3.5 8 I 92 20 10 30 3.5 9 J 92 30 10 30 10.0 8 K 92 60 10 30 0.0 7
West Valley Connector/Hybrid Alignment L 88 30 10 28 0.0 8 M 88 30 10 27 3.5 8 N 88 30 10 27 6.5 8
Figure 4-9: Characteristics of the Initial Set of Alternatives

4-12 OMNITRANS WEST VALLEY CONNECTOR ALTERNATIVE ANALYSIS REPORT
4 – DEFINITION OF ALTERNATIVES
Figu
re 4
-10:
Bui
ld A
lter
nati
ve L

OMNITRANS WEST VALLEY CONNECTOR ALTERNATIVE ANALYSIS REPORT 4-13
4 – DEFINITION OF ALTERNATIVES
Figu
re 4
-11:
Bui
ld A
lter
nati
ve M
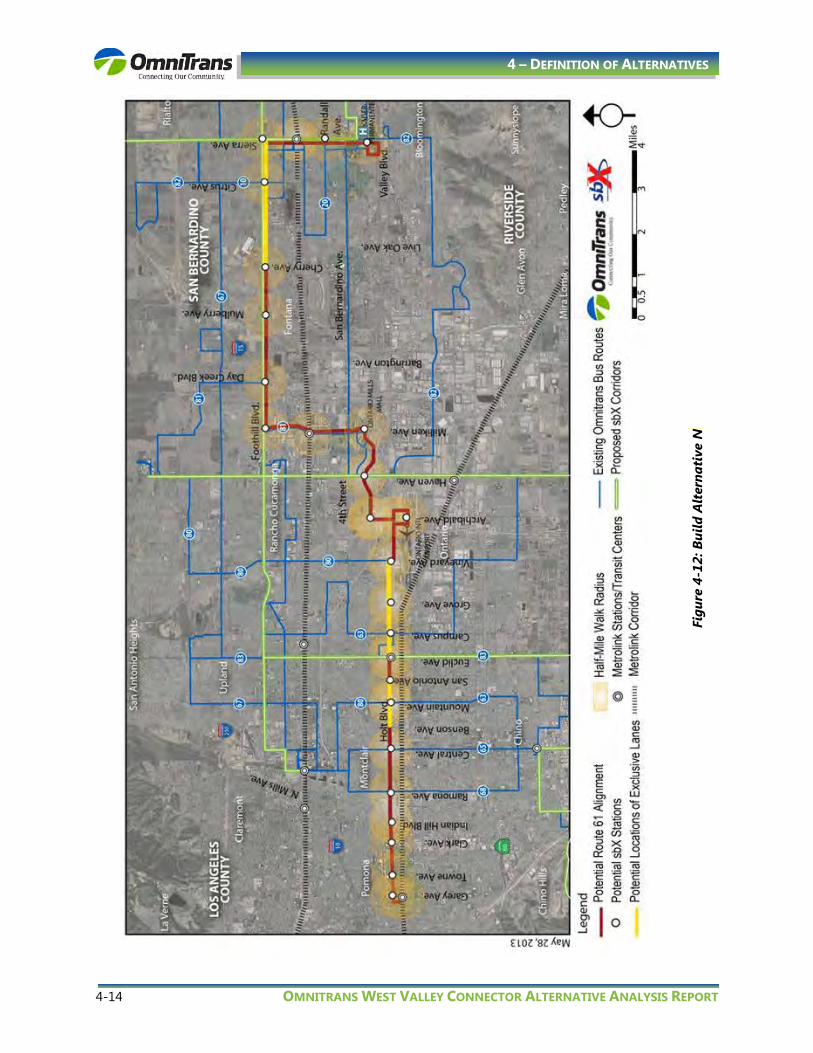
4-14 OMNITRANS WEST VALLEY CONNECTOR ALTERNATIVE ANALYSIS REPORT
4 – DEFINITION OF ALTERNATIVES
Figu
re 4
-12:
Bui
ld A
lter
nati
ve N

OMNITRANS WEST VALLEY CONNECTOR ALTERNATIVE ANALYSIS REPORT 4-15
4 – DEFINITION OF ALTERNATIVES
4.4 Station Locations The conceptual Build alternatives A, B, D, E, and F include the following 18 initial BRT station locations with average 1-mile spacing, based on current ridership, adjacent existing and proposed land uses, transfer opportunities, connections to other nearby activity centers, and input from the city stakeholders.
• Pomona
o Pomona Metrolink Station o San Antonio Avenue / Holt Avenue o Indian Hill Boulevard / Holt Avenue
• Montclair
o Ramona Avenue / Holt Boulevard o Central Avenue / Holt Boulevard
• Ontario
o Mountain Avenue / Holt Boulevard o Euclid Avenue / Holt Boulevard o Grove Avenue / Holt Boulevard o Vineyard Avenue / Holt Boulevard o Ontario Airport o Archibald Avenue/ Inland Empire Boulevard o Haven Avenue / Inland Empire Boulevard o Ontario Mills on Milliken
• Ontario / Rancho Cucamonga
o E. Fourth St. / Franklin Avenue / Buffalo Avenue
• San Bernardino County
o Cherry Avenue / San Bernardino
• Fontana
o Citrus Avenue / San Bernardino o Kaiser Hospital / South Fontana Transit Center at Marygold Avenue / Sierra Avenue o Fontana Metrolink Station
Alternatives C, G, H, I, J, and K were developed to maximize station access and include a total of 30 BRT stations. These additional BRT station locations were selected based on their currently significant ridership on the Route 61 local service and approximately ½-mile spacing from the initial 18 BRT stations. The additional 12 BRT stations would be located at:
• Pomona
o Holt Avenue / Palomares Street, Clark Avenue
• Montclair
o Holt Boulevard / Monte Vista
4-16 OMNITRANS WEST VALLEY CONNECTOR ALTERNATIVE ANALYSIS REPORT
4 – DEFINITION OF ALTERNATIVES
• Ontario
o Holt Boulevard / San Antonio Avenue, Campus Avenue and Corona Avenue o Inland Empire Boulevard / Turner Avenue, Center Avenue
• Unincorporated San Bernardino County
o Fourth Street / Barrington Avenue o San Bernardino Avenue / Live Oak Avenue
• Fontana
o San Bernardino Avenue / Fontana Avenue o Sierra Avenue / Randall Avenue
The hybrid alignment developed for alternatives L, M, and N travels along portions of Route 61 and Route 66 resulting in different station locations. Alternative L uses 21 of the same stations as Alternatives C, G, H, I, J, and K, between Pomona Metrolink Station and Ontario Mills. The remaining stations are as follows:
• Rancho Cucamonga Metrolink Station • Day Creek Boulevard/Foothill Boulevard • Etiwanda Avenue/Foothill Boulevard (Alt L only) • Mulberry Avenue/Foothill Boulevard (Alt M and N) • Cherry Avenue/Foothill Boulevard • Beech Avenue/Foothill Boulevard(Alt L only) • Citrus Avenue/Foothill Boulevard • Sierra Avenue/Foothill Boulevard • Fontana Metrolink Station/Sierra Avenue • Randall Avenue/Sierra Avenue (Alt M and N) • South Fontana Transit Center and Kaiser Permanente/Sierra Avenue(Alt M and N)
Table 4-1 on the following page identifies the total potential station locations.

OMNITRANS WEST VALLEY CONNECTOR ALTERNATIVE ANALYSIS REPORT 4-17
4 – DEFINITION OF ALTERNATIVES
Table 4-1: Potential Station Locations
Holt / Route 611 Route 61 / Route 66
Pomona (Los Angeles County) • Pomona Metrolink Station • Garey Avenue • Reservoir Street • Indian Hill Boulevard Montclair (San Bernardino County) • Holt Boulevard and Ramona Avenue • Holt Boulevard and Central Avenue • Holt Boulevard and Mountain Avenue Ontario (San Bernardino County)1
• Holt Boulevard and San Antonio Avenue
• Holt Boulevard and Euclid Avenue • Holt Boulevard and Campus Avenue • Holt Boulevard and Grove Avenue • Holt Boulevard and Vineyard Avenue • Ontario International Airport • Inland Empire Boulevard and Archibald Avenue • Inland Empire Boulevard and Haven Avenue • Ontario Mills Transfer Center on Mills Circle • Fourth Street and Franklin Avenue
2
Rancho Cucamonga (San Bernardino County) • Fourth Street and Etiwanda Avenue San Bernardino County (Unincorporated Area) • San Bernardino Avenue and Cherry Avenue Fontana • San Bernardino Avenue and Citrus Avenue • Kaiser Permanente Hospital • Fontana Metrolink Station
Pomona (Los Angeles County) • Pomona Metrolink Station • Holt Avenue and Garey Avenue • Holt Avenue and Towne Avenue • Holt Avenue and Clark Avenue • Holt Avenue and Indian Hill Boulevard Montclair (San Bernardino County) • Holt Boulevard and Ramona Avenue • Holt Boulevard and Central Avenue • Holt Boulevard and Mountain Avenue Ontario (San Bernardino County) • Holt Boulevard and San Antonio Avenue • Holt Boulevard and Euclid Avenue • Holt Boulevard and Campus Avenue • Holt Boulevard and Grove Avenue • Holt Boulevard and Vineyard Avenue • Ontario International Airport • Inland Empire Boulevard and Archibald Avenue • Inland Empire Boulevard and Haven Avenue • Ontario Mills Rancho Cucamonga (San Bernardino County) • Rancho Cucamonga Metrolink Station • Foothill Boulevard and Milliken Avenue • Foothill Boulevard and Day Creek Boulevard Fontana (San Bernardino County) • Foothill Boulevard and Mulberry Avenue • Foothill Boulevard and Cherry Avenue • Foothill Boulevard and Citrus Avenue • Foothill Boulevard and Sierra Avenue • Fontana Metrolink Station • Sierra Avenue near Randall Avenue • Kaiser Permanente Hospital
1A potential station location located at Fourth Street and Milliken Avenue is an option 2Fourth Street and Franklin Avenue was identified as a potential station in a sub area analysis

4-18 OMNITRANS WEST VALLEY CONNECTOR ALTERNATIVE ANALYSIS REPORT
4 – DEFINITION OF ALTERNATIVES
4.5 Sub Area Alignments Multiple sub areas were analyzed in detail to improve access to key destinations and optimize operations along Route 61 and the hybrid alignments.
Ontario Airport to Ontario Mills Sub Area Route 61 is shown in Figure 4-13 below and travels westbound on Airport Drive, up Archibald Avenue to Inland Empire Drive east into the Ontario Mills. With future plans for a multi-modal center near the Ontario Airport and the large number of activity centers in this area warranted a sub area analysis of potential alignments to increase the access for transit users in the area. This analysis was broken into segments A, B and C for discussion purposes.
Segment A of the sub area provides 4 options for accessing both the existing Ontario Airport and the future potential multi modal center. The current route 61 alignment does not serve the Ontario convention center or the airport directly.
• Option 1 would serve the Ontario convention center, the airport, and the future intermodal center directly and uses Inland Empire like current Route 61.
• Option 2 would also serve the convention center, the airport, and the future intermodal center directly, but uses Airport Drive to Archibald Avenue rather than using Inland Empire Boulevard.
• Option 3 would not serve the convention center or future intermodal center directly but would serve the airport directly.
Currently the existing Route 61 does not provide access directly to the airport terminals and requires a transfer to an airport shuttle to access the terminals. This transfer is indirect and provides limited access to the terminals, since the airport shuttles do not stop directly at the Omnitrans bus stops.
Figure 4-13: Existing Route 61 and Sub Area Segments A, B, C
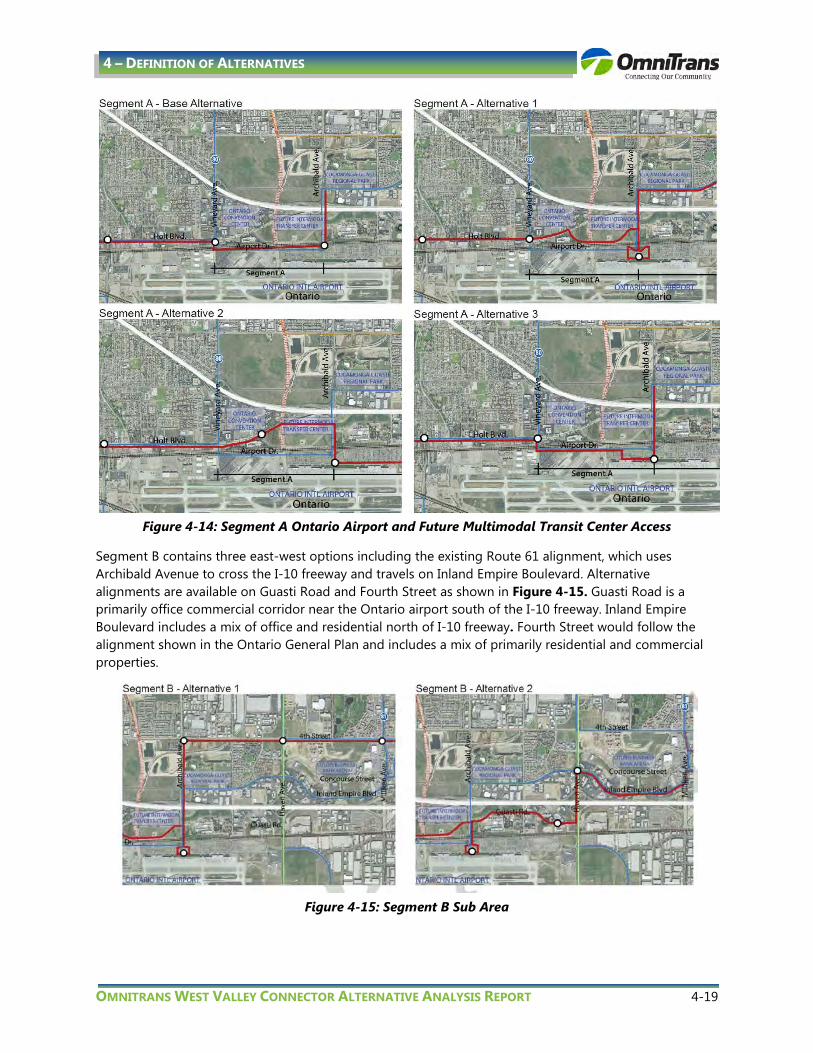
OMNITRANS WEST VALLEY CONNECTOR ALTERNATIVE ANALYSIS REPORT 4-19
4 – DEFINITION OF ALTERNATIVES
Figure 4-14: Segment A Ontario Airport and Future Multimodal Transit Center Access
Segment B contains three east-west options including the existing Route 61 alignment, which uses Archibald Avenue to cross the I-10 freeway and travels on Inland Empire Boulevard. Alternative alignments are available on Guasti Road and Fourth Street as shown in Figure 4-15. Guasti Road is a primarily office commercial corridor near the Ontario airport south of the I-10 freeway. Inland Empire Boulevard includes a mix of office and residential north of I-10 freeway. Fourth Street would follow the alignment shown in the Ontario General Plan and includes a mix of primarily residential and commercial properties.
Figure 4-15: Segment B Sub Area
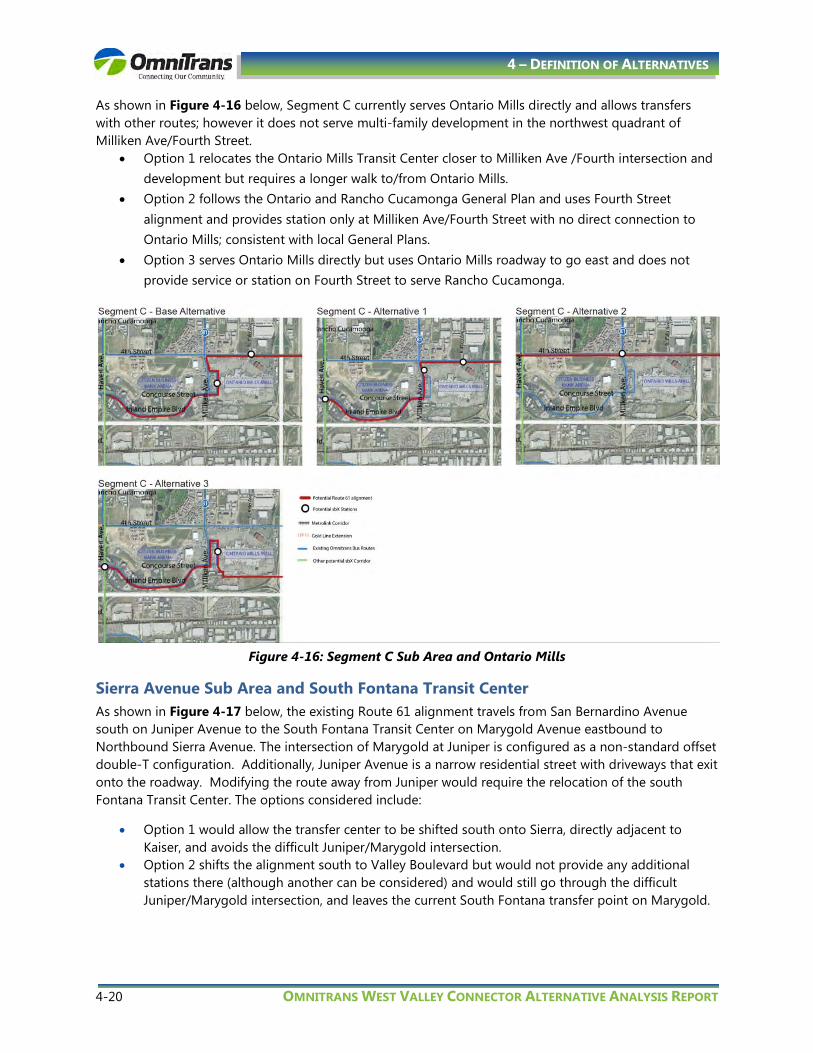
4-20 OMNITRANS WEST VALLEY CONNECTOR ALTERNATIVE ANALYSIS REPORT
4 – DEFINITION OF ALTERNATIVES
As shown in Figure 4-16 below, Segment C currently serves Ontario Mills directly and allows transfers with other routes; however it does not serve multi-family development in the northwest quadrant of Milliken Ave/Fourth Street.
• Option 1 relocates the Ontario Mills Transit Center closer to Milliken Ave /Fourth intersection and development but requires a longer walk to/from Ontario Mills.
• Option 2 follows the Ontario and Rancho Cucamonga General Plan and uses Fourth Street alignment and provides station only at Milliken Ave/Fourth Street with no direct connection to Ontario Mills; consistent with local General Plans.
• Option 3 serves Ontario Mills directly but uses Ontario Mills roadway to go east and does not provide service or station on Fourth Street to serve Rancho Cucamonga.
Figure 4-16: Segment C Sub Area and Ontario Mills
Sierra Avenue Sub Area and South Fontana Transit Center As shown in Figure 4-17 below, the existing Route 61 alignment travels from San Bernardino Avenue south on Juniper Avenue to the South Fontana Transit Center on Marygold Avenue eastbound to Northbound Sierra Avenue. The intersection of Marygold at Juniper is configured as a non-standard offset double-T configuration. Additionally, Juniper Avenue is a narrow residential street with driveways that exit onto the roadway. Modifying the route away from Juniper would require the relocation of the south Fontana Transit Center. The options considered include:
• Option 1 would allow the transfer center to be shifted south onto Sierra, directly adjacent to Kaiser, and avoids the difficult Juniper/Marygold intersection.
• Option 2 shifts the alignment south to Valley Boulevard but would not provide any additional stations there (although another can be considered) and would still go through the difficult Juniper/Marygold intersection, and leaves the current South Fontana transfer point on Marygold.

OMNITRANS WEST VALLEY CONNECTOR ALTERNATIVE ANALYSIS REPORT 4-21
4 – DEFINITION OF ALTERNATIVES
• Option 3 would avoid the geometric issues at Juniper/Marygold intersection, but would bypass Kaiser altogether providing for a shorter route, but bypassing ridership and important activity centers for the corridor.
• Option 4 would serve the main Kaiser entrance on the east side (Mango Ave.), but would require somewhat longer travel time; may be more appropriate for local service rather than BRT given the narrow roadway and pedestrian/vehicle congestion. The west (Sierra) side access is best for pedestrians, employees and transit users; the east (Mango) side is best for auto access to Kaiser.
Figure 4-17: Existing Route 61 on Sierra Avenue and South Fontana Transit Center

4-22 OMNITRANS WEST VALLEY CONNECTOR ALTERNATIVE ANALYSIS REPORT
4 – DEFINITION OF ALTERNATIVES
Figure 4-18: Sierra Avenue and South Fontana Transit Center Sub Area
Victoria Gardens Sub Area Access to Victoria Gardens from Route 66 along Foothill Boulevard is currently provided by pedestrian connections or a short transfer to Route 81 along Day Creek Boulevard, with Victoria Gardens located approximately ½ mile north and east of Foothill Boulevard and Day Creek Boulevard, immediately north of Victoria Gardens Lane. SANBAG’s Integrated Transit/Land use Study for the Foothill Boulevard Corridor and Rancho Cucamonga’s General Plan provide alternative alignments and station locations to increase connectivity and access to Victoria Gardens. These alternatives include potential alignments on Day Creek Boulevard, Church Lane, and Victoria Gardens Lane. Station locations include:
• Day Creek Boulevard and Victoria Gardens Lane (General Plan Transit Center designation) • Victoria Gardens Lane and Kew Avenue (General Plan) • Day Creek Boulevard and Church Street (Foothill Boulevard BRT Corridor Study)
Additional potential alternative stations for Victoria Gardens include:
• Day Creek Boulevard and Main Street • Victoria Gardens Lane and Main Street
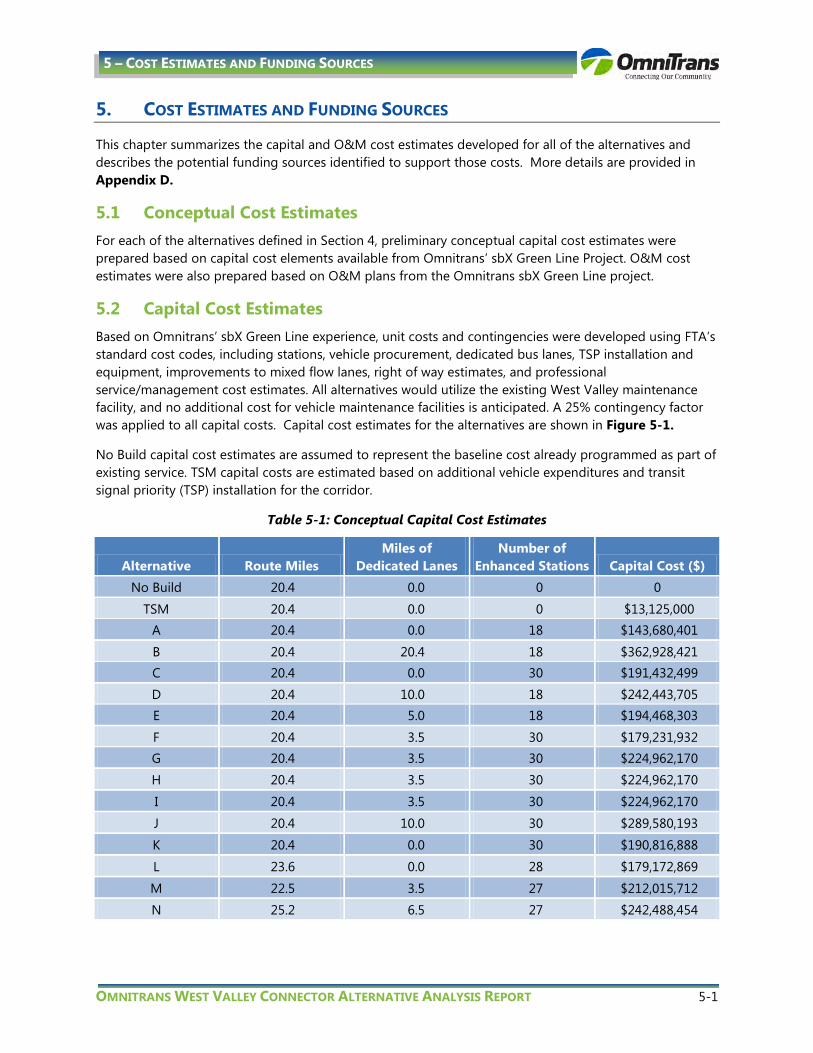
OMNITRANS WEST VALLEY CONNECTOR ALTERNATIVE ANALYSIS REPORT 5-1
5 – COST ESTIMATES AND FUNDING SOURCES
5. COST ESTIMATES AND FUNDING SOURCES
This chapter summarizes the capital and O&M cost estimates developed for all of the alternatives and describes the potential funding sources identified to support those costs. More details are provided in Appendix D.
5.1 Conceptual Cost Estimates For each of the alternatives defined in Section 4, preliminary conceptual capital cost estimates were prepared based on capital cost elements available from Omnitrans’ sbX Green Line Project. O&M cost estimates were also prepared based on O&M plans from the Omnitrans sbX Green Line project.
5.2 Capital Cost Estimates Based on Omnitrans’ sbX Green Line experience, unit costs and contingencies were developed using FTA’s standard cost codes, including stations, vehicle procurement, dedicated bus lanes, TSP installation and equipment, improvements to mixed flow lanes, right of way estimates, and professional service/management cost estimates. All alternatives would utilize the existing West Valley maintenance facility, and no additional cost for vehicle maintenance facilities is anticipated. A 25% contingency factor was applied to all capital costs. Capital cost estimates for the alternatives are shown in Figure 5-1.
No Build capital cost estimates are assumed to represent the baseline cost already programmed as part of existing service. TSM capital costs are estimated based on additional vehicle expenditures and transit signal priority (TSP) installation for the corridor.
Table 5-1: Conceptual Capital Cost Estimates
Alternative Route Miles Miles of
Dedicated Lanes Number of
Enhanced Stations Capital Cost ($) No Build 20.4 0.0 0 0
TSM 20.4 0.0 0 $13,125,000 A 20.4 0.0 18 $143,680,401
B 20.4 20.4 18 $362,928,421 C 20.4 0.0 30 $191,432,499
D 20.4 10.0 18 $242,443,705 E 20.4 5.0 18 $194,468,303
F 20.4 3.5 30 $179,231,932 G 20.4 3.5 30 $224,962,170
H 20.4 3.5 30 $224,962,170
I 20.4 3.5 30 $224,962,170
J 20.4 10.0 30 $289,580,193
K 20.4 0.0 30 $190,816,888
L 23.6 0.0 28 $179,172,869
M 22.5 3.5 27 $212,015,712
N 25.2 6.5 27 $242,488,454

5-2 OMNITRANS WEST VALLEY CONNECTOR ALTERNATIVE ANALYSIS REPORT
5 – COST ESTIMATES AND FUNDING SOURCES
Figure 5-1: Conceptual Capital Cost Estimates
5.3 Capital Funding Sources Capital funding sources were identified for this study based on a mix of federal, state, regional and local funds in addition to various grants and city in-kind and private contributions as shown in Figure 5-2. Funding for the project assumes the following conservative and optimistic estimates:
• Local funds – the conservative estimate includes only plan review and permit fees. The optimistic estimate assumes potential land grants and other in-kind donations from major activity centers in the corridor.
• Various grants - These are mostly from supportive coordinating agencies (Caltrans, AQMD, SCAG etc) and would be based on project benefit/contributions in air quality improvements, sustainable communities, greenhouse gas (GHG) emission reductions, or pedestrian/bicycle improvements.
• Regional – the conservative estimate assumes the current moratorium on Measure I BRT grants continues. The optimistic use maintains this moratorium on Measure I BRT funds, and adds potential funding from unfunded projects in the corridor in the Measure I Valley Local Street Program. Additional optimistic funds included are Local Transportation Funds (LTF), and LA Metro pass-through funds for the Los Angeles County portion of the corridor.
• State – State funding sources have shrunk since sbX Green Line financial plan was implemented and Proposition 1b funds are the only identified state funds. The optimistic level is consistent with the sbX Green Line project share; however the conservative estimate includes no state funds.
• Omnitrans/Federal – The conservative estimate only shows the available federal funding already programmed for Omnitrans’ use. The optimistic estimate includes a maximum Small Starts share of up to $75 million.
$-
$50,000,000
$100,000,000
$150,000,000
$200,000,000
$250,000,000
$300,000,000
$350,000,000
$400,000,000
No Build
TSM A B C D E F G H I J K L M N
Capital Cost
Capital Funding Source
Conservative Estimate
Optimistic Estimate
City/Private $4 M $16-25 M
Various Grants $0 M $4-5 M Regional $0 M $5-15 M
State $0 M $15 M Omnitrans/FTA $20 M $40-75 M
Total $24 M $60-135 M Figure 5-2: Capital Funding Sources
Conceptual Estimates
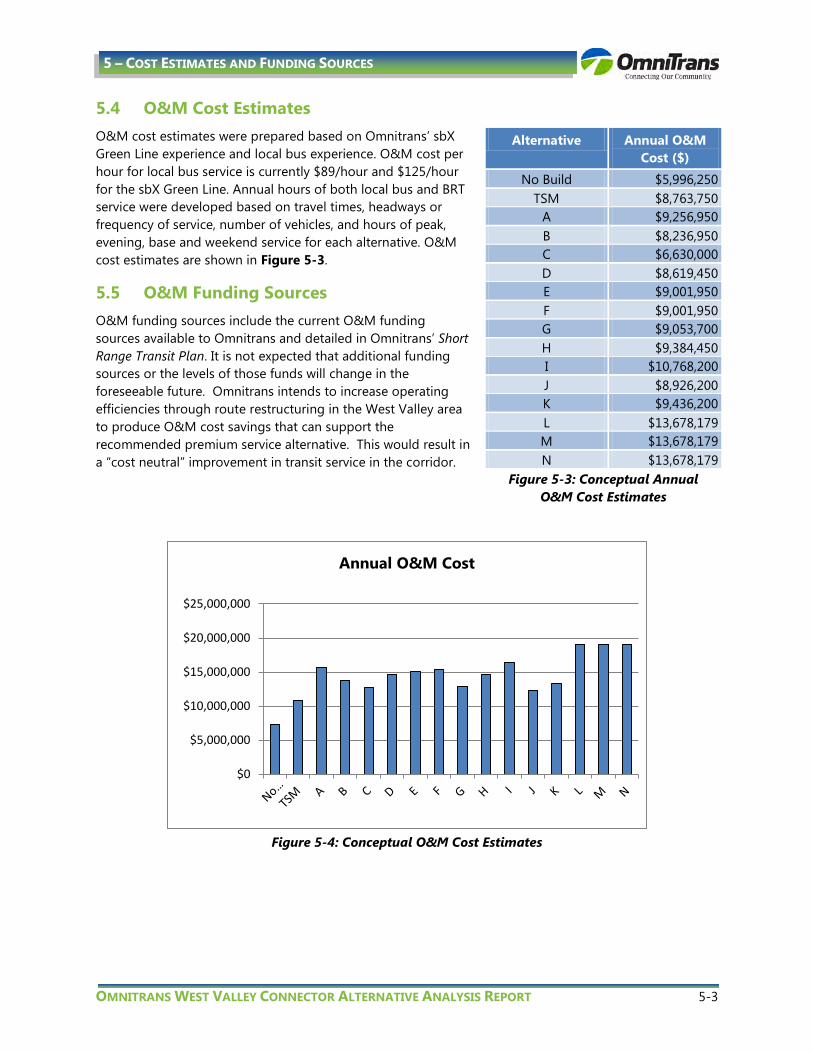
OMNITRANS WEST VALLEY CONNECTOR ALTERNATIVE ANALYSIS REPORT 5-3
5 – COST ESTIMATES AND FUNDING SOURCES
5.4 O&M Cost Estimates O&M cost estimates were prepared based on Omnitrans’ sbX Green Line experience and local bus experience. O&M cost per hour for local bus service is currently $89/hour and $125/hour for the sbX Green Line. Annual hours of both local bus and BRT service were developed based on travel times, headways or frequency of service, number of vehicles, and hours of peak, evening, base and weekend service for each alternative. O&M cost estimates are shown in Figure 5-3.
5.5 O&M Funding Sources O&M funding sources include the current O&M funding sources available to Omnitrans and detailed in Omnitrans’ Short Range Transit Plan. It is not expected that additional funding sources or the levels of those funds will change in the foreseeable future. Omnitrans intends to increase operating efficiencies through route restructuring in the West Valley area to produce O&M cost savings that can support the recommended premium service alternative. This would result in a “cost neutral” improvement in transit service in the corridor.
Figure 5-4: Conceptual O&M Cost Estimates
$0
$5,000,000
$10,000,000
$15,000,000
$20,000,000
$25,000,000
Annual O&M Cost
Alternative Annual O&M Cost ($)
No Build $5,996,250 TSM $8,763,750
A $9,256,950 B $8,236,950 C $6,630,000 D $8,619,450 E $9,001,950 F $9,001,950 G $9,053,700 H $9,384,450 I $10,768,200 J $8,926,200 K $9,436,200 L $13,678,179 M $13,678,179 N $13,678,179
Figure 5-3: Conceptual Annual O&M Cost Estimates

5-4 OMNITRANS WEST VALLEY CONNECTOR ALTERNATIVE ANALYSIS REPORT
5 – COST ESTIMATES AND FUNDING SOURCES
This Page Intentionally Left Blank.

OMNITRANS WEST VALLEY CONNECTOR ALTERNATIVE ANALYSIS REPORT 6-1
6 – EVALUATION OF ALTERNATIVES
6. EVALUATION OF ALTERNATIVES
Based on the alternatives defined in Section 4, and the cost information detailed in Section 5, an alternatives evaluation process was developed in coordination with the PDT. This evaluation process was developed to identify the alternatives that best address the project Goals and Objectives identified in Section 1.3. The five main categories of evaluation are as follows:
• Ridership and Performance • Capital costs • O&M costs • Cost effectiveness • Financial viability
6.1 Ridership and Performance Results Ridership and performance statistics were developed via a traditional transportation demand model using the four step modeling process. The primary forecasting tool employed for the evaluation of conceptual alternatives is the San Bernardino Valley Focused Model (SBVFM), derived from the Southern California Association of Governments (SCAG) regional model, the metropolitan planning organization for the region. The travel demand model methodology and the ridership results are detailed in Appendix C.
Based on the definition of the alternatives, travel times and average bus speed vary based on the number of stations, the route alignment and length, and the availability of dedicated bus-only lanes. Travel times are shown in Table 6-1 and are currently 95 eastbound and 90 minutes westbound for existing Route 61, in the No Build condition. The TSM alternative would not improve or worsen travel times in the corridor since the buses would continue to operate in mixed flow lanes and use the same number of local stops. Overall the alternatives with larger investments in dedicated bus-only lanes (alternatives B, D, J, N) and fewer stations (alternatives A, B, D, E) result in faster run times with higher average speeds. The alternatives that maximize the miles of dedicated lanes and minimize the number of stations are able to travel the fastest (alternatives B and D) and have the shortest travel times.
Table 6-1: Travel Time Results
Alternative Alignment
Length
Miles of Dedicated
Lanes
Number of Enhanced Stations
East Bound Run Time
(Mins)
West Bound Run Time
(Mins)
Avg Bus Speed (MPH)
No Build 20.4 - - 95.0 90.0 12.6
TSM 20.4 - - 95.0 90.0 12.6 A 20.4 - 18 68.5 69.2 17.8
B 20.4 20.4 18 57.3 56.5 21.5 C 20.4 - 30 74.5 75.2 16.4
D 20.4 10.0 18 63.0 63.5 19.3 E 20.4 5.0 18 65.5 65.9 18.6
F 20.4 3.5 30 66.3 67.0 18.4 G 20.4 3.5 30 72.3 73.0 16.9
H 20.4 3.5 30 72.3 73.0 16.9 I 20.4 3.5 30 72.3 73.0 16.9

6-2 OMNITRANS WEST VALLEY CONNECTOR ALTERNATIVE ANALYSIS REPORT
6 – EVALUATION OF ALTERNATIVES
Alternative Alignment
Length
Miles of Dedicated
Lanes
Number of Enhanced Stations
East Bound Run Time
(Mins)
West Bound Run Time
(Mins)
Avg Bus Speed (MPH)
J 20.4 10.0 30 69.0 69.5 17.7 K 20.4 - 30 74.5 75.2 16.4
L 23.6 - 28 73.2 75.1 19.5 M 22.5 3.5 27 76.4 78.0 19.9
N 25.2 6.5 27 75.0 76.5 20.3
2015 ridership results are presented in Table 6-2 and vary primarily based on the number of enhanced stations, overall travel time, and the local “shadow” bus route frequency/headways. Increasing the number of local buses per hour in the corridor by 50%, as represented in the TSM alternative, results in a 22% gain in ridership. Alternative B, which has dedicated lanes for the entire corridor, only produces 8% higher ridership in the 2015 or opening year scenario than Alternative A, which has no dedicated lanes for the corridor. Alternative C increases the number of enhanced stations from a typical 1-mile BRT station spacing to a 2/3-mile average and results in a 26% ridership increase; however, it does not provide any local bus service on Route 61. Alternatives G, H, and I provide the same station locations and dedicated lanes, and vary the local Route 61 service between 60, 30 and 20 minutes respectively. These three alternatives generate the highest ridership of the Route 61 alignment alternatives, with Alternative I at 20-minute local bus service in the corridor generating the highest ridership of all Route 61 alignment alternatives. Alternative K generates similar ridership results without dedicated lanes.
Hybrid alignments L, M, and N (combining portions of the Holt Boulevard and Foothill Boulevard corridors) generate the highest total ridership, indicating significant ridership gains by using Foothill Boulevard instead of San Bernardino Avenue. On Alternative N, with more miles of dedicated lanes and a longer alignment south to Kaiser Permanente/South Fontana Transit Center, ridership increases by 10% over Alternative L compared to the No Build alternative.
Table 6-2: 2015 Ridership Results for the Alternatives
Alternative
Number of Enhanced Stations
Route 61 headways
Route 61 Ridership
New Service Ridership
Total Ridership
% Increase From No
build
No Build - 15 6,100 - 6,100 -
TSM - 10 7,470 - 7,470 22% A 18 30 2,400 5,950 8,350 37%
B 18 30 2,360 6,490 8,850 45% C 30 - - 7,700 7,700 26%
D 18 30 1,390 6,160 8,550 40% E 18 30 1,390 6,070 8,460 39%
F 30 30 1,390 6,050 8,440 38% G 30 60 1,020 7,730 8,750 43%
H 30 30 2,060 7,490 9,550 57% I 30 20 3,300 7,180 10,480 72%

OMNITRANS WEST VALLEY CONNECTOR ALTERNATIVE ANALYSIS REPORT 6-3
6 – EVALUATION OF ALTERNATIVES
Alternative
Number of Enhanced Stations
Route 61 headways
Route 61 Ridership
New Service Ridership
Total Ridership
% Increase From No
build
J 30 30 1,020 7,860 8,880 46% K 30 60 1,030 7,610 8,640 42%
L 28 30 5,180 7,600 12,780 110% M 27 30 4,960 8,400 13,360 119%
N 27 30 4,950 8,480 13,430 120%
6.2 2035 Forecasted Ridership The ridership forecasts prepared for horizon year 2035 are shown in Appendix C using socioeconomic data derived from SCAG RTP 2012. The ridership forecasts are based on the operating plans for the alternatives presented.
Build alternatives are forecast to generate between 2,030 and 2,400 new transit trips in the region, and increase the overall transit mode share for travel in the San Bernardino Valley from 1.22 percent to 1.26 percent of all trips in the region. As we would expect, the faster BRT alternatives are forecast to attract more new transit trips than the Rapid alternative. Home-based work trips are forecast to account for approximately one-half of the transit trips in the San Bernardino Valley, and they are forecast to account for approximately 45 percent of the new transit trips resulting from the West Valley Connector Corridor alternatives.
Build alternatives are forecast to generate between 5,000 and 5,800 additional unlinked transit trips in the West Valley Connector Corridor. The majority of passengers riding build alternatives are forecast to be existing transit riders who alter their transit paths to include the premium bus route. In horizon year 2035, between 40 and 41 percent of the passengers on the premium bus route are assumed to be new transit riders, and that the remaining 59 to 60 percent of trips on the premium service are assumed to be diverted from other existing bus routes.
6.3 Cost Effectiveness Evaluation Conceptual capital costs and O&M costs as detailed in Section 5 are presented in Table 6-3 with a cost per rider evaluation that represents the cost effectiveness of each alternative. The No Build capital cost includes fleet replacement costs for Route 61 and provides the baseline O&M costs. The TSM alternative increases these baseline costs by adding additional vehicles and TSP in the corridor. Capital costs and O&M for the Build alternatives are based on actual cost information for Omnitrans sbX Green Line and extrapolated based on each alternative’s definition. Enhanced stations of similar magnitude to the Omnitrans sbX Green Line are assumed for alternatives A-N. In general, alternatives that do not provide dedicated bus-only lanes generate a better cost effectiveness per rider but have limited additional increase in ridership. Hybrid alignments perform significantly better among the Build alternatives in terms of cost effectiveness per rider.

6-4 OMNITRANS WEST VALLEY CONNECTOR ALTERNATIVE ANALYSIS REPORT
6 – EVALUATION OF ALTERNATIVES
Table 6-3: Capital and O&M Cost Comparison
Alternative Capital Cost Annualized Capital Cost
Annual O&M Cost
O&M cost per rider ($)
Cost Effectiveness – Total Cost per
Rider ($)*
No Build - - $5,996,250 3.17 4.24
TSM $13,125,000 $594,563 $8,763,750 3.78 5.51 A $143,680,401 $6,508,722 $9,256,950 3.58 8.63
B $362,928,421 $16,440,657 $8,236,950 3.00 11.24 C $191,432,499 $8,671,892 $6,630,000 2.78 9.00
D $242,443,705 $10,982,700 $8,619,450 3.25 9.91 E $194,468,303 $8,909,414 $9,001,950 3.43 9.18
F $179,231,932 $8,119,207 $9,001,950 3.44 9.00 G $224,962,170 $10,190,786 $9,053,700 3.34 8.53
H $224,962,170 $10,190,786 $9,384,450 3.17 8.41 I $224,962,170 $10,190,786 $10,768,200 3.31 8.22
J $289,580,193 $13,117,983 $8,926,200 3.24 9.28 K $190,816,888 $8,644,005 $9,436,200 3.52 8.23
L $179,172,869 $8,116,531 $13,678,179 3.45 6.87 M $212,015,712 $9,604,312 $13,678,179 3.30 7.01
N $242,488,454 $10,984,727 $13,678,179 3.99 7.30 *Calculated as O&M cost per rider plus annualized capital cost per rider.
6.4 Evaluation Results Based on the ridership and performance evaluation, Alternative N generates the highest ridership with hybrid alternatives M and L providing the 2nd and 3rd
The cost effectiveness evaluation indicates that Alternative L provides the 2nd lowest O&M cost of all built alternatives and the highest cost effectiveness per rider, without the need for substantial investment in dedicated bus lanes. This indicates that the best performing alternative is a Rapid bus service rather than a larger BRT investment.
highest ridership, respectively. The increase in dedicated bus lanes between alternatives M and N only results in a 1% or 70 riders per day increase over Alternative L, with substantially higher costs associated with dedicated bus lanes. Alternative L provides 10% less ridership or 650 fewer riders per day, without dedicated bus lanes or providing access to the South Fontana Transit Center / Kaiser Permanente Medical Center. The extension of Alternatives M and N to this location and the elimination of one lower performing station thus account for the increase in ridership between the hybrid alternatives. All Build alternatives provide significantly increased ridership over the No Build and the TSM alternatives.
As shown in Section 5, available capital and O&M funding sources are constrained. Capital costs for all alternatives including the TSM alternative exceed available funding sources. Based on the results of this evaluation and the need for transit improvements in this corridor, a reduced cost Rapid Bus service on theWest Valley Connector Corrdor, with station locations and an alignment based on Alternative N

OMNITRANS WEST VALLEY CONNECTOR ALTERNATIVE ANALYSIS REPORT 6-5
6 – EVALUATION OF ALTERNATIVES
(without dedicated bus lanes) was developed and Compared to a No-build, TSM and two BRT options on the West Valley Connector Corridor. Existing 2015 daily ridership results are presented in Figure 6-1, and show a 30% increase in existing daily ridership between the no build and the Rapid Bus Service, with only marginal ridership gains for BRT alternatives with exclusive lanes. Capital Cost estimates and Annual O&M cost estimates were also prepared for the Rapid Bus service, and are shown in Figure 6-2 and 6-3 respectively. The capital cost estimate reflects the low cost nature of the rapid bus service, and limited low cost improvements at station locations. These costs are detailed in Appendix D. Total Cost per rider calculations are shown in Figure 6-4, and reflect the ridership gains and low capital and O&M costs of a Rapid Bus alternative.
Figure 6-1: Existing Daily Ridership for West Valley Connector Alternatives
9,600
11,756 12,480
13,360 13,430
-
2,000
4,000
6,000
8,000
10,000
12,000
14,000
16,000
No Build (existing Rt.
61/66)
TSM (improved Rt.
61/66)
Rapid Bus Slim BRT - 3.5 miles ded.
lanes
Full BRT - 6.5 miles ded.
lanes
Existing Daily Ridership

6-6 OMNITRANS WEST VALLEY CONNECTOR ALTERNATIVE ANALYSIS REPORT
6 – EVALUATION OF ALTERNATIVES
Figure 6-2: Capital Costs for West Valley Connector Alternatives
Figure 6-3: Annual O&M Costs for West Valley Connector Alternatives
$- $13,000,000 $21,132,255
$212,000,000 $242,000,000
$-
$50,000,000
$100,000,000
$150,000,000
$200,000,000
$250,000,000
$300,000,000
No Build (existing local
Rt. 61/66)
TSM (improved Rt.
61/66)
Rapid Bus Slim BRT Full BRT
Capital Costs
$10.14
$14.84
$12.30 $13.68 $13.68
$-
$2.00
$4.00
$6.00
$8.00
$10.00
$12.00
$14.00
$16.00
No Build (existing Rt.
61/66)
TSM (improved Rt. 61/66)
Rapid Slim BRT Full BRT
Annual O&M Cost (millions)

OMNITRANS WEST VALLEY CONNECTOR ALTERNATIVE ANALYSIS REPORT 6-7
6 – EVALUATION OF ALTERNATIVES
Figure 6-4: Total Cost per Rider for West Valley Connector Alternatives
$3.41 $4.23 $3.88
$5.40 $5.75
$-
$1.00
$2.00
$3.00
$4.00
$5.00
$6.00
$7.00
No Build (existing Rt. 61/66)
TSM (improved Rt. 61/66)
Rapid Bus Slim BRT - 3.5 miles ded. lanes
Full BRT - 6.5 miles ded. lanes
Total (Capital and O&M) Cost per Rider

6-8 OMNITRANS WEST VALLEY CONNECTOR ALTERNATIVE ANALYSIS REPORT
6 – EVALUATION OF ALTERNATIVES
This Page Intentionally Left Blank.

OMNITRANS WEST VALLEY CONNECTOR ALTERNATIVE ANALYSIS REPORT 7-1
7 – STAKEHOLDER AND PUBLIC OUTREACH
7. STAKEHOLDER AND PUBLIC OUTREACH
7.1 Stakeholder Outreach Process Omnitrans’ stakeholder outreach occurred throughout the project duration in multiple forms including the Project Development Team (PDT) that was comprised of representatives from all of the local jurisdictions traversed by the West Valley Connector Corridor and other affiliated agencies and businesses, to review all of the technical work and provide input on the preferred transit solution. The PDT included representatives from:
• Omnitrans • San Bernardino Associated Governments (SANBAG) • Southern California Association of Governments (SCAG) • County of San Bernardino • City of Fontana • City of Montclair • City of Ontario • City of Pomona • City of Rancho Cucamonga • Foothill Transit • Los Angeles County Metropolitan Transportation Authority (LA Metro) • Southern California Regional Rail Authority (SCRRA/Metrolink) • Los Angeles World Airports (LAWA) • Simon Group (Ontario Mills) • Kaiser Permanente
PDT meetings occurred on a monthly basis with local jurisdictions hosting as available. Input on the project was received verbally and documented in meetings notes distributed to the PDT. Additional meetings with city staff and major stakeholders occurred throughout the project duration to review specific items and provide input into the project as needed.
7.2 Public Outreach Meetings In May and June, 2014, Omnitrans conducted public outreach activities for the West Valley Connector Corridor project. The purpose of the outreach activities was to explain the purpose and objectives of the project, and provide a range of opportunities to answer questions and collect comments from the public. The outreach activities summarized in this report include:
• Public outreach meetings (2) • Rider information sessions (2) • Operator information session • Community survey
Public input is critical to defining the project design and service features. In addition to extensive outreach to the cities’ transportation planning, engineering, and public works departments, the project team conducted targeted outreach to major employers and businesses in the project area. Specific outreach activities included two public information meetings, rider information sessions at two transit centers on the corridor, an operator information session, and a community survey.

7-2 OMNITRANS WEST VALLEY CONNECTOR ALTERNATIVE ANALYSIS REPORT
7 – STAKEHOLDER AND PUBLIC OUTREACH
7.2.1 Public Outreach Meetings On June 3 and 4, 2014, Omnitrans conducted two (2) open house style Public Outreach Meetings in the project area. The purpose of the meetings was to (a.) explain the purpose and objectives of the project, and (b.) provide a meaningful opportunity to answer questions and collect comments from participants. A full summary of the public outreach process is available in Appendix E.
Public notifications of the meetings included a range of tactics included a variety of tools and methods, including:
• Printed Notice Distribution: On May 21, 2014, nearly 300 postcard notices were distributed to the project contact list including Project Development Team members, elected officials and staff from participating cities, large employers, major activity centers, business organizations including Chambers of Commerce, educational representatives, other government agencies and other interested stakeholders. A copy of the postcard is shown in Figure 7-1.
• E-blast Notice Distribution: Similar to the postcard, an electronic notice was distributed via email to the project contacts on May 15, May 22 and June 2, 2014. On-board Rider Alert Notices: Omnitrans staff designed and placed an on-board rider alert card on Routes 61 and 66.
• Website: Omnitrans provided a web link the project notice and community survey, as did the City of Montclair.
• Public Announcements - City Council Meetings: Project team members provided meeting announcements during the public comment portion of City Council meetings most closely associated with the project alignment.
Figure 7-1: Printed Public Meeting Notice

OMNITRANS WEST VALLEY CONNECTOR ALTERNATIVE ANALYSIS REPORT 7-3
7 – STAKEHOLDER AND PUBLIC OUTREACH
7.2.2 Summary of Discussion Overall, the majority of participants expressed support for the project. Following is a summary of discussion points from the meetings.
• Strengthen connectivity and service to the proposed major destinations, other Omnitrans routes, and other transportation modes
• Enhance access to and comfort of transit vehicles, particularly for those who are mobility impaired • Design comfortable stations that protect from the weather • Provide real-time scheduling and arrival information at stations • Educate the community about the service brand, and distinguish it from local bus service • Support safer streets design through station designs • Avoid impacts to traffic and parking • Improve customer service from transit operators • Maintain affordable transit fares that match local service • Expand capabilities to carry bikes on transit vehicles • Leverage underutilized parking at transit station areas for transit-oriented development • Address constrained circulation at Fontana Transit Center
7.2.3 Rider Information Sessions On June 3 and 5, 2014, Omnitrans conducted two (2) Rider Information Sessions in the project area. The purpose of the meetings was to engage current Omnitrans riders of Routes 61 and 66 to (a) provide a brief overview of the project purpose and proposed features, and (b) collect input and reactions. The first session was held on June 3, 2014 at Fontana Transit Center, and the second session was held on June 5, 2014 at Ontario Mills Transfer Center. Project team members displayed two display boards with information, and engaged approximately 50 rider participants in brief discussions.
Overall, most riders expressed support for the project. Following are key discussion points from riders.
• Increase frequency of existing routes instead of implementing new routes • Lower fares • Extend hours on Route 29 • Accelerate implementation (2-3 years is too long) • Reduce the number of existing stops to improve travel time
7.2.4 Operator Information Sessions Omnitrans provided a brief overview of the project to transit operators to solicit their input based on their experience in the project area. Approximately 35 operators provided verbal and written comments, with key points summarized as follows:
• Consider additional freeway-based service versus rapid service (e.g., Route 90) • Strengthen connections, including:
o Montclair Transit Center o San Bernardino to Montclair o Service span to San Bernardino
• Consider alignment revisions:
o Extending to San Bernardino o Expanding service along Foothill Blvd.

7-4 OMNITRANS WEST VALLEY CONNECTOR ALTERNATIVE ANALYSIS REPORT
7 – STAKEHOLDER AND PUBLIC OUTREACH
o Running on Archibald
• Address route navigation and timeliness challenges:
o Turns at Monterrey, Valley, Marygold and Sierra o Space at Pomona Transit Center o Crossing railroad tracks at Ontario Airport o Closely located stops in Pomona
• Expand amenities at stops including security cameras and shade • Minimize walking distances from stops to major destinations • Address the increase in passengers with bikes • Refine the sbX service and experience
o Provide right-sized stations o Strengthen marketing
• Consider enhancing other routes:
o Expand service to Yucaipa/Redlands o Improve scheduling of Route 82 o Expand weekend service from Ontario Mills to Victoria Gardens o Expand service on Route 14 to address feed from the West Valley Connector
7.2.5 Community Survey From May 21 to June 11, 2014, Omnitrans provided a community survey to collect public comments on service enhancements for the West Valley Connector Corridor and the current Routes 61 and 66. While not a statistically valid survey, the purpose was to provide an additional source of qualitative information about interest in the proposed service and desired amenities. A copy of the survey is shown in Figure 7-2.
The survey was distributed (a) electronically through a web page, and (b) in paper format. As part of public notification of the Public Outreach Meetings, respondents were asked to review the project display boards and complete the survey at the web page. Additionally, some participants at the Public Outreach Meetings and Rider Information Sessions completed web-based or paper-based versions of the survey. A total of 27 surveys were submitted.
Detailed responses are included as Appendix E and a summary of key findings follows:
• About half of respondents are current riders of Route 61 or 66 who ride anywhere from daily to once weekly.
• About half of respondents indicated that the West Valley Connector would serve their destinations.
• On a scale of 1 to 10 (10 being the most important), respondents indicated how important are the following factors to them in deciding whether to ride. The following percentages indicated how many respondents rated 10 for each factor:
o Frequency (53%) o Reliability (60%) o Hours of Service (67%) o Travel Time/Speed (44%)
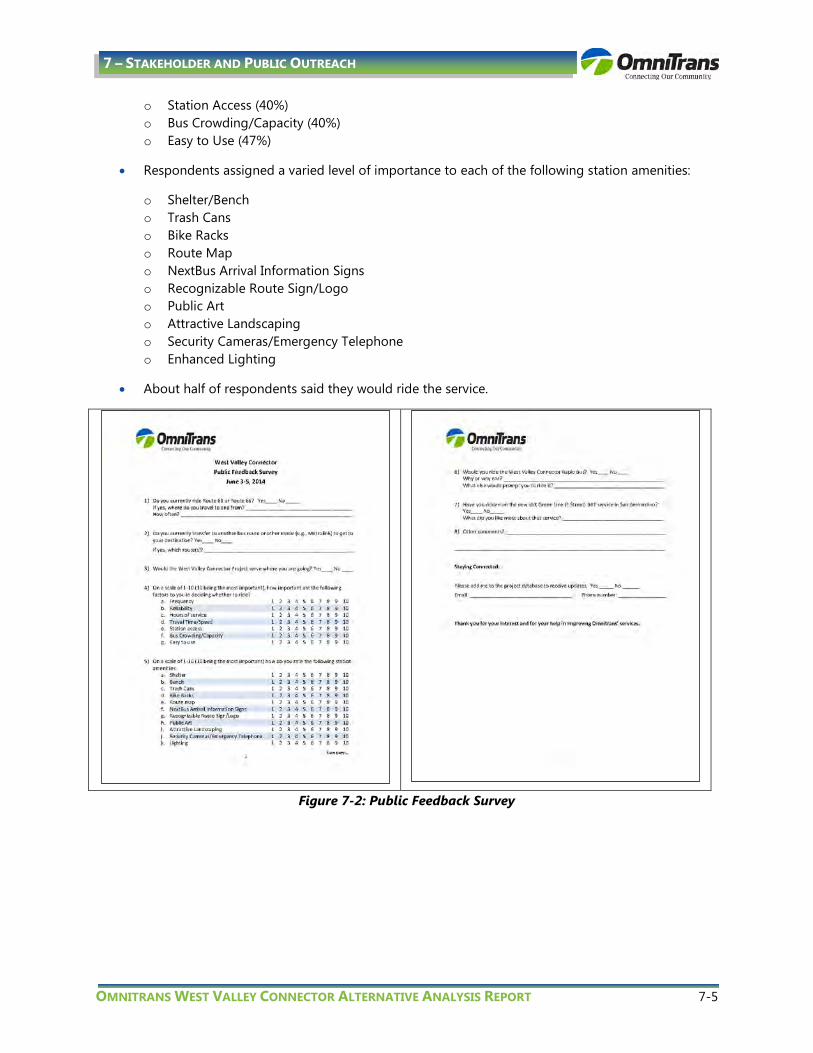
OMNITRANS WEST VALLEY CONNECTOR ALTERNATIVE ANALYSIS REPORT 7-5
7 – STAKEHOLDER AND PUBLIC OUTREACH
o Station Access (40%) o Bus Crowding/Capacity (40%) o Easy to Use (47%)
• Respondents assigned a varied level of importance to each of the following station amenities:
o Shelter/Bench o Trash Cans o Bike Racks o Route Map o NextBus Arrival Information Signs o Recognizable Route Sign/Logo o Public Art o Attractive Landscaping o Security Cameras/Emergency Telephone o Enhanced Lighting
• About half of respondents said they would ride the service.
Figure 7-2: Public Feedback Survey

7-6 OMNITRANS WEST VALLEY CONNECTOR ALTERNATIVE ANALYSIS REPORT
7 – STAKEHOLDER AND PUBLIC OUTREACH
This Page Intentionally Left Blank.
OMNITRANS WEST VALLEY CONNECTOR ALTERNATIVE ANALYSIS REPORT 8-1
8 – RECOMMENDED ALTERNATIVE
8. RECOMMENDED ALTERNATIVE
This chapter details the recommended alternative based on the analysis presented in this report. This process was developed in coordination with the local jursidictions and key stakeholders via the project development team (PDT); the recommended alternative was also presented to the public for input as detailed in Chapter 7.
8.1 Findings from the Evaluation As detailed in Chapter 6, multiple alternatives were evaluated and presented to the PDT, local jurisdictions and key stakeholders. Based on the comprehensive technical evaluation presented in this report and public/stakeholder input, the following key findings are presented:
• Route 61 is the highest ridership corridor in Omnitrans’ service area, providing more than 1.86 million boardings per year; approximately 5,800 per average weekday. This represents approximately 11.5% of Omnitrans’ total system ridership. Route 61 has consistently generated the highest ridership of all Omnitrans routes since 2006.
• Route 66 is the fifth highest ridership corridor in Omnitrans service area, providing more than 1.22 million boardings per year; approximately 3,800 per average weekday. This represents approximately 7.5% of Omnitrans’ total system ridership.
• The existing local routes’ combined daily ridership is 9,600 and forecasted to grow to 13,000 by 2035.
• Limited stop Rapid service would increase the ridership to 12,480 per day in the existing condition and is forecasted to grow to 18,790 daily riders by 2035.
• Currently available capital funding sources are not sufficient for higher levels of investment such as BRT dedicated lanes and/or enhanced stations and local matching funds are limited. The lack of a local match does not support entering FTA New Starts/Small Starts process at this time. However, there is sufficient available capital funding to support a Rapid bus service.
• Currently available O&M funding sources are limited and are projected to remain limited in the future, but will be sufficient for the Rapid service O&M costs.
• The No Build alternative does not meet the goals and objectives of the study, nor does it support city and regional goals for improved transit services in the major travel corridors.
• The TSM alternative would add capacity and increase ridership; however, it raises the current O&M cost by 46% and generates less ridership than a Rapid bus service, resulting in a higher cost per rider than Rapid bus service.
• Due to low levels of existing and future traffic congestion in the corridor, dedicated bus lanes would not significantly improve transit operations above the benefits provided by a limited stop Rapid service operating in mixed traffic flow lanes.
• A limited stop Rapid bus service provides the flexibility to maintain costs within the current funding projections by eliminating the need for ROW acquisition that would be required for higher levels of investment in the corridor such as dedicated lanes.
• A hybrid alignment using portions of Route 61 and Route 66 provides significantly better ridership than standalone alignments on Route 61 or Route 66 and provides increased access to regional key destinations.
• A limited stop Rapid service provides the most cost-effective service of the build alternatives, with the lowest increase in O&M cost of all build alternatives and a 30% increase in ridership.
• The 27 station locations identified in Alternative N are preferred by Omnitrans and the PDT. • The PDT recommends advancing the project into the next stages of project development. The
preferred alignment is shown in Figure 8-1.

8-2 OMNITRANS WEST VALLEY CONNECTOR ALTERNATIVE ANALYSIS REPORT
8 – RECOMMENDED ALTERNATIVE
• The West Valley Connector Corridor Rapid service project supports the development of improved transit service on substantial portions of three transit corridors, and increases the viability and ridership of all the Omnitrans West Valley Routes and the regional Metrolink service. It also sets the stage for further improvements in four corridors, including Haven Avenue, in the future as additional funding becomes available to Omnitrans.
Figure 8-1: Recommended Alternative; West Valley Connector Rapid Service
8.2 Recommended Alternative Based on these findings the recommended alternative is a modified low-cost version of Alternative N. This alternative continues local Route 61 and Route 66 service at 60-minute headways plus 10-minute Rapid bus service in mixed flow operation with 27 stations. Service on the portions of Route 61 and 66 not covered by the alignment would be equilibrated to the demand on those portions of the route, with likely headways of 30 minutes for Route 61 and 20 minute for Route 66. The all mixed flow operation has layovers at the end-of-line stations: Pomona Metrolink Station and South Fontana Transit Center (on Marygold Avenue).
The Rapid Bus would use 40-foot vehicles similar to what is already in service. Specialized branding would be developed that follows the sbX branding elements in place on the sbX Green Line, including a vehicle wrap to differentiate the Rapid bus vehicles from Omnitrans’ local bus service. The vehicle branding will be consistent with sbX branding at station locations and provide a uniform image that promotes the service as premium transit service.
Based on agreement with city staff and stakeholders, the recommended Sub-Area Alignments are shown below in Figure 8-2.

OMNITRANS WEST VALLEY CONNECTOR ALTERNATIVE ANALYSIS REPORT 8-3
8 – RECOMMENDED ALTERNATIVE
Segment A around the Ontario Airport, the preferred alignment provides direct access from Airport Drive at Archibald Avenue to the airport terminals via a short loop around airport parking minimizing run times and operational costs.
Segment B, Inland Empire Boulevard provides the best east-west connectivity between activity centers and access for users
Segment C Ontario Mills, the current Route 61 Alignment into the Ontario Mills is preferred, with the route continuing north on Milliken Avenue.
Figure 8-2: Recommended Sub Area Alignments

8-4 OMNITRANS WEST VALLEY CONNECTOR ALTERNATIVE ANALYSIS REPORT
8 – RECOMMENDED ALTERNATIVE
Connectivity to the Rancho Cucamonga Metrolink station will remain the same as existing Route 81 with access via 7th
Street. Right turns in and out of Azusa court (not depicted) will remain.
Access to Victoria Gardens will be provided via pedestrian connections or transfers from Foothill Boulevard/ Day Creek Boulevard.
South Fontana Transit Center, the Rapid bus service in the southbound direction will loop west on Marygold Avenue, south on Juniper Avenue, east on Valley and north on Sierra Avenue to the Kaiser Hospital station. The layover for vehicles will occur on Marygold Avenue.
Figure 8-2: Recommended Sub Area Alignments (Contd)
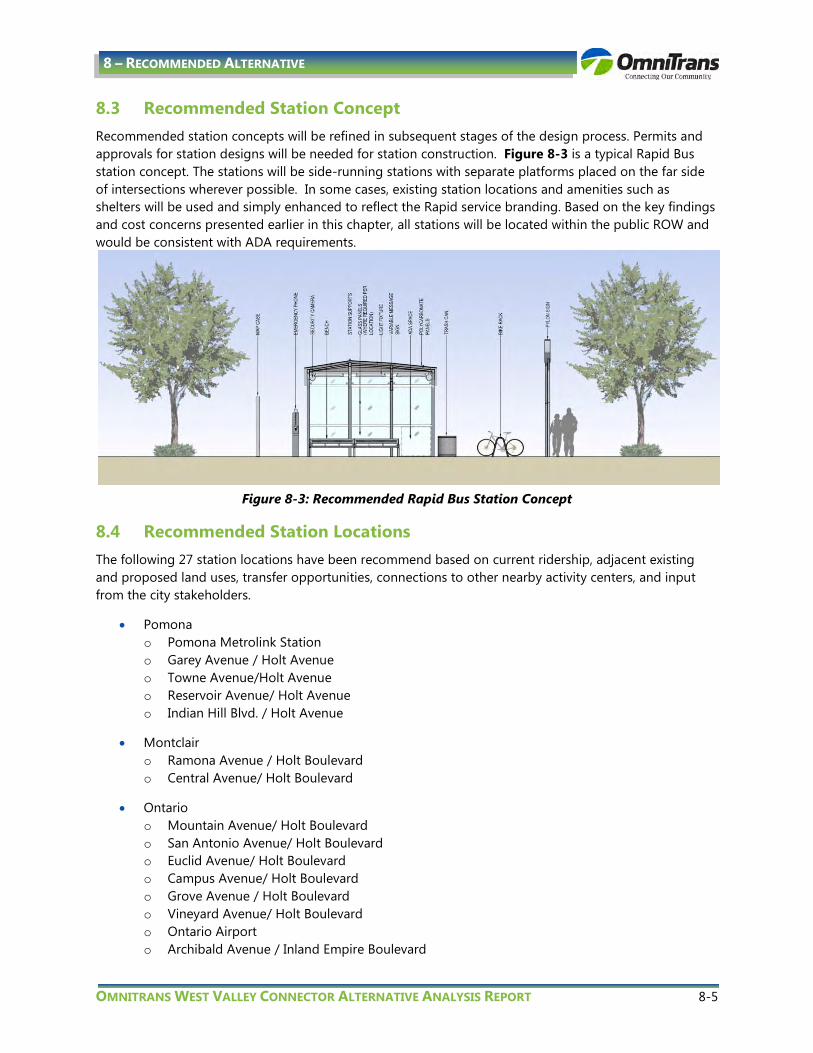
OMNITRANS WEST VALLEY CONNECTOR ALTERNATIVE ANALYSIS REPORT 8-5
8 – RECOMMENDED ALTERNATIVE
8.3 Recommended Station Concept Recommended station concepts will be refined in subsequent stages of the design process. Permits and approvals for station designs will be needed for station construction. Figure 8-3 is a typical Rapid Bus station concept. The stations will be side-running stations with separate platforms placed on the far side of intersections wherever possible. In some cases, existing station locations and amenities such as shelters will be used and simply enhanced to reflect the Rapid service branding. Based on the key findings and cost concerns presented earlier in this chapter, all stations will be located within the public ROW and would be consistent with ADA requirements.
Figure 8-3: Recommended Rapid Bus Station Concept
8.4 Recommended Station Locations The following 27 station locations have been recommend based on current ridership, adjacent existing and proposed land uses, transfer opportunities, connections to other nearby activity centers, and input from the city stakeholders.
• Pomona o Pomona Metrolink Station o Garey Avenue / Holt Avenue o Towne Avenue/Holt Avenue o Reservoir Avenue/ Holt Avenue o Indian Hill Blvd. / Holt Avenue
• Montclair o Ramona Avenue / Holt Boulevard o Central Avenue/ Holt Boulevard
• Ontario o Mountain Avenue/ Holt Boulevard o San Antonio Avenue/ Holt Boulevard o Euclid Avenue/ Holt Boulevard o Campus Avenue/ Holt Boulevard o Grove Avenue / Holt Boulevard o Vineyard Avenue/ Holt Boulevard o Ontario Airport o Archibald Avenue / Inland Empire Boulevard

8-6 OMNITRANS WEST VALLEY CONNECTOR ALTERNATIVE ANALYSIS REPORT
8 – RECOMMENDED ALTERNATIVE
o Haven Avenue / Inland Empire Boulevard o Ontario Mills
• Rancho Cucamonga o Rancho Cucamonga Metrolink Station o Milliken Avenue/Foothill Boulevard o Day Creek Boulevard/ Foothill Boulevard
• Fontana o Mulberry Avenue/Foothill Boulevard o Cherry Avenue /Foothill Boulevard o Citrus Avenue/Foothill Boulevard o Sierra Avenue/ Foothill Boulevard o Fontana Metrolink Station o Randall Avenue/ Sierra Avenue o Kaiser Hospital / South Fontana Transit Center
8.5 Project Ridership Statistics The Rapid Bus would travel the 25.2 mile corridor in 79 minutes and provide a substantial increase in ridership in the corridor in opening year, represented by year 2015 statistics, as shown in Table 8-1 below. Detailed ridership estimates are shown in Appendix D. Ridership by station is shown in Table 8-2.
Variable No Project TSM Rapid
Corridor Route* – 7,540 8,030
Route 61 6,100 760 1,690
Route 66 3,500 1,850 2,500
Routes 81 690 750 720
Total – All Routes 10,290 10,900 12,940
Additional Boardings – 610 2,650 Table 8-1: Rapid Bus Opeeing Year Ridership Statistics
Station Rapid
Pomona Metrolink 743
Holt & Garey 430
Holt & Towne 245
Holt & Clark 408
Holt & Indian Hill 501
Holt & Ramona 416
Holt & Central 353
Holt & Mountain 313
Holt & San Antonio 136
Holt & Euclid 357
Holt & Campus 270
Holt & Grove 175

OMNITRANS WEST VALLEY CONNECTOR ALTERNATIVE ANALYSIS REPORT 8-7
8 – RECOMMENDED ALTERNATIVE
Station Rapid
Airport & Vineyard 58
Ontario Airport 53
Inland Empire & Archibald 118
Inland Empire & Haven 183
Ontario Mills Mall 264
Rancho Metrolink 395
Foothill at Milliken 460
Foothill at Day Creek 45
Foothill at Mulberry 86
Foothill at Cherry 153
Foothill at Citrus 258
Foothill at Sierra 490
Fontana Metrolink 380
Sierra & Randall 161
Sierra & Kaiser 578
Total 8,030 Table 8-2: Opening Year Projected Ridership per Station Location
8.6 Project Cost Estimates and Recommended Funding Strategy Capital cost estimates for the rapid bus are based on the sbX green line experience and reflect the lower level of amenities provided at stations and detailed in Section 8.3 above. The conceptual capital cost estimate is shown in Table 8-3. O&M cost estimates are based on Omnitrans actual O&M costs and presented in Table 8-4. The net increase in O&M costs will be funded by existing O&M funding sources, including effeciences gained from restructuring West Valley Routes, with no net increase in Omnitrans O&M funding, effectively resulting in a cost neutral O&M cost.
Capital Costs
27 stations (48 stops) $10,998,255
Transit signal priority $1,725,000
Vehicles (7 new vehicles) $4,200,000
Rebranding of 23 vehicles $134,550
Design and Professional services $3,180,814
Contingency $4,230,814
Total $24,469,433 Table 8-3: Rapid Bus Conceptual Cost Estimate
Operating & Maintenance Costs
Rt. 61/66 60-min weekdays; 15-min. weekends; $ 7,048,179
Rapid 10-min weekdays; 14 hours per day; $ 5,247,900
Total $12,938,679

8-8 OMNITRANS WEST VALLEY CONNECTOR ALTERNATIVE ANALYSIS REPORT
8 – RECOMMENDED ALTERNATIVE
Operating & Maintenance Costs
Existing Rt. 61/66 service $10,139,200
Net Increase $2,156,879 Table 8-4: Rapid Bus Conceptual O&M Estimate
Capital funding for this project is available from Omnitrans’ funding reserves from unallocated federal funds, and local plan check and permit waivers as shown in Table 8-5. State and Federal grants may also be available on a competitive basis for portions of the project funding. Operations and maintenance costs will be funded by existing operations and maintenance funding sources, with no net increase in Omnitrans’ operations and maintenance funding. Routes that are duplicated by the West Valley Connector Rapid project will be optimized for ridership and cost efficiency.
Potential Capital Funding Sources
Value of Mid-Valley Land $21,000,000
Mid-Valley funds already programmed for construction $4,000,000
In-Kind Donations -
City Permit/Plan Check Fee Waivers $75,000
Ontario Mills Mall Station improvement Funds $800,000
Total Funding Available $25,875,000 Table 8-5: Rapid Bus Conceptual Funding Sources
8.7 Next Steps
8.7.1 Board Review and SCAG RTP The recommended alternative has been reviewed by the project development team (PDT) and the public. The PDT and key stakeholders have indicated strong support for the West Valley Connector and the recommended Rapid service alternative. The recommendations of the PDT were presented to the Omnitrans Plans and Programs Committee (PPC) in August 2014 and to the Omnitrans Board in September 2014. Presentations of the Alternatives Analysis Report will also be given to each of the five cities on the corridor during the ensuing months. Board adoption of the preferred alternative will occur commensurate with the project entering the next project development phase, specifically design and NEPA compliance.
The Holt Boulevard/Route 61 Corridor and the Route 66/West Foothill Corridor are already listed in SCAG’s financially constrained Regional Transportation Plan (RTP). An update to SCAG’s RTP will be coordinated with SCAG based on Board action.
8.7.2 Transition into Engineering Design and Environmental Studies Cost estimates, conceptual plans and an environmental screening have been prepared for the West Valley Connector Rapid service and are included as Appendices F and G to this report. Omnitrans will initiate the preparation of construction drawings and the preparation of environmental studies to support a Categorical Exclusion/Categorical Exemption under NEPA/CEQA. Startup of revenue service is anticipated in 2016.
Review of the potential for environmental impacts, as described above, indicates the absence of the potential for adverse effects under NEPA and significant impacts under CEQA. Based upon this finding, it

OMNITRANS WEST VALLEY CONNECTOR ALTERNATIVE ANALYSIS REPORT 8-9
8 – RECOMMENDED ALTERNATIVE
is recommended that the environmental clearance vehicles for the West Valley Connector to be pursued in the next phase of project development should be a Categorical Exclusion (under NEPA) and Categorical Exemption (under CEQA). The following sections provide additional information.
National Environmental Policy Act (NEPA) In February 2013, the Federal Transit Administration (FTA) published new Categorical Exclusions (CEs) tailored specifically to transit projects. These are codified at 23CFR771.118. The following CE categories should be considered as potentially applicable to the project.
Utility and Similar Appurtenance Action – Acquisition, installation, operation, evaluation, replacement, and discrete utilities and similar appurtenances within or adjacent to existing transportation right-of-way, such as: utility poles, underground wiring, cables, and information systems; and power substations and utility transfer stations. This would apply to utility modifications and installations incidental to the BRT station locations.
Maintenance, Rehabilitation, Reconstruction of Facilities – Maintenance, rehabilitation, and reconstruction of facilities that occupy substantially the same geographic footprint and do not result in a change in functional use, such as: improvements to bridges, tunnels, storage yards,, buildings, stations, and terminals; construction of platform extensions, passing track, and retaining walls; and improvements to tracks and railbeds. This would apply to the joint use of existing bus stops converted to BRT stations and could be justified co-located new BRT stations.
Action within Existing Operational Right-of-Way – Projects … that would take place entirely within the existing operational right-of-way. Existing operational right-of-way refers to right-of-way that has been disturbed for an existing transportation facility or is maintained for a transportation purpose. This would apply to the introduction of a new BRT route along and within existing street rights-of-way.
California Environmental Quality Act (CEQA) CEQA Guidelines (Article 19) identify a list of classes of projects which have been determined not to have a significant impact on the environment and which shall, therefore, be exempt from the provisions of CEQA. The following CE categories should be considered as potentially applicable to the project.
15301. Existing Facilities – Class 1 consists of the operation, repair, maintenance, permitting, leasing, licensing, or minor alteration of existing public or private structures, facilities, mechanical equipment, or topographic features, involving negligible or no expansion of use beyond that existing … Paragraph (c) references existing highways, streets, sidewalks and gutters.
15302. Replacement or Reconstruction – Class 2 consists of replacement or reconstruction of existing … facilities where the new structure … will have substantially the same purpose … as the structure replaced. Paragraph (c) refers to existing utility systems.
CEQA Guidelines (Article 5) also provides for the following:
15061. Review for Exemption (a) A project is exempt from CEQA if:
(3) The activity is covered by the general rule that CEQA applies only to projects which have the potential for causing a significant effect on the environment. Where it can be seen with certainty that there is no possibility that the activity in question may have a significant effect on the environment, that activity is not subject to CEQA.
8-10 OMNITRANS WEST VALLEY CONNECTOR ALTERNATIVE ANALYSIS REPORT
8 – RECOMMENDED ALTERNATIVE
Sections 15301 and 15302 may be applied to specific project components; section 15061 may be applied to the project as a whole.
Recommended Technical Studies In order to effectively demonstrate that the CE/CE NEPA/CEQA clearance process is appropriate, several technical studies should be conducted, the results of which would support the document selection. The recommended studies are as follows:
• Air Quality (including Greenhouse Gases) – Project vs. No Project calculations should be done to address the expected incremental changes in criteria pollutant emissions, local carbon monoxide concentrations, and greenhouse gas production.
• Cultural Resources – An affirmative search of potential resources located along the corridor, pursuant to 36CFR800 requirements, should be done. Potential effects (which would be expected to be absent) should then be assessed.
• Parks & Recreation – An inventory of publicly owned parks and recreational facilities along the corridor should be conducted and effects assessed. It is likely that only beneficial effects (i.e., increased accessibility) would be found.
• Section 4(f) – A federal requirement, related both to cultural resources and parklands, is to determine if a “use” of a Section 4(f) resource would occur. This evaluation should be done; again it would be expected to be noneventful.
• Hazards & Hazardous Materials – An inventory of published hazardous materials databases, supplemented with visual observations along the corridor, should be conducted. It is unlikely that a potentially significant consequence would be found.
• Land Use/Planning – The project should be evaluated in terms of its consistency with regional and local land use plans; a positive outcome would be expected.
• Noise – Although highly unlikely, potential noise impacts should be evaluated on a Project vs. No Project basis.
• Public Services - An inventory of public services and facilities (libraries, health care facilities, youth and senior service centers, etc.) along the corridor should be conducted and effects assessed. Beneficial effects (i.e., increased accessibility) would be expected.
• Transportation/Traffic – A Project vs. No Project analysis should be conducted, which would be expected to yield positive results, in terms of a slight reduction in automobile usage, improved overall accessibility, and minimal effects on local traffic conditions. Also, the removal of a negligible amount of on-street parking spaces (in the immediate vicinity of BRT station stops) should be evaluated in the context of overall corridor capacity.
8.8 Future Potential Improvements and Connections The West Valley Connector Corridor, develops portions of three sbX Corridors including Holt Boulevard, West Foothill Boulevard and Sierra Avenue as identified in Omnitrans’ Systemwide Plan and shown in Figure 8-4. As potential corridors for future BRT or other premium transit service these three corridors are integral to the development of the complete sbX System. Addtionally, Haven Avenue is identified in the City of Rancho Cucamonga’s General Plan as a key development corridor and premium transit service is needed to serve the expected development levels. Omnitrans will examine opportunities to provide premium transit service in the Haven Avenue corridor and others as part of future potential improvements in Omnitrans System. The implementation of Rapid bus service along Holt Boulevard, Milliken Avenue and Foothill Boulevard as proposed in this AA report does not preclude future development of higher levels of premium transit service in any of the three corridors, as sufficient funding becomes available.

OMNITRANS WEST VALLEY CONNECTOR ALTERNATIVE ANALYSIS REPORT 8-11
8 – RECOMMENDED ALTERNATIVE
Ontario’s Holt Boulevard Streetscape and Strategic Mobility Plan (2013) identified BRT with 3.5 miles of dedicated lanes along Holt Boulevard. The implementation of Rapid bus service along Holt Boulevard as proposed in this AA report does not preclude future development of higher levels of premium transit service along Holt Boulevard as sufficient funding becomes available. Capital cost estimates and funding sources for this potential future project are shown in Table 8-6.
Conceptual Cost Estimate
6 station upgrades $3,000,000
Dedicated BRT lanes $18,000,000
Sitework/utilities $4,200,000
Right-of-Way acquisition $3,484,800
Design and Professional services $9,793,920
Contingency (25%) $9,619,680
Total $48,098,400
Potential Capital Funding Sources
TIGER VI grant $15,000,000
Measure I - Major Arterial funding $24,049,200
Potential surplus from Phase 1 improvements $1,405,568
City of Ontario In-kind Donation $ 6,013,427
Total Funding Available $46,468,195 Table 8-6: Rapid Bus Conceptual Capital Costs and Funding Sources
Many stakeholders and Omnitrans staff have also expressed the desire to extend the West Valley Connector Corridor to San Bernardino so that it will connect with Omnitrans’ existing sbX Green Line and connect riders efficiently between the eastern and western portions of the San Bernardino Valley. Omnitrans’ existing Route 14 (from Fontana Transit Center to downtown San Bernardino along Foothill/Fifth Street) is one of the Omnitrans’ most productive bus routes as measured by passengers/hour. SANBAG’s Integrated Transit and Land Use Planning for the Foothill Boulevard/5th Street Transit Corridor (2013) recommended developing Rapid service along the Route 14 corridor when funds become available through the Measure I BRT fund in 2019. This is anticipated to be developed as a next phase to connect between the West Valley Connector Corridor and the sbX Green Line.

8-12 OMNITRANS WEST VALLEY CONNECTOR ALTERNATIVE ANALYSIS REPORT
8 – RECOMMENDED ALTERNATIVE
Figure 8-4: Future Potential Connections to the West Valley Connector Corridor

OMNITRANS WEST VALLEY CONNECTOR ALTERNATIVE ANALYSIS REPORT 8-13
8 – RECOMMENDED ALTERNATIVE
This Page Intentionally Left Blank.


OMNITRANS WEST VALLEY CONNECTOR ALTERNATIVE ANALYSIS REPORT A-1
APPENDIX A – TRANSIT SIGNAL PRIORITY MEMO
APPENDIX A – TRANSIT SIGNAL PRIORITY MEMO

A-2 OMNITRANS WEST VALLEY CONNECTOR ALTERNATIVE ANALYSIS REPORT
APPENDIX A – TRANSIT SIGNAL PRIORITY MEMO
This Page Intentionally Left Blank.

OMNITRANS WEST VALLEY CONNECTOR ALTERNATIVE ANALYSIS REPORT B-1
APPENDIX B – LAND USE PLANS AND POLICY REVIEW MEMO
APPENDIX B – LAND USE PLANS AND POLICY REVIEW MEMO

B-2 OMNITRANS WEST VALLEY CONNECTOR ALTERNATIVE ANALYSIS REPORT
APPENDIX B – LAND USE PLANS AND POLICY REVIEW MEMO
This Page Intentionally Left Blank.

OMNITRANS WEST VALLEY CONNECTOR ALTERNATIVE ANALYSIS REPORT C-1
APPENDIX C – TRAVEL DEMAND FORECASTING MEMO
APPENDIX C –TRAVEL DEMAND FORECASTING MEMO

C-2 OMNITRANS WEST VALLEY CONNECTOR ALTERNATIVE ANALYSIS REPORT
APPENDIX C – TRAVEL DEMAND FORECASTING MEMO
This Page Intentionally Left Blank.

OMNITRANS WEST VALLEY CONNECTOR ALTERNATIVE ANALYSIS REPORT D-1
APPENDIX D – CONCEPTUAL COST ESTIMATES
APPENDIX D – CONCEPTUAL COST ESTIMATES

D-2 OMNITRANS WEST VALLEY CONNECTOR ALTERNATIVE ANALYSIS REPORT
APPENDIX D – CONCEPTUAL COST ESTIMATES
This Page Intentionally Left Blank.

APPENDIX E – PUBLIC OUTREACH MEMO

G-2 OMNITRANS WEST VALLEY CONNECTOR ALTERNATIVE ANALYSIS REPORT
APPENDIX G – ENVIRONMENTAL SCREENING MEMO
This Page Intentionally Left Blank.

OMNITRANS WEST VALLEY CONNECTOR ALTERNATIVE ANALYSIS REPORT G-1
APPENDIX G – ENVIRONMENTAL SCREENING MEMO
APPENDIX F– CONCEPTUAL PLANS

G-2 OMNITRANS WEST VALLEY CONNECTOR ALTERNATIVE ANALYSIS REPORT
APPENDIX G – ENVIRONMENTAL SCREENING MEMO
This Page Intentionally Left Blank.

OMNITRANS WEST VALLEY CONNECTOR ALTERNATIVE ANALYSIS REPORT G-1
APPENDIX G – ENVIRONMENTAL SCREENING MEMO
APPENDIX G – ENVIRONMENTAL SCREENING MEMO

G-2 OMNITRANS WEST VALLEY CONNECTOR ALTERNATIVE ANALYSIS REPORT
APPENDIX G – ENVIRONMENTAL SCREENING MEMO
This Page Intentionally Left Blank.


