22
Westlake Chemical Corporation Fourth Quarter 2020
Westlake Chemical CorporationFourth Quarter 2020

Olefins (2020)
$303 million EBITDA(1)
24% of total EBITDA(4)
Westlake Chemical CorporationA Leading Integrated Materials Company
2Notes: (1) See page 20, (2) Includes WLK Corporate EBITDA, (3) Net Income attributable to WLK, (4) Excludes WLK corporate EBITDA
(2020)
Vinyls (2020)
$957 million EBITDA(1)
76% of total EBITDA(4)
Net Sales $7,504 Million
EBITDA (1,2) $1,246 Million
Net Income (3) $330 Million
Our Mission:
• Profitable bottom line
growth.
• In businesses we
understand.
• Globally in areas we can
gain an edge.
• In a disciplined and
opportunistic manner.
Strategic Action Update:
• Disciplined, financially
conservative strategy with
integrated operations:
o Increased Ethylene JV ownership to
expand integrated vinyls margins.
o Recent global PVC, VCM & Chlor
Alkali expansions increase
integration.
• Strong balance sheet and
liquidity with focus on costs and
cash generation.
Our mission is to create long term value with a risk adjusted return approach.
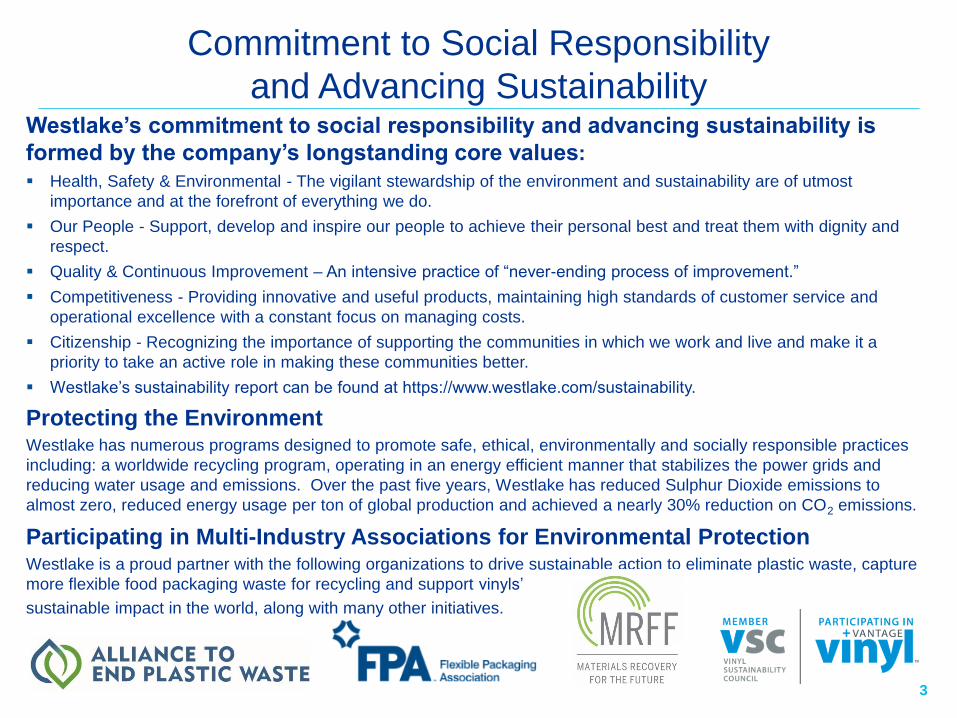
Westlake’s commitment to social responsibility and advancing sustainability is
formed by the company’s longstanding core values:
▪ Health, Safety & Environmental - The vigilant stewardship of the environment and sustainability are of utmost
importance and at the forefront of everything we do.
▪ Our People - Support, develop and inspire our people to achieve their personal best and treat them with dignity and
respect.
▪ Quality & Continuous Improvement – An intensive practice of “never-ending process of improvement.”
▪ Competitiveness - Providing innovative and useful products, maintaining high standards of customer service and
operational excellence with a constant focus on managing costs.
▪ Citizenship - Recognizing the importance of supporting the communities in which we work and live and make it a
priority to take an active role in making these communities better.
▪ Westlake’s sustainability report can be found at https://www.westlake.com/sustainability.
Commitment to Social Responsibility
and Advancing Sustainability
Participating in Multi-Industry Associations for Environmental Protection Westlake is a proud partner with the following organizations to drive sustainable action to eliminate plastic waste, capture
more flexible food packaging waste for recycling and support vinyls’
sustainable impact in the world, along with many other initiatives.
Protecting the EnvironmentWestlake has numerous programs designed to promote safe, ethical, environmentally and socially responsible practices
including: a worldwide recycling program, operating in an energy efficient manner that stabilizes the power grids and
reducing water usage and emissions. Over the past five years, Westlake has reduced Sulphur Dioxide emissions to
almost zero, reduced energy usage per ton of global production and achieved a nearly 30% reduction on CO2 emissions.
3

Westlake Makes Essential Products To Protect and
Enhance Our Daily Lives
4
Chlor Alkali
Used in water treatment, disinfectants,
paper, tissues and cardboard packaging.
PVC
Used in medical equipment and supplies
as well as a variety of construction and
infrastructure uses, such as fresh and
waste water piping.
Low Density Polyethylene
Used for medical applications and
food packaging.
Westlake’s products support over
half of the 17 Sustainable
Development Goals adopted by
the United Nations:
Westlake’s products are used for many
essential goods that are particularly
important in today’s environment:

Westlake, A Global Diversified Product Mix
5
World Wide Presence:
North America
Highly integrated, low
cost production of PE,
PVC & Caustic Soda:
• 11 Chemical sites.
• 20+ Polymer product
sites.
Europe
Global leader in Specialty
PVC, Leading global PVC
compounder:
• 5 Chemical sites.
• Downstream value added
polymer compound
products.
Asia
High quality PVC resin and
film products in a growth
region:
• 2 Chemical sites.
• 3 Polymer product sites.
A Global Leading Producer:
Chlor Alkali
2nd largest Chlor Alkali
producer in the world,
capitalizes on globally
low cost natural gas for
power in North America.
PVC
2nd largest producer of
PVC in the world leveraging
the high level of product
integration and long-term
low cost feedstocks.
Low Density Polyethylene
• Largest specialty autoclave
LDPE producer globally.
• 2nd largest producer of
Low Density Polyethylene
in the Americas.
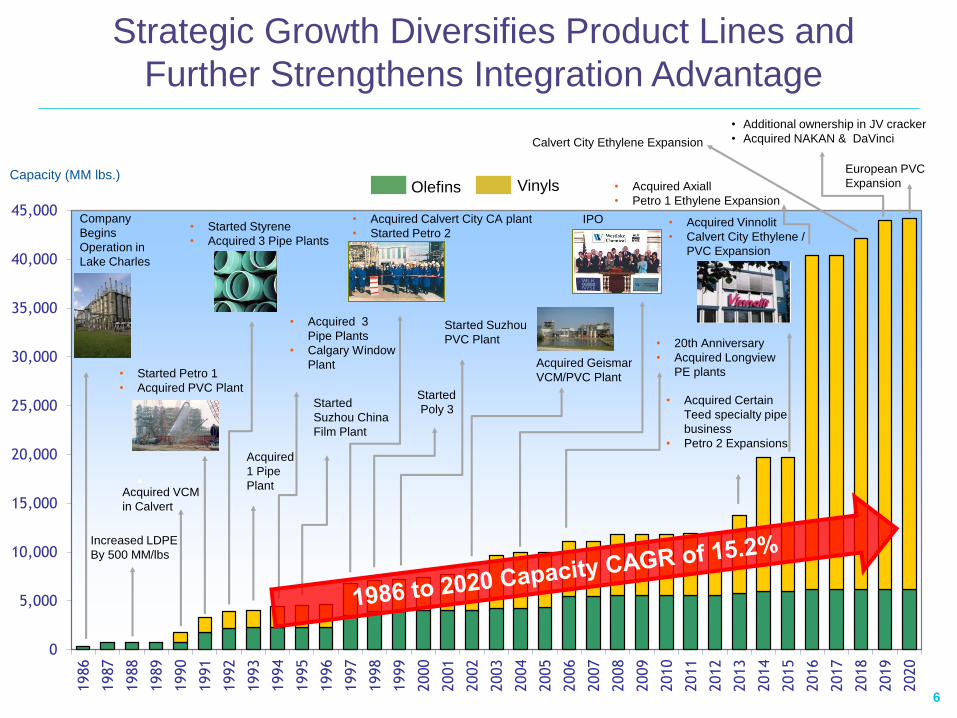
Strategic Growth Diversifies Product Lines and
Further Strengthens Integration Advantage
0
5,000
10,000
15,000
20,000
25,000
30,000
35,000
40,000
45,000
1986
1987
1988
1989
1990
1991
1992
1993
1994
1995
1996
1997
1998
1999
2000
2001
2002
2003
2004
2005
2006
2007
2008
2009
2010
2011
2012
2013
2014
2015
2016
2017
2018
2019
2020
Capacity (MM lbs.)VinylsOlefins
Company
Begins
Operation in
Lake Charles
Acquired VCM
in Calvert
• Started Petro 1
• Acquired PVC Plant
Acquired Geismar
VCM/PVC Plant
Acquired
1 Pipe
Plant
• Acquired 3
Pipe Plants
• Calgary Window
Plant
Started
Suzhou China
Film Plant
Increased LDPE
By 500 MM/lbs
• Acquired Calvert City CA plant
• Started Petro 2
Started
Poly 3
Started Suzhou
PVC Plant
• Started Styrene
• Acquired 3 Pipe Plants
IPO
• 20th Anniversary
• Acquired Longview
PE plants
• Acquired Vinnolit
• Calvert City Ethylene /
PVC Expansion
• Acquired Certain
Teed specialty pipe
business
• Petro 2 Expansions
• Acquired Axiall
• Petro 1 Ethylene Expansion
Calvert City Ethylene Expansion
• Additional ownership in JV cracker
• Acquired NAKAN & DaVinci
6
European PVC
Expansion
• Pulp & paper
• Glass
• Alumina
Globally Advantaged Cost Position With A
Very High Degree of Product Integration
7
• Tires
• Latexes for paint &
coatings
• Flooring
• Roofing
• Wall paper
• Films
• Coating
• Automotive
• Artificial leather
• Fencing
• Decking
• Siding
• Pipe
Expansion
Olefins
Vinyls
All ethane
feedstock
capability
Chlorinated
Products
Key:
Ethylene
4.8 Billion lbs
Polyethylene
2.6 Billion lbs
Styrene
570 Million lbs
Chlorine
7.1 Billion lbs
Vinyls
PVC
7.8 Billion lbsVinyls
Products
3.4 Billion
lbs
Chlorinated Products
2.3 Billion lbs
Caustic Soda
7.9 Billion lbs
North
American
Merchant
Ethylene
Purchases
~1.1 Billion
lbs
Westlake
+55 Million lbs
+60 Million lbs
• Flexible packaging
• Shrink wrap
• Trash bags
End Markets
Westlake Chemical has a long-term strategic cost advantage:
• North America has a long-term cost advantaged position through abundant supply of
Ethane from shale, electricity from natural gas and ample salt compared to global markets.
• Integration from feedstock to final product captures margin across the production chain and
throughout the economic cycle.
Note: only North American capacities are listed

52%
39%
9%
Chlor Alkali
Ethylene
PVC Resin
Low Cost Producer of PVC
Combined with High Integration Captures Margin
• Westlake has made numerous PVC debottlenecks that
inexpensively capture more integrated margin
• Integration has allowed Westlake to operate its chlorovinyls
plants at higher operating rates than US industry average.
• Increased ownership in the Westlake – Lotte JV Ethylene
cracker expands Ethylene integration advantage.
Overview of the Vinyls Chain
Average Vinyls Industry Margin
Distribution Over the Last
10 Year Cycle
Polyvinyl
Chloride
(PVC)
Vinyl
Chloride
Monomer
(VCM)
Ethylene
Dichloride
(EDC)
Chlorine
Ethylene
Chlor-Alkali
Caustic
Soda
PVC
(Vinyls
Products)
Merchant
Sales
Chlorinated
Products
8Source: IHS Markit
Majority of Margin Captured in
Chlor-Alkali and Ethylene.
• Through backward integration into Chlor Alkali (shale gas based power) and ethylene (shale gas based
ethane), Westlake is consistently one of the lowest cost PVC producers globally.
• Cost competitive PVC exports as Westlake sits long-term at the low end of the cost curve.
• Complexity of vinyls chain drives value and raises barriers to entry.
0
1,000
2,000
3,000
4,000
5,000
6,000
Olin Westlake Oxy Formosa Dow
kM
T
0
1,000
2,000
3,000
4,000
5,000
Shin-Etsu Westlake Formosa INEOS Xinjiang Zhongtai
kM
T
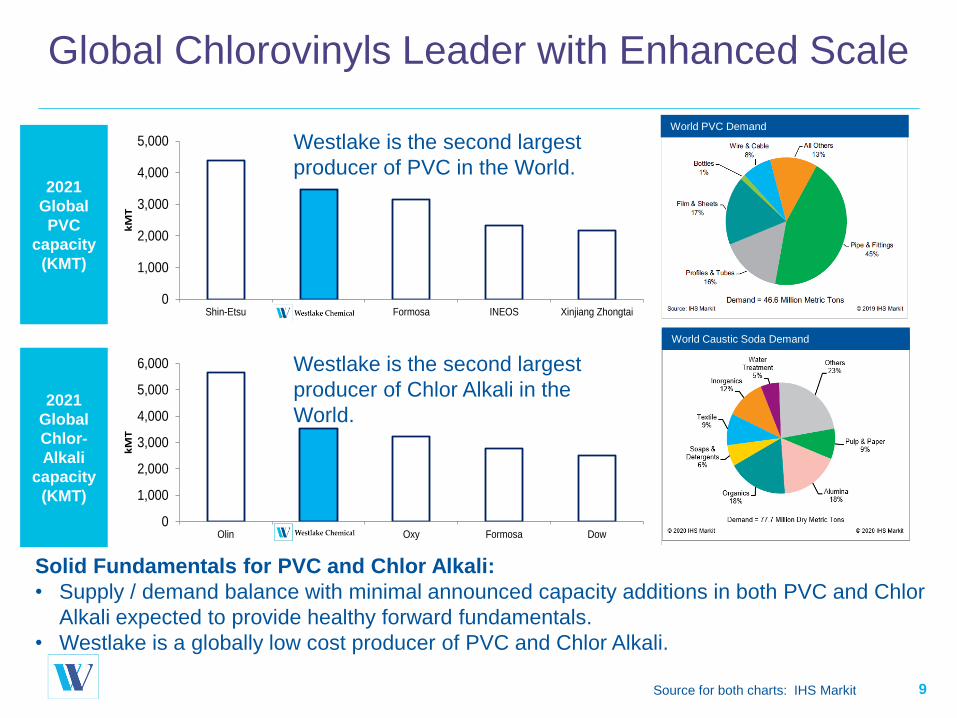
Global Chlorovinyls Leader with Enhanced Scale
9Source for both charts: IHS Markit
Solid Fundamentals for PVC and Chlor Alkali:
• Supply / demand balance with minimal announced capacity additions in both PVC and Chlor
Alkali expected to provide healthy forward fundamentals.
• Westlake is a globally low cost producer of PVC and Chlor Alkali.
2021
Global
PVC
capacity
(KMT)
2021
Global
Chlor-
Alkali
capacity
(KMT)
Westlake is the second largest
producer of PVC in the World.
Westlake is the second largest
producer of Chlor Alkali in the
World.
World PVC Demand
World Caustic Soda Demand

0
100
200
300
400
500
600
Orbia(Mexico,
USA,Germany)
Westlake(Germany)
Inovyn(EU)
Formosa(Taiwan,
USA, China)
Shenyang(China)
AnhuiHongsifang
(China)
XinjiangHuatai(China)
Kaneka(Japan)
Kem One(EU)
Hanwha(Korea)
Ca
pa
city (
km
t)
0
30
5 Year Ave(2016-2020)
cen
ts p
er
po
un
d
Westlake is the Global Leader in Specialty PVC
10
Westlake / Vinnolit is a leading producer of specialty PVC
2021 Specialty PVC global capacity: ~4,200 KMT
Source: IHS Markit
Westlake’s Vinnolit operations provide
specialty PVC which:
• Delivers higher margins and diversifies
end market demand vs. commodity PVC.
• Broadens Westlake’s market channels.
Specialty PVC Creates
Margin Advantage Over
Commodity PVC
-5%
-3%
-1%
1%
3%
5%
20
03
20
04
20
05
20
06
20
07
20
08
20
09
20
10
20
11
20
12
20
13
20
14
20
15
20
16
20
17
20
18
20
19
20
20
20
21
20
22
20
23
20
24
20
25
Rel
ativ
e C
han
ge in
C
apac
ity
Co
mp
ared
to
W
orl
d G
DP
Over/ Under Investment in World Caustic Capacity
Fundamentals in Chlor Alkali Constructive
11Source: IHS Markit, IMF
Forecast
• Integrated facilities in North America benefit from consistently low
cost feedstocks and natural gas.
• Outlook for demand growth outpaces industry capacity additions.
Significant under investment positions the industry to benefit as demand grows

0%
10%
20%
30%
40%
50%
60%
-
10,000
20,000
30,000
40,000
50,000
60,0002000
2001
2002
2003
2004
2005
2006
2007
2008
2009
2010
2011
2012
2013
2014
2015
2016
2017
2018
2019
2020
2021
2022
2023
2024
2025
2026
Nort
h A
meri
ca P
VC
Export
s(a
s %
of
Tota
l N
ort
h A
meri
ca P
roducti
on)
Glo
bal PV
C D
em
and
(thousa
nd M
etr
ic T
ons)
Global PVC Demand
North American PVC Exports
Growing Global PVC Demand
Supports North American Exports
12
2000 – 2020 Global Demand CAGR = 2.7% 2021 – 2026
Global Demand
CAGR = 3.8%
• Global growth in PVC demand is forecasted to continue growing well into the future.
• Producers with a high level of integration benefit with higher margins over the cycle.
• Global growth in PVC demand and long-term advantaged feedstocks in PVC production supports North American production.
Source: IHS Markit

5.9 ¢
7.3 ¢8.0 ¢ 7.8 ¢
0
3
6
9
0
2
4
6
2015 -2019 Average
LDPE, 58%
LLDPE, 42%
Advantaged Polyethylene Product Mix
13
LDPE is More Profitable than LLDPE and HDPE Average Margin Advantage of LDPE vs. Other PE Grades
LDPE22%
LLDPE33%
HDPE45%
2021 Global Industry Demand
(% share)
2021 Total Forecasted Demand:
241 billion pounds
Westlake Capacity (% share)
Total Capacity: 2.6 billion pounds
Specialty PE(1) Is Even More
Profitable
Note (1): Chart above reflects a mix of both specialized and
differentiated products for LDPE and LLDPE.
Source for all charts IHS Markit
¢ /lb
2006 – 2020
Average
2016 – 2020
Average
LD
PE
vs
. H
DP
E
LD
PE
vs
. L
LD
PE
LD
PE
vs
. H
DP
E
LD
PE
vs
. L
LD
PE
¢ /lb
Average
specialty
premium over
commodity PE
0% 20% 40% 60% 80%
Chevron Phillips
Dow
ExxonMobil
LyondellBasell
Westlake
Advantaged Product MixWestlake’s Unique LDPE Focus
14
LDPE Capacity as a Percentage of
Total Company PE Capacity
Westlake has a
significantly
higher percentage
of LDPE product
mix than industry
competitors in
the Americas
Autoclave vs Tubular LDPE:
• Autoclave LDPE is a more specialty product
with broader applications and better margins;
Westlake’s focus into food packaging
applications provides demand stability.
• Supply/demand balance for autoclave grows
tighter.
Source for both charts: IHS Markit
The Specialty Advantage
80%
40%
33%
33%
20%
60%
67%
63%
Westlake 2021
North America 2021
World 2021
World 2024
Autoclave Tubular Undeclared
HDPE: High Density Polyethylene, LLDPE: Linear Low Density Polyethylene, LDPE: Low Density Polyethylene.
Sources: IHS Markit (Capacity), Bloomberg (GDP 2012 – 2022), OECD (GDP 2023-2024). All as of Oct, 2020.
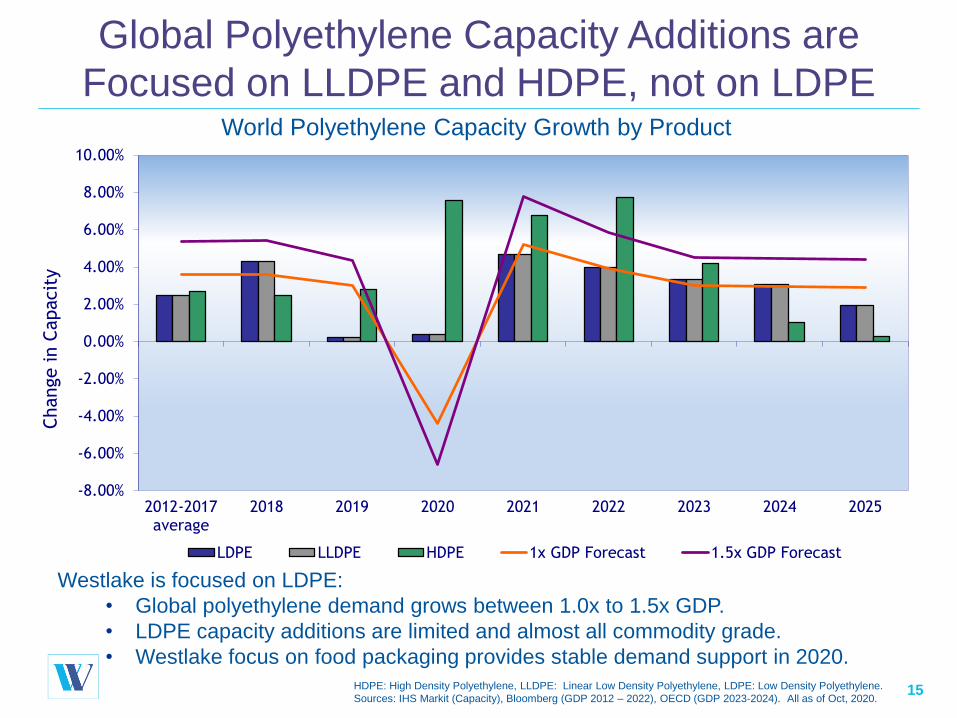
Global Polyethylene Capacity Additions are
Focused on LLDPE and HDPE, not on LDPE
15
World Polyethylene Capacity Growth by Product
Westlake is focused on LDPE:
• Global polyethylene demand grows between 1.0x to 1.5x GDP.
• LDPE capacity additions are limited and almost all commodity grade.
• Westlake focus on food packaging provides stable demand support in 2020.
-8.00%
-6.00%
-4.00%
-2.00%
0.00%
2.00%
4.00%
6.00%
8.00%
10.00%
2012-2017average
2018 2019 2020 2021 2022 2023 2024 2025
Change in C
apacit
y
LDPE LLDPE HDPE 1x GDP Forecast 1.5x GDP Forecast

Financially Disciplined
• A leading materials company founded and operated
on value creation.
• A global, diversified products producer fueled by
long-term low cost feedstock.
• High level of product integration drives higher
operating rates with higher margin specialty
production in Polyethylene and PVC.
• Disciplined investment culture and a strong balance
sheet provide for ability to weather economic cycles
and generate strategic growth over time.
16
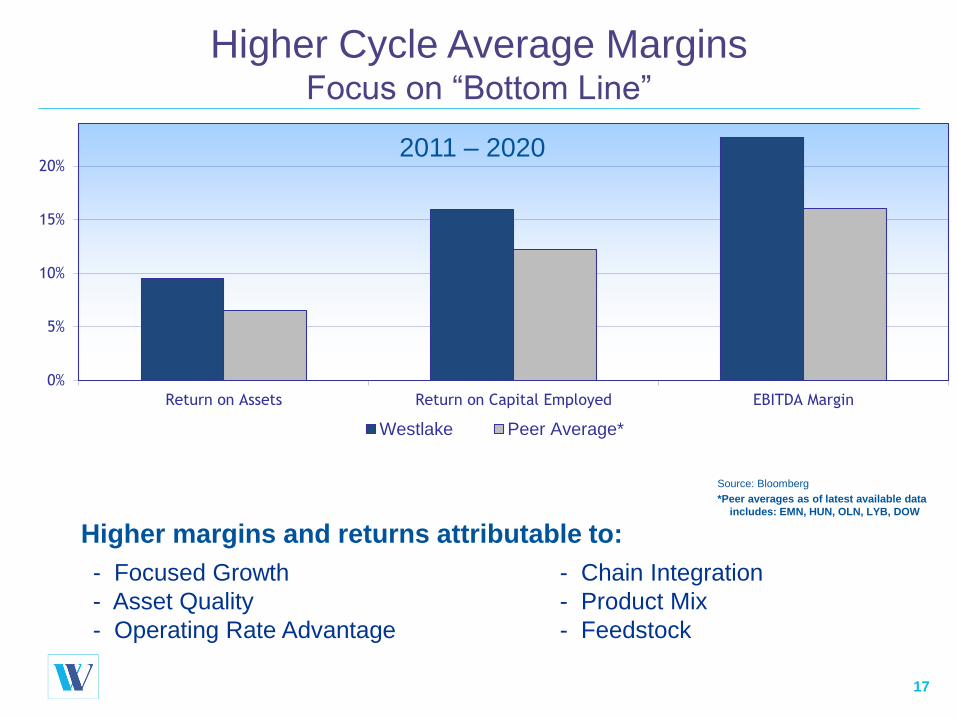
0%
5%
10%
15%
20%
Return on Assets Return on Capital Employed EBITDA Margin
Westlake Peer Average*
Higher Cycle Average MarginsFocus on “Bottom Line”
17
Higher margins and returns attributable to:
- Focused Growth - Chain Integration
- Asset Quality - Product Mix
- Operating Rate Advantage - Feedstock
2011 – 2020
Source: Bloomberg
*Peer averages as of latest available data
includes: EMN, HUN, OLN, LYB, DOW
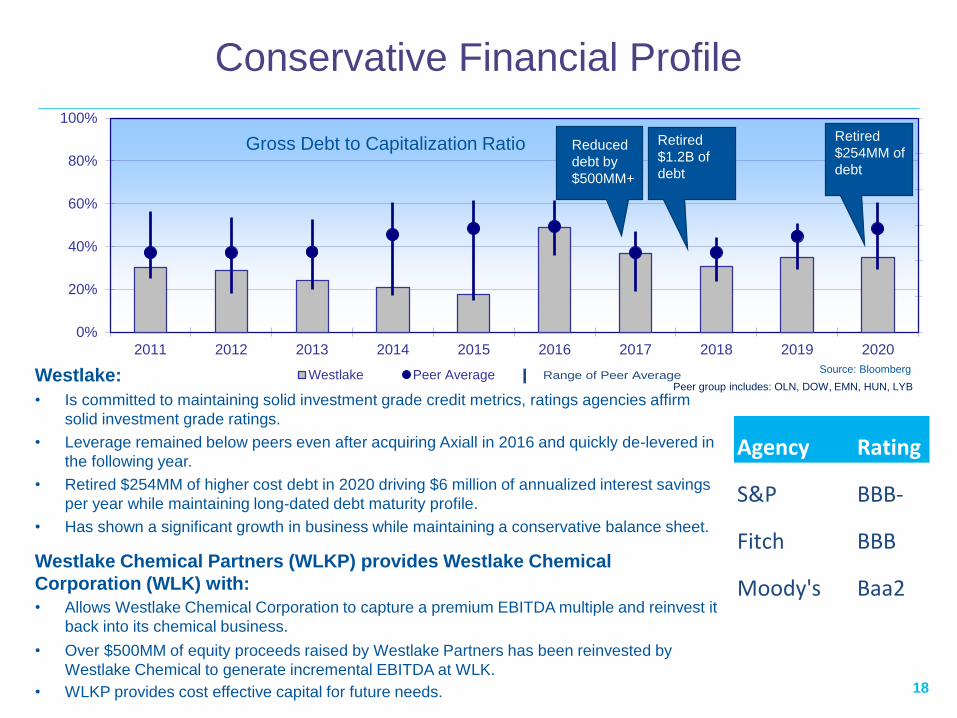
0%
20%
40%
60%
80%
100%
2011 2012 2013 2014 2015 2016 2017 2018 2019 2020
Westlake Peer Average
18
Conservative Financial Profile
Gross Debt to Capitalization Ratio
Range of Peer AverageSource: Bloomberg
Peer group includes: OLN, DOW, EMN, HUN, LYB
Retired
$1.2B of
debt
Reduced
debt by
$500MM+
Agency Rating
S&P BBB-
Fitch BBB
Moody's Baa2
Westlake:
• Is committed to maintaining solid investment grade credit metrics, ratings agencies affirm
solid investment grade ratings.
• Leverage remained below peers even after acquiring Axiall in 2016 and quickly de-levered in
the following year.
• Retired $254MM of higher cost debt in 2020 driving $6 million of annualized interest savings
per year while maintaining long-dated debt maturity profile.
• Has shown a significant growth in business while maintaining a conservative balance sheet.
Westlake Chemical Partners (WLKP) provides Westlake Chemical
Corporation (WLK) with:
• Allows Westlake Chemical Corporation to capture a premium EBITDA multiple and reinvest it
back into its chemical business.
• Over $500MM of equity proceeds raised by Westlake Partners has been reinvested by
Westlake Chemical to generate incremental EBITDA at WLK.
• WLKP provides cost effective capital for future needs.
Retired
$254MM of
debt
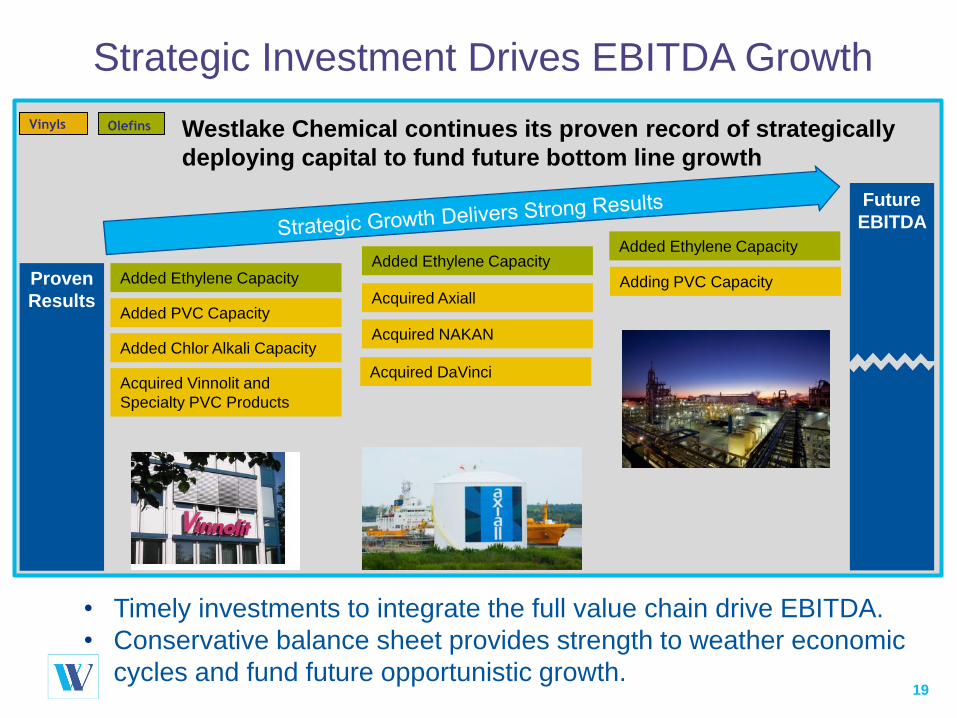
Strategic Investment Drives EBITDA Growth
19
Proven
Results
Future
EBITDA
Vinyls Olefins
Added Ethylene Capacity
Added PVC Capacity
Added Chlor Alkali Capacity
Acquired Vinnolit and
Specialty PVC Products
Added Ethylene Capacity
Acquired Axiall
Added Ethylene Capacity
Adding PVC Capacity
• Timely investments to integrate the full value chain drive EBITDA.
• Conservative balance sheet provides strength to weather economic
cycles and fund future opportunistic growth.
Acquired NAKAN
Westlake Chemical continues its proven record of strategically
deploying capital to fund future bottom line growth
Acquired DaVinci

Reconciliation of Westlake EBITDA to Net Income and to Cash
Flow from Operating Activities (in $ millions)
20
Note 1 from page 2: Non-GAAP Financial Measures
This presentation includes the non-GAAP measure EBITDA. A reconciliation to net income and to cash flow from operating activities is included above.
2010 2011 2012 2013 2014 2015 2016 2017 2018 2019 2020
Adjusted EBITDA 512$ 584$ 780$ 1,118$ 1,330$ 1,244$ 1,015$ 1,841$ 2,101$ 1,407$ 1,246$
Debt Retirement Cost - - (7) - - - - - - - -
EBITDA 512 584 773 1,118 1,330 1,244 1,015 1,841 2,101 1,407 1,246
Less:
Income Tax (Provision) Benefit (122) (142) (200) (332) (399) (298) (138) 258 (300) (108) 42
Interest Expense (40) (51) (43) (18) (38) (35) (79) (159) (126) (124) (142)
Depreciation & Amortization (129) (132) (144) (158) (208) (246) (378) (601) (641) (713) (773)
Non Controlling Interest - - - - (6) (19) (21) (35) (38) (41) (43)
Net Income 221 259 386 610 679 646 399 1,304 996 421 330
Non Controlling Interest - - - - 6 19 21 35 38 41 43
Changes in operating assets & liabilities and others 48 86 233 49 288 374 346 723 313 785 778
Deferred income taxes 14 14 6 94 59 40 101 (534) 62 54 146
Cash flow from operating activities 283$ 359$ 624$ 753$ 1,032$ 1,079$ 867$ 1,528$ 1,409$ 1,301$ 1,297$
Vinyls EBITDA (20) 48 131 207 247 398 415 1,095 1,439 1,032 957
Olefins EBITDA 547 549 655 944 1,126 863 699 803 715 407 303
Corporate EBITDA (15) (13) (13) (33) (43) (17) (99) (57) (53) (32) (14)
Westlake Adjusted EBITDA 512$ 584$ 773$ 1,118$ 1,330$ 1,244$ 1,015$ 1,841$ 2,101$ 1,407$ 1,246$
Safe Harbor Language
21
Investor Relations Contacts
Westlake Chemical
2801 Post Oak Boulevard, Suite 600
Houston, Texas 77056
713-960-9111
Steve Bender
Executive Vice President &
Chief Financial Officer
Jeff Holy
Vice President &
Treasurer
This presentation contains certain forward-looking statements including statements regarding managing working capital,
lowering operating costs and reducing capital expenditures and the timing of the Petro 2 turnaround. Actual results may
differ materially depending on factors such as general economic and business conditions; the cyclical nature of the
chemical industry; the availability, cost and volatility of raw materials and energy; uncertainties associated with the United
States, Europe and worldwide economies, including those due to political tensions in the Middle East and elsewhere;
current and potential governmental regulatory actions in the United States and Europe and regulatory actions and political
unrest in other countries; industry production capacity and operating rates; the supply/ demand balance for our products;
competitive products and pricing pressures; instability in the credit and financial markets; access to capital markets; the
COVID-19 pandemic and the response thereto; terrorist acts; operating interruptions including leaks, explosions, fires,
weather-related incidents, mechanical failure, unscheduled downtime, labor difficulties, transportation interruptions, spills
and releases and other environmental risks; changes in laws or regulations; technological developments; our ability to
implement our business strategies; creditworthiness of our customers; and other factors described in our reports filed with
the Securities and Exchange Commission. Many of these factors are beyond our ability to control or predict. Any of these
factors, or a combination of these factors, could materially affect our future results of operations and the ultimate accuracy
of the forward-looking statements. These forward-looking statements are not guarantees of our future performance, and
our actual results and future developments may differ materially from those projected in the forward-looking statements.
Management cautions against putting undue reliance on forward-looking statements. Every forward-looking statement
speaks only as of the date of the particular statement, and we undertake no obligation to publicly update or revise any
forward-looking statements.


