28
Westlake Chemical Corporation Houston Chemical Intensity Day Goldman Sachs March 24, 2009
Westlake Chemical Corporation
Houston Chemical Intensity DayGoldman SachsMarch 24, 2009
2
SAFE HARBOR LANGUAGE
This presentation may include forward-looking statements, as defined in the Private Securities Litigation Reform Act of 1995, reflecting management’s current analysis and expectations, based on reasonable assumptions. Results could differ materially depending on such factors as business climate, business performance, economic and competitive uncertainties, ability to execute work process redesign and reduce costs, failure to complete transactions or to achieve benefit from transactions, higher manufacturing costs, change in strategies, reduced level of customer orders, risks in developing new products and technologies, adverse legal and regulatory developments including increases in the number or financial exposures of claims, lawsuits, settlements or judgments, or the inability to eliminate or reduce such financial exposures by collecting indemnity payments from insurers, environmental and safety regulations and clean-up costs, foreign exchange rates, and adverse changes in economic and political climates around the world. Accordingly, there can be no assurance that the Company will meet future results, performance or achievements expressed or implied by such forward-looking statements. As appropriate, additional factors are contained in reports filed with the Securities and Exchange Commission. This paragraph is included to provide safe harbor for forward-looking statements, which are generally not required to be publicly revised as circumstances change.
Investor Relations Contact
Steven BenderSr. Vice President, Chief Financial Officer
& Treasurer
Westlake Chemical Corporation2801 Post Oak Boulevard, Suite 600
Houston, Texas 77056713-960-9111
www.westlake.com
3
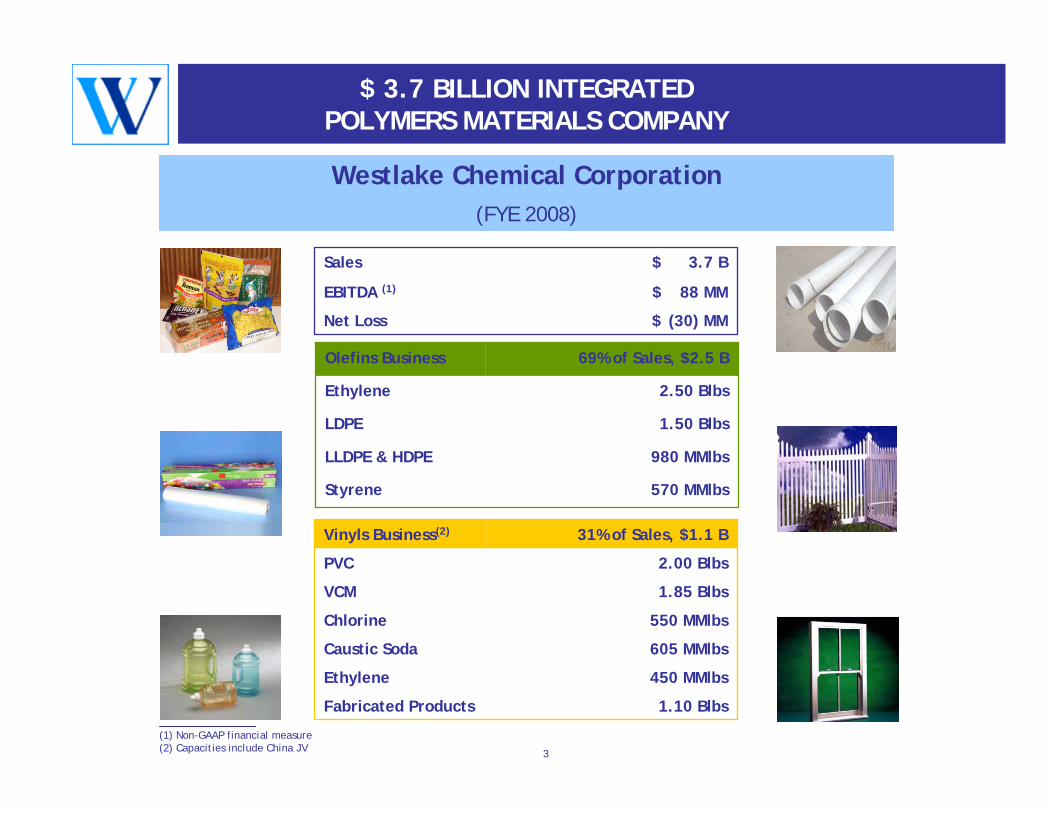
$ 3.7 BILLION INTEGRATEDPOLYMERS MATERIALS COMPANY
31% of Sales, $1.1 BVinyls Business(2)
450 MMlbsEthylene
1.85 BlbsVCM
550 MMlbsChlorine
1.10 BlbsFabricated Products
605 MMlbsCaustic Soda
2.00 Blbs PVC
$ (30) MMNet Loss
$ 88 MMEBITDA (1)
$ 3.7 B Sales
Westlake Chemical Corporation(FYE 2008)
(1) Non-GAAP financial measure(2) Capacities include China JV
69% of Sales, $2.5 B Olefins Business
980 MMlbsLLDPE & HDPE
570 MMlbsStyrene
1.50 BlbsLDPE
2.50 Blbs Ethylene
4
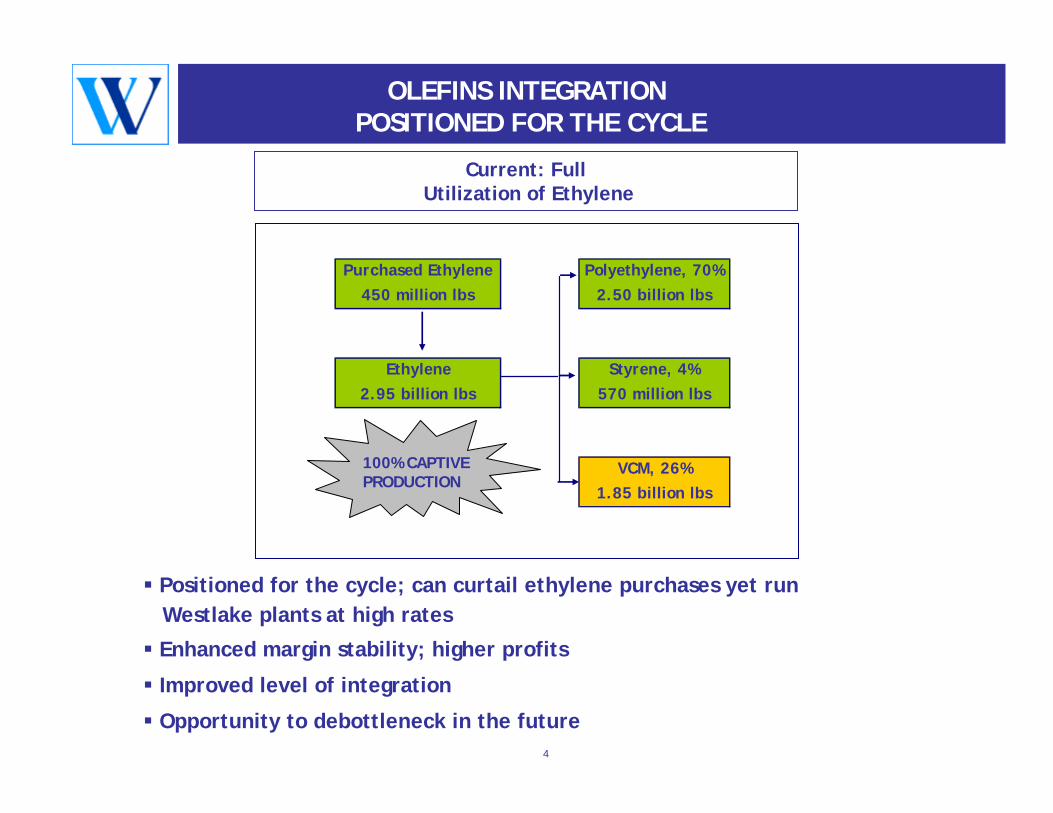
OLEFINS INTEGRATIONPOSITIONED FOR THE CYCLE
Current: FullUtilization of Ethylene
Positioned for the cycle; can curtail ethylene purchases yet runWestlake plants at high rates
Enhanced margin stability; higher profits
Improved level of integration
Opportunity to debottleneck in the future
Purchased Ethylene Polyethylene, 70%450 million lbs 2.50 billion lbs
Ethylene Styrene, 4%2.95 billion lbs 570 million lbs
VCM, 26%1.85 billion lbs
100% CAPTIVE 100% CAPTIVE PRODUCTIONPRODUCTION
5
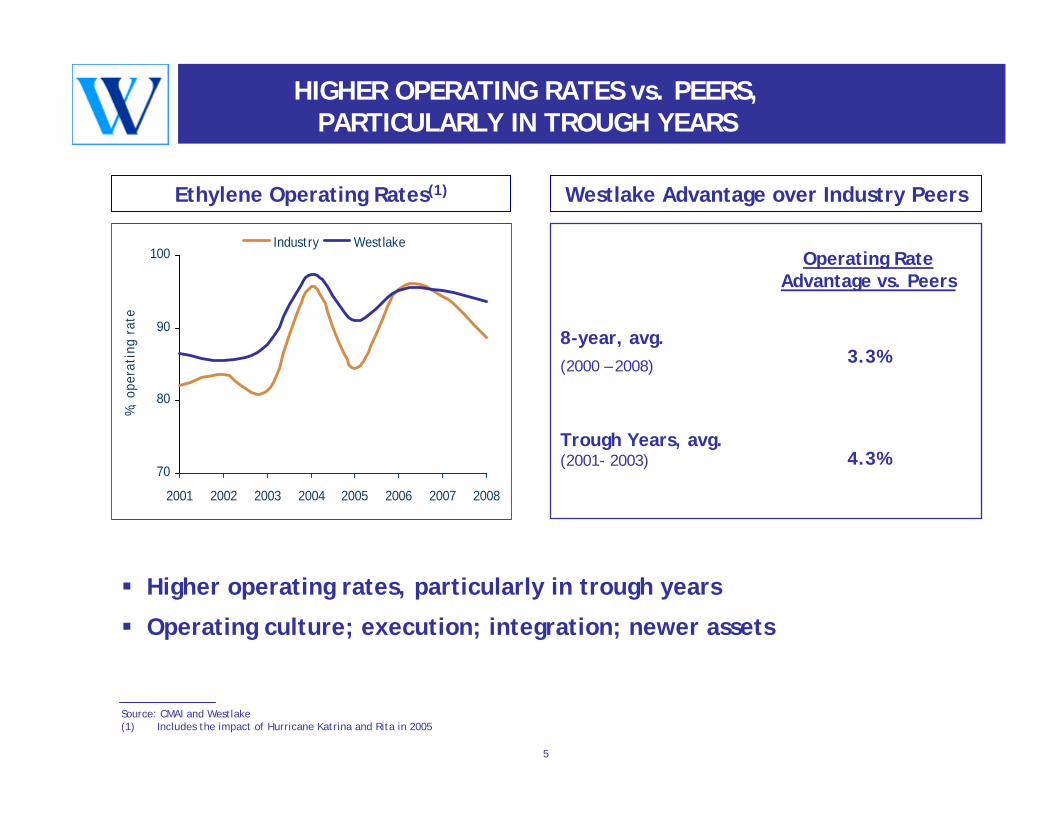
HIGHER OPERATING RATES vs. PEERS, PARTICULARLY IN TROUGH YEARS
Ethylene Operating Rates(1) Westlake Advantage over Industry Peers
Higher operating rates, particularly in trough years
Operating culture; execution; integration; newer assets
70
80
90
100
2001 2002 2003 2004 2005 2006 2007 2008
%,
oper
atin
g ra
te
Industry Westlake
4.3%Trough Years, avg.(2001- 2003)
3.3%8-year, avg.(2000 – 2008)
Operating Rate Advantage vs. Peers
Source: CMAI and Westlake(1) Includes the impact of Hurricane Katrina and Rita in 2005
6
0
4
8
12
16
20
1990
1992
1994
1996
1998
2000
2002
2004
2006
2008
2010
E
2012
E
Cen
ts /
lb
Naptha Cash Margin Ethane Cash Margin
6
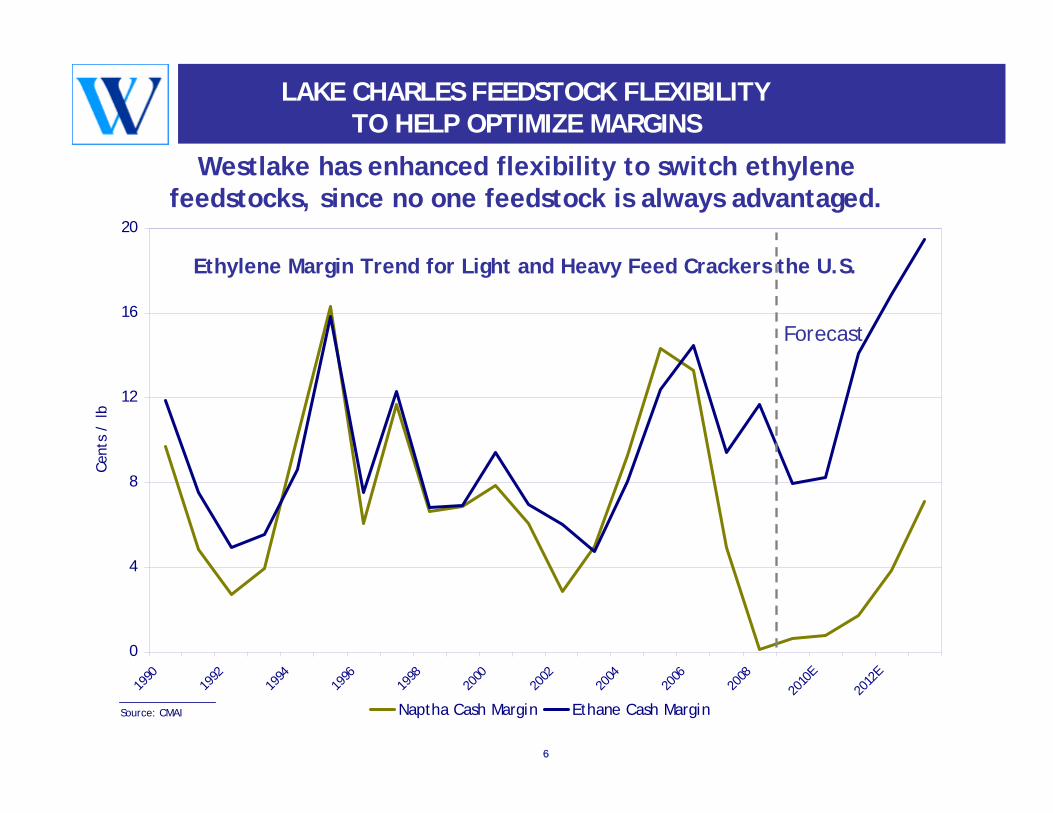
LAKE CHARLES FEEDSTOCK FLEXIBILITY TO HELP OPTIMIZE MARGINS
Westlake has enhanced flexibility to switch ethylene feedstocks, since no one feedstock is always advantaged.
Source: CMAI
Forecast
Ethylene Margin Trend for Light and Heavy Feed Crackers the U.S.
77
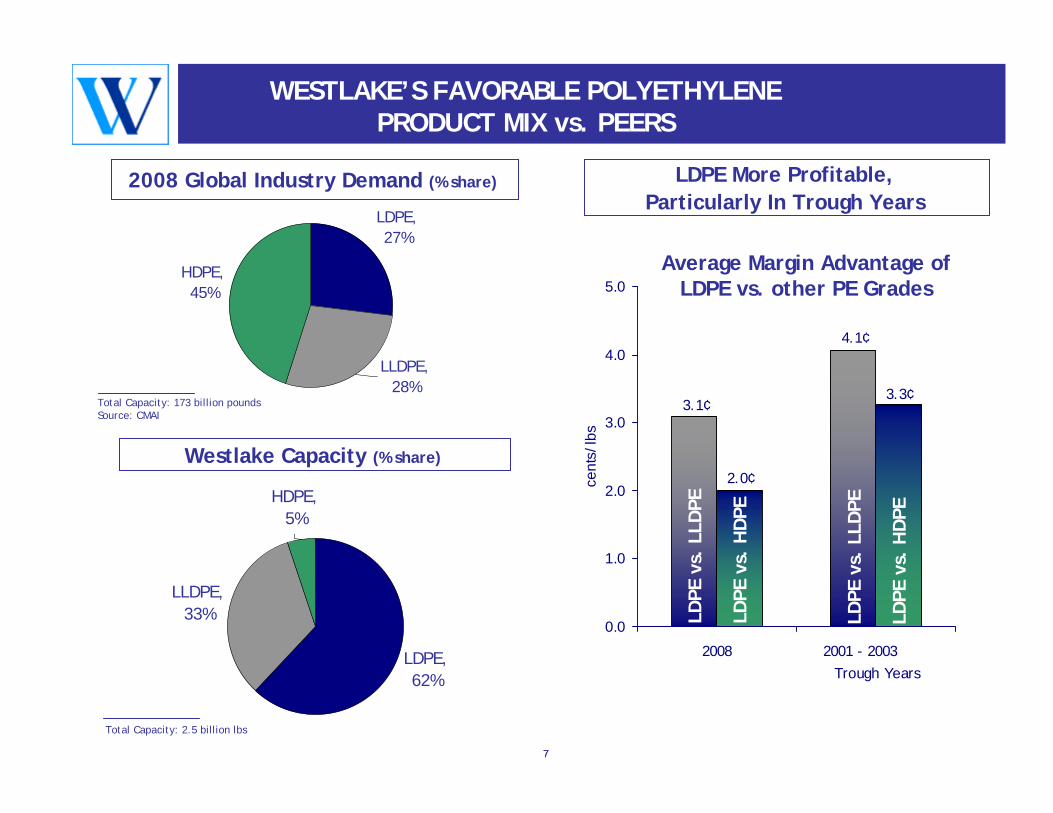
4.1¢
3.1¢3.3¢
2.0¢
0.0
1.0
2.0
3.0
4.0
5.0
2008 2001 - 2003 Trough Years
cent
s/ lb
s
LDPE More Profitable, Particularly In Trough Years
Befo
re
LLDPE, 28%
LDPE, 27%
HDPE, 45%
Total Capacity: 173 billion poundsSource: CMAI
2008 Global Industry Demand (% share)
Westlake Capacity (% share)
LLDPE, 33%
HDPE, 5%
LDPE, 62%
Total Capacity: 2.5 billion lbs
Average Margin Advantage of LDPE vs. other PE Grades
WESTLAKE’S FAVORABLE POLYETHYLENE PRODUCT MIX vs. PEERS
LDPE
vs.
LLD
PE
LDPE
vs.
HD
PE
LDPE
vs.
HD
PE
LDPE
vs.
LLD
PE
88
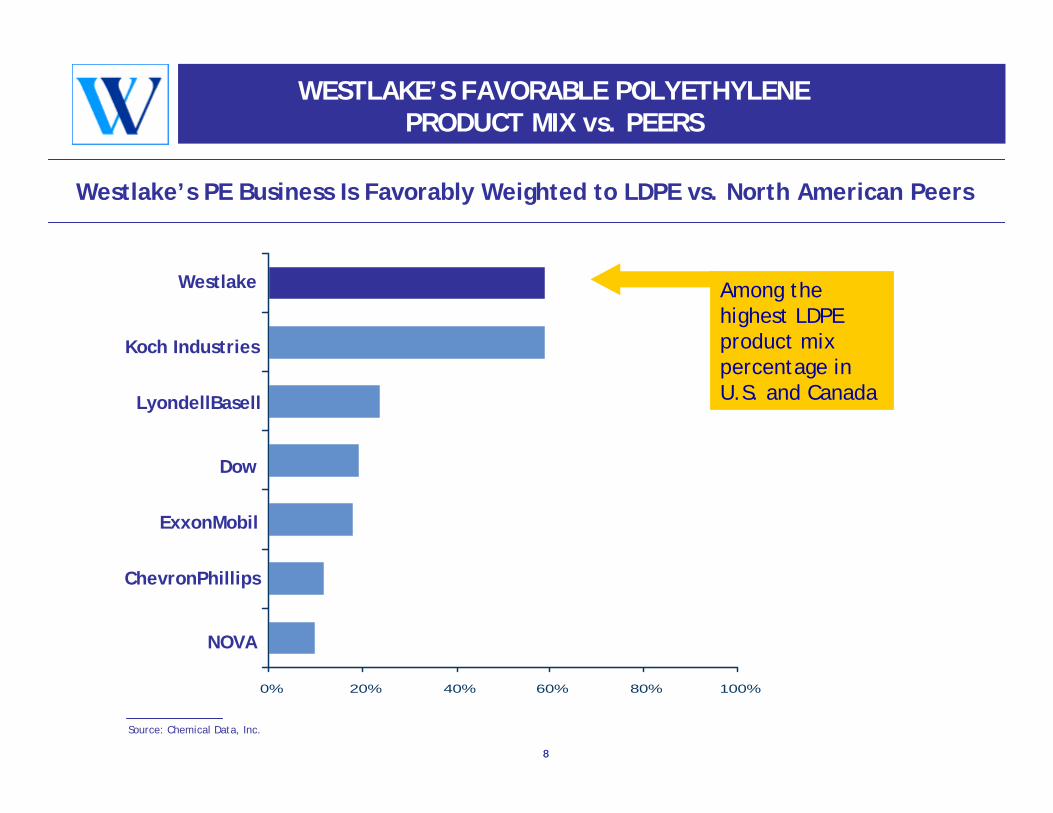
WESTLAKE’S FAVORABLE POLYETHYLENE PRODUCT MIX vs. PEERS
Westlake’s PE Business Is Favorably Weighted to LDPE vs. North American Peers
0% 20% 40% 60% 80% 100%
Among the highest LDPE product mix percentage in U.S. and Canada
Westlake
Koch Industries
LyondellBasell
Dow
ExxonMobil
ChevronPhillips
NOVA
Source: Chemical Data, Inc.
9
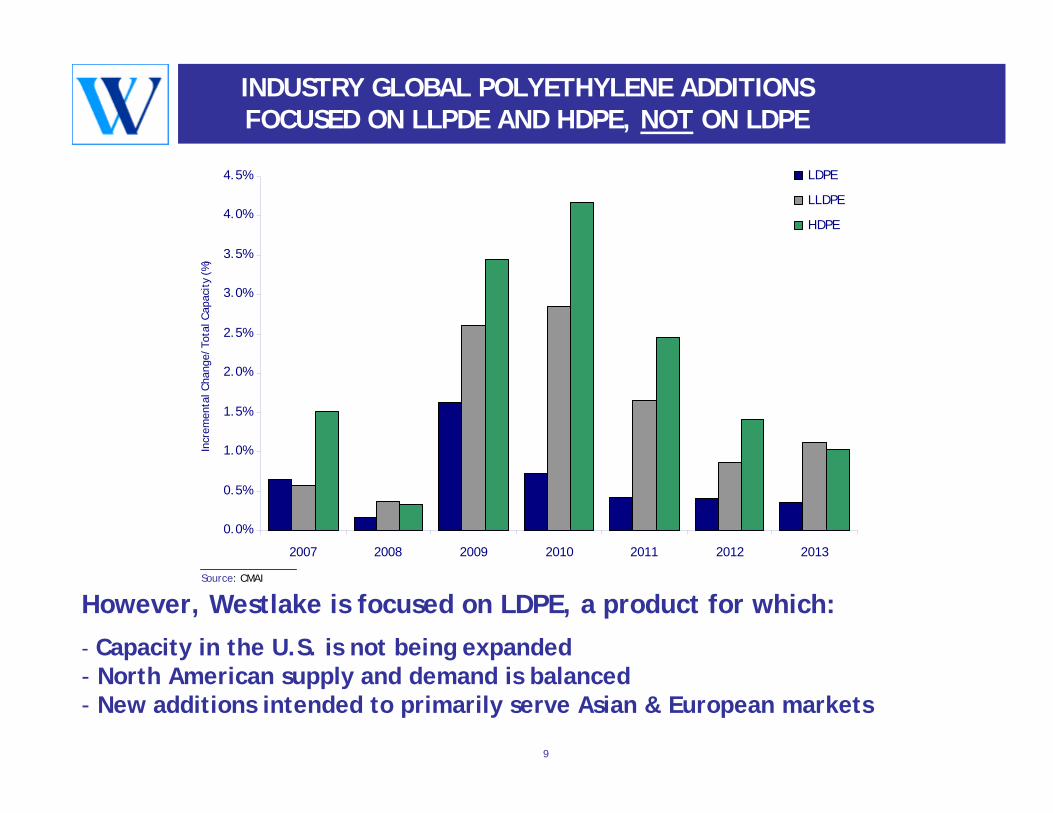
INDUSTRY GLOBAL POLYETHYLENE ADDITIONS FOCUSED ON LLPDE AND HDPE, NOT ON LDPE
However, Westlake is focused on LDPE, a product for which:
- Capacity in the U.S. is not being expanded- North American supply and demand is balanced- New additions intended to primarily serve Asian & European markets
Source: CMAI
0.0%
0.5%
1.0%
1.5%
2.0%
2.5%
3.0%
3.5%
4.0%
4.5%
2007 2008 2009 2010 2011 2012 2013
Incr
emen
tal C
hang
e/To
tal C
apac
ity
(%)
LDPE
LLDPE
HDPE
10
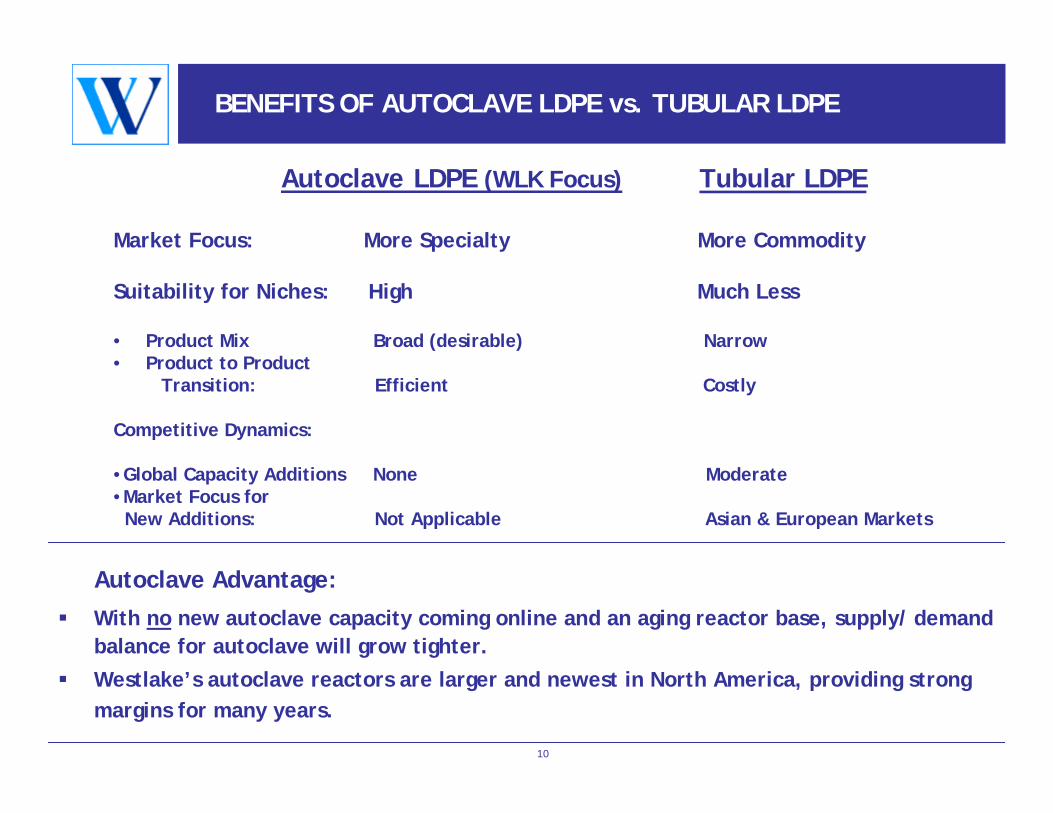
BENEFITS OF AUTOCLAVE LDPE vs. TUBULAR LDPE
Autoclave Advantage:
With no new autoclave capacity coming online and an aging reactor base, supply/ demand balance for autoclave will grow tighter.Westlake’s autoclave reactors are larger and newest in North America, providing strong margins for many years.
Autoclave LDPE (WLK Focus) Tubular LDPE
Market Focus: More Specialty More Commodity
Suitability for Niches: High Much Less
• Product Mix Broad (desirable) Narrow• Product to Product
Transition: Efficient Costly
Competitive Dynamics:
•Global Capacity Additions None Moderate•Market Focus for
New Additions: Not Applicable Asian & European Markets
1111
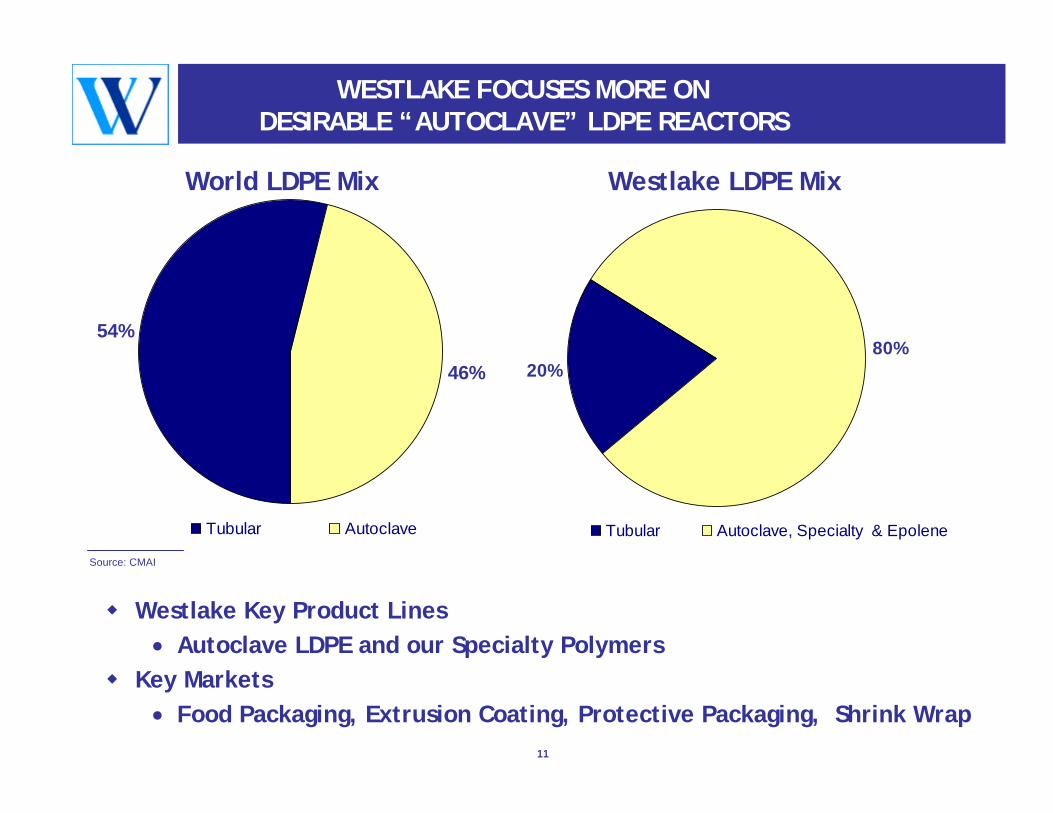
WESTLAKE FOCUSES MORE ON DESIRABLE “AUTOCLAVE” LDPE REACTORS
20%80%
Tubular Autoclave, Specialty & Epolene
Westlake Key Product Lines• Autoclave LDPE and our Specialty Polymers
Key Markets• Food Packaging, Extrusion Coating, Protective Packaging, Shrink Wrap
Westlake LDPE Mix
54%
46%
Tubular Autoclave
World LDPE Mix
Source: CMAI
12
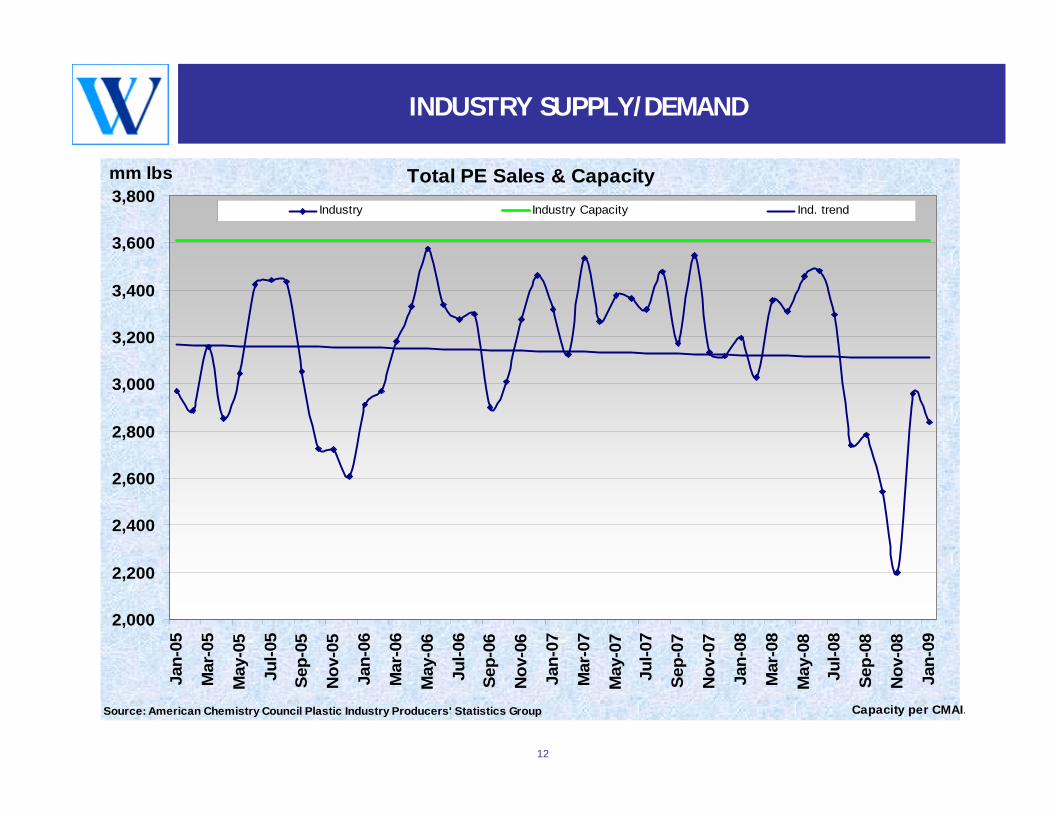
INDUSTRY SUPPLY/DEMAND
Total PE Sales & Capacity
2,000
2,200
2,400
2,600
2,800
3,000
3,200
3,400
3,600
3,800Ja
n-05
Mar
-05
May
-05
Jul-0
5
Sep-
05
Nov
-05
Jan-
06
Mar
-06
May
-06
Jul-0
6
Sep-
06
Nov
-06
Jan-
07
Mar
-07
May
-07
Jul-0
7
Sep-
07
Nov
-07
Jan-
08
Mar
-08
May
-08
Jul-0
8
Sep-
08
Nov
-08
Jan-
09
mm lbs
Industry Industry Capacity Ind. trend
Capacity per CMAI.Source: American Chemistry Council Plastic Industry Producers' Statistics Group
13
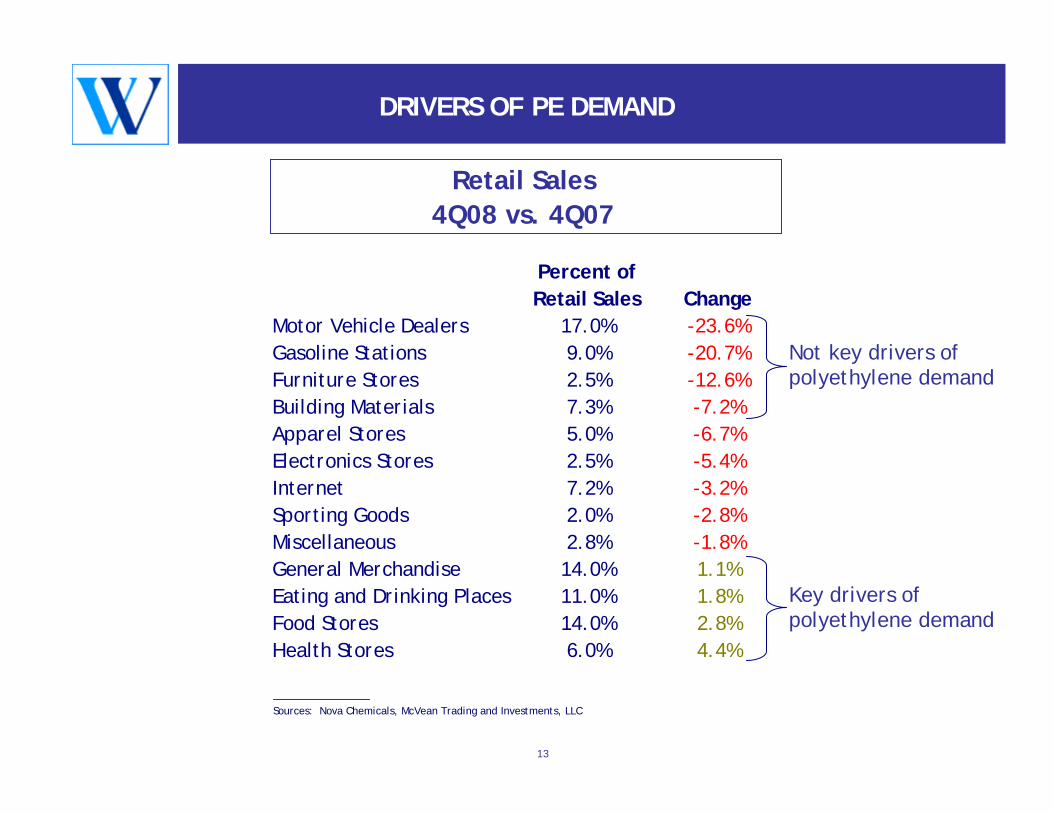
DRIVERS OF PE DEMAND
Retail Sales 4Q08 vs. 4Q07
Percent of Retail Sales Change
Motor Vehicle Dealers 17.0% -23.6%Gasoline Stations 9.0% -20.7%Furniture Stores 2.5% -12.6%Building Materials 7.3% -7.2%Apparel Stores 5.0% -6.7%Electronics Stores 2.5% -5.4%Internet 7.2% -3.2%Sporting Goods 2.0% -2.8%Miscellaneous 2.8% -1.8%General Merchandise 14.0% 1.1%Eating and Drinking Places 11.0% 1.8%Food Stores 14.0% 2.8%Health Stores 6.0% 4.4%
Not key drivers of polyethylene demand
Key drivers of polyethylene demand
Sources: Nova Chemicals, McVean Trading and Investments, LLC
14
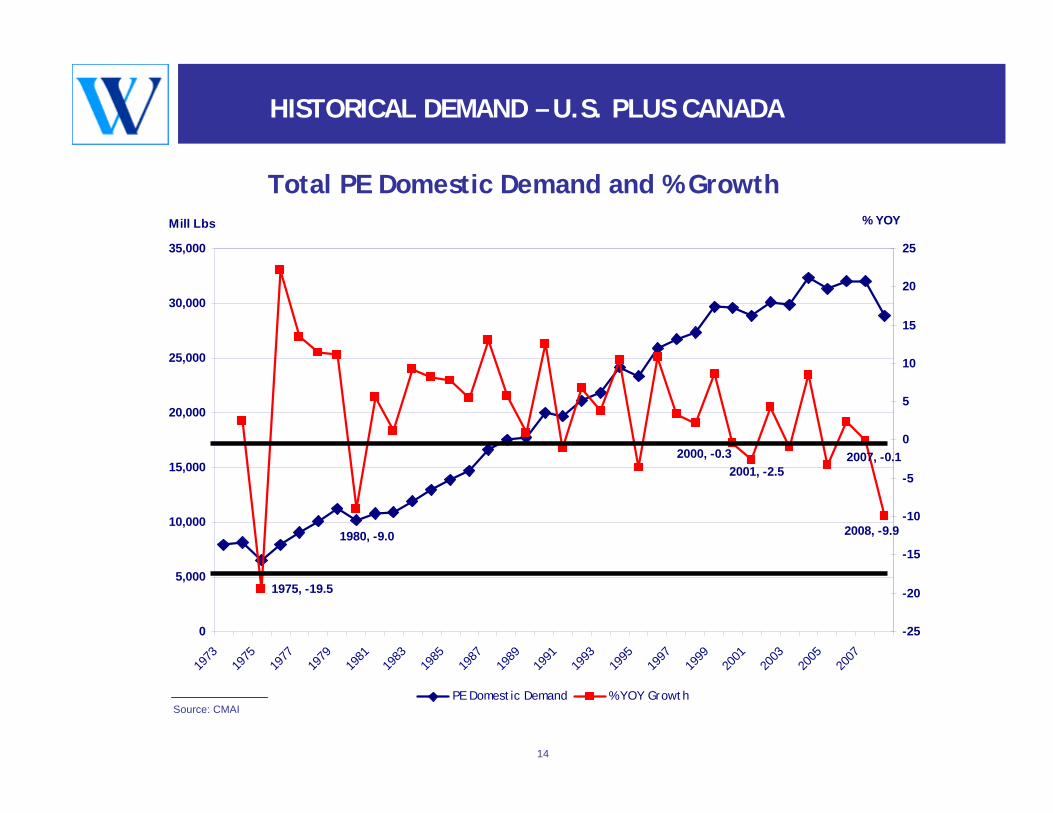
HISTORICAL DEMAND – U.S. PLUS CANADA
2007, -0.1
2008, -9.91980, -9.0
2000, -0.32001, -2.5
1975, -19.5
0
5,000
10,000
15,000
20,000
25,000
30,000
35,000
1973
1975
1977
1979
1981
1983
1985
1987
1989
1991
1993
1995
1997
1999
2001
2003
2005
2007
Mill Lbs
-25
-20
-15
-10
-5
0
5
10
15
20
25
% YOY
PE Domestic Demand % YOY GrowthSource: CMAI
Total PE Domestic Demand and % Growth
15
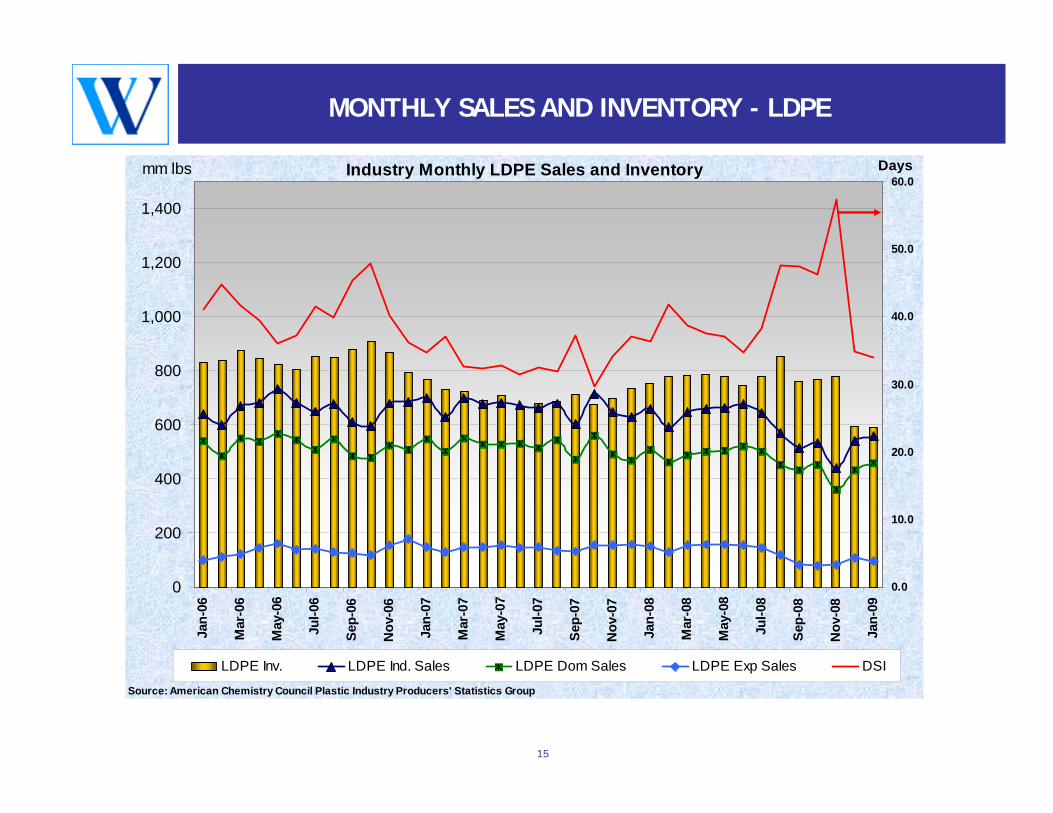
MONTHLY SALES AND INVENTORY - LDPE
Industry Monthly LDPE Sales and Inventory
0
200
400
600
800
1,000
1,200
1,400Ja
n-06
Mar
-06
May
-06
Jul-0
6
Sep-
06
Nov
-06
Jan-
07
Mar
-07
May
-07
Jul-0
7
Sep-
07
Nov
-07
Jan-
08
Mar
-08
May
-08
Jul-0
8
Sep-
08
Nov
-08
Jan-
09
mm lbs
0.0
10.0
20.0
30.0
40.0
50.0
60.0
LDPE Inv. LDPE Ind. Sales LDPE Dom Sales LDPE Exp Sales DSI
Source: American Chemistry Council Plastic Industry Producers' Statistics Group
Days
16
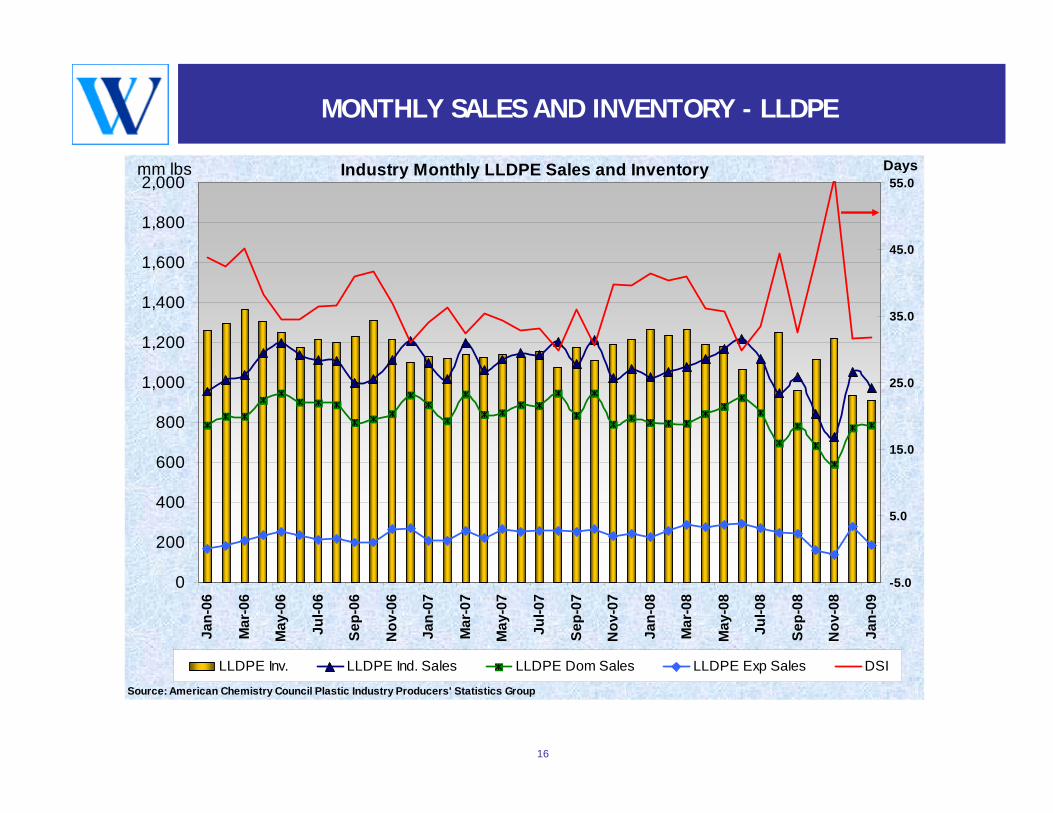
MONTHLY SALES AND INVENTORY - LLDPE
Industry Monthly LLDPE Sales and Inventory
0
200
400
600
800
1,000
1,200
1,400
1,600
1,800
2,000Ja
n-06
Mar
-06
May
-06
Jul-0
6
Sep-
06
Nov
-06
Jan-
07
Mar
-07
May
-07
Jul-0
7
Sep-
07
Nov
-07
Jan-
08
Mar
-08
May
-08
Jul-0
8
Sep-
08
Nov
-08
Jan-
09
mm lbs
-5.0
5.0
15.0
25.0
35.0
45.0
55.0
LLDPE Inv. LLDPE Ind. Sales LLDPE Dom Sales LLDPE Exp Sales DSI
Source: American Chemistry Council Plastic Industry Producers' Statistics Group
Days
17
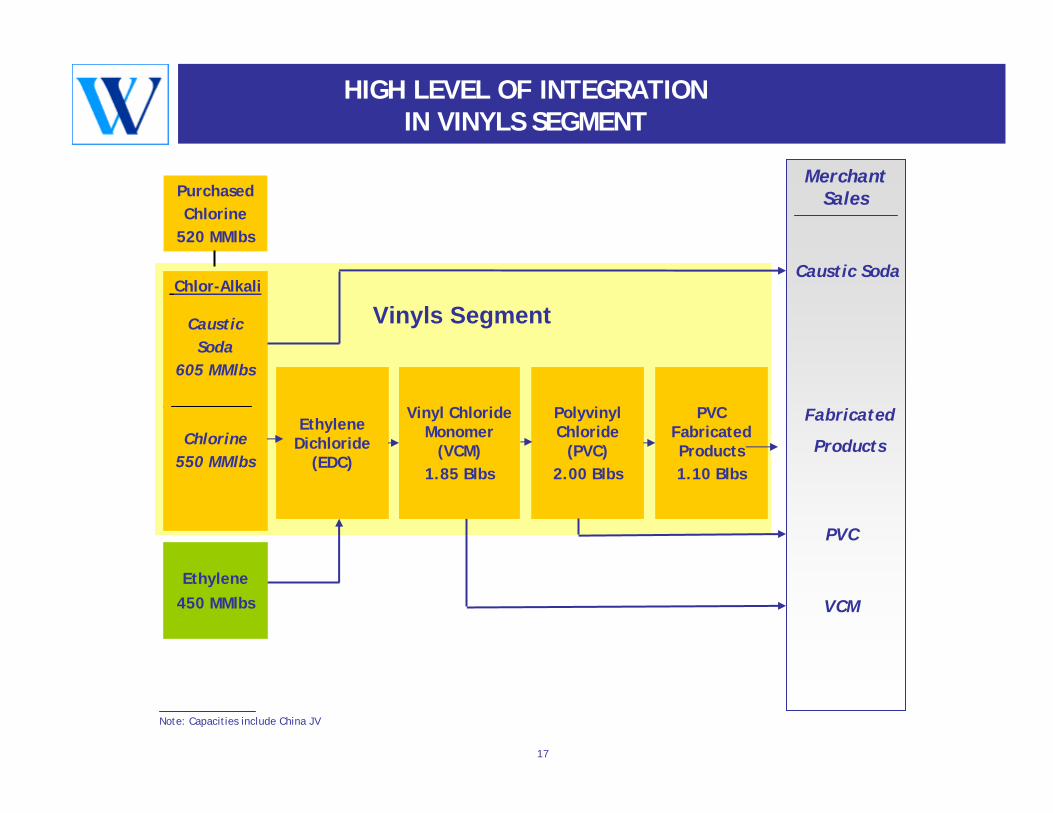
HIGH LEVEL OF INTEGRATION IN VINYLS SEGMENT
Polyvinyl Chloride
(PVC)2.00 Blbs
Caustic Soda
Fabricated
Products
PVC
VCM
PVC Fabricated Products1.10 Blbs
Vinyl Chloride Monomer
(VCM)1.85 Blbs
Ethylene Dichloride
(EDC)
CausticSoda
605 MMlbs
Chlorine550 MMlbs
Ethylene450 MMlbs
Vinyls Segment
PurchasedChlorine
520 MMlbs
Merchant Sales
Chlor-Alkali
Note: Capacities include China JV
18
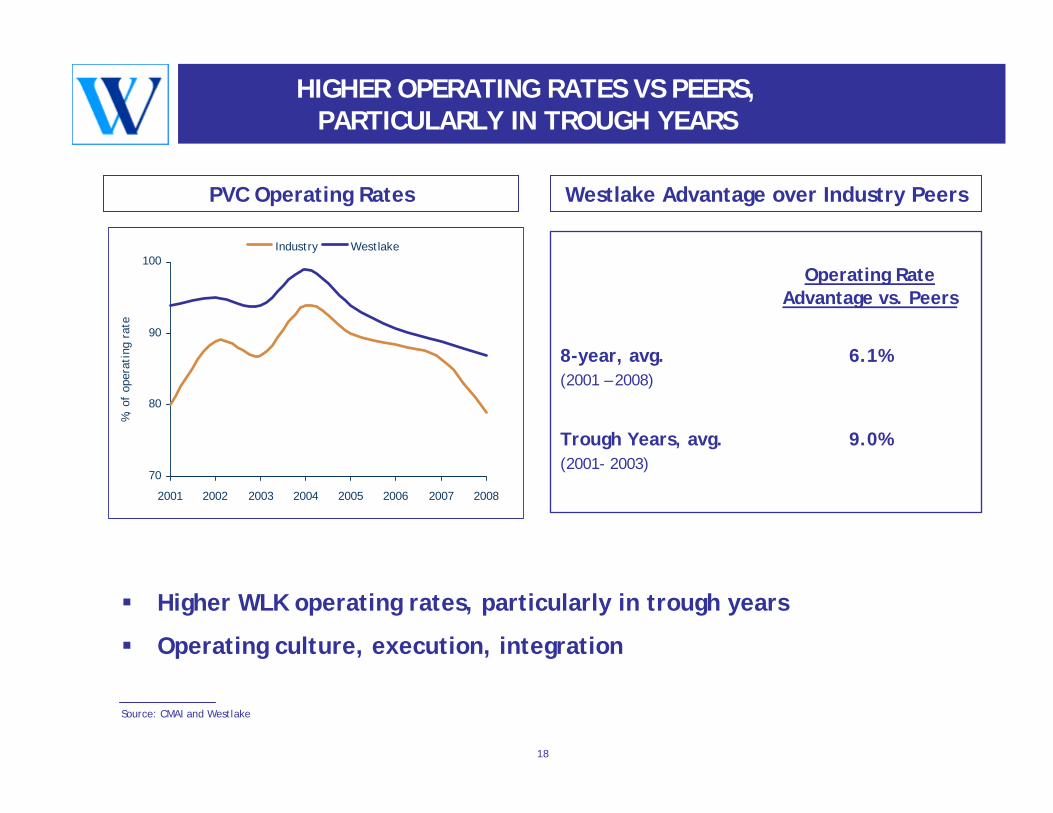
HIGHER OPERATING RATES VS PEERS, PARTICULARLY IN TROUGH YEARS
70
80
90
100
2001 2002 2003 2004 2005 2006 2007 2008
%,
of o
pera
ting
rat
e
Industry Westlake
Higher WLK operating rates, particularly in trough years
Operating culture, execution, integration
Westlake Advantage over Industry Peers
9.0%Trough Years, avg.(2001- 2003)
6.1%8-year, avg.(2001 – 2008)
Operating RateAdvantage vs. Peers
PVC Operating Rates
Source: CMAI and Westlake
19
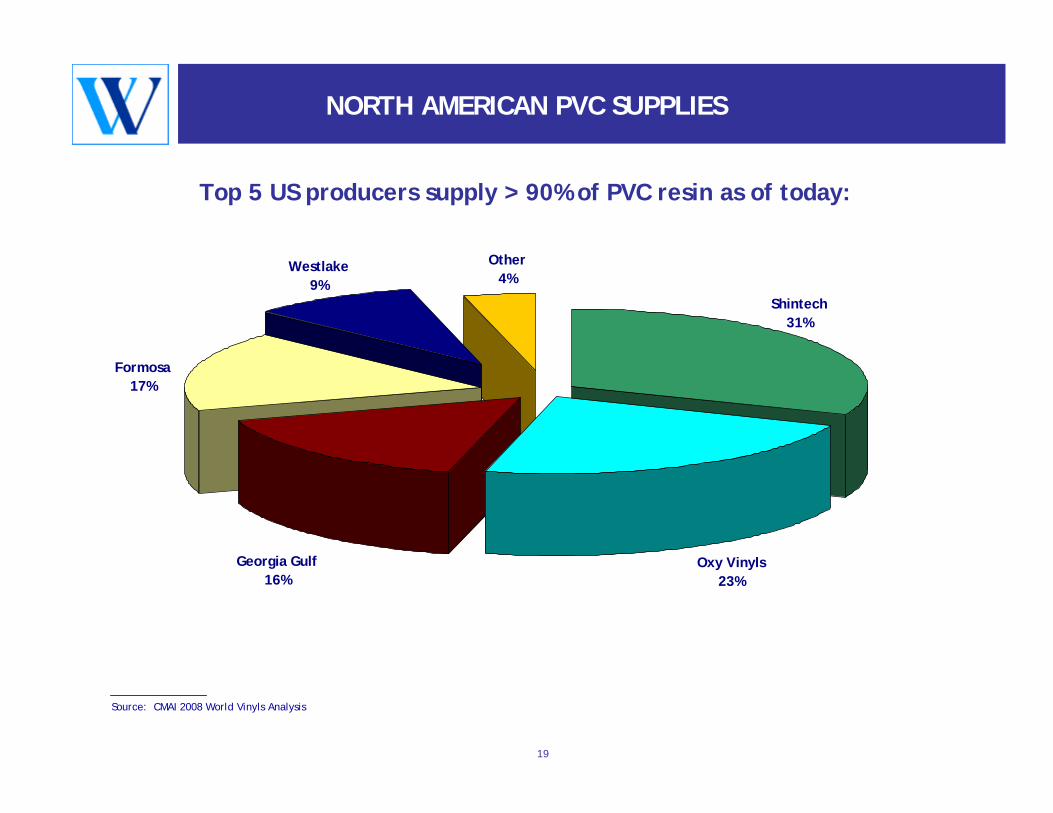
NORTH AMERICAN PVC SUPPLIES
Top 5 US producers supply > 90% of PVC resin as of today:
Source: CMAI 2008 World Vinyls Analysis
Oxy Vinyls23%
Other4%
Georgia Gulf16%
Formosa17%
Westlake9%
Shintech31%
20
THOUGHTS ON PVC
Many expect late 2008 demand levels to continue
Expect a few bright spotsRising global demand for clean water Infrastructure projects play to Westlake’s strategy of large diameter PVC pipe
PVC demand levels continue to support caustic pricing
Both producers and converters continue to manage inventories due to risks in pricing swings
21
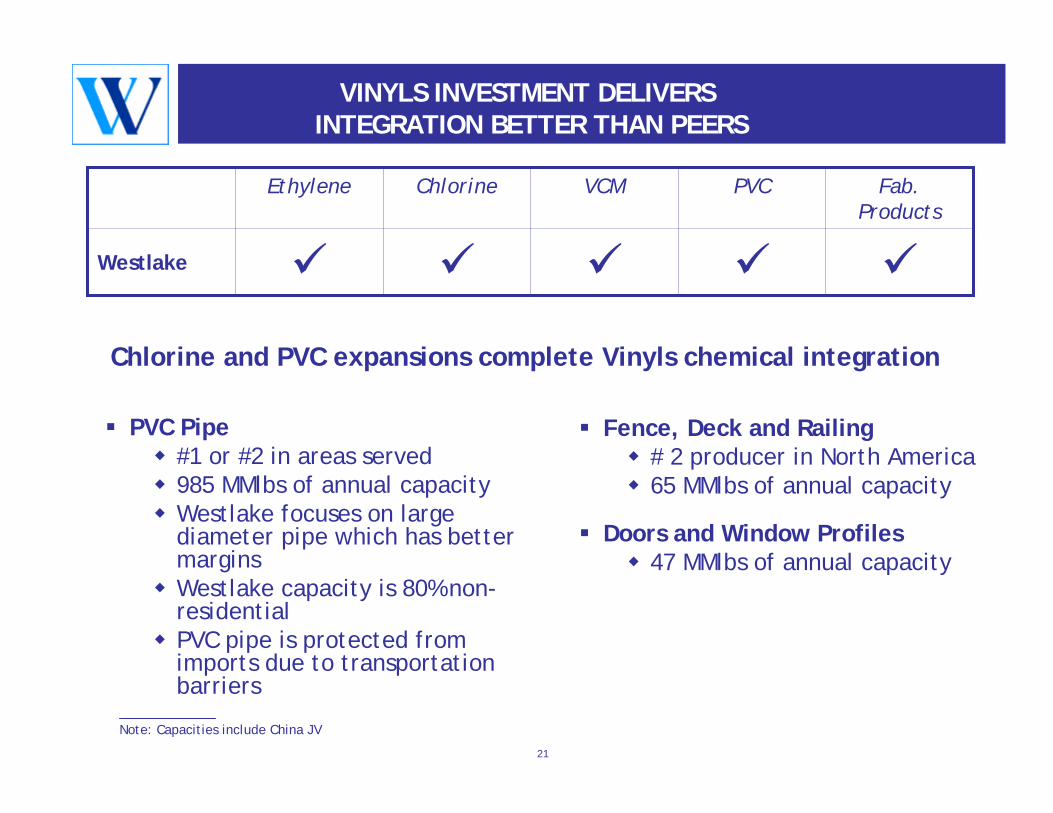
VINYLS INVESTMENT DELIVERSINTEGRATION BETTER THAN PEERS
Westlake
Fab. Products
PVCVCMChlorineEthylene
PVC Pipe#1 or #2 in areas served 985 MMlbs of annual capacityWestlake focuses on large diameter pipe which has better marginsWestlake capacity is 80% non-residentialPVC pipe is protected from imports due to transportation barriers
Fence, Deck and Railing # 2 producer in North America65 MMlbs of annual capacity
Doors and Window Profiles47 MMlbs of annual capacity
Chlorine and PVC expansions complete Vinyls chemical integration
Note: Capacities include China JV
22
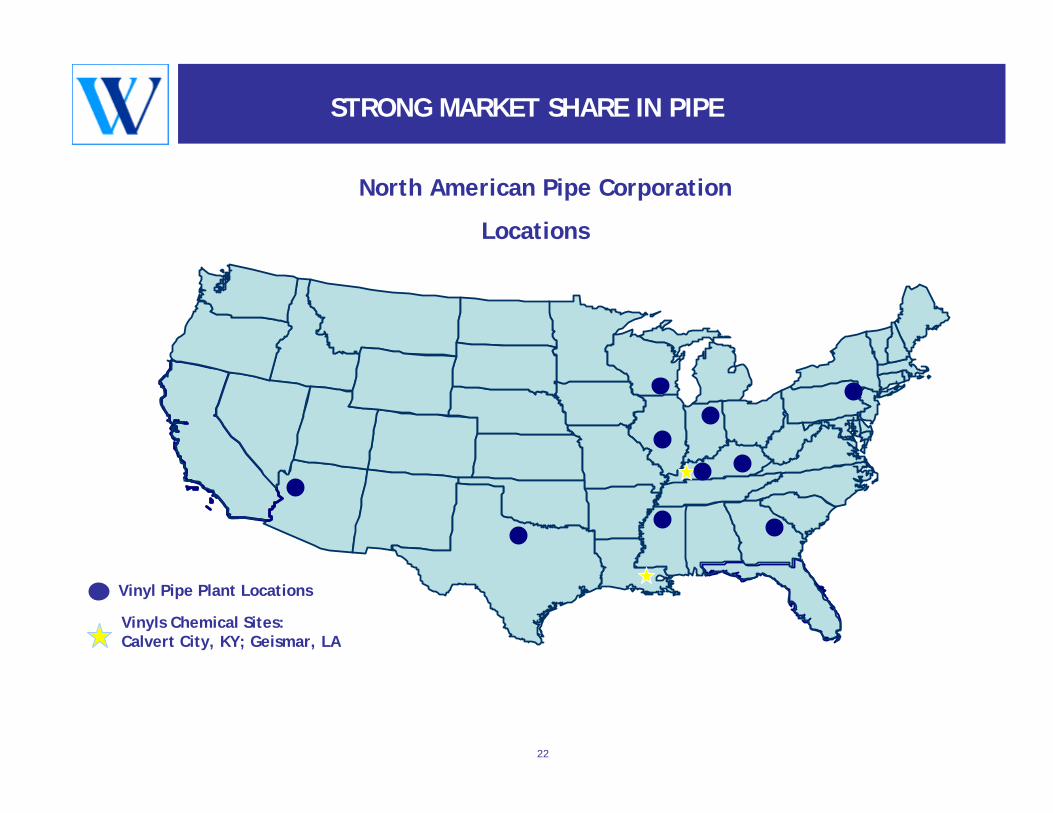
STRONG MARKET SHARE IN PIPE
North American Pipe Corporation
Locations
Vinyl Pipe Plant Locations
Vinyls Chemical Sites: Calvert City, KY; Geismar, LA
23
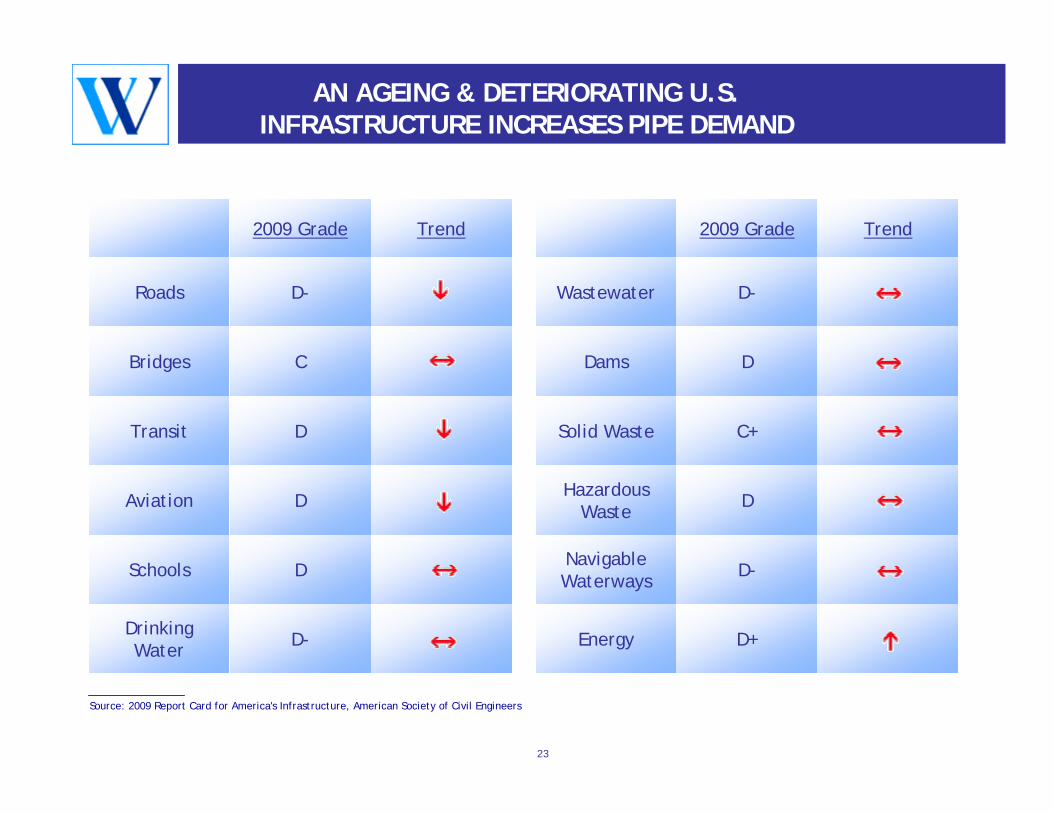
AN AGEING & DETERIORATING U.S. INFRASTRUCTURE INCREASES PIPE DEMAND
D-Drinking Water
DSchools
DAviation
DTransit
CBridges
D-Roads
Trend2009 Grade
D+Energy
D-Navigable Waterways
DHazardous Waste
C+Solid Waste
DDams
D-Wastewater
Trend2009 Grade
Source: 2009 Report Card for America's Infrastructure, American Society of Civil Engineers
24
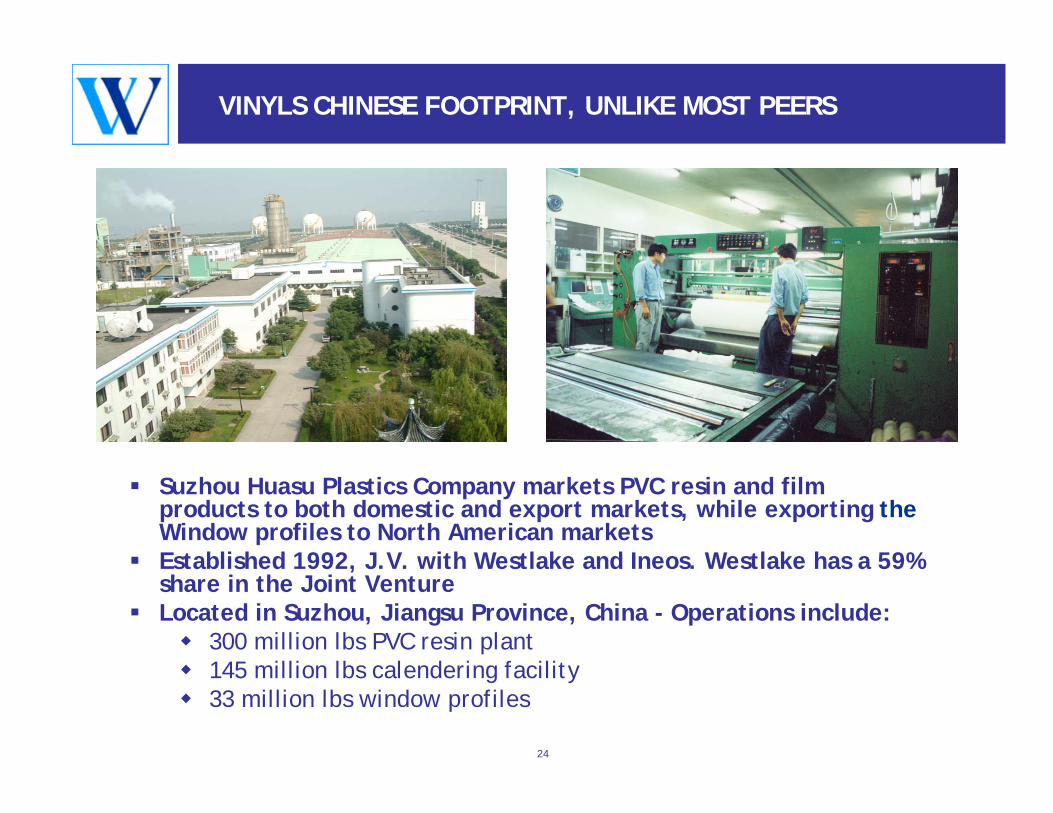
VINYLS CHINESE FOOTPRINT, UNLIKE MOST PEERS
Suzhou Huasu Plastics Company markets PVC resin and film products to both domestic and export markets, while exporting theWindow profiles to North American marketsEstablished 1992, J.V. with Westlake and Ineos. Westlake has a 59% share in the Joint Venture Located in Suzhou, Jiangsu Province, China - Operations include:
300 million lbs PVC resin plant145 million lbs calendering facility33 million lbs window profiles
25
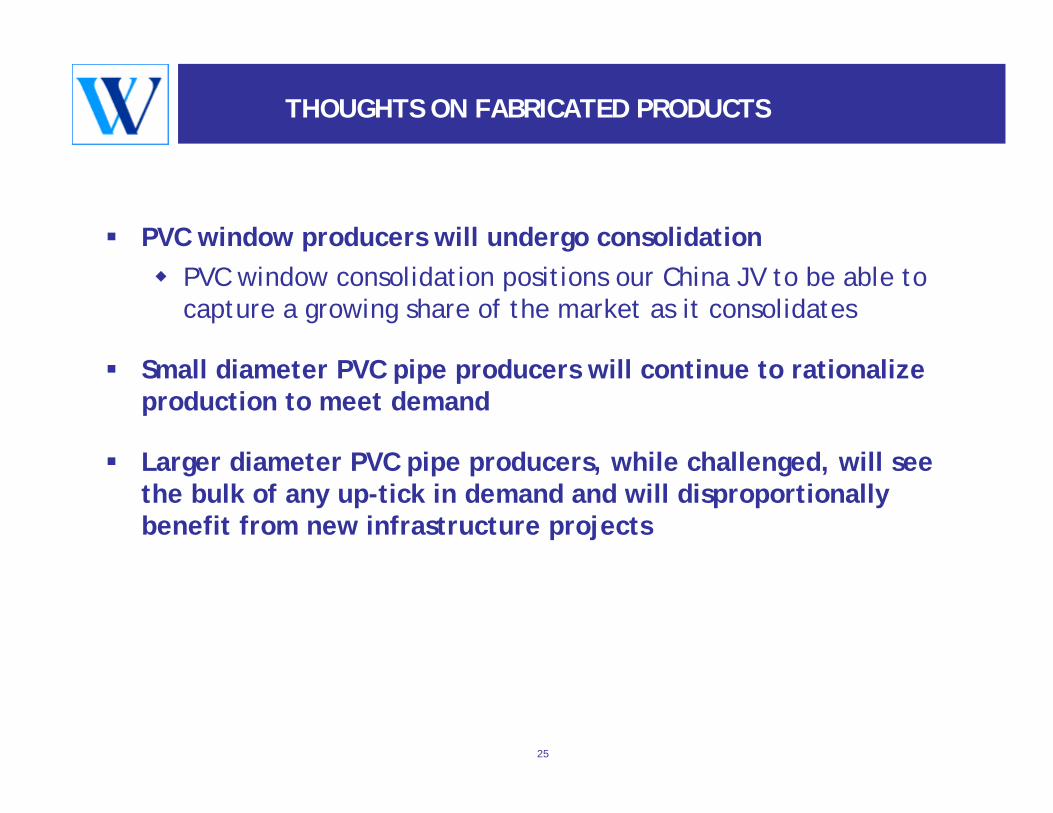
THOUGHTS ON FABRICATED PRODUCTS
PVC window producers will undergo consolidationPVC window consolidation positions our China JV to be able to capture a growing share of the market as it consolidates
Small diameter PVC pipe producers will continue to rationalize production to meet demand
Larger diameter PVC pipe producers, while challenged, will see the bulk of any up-tick in demand and will disproportionally benefit from new infrastructure projects
26
WESTLAKE STRENGTHS
Consistently Demonstrated Profitable Growth
Strategically located asset base
Vertical integration with high operating rate
Feedstock Flexibility
LDPE driven product mix in Olefins
Earnings leverage based on product diversification
Financial flexibility
28
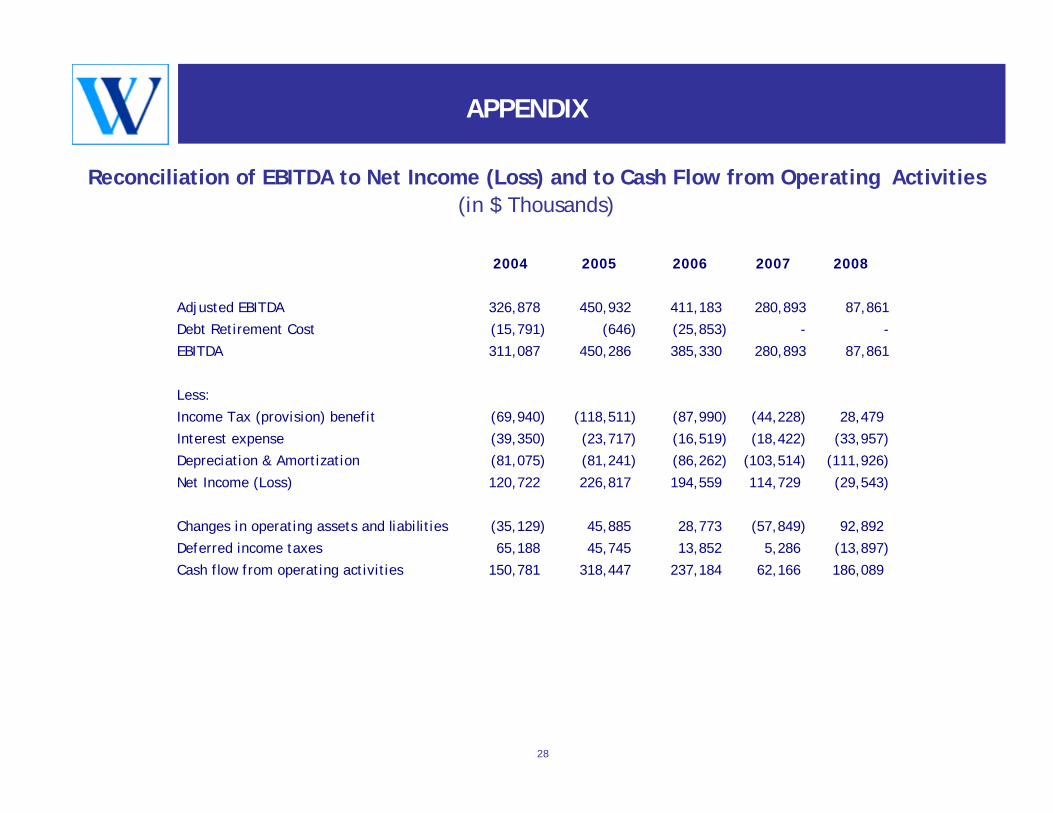
APPENDIX
2004 2005 2006 2007 2008
Adjusted EBITDA 326,878 450,932 411,183 280,893 87,861
Debt Retirement Cost (15,791) (646) (25,853) - -
EBITDA 311,087 450,286 385,330 280,893 87,861
Less:
Income Tax (provision) benefit (69,940) (118,511) (87,990) (44,228) 28,479
Interest expense (39,350) (23,717) (16,519) (18,422) (33,957)
Depreciation & Amortization (81,075) (81,241) (86,262) (103,514) (111,926)
Net Income (Loss) 120,722 226,817 194,559 114,729 (29,543)
Changes in operating assets and liabilities (35,129) 45,885 28,773 (57,849) 92,892
Deferred income taxes 65,188 45,745 13,852 5,286 (13,897)
Cash flow from operating activities 150,781 318,447 237,184 62,166 186,089
Reconciliation of EBITDA to Net Income (Loss) and to Cash Flow from Operating Activities (in $ Thousands)


