40
What does a Clinical Director look for in the Annual Registry Report ? D Eadington Hull Royal Infirmary June 2008 Conflict of Interest; no longer a Clinical Director
| Date post: | 26-Dec-2015 |
| Category: |
Documents |
| Upload: | angelina-joseph |
| View: | 215 times |
| Download: | 0 times |

What does a Clinical
Director look for in
the Annual Registry Report ?
D Eadington
Hull Royal Infirmary
June 2008 Conflict of Interest;
no longer a Clinical Director

The problem with the post-prandial talk ….
PRIMACY
RECENCY

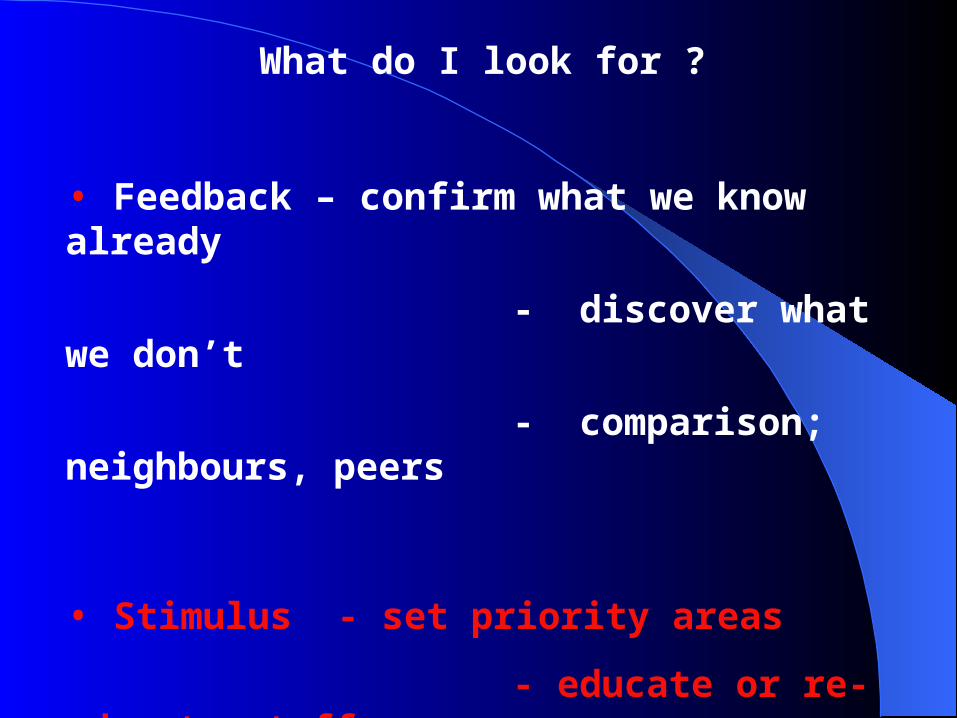
What do I look for ?
• Feedback – confirm what we know already
- discover what we don’t
- comparison; neighbours, peers
• Stimulus - set priority areas
- educate or re-educate staff
• Things that inform the commissioning process

• Who do we compare ourselves with ?
• What do I look at (or not) ?
• What does the data mean ?
• What else do we do with it ?
• What would I like more of ?

1st HULL
1. Luton
2. Windsor
3. Sunderland
19th Hull


• Population 1.04 million, ~3000 sq m
• 3 peripheral DGHs (~540k)
• Satellites; 1992 Brigg
• 1998 Scarborough
• 2002 Grimsby
• 2007 Scunthorpe (Brigg closed)
• 2008 Bridlington
• 2008 Fresenius partnership (first central unit)Consultant 7 (6 WTE)
[GIM 5/19 + 28 beds]
SpR 6 Renal
1 Acute Medicine
StRs 2
FY 1 + 2 3 + 1
Nurse Specialist 7
York 40 miles
Leeds 65 miles
Sheffield 65 miles
Middlesborough 80 miles

Who are our comparator units ?
• Colleagues; Leeds, Bradford, York
• Neighbours ; Sheffield, Middlesborough
• Peer hospitals; Preston, Newcastle
• “How are they doing that better than us ?”
What do I do with the report ?
• Some; look at quickly – less interest
• Some; look at longer - wonder what it means
• Rest; look at longest - compare with other units, discuss
- where is the widest range ?
• Reflection; What are we not doing well enough ?
- outcomes, data inputs
What is not there at all ?

What else do we do with the reports ?
• Service planning (less than in past)
• Training – junior staff
- nurses
- medical students
• Nursing governance – ‘every data point counts’
• Patients – dietitians, information posters

1. Look at quickly
• Demographics – are take on rates stabilising ?
- more palliation as part of LCC ?
• Items where new action is not a high priority
- Adequacy/URR
- Ferritin
• Not yet a strong evidence base to change practice
- Cholesterol
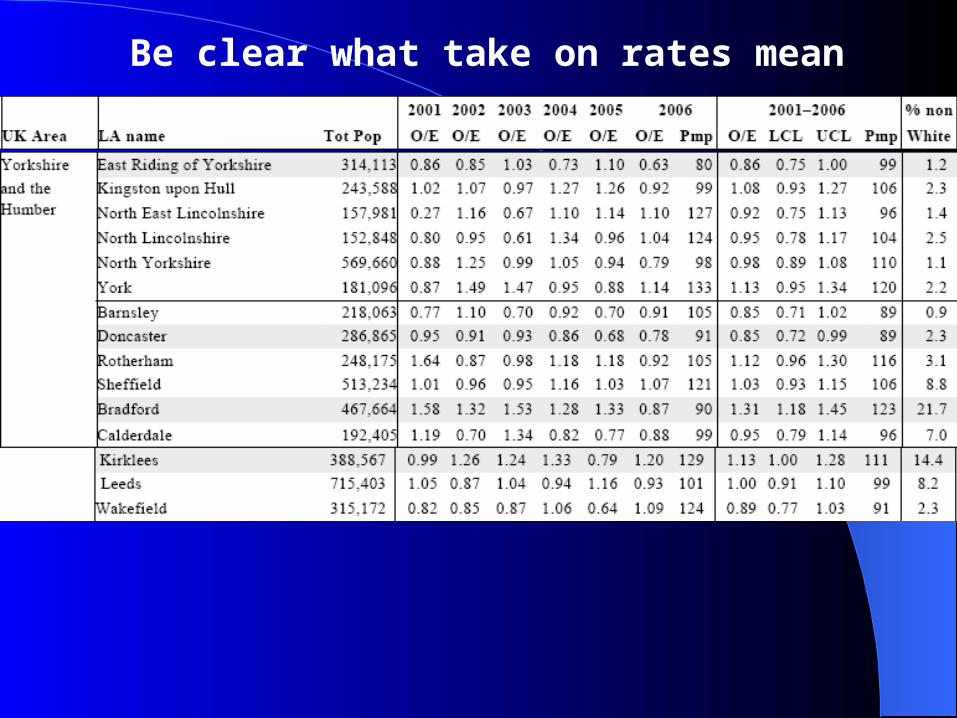
Be clear what take on rates mean

4.97 m
Hull 1.04m
York 0.39m
Sheffield 1.75m
Bradford 0.60m
Leeds 2.20m
All 5.98m
Be clear what take on rates mean
Which one
is right ?
1.62m
1.27m
0.47m
1.61m

2. Look at longer; what does it mean ?
• Anaemia
• PTH

Adequate

Is it any better ?
(CHOIR/CREATE)


3. Look at longest – comparisons matter
• Phosphate
• Blood pressure
• Survival
0102030405060708090
%
2001 2002 2003 2004 2005 2006 2007
Year
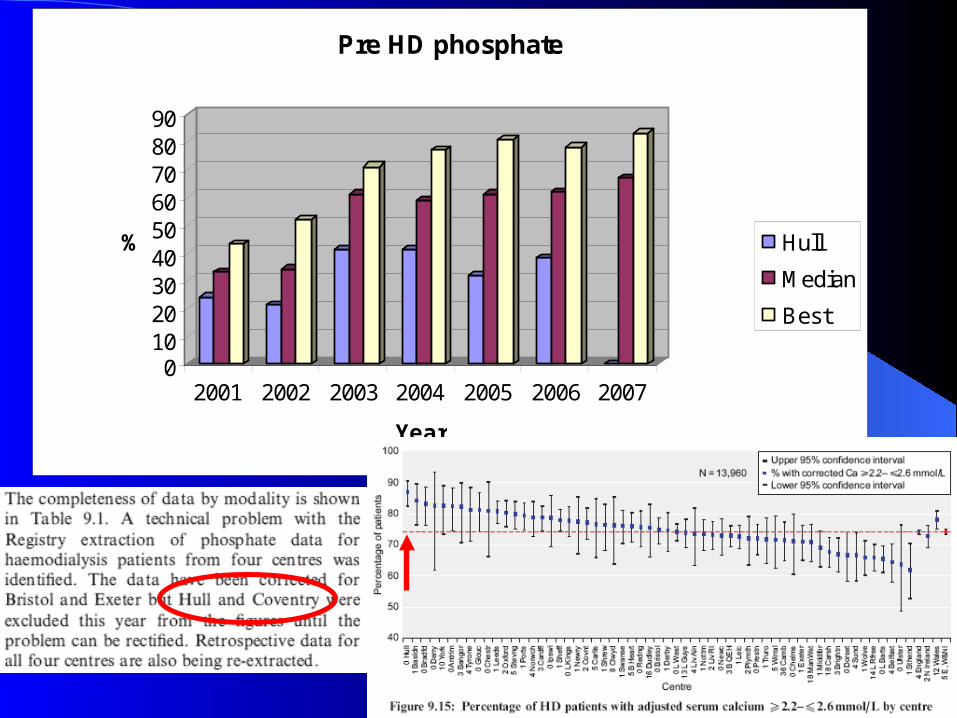
Pre HD phosphate
Hull
Median
Best

All HD phosphate
0
10
20
30
40
50
60
1.1-1.59 1.6-1.79 1.8-1.99 >1.99
Range
%
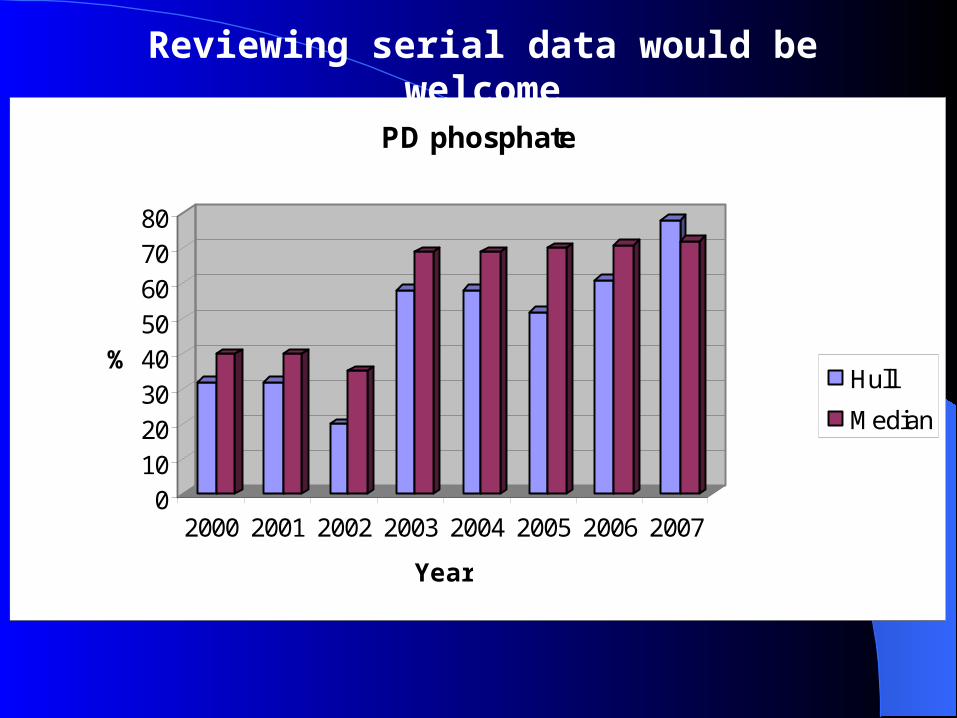
01020304050607080
%
2000 2001 2002 2003 2004 2005 2006 2007
Year
PD phosphate
Hull
Median
Reviewing serial data would be welcome

Blood pressure – a very wide range
Is data collection standardised ?
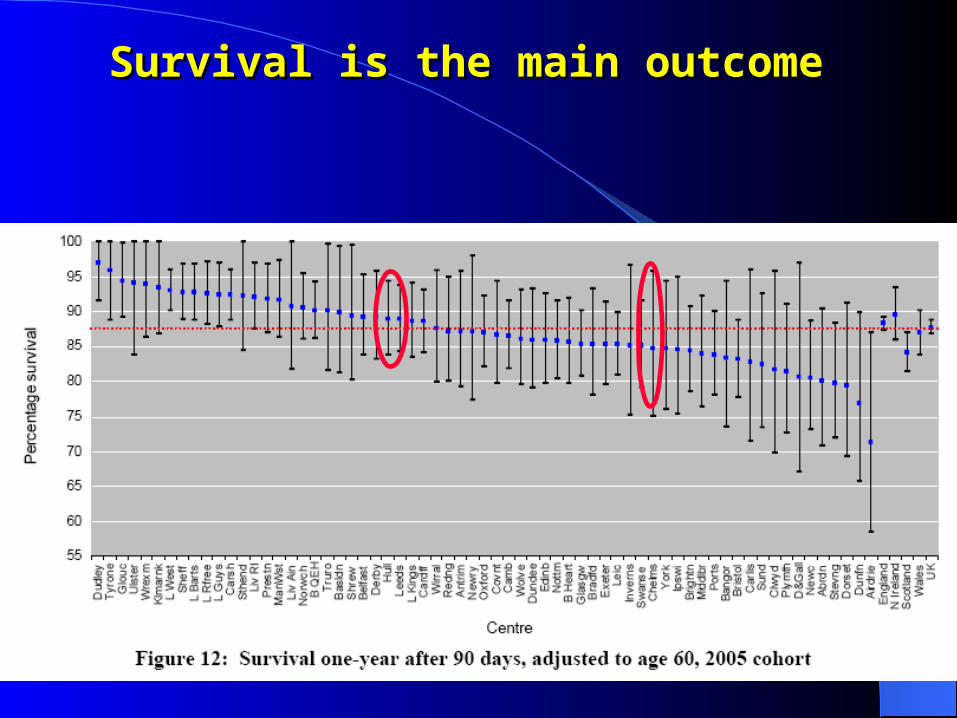
Survival is the main outcome Survival is the main outcome

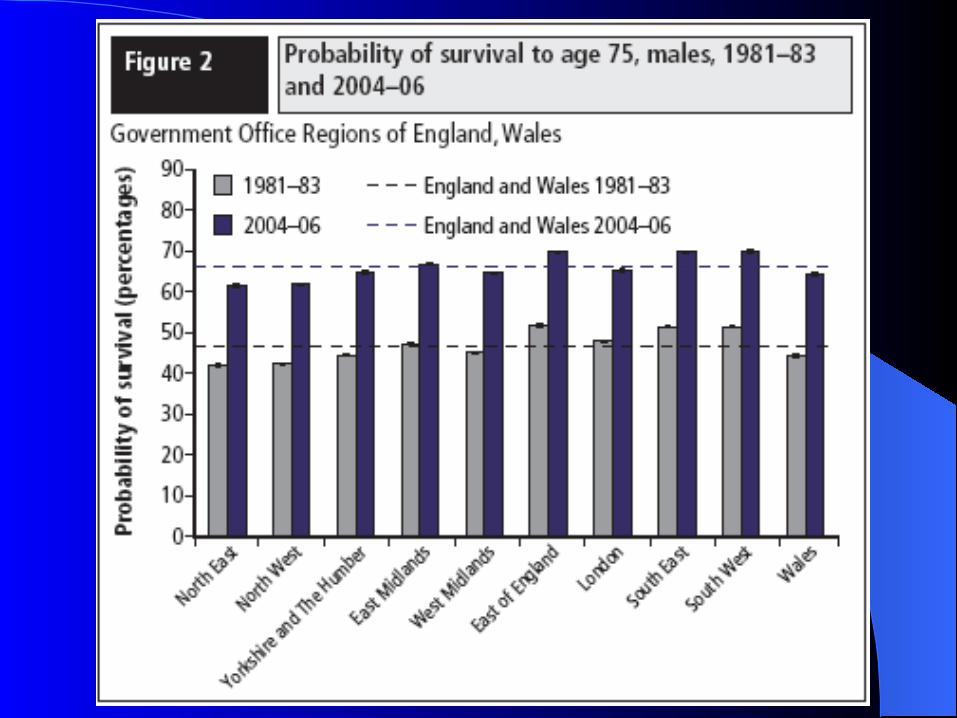
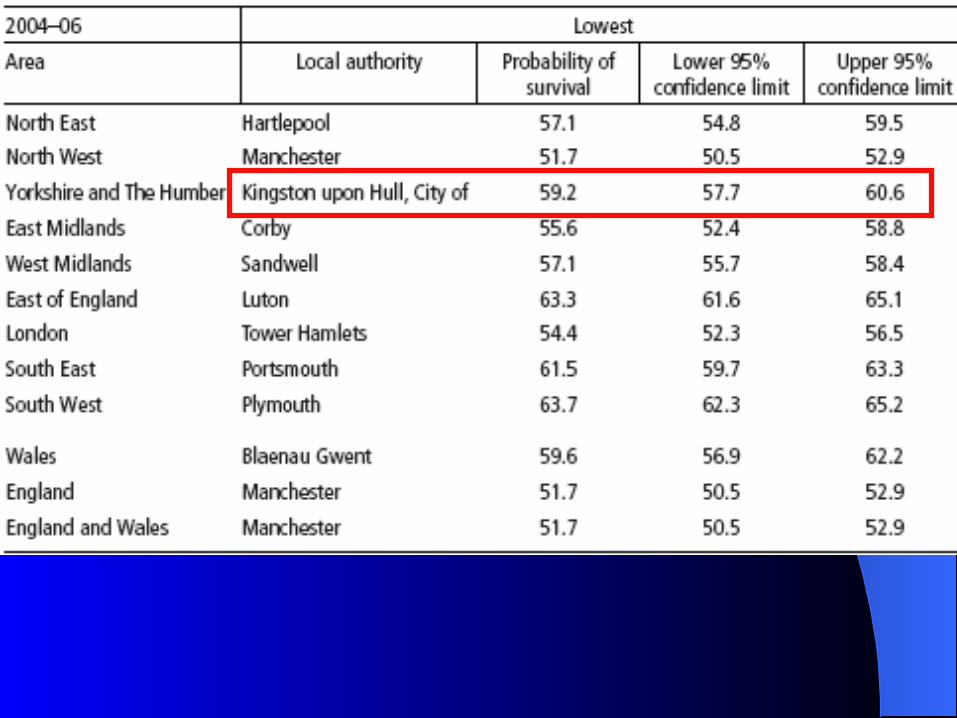


Does deprivation affect ESRD survival ?
61 ( 37% )
71 ( 44% )
45 ( 28% )
78 ( 48% )
0
100 ( 61% )
70 ( 43% )
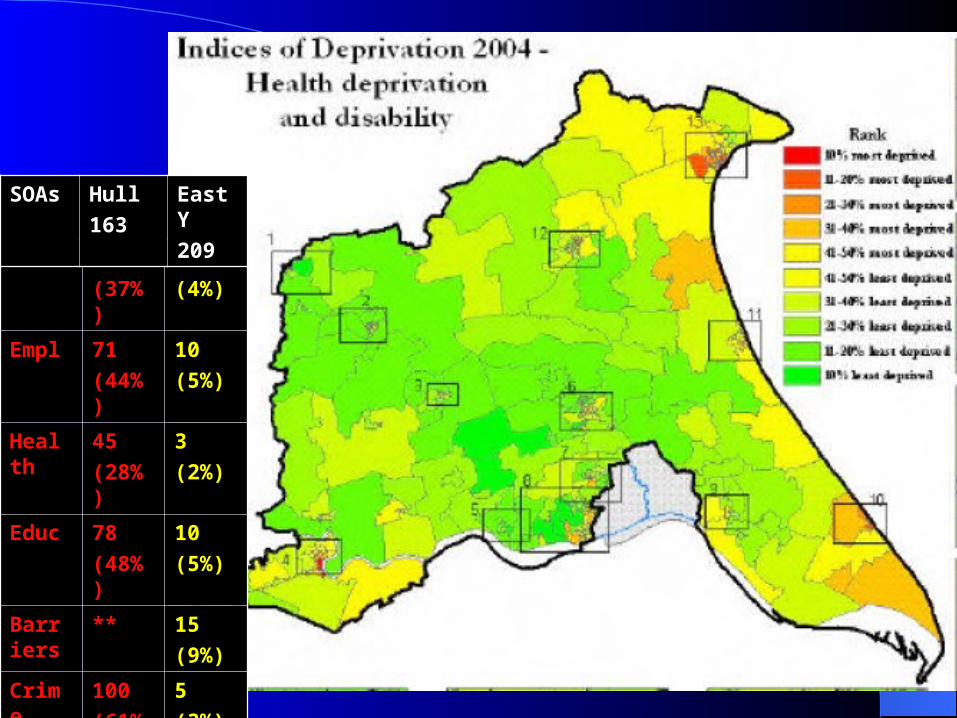
Inc 61
(37%)
9
(4%)
Empl 71
(44%)
10
(5%)
Health 45
(28%)
3
(2%)
Educ 78
(48%)
10
(5%)
Barriers
** 15
(9%)
Crime 100
(61%)
5
(3%)
Envir 70
(43%)
10
(5%)
SOAs Hull
163
EastY
209

Does the disadvantage of deprivation on health
continue into ESRD ?
OR
Is it neutralised by the severity of other risk factors ?
OR
Something else ?
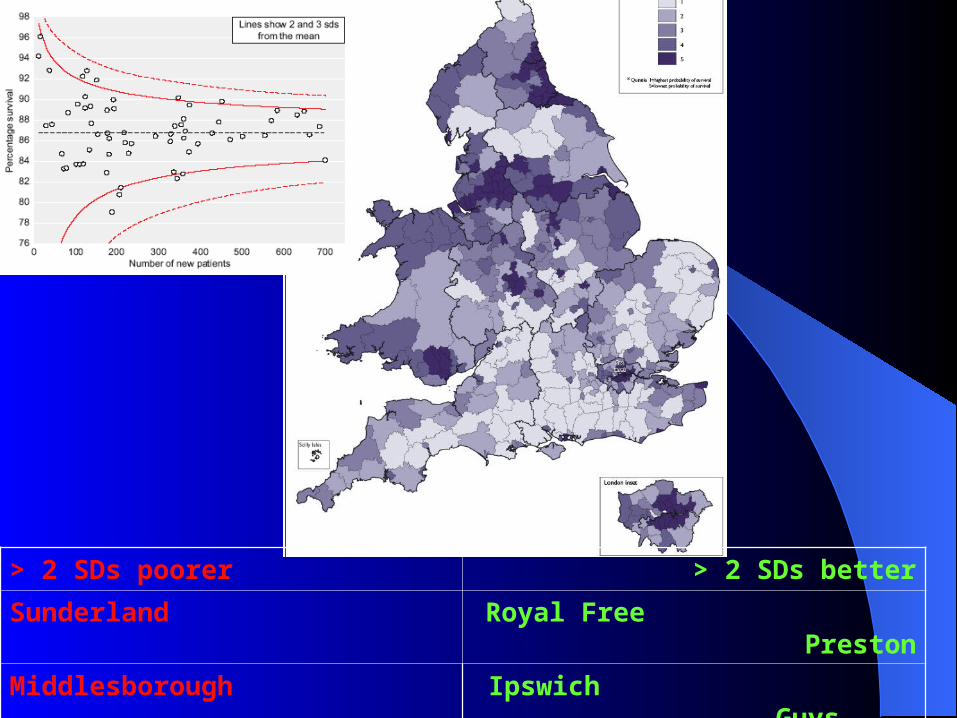
> 2 SDs poorer > 2 SDs better
Sunderland Royal Free Preston
Middlesborough Ipswich Guys
Airdrie Basildon
What do I look for ?
• Feedback – confirm what we know already
- discover what we don’t
- comparison; neighbours, peers
• Stimulus - set priority areas
- educate or re-educate staff
• Things that inform the commissioning process

Stimulus - what are we not recording well enough ?
Hull
• Transplant blood pressures
• Comorbidity data
• Referral patterns

Crash landers remain too common

What do we have to do for ourself ?
• More interactivity with own data possible ?
• Time - IMPROVEMENT
• Relative position – RATE OF CHANGE
HD URR > 65%
0
20
40
60
80
100
120
2002 2003 2004 2005 2006 2007
Years
%
Hull
Median
Best
0
20
40
60
80
100
%
2002 2003 2004 2005 2006 2007
Years
HD Hb > 10 g/dl
Hull
Median
Best

• Cause of death ; how many withdrawals ?
• Low Clearance Care; how many for palliation ?
evidence for slower progression ?
(CKD5 pilot)
What else is missing ?
How is your commissioning process ?
Save 1 kg paper / copy online

“Wake up, he’s finishing …”
• stimulus to service improvement
• pride in a communal effort
• content far outweighs any shortcomings


