Why does the Reaction to News Announcements Vary across Countries? + John M. Griffin a , + Nicholas H. Hirschey a , and Patrick J. Kelly b a University of Texas at Austin, McCombs School of Business, Austin, TX 78712, USA b University of South Florida, Tampa, FL 33620, USA October 10, 2008 + The first two authors are from the McCombs School of Business at the University of Texas at Austin. Griffin is currently visiting HKUST in Hong Kong and Kelly is at the University of South Florida. We thank Utpal Bhattacharya, Bernie Black, Miguel Ferreira, Jay Hartzell, Alok Kumar, Federico Nardari, Clemens Sialm, Sheridan Titman and seminar participants at the International Finance Conference at McGill University and the University of Texas at Austin for helpful comments and discussion. Email addresses: [email protected], [email protected], and [email protected].
Transcript
Why does the Reaction to News Announcements Vary across Countries?+
John M. Griffina,+ Nicholas H. Hirschey a, and Patrick J. Kellyb
a University of Texas at Austin, McCombs School of Business, Austin, TX 78712, USA b University of South Florida, Tampa, FL 33620, USA
October 10, 2008
+ The first two authors are from the McCombs School of Business at the University of Texas at Austin. Griffin is currently visiting HKUST in Hong Kong and Kelly is at the University of South Florida. We thank Utpal Bhattacharya, Bernie Black, Miguel Ferreira, Jay Hartzell, Alok Kumar, Federico Nardari, Clemens Sialm, Sheridan Titman and seminar participants at the International Finance Conference at McGill University and the University of Texas at Austin for helpful comments and discussion. Email addresses: [email protected], [email protected], and [email protected].
Abstract
We examine stock price reactions to large news events (earnings and takeover announcements) around the world. We find that the reactions to major events vary widely around the world—with some markets exhibiting large reactions and other markets with little or no reaction. We investigate possible explanations including: erroneous announcement dates, the lack of meaningful accounting numbers, delayed reaction to news, poor news quality, and insider trading. Overall, we find substantial support for the cross-country differences in reactions being driven by insider trading and press freedom as a proxy for news dissemination.
News announcements, such as annual earnings reports, are made for most traded firms in both
developed and emerging markets. Yet relatively little is known about how market participants
respond to this news. Does the strength of stock price reactions to news vary widely across
countries? If so, why do these reactions vary? Are they primarily driven by differences in the quality
of the information released or by the timing of when the news is traded on?
This paper examines the market reaction to common events around the world. We believe
such a study is useful for deepening our understanding of the information environment around the
world using an approach that is extremely systematic across countries. Our study reveals that stock
market reactions to news do vary widely around the world and they seem to vary mainly due to the
timing of when news is incorporated into prices.
In an innovative paper, Bhattacharya, et al (2000) track down news announcement dates in
Mexico from in a window from 1994 to 1997. Interestingly, they find that in Mexico there is no
stock price reaction on the announcement day. After examining possible explanations, they conclude
that this is due to rampant insider trading. In their abstract they state that their paper “points toward
a methodology for ranking emerging markets according to their market integrity.” The biggest
barrier that has stood in the way of such a systematic study is the difficulty in obtaining accurate
news event dates. For example, Bhattacharya et al. (2000), use 75 events that are hand collected from
Bloomberg. We also obtain event dates from Bloomberg, and we verify through hand checks of
alternate news services that Bloomberg announcement dates are indeed typically accurate (roughly
75 percent of the time). We use additional procedures to increase our event date accuracy up to an
estimated 90 percent accuracy. For earnings news we create two samples, one where Bloomberg
events are overlapping with IBES event dates and another where they are verified by Factiva news
articles. Our combined sample of earnings news event dates from January 2, 2001 to October 12,
2007 consists of 54,336 earnings announcements in developed markets (excluding the U.S.) and
13,884 emerging markets. Additionally, we obtain merger dates for target firms from three sources
and use only the earliest date for each event from among those sources.
Several papers have examined stock market reactions to earnings or news internationally.
The closest paper to ours is by DeFond, Hung, and Trezevant (2007), who examine the role that
investor protection, accounting standards, and insider trading laws play in explaining cross-country
differences in event reactions. The first major difference between their study and ours is that they
use IBES event reactions that we show (and they also acknowledge) often exhibit problems with
accuracy internationally. Second, they examine only 26 primarily developed markets, whereas we are
able to obtain events from many smaller markets. Third, their focus and conclusions are vastly
different from ours. Bailey, Karolyi, and Salva (2006) use earnings event reactions before and after a
U.S. cross-listing and find that U.S. accounting requirements lead to increases in earnings
announcement reactions. In an interesting study on takeovers Bris (2005) examines general patterns
of stock price run-ups prior to takeovers before and after the implementation of insider trading
laws.1
We first examine if news announcements vary across countries. We measure the average
absolute return over a three-day announcement window scaled by the average non-event day
volatility as our measure of normalized event volatility. We find that event dates reactions do vary
substantially across countries ranging from a value of two times normal event volatility to a value of
1.03 in Mexico, which indicates that an earnings event day in Mexico is essentially the same as any
other day. Nine emerging and three developed markets (Austria, Greece, and South Korea) have
event day reactions below 1.2 whereas nine developed markets exhibit reactions above 1.5.
1 Perhaps due to the scarcity of takeover events, in certain countries, his paper does not contain country-by-country analysis. Ackerman, Halteren, and Maug (2008) find that insider trading laws and not actual enforcement of the laws is more important for explaining pre-announcement price run-ups for takeovers.
We next turn to understanding the causes of the cross-country event reactions. There are
five main factors that may affect the reaction to a news event. First, if due to poor accounting quality
the earnings news is of low or no value, then there is little reason for stock prices to react. Second,
investors may not actively research stocks because the costs to collecting information are high,
which is typically referred to as investor inattention. Third, due to poor information dissemination
mechanisms, investors may be slow to receive the news. Fourth, investors may be able to anticipate
the news prior to the event through other public, non-announcement-related sources. Fifth, the
news may be largely impounded into prices through privately informed trade. We find support for
the third and fifth hypothesis.
We examine these hypotheses by studying differences in volatility and returns during
announcement, pre-announcement, and post announcement windows. This is followed by a joint
examination of these hypotheses in a cross-sectional, cross-country regression framework. To
examine the first hypothesis that poor earnings quality leads to smaller announcement period returns,
we examine the difference in abnormal stock returns between stocks with high and low changes in
earnings over the entire fiscal year. If low event reactions are driven by poor earnings quality, then
we expect a weak relation between stock prices and earnings in countries where there is little
reaction to earnings announcements. In contrast, we find that the difference between the returns of
firms with positive and negative changes in earnings is 21 percent per year in the quartile of
countries with the lowest reactions to earnings news. This is similar to the 26 percent per year
difference in the top quartile of countries with high event reactions. Next, since the strength of
takeover announcements does not depend on the quality of accounting data (like earnings), we
examine the relation between earnings event reactions. The cross-country correlation between
earnings and takeover event reactions is a highly significant 0.57.
To examine the second and third hypothesis we look for evidence of drift prior to earnings
announcements. In contrast to the predictions of these two hypotheses, we find substantial drift
prior to earnings announcements in both high and low earnings announcement countries, though
positive drift is somewhat higher in low reaction countries.
To examine the fourth and fifth hypotheses dealing with news being anticipated (either
through public or private channels), we examine if returns are moving in the same direction as
positive and negative earnings surprises (measured relative to IBES analyst forecasts). In low
reaction countries the relation between earnings surprises and prior period returns is similar to that
in high reaction countries even though the stock price movement on the announcement day is small
in the low reaction group. Additionally, merger announcements help us distinguish between the
public and private channels, since merger announcements are unscheduled events and in most cases
difficult to predict. In low reaction countries we find that 62.4 percent of the total price run-up is
reflected in the pre-announcement period, whereas in high event reaction markets, only 30.9 percent
of the run-up is in the pre-announcement period. Since we take the first takeover announcement
date, these findings seem to support the insider trading hypothesis over public information leakage.
To examine all our five main hypotheses jointly in a cross-country framework, we regress
our average normalized event volatility ratio on variables reflecting aspects of accounting quality, the
information environment, trading activity, insider trading law and practice, laws regarding investor
protection and trade, the level of economic and market development, and trading costs. Of the
thirty three variables related to these hypotheses that we examine in univariate regressions, we then
examine 153 regressions of unique combinations of the 18 significant variables in bivariate
regressions. From these regressions we examine the top seven in multivariate specifications (Panel C
in Table V). Of these variables, two survey response measures from the World Economic Forum’s
Global Competitiveness Report (GCR) Executive Opinion Survey emerge as significant in nearly
every specification: freedom of the press (a proxy for the quality of the information environment)
and prevalence of insider trading. We also estimate Panel regressions with firm-level controls and
find that these two variables are highly significant, along with a GCR survey variable on the
prevalence of ethical firms. Countries with a more ethical business environment, where there is less
of a perception of insider trading, and with greater press freedom exhibit stronger event reactions.
In sum, both our sorting results as well as cross-sectional regressions suggest that cross-country
differences in the way that firms respond to news are driven by the prevalence of insider trading and
strength of the financial press.
Our paper relates to a large international literature that examines the effect of insider trading
laws or the enforcement of these laws on issues such as the cost of capital [Bhattacharya and Daouk
(2002) and Beny (2007)], volatility [Du and Wei (2004)], idiosyncratic volatility [Fernandes and
Ferreira (2007)], and stock return autocorrelations patterns [Durnev and Nain (2007)]. The existence
of a law or its enforcement is only a proxy for the prevalence of insider trading. Bhattacharya (2006)
argues that even in a developed market such as Canada with prior enforcements that insider trading
may be widespread and that larger penalties and more enforcements can improve market conditions.
We add to this literature by providing a proxy to partially measure the extent to which insider trading
may occur across markets.
Section I describes and outlines our five main hypotheses. Section II describes our data
sources and process of gathering announcements and in insuring accuracy. Section III displays our
event reactions and Section IV shows various sorting tests to shed light on our hypotheses and
Section V further tests them through cross-country regressions. Section VI concludes.
I. News Channels
This section outlines potential causes for between-country differences in the reaction to the
public release of firm-specific information. Before discussing hypotheses, a basic point is important
to emphasize: Without accurate event dates, any analysis of news events is fundamentally flawed.
For this reason, we use announcements that have been verified from two different databases. In
addition, we confirm news announcements with independent news sources as we describe in much
more detail in our data section.
At its most basic level, the price reaction to a given news event is a function of the
magnitude of the valuation change signaled by the news. The price reaction is further affected by 1)
the quality and precision of that signal and 2) whether there is information leakage prior to the news
announcement. Our five hypotheses derive from these two basic principles.
A. Accounting Quality
First, the strength of the earnings news reactions may vary across countries due to the
importance or accuracy of financial accounting across countries, i.e. the quality and precision of the
valuation signal. In the extreme, a country with meaningless accounting standards would have no
reaction to earnings related news because investors assign no meaning or value to the accounting
information content of the news. Ball, Kothari, and Robin (2000) find evidence that the variation in
international accounting standards is sufficient to produce economically significant differences in
financial statements. If firms rely more on the financial markets for funding, they may be more
inclined to provide accurate and timely financial statements (see Ball, Kothari, and Robin (2000)).
Similarly, Ali and Hwang (2000) show that the value of accounting information is decreasing in a
country’s dependence on bank finance. This paper uses measures of earnings management, the level
of financial disclosure within a country, and a country’s reliance on the stock market or banks for
announcement reactions. Also, we examine news announcements from takeovers as an alternative
form of news that is not typically subject to the quality of accounting information.
B. Inattentive Investors and Poor Information Environment
Second, reactions may be delayed due to inattentive investors. In the extreme, even in the
face of significant news, stock prices might not move simply because investors are not reacting to
news [Huberman and Regev (2001), Peng and Xiong (2006)]. In the U.S., inattention has been
shown to lead to less reaction and more post-earnings drift on days with multiple earnings
announcements [Hirshleifer, Lim, and Teoh (2007)] and on Fridays [DellaVigna and Pollet (2008)].
We examine the magnitude of inattention by looking at the strength of post-earnings announcement
drift across markets and whether the magnitude of event day reactions is associated with the amount
of active trading in the market.
Third, a closely related hypothesis is that investors are slow to react not because they are
inattentive but because information is slow to reach the investor. If investors are not aware of an
event, then they cannot react to it. Consequently, one would expect stronger market reactions in
countries where information is transmitted relatively quickly and effectively. There may also be a
secondary effect; Grossman and Stiglitz (1980) note that when information acquisition costs are high
less information will be gathered. If poor communications infrastructure represents a component of
information acquisition costs, then in countries with poor communications infrastructure, not only is
it harder for investors to acquire firm-specific information, but they may also be inclined to collect
less of it. To analyze such effects we use controls for the quality of information dissemination within
a country.
A final related variant of both of these hypotheses is that investors simply do not respond at
all to news because the market is informationally inefficient. This could either occur due to fully
inattentive investors or because news is so poorly disseminated that the marginal investor does not
receive it. With the inattentive investor hypothesis or slow news dissemination, we expect to have
little event reaction but substantial post-announcement drift but with a completely inefficient market
there should be no movements in the direction of price announcements in either the pre-, post-, or
event period. As such, a completely informationally inefficient market is similar to a market where
the accounting information is invalid. In this case, the market would have neither drift in the
direction of the earnings surprise nor any pre-announcement price movement in the direction of the
news.
C. Pre-Announcement Trading through Public or Private Information
Our fourth and fifth hypotheses posit that the magnitude of news announcement reactions
is reduced by information leakage prior to the event day. This could occur due to news being
released through public channels outside of the official earnings announcement such as through
public conference calls with analysts, our fourth hypothesis, or it could be do to investors with
privileged knowledge trading on information before it is released to the public, our fifth hypothesis.
Such trading will dampen market reactions to information releases, since market participant reveal
information when they trade [Grossman (1981)]. It is important to note that we use the term
“insiders” to denote trading on to information not released through public channels. It is difficult to
pin down whether this trading is due to trading that is explicitly illegal in nature, though in cross-
country analysis we will investigate linkages to perception of insider trading and its relation to insider
trading laws.
We examine preannouncement run-up to explore the possibility that information gets to the
market prior to earnings events. If information is dispersed into prices through insider trading or
other public or private information based trade then we should see prices moving in the direction of
the earnings surprise before the reaction in countries with little event reaction. To separate the
public and private channel of early information release (our fourth and fifth hypotheses), we use the
prevalence of insider trading (a country level variable) to examine whether average country level
reactions are lower in countries with more insider trading.
Most of the evidence that we use to investigate each of these five hypotheses also has
implications for the other hypotheses, which we discuss in greater detail when describing our
findings. In addition, we use cross-sectional regressions and country-level variables to investigate
additional aspects of what features are related to event reactions across countries.
II. Data
The main data in this paper consist of firm stock returns and accounting variables, country-
level descriptive variables, and most importantly earnings and takeover announcements.
A. Preliminaries: Return, Accounting, and IBES data
Daily returns accounting for dividends and capital structure changes, and market
capitalization series are from CRSP for the United States and from Thomson Financial’s Datastream
for the rest of the world. Since we wish to restrict our sample to common equity, we use stocks with
CRSP share code of 10 or 11 in the U.S. For non-U.S. securities we follow the substantial screens of
Griffin, Kelly, and Nardari (2008) which eliminate preferred stock, warrants, unit or investment
trusts, duplicates, GDRs or cross-listings, and other non-common equity. We also use their return
filters to smooth potential data errors. We use Datastream’s value-weighted total market index
returns. Because our reactions are relative to local indices, we leave returns in local currency. For
annual earnings we use Worldscope annual earnings. Analyst forecast information internationally is
obtained from IBES. Annually rebalanced size portfolios are created using U.S. market capitalization
breakpoints by sorting all stocks listed on NYSE, AMEX, and NASDAQ into three market
capitalization portfolios. Each non-U.S. firm’s market capitalization is converted into U.S. dollars
using spot exchange rates from Datastream and is sorted into one of the US-size portfolios based on
its December-end market cap.
B. Country-level Variables
Developed or emerging classifications are based on World Bank income classifications in
November 2005. Country-level variables are primarily taken from the World Bank Development
Database or the World Economic Forum’s 1999 Global Competitiveness Report (GCR). This
source aggregates hard data and also reports the results of a survey of over 4,000 executives in 59
countries. The book reports an average response for each country and question asked. A key GCR
variable of interest is a survey question that asks executives if “insider trading in your country’s stock
markets is (1=pervasive, 7=extremely rare).” We aggregate the responses in the editions from 1999,
2000, and 2002-2003, but the World Economic Forum seemed to have stopped asking the question
in more recent surveys. We also use and extend the Bhattacharya and Daouk (2002) survey for
those countries in our sample that had not yet prosecuted a case of insider trading as of their sample
in December 1998. We contacted the 46 exchanges and regulators for markets covered by either
Datastream or FactSet and we received definitive answers about the first enforcement of insider
trading laws from 24. We received no conclusive responses from the remaining 22 countries, so in
these cases we use the anti-insider trading enforcement dates found by Bhattacharya and Daouk
(2002).
C. Earnings Announcement Dates
We choose earnings announcements as our main news event because we seek to investigate
a common event across countries, as well as an event with a standardized data source. Because firms
in many countries only announce earnings annually, for consistency we only examine reactions to
annual earnings announcement dates in all countries.
C.1. Data Collection procedure
For our international earnings announcement dates, we start with announcement dates from
Bloomberg. We also collect earnings announcements dates from IBES. We first examine the
accuracy by managing research assistants to check a sample of all events for five firms in each
country in our sample. In order to examine the accuracy of these databases, we begin in Appendix
Table A1, by matching and comparing all annual earnings announcement dates from IBES and
Bloomberg from 1994 through 2005 where both IBES and Bloomberg have announcement dates
for the same fiscal year. The count column shows the number of matched events. The next shows
the number of times the event dates were identical in both datasets. IBES Earlier is the count of the
number of times the IBES announcement is earlier than the Bloomberg date. More Bloomberg
dates are earlier (BB Earlier) in all countries except Colombia. If dates are not falsely reported early,
then Bloomberg dates appear to be much more accurate than the dates provided by IBES. In
fairness to IBES, they do not claim to provide announcement dates. They instead provide the date
the data were entered into their databases. In the U.S. the entry dates are the announcement dates,
but this does not appear to be true around the world.
To further investigate the database accuracy we sample five firms per country and examine
the accuracy of each and every event announcement for each of the five companies per country by
comparing these announcement dates to what we find when we search Factiva “by hand.” Table AII
reports that of the 1346 events checked and find that Bloomberg are accurate 75 percent of the time
in developed markets and 3 percent of the time in emerging markets. By contrast IBES dates are
accurate only 8 percent of the time in emerging markets and 23 percent of the time in developed. In
unreported results we restrict the sample to only the dates where IBES and Bloomberg match within
3 days of each other. This reduces the sample to only 201 dates over all, but the accuracy jumps to
91%.2
For this reason, we start with Bloomberg as our primary source even though we use IBES
dates for cross-checking. Even though we are able to collect Bloomberg announcement dates back
to 1994, we begin our sample in January 2001 since there have been significant changes over the last
ten years over which the speed and manner in which information is released and reported. Our last
earnings announcement date is on October 12, 2007. For U.S. firms, this sample consists of IBES
dates confirmed by Compustat.
To further check our international sample, we collect dates through Factiva as well. We took
a sample of fifty firms in each of the developed markets and half of all emerging market firms (at
least 100 per market where available) and downloaded all Factiva earnings news articles for these
firms. Because of the large volume of articles we automated the date confirmation process for this
sample. To begin we required articles be tagged as earnings related by Factiva. Then we checked to
see if any article has a number within five percent of the actual earnings figure (as reported by
Worldscope). If the publication date of such matched article from Factiva is within ±3 days of the
date reported by Bloomberg, we use the earlier of these two dates as our announcement date and
label the event as crossed with Factiva. We also construct a combined sample that we use for most
of our analysis that is simply the combination of the Bloomberg date that were either verified by
IBES or Factiva. If a Bloomberg date was verified by Factiva but we find an IBES announcement
2 These calculations are based on the assumption that the research assistant accuracy is 100 percent for the hand checked sample. The accuracy rate of the combined Bloomberg plus IBES sample could likely exceed 91 percent.
that is earlier then we exclude the event in the combined sample. To avoid imprecise inferences, we
also require that each country have at least 20 earnings news events over our combined sample to be
included in any analysis.
C.2. Sample Summary Statistics
Panel A and B of Table 1 shows summary statistics for both developed and emerging market
earnings announcements. Panel A first displays the number of firms with Datastream data and the
number of these firms that match to Bloomberg and where Bloomberg has earnings dates. In
developed markets, the average developed market has 1,151 common equity firms on Datastream
and 854 of these firms have Bloomberg announcement dates. The average emerging market has 725
firms with 543 having Bloomberg dates. On average, firms have slightly more than six annual
earnings announcement for a average of 5,245 unverified announcement dates in developed markets
and 3,313 in emerging markets. We are only able to check a limited set of dates with Factiva.
Because the IBES crossed with Bloomberg gathers such a large sample in most developed markets,
we only check a smaller sample of fifty firms from Factiva in Developed markets and end up with
data for an average of 17 firms and 42 events in each developed market. For emerging markets we
sample a much larger set of firms and end up with 164 firms and 277 events on average in each
market. The combined data includes the Bloomberg and IBES intersection—this drastically
increases the sample in developed markets. On average, there are 657 firms with data coverage in
developed markets and 2,470 events. In emerging markets there are on average 260 firms and 659
events. There are four emerging markets with less than 50 combined events (Egypt, Hungry,
Pakistan, and Peru). While this may seem like a small number of events, it is not when compared to
the previous literature. Bhattacharya et al. (2000)’s sample consisted of 19 earnings events and 75
total events in Mexico. In contrast, our sample of 118 Mexican earnings announcements has a
similar number of total announcements and six times the number of earnings announcements.
DeFond, Hung, and Trezevant (2007) do not even have Mexico, and many other emerging markets
in their sample.
Panel C presents the percent of the Factiva sample that occurs each year. Most of the sample
occurs after 2004. We suspect the low rate of earnings matching prior to 2004 is due to the
infrequent use of the earnings tag in this part of the sample.
D. Merger Announcement Dates
The sample of merger announcements is comprised of data from three sources: SDC,
FactSet, and Bloomberg. While there is significant overlap among sources, each source contains
some events that are not present in either of the other two. The sample is restricted to initial bids;
any bid for a target in any one of the databases within two years of a previous bid is thrown out. The
announcement date used for this study is the first date from among the three sources.
Panel D of Table 1 reports the number of merger events for which there was data in each
country. The number of events per country ranges from a maximum of 807 in the U.K. to a
minimum of 2 in Luxembourg. The small number of events in some countries make accurate
estimation of the associated country effect difficult. So that our findings are not driven by imprecise
measurement, if any country has less than ten merger announcement dates it is excluded from the
sample. The sample consists of 38 countries with over ten merger dates as compared to 42 countries
with over 30 earnings announcement dates. On average the 22 developed markets have 188 events
per country and the 16 emerging markets have 61 events per country. The merger sample is
significantly smaller than the earnings sample yet still a significant sample size of 5,114. There are
only 3,943 events in this sample.
III. Earnings Event Reactions Across Countries
We wish to examine whether significant news is disseminated on the announcement day.
Since no study has comprehensively examined the stock price reaction around news announcements
for a broad cross-section of emerging market countries, we do not know if the Bhattacharya et al.
(2000) case of Mexico in the early and mid 1990s is the exception or the norm. Given that the
amount of trading in most emerging markets has increased dramatically since the late 1990s, there
are reasons to think that responses of stock price reaction to news may have changed since 1994-
1997, even in Mexico. Here we first outline our main methodology for examining event reactions
and then we turn to examining event reactions around the world.
A. Preliminaries
Even though positive earnings news is typically accompanied by a positive stock price
reaction, our concern is whether information released is concentrated around news events, and not
the direction of the news itself. Hence, we focus our analysis on announcement volatility, although
in later analyses we will aloes look at signed announcement returns.
Reactions are most commonly based on Dimson-beta adjusted abnormal returns (Dim. Adj.)
although we check our main inferences with market-adjusted abnormal returns and find that they are
similar. The market factor in both models is the value-weighted local stock market return since a
local model is shown by Griffin (2002) to lead to more precise return forecasts than more
complicated global or international models. Betas are calculated following Dimson (1979), using
three leads and lags of the value-weighted local market return. The reaction statistics are composed
of two parts: event volatility and normal volatility. Event volatility is the mean absolute abnormal
return over the [-1, 2] event window relative to the earnings announcement date. Normal volatility
is the mean absolute abnormal return during the [-55, -2] and [3, 55] windows. Normalized volatility
is event volatility divided by normal volatility and has intuitive appeal in that it measures absolute
event returns in proportion to absolute returns outside of the earnings window. If the two periods
are equivalent, the ratio will take a value of one. Differenced volatility is event volatility minus
normal volatility. To assess significance, we use a non-parametric rank-deviation test for differences
in abnormal absolute returns, first proposed by Corrado (1989) and implemented by Bhattacharya, el
al (2000).
Importantly, we wish to avoid capturing non-reactions which are due to stock price
illiquidity or the fact that a stock does not trade. For this reason, in order to be included in any of
our samples, we require a stock to exhibit at least 50 days of non-zero returns or volume during the
period of -250 to -126 prior to the event.
B. Event Reaction Results
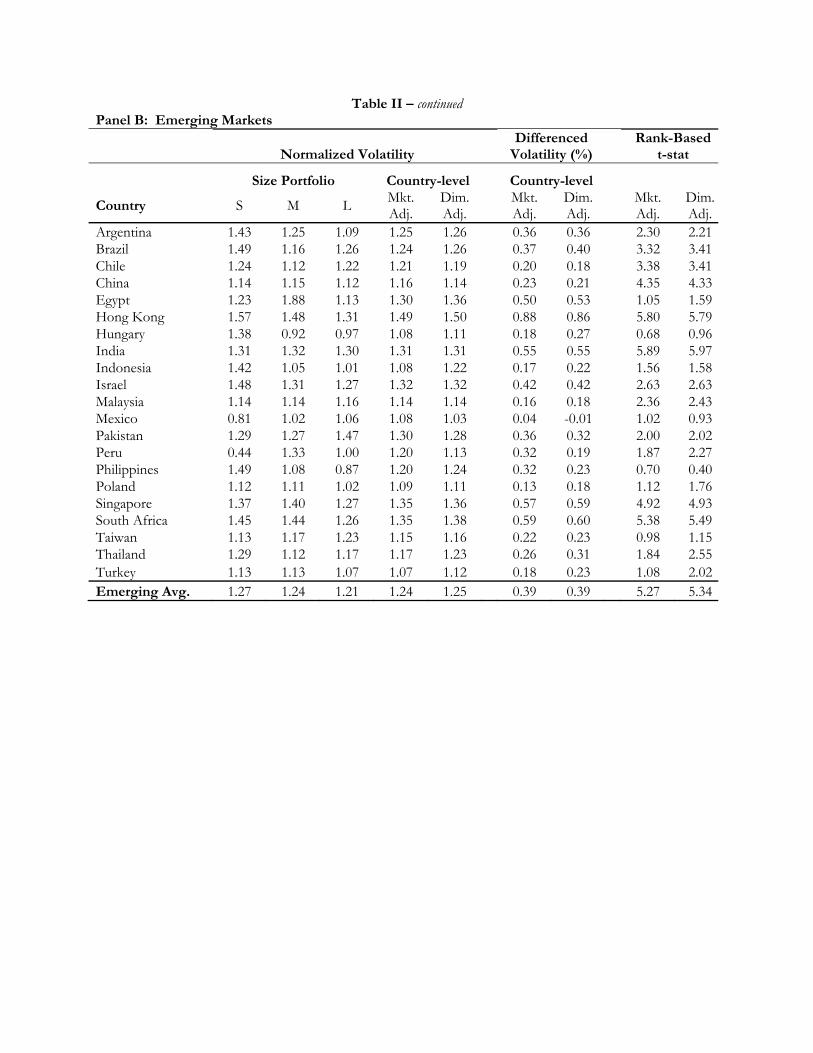
Table II first reports normalized volatility at the country-level and by size portfolio with
Panel A for developed markets and Panel B for emerging for our combined sample. Size portfolios
are based on prior December NYSE/AMEX/NASDAQ tercile breakpoints. First, Table II shows
that country reactions vary widely across countries. Second, there are typically relatively small
differences in reactions across size portfolios. Yet, in many developed markets there is a slight
tendency for reactions to be larger among larger firms. For example, in small developed markets the
average event reaction is 1.44 in small firms and 1.57 in large firms. In emerging markets the
reactions for small firms (1.27) is slightly larger than that for large firms (1.21). Third, there is little
difference in the Dimson market-model adjusted ratios as compared to those calculated using a
simple return minus the market. Unless otherwise stated, we use abnormal returns calculated with
the Dimson measure throughout the paper.
Figure 1 ranks all of our countries from highest to lowest volatility event ratio. Developed
markets are blue (light) and emerging markets are in red (dark) and significance at the five percent
level is indicated by stripes. First, the figure highlights how event reactions vary widely around the
world. The U.K. has an event reaction of two, meaning that event volatility is double normal stock
volatility, while Mexico has an insignificant event reaction of only 1.03. Second, the developed
markets typically have much higher event reactions. The emerging markets with high event reactions
like Hong Kong and Singapore have well developed capital markets and would be thought of as
advanced if not for our World Bank classifications. Third, the non-parametric t-statistics for the
Figure are also reported in the last columns of Table II and show that eight markets exhibit
insignificant reactions (Egypt, Philippines, Thailand, Indonesia, Taiwan, Hungry, Poland, South
Korea, and Mexico). Finally, many countries with reactions that are statistically different from one
have reactions that are economically close to one and much different from the reaction in most
developed markets. For example, Chile, Austria, China, Malaysia, Peru, Greece, and Turkey all
exhibit statistically significant reactions between 1.1 and 1.2. In contrast, U.K., Netherlands, Finland,
Sweden, Switzerland, France, Belgium, and the U.S. all exhibit reactions that are at least above 1.5
times the volatility on a normal trading day.
Panel B of Figure 1 shows the difference in volatility reaction from the event period to the
normal period. To facilitate comparison, the ordering is kept the same as in Panel A. While the
precise ordering varies somewhat across countries, the Panel shows that the overall ordering is
similar with the difference in volatility measure. Markets like Hong Kong and the U.S. exhibit
relatively higher measures with the difference in event volatility. The volatility ratio is relatively
smaller ratios for these markets because the abnormal returns during ‘normal’ or the non-earnings
window is relatively more volatile. We are not able to tell whether this volatility during the ‘normal’
period is due to news or private trading days. Conceptually, we prefer the volatility ratio to the
volatility difference, because the ratio makes for more intuitive comparisons of abnormal volatility
among countries.
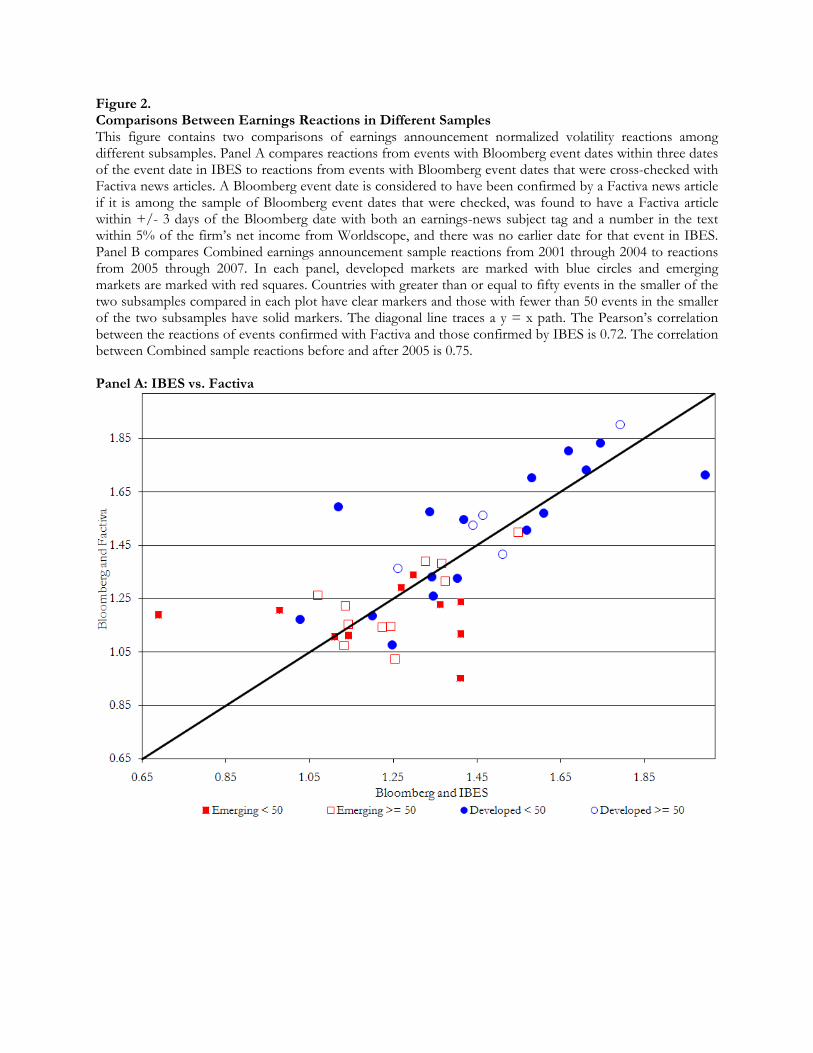
We now turn to examining how sensitive the volatility ratio is to differences in date
confirmation methodology by examining the relation between our sample of Bloomberg dates that is
confirmed by IBES as compared to those verified by Factiva. Figure 2 shows a scatterplot of the
average volatility ratio for each market where red (dark) circles are for emerging markets and blue
(grey) boxes for developed markets. Markets with less than fifty events in the smaller of the two
subsample are in boxes and circles that are solid, while countries with more observations are hollow.
Panel A of Figure 2 shows that there is a linear relation between the two samples with most
countries, particularly those with over fifty events mapping to each other. Overall, the cross-country
correlation between the two samples is 0.72. Additionally, the mean of the two samples is nearly
identical with a cross-country sample average of 1.35 for those dates confirmed by IBES and 1.36
for those confirmed by Factiva. If one of the two approaches led to inaccurate dates but the other
sample was accurate, then we would expect a large difference between the two subsamples. The
strong relation between the two samples provides some support for the accuracy of our dates
through both methods. With bad dates from both methods one would obtain no reactions in both
countries. However, it would be odd that our dates would be extremely accurate using both methods
in most countries but inaccurate using both methods in a few.
In Panel B of Figure 2 we examine if the reaction on two earnings dates shifted dramatically
through time. There is tight linear relation between the two subperiods and the cross-country
correlation between the two samples is 0.75. If there are shifts in news accuracy or large changes in
issues related to the hypothesis we developed in Section I, then we would expect the samples to
differ dramatically through time. The tight relation through time provides confidence that the event
reactions are relatively accurate and stable through time within a country.
IV. Hypothesis Testing
We investigate our five hypotheses using several tests and methodologies.
A. Earnings and Returns
Event reactions may be small in many countries because accounting earnings are of poor or
no quality. To investigate this possibility we examine if stock returns are moving in the same
direction as earnings information in the course of a year prior to just after the announcement (-230, -
2). Firms are placed into bins based on the ordering of high to low abnormal event reactions based
on the ordering of the normalized volatility ratio in Figure 1. We examine the abnormal stock
returns over the year for both firms with positive changes in earnings and those with negative
changes in earnings. The analysis is similar in spirit to the sorting approach used in the international
study of the relation between earnings and returns performed by Alford, et al. (1993).
Figure 3 shows that for the combined sample, the relation between news and abnormal
returns is strong in all four periods, though stronger in the high reaction countries. Nevertheless,
even in the lowest reaction set of countries there stocks with positive news over the year earn five
percent abnormal returns over the year, whereas countries with negative news announcements earn
below 16 percent—a more than 21 percent difference in returns. By comparison the difference in
returns between positive and negative news firms is over 26 percent in event reaction markets and
over 22 percent in the next to highest event reaction market. At first glance one might say that
stocks in low reaction countries exhibit stronger reactions to negative earnings news than to positive
news—this inference is incorrect. Since abnormal returns are calculated based on the returns in the
market over the year, the benchmark itself in may contain many positive earnings firms. Over our
2001 to 2007 period the emerging markets in the low reaction countries experienced much stronger
growth in earnings and returns than those in developed markets. This would be reflected in positive
market returns in each market. Panel B shows return differences between those with positive and
negative earnings changes over the year for firms in the sample verified by Factiva (2004- 2007). In
sum, both for the combined and Factiva-only sample earnings are tightly linked with stock returns in
both high and low reaction markets providing evidence against the hypothesis that low reactions are
due to low earnings quality.
We also turn to examining an event that does not rely on accounting information—
takeovers. Table III displays diagnostics of target firm abnormal event reactions on the
announcement day. These results are displayed by size portfolio, as well as with both market and
Dimson (1979) adjusted returns. One country that stands out is Norway where the average
abnormal volatility on takeover announcement days is 14 times that of a normal day. The average
developed market has an event reaction of 2.19 as compared to an event reaction of 3.59 for
emerging markets.
Figure 4 plots the relation between our combined earnings sample to the reaction of
takeovers. As should be expected, takeover reactions are much larger than earnings reactions. For
the most markets there is a clear relation between the abnormal takeover reaction and the abnormal
earnings reaction. Across countries there is a correlation of 0.57 between event reactions and
earnings reactions. This again provides evidence that cross-country patterns in earnings event
reactions are not primarily driven by differences in accounting conventions across markets.
Nevertheless, we will also further examine the relation between accounting variables and cross-
country reactions later in our cross-sectional regression analysis.
B. Inattentive Investors and the Information Environment
We next examine whether investor inattention or a low quality information environment is
partially responsible for slow or no reactions in low reaction countries. If earnings are meaningful,
but not incorporated upon the announcement, then one should see post-earnings announcement
drift [Ball and Brown (1968)]. Griffin, Kelly, and Nardari (2008) find substantial drift in both
developed and emerging markets but do not look at the relations between event reactions and drift.
We calculate earnings surprises as the difference between the actual reported earnings per
share and the mean analyst earnings per share forecast. We include only the last forecast for each
analyst at least 14 calendar days and not more than 182 calendar days before the reporting date. This
difference between actual and expected earnings is then scaled by price six calendar days prior to the
reporting date in order to normalize across different firms. Within a country, we sort events into the
positive (negative) portfolio if SUE is in the top (bottom) 60 percent of positive (negative) SUEs.
We first wish to see if returns over the three-day event window are in the same direction as
the earnings surprise. Panel A of Figure 5 shows that for firms with positive earnings surprises the
relation monotonically declines across portfolios from 1.9% in the high reaction country to 0.3% in
the low reaction country. For negative earnings surprises there is not a monotonic relation due to
only a small negative surprise in the next to highest reaction group of countries. Nevertheless, there
are large differences across groups, with firms in high reaction countries exhibiting negative returns
of 1.6% in high reaction countries and only 0.6% in low reaction countries. Panel B also shows
similar patterns for the part of the sample that is verified with Factiva though the differences are not
significant in the high reaction countries, likely due to the scarcity of observations here since many
more firms were sampled in emerging markets. The main point from these figures is that inferences
using earnings surprises yield a consistent picture as those from using volatility ratios. Having
established this fact, we turn to measuring post-event price movements.
Panel B shows that there is post-earnings announcement drift in the period from 3 to 55
trading days following the earnings announcement. The difference between the average returns to
positive earnings announcements minus the return from negative earnings announcements is 0.8%
percent in high reaction markets and 2.0% in low reaction markets. For the Factiva sample there is
actually a smaller difference between positive and negative post-earnings drift in the low reaction
market than in many of the other groups.
Panel C examines drift in the window of 56 to 125 trading days following the announcement.
Here there is little drift in high reaction countries but substantial negative drift (over three percent)
in low reaction countries. Overall, the results from Panels C and D show some more drift in low
reaction countries, although the differences are not large. To sum up we find only weak support for
the inattentive investors or poor news environment hypotheses. In a later section we use cross-
sectional regression analysis to disentangle these competing hypotheses.
C. Pre-Announcement Trading through Public or Private Information
We next examine whether there is pre-announcement information leakage in the same
direction as the earnings surprise. Panel D of Figure 5 shows that in the combined sample there is
more trading in the direction of positive earnings surprise events in the prior period [-55, -2] in all
four reaction portfolios, though the pre-announcement returns are largest in the low reaction sample
(5.1 percent return). Interestingly, however, firms with negative earnings surprises also have positive
returns in the low reaction sample (3.1 percent). The result is that the pre-announcement drift is
similar in high and low reaction countries. The sample that is verified with Factiva also yields similar
inferences. In Panel E we also examine post-announcement trading in the period from [-125, -56].
Here we find that in low reaction countries high earnings stocks outperform low earnings stocks by
over seven percent whereas in high reaction markets the difference is only over three percent. This
is consistent with information leakage occurring earlier in low reaction countries. However, the
results are not as strong with the smaller Factiva verified sample.
For low reaction firms, since earnings typically move in the same direction as the analyst
forecast and in similar or greater magnitude to that in high reaction markets in both the pre- and
post-announcement period, both the pre- and post-announcement results also provide strong
evidence against the first hypothesis that earnings are not moving in the announcement window in
low reaction countries due to poor earnings quality. Our results seem to point to significant trading
in the same direction as the news announcement which is consistent with some form of information
leakage.
In Table IV we also exhibit information leakage for takeovers. Pre-announcement leakage is
lower in low reaction market. However, the total premium appears to be much lower as well.
Takeover targets in low earnings reaction countries exhibit a much lower event reaction (3.5 percent)
than those in high reaction markets (17.4 percent) but when averaged across the two prior
subperiods ([-126, -56] and [-55, -2]) still exhibit pre-announcement leakage (5.8 percent) which is
almost as great as that in the high reaction markets (7.8 percent). The end result is that in low
reaction markets 62.4 percent of the total price run-up from [-126, +2] is reflected in the pre-
announcement period whereas in high earnings reaction markets only 30.9 percent of the total run-
up is reflected in the pre-announcement period. Unlike with earnings events, with mergers, we see
no drift for low reaction markets. In contrast to earnings announcement, merger announcements are
unplanned and unscheduled. Hence, the relatively larger stock price increase in the pre-
announcement period for low reaction countries is suggestive of informed (or insider) trading. In the
next section we explore how average event reactions with a country are associated with country-level
measures of insider trading to further shed light on whether the lower event reactions associated
with information leakage is the result of public or private sources of information.
V. Cross-Country Analysis
In this section we bring additional evidence to bear on the five hypothesized factors
influencing the magnitude of announcement reaction: accounting quality, investor attention and
information environment, public pre-announcement information release, and insider trade. We first
describe our cross-sectional data, then precede to univariate and multivariate cross-country
regressions followed by checking the robustness of our inferences to firm-level controls with panel
regressions.
A. Cross-Country Data
Event reaction characteristics can and do vary across companies, but they have a strong
country-level component as well. For example, while companies within a market can have differing
levels of accounting quality, base levels of accounting quality are something that is often mandated
by rule or law for all firms listing in a market. As such, we may find differences in event reactions
across markets as a function of differences in country-wide characteristics.
In the following subsections we examine whether a broad set of variables that relate to these
characteristics is associated with the size of the event reaction. The variables are taken from a variety
of sources and are chosen because they reflect aspects of accounting quality, the information
environment, trading activity, insider trading law and practice, laws regarding investor protection and
trade, and the level of economic and market development that relate to our hypotheses. Where data
availability permits we take the average value of the variable over our 2001 to 2007 sample.4
We conduct our analysis of the cross-country evidence for our five hypotheses by first
examining univariate regressions with event reaction as the dependent variable and proxies for
accounting quality, insider trading law and practice, etc. as the independent variables. It is important
to note that our regressions are not meant to imply causality but are merely capturing associations
between variables. We then progress to bivariate regressions and trivariate regressions in order to
explore which of these country-level characteristics is most important in the cross section.
4 We have also collected variables from other papers or from data sources that only cover part of the 2001 to 2007 period, in these cases we use the average value of the data available.
B. Univariate Cross-Country Regressions
Panel A of Table V presents the coefficients, t-statistics, and adjusted R2s from regressions in
which we regress a measure of earnings announcement reaction on variables reflecting aspects of
accounting quality, the information environment, trading activity, insider trading law and practice,
laws regarding investor protection and trade, the level of economic and market development, and
trading costs. For each event within a market the earnings announcement reaction is measured as
the natural log of the normalized volatility ration (as used in Table II and Figure 1). The equally
weighted average event reaction is calculated for each country, pooling across all years. We are
concerned that countries with fewer events might have less precise average earnings announcements,
which might induce bias in our regressions. To mitigate this concern we weight the observations by
the number of earnings announcements in each country in the left panel of Panel A. We also present
unweighted regressions for comparison in the right panel. The results are qualitatively the same.
B.1 Accounting Quality
Our first hypothesis is that the strength of the earnings news reactions may vary across
countries due to the importance or accuracy of financial accounting across countries. In the top
panel we see that countries with better quality of financial disclosure and stronger accounting
standards, and less earnings management (from Leuz, et al (2003)) are all associated with stronger
event reactions, consistent with the notion that better accounting quality results in more informative
valuation signals.
B.2 Inattentive Investors and Poor Information Environment
The second and third hypotheses posit that event reactions may be muted due to investor
inattention or information that is slow to arrive. As a proxy for attention we examine turnover by
value and the value of trade to GDP. The table shows that simple turnover is significantly positively
associated with greater event reactions, which is consistent with greater attention in the market
resulting in rapid information incorporation, although as one cannot infer causality from these
regressions other interpretations are possible. Better quality information could either improve the
speed of information incorporation, increasing event reactions or a surfeit of information could
overload investors and result in slow information diffusion into prices. These univariate regressions
show that a better quality information environment has a pronounced relation to stronger event
reactions. Both Availability of Information, which asks if “Information about businesses is extensive
and easily available” and Freedom of the Press, a response to the question whether “the media can
publish/broadcast stories of their choosing without fear of censorship or retaliation,” are both
strongly related to differences in average earnings announcement reaction volatility explaining just
over half of the variation across countries.
B.3 Private Information
Country level measures do a poor job of reflecting whether news is publicly pre-released
prior to earnings announcements, so we turn straight away to the fifth hypothesis: Information
leakage resulting insider trading will dampen the impact of news announcements on price. In these
univariate regressions, we see that event reactions are larger where insider trading laws have been
enforced and in countries where surveys indicate the perception of less insider trade and firms which
tend to behave ethically. 5 Both are consistent with the notion that information leakage occurs when
insider trading is common.
Finally, we also examine a number of indicators of economic and financial developed to see
whether differences are predominantly related to market development. Notably, sophistication of
financial markets and technological sophistication are strong correlates of event reactions. In the 5 Prevalence of Insider Trading is a CEO survey response variable from the Global Competitiveness Report (1=pervasive; 7=extremely rare). The Ethical Firms question asks if “corporate ethics (ethical behavior in interactions with public officials, politicians, and other enterprises) of your country’s firms in your industry are among the best in the world.”
next section we include significant variables from these univariate regressions in bi- and trivariate
regressions in order to distill the more important correlates of the size of event reactions.
C. Multivariate Cross-Sectional Regressions
We follow the procedure outlined in Griffin, Nardari, and Stulz (2007) and take the
significant variables from Panel A and examine these variables in multiple combinations of bivariate
regressions to uncover the stronger correlates of earnings announcement reactions. We
systematically examine all 153 unique combinations of the 18 significant variables from the
univariate regressions. In the interest of space the panel only presents a sampling of the results. The
first column of Panel B of Table V indicates the number of times that a particular variable is
significant in combination with others.
Each category (quality of accounting, etc.) contains variables frequently associated with
greater event reactions, but two in particular stand out. Absence of insider trading as captured by the
Prevalence of Insider Trade (1=pervasive; 7=extremely rare) and a strong information environment
as reflected in a Press Freedom survey measure, stand out as strong correlates of the magnitude of
earnings announcement reactions. Notably, insider trading law enforcement appears to be less
significant than the survey response to the Prevalence of Insider Trade, but perhaps this is not
surprising since enforcement of insider trading laws does not mean that insider trading does not
occur. A survey variable may be a much more direct measure of perceptions within the market.
In Panel C, we perform 35 trivariate regressions with each of seven variables significant in
over half of bivariate regressions. Again Press Freedom and Prevalence of Insider Trade stand out as
significant in all specifications. Prevalence of Insider trade is at worst marginally insignificant in only
one specification out of all the 35. This is displayed in specification 8, where Availability of
Information and Quality of Financial Disclosure are collinear. Freedom of the Press is significant in
every single specification.
In summation, we find some evidence in cross country data for each of the hypotheses
examined in this section but only robust evidence is found for two of the hypotheses. Accounting
quality generally makes for larger event reactions as does greater investor attention, and stronger
legal protections for investors. However, the greatest impact is the prevalence of insider trading and
the quality of information environment. Together these explain nearly 66 percent of the variation in
country average event reactions (Panel B, specification 1). Broadly, these findings are consistent the
hypothesis that insider trading prior to events mutes the impact of news and they suggest that a
generally poor information environment reduces the magnitude of announcement reactions.
D. Panel Regressions
The cross-sectional regressions are advantageous in that they average affects across firms
within a country and are careful not to overweight countries simply because they contain more
observations (in our case, events). However, market reactions to the release of firm-specific
information may vary by the type of which about which the news in generated. Accordingly,
accounting for firm differences may be necessary to isolate true country-level variation. Such
differences will be determined by the strength of value-relevant information available from outside
sources. For example, one may form a relatively precise estimate of an oil firm’s quarterly earnings
ahead of the announcement date by utilizing information available in the commodities markets. For
a different firm, such as a software company, there may exist little information outside that
produced by the company that is relevant for the calculation of firm value. One way to isolate
similar firms is to use industry affiliation. For international stock returns, Griffin and Karolyi (1998)
find that industry composition is largely averaged out when computing country-level stock returns.
Nevertheless, Brown and Ball (1967) show that a firm’s earnings contain a significant industry
component it is possible that the industry composition could be driving cross-country averages. We
use Datastream industry dummies for 17 industries.6 Importantly, we can control for the strength of
the news by using the magnitude of the earnings surprise relative to the IBES forecast. We include
U.S. market cap size dummies to capture simple differences in reactions across firm-size groupings.
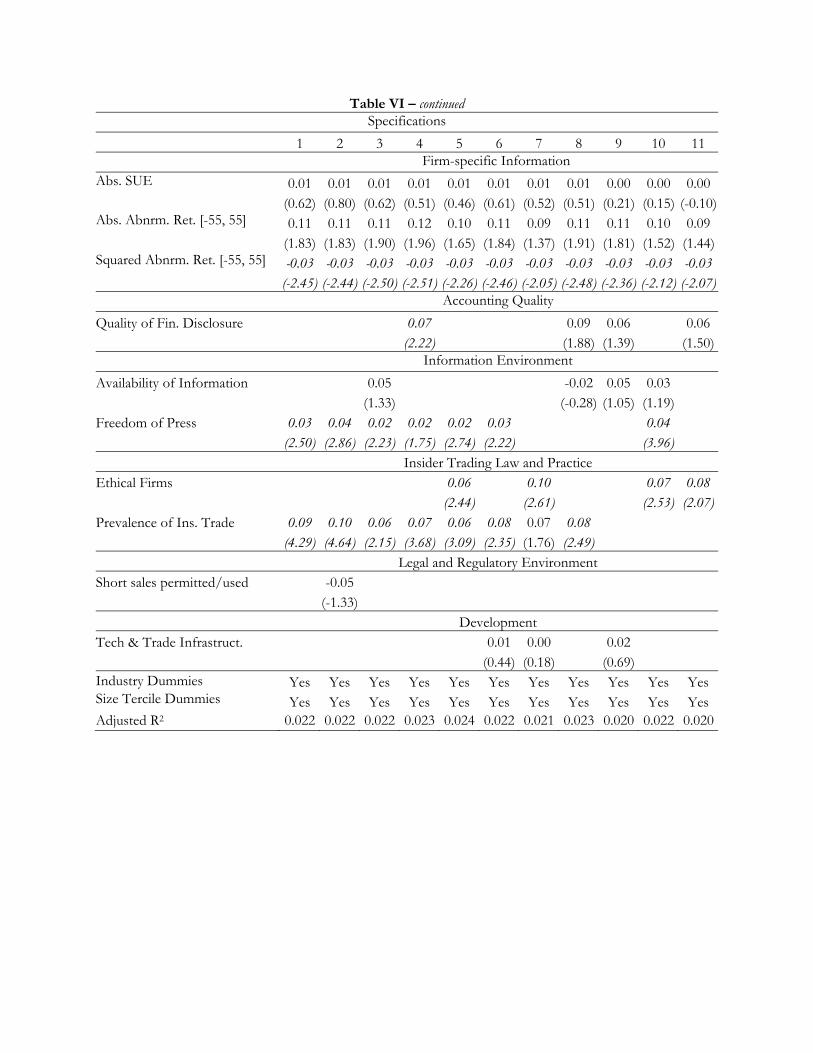
Table VI shows the Panel regressions with firm controls and industry and size tercile
dummies. We estimate panel regressions with exactly the same cross-country variables as in Panel C
of Table V. Surprisingly, the main inferences from the simple cross-sectional regressions are
essentially unchanged. Both the freedom of the press variable and prevalence of insider trade are
significant in all specifications except for one specification each. The only difference is that the
Ethical firms are significant as well which indicates that countries with stronger corporate ethics
have stronger event reactions.
VI. Conclusion
This paper finds that stock market reactions to news events vary widely around the world,
with most developed markets exhibiting large reactions to news and some emerging markets
exhibiting only miniscule reactions. We examine possible explanations including poor accounting
quality, inattentive investors, poor news dissemination, public pre-announcement trading, and
insider trading.
In countries with low event reactions, prices move strongly with earnings over annual
horizons. Returns move in the same direction as the earnings surprise both prior to the earnings
announcement and afterward. This is strong evidence that it is not poor earnings quality driving the
lack of event reactions in some markets. The post-announcement drift in the same direction of the
6 Because we use Datastream industry codes we currently exclude U.S. firms until we can map the U.S. SIC industries to Datastream.
earnings announcement is consistent with inattentive investors or poor news dissemination. Pre-
announcement trading is consistent with early news dissemination either through public or private
information sources. Merger announcements provide an interesting event to test these two
hypotheses, since takeover announcements usually catch the market by surprise. For our sample of
mergers, we find much more of the total price run-up is released in the period prior to the merger
than for firms in high reaction countries. This provides some suggestive evidence of informed or
insider (non-public) trading.
To more fully disentangle these hypotheses we systematically examine over 33 cross-country
variables related to these hypotheses and find that two main variables emerge: press freedom and the
perception of insider trading. One interpretation of this finding is that a stronger and freer press is
associated with more rapid information dissemination and incorporation into prices. In markets with
rampant insider trading the information news from the press is not a surprise as it is already
impounded into prices.
Our event reactions may be useful to policy markets, stock exchanges, and investors as they
seek to understand the relative magnitudes and extent of non-public information based trading in a
market. Additionally, since understanding the extent of private trading has implications for many
other aspects of financial markets, we hope to see additional research using the magnitude of the
event reaction as an empirical metric to help understand other cross-country differences in trading
volume, liquidity, foreign (outsider) ownership, and market valuations.
REFERENCES
Ackerman, Abraham, Jörn van Halteren, and Ernst Maug, 2008, Insider trading legislation and acquisition announcements: Do laws matter? Working Paper, University of Mannheim.
Alford, Andrew, Jennifer Jones, Richard Leftwich, and Mark Zmijewski, 1993, The relative
informativeness of accounting disclosures in different countries. Journal of Accounting Research 31, 183-223
Ali, Ashiq, and Lee-Seok Hwang, 2000, Country-specific factors related to financial reporting and
the value relevance of accounting data, Journal of Accounting Research 38, 1-21. Ball, Ray, S. P. Kothari, and Ashok Robin, 2000, The effect of international institutional factors on
properties of accounting earnings, Journal of Accounting and Economics 29, 1-51. Ball, Ray, and Philip Brown, 1968, An empirical evaluation of accounting income numbers, Journal of
Accounting Research 6, 159-178. Bailey, Warren, George Andrew Karolyi, and Carolina Salva, 2006, The economic consequences of
increased disclosure: Evidence from international cross-listings, Journal of Financial Economics 81, 175-213.
Beck, Thorsten, Asli Demirgüç-Kunt, and Ross Levine, 2000, A new database on the structure and
development of the financial sector, World Bank Economic Review 14, 597-605. Beny, Laura N., 2007, Insider trading rules can affect attractiveness of country’s stock markets,
University of Michigan Law Quadrangle Notes 50, 73-75. Bhattacharya, Utpal, 2006, Enforcement and its impact on cost of equity and liquidity of the market,
Working paper, Indiana University. Bhattacharya, Utpal, and Hazem Daouk, 2002, The world price of insider trading, Journal of Finance
57, 75-108. Bhattacharya, Utpal, Hazem Daouk, Brian Jorgenson, and Carl-Heinrich Kehr, 2000, When an event
is not an event: The curious case of an emerging market, Journal of Financial Economics 55, 69-101. Boehmere, Ekkehart, Jim Masumeci, and Annette B. Poulsen, 1991, Event-study methodology
under conditions of event-induced variance, Journal of Financial Economics 30, 253-272. Bris, Arturo, 2005, Do insider trading laws work? European Financial Management 11, 267-312. Bris, Arturo, William N. Goetzmann, and Ning Zhu, 2007, Efficiency and the bear: short-sales and
markets around the world, Journal of Finance 62, 1029-1079. Brown, Philip, and Ray Ball, 1967, Some preliminary findings on the association between the
earnings of a firm, its industry, and the economy, Journal of Accounting Research 5, 55-77.
Corrado, Charles J., 1989, A non-parametric test for abnormal security-price performance in event studies, Journal of Financial Economics 23, 385-395.
DeFond, Mark, Mingyi Hung, and Robert Trezevant, 2007, Investor protection and the information
content of annual earnings announcements: International evidence, Journal of Accounting and Economics 43, 37-67.
DellaVigna, Stefano, and Joshua Pollet, 2008, Investor inattention and Friday earnings
announcements, forthcoming in Journal of Finance. Dimson, Elroy, 1979, Risk measurement when shares are subject to infrequent trading. Journal of
Financial Economics 7, 197-226. Djankov, Simeon, Rafael La Porta, Florencio Lopez-de-Silanes, and Andrei Shleifer, 2008, The law
and economics of self-dealing, forthcoming in Journal of Financial Economics. Du, Julan, and Shang-Jin Wei, 2004, Does insider trading raise market volatility? The Economic Journal
114, 916-942. Durnev, Art A., and Amrita S. Nain, 2007, Does insider trading regulation deter private information
trading? International evidence, Pacific-Basin Finance Journal 15, 409-433. Fernandes, Nuno, and Miguel Ferreira, 2007, Enforcement of insider trading laws and stock price
informativeness, forthcoming in Review of Financial Studies. Griffin, John M., 2002, Are the Fama and French factors global or country-specific? Review of
Financial Studies 10, 783-803. Griffin, John M., and George Andrew Karolyi, 1998, Another look at the role of the industrial
structure of markets for international diversification strategies, Journal of Financial Economics 50, 351-373.
Griffin, John M., Patrick J. Kelly, and Federico Nardari, 2008, Measuring short-term international
stock market efficiency, Working Paper, University of Texas. Griffin, John M., Federico Nardari, and René M. Stulz, 2007, Do investors trade more when stocks
have performed well? Evidence from 46 countries, Review of Financial Studies 20, 905-951. Grossman, Sanford J., and Joseph E. Stiglitz, 1980, On the impossibility of informationally efficient
markets, American Economic Review 70, 393-408. Hasbrouck, Joel, 2004, Liquidity in the futures pits: inferring market dynamics from incomplete data,
Journal of Financial and Quantitative Analysis, 39, 2. Hirshleifer, David, Sonya Seongyeon Lim, and Siew Hong Teoh, 2007, Driven to distraction:
Extraneous events and underreaction to earnings news, working paper, University of California, Irvine.
Huberman, Gur, and Tomer Regev, 2001, Contagious speculation and a cure for cancer: A nonevent
that made stock prices soar, The Journal of Finance 56, 387-396. La Porta, Rafael, Florencio Lopez-de-Silanes, and Andrei Shleifer, 1999, Corporate ownership
around the world, The Journal of Finance 54, 471-517. Lesmond, David A., Joseph P. Ogden, and Charles A. Trzcinka, 1999, A new estimate of transaction
costs, Review of Financial Studies 12, 1113-1141. Leuz, Christian, Dhananjay Nanda, and Peter D. Wysocki, 2003, Earnings management and investor
protection: an international comparison, Journal of Financial Economics 69, 505-527. Newey, Whitney K., and Kenneth D. West, 1987, A simple, positive semi-definite, heteroskedasticity
and autocorrelation consistent covariance matrix, Econometrica 55, 703-708. Peng, Lin, and Wei Xiong, 2006, Investor attention, overconfidence and category learning, Journal of
Financial Economics 80, 563-602.
Table AI Earnings Announcement Date Timing
All Bloomberg and IBES annual earnings announcement dates for 1994 through 2005 were matched based on the fiscal year of the report. Count is the total number of announcement dates. Both Equal is the number of times both sources report the same announcement date. IBES Earlier counts the number of times the IBES date is earlier and BB Earlier is the number of times Bloomberg has the earlier announcement date. Developed Markets Emerging Markets
A random sample of five firms per country was chosen. For each firm all available Bloomberg and IBES earnings announcement dates were compared to those found through Factiva to check for accuracy. The number to the right of the “/” represents the number of announcements in the country sample for which data could be found in Factiva. The number to the left is the number of those announcements which fall within the [-1, +1] window relative to the date found in Factiva. Developed Markets Emerging Markets Country IBES Bloomberg Country IBES BloombergAustralia 3/27 21/27 Argentina 4/37 17/37Austria 9/23 8/23 Brazil 0/33 23/33Belgium 4/28 25/28 Chile 1/39 15/39Canada 3/20 14/20 China 5/17 15/17Denmark 10/26 25/26 Columbia 0/22 1/22Finland 12/30 21/30 Croatia 4/18 7/18France 7/31 22/31 Cyprus 0/11 5/11Germany 1/23 3/23 Czech Republic 2/32 13/32Greece 0/10 0/10 Egypt 0/15 3/15Iceland 0/14 9/14 Ghana 0/3 0/3Ireland 0/20 11/20 Hong Kong 11/47 25/47Italy 2/17 12/17 Hungary 5/26 20/26Japan 16/42 34/42 India 1/24 14/24Luxembourg 1/22 21/22 Indonesia 1/9 5/9Netherlands 18/46 42/46 Israel 1/21 18/21New Zealand 5/26 26/26 Jordan 0/8 0/8Norway 4/17 13/17 Kenya 0/10 4/10Portugal 2/36 32/36 Kuwait 0/6 3/6Spain 7/25 23/25 Lithuania 0/11 2/11Sweden 2/33 29/33 Malaysia 4/31 12/31Switzerland 16/43 32/43 Mauritius 0/5 2/5U.K. 18/49 33/49 Mexico 12/37 26/37 Morocco 0/10 2/10 Pakistan 0/19 3/19 Peru 0/22 10/22 Philippines 1/16 3/16 Poland 0/25 1/25 Romania 0/10 0/10 Singapore 4/35 30/35 South Africa 0/23 16/23 Sri Lanka 0/11 0/11 Taiwan 2/15 3/15 Thailand 3/41 17/41 Turkey 0/11 2/11 Venezuela 1/24 0/24 Zimbabwe 0/9 5/9
Total 140/608 456/608 Total 62/738 323/738
Figure 1. Earnings Announcement Reactions This figure plots two types of earnings announcement reaction volatilities. These volatilities are calculated using Dimson-beta adjusted abnormal returns. Betas are calculated following Dimson (1979), using three leads and lags of the value-weighted local market return. In order for an event to be included, there must be at least 50 non-missing returns in the period 250 to 126 days before the event for the purposes of market model estimation. The reaction statistics are composed of two parts: event volatility and normal volatility. Event volatility is the mean absolute abnormal return over the [-1, 2] event window relative to the earnings announcement date. Normal volatility is the mean absolute abnormal return during the [-55, -2] and [3, 55] windows. The Normalized Volatility Reactions in Panel A are event volatility divided by normal volatility. Differenced Volatility Reactions in Panel B are event volatility minus normal volatility. Developed market countries are marked with red (dark) bars and emerging market countries are marked with blue (light) bars. Countries with event volatility significantly greater than normal volatility are denoted by striped bars. Significance is determined by a Corrado (1989) non-parametric rank t-test. Panel A: Combined Earnings Announcement Sample Normalized Volatility
Figure 2. Comparisons Between Earnings Reactions in Different Samples This figure contains two comparisons of earnings announcement normalized volatility reactions among different subsamples. Panel A compares reactions from events with Bloomberg event dates within three dates of the event date in IBES to reactions from events with Bloomberg event dates that were cross-checked with Factiva news articles. A Bloomberg event date is considered to have been confirmed by a Factiva news article if it is among the sample of Bloomberg event dates that were checked, was found to have a Factiva article within +/- 3 days of the Bloomberg date with both an earnings-news subject tag and a number in the text within 5% of the firm’s net income from Worldscope, and there was no earlier date for that event in IBES. Panel B compares Combined earnings announcement sample reactions from 2001 through 2004 to reactions from 2005 through 2007. In each panel, developed markets are marked with blue circles and emerging markets are marked with red squares. Countries with greater than or equal to fifty events in the smaller of the two subsamples compared in each plot have clear markers and those with fewer than 50 events in the smaller of the two subsamples have solid markers. The diagonal line traces a y = x path. The Pearson’s correlation between the reactions of events confirmed with Factiva and those confirmed by IBES is 0.72. The correlation between Combined sample reactions before and after 2005 is 0.75. Panel A: IBES vs. Factiva
Panel B: Combined Reactions Before and After 2005
Figure 3. Abnormal Prior-Year Returns for Country Reaction Portfolios Sorted on Changes in Net Income This figure plots buy-and-hold abnormal returns from 230 trading days before an earnings announcement through two days after the announcement. In each panel, countries are sorted into four reaction portfolios based on the average normalized volatility reaction for events in our Combined earnings announcement sample. We then plot abnormal returns for events in each country-reaction portfolio according to whether the firm reported a positive or negative change in net income on the event day as indicated by net income data from Worldscope. The plots below depict these sorts for both our Combined earnings announcement sample (ex-U.S.) and our Crossed w/ Factiva earnings announcement sample. Abnormal returns are calculated following Dimson (1979), using three leads and lags of the value-weighted local market return. In order for an event to be included, there must be at least 50 non-missing returns in the period 500 to 251 days before the event for the purposes of market model estimation. Significant differences between the abnormal returns of positive and negative change in net income portfolios within a country-reaction group are indicated with striped bars. Significance is calculated following Boehmer (1991).
Figure 4. Comparison between Earnings and Merger Reactions This figure compares earnings announcement normalized volatility reactions to merger announcement normalized volatility reactions. In each panel, developed markets are marked with blue circles and emerging markets are marked with red squares. Countries with greater than or equal to fifty events in the smaller of the two subsamples compared in each plot have clear markers and those with fewer than 50 events in the smaller of the two subsamples have solid markers. The Pearson’s correlation between the two series is 0.57.
Figure 5. Abnormal Returns for Country Reaction Portfolios Sorted on SUE This figure plots buy-and-hold abnormal returns in the periods surrounding earnings announcements. Abnormal returns are calculated following Dimson (1979), using three leads and lags of the value-weighted local market return. In order for an event to be included, there must be at least 50 non-missing returns in the period 250 to 126 days before the event for the purposes of market model estimation. In each panel, countries are sorted into four reaction portfolios based on the average normalized volatility reaction for events in our Combined earnings announcement sample. We then plot abnormal returns for events in each country-reaction portfolio according to the firm’s standardized unexpected earnings (SUE) for that event. Earnings surprises are calculated as the difference between the actual earnings and the mean of the last IBES earnings forecast made by each analyst covering the stock between 14 and 182 calendar days prior to the announcement. Surprise is scaled by the price at least six and not more than twelve days prior to the event. Within a country-reaction group, we sort events into the positive (negative) portfolio if SUE is in the top (bottom) 60% of positive (negative) SUEs for the corresponding country. The plots below depict these sorts for both our Combined earnings announcement sample (ex-U.S.) and our Crossed w/ Factiva earnings announcement sample. Significant differences between the abnormal returns of SUE portfolios within a country-reaction group are indicated with striped bars. Significance is calculated following Boehmer (1991). Panel A: [-1, 2] Window
Panel B: [3, 55] Window
Panel C: [56, 125] Window
Panel D: [-55, -2] Window
Panel E: [-126, -56]
Table I Summary Statistics
This table presents summary data for the events in our sample. Earnings and merger announcement samples contain events from January 2, 2001, through October 10, 2007, and April 26, 2007, respectively. Panels A and B present the same statistics for developed and emerging markets. The Datastream column reports the total number of firms in Thomson’s Datastream that pass the Griffin, Nardari, and Kelly (2007) common stock filters. The Bloomberg column reports the number of firms/events from our set of Bloomberg earnings announcements that we can merge to Datastream. The Crossed w/ Factiva subgroup consists of all firms/events of those in the Bloomberg sample that we checked, were found to have a Factiva article within +/- 3 days of the Bloomberg date with both an earnings-news subject tag and a number in the text within 5% of the firm’s net income from Worldscope, and for which there was not an earlier date in IBES. The Combined sample is the union of the Crossed w/ Factiva sample and the remaining Bloomberg events with an announcement date within +/- 3 days of the date reported by IBES. The Events by Tercile statistic is the percent of Combined events with firms falling in each of three size terciles. Annually rebalanced size portfolios are created using U.S. market capitalization breakpoints in the following manner: at the end of each December from 2000 to 2006 we sort all stocks listed on NYSE, AMEX, and NASDAQ into three equal portfolios; each non-U.S. firm is sorted into one of the U.S.-size portfolios based on its December-end market capitalization converted into U.S. dollars using spot exchange rates from Datastream. In the case of U.S. events, the Combined firms/events are instead the number for which the event date in IBES is within +/- 3 days of the date in Compustat. In all subsequent results, the event date is the earliest matching date within the respective +/- 3 day window. The Average row reports the average of each country-level statistic in the above columns for panels A, B, and D. Panel C reports Crossed w/ Factiva events (for developed and emerging markets) as a percent of checked Bloomberg and Combined events as a percent of all Bloomberg by year. Panel D reports the number of merger events in the union of Bloomberg, Mergerstat, and SDC.
Table I – continued Panel A: Developed Market Earnings Announcements
Developed Emerging Country # Mergers Country # MergersAustralia 262 Brazil 12Austria 16 China 81Belgium 34 Egypt 10Canada 479 Hong Kong 117Denmark 31 Hungary 14Finland 33 India 141France 217 Indonesia 49Germany 237 Israel 21Greece 65 Malaysia 114Ireland 11 Philippines 14Italy 101 Poland 46Japan 518 Singapore 92Netherlands 56 South Africa 87New Zealand 32 Taiwan 91Norway 56 Thailand 53Portugal 14 Turkey 29South Korea 98 Spain 41 Sweden 82 Switzerland 42 U.K. 96 U.S. 1,622 Total 4,143 971Average 188 61
Table II Earnings Event Reactions
This table reports summary statistics for our Combined earnings reactions sample. For non-U.S. firms, this sample consists of Bloomberg events with dates confirmed either by Factiva news articles or IBES. For U.S. firms, this sample consists of IBES dates confirmed by Compustat. Reactions are based either on market-adjusted abnormal returns (Mkt. Adj.) or Dimson-beta adjusted abnormal returns (Dim. Adj.). The market factor in both models is the value-weighted local stock market. In order for an event to be included, there must be at least 50 non-missing returns in the period 250 to 126 days before the event for the purposes of market model estimation. Betas are calculated following Dimson (1979), using three leads and lags of the value-weighted local market return. The reaction statistics are composed of two parts: event volatility and normal volatility. Event volatility is the mean absolute abnormal return over the [-1, 2] event window relative to the earnings announcement date. Normal volatility is the mean absolute abnormal return during the [-55, -2] and [3, 55] windows. Normalized Volatility is event volatility divided by normal volatility. Differenced Volatility is event volatility minus normal volatility. Size portfolios are based on prior December NYSE/AMEX/NASDAQ tercile breakpoints from 2000 to 2006. The last two columns report non-parametric rank-based t-stats for each country calculated following Corrado (1989) for tests of the hypothesis that event-period volatility equals normal-period volatility. The average at the bottom of each panel is the average of event reactions within either developed or emerging markets. Panel A: Developed Markets
This table reports summary statistics for our sample of merger announcements collected from Bloomberg, Mergerstat, and SDC. We restrict the sample to initial bids (no bids for the target in the prior two years). A merger event in any of the three sources is considered the same event as one from another source if the bids are for the same target and within two years of each other. We take the earliest announcement date for each event from the union of all three sources. Reactions are based either on market-adjusted abnormal returns (Mkt. Adj.) or Dimson-beta adjusted abnormal returns (Dim. Adj.). The market factor in both models is the value-weighted local stock market. In order for an event to be included, there must be at least 50 non-missing returns in the period 250 to 126 days before the event for the purposes of market model estimation. Betas are calculated following Dimson (1979), using three leads and lags of the value-weighted local market return. The reaction statistics are composed of two parts: event volatility and normal volatility. Event volatility is the mean absolute abnormal return over the [-1, 2] event window relative to the earnings announcement date. Normal volatility is the mean absolute abnormal return during the [-55, -2] and [3, 55] windows. Normalized Volatility is event volatility divided by normal volatility. Differenced Volatility is event volatility minus normal volatility. Size portfolios are based on prior December NYSE/AMEX/NASDAQ tercile breakpoints from 2000 to 2006. The last two columns report non-parametric rank-based t-stats for each country calculated following Corrado (1989) for tests of the hypothesis that event-period volatility equals normal-period volatility. The average at the bottom of each panel is the average of event reactions within either developed or emerging markets. Panel A: Developed Markets
This table reports abnormal returns for merger events sorted into four portfolios based on the average normalized volatility reaction to earnings announcements for firms from the target’s home country. Abnormal returns are calculated following Dimson (1979), using three leads and lags of the value-weighted local market return. We report abnormal returns in percent for the periods 125 to 56 days before the event, 55 to 2 days before the event, the day before the event to 2 days after, and 3 to 55 days after the event. T-stats for tests of the hypothesis that abnormal returns are equal to zero for each Reaction Portfolio/Return Window combination are reported inside parentheses. These t-stats are calculated following Boehmer (1991).
Table V Regressions of Announcement Volatility Ratios on Cross-Country Characteristics
Panel A reports univariate regressions the equally weighted average event reaction for each country, pooling across all years, on variables which proxy for accounting quality, information environment quality, trading activity, insider trading law and practice, development and trading costs index described below. Event reactions are the natural log of the mean absolute return in the days -1 to +2 around each announcement scaled by mean absolute return in the period 55 days to 2 prior to each announcement and 3 to 55 days following the event.. Regressions are Newey-West (1987) heteroskedasticity corrected. The left panel reports regressions where observations are weighted by the number of earnings announcements in a country. The right panel reports unweighted results. Panel B reports bivariate regressions with observations weighted by the number of earnings announcements. Panel C reports trivariate regressions. A number of variables come from the World Economic Forum’s Executive Opinion Survey of 8,000 executives world wide as Reported in various Global Competitiveness Reports (GCR). Where unstated, 7 is high/strongly agree and 1 is low/strongly disagree on these surveys. Quality Fin. Disclosure [98-99 GCR] is from the 98-99 GCR and reports “The level of financial disclosure required is extensive and detailed.” Strength of Accounting Standards [02-03 GCR], Availability of Information[98-99 GCR] and asks whether “Information about businesses is extensive and easily available.” Freedom of Press [02-03 GCR] asks if “the media can publish/broadcast stories of their choosing without fear of censorship or retaliation.” Ethical Firms [02-03 GCR] asks if “corporate ethics (ethical behavior in interactions with public officials, politicians, and other enterprises) of your country’s firms in your industry are among the best in the world.” Prevalence of Insider Trade is the average of the 98-99, 99-00, and 02-03 GCR responses. The question asks if “Insider trading in your country’s stock markets is (1=pervasive, 7=extremely rare). Strength of Private Property Rights [02-03 GCR] asks if “Financial assets and wealth are clearly delineated and well protected by law.” Sophistication of Fin. Mkt. [98-99 GCR] asks if “The level of sophistication of financial markets is higher than international norms.” Tech. Sophistication [98-99 GCR] asks if “Overall, your country is a world leader in technology.” The following variables are from the World Bank’s doingbusiness.org: Disclosure, the extent of disclosure required for large corporate transactions, Cost to Enforce Contracts is as a percentage of debt, Director Liability measures “liability for self-dealing”, and Shareholder Lawsuits measures “shareholders’ ability to sue officers and directors for misconduct.” Variables from other papers: Ex-Ante Disclosure and Anti-Self Dealing are from Djankov, La Porta, Lopez-de-Silanes, and Schleifer (2007) and is the first principle component of several doingbusiness.org measures. Earnings Management is from Leuz et al. (2003) and measures the amount of earnings management within a country. Anti-Insider Trading Law is a dummy variable if a country has enforced anti-insider trading laws and is from Bhattacharya and Daouk (2002) and has been updated for this paper in early 2008. The Corruption index is from La Porta et al. (1999). Short sales (from Bris, Goetzmann and Zhu (2007)) is a dummy variable that equals one if short sales are allowed as of the end of 1998. Tech & Trade Infrastructure is the first principal component of computers per capita, email use, and internet hosts per million people from the 98-99 GCR. Financial Deposits / GDP is Financial System Deposits to GDP from Beck, Demirgüç-Kunt, and Levine (2000). Quarter and Semi-Annual Earnings are dummy variables set to 1 if more than 35% of companies with annual earnings announcements also have quarterly or semi-annual earnings reports, respectively. Turnover is the 2001 through 2007 average annual value traded divided by the total market capitalization for each market from Datastream. Value Traded to GDP is from World Bank’s Financial Development and Structure database. British Law is a dummy variable for whether the legal system in a country is based on common law. Investor Protection is the principal component of private enforcement and anti-director rights on a scale from 0 to 10. Country Risk is the average over the period 1994-2005 of the country risk index published by Euromoney. Log (GDP) per capita is the natural logarithm of per capita Gross Domestic Product (in U.S. dollars) in 2000. Market Cap / GDP is the average of the ratio of stock market capitalization held by shareholders to gross domestic product for the period 1996-2000. P/E is the average price-earnings ratio for all firms in the market from January 2004 through March 2008 from Factset. Hasbrouck and LOT transaction costs are computed following Hasbrouck (2004) and Lesmond, et al (1999) respectively, and averaged over 1994 through 2005.
Table V – continued Panel A: Univariate Regressions
Volatility Ratio
Earnings-count weighted Volatility Ratio Non-weighted
Information Environment Availability of Info. 4 0.00 0.03 0.12 0.00 (0.09) (0.31) (2.16) (-0.04) Freedom of Press 15 0.04 0.04 0.04 0.04 0.03 0.04 0.05 (3.36) (3.43) (4.56) (3.03) (2.85) (5.06) (3.79) Insider Trading Law and Practice Ethical Firms 4 0.03 0.11 0.07 0.11 (1.68) (1.48) (1.18) (2.13)Prevalence of Ins. Trade 14 0.05 0.09 0.09 0.09 0.07 0.10 0.10 (3.99) (3.48) (2.41) (3.82) (3.15) (2.18) (1.99) Legal and Regulatory Environment Short sales permitted/used 3 -0.01 0.15 (-0.32) (2.24) Development Tech & Trade Infrastruct. 1 -0.01 -0.02 0.01 (-0.37) (-0.48) (0.28) Number of Obs. 41 40 41 41 41 41 40 41 42 41 40 Adjusted R2 0.659 0.646 0.650 0.650 0.671 0.652 0.587 0.614 0.504 0.598 0.587
Table VI Regressions of Announcement Volatility Ratios with Firm-specific Variables
This table reports results from regressions of log announcement volatility ratios on cross-country and firm specific variables for non-US firms. Volatility ratios are mean absolute abnormal return over the [-1, 2] event window divided by mean absolute abnormal return during the [-55, -2] and [3, 55] windows. Abnormal returns are calculated following Dimson (1979), using three leads and lags of the value-weighted local market return. A number of the independent variables come from the World Economic Forum’s Executive Opinion Survey of 8.000 executives worldwideas reported in various Global Competitiveness Reports (GCR). Where unstated, 7 is high/strongly agree and 1 is low/strongly disagree on these surveys. Quality Fin. Disclosure [99 GCR] reports whether respondents think “The level of financial disclosure required is extensive and detailed.” Availability of Information [99 GCR] asks whether “Information about businesses is extensive and easily available.” Freedom of Press [02-03 GCR] asks if “the media can publish/broadcast stories of their choosing without fear of censorship or retaliation.” Ethical Firms [02-03 GCR] asks if “corporate ethics (ethical behavior in interactions with public officials, politicians, and other enterprises) of your country’s firms in your industry are among the best in the world.” Prevalence of Insider Trade is the average of 99, 99-00, and 02-03 GCR responses. The question asks if “Insider trading in your countries stock markes is (1=pervasive, 7=extremely rare). Short sales (from Bris, Goetzmann, and Zhu (2007)) is a dummy variable that equals one if short sales are allowed as of the end of 1998. Tech & Trade Infrastructure is the first principal component of computers per capita, email use, and internet hosts per million people [99 GCR]. The Absolute Value of SUE is standardized unexpected earnings calculated as the difference between the actual earnings and the mean of the last IBES earnings forecast made by each analyst covering the stock between 14 and 182 calendar days prior to the event. Abs. Abnrm. Ret. [-55, 55] is the absolute value of Dimson-adjusted buy-and-hold returns from 55 days before the event to 55 days after the event, and Squared Abnrm. Ret. is the square of that return. We also include dummies for 17 Fama and French industries and dummies for size portfolios. Size portfolios are based on prior December NYSE/AMEX/NASDAQ tercile breakpoints from 2000 to 2006. Standard errors in all regressions below are clustered by country. Regressions (2) and (7) have 16,420 observations, regression (9) has 16,525 observations, and all other have 16,516 observations.