Wild olive selection for quality oil production A report for the Rural Industries Research and Development Corporation by Professor Margaret Sedgley July 2004 RIRDC Publication No 04/101 RIRDC Project No UA-54A
Transcript
Wild olive
selection for quality oil
production
A report for the Rural Industries
Research and Development Corporation
by Professor Margaret Sedgley
July 2004
RIRDC Publication No 04/101 RIRDC Project No UA-54A
Foreword This project is the first in Australia to address the selection of olive cultivars with local adaptation. All existing cultivars were developed for environmental and climatic conditions found overseas, and they thrive in these situations. Experience with other crops has taught us that importation of cultivars from overseas can result in sub-optimal production in Australia, as our growing conditions can differ, often quite considerably, from those at the point of origin. With the olive, we have the unique situation of weed escape from groves established following the first European settlement of Australia. These weed population are so successful that olive eradication is a prime focus of many local councils and conservation groups across southern Australia. While these populations pose an environmental problem, they also offer a unique opportunity to the new fledgling olive industry. The weed populations are so well adapted that they compete successfully with native vegetation. Harnessing this competitive ability will pay dividends in terms of the development of adapted genotypes. Our study has surveyed wild olive populations across southern Australia and has tested for oil yield and quality. Those that were superior to existing cultivars have been propagated and planted at the Roseworthy Campus of the University of Adelaide. While it will be some years yet before this material can be proven under cultivated conditions, the resource secures the future of the olive industry in Australia, with the promise of superior adapted cultivars for the future. This project was funded from RIRDC Core Funds which are provided by the Australian Government. This report, an addition to RIRDC’s diverse range of over 1000 research publications, forms part of our New Plant Products R&D program, which aims to facilitate the development of new industries based on plants or plant products that have commercial potential for Australia. Most of our publications are available for viewing, downloading or purchasing online through our website:
• downloads at www.rirdc.gov.au/fullreports/index.html • purchases at www.rirdc.gov.au/eshop
Simon Hearn Managing Director Rural Industries Research and Development Corporation
iv
Acknowledgments Dr Michael Burr for advice and assistance with the selections. Dr Graham Jones for analysis of oil samples. Dr Graham Collins for advice with DNA fingerprinting. Dr Genet Mekuria, for work on the peacock spot resistance marker. Susan Sweeney for advice on the trial. Peter Cox for management of the trial site. Dr Andrew Granger for assistance with the selections. Dr Eduarda Cristovam-Forhaug for sensory analysis. Dr Jenny Guerin for DNA and field work. Dr Michelle Wirthensohn for DNA and field work. Professor Shimon Lavee for advice and provision of material from the breeding program in Israel. Providers of leaves for the DNA database: NOVA trial, University of Adelaide Roseworthy Campus; The Olive World Collection, Centro de Investigacion y Desarollo Agrario, Cordoba, Spain; The Volcani Centre, Bet-Dagan, Israel; CORIPROL, Pescia, Italy; Consiglio Nationale delle Ricerche, Instituto di Ricerca Sulla Olivicultura, Perugia Itlay; Foundation Plant Material Service, University of California, Davis, California, United States; Subtropical Plants and Olive Trees Institute of Chania Agrokipio, Chania, Greece; Jouve-Racamond Nursery, Avignon, France; Charles Sturt University Olive Collection. Contributors: Olives SA, Kangaringa Proprietors Pty. Ltd., BOS&S, Coralee Management Pty. Ltd., Comit Farm Produce, Agostino Group, Hastings Valley Olives, Australian Olives Association. Growers properties where feral trees have been planted: Grant Wylie and Frank Agostino at Keith, Frank Mitolo at Waikerie, Richard Whiting at Frances, Graeme and Kathy Booker at Wauchope NSW.
Abbreviations RAPD - random amplified polymorphic DNA PCR – polymerase chain reaction SCAR – sequence characterised amplified region NOVA – National olive variety assessment PBR – Plant breeders rights ANOVA – Analysis of variance
v
Contents Foreword ............................................................................................................................................... iii Acknowledgments................................................................................................................................. iv Abbreviations........................................................................................................................................ iv Executive Summary ............................................................................................................................. vi 1. Introduction ....................................................................................................................................... 1 2. Objectives ........................................................................................................................................... 3 3. Materials and Methods ..................................................................................................................... 4
3.1 Survey of feral olive populations in southern Australia. ............................................................... 4 3.2 Genetic characterisation ................................................................................................................ 5
4. Results ................................................................................................................................................ 7 4.1 Survey of feral olive populations in southern Australia ................................................................ 7 4.2 Identification of the best selections ............................................................................................... 9 4.3 Genetic characterisation .............................................................................................................. 10 4.4 Trial sites ..................................................................................................................................... 12
5. Discussion of the results .................................................................................................................. 15 5.1 Survey of feral olive populations in southern Australia .............................................................. 15 5.2 Identification of the best selections ............................................................................................. 15 5.3 Genetic characterisation .............................................................................................................. 16 5.4 Trial sites ..................................................................................................................................... 16
Executive Summary The aim of the project is selection of new improved cultivars from wild southern Australian material based on oil analysis, DNA fingerprinting, propagation and field trials. This will improve yield and quality for domestic and export markets, and provide quality assurance to the industry. Australia imports approximately 16,000 tonnes of olive oil and 7,000 tonnes of fruit per annum, valued at roughly $90 million and $20 million, respectively. It is generally accepted that about 95% of olive oil consumption is met by imports. The olive industry is now undergoing a renaissance, many of the old groves are being rejuvenated and planting of new groves is rapidly expanding. The Australian Olive Association Ltd was formed in 1994 with the aim of encouraging the sustained development of a national olive industry in Australia through research and dissemination of information. In line with this philosophy, we are undertaking an integrated program to meet the increasing demands of the industry. Despite the range of cultivars currently available, plant improvement programs are rated highly in all olive producing countries (Fontanazza and Baldoni 1990, Lavee 1990, Rallo, 1995, Trigui 1996) and new cultivars continue to benefit the industry. The primary aim is to select superior cultivars for oil production under Australian conditions and this involves a combination of research strategies. The approach is based on initial field selection and oil analysis to identify high yielding trees with high levels of oleic acid, conferring oxidative stability and health benefits. Superior trees are evaluated further by sensory evaluation and propagation. Molecular markers are used to determine family relationships and to develop a genetic fingerprint for each new genotype (Mekuria et al., 1999, Guerin et al., 2002). New superior selections are expected to be adapted to Australian conditions and will be evaluated against existing cultivars (Sedgley and Wirthensohn, 1999). The current project continues on from a previous RIRDC project No UA-41A also entitled ‘Wild Olive Selection for Quality Oil Production’. The survey of wild olive populations began in 1997 until 2001. New cultivars adapted to the Australian environment offer the potential for improvement in yield and quality for Australian olive products. Selected superior cultivars have been planted for evaluation at the University of Adelaide Roseworthy campus, adjacent to the National Olive Variety Assessment project trials. In the year 2000; 15 superior trees were identified out of 63 trees from 7 new populations that were surveyed, and 2 superior trees were revisited to take further samples to obtain multi year data for oil yield and fatty acid profiles. In 2001, one superior tree was identified from 5 trees from two new populations, and 48 superior trees were revisited to take further samples. In 2002 no new trees were sampled as many superior trees had already been identified since 1997. Ten trees were revisited for re-sampling. Cuttings from 49 trees that were identified as superior were propagated in the glasshouse, and strike rates from each tree were calculated. The strike rates varied from 0% to 100% with a mean of 42% showing that there is likely to be significant genetic control over the rooting ability of cuttings. Oil yield and composition was obtained from the newly surveyed trees and the superior trees that were revisited. Oil yields ranged from 8.5 to 28.5% in the trees in the 8 new populations surveyed. Fatty acid profiles varied from 42.9 to 85.3 % oleic acid, and 0.4 to 1.3 % linolenic acid. Oil was extracted from 30 fruit samples in 2001 using the mini extraction unit, and tested by an organoleptic panel. ANOVA showed that the panel members found that the green grassy character and pungency varied significantly between samples.
vii
DNA fingerprints of all the selected superior ferals were generated using RAPD-PCR. The fingerprints were compared with those of 79 DNA samples from the database housed in the Discipline of Wine and Horticulture (Guerin et al., 2002). The database contains standard samples of olive cultivars from several international collections and includes the majority of known varieties that have been planted in Australia. None of the feral trees had a 100% match with any of the known varieties, indicating that the new selections are novel genotypes. RAPD-PCR analysis was also conducted on all propagated material to ensure that propagules were derived from the correct mother tree. Up to 12 cuttings from each of the 35 final selected trees were fingerprinted to ensure genetic consistency between the replicate trees and the original tree sampled. The STS marker for peacock spot resistance ( Mekuria et al., 2002) was found in the known cultivars ‘Koroneiki’ and ‘Leccino’, that are reputedly resistant to olive leaf spot, but was absent in ‘Barouni’ and ‘Mission’, reported to be susceptible (Anon, 1996). The STS marker was applied to the superior feral selections as described in the methods and was found in 19 out of the 35 selected ferals, indicating that more than half of the selected trees are likely to be resistant to Peacock Spot disease. The feral trial was planted in September 2002 at the University of Adelaide Roseworthy Campus. The young plants were watered several times to ensure good establishment after planting and will receive seasonal irrigation and fertigation schedules depending on the requirements of the plants. Height and diameter measurements were taken in November 2003. The fastest growing cuttings were taken from population 1, 6, 10, 13 and 19. The shortest cultivars were from population 4. In conclusion the range of the oil characters tested in all the trees surveyed since 1997 is very wide. For example the oil yields at 50 % moisture vary from as low as 1.7% to as high as 33.4% and oleic acid varies from 40.9% to 87.7%. These data show that the feral populations are highly heterogeneous and are a valuable source of material for selecting new cultivars. Feral trees with superior oil characters have been retested over several seasons, and the results are generally consistent across years, indicating that these characters are mainly determined by genotype. The mean values of the % oil and % oleic acid levels did not differ significantly between years when analysed using the T-Test. However, it is necessary to evaluate the performance of clonal propagules from these trees to assess these potential new cultivars both under cultivation and in different environments. Benefits to the industry arising from the olive program include improved planting material, quality assurance services and continuing research and development into production technology. The development of techniques for DNA analysis, oil chemistry analysis, propagation and assessment of the extent of variation amongst the feral olive populations in South Australia, also offer significant support to the industry.
viii
1
1. Introduction The olive tree, Olea europaea, has been part of Mediterranean civilisation since before recorded history, and is thought to have been cultivated and traded for its oil by Semitic people in Syria as early as 3000 B.C., or possibly even earlier (Zohary, 1994). Cultivation is assumed to have spread northward from Syria into Turkey and to Greece, southward into Egypt, through North Africa to southern Spain, and later, Italy. Olive cultivation commenced in Australia around the beginning of the 19th century with the importation of over 60 cultivars to the new colony being developed in New South Wales and South Australia (Hobman, 1993). Olive groves were subsequently established around the city of Adelaide and in the surrounding foothills. However, many of these were abandoned by the 1960s as a result of the removal of government support and competition with low priced imported oils. These early plantings provided the seed bank for the spread of olives outside their original groves and new populations have emerged via sexual reproduction and seed dispersal. These trees are termed ‘feral’ as they are derived from cultivated varieties that have escaped into the surrounding suburban and bushland areas. Olives are predominantly outcrossing and, after years of random cross pollination, a unique population containing a diverse gene pool has developed in southern Australia. Furthermore, the feral trees are adapted to their local surroundings from growing under selective environmental conditions rather than in cultivation (Sedgley and Wirthensohn, 2000). Adelaide is located at latitude of 35°S, which is roughly equivalent, in the northern hemisphere, to Los Angeles in the USA, Tunis in Tunisia, and Tripoli in Lebanon. The “Mediterranean” climates in these areas are characterised by winter temperatures that are relatively mild, yet able to satisfy the vernalisation requirement of olives, and summer temperatures that are hot and provide the long ripening period necessary for maximum oil accumulation in the fruit. The success of the olive in South Australia is evident as it has now been declared an invasive weed and eradication programs have commenced to remove trees from native bushland areas. Today Australia imports approximately 16,000 tonnes of olive oil and 7,000 tonnes of fruit per annum, valued at roughly $90 million and $20 million, respectively. It is generally accepted that about 95% of olive oil consumption is met by imports. The olive industry is now undergoing a renaissance, many of the old groves are being rejuvenated and planting of new groves is rapidly expanding. The Australian Olive Association Ltd was formed in 1994 with the aim of encouraging the sustained development of a national olive industry in Australia through research and dissemination of information. In line with this philosophy, we are undertaking an integrated program to meet the increasing demands of the industry. Despite the range of cultivars currently available, plant improvement programs are rated highly in all olive producing countries (Fontanazza and Baldoni 1990, Lavee 1990, Rallo, 1995, Trigui 1996) and new cultivars continue to benefit the industry. The primary aim is to select superior cultivars for oil production under Australian conditions and this involves a combination of research strategies. The approach is based on initial field selection and oil analysis to identify high yielding trees with high levels of oleic acid, conferring oxidative stability and health benefits. Superior trees are evaluated further by sensory evaluation and propagation. Molecular markers are used to determine family relationships and to develop a genetic fingerprint for each new genotype (Mekuria et al., 1999, Guerin et al., 2002). New superior selections are expected to be adapted to Australian conditions and will be evaluated against existing cultivars (Sedgley and Wirthensohn, 1999). Genetic diversity within and between plant populations results from a combination of geographical distance, population size, type of mating system (selfing or outcrossing), mode of dispersal of pollen and seed, and rate of gene flow (Loveless and Hamrick, 1984). The mating system of plants appears to play a major role in genetic diversity by determining the rate of exchange of genes (Darmency, 1997). Species that are predominantly outcrossing are reported to show lower interpopulation and higher
2
intrapopulation differences in genetic variation compared to species where self-fertilisation predominates (Maguire and Sedgley, 1997). Olives are predominantly allogamous, indicating that a wide range of genotypes, and consequent phenotypes, would be observed both within and between the feral olive populations. The outcrossing behaviour of olive trees leads to high levels of heterozygosity and DNA polymorphism among individuals (Angiolillo et al., 1999; Rallo et al., 2000). To avoid segregation of positive characters through sexual reproduction, cultivars are clonally propagated so that, barring somatic mutation, propagules will be genetically identical to the mother tree. The use of DNA markers is a practical method of cultivar identification given the levels of DNA polymorphism among cultivars and the genetically stable methods of propagation. The random amplified polymorophic DNA (RAPD) technique has previously been used to successfully distinguish between olive cultivars (Guerin et al., 2002; Belaj et al., 2001; Besnard et al., 2001; Fabbri et al., 1995; Mekuria et al., 1999; Sanz-Cortés et al., 2001; Weisman et al., 1998). A small number of RAPD bands have been shown to be effective in discriminating among olive cultivars with a low rate of confusion (Besnard et al., 2001). Cultivar identification is now a routine practice in our laboratories using DNA fingerprinting by RAPD analysis (Guerin et al., 2002). An olive DNA database has been compiled, including cultivars from several international and Australian collections that are used as reference standards. DNA fingerprinting is a useful tool to confirm genetic uniqueness and consistency of new cultivars selected from our program. To improve the utility of random amplified polymorphic DNA (RAPD) markers in breeding programs, Paran and Michelmore (1993) developed sequence characterised regions (SCARs) by using longer and more specific primers developed from the sequences of the RAPD fragments. These longer primers generate a sequence-tagged site (STS) as described by Olson et al. (1989). Such markers have been developed for disease resistance in many plant species, such as downy mildew resistance in lettuce (Paran and Michelmore 1993), and Phytophthora resistance in strawberry (Haymes et al. 2000). Using bulked segregant analysis (BSA), a RAPD marker linked to resistance to olive leaf spot disease was identified (Mekuria et al. 2001) using DNA from a segregating population obtained from a breeding program in Israel. The development of specific primers to generate an STS linked to leaf spot in olives was based on that RAPD marker (Mekuria et al., 2002). Olive leaf spot, peacock spot, peacock eye, and bird’s eye spot are alternative names for the same disease caused by the pathogen, Spilocea oleaginea (syn. Cycloconium oleaginum Cast.) (Ogawa and English 1991). The disease has been recorded in all Mediterranean olive-growing countries since the mid 1800s, and it has been recognised as the most important leaf disease of olives in China, California, South Africa, South America, and Australia (Hughes 1953; Ogawa and English 1991). The pathogen attacks mainly leaves, producing lesions and circular spots on the upper surfaces, but in rare cases fruits and fruit stems may also be attacked (Shabi et al. 1994). The lesions first appear as small sooty blotches, and later develop into dark green to black circular spots, which, if numerous, result in leaf yellowing and abscission (Ogawa and English 1991). Because most infected leaves fall prematurely, small branches weaken and subsequently die, resulting in a marked reduction in both flower bud differentiation and fruit set in subsequent years (Shabi et al. 1994). Hartmann (1957) reported that in California, some trees have been reduced in yield by as much as 20% due to partial defoliation of leaves caused by S. oleaginum. A complete loss of yield of some sensitive cultivars can occur under extreme inductive climatic conditions (Lavee et al. 1999). The olive leaf spot resistance marker will assist in the selection of disease resistant cultivars, especially in more humid areas. The current project continues on from a previous RIRDC project No UA-41A also entitled ‘Wild Olive Selection for Quality Oil Production’. The survey of wild olive populations began in 1997 until 2001. New cultivars adapted to the Australian environment offer the potential for improvement in yield and quality for Australian olive products. Selected superior cultivars have been planted for
3
evaluation at the University of Adelaide Roseworthy campus, adjacent to the National Olive Variety Assessment project trials.
2. Objectives The aim of the project is selection of new improved cultivars from wild southern Australian material based on oil analysis, DNA fingerprinting, propagation and field trials. This will improve yield and quality for domestic and export markets, and provide quality assurance to the industry.
4
3. Materials and Methods 3.1 Survey of feral olive populations in southern Australia. The collaborators involved in this part of the project were Michael Burr, Margaret Sedgley, Andrew Granger, Michelle Wirthensohn and Jenny Guerin. Collections were made from 472 feral trees from 28 populations during the years 1997–2002. Two regimes of sampling were followed. Firstly the size of the population was measured with respect to distance across the population, and one tree was sampled at every tenth of the total distance, and secondly, any trees with apparent potential on the basis of crop load, fruit size and tree habit were also sampled. All trees were tagged and their location noted by recording GPS coordinates. Samples taken included leaf material for DNA analysis, cuttings for propagation, and fruit for oil analysis. The physical condition of the tree was also noted including crop load, leaf colour, tree habit, presence of shot berries, and presence of disease or insect infestation. Superior trees were selected on the basis of their oil qualities, with trees showing high oil content of the fruit (>18%) and high oleic acid content in the fatty acid profile (>70%) selected for further investigation. A large number of superior trees were identified in the years between 1997 and 1999 as reported in RIRDC publication No 00/116 RDC project No UA-41A. Consequently, in the years between 2000 and 2002 the focus was on re-sampling these superior trees as well as identifying new superior trees.
3.1.1 Propagation Leafy stemmed cuttings approximately 12-15 cm long were taken from 1-2 year old wood from the selected feral trees. Growing tips were removed and leaves stripped except for the top 2-3 pairs. The bottom end of the cuttings were cut beneath a node and wounded before dipping in ‘Clonex Purple’ containing indole butyric acid at 300 ppm. The stems were then inserted in to a moistened mix containing 50% perlite and 50% vermiculite and kept in a mister unit, covered in shade cloth, with water sprayed for 10 sec every hour from 9am to 9pm. When roots appeared at the bottom of the pot, usually within 6-12 weeks, the cuttings were transferred to ‘Nu earth Premium’ potting mix into 0.8L capacity olive pots. Strike rates were recorded as the percent of rooted cuttings at the time of potting into soil.
3.1.2 Oil content and quality Graham Jones supervised the chemical analysis of the oils obtained from fruit samples from the trees surveyed. Oil yields were determined by Soxhlet extraction and oil composition was measured by gas chromatography (IOOC, 1999; American Oil Chemistry Society, 1978). Trees were deemed ‘superior’ when fruit samples had oil yields greater than 18%, calculated at 50% moisture, oleic acid levels greater than 70% and linolenic acid levels less than 1%. Principal component analysis of the oil parameters tested was done with the software NTSYS pc ver. 2.02k (Applied Biostatistics Inc., Setauket, N.Y.). 3.1.3 Sensory evaluation Eduarda Cristovam-Forhaug and Jenny Guerin organised the tasting panel comprising staff and students of the Discipline of Wine and Horticulture, Susan Sweeney from PIRSA and Michael Burr. Three of the eight participants were members of the Australian Olive Association organoleptic panel at the time of the analysis.
5
Approximately 100 mL oil from selected superior ferals was used for organoleptic assessment. The oils were extracted from 1.0–1 .5 kg of freshly picked fruit using a mini extraction unit by crushing with a hammer mill, malaxation for 30 min at 30°C followed by 5 min centrifugation. Oils were filtered through cotton wool, then layered with carbon dioxide to reduce oxidation and stored at 4°C in tightly capped amber bottles until use. Sensory analysis was conducted in the University of Adelaide sensory laboratory by a panel of eight judges who had undergone training to identify positive flavour characters in extra virgin olive oil. The oils were scored between 0 and 5 for intensity in aroma and taste of grassy flavour, olive fruit, apple, other fruit flavours, bitterness and pungency. A zero rating indicated that the character was not detected and a rating of five indicated that the character was extremely strong.
3.2 Genetic characterisation Genet Mekuria, Michelle Wirthensohn, Jenny Guerin, Graham Collins and Margaret Sedgley were involved in the molecular analyses of the feral selections. Genet Mekuria and Graham Collins in collaboration with Shimon Lavee from the Voclani Institute , Israel, identified the peacock spot resistance marker using bulked segregant analysis. 3.2.1 DNA fingerprinting DNA extraction Leaf material (200 mg) was ground to a fine powder in liquid nitrogen, extracted with 500 µL of extraction buffer (3% (w/v) cetyltrimethyl ammonium bromide; 1.4 M NaCl; 0.1 M EDTA pH 8.0; 1 M Tris HCl pH 8.0), and incubated at 60°C for 30 min, with occasional gentle mixing. The sample was then mixed with 500 µL of chloroform/isoamyl alcohol (24:1) for 10 min at room temperature before centrifugation at 8000 rpm for 20 min. The aqueous layer was precipitated with 2/3 vol of cold isopropanol, and the DNA spooled with a fine glass rod and washed at least three times in 1 mL aliquots of wash buffer (76% ethanol; 10 mM NH4 acetate). The DNA was dissolved in 100 µL of TE buffer and RNA was removed by adding 10 µg RNase A (DNase-free) (AMRESCO® Solon, United States) and incubating at 37°C for 30 min. Residual proteins were removed by adding NH4 acetate to a final concentration of 2.5 M, incubating on ice for 20 min (Crouse & Amorese, 1987), and centrifuging at 14,000 rpm for 20 min. DNA was recovered after precipitation with cold ethanol, and dissolved in 100 µL TE buffer. The purity of the DNA was evaluated by measuring the absorbances at 230, 260, and 280 nm, and calculating the ratios of the absorbance at 260:280 and 260:230. DNA samples used had absorbance ratios greater than 1.8.
RAPD Analysis RAPD bands were generated using PCR in a volume of 20 µL containing 40 ng genomic DNA, 1.5 mM MgCl2, 0.3 µM 10-mer oligodeoxynucleotide primer, 200 µM each of dGTP, dATP, dTTP, dCTP, 1 x PCR Buffer (10 mM Tris HCl pH 8.3; 50 mM KCl; 0.001% (w/v) gelatine) and 0.6 units Taq DNA polymerase (Life Technologies, United States) and overlaid with paraffin oil. Negative controls, with genomic DNA omitted, were run with every PCR to check for DNA contamination. The PCR program was as reported by Collins and Symons (1993). PCR reactions were carried out, in duplicate, with the six random 10-mer primers used by Mekuria et al. (1999).
6
Amplified fragments were separated by electrophoresis at 200 V on 1.75% (w/v) agarose gels, and visualised under UV light after staining with ethidium bromide (400 µg/L). Verification of replicate feral cuttings To confirm genetic consistency within the replicate trees of the selected superior ferals, the PCR products obtained from a bulked DNA sample, containing 8 ng of genomic DNA from each of the replicate trees, were compared on the same gel with those obtained from the DNA (40 ng) from the remaining replicate of that cultivar. Comparison between DNA from superior feral selections and standard cultivars The presence and absence of bands on the gels was recorded using Gelpro 32 (Media Cybernetics, Maryland, United States), and translated to a binary matrix by allocating 1 or 0 for the presence and absence of bands, respectively. Genetic similarities among all pairs of individuals were estimated using the simple matching coefficient (Sokal and Michener, 1958) as described in Apostol et al. (1993). Cluster analysis was performed on the estimated similarities using the unweighted pair group method with arithmetic average (UPGMA) and the SAHN algorithm, and the resulting clusters were expressed as a dendrogram using NTSYS-pc (Exeter Software v.1.8) (Rohlf, 1993). 3.2.2 Peacock spot resistance marker DNA was extracted from olive leaves of trees identified as susceptible or resistant to the disease obtained from an olive breeding program at the Volcani Center, Israel (Mekuria et al., 2001). RAPD-PCR and bulked segregant analysis were used to identify molecular markers linked to the disease. DNA was prepared from 13 progeny showing tolerance and also from 13 progeny showing susceptibility for the disease. One primer produced a polymorphic band of 780 bp that appeared in 70.6% of the segregating progeny and 100% of resistant parents (Mekuria et al., 2001). A sequence-tagged site, developed from the 780 bp marker, was tested against individuals from the population segregating for resistance, and commercial olive cultivars showing various levels of resistance to the pathogen. The STS marker was present in 71.4% of the resistant parents and progeny, and was absent in 87% of the parents and progeny showing susceptibility (Mekuria et al., 2002).
7
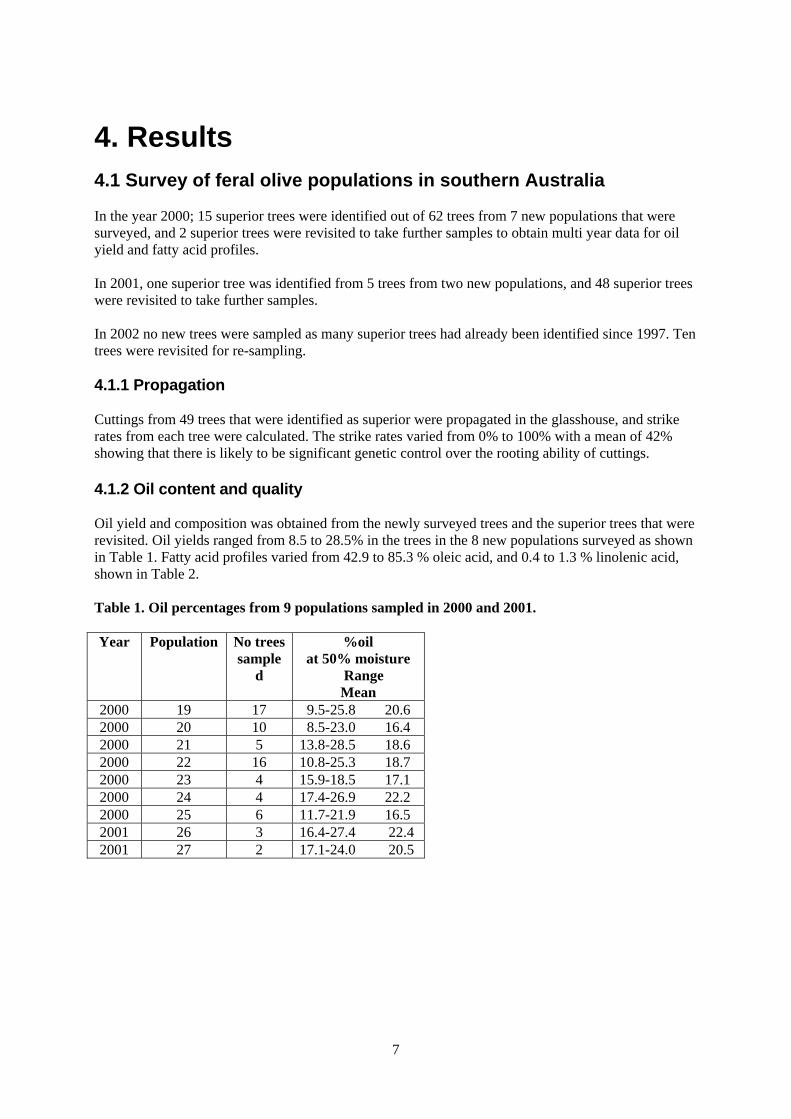
4. Results 4.1 Survey of feral olive populations in southern Australia In the year 2000; 15 superior trees were identified out of 62 trees from 7 new populations that were surveyed, and 2 superior trees were revisited to take further samples to obtain multi year data for oil yield and fatty acid profiles. In 2001, one superior tree was identified from 5 trees from two new populations, and 48 superior trees were revisited to take further samples. In 2002 no new trees were sampled as many superior trees had already been identified since 1997. Ten trees were revisited for re-sampling. 4.1.1 Propagation Cuttings from 49 trees that were identified as superior were propagated in the glasshouse, and strike rates from each tree were calculated. The strike rates varied from 0% to 100% with a mean of 42% showing that there is likely to be significant genetic control over the rooting ability of cuttings. 4.1.2 Oil content and quality Oil yield and composition was obtained from the newly surveyed trees and the superior trees that were revisited. Oil yields ranged from 8.5 to 28.5% in the trees in the 8 new populations surveyed as shown in Table 1. Fatty acid profiles varied from 42.9 to 85.3 % oleic acid, and 0.4 to 1.3 % linolenic acid, shown in Table 2. Table 1. Oil percentages from 9 populations sampled in 2000 and 2001. Year Population No trees
4.1.3 Sensory evaluation Oil was extracted from 30 fruit samples in 2001 using the mini extraction unit, and tested by an organoleptic panel as described in the methods. ANOVA showed that the panel members found that the green grassy character and pungency varied significantly between samples. When the mean values scored from the panel for any given characters were over 2 (the level where the flavours were perceived as slight) that character was listed as a sensory attribute in the summary pages in appendix 1. The mean values for each of the characters scored are shown in Table 3. Table 3. Mean values from the sensory panel scores for each of the oils tested in 2001.
4.2 Identification of the best selections On the basis of the oil yield, fatty acid profile, morphological observations and sensory analysis of the trees surveyed, 35 were selected to be planted in the trial. The trees were selected from 9 populations shown in Table 4, spanning from Kangaroo Island to the Clare Valley Region. Figure 1 shows the principal component analysis of the data collected from all the feral trees, including oil yield and levels of the fatty acids. In part A it is shown that the oil yield and oleic acid levels accounted for the majority of the variation in the samples. Part B shows the data plotted over the loadings separating the trees with the highest oil yield and oleic acid levels to be in the upper right hand quadrant of the graph. Trees from this region were identified as the most superior trees, having both high yield and oleic acid levels. Table 4. Populations that the trees for the trial were selected from. Population No
Population Location
No trees
1 Barossa Valley 4 3 Clare Valley 4 4 Kangaroo Island 12 5 McLaren Vale 1 2 6 Mintaro 2
Total 35 Figure 1. Principal component analysis of the oil yield and fatty acid data for: palmitic, palmitoleic, stearic, oleic, linoleic and linolenic acid obtained from all the feral trees surveyed. A) shows that the oil yield and % oleic acid levels are the most important parameters in the variation between the samples. Palmitoleic acid, Strearic acid and Linolenic acid levels overlie each other close to the zero point. B) shows the data from individual trees plotted with the loadings with groupings based on oil yield. Each number represents a tree.
10
4.3 Genetic characterisation 4.3.1 DNA fingerprinting DNA fingerprints of all the selected superior ferals were generated using RAPD-PCR as described in the methods. The fingerprints were compared with those of 79 DNA samples from the database housed in the Discipline of Wine and Horticulture (Guerin et al., 2002). The database contains standard samples of olive cultivars from several international collections and includes the majority of known varieties that have been planted in Australia. Figure 2 shows that none of the feral trees had a 100% match with any of the known varieties, indicating that the new selections are novel genotypes. RAPD-PCR analysis was also conducted on all propagated material to ensure that propagules were derived from the correct mother tree. Up to 12 cuttings from each of the 35 final selected trees were fingerprinted to ensure genetic consistency between the replicate trees and the original tree sampled. 4.3.2 Peacock Spot Resistance Marker The STS marker for peacock spot resistance ( Mekuria et al., 2002) was found in the known cultivars ‘Koroneiki’ and ‘Leccino’, that are reputedly resistant to olive leaf spot, but was absent in ‘Barouni’ and ‘Mission’, reported to be susceptible (Anon, 1996). The STS marker was applied to the superior feral selections as described in the methods and was found in 19 out of the 35 selected ferals, indicating that more than half of the selected trees are likely to be resistant to Peacock Spot disease. Figure 3 shows the presence and absence of the STS marker in resistant and susceptible trees obtained from the Volcani Insitute. The presence or absence of the marker for each of the trees is recorded in the summary pages in appendix 1.
B
11
Figure 2. Dendrogram showing the genetic relationships between the selected superior feral trees (bold type) and known cultivars from the olive DNA database. DNA samples in the database were obtained from leaves sourced from the following collections: NOVA, University of Adelaide Roseworthy Campus; Spain, The Olive World Collection, Centro de Investigacion y Desarollo Agrario, Cordoba, Spain; Israel, The Volcani Centre, Bet-Dagan, Israel; Italy, CORIPROL, Pescia, Italy or Consiglio Nationale delle Ricerche, Instituto di Ricerca Sulla Olivicultura, Perugia Itlay; USA and Mexico, Foundation Plant Material Service, University of California, Davis, California, United States; Greece, Subtropical Plants and Olive Trees Institute of Chania Agrokipio, Chania, Greece; France, Jouve-Racamond Nursery, Avignon, France; Wagga, Charles Sturt University Olive Collection NSW Australia; Australia, nurseries and groves within Australia.
Genetic Similarity0.50 0.67 0.83 1.00
177 NOVAVerdale Italy Amelon NOVADel Morocco NOVA Dr Fiasci NOVA Benito NOVAVerdale USA Institute NOVAPigale Wagga Rouget NOVAFS17 NOVALarge Pickling NOVA Tanche Nuons France 13-008 Large Fruiting NOVA Longue d'Ascoli NOVA Picholine Australia Manaki NOVA 26-001 Barouni NOVA01-001 04-P002 04-P001 16-P004 Praecox NOVAArbequina NOVA04-012 05-004 04-019 Rougette France Pendulina Australia 04-033 Regalaise de Languedoc NOVA Ascolano USA Verdale France Souri Israel Large Fruited NOVA Pendulina Australia Pigale NOVA19-008 Hojiblanca Spain Azapa NOVAManzanilla de Sevilla Spain Manzanilla de Prieta Spain Frantoio ItalyKoreneiki GreecePicholine France04-050 04-021 04-036 04-037 Queen of Spain NOVA 19-021 01-010 04-015 03-012 04-017 03-006 06-009 03-011Rubra Baillon d'Aise NOVA Hardys Mammouth Australia Leccino IsraelPicholine Wagga04-016 03-001 Atro Violacea NOVA Blanquette NOVA Blanquetta Spain Volos NOVABarnea Israel Black Italian Australia Ligurian AustraliaCoratina Spain 10-005 Amelon WaggaOblonga NOVAPicholine Wagga UC13A6 NOVAColumella NOVAPendolino Spain Picual Spain Manzanilla de Jaen Spain 13-006 Mission USA Solonenque France Oblitza NOVANocellara Belice Israel Nocellara Etnea Israel 16-P005 01-005 Verdale Israel Buchine NOVAPicholine Israel Pecholine Italy Lucque France 19-004 Kalamata Israel Katsourella Australia Sevillano Israel Tarascoa Wagga Katsourella NOVAAreccuzo NOVA35 AtroRubens NOVA Nevadillo Blanco USA 19-005 06-008 Jumbo Kalamata NOVA Bouquettier NOVAVerdale USA01-006 Mission Mexico 05-010 10-003
12
Figure 3. STS marker (arrow) amplified and separated on 3% agarose. DNA samples were taken from resistant (R) or susceptible (S) trees. R R R R R R R R S S S S S S S S
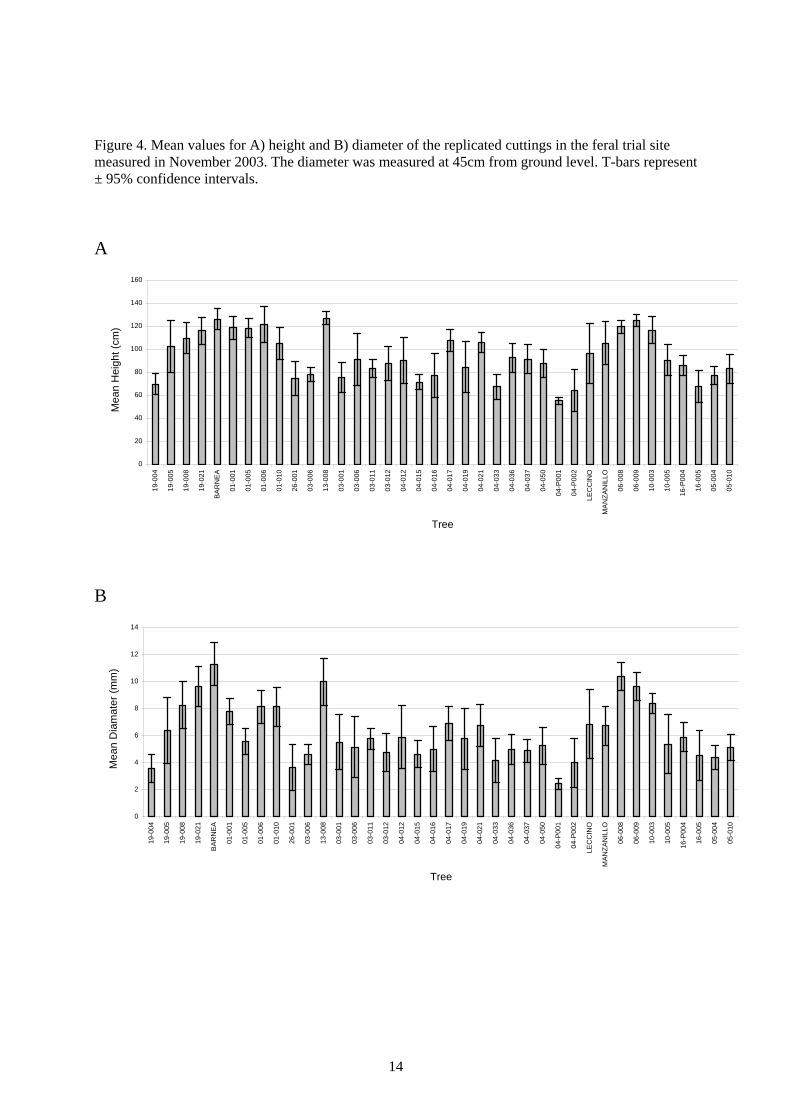
4.4 Trial sites 4.4.1 Roseworthy site The major trial site is at the Roseworthy Campus of the University of Adelaide, situated 50 km north of Adelaide (-34°52'S, 138°69'E). The site is adjacent to the National Olive Variety Assessment trial, established by Susan Sweeney of Primary Industries and Resources of South Australia, which contains accessions of 53 different cultivars. The soil type, climate and management of the trees are similar to those described in the RIRDC report No 03/054. The trial plot accommodates 300 trees in an array of 30 rows by 10 columns. The planting plan was designed in collaboration with the biometricians at the university to include 8 cuttings of 35 selected ferals and three known varieties. The dimensions of the field layout make it impossible to allocate 38 cultivars equally. Therefore, 34 trees were replicated 8 times and 4 trees were replicated 7 times. A row-column design was chosen because of its flexibility and the added advantage of enabling nearest neighbour properties to be included (i.e. ensuring that no two trees occur as neighbours more than once). Furthermore the design eliminates the effects of the row and column factors. The planting plan was generated using the computer program SpaDes. For the 4 varieties with only 7 replicates we used the three known olive varieties and one of the feral trees as shown in Table 5. Details of the trial design were discussed with the Plant Breeders Rights Office, Canberra, and a copy of the planting plan was lodged with the PBR office. The feral trial was planted in September 2002 at the University of Adelaide Roseworthy Campus. The young plants were watered several times to ensure good establishment after planting and will receive seasonal irrigation and fertigation schedules depending on the requirements of the plants. Figure 4 shows height and diameter measurements taken in November 2003. The fastest growing cuttings were numbers 001, 005 and 006, taken from population 1, 008 and 009 from population 6, 003 from population 10, 008 from population 13 and 005, 008, 021 from population 19. The known cultivars, Barnea, Manzanillo and Leccino were also among the tallest trees recorded. The shortest cultivars were 033, P001 and P002 from population 4, and P005 from population 16. 4.4.2 Trials on growers properties Eighty trees were divided equally between 4 properties within South Australia (Waikerie, Frances, and 2 properties at Keith), and 20 were sent to Wauchope NSW. The trees were planted in the spring of 2002 and records containing details of soil type, irrigation schedules and progress of the trees are kept on file at the University. Property owners have signed a Material Transfer Agreement with the University of Adelaide to avoid breaches to the requirements of PBR. A further 60 trees are ready to be distributed between 3 properties in QLD.
13
Table 5. Trial Design for the for the superior feral selections planted at the Roseworthy site.
Figure 4. Mean values for A) height and B) diameter of the replicated cuttings in the feral trial site measured in November 2003. The diameter was measured at 45cm from ground level. T-bars represent ± 95% confidence intervals. A
0
20
40
60
80
100
120
140
160
19-0
04
19-0
05
19-0
08
19-0
21
BA
RN
EA
01-0
01
01-0
05
01-0
06
01-0
10
26-0
01
03-0
06
13-0
08
03-0
01
03-0
06
03-0
11
03-0
12
04-0
12
04-0
15
04-0
16
04-0
17
04-0
19
04-0
21
04-0
33
04-0
36
04-0
37
04-0
50
04-P
001
04-P
002
LEC
CIN
O
MA
NZA
NIL
LO
06-0
08
06-0
09
10-0
03
10-0
05
16-P
004
16-0
05
05-0
04
05-0
10
Tree
Mea
n H
eigh
t (cm
)
B
0
2
4
6
8
10
12
14
19-0
04
19-0
05
19-0
08
19-0
21
BA
RN
EA
01-0
01
01-0
05
01-0
06
01-0
10
26-0
01
03-0
06
13-0
08
03-0
01
03-0
06
03-0
11
03-0
12
04-0
12
04-0
15
04-0
16
04-0
17
04-0
19
04-0
21
04-0
33
04-0
36
04-0
37
04-0
50
04-P
001
04-P
002
LEC
CIN
O
MA
NZA
NIL
LO
06-0
08
06-0
09
10-0
03
10-0
05
16-P
004
16-0
05
05-0
04
05-0
10
Tree
Mea
n D
iam
ater
(mm
)
15
5. Discussion of the results 5.1 Survey of feral olive populations in southern Australia The extent of the survey since 1997 is summarised in Table 6. The data show that approximately 14 % of trees surveyed were deemed superior. Approximately half of these were selected for further testing in the trial site at Roseworthy. Table 6. Summary of the feral survey from 1997-2001. Year Populations Trees Superior Trees 1997 - 121 10 1998 10 188 20 1999 8 95 20 2000 7 62 15 2001 2 5 1 Total 27 471 66 The range of the oil characters tested in all the trees surveyed since 1997 is very wide. For example the oil yields at 50 % moisture vary from as low as 1.7% to as high as 33.4% and oleic acid varies from 40.9% to 87.7%. These data show that the feral populations are highly heterogeneous and are a valuable source of material for selecting new cultivars. Feral trees with superior oil characters have been retested over several seasons, and the results are generally consistent across years, indicating that these characters are mainly determined by genotype. Table 7 shows data collected in repeated years for 35 superior trees from 10 southern Australian populations. The mean values of the % oil and % oleic acid levels did not differ significantly between years when analysed using the T-Test. However, it is necessary to evaluate the performance of clonal propagules from these trees to assess these potential new cultivars both under cultivation and in different environments. Table 7. Summary of data collected for 35 superior feral trees, over two seasons showing the means and 95% confidence intervals of % oil at 50% moisture, and % oleic acid.
Year 1 % Oil % Oleic Year 2 % Oil % Oleic
Mean 24.4 ± 1.1 73.8 ± 2.3 Mean 23.2 ± 2.2 73.1 ± 2.3
Sensory analysis of the oils identified a range of detectable fruit flavours including green apple, citrus, melon, green banana, pineapple, passionfruit and kiwifruit. Several of the oils also scored highly for bitterness and pungency, indicating that they may have a useful role for blending with oils lacking these qualities. However, cultivation and extraction under commercial conditions may alter the flavour profiles of the feral oils. These effects will be investigated further when propagules of the selections begin to bear in the selection trial. 5.2 Identification of the best selections The majority of trees selected for the trial had reproducible results showing high oil yield and levels of oleic acid. However, seven out of the thirty-five selected trees did not meet the requirements for either oleic acid level or oil yield but were included in the trial for other desirable traits. 26-001 was included for an aromatic, tropical fruit sensory profile and predicted tolerance to saline coastal conditions, 19-021 for large fruit that hangs on a long peduncle with low fruit removal force, likely to be suitable for
16
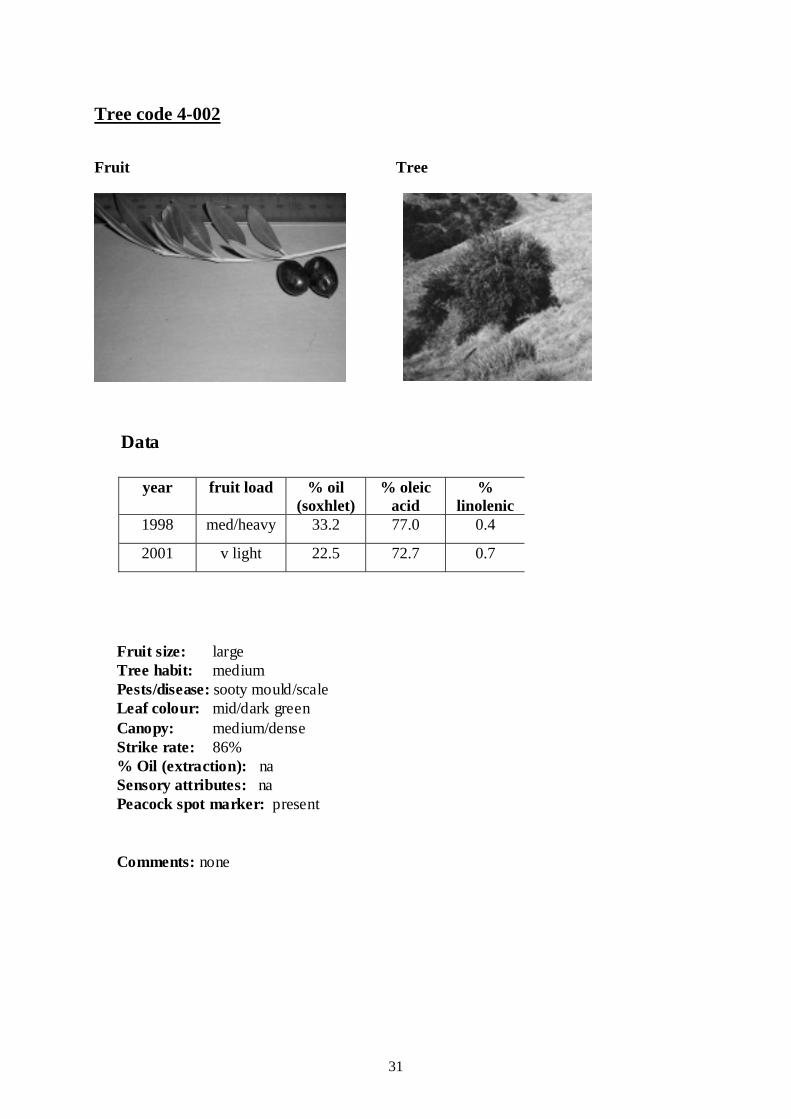
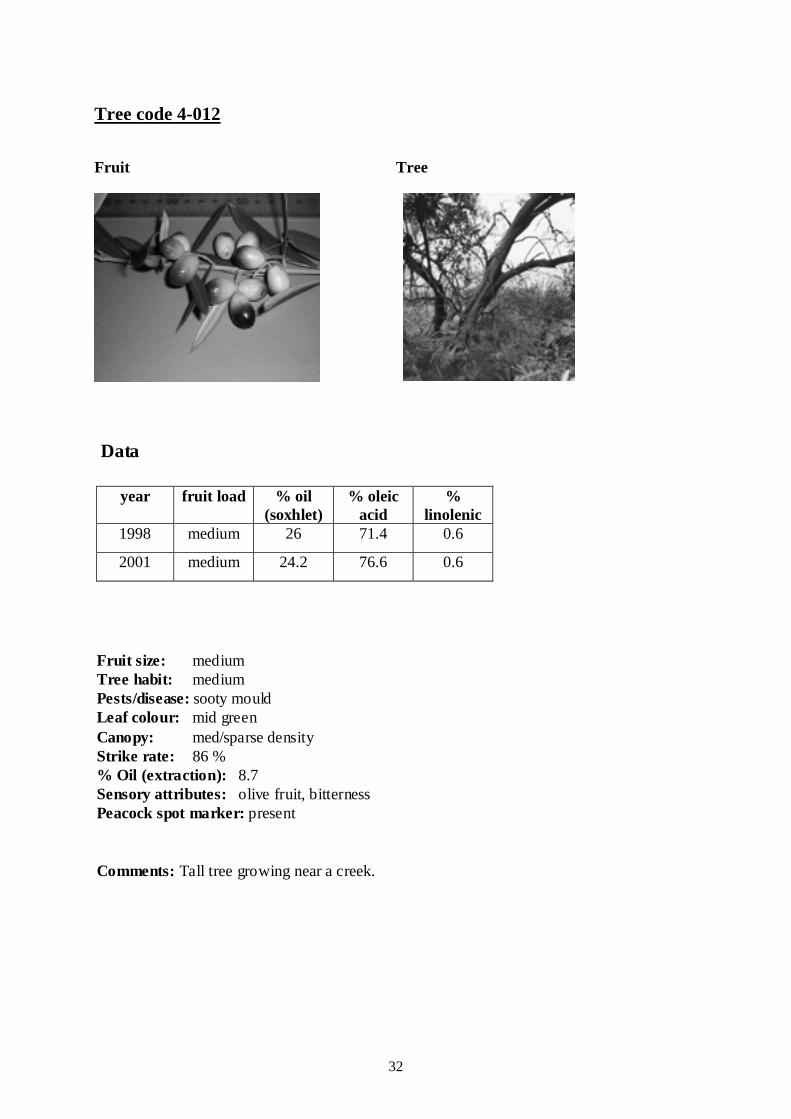
mechanised harvesting techniques, and 5-004, 19-004 and 4-012 as they bore medium to large fruit with a high oil content. 1-001 and 5-010 were included as extra comparators for their populations that may be necessary for the application of Plant Breeders Rights. At least two trees from each population that have close morphological characters have been planted. These trees will be used as comparators for Plant Breeders Rights applications. Three known varieties are also included in the trial with three distinct types of fruit, which may also be used as comparators if they more closely resemble the candidate tree. We propose to use morphological traits and DNA fingerprinting to establish distinctness from the closest comparators. While the current focus of the program is on oil quality, the selections with large fruit will be investigated in the future for table olive potential. The availability of this diverse gene pool coupled with techniques developed to analyse the agronomic performance of selected new cultivars is a powerful combination for research into new cultivars for Australia. 5.3 Genetic characterisation The DNA fingerprinting methods and the olive DNA database developed in our laboratories were invaluable tools for this project. The database was used as a reference to determine the relationship between the superior feral trees and known cultivars planted in Australia (Figure 2). This comparison was important to ensure that the trees selected from the feral populations were genetically distinct from the known cultivars. Another purpose of the DNA fingerprinting was to determine that the propagules were identical to each other and to the selected mother tree, ensuring that no errors in tree identity occurred during propagation. In this study, the genetic variation between the cultivars was described by scoring 37 RAPD markers from four primers. The number of RAPD markers and primers used to distinguish between olive varieties varies between reports. Sanz-Cortés et al. (2001) used 34 markers generated by 18 primers to distinguish 40 genotypes, Besnard et al. (2001) used 45 RAPD markers from 8 primers for 102 cultivars and Belaj et al. (2001) found that 20 bands from 4 primers allowed the identification of 51 cultivars. A conservative approach to marker selection was adopted in this study and only bands that were strongly amplified and highly reproducible were scored. This was necessary to circumvent the difficulties in obtaining consistent reproduction of minor bands. Although many of the minor bands were disregarded, it was found that the bands scored were sufficient to distinguish between cultivars and good reproducibility of the fingerprints was observed. Another valuable tool for the selection of new cultivars was the development of the molecular marker for peacock spot resistance. Screening progeny for resistance to olive leaf spot, based on field observation alone, takes many years, whereas by using a genetic marker linked to this trait, resistance can easily be identified, making it possible to identify resistant progeny at an early stage. In this study an STS marker linked to resistance to olive leaf spot was developed using sequence specific primers designed from the sequence of a RAPD marker. The marker was used for the identification of progeny that are likely to be resistant to olive leaf spot in studied in this selection program. Challenges with the pathogen against trees containing the resistance marker would be an effective way of testing the marker, but these experiments are beyond the scope of this program. However, trees will be monitored in different environments for the presence of peacock spot disease in the future. 5.4 Trial sites The performance of the propagules from the superior feral trees will be compared to those of known cultivars growing in the same environment. Three known cultivars, Barnea, Leccino and Manzanillo were propagated in the same conditions and planted at the same time as the feral trees and are therefore useful for direct comparison. In addition, data from the NOVA site, which is adjacent to the feral block, is available from the time of planting and will also be used for comparative reference. Further measurements necessary for the evaluation of the new cultivars include fruit yield, oil yield,
17
fruit size, flesh to pit ratio, fatty acid composition and sensory analysis. These cannot be achieved until the trees are bearing fruit. Further assessment of the superior selections will also be conducted at the trial sites on collaborative growers’ properties, with the aim of evaluating different cultivars under various environmental conditions.
18
6. Implications The current demand for olive oil, and the attendant profits that could accompany it, have provided the stimulus for the recent investment and expansion of the industry in Australia. Research organisations and industry leaders are concerned that the Australian industry must be built on the best available planting material and production technology to compete successfully on the international market during the long-term. The current olive improvement program is a highly structured and coordinated effort to ensure that this latest phase in the development of the industry brings together the best management practices, the best varieties, and high-grade research. The outcome will be the promotion of quality-assured products that will be in demand on both the Australian and overseas markets. The development of uniquely Australian cultivars with high oil yield and distinctive favour profiles that are adapted to the environment will increase opportunities for export and domestic consumption. Benefits to the industry arising from the olive program include improved planting material, quality assurance services and continuing research and development into production technology. The development of techniques for DNA analysis, oil chemistry analysis, propagation and assessment the extent of variation amongst the feral olive populations in South Australia, also offer significant support to the industry.
7. Recommendations Further investigation into the growth, yield, disease resistance and oil quality of the selected superior trees under cultivation at Roseworthy and other sites need to be completed before new cultivars are registered with the PBR office and recommendations are made to the industry.
19
8. References American Oil Chemistry Society (1978) Official and tentative methods. Third edition including
additions and revisions. Champaign, Illinois. Angiolillo A, Mencuccini M, Baldoni L (1999) Olive genetic diversity assessed using amplified
fragment length polymorphisms. Theor Appl Genet 98: 411-421. Anon (1996) Olive Germplasm: cultivars and world-wide collections. FAO. Plant production and
Protection Division (http://www.fao.org/ag/agp/agps/data.htm) Apostol B, Black W, Miller B, Reiter P, Beaty B (1993) Estimation of the number of full sibling
families at an oviposition site using RAPD PCR markers: applications to the mosquito Aedes aegypti. Theor Appl Genet 86:991-1000.
Belaj A, Trujillo I, De la Rosa R, Rallo L (2001) Polymorphism and discrimination capacity of randomly amplified polymorphic markers in an olive germplasm bank. J Amer Soc Hort Sci 126: 65-71.
Besnard G, Baradat P, Bervillé A (2001) Genetic relationships in the olive (Olea europaea L.) reflect multilocal selection of cultivars. Theor Appl Genet 102: 251-258.
Collins G, Symons R (1993) Polymorphisms in grapevine DNA detected by the RAPD PCR technique. Plant Mol Biol Rep 11: 105-112.
Crouse J, Amorese D (1987) Ethanol Precipitation: Ammonium acetate as an alternative to sodium acetate. Focus 9: 2-3.
Darmency H (1997) Gene flow between crops and weeds: Risk for new herbicide resistance weeds? In: De Prado R, Jorrín J, García-Torres L. Weed and crop resistance to herbicides. Kluwer Academic Publishers, Dordrecht, The Netherlands, pp.239-248.
Fabbri A, Hormaza J, Polito V (1995) Random amplified polymorphic DNA analysis of olive (Olea europaea L.) cultivars. J. Amer. Soc. Hort Sci 120: 538-542.
Fontanazza G, Baldoni L (1990) Proposed programme for the genetic improvement of the olive. Olivæ 34: 32-40.
Guerin J, Sweeney S, Collins G, Sedgley M (2002) The development of a genetic database to identify olive cultivars. J Amer Soc Hort Sci 127:977-983.
Hartmann H (1957) Olive Production in California. The College of Agriculture, Uni. California, pp50-59
Haymes K, Van de Weg W, Arens P, Maas J, Vosman B, Den Nijs A (2000) Development of SCAR markers linked to a Phytophthora fragariae resistance gene and their assessment in European and North American strawberry genotypes. J Amer Soc Hort Sci 125:330-339
Hobman F (1993) Olive Information Package. Primary Industries South Australia, p 371 Hughes S (1953) Some foliicolous hyphomycetes. Can J Bot 31:560-576 International Olive Oil Council (1999) Trade standard applying to olive oil and olive-pomace oil.
COI/T.15/NC no.2 Rev.9. Lavee S (1990) Aims, methods, and advances in breeding of new olive (Olea europaea L.) cultivars.
Acta Horticulturæ 286: 23-36. Lavee S, Harshemesh H, Haskal A, Meni V, Wodner M, Ogrodovich A, Avidan B, Wiesman Z,
Avidan N, Trapero Casas A (1999) ‘Maalot’ a new orchard-resistant cultivar to peacock eye leaf spot (Spilocaea oleagina Cast.). Olivæ 78:51-59
Loveless M, Hamrick J (1984) Ecological determinants of genetic structure in plant populations. Ann. Rev. Ecol. Sys. 15: 65-95.
Maguire T, Sedgley M (1997) Genetic diversity in Banksia and Dryandra (Proteaceae) with emphasis on Banksia cuneata, a rare and endangered species. Heredity 79: 396-401.
Mekuria G, Collins G, Sedgley M (1999) Genetic variability between different accessions of some common commercial olive cultivars. J Hort Sci Biotech 74: 309-314.
Mekuria G, Collins G, Sedgley M, Lavee S (2001) Identification of genetic markers in olive linked to olive leaf spot resistance and susceptibility. J Amer Soc Hort Sci 126: 305-308.
Mekuria G, Sedgley M, Collins G, Lavee S (2002) Development of a sequence tagged site fro the RAPD marker linked to leaf spot resistance in olive. J Amer Soc Hort Sci 127: 673-676.
20
Ogawa M, English H (1991) Diseases of temperate zone tree fruits and nut crops. Univ. of Calif., Division of Agr. and Natural Resources, Oakland, Calif. Publ. 3345, pp344-347.
Olson M, Hood L, Cantor C, Botstein D (1989) A common language for physical mapping of the human genome. Science 245:1434-1435
Paran I, Michelmore R (1993) Development of reliable PCR-based markers linked to downy mildew resistance genes in lettuce. Theor Appl Genet 85:985-993
Rallo L (1995) Selection and breeding of olive in Spain. Olivæ 59:46-53. Rallo P, Dorado G, Martin A (2000) Development of simple sequence repeats (SSRs) in olive tree
Department of Ecology and Evolution, State University of New York. Exeter Publ. Ltd., Setauket, NY.
Sanz-Cortés F, Badenes M, Paz S, Íñiguez A, Llácer G (2001) Molecular characterisation of olive cultivars using RAPD markers. J Amer Soc Hort Sci 126: 7-12.
Sedgley M, Wirthensohn M (1999) The University of Adelaide Olive Selection Program: Better olive cultivars for Australia. The Olive Press Spring 12-14.
Sedgley M, Wirthensohn M (2000) The Australian olive improvement program. Olivæ 83: 27-30. Shabi E, Birger R, Lavee S (1994) Leaf spot (Spilocaea oleaginea) of olive in Israel and its control.
Acta Hort 356:390-394 Sokal R. Michener C (1958) A statistical method for evaluating systematic relationships. The
University of Kansas Science Bulletin 38: 1409-1438. Trigui A (1996) Improving the quantity and quality of olive production in Tunisia: unavoidable need
and outlook for olive identification and breeding. Olivæ 61: 34-40. Weisman Z, Avidan N, Lavee S, Quebedeaux B (1998) Molecular characterization of common olive
varieties in Israel and the West Bank using randomly amplified polymorphic DNA (RAPD) markers. J Amer Soc Hort Sci 123: 837-841.
Zohary D (1994) The wild genetic resources of the cultivated olive. Acta Horticulture Olive Growing II: 356;62-65.
21
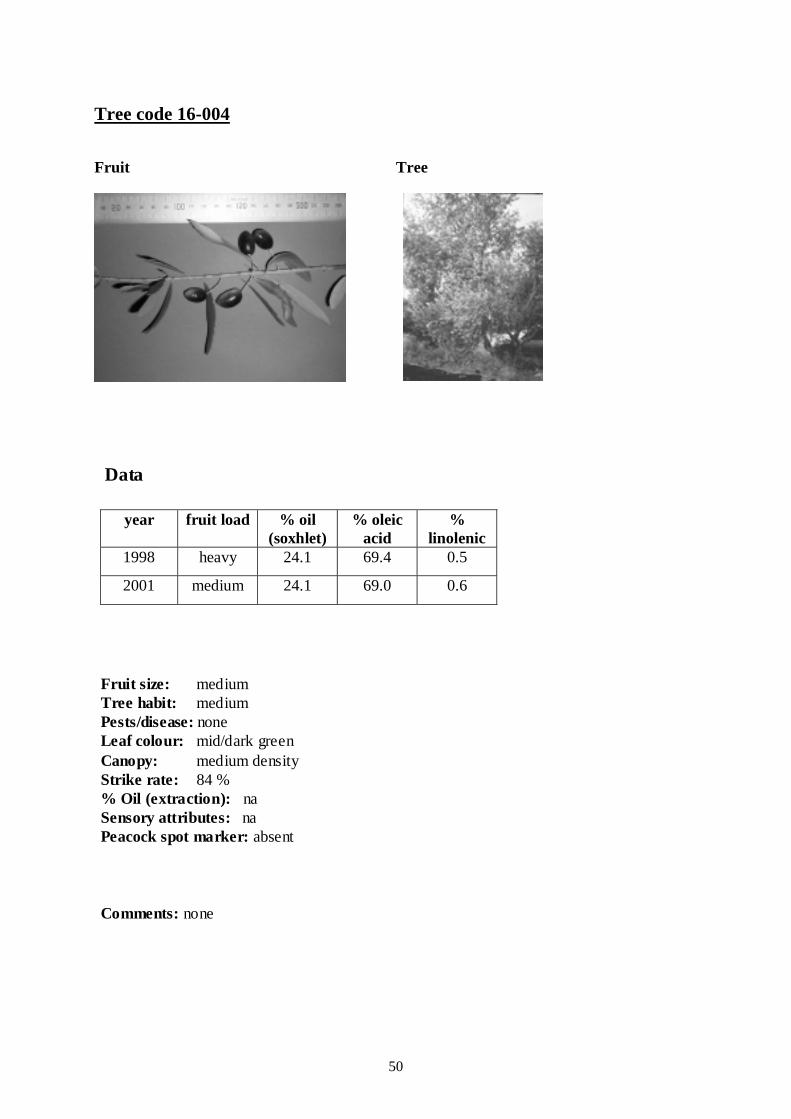
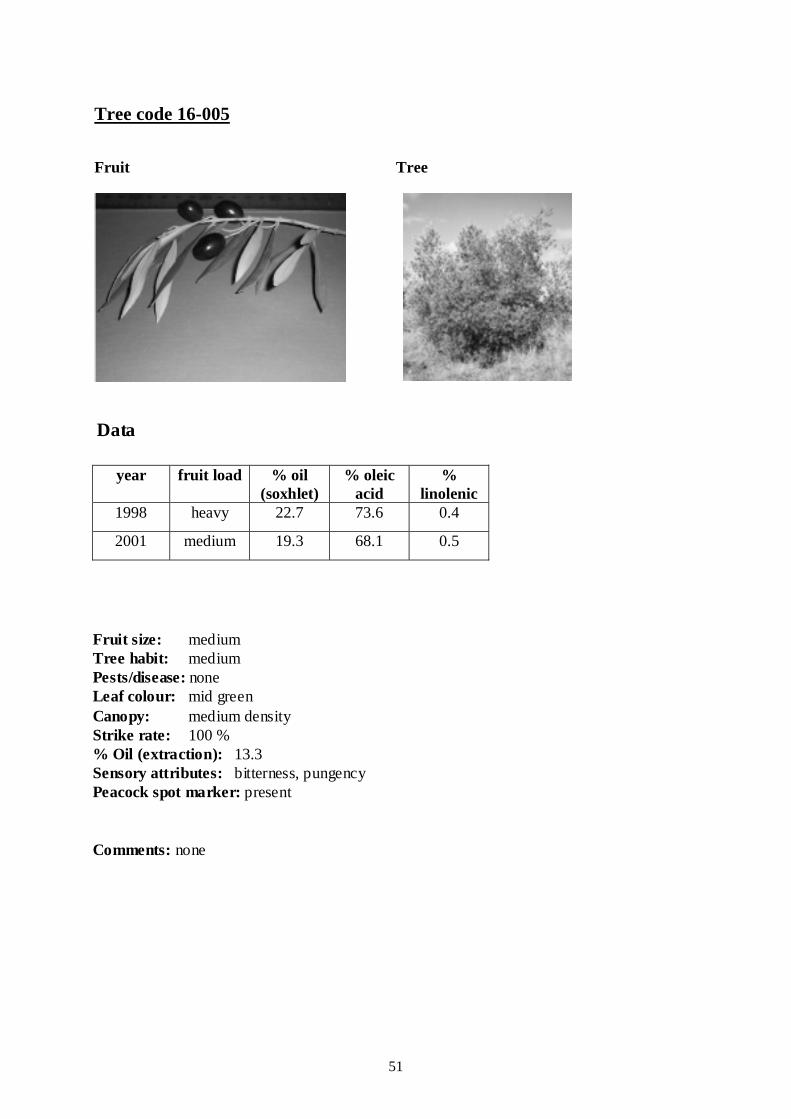
APPENDIX 1:
Summary pages for selected feral trees.
22
Tree code 1-001 Fruit Tree
year fruit load % oil (soxhlet)
% oleic acid
% linolenic
1998 medium 23.5 70.4 0.7
2001 light 10.7 67 0.7
2002 medium na na na
Data
Fruit size: medium Tree habit: medium Pests/disease: mild chlorosis Leaf colour: mid green Canopy: medium density Strike rate: 38 % % Oil (extraction): 6.8 Sensory attributes: apple, other fruit, olive fruit, bitterness, pungencyPeacock spot marker: absent Comments: Extra comparator.


![Olivicultura Ingles[1]](https://static.documents.pub/doc/80x56/5532afcc5503464f7d8b46f5/olivicultura-ingles1.jpg)


