This document was downloaded on March 17, 2014 at 05:27:52 Author(s) Williams, Edward O. Title Surveillance and interdiction models : a game-theoretic approach to defend against VBIEDS Publisher Monterey, California. Naval Postgraduate School Issue Date 2010-06 URL http://hdl.handle.net/10945/5329
Transcript
This document was downloaded on March 17, 2014 at 05:27:52
Author(s) Williams, Edward O.
Title Surveillance and interdiction models : a game-theoretic approach to defend againstVBIEDS
Publisher Monterey, California. Naval Postgraduate School
Issue Date 2010-06
URL http://hdl.handle.net/10945/5329
NAVALPOSTGRADUATE
SCHOOL
MONTEREY, CALIFORNIA
THESIS
SURVEILLANCE AND INTERDICTION MODELS: AGAME-THEORETIC APPROACH TO DEFEND AGAINST
VBIEDS
by
Edward O. Williams
June 2010
Thesis Advisor: Timothy H. ChungSecond Reader: Frank Giordano
Approved for public release; distribution is unlimited
THIS PAGE INTENTIONALLY LEFT BLANK
REPORT DOCUMENTATION PAGE Form ApprovedOMB No. 0704–0188
The public reporting burden for this collection of information is estimated to average 1 hour per response, including the time for reviewing instructions, searching existing data sources, gatheringand maintaining the data needed, and completing and reviewing the collection of information. Send comments regarding this burden estimate or any other aspect of this collection of information,including suggestions for reducing this burden to Department of Defense, Washington Headquarters Services, Directorate for Information Operations and Reports (0704–0188), 1215 JeffersonDavis Highway, Suite 1204, Arlington, VA 22202–4302. Respondents should be aware that notwithstanding any other provision of law, no person shall be subject to any penalty for failing tocomply with a collection of information if it does not display a currently valid OMB control number. PLEASE DO NOT RETURN YOUR FORM TO THE ABOVE ADDRESS.
1. REPORT DATE (DD–MM–YYYY) 2. REPORT TYPE 3. DATES COVERED (From — To)
4. TITLE AND SUBTITLE 5a. CONTRACT NUMBER
5b. GRANT NUMBER
5c. PROGRAM ELEMENT NUMBER
5d. PROJECT NUMBER
5e. TASK NUMBER
5f. WORK UNIT NUMBER
6. AUTHOR(S)
7. PERFORMING ORGANIZATION NAME(S) AND ADDRESS(ES) 8. PERFORMING ORGANIZATION REPORTNUMBER
16. SECURITY CLASSIFICATION OF:a. REPORT b. ABSTRACT c. THIS PAGE
17. LIMITATION OFABSTRACT
18. NUMBEROFPAGES
19a. NAME OF RESPONSIBLE PERSON
19b. TELEPHONE NUMBER (include area code)
Standard Form 298 (Rev. 8–98)Prescribed by ANSI Std. Z39.18
11–6–2010 Master’s Thesis 2009-01-07–2010-06-18
Surveillance and Interdiction Models: A Game-Theoretic Approach toDefend Against VBIEDs
Edward O. Williams
Naval Postgraduate SchoolMonterey, CA 93943
US Special Operations Command
Approved for public release; distribution is unlimited
The views expressed in this thesis are those of the author and do not reflect the official policy or position of the Department ofDefense or the U.S. Government. IRB Protocol No: XXXX.
This thesis develops a model for surveillance and interdiction operations by combining a tactical Unmanned Aerial Vehicle(UAV) to detect a threat with a ground force to interdict that threat. The scenario models the defense of a fixed facility such asa Forward Operating Base against an enemy attack in the form of a Vehicle Borne Improvised Explosive Device (VBIED).UAVs are increasingly more important in the military, and significant improvements in quantity and capability allow eventactical units to employ this tool, yet little research has been done on effective employment techniques at this level.Additionally, VBIEDs are a significant threat, but the primary counter-VBIED technique is simply hardened perimeterdefenses, and little work has been done to detect and interdict a VBIED before it reaches the target. This research projectaddresses both deficiencies. Through spreadsheet and decision theory analysis, the factors that impact UAV and ground forceemployment are examined and effective strategies to employ the two together are considered. Then through Game Theory, thestrategic interactions between attack and defender are modeled to examine how changes in the conditions can impact theoptimal strategy choices for each side.
Approved for public release; distribution is unlimited
SURVEILLANCE AND INTERDICTION MODELS: A GAME-THEORETIC APPROACH TO DEFEND AGAINST VBIEDS
Edward O. Williams Major, United States Army
B.S., United States Military Academy, 1998
Submitted in partial fulfillment of the requirements for the degree of
MASTER OF SCIENCE IN DEFENSE ANALYSIS
from the
NAVAL POSTGRADUATE SCHOOL June 2010
Author: Edward O. Williams Approved by: Timothy H. Chung Thesis Advisor Frank Giordano Second Reader Gordon McCormick Chair, Department of Defense Analysis
THIS PAGE INTENTIONALLY LEFT BLANK
iv
ABSTRACT
This thesis develops a model for surveillance and interdiction operations by combining a tacticalUnmanned Aerial Vehicle (UAV) to detect a threat with a ground force to interdict that threat.The scenario models the defense of a fixed facility such as a Forward Operating Base againstan enemy attack in the form of a Vehicle Borne Improvised Explosive Device (VBIED). UAVsare increasingly more important in the military, and significant improvements in quantity andcapability allow even tactical units to employ this tool, yet little research has been done oneffective employment techniques at this level. Additionally, VBIEDs are a significant threat, butthe primary counter-VBIED technique is simply hardened perimeter defenses, and little workhas been done to detect and interdict a VBIED before it reaches the target. This research projectaddresses both deficiencies. Through spreadsheet and decision theory analysis, the factors thatimpact UAV and ground force employment are examined and effective strategies to employ thetwo together are considered. Then through Game Theory, the strategic interactions betweenattack and defender are modeled to examine how changes in the conditions can impact theoptimal strategy choices for each side.
On August 18, 2008, the Taliban in Afghanistan launched a double Vehicle Borne ImprovisedExplosive Device (VBIED) attack against a U.S. military base in Khost Province [1]. The firstvehicle detonated at the gate, killing ten people and wounding thirteen others. The secondvehicle also made it to the gate area, but the defenders detected the threat and shot the driverbefore the bomb detonated. That base, Forward Operating Base (FOB) Salerno, is a largefacility and serves as a hub of coalition activity, and so it had the infrastructure and resourcesto defend against the attack. Even though the first vehicle exploded at the gate, no significantdamage inside the base was reported, and the casualties were all local Afghans. However,if this attack happened at a smaller base, or if a larger vehicle was used to deliver a biggerbomb, greater casualties and damage should be expected in this type of attack. At a smallerfacility without the standoff distance that FOB Salerno has, a large VBIED could potentiallycause casualties and damage throughout the entire base, even if it detonates outside the base atthe entry gate. In that case, relying on the perimeter to secure the facility is not enough—thedefenders need to be able to detect and interdict such an attack before it reaches the gate.
In both Iraq and Afghanistan, coalition forces have moved out of the large FOBs and into smallerbases in order to integrate better with the local population. This reverses an earlier strategy, inwhich force protection was more of a primary concern that led the military to base its units inthe security of large FOBs. Although this was an effective force protection strategy, it failedto facilitate the primary counter-insurgency (COIN) mission. Effective COIN strategy requireswinning the support of the local population, and in an effort to accomplish this, commandersbegan pushing units off of the large FOBs and into smaller outposts to better interact with thelocals. While this is a good and effective COIN strategy, it does dramatically increase the riskand creates some force protection problems. These units are no longer tucked away safe withina large base. On these smaller outposts, the entry gate might well be within the blast rangeof even a medium-sized VBIED. Special Operations Forces (SOF) in particular often operatefrom team houses located within a village or town and may have no standoff distance to theirperimeter to provide protection from a VBIED. In these cases, being able to detect and interdicta VBIED attack before it reaches the facility is important and will be much more effective thansimply relying on hardened defenses to absorb an attack.
1
1.1 The IED Threat
Improvised Explosive Devices (IED) are the greatest threat to the U.S. military in both Iraqand Afghanistan. In the Joint IED Defeat Organization’s (JIEDDO) 2008 annual report, theagency director LTG Thomas Metz states: “In Iraq and Afghanistan, the most effective weaponemployed against coalition forces during 2008 continued to be the Improvised Explosive Device(IED)” [2, p. 3]. Even beyond those theaters, the report comments that “IEDs remain theweapon of choice for terrorists worldwide in 2008 requiring limited skills and giving them theability to conduct spectacular attacks for a relatively small investment” (p. 5). IEDs were alwaysthe greatest threat in Iraq, and although slower to catch on in Afghanistan, IED use there beganto significantly increase in 2008 and accounted for about three quarters of all enemy attacks thatyear. In response to this threat, the United States has put a tremendous amount of resources andeffort into countering IEDs.
JIEDDO has the lead in the Counter-IED (C-IED) effort for the U.S. This organization beganin 2003 as an Army IED Task Force, then became a joint task force, then finally reached itscurrent structure as a joint organization directed by a 3-star general in February 2006 underDoD Directive 2000.19E [3, 4]. JIEDDO’s evolution and rising importance is partly due to itssuccess, but is also directly related to the increasing significance of the IED threat. In 2008,JIEDDO approved over $4 billion of funding for C-IED efforts, and its annual reports highlightmany new technologies, research, and systems that JIEDDO has supported the developmentof [5, 2]. Obviously the C-IED effort is important and the United States continues to improvecapabilities to deal with this threat.
Although IEDs can come in many varieties, the dominant threat is roadside bombs of some sortdesigned to attack a convoy driving past. This particular IED threat has rightly received mostof the attention and effort given to defeating IEDs. However, there are also other types of IEDthreats that, although not as prolific, are still dangerous. In particular, Vehicle Borne IEDs area major threat that is difficult to defeat. In general terms, VBIEDs include any explosive attackdelivered by a vehicle, though common usage usually limits the term to cars or trucks and oftenimplies a suicide attack in which the driver or other triggerman detonates the vehicle as soonas it arrives at the target. A more inclusive definition, though, would also count non-suicideattacks in which the driver parks the vehicle and leaves the scene before detonating the bomb.Most often, these attacks are against fixed facilities, although there have been VBIED attacksagainst moving convoys as well [3].
2
VBIEDs have the potential to be extremely devastating attacks. Since the bombs are assembledin a secure area (rather than in the open as in the case of roadside IEDs), the attackers have thetime and opportunity to construct as large a bomb as the vehicle will carry. Also, since the bombis delivered and detonated by a human, VBIEDs are sometimes referred to as smart weapons,and they have proven to be particularly difficult to defeat. Despite the significant impacts that aVBIED can have, relatively little work has been done to counter VBIED attacks other than thewidespread hardening of facilities with primitive techniques such as dirt and concrete barriers.Of the dozens of C-IED efforts including research, initiatives, and new technologies mentionedin both the 2007 and 2008 JIEDDO reports, none are specifically aimed at VBIEDs. In fact, theterm “VBIED” is used only once in the 2007 report, and then just in the acronym list, and notat all in the 2008 report. Given the lack of attention paid to VBIEDs, one might conclude thatthis particular type of attack is not a threat at all, at least compared to the roadside IED whichreceives the vast majority of C-IED efforts.
On the contrary, VBIED attacks against fixed facilities are a significant threat. Almost allterrorist attacks that result in high casualties are from some sort of VBIED. A Department ofHomeland Security (DHS) document states, “Gauging by the number of casualties and amountof property damage, VBIEDs have been the most successful means of terrorist attack bothdomestically and internationally” [6, p. 4]. The 1983 attacks in Lebanon, first against the U.S.Embassy and then later against the Marine Barracks, were both done with VBIEDs and resultedin over 300 Americans killed. The 1998 U.S. embassy bombings in Africa were also VBIEDattacks, again killing hundreds and wounding over 4,000 people [7]. The 1996 bombing ofthe Khobar Towers in Saudi Arabia was a VBIED attack that killed 19 Air Force personneland wounded hundreds of others. The worst homegrown terrorist incident in the U.S., the1995 Oklahoma City bombing, was a VBIED attack that killed 168 people and destroyed orstructurally damaged over 300 buildings and shattered glass in over 250 additional buildings [8,p. 6]. This incident in particular demonstrates the potential destructive capability of a VBIED,and why this threat, even if not as common as other IED attacks, is still a major concern. OtherVBIED attacks include the bombing of the USS Cole (sometimes called a Water Borne IED)and the 1993 World Trade Center attack, and even the 2001 World Trade Center attacks could beconsidered a type of VBIED in which a vehicle delivered an explosive attack against a facility.In Iraq and Afghanistan, the U.S. military has learned the lessons of these past attacks andhas put up sufficient defenses around the large FOBs to ensure protection against such attacks,and so the VBIED threat against the military in these theaters has not been as great as other
3
IED attacks against more exposed convoys on the roads. However, VBIEDs are still occurringregularly in both countries against softer targets that are not as well defended. These attacksare usually against host nation facilities such as government buildings or recruiting stations, oreven against civilian targets such as markets. However, as U.S. forces continue to move out ofthe security of large FOBs and into smaller outposts to mix in more with the local population,they will lose their primary defense against VBIEDs and the threat of those attacks might thenincrease.
The VBIED concept is a very old idea that has withstood the test of time because it is soeffective. In an article on the subject, Henry Morgenstern writes:
Since the times of the Trojan Horse, the idea of taking an object that can breach asecurity system because it is familiar or desirable and using it to deliver a payloadto enemy forces is a well-known tactic. The Vehicle Borne Improvised ExplosiveDevice (VBIED) is but the latest such incarnation of a very old theme – but with adeadly, sometime mass destructive force. [9]
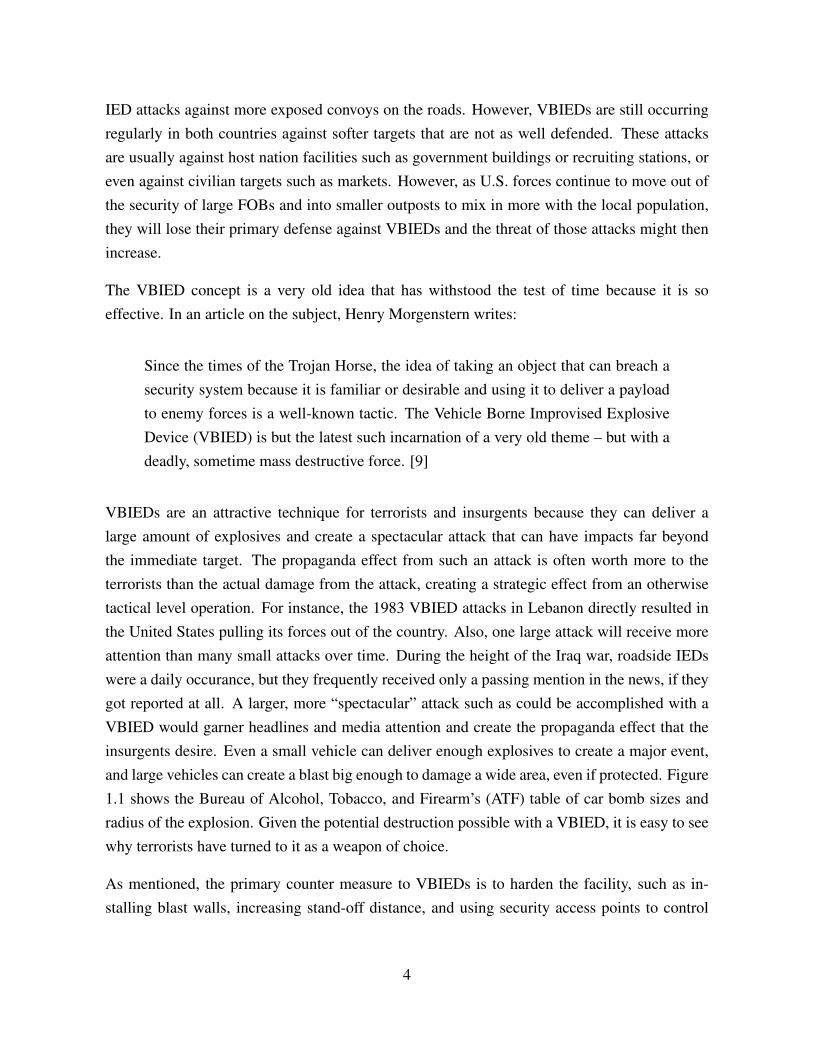
VBIEDs are an attractive technique for terrorists and insurgents because they can deliver alarge amount of explosives and create a spectacular attack that can have impacts far beyondthe immediate target. The propaganda effect from such an attack is often worth more to theterrorists than the actual damage from the attack, creating a strategic effect from an otherwisetactical level operation. For instance, the 1983 VBIED attacks in Lebanon directly resulted inthe United States pulling its forces out of the country. Also, one large attack will receive moreattention than many small attacks over time. During the height of the Iraq war, roadside IEDswere a daily occurance, but they frequently received only a passing mention in the news, if theygot reported at all. A larger, more “spectacular” attack such as could be accomplished with aVBIED would garner headlines and media attention and create the propaganda effect that theinsurgents desire. Even a small vehicle can deliver enough explosives to create a major event,and large vehicles can create a blast big enough to damage a wide area, even if protected. Figure1.1 shows the Bureau of Alcohol, Tobacco, and Firearm’s (ATF) table of car bomb sizes andradius of the explosion. Given the potential destruction possible with a VBIED, it is easy to seewhy terrorists have turned to it as a weapon of choice.
As mentioned, the primary counter measure to VBIEDs is to harden the facility, such as in-stalling blast walls, increasing stand-off distance, and using security access points to control
4
Figure 1.1: ATF Car Bomb Table [From 10]: This chart shows the potential explosive size of a VBIED for variousvehicle sizes. For each vehicle, the typical maximum explosive capacity and the corresponding expected lethal blastrange and damage range are shown.
entry and search vehicles. For the most part, these are old technologies, and relatively little newwork has been done in this area. Some new technology for improving vehicle searches, suchas scanners that can detect hidden explosives, have been developed and deployed to high valuelocations. However, even these are a last line of defense, allowing a potential VBIED rightup to the gate of the targeted facility. For the most part, all of these counter-VBIED actionsare defensive, designed to protect a facility and better absorb an attack, or make the target too“hard” and deter the attackers from choosing that target, but likely sending them to attack asofter target. Relatively little work has been done to improve the ability to detect and interdicta VBIED before it reaches its intended target. In 2009, the DHS issued a Research/Focus Areadocument dedicated to VBIED detection [6]. This paper highlights the counter-VBIED chal-lenges and why defeating this threat is so difficult, and it shows that DHS is moving forwardwith more advanced counter-VBIED efforts. So far, the military seems to be content with usingperimeter security to defend against VBIEDs and is putting most of its resources and effort intocountering other IED attacks. This strategy has worked well so far, and at least in Iraq andAfghanistan, military facilities have avoided a successful major VBIED attack, but if the trendtowards putting units on smaller outposts continues, the VBIED threat will increase and theability to rely on perimeter security to defend and protect against a VBIED will decrease. Hard-ening of facilities can only accomplish so much, and therefor other counter-VBIED techniquesshould be examined and developed as well, including detection and distant interdiction such asDHS is focused on.
5
1.2 The Scenario
This thesis is part of a larger research effort that addresses parts of this deficiency in Counter-VBIED efforts by exploring ways to combine a tactical UAV for detection with a ground basedforce for interdiction in order to better protect a specific facility from a VBIED attack. Specifi-cally, this thesis examines a VBIED attack scenario and looks at employment factors of surveil-lance and interdiction assets as well as the strategic interactions between attacker and defenderin a game theoretic model.
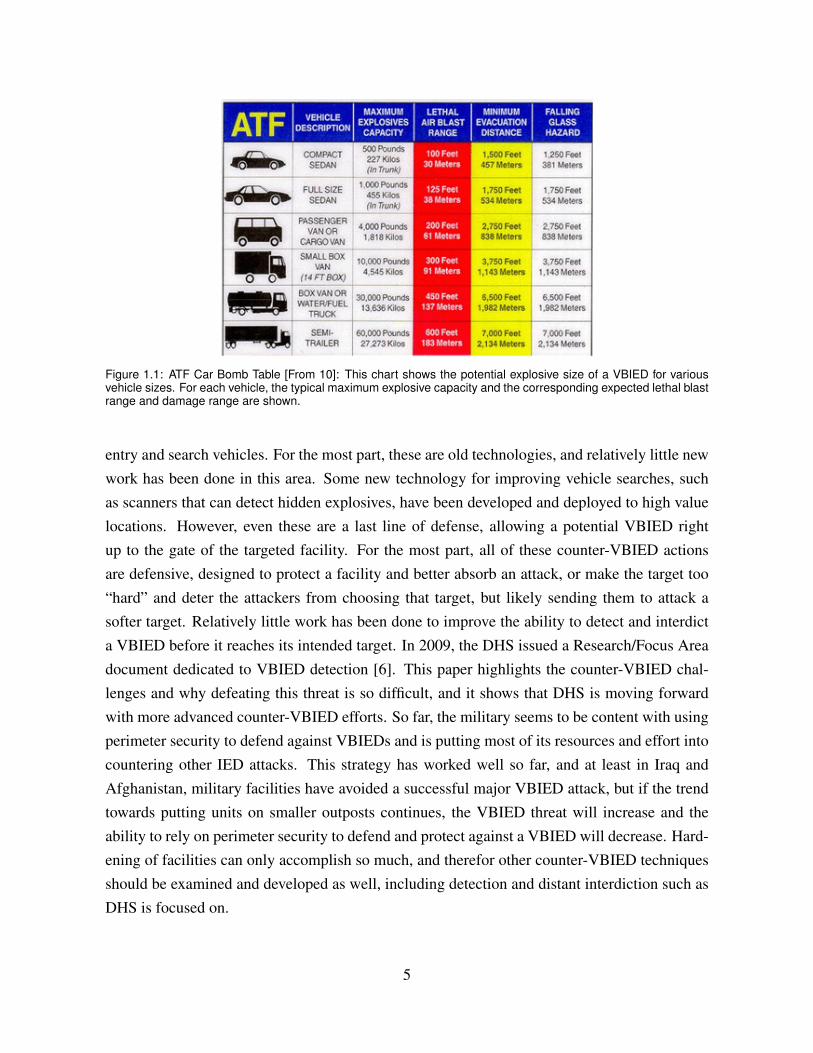
The scenario used in this project is built around an enemy attacker using a VBIED to target asmall, remote FOB defended by a friendly force, similar to what might be found in the coun-tryside of Afghanistan. The unit on this base can have any of a variety of different missionsthat require its presence in that area, but regardless of the primary mission, one task that all de-ployed military units have is force protection, including guarding the base against attacks. Thedefenders have a single tactical Unmanned Aerial Vehicle (UAV) that they control which can beused for surveillance. The defenders also have a ground force that can conduct patrols aroundthe FOB, but due to limited numbers the defenders can only send out one patrol at a time. ThisQuick Reaction Force (QRF) will be used to interdict an enemy attack. In the studied example,this FOB is located near a three-way road junction, so that there are three avenues of approachleading to the base. Now imagine that the defenders receive credible intelligence warning ofa VBIED attack planned for sometime the next morning, but the exact time and road that theattack will come from is unknown. The defenders obviously want to interdict the attack withthe ground force as far from the base as possible to limit potential damage, but without knowingwhich road to send the force down this is a difficult decision. Figure 1.2 graphically depicts thissituation. Given this scenario, how should the defenders act to best interdict the VBIED attack?
There are several plausible courses of action in this scenario, but for this project we assumethe defenders keep the QRF at the base on stand-by and use the UAV to look for the VBIED.When the UAV detects the target, the QRF can then travel down the correct road to interdictthe attack. In case the UAV misses the VBIED, the QRF is also conducting static surveillancefrom the FOB, and if the QRF detects an approaching vehicle it will then move on that road andstop the vehicle. In this case, the VBIED will get much closer to the base and if large enoughwill cause damage, so the preference is for the UAV to make the detection and allow the QRFto interdict the attack farther away. There are also several methods to employ the UAV, and forthis scenario we model a barrier-type patrol, in which the UAV flies a circular route at various
6
Figure 1.2: Basic Scenario Diargram. This picture shows the FOB in the center, with the road network of threeavenues of approach leading to the FOB. The defenders have a ground force QRF on standby at the FOB tointerdict the attacking VBIED once the UAV detects which road it is on.
fixed distances from the FOB. The details of this model are explained in later chapters.
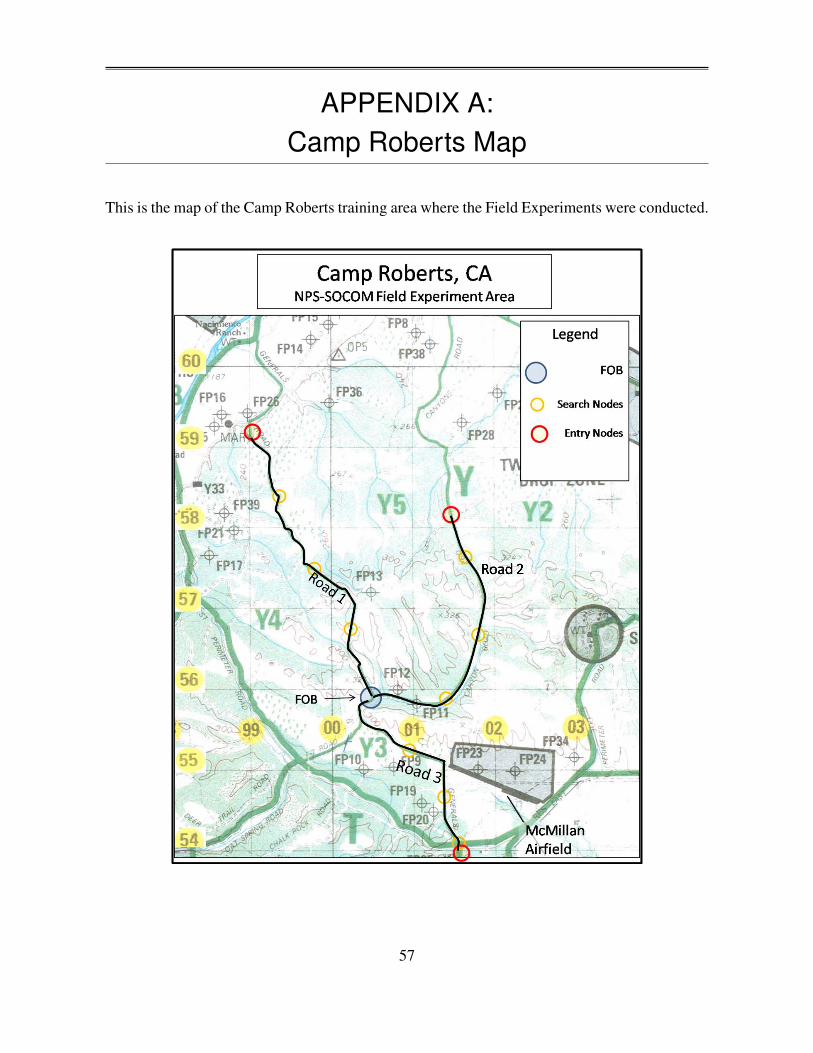
As part of the larger research project, several field experiments were conducted during the NavalPostgraduate School (NPS)-United States Special Operations Command (USSOCOM) FieldExperimentation Cooperative program at Camp Roberts Army National Guard Base, California.To better replicate a real-world situation, the general scenario was tailored to a specific locationused in these field experiments. Use of this Camp Roberts scenario added real world complexityto the problem, such as curved roads, varied terrain from rolling hills to steep canyons, anddifferent types of roads including improved packed gravel and dirt jeep trails, which allow themodel to better represent a real-world situation. Appendix A shows a map of the location usedat Camp Roberts.
1.3 Research DesignThe purpose of this thesis is to examine the optimal methods of employing a UAV and groundforce together to interdict a VBIED attack. The question this thesis addresses is how shouldthe defenders act in order to best defend against a VBIED attack. This scenario is initiallymodeled as a one-sided decision in which only the factors related to the defender are considered.Then a game theoretic approach is taken in which the decisions of both attacker and defenderare considered along with how they impact each other. The primary goal of this thesis is todetermine an optimal UAV and QRF employment strategy for the defenders to successfullyinterdict a VBIED attack in the given scenario. There are a large number of possible issuesinvolved in this problem that could be considered, and so the scope of this thesis is limited to
7
the given scenario. Only a single UAV and ground force are considered. The UAV is a tacticalone locally controlled and used only for surveillance (i.e., it is unarmed and not used for theinterdiction task, but it is also dedicated to the defenders and will not be tasked away by ahigher headquarters). This thesis focuses on employment of the UAV as a vehicle and not onthe characteristics of the UAV’s sensor; issues such as missed detections and false positivesare not addressed. Other limitations on the scope of this model include no weather effects andthe UAV functions normally (i.e., no mechanical or technical problems and the enemy does notinterfere with UAV operations). These and other limitations and assumptions will be explainedin detail in later sections.
1.4 Thesis OrganizationChapter 2 presents a review of UAVs, Barrier Patrol and how it is applied to this problem, andGame Theory as it is used here. Chapter 3 develops the model for UAV and QRF employmentthrough spreadsheet analysis. Chapter 4 discusses the attacker and related factors. Chapter 5 ex-amines the strategic interaction between attacker and defender through Game theory. Chapter 6discusses the Field Experiments conducted as part of this research project. Chapter 7 concludesthe thesis with some applications and future development of this research. There are three ap-pendices: Appendix A details the area used in the Field Experiments, Appendix B shows theimplementation of the linear program to solve the Game Theory problem, and Appendix C isthe Field Experiment Procedures.
8
CHAPTER 2:Background
2.1 Unmanned Aerial VehiclesUAVs are becoming an ever increasing and more important part of military operations. Tradi-tionally, intelligence platforms were a high-level asset and had very little direct link to tacticalground units. UAVs are changing this, however, and “provide frontline tactical formations . . .with organic aerial capabilities that they can directly control” [11, p. I-1]. The traditional role ofthe UAV has also changed, from one of primarily intelligence, surveillance, and reconnaissance(ISR) to a strike platform as new technology allows more weapon systems to be employed ona greater number of UAVs [12]. Although this project does not examine the use of UAVs in astrike role, the increasingly ubiquitous nature of UAVs and the ability of tactical level groundcommanders to control them is an important development that allows the scenario presentedhere to be realistically considered.
2.2 Barrier PatrolSearch Theory is a subset within the Operations Research effort that originated during WorldWar II, and Barrier Patrol is a specialized technique within the general subject of Search Theory[13]. As the name implies, Search Theory deals with the process of detecting different things,with many different analytical factors involved [14]. The military had several applications thatrequired efficient and effective search techniques, including locating missing people such asshot down air crews, finding enemy formations on land in order to better attack them, anddetecting enemy forces that are approaching a friendly position. In particular, the Navy ledthe development of Search Theory in its application towards Anti-Submarine Warfare (ASW).Detecting and then defeating enemy U-boats was a vital effort and perhaps the most significantapplication of Search Theory. In the field of ASW, the specialized form of searching calledBarrier Search was developed.
Barrier Search assumes that the enemy is trying to move from one area to another and that thefriendly forces have created a line or barrier that they are searching along in order to detect theenemy as he crosses that line while moving from one area to another. A classic example toillustrate this concept comes from the naval campaigns of the Mediterranean Sea. The GermanU-boats wanted to conduct operations in the Mediterranean to disrupt Allied shipping there. To
9
do so, the U-boats needed to move from the Atlantic Ocean, through the Straits of Gibraltar,and into the Mediterranean. The allies treated the straits as a barrier and patrolled back andforth (going north and south) across the straits, trying to detect the enemy traversing the straits.Koopman, in his report OEG 56 and a subsequent book, details much of the early work done inthis field [13].
The basics of Barrier Search as described in this example are transferred to land for this sce-nario. Instead of U-boats moving from the Atlantic to the Mediterranean, VBIEDs are movingfrom a staging area to the FOB. Just as the Allies knew the path that the U-boats would take,the defenders in this scenario know that the VBIEDs will be travelling along a set of roads.However, the defenders do not have the ability to observe or block all three roads at once, justas the Allies could not observe or block the entire width of the Straits of Gibraltar. To deal withthis, the Allies had ships and planes going back and forth searching the straits, which becametheir barrier line. In our scenario, the defenders have a UAV that searches across each road,and the UAV’s flight path becomes the barrier line at which the defenders want to detect theVBIED. Rather than establish the barrier at a fixed chokepoint, though, the defenders are ableto fly the UAV at any distance from the base and so can establish their barrier at any point alongthe roads. The factors leading to the decision on where this barrier should be established arediscussed in the next chapter.
Nash presents an overview of recent Barrier Search methods related to ASW, including mea-sures of effectiveness to evaluate specific searches [15]. Nash also develops a technique tocalculate probabilities of detection in a Barrier Search based on the ratio of area (measured insearch cells) covered by the sensor to the total area within the barrier. The model in this projectis developed using a similar concept of ratio of time spent searching a specific node out of thetotal time of the search patrol.
2.3 Game Theory ApplicationGame Theory is the study of how decisions are made in situations where the decisions of oneperson affect the decisions of another. As one textbook on the subject says, “Game Theory isconcerned with how rational individuals make decisions when they are mutually interdepen-dent” [16, p. 1]. Game theory primarily developed out of the field of economics, but has sincebeen applied to a wide range of areas. Current applications include biology, political science,international relations, and even areas where the decisions are not made by people, such as incomputer science. The widespread use of Game Theory shows its usefulness and effectiveness
10
at helping to understand and improve decision making in strategic situation (i.e., situations inwhich the decision of one side impacts the decision making of another. Just as there are a widerange of applications for Game Theory, there are also many variations of games that can bestudied.
Two main branches of game theory are non-cooperative and cooperative [16]. Non-cooperativegames imply individualism, and mean that the people involved (called players) cannot enter intoand enforce agreements between themselves, although they may work together to further theirindividually perceived best interest. Cooperative games allow for players to join together andwork towards a collective goal, which will result in the best outcome for the group but may notbe the best result individually. The scenario in question here is clearly non-cooperative, and theattackers and defenders will not establish any sort of agreements between themselves.
Games can also be zero- or partial-sum games. In zero-sum games, in order for one side togain an advantage or increased benefit, the other side must have a corresponding disadvantageor decreased benefit. For example, when setting the price of product for sale, as the price goesup the seller’s profit will increase by exactly as much as the buyer’s expenses. The amountof money that the buyer collects minus the money the seller spends always equals zero, andthe sum of money (the benefit) that both sides have stays the same. In partial-sum games, theresulting amount of benefit that both sides have can vary based on which decisions are made.For example, the Prisoner’s Dilemma is a famous partial-sum game. The scenario in this projectresults in a zero-sum game. In order for the attackers to succeed, the defenders have to fail, andan increase in the likelihood of a successful attack results in a corresponding decrease in thelikelihood of a successful defense.
Games are also categorized by the timing of each player’s move or decision. If one playermoves first, and the next player knows something about the first player’s move before makinghis own decision, the game is sequential. If both players make their decision at the same time orif at different times but without knowing anything about the other player’s decision, the gameis considered simultaneous. The game developed here is simultaneous. The defenders clearlydo not know the attacker’s decision on which road to use or even when or if to make the attack.Also, although the attacker might be able to learn how the defenders are employing the UAV,we assume that the attacker must commit to a course of action before knowing this decision.
Related to the timing of the game is how the game is represented [17]. Sequential games aregenerally shown as a tree to indicate the sequence of decisions, called extensive form. Simulta-
11
Player IIC D
Player A 3 1I B 4 2
Table 2.1: Game Matrix Format: This shows a simultaneous, zero-sum game represented in matrix form. The rowsrepresent a strategy available to Player I (strategies A and B) and each column is a strategy for Player II (strategiesC and D). The numbers are the payoff values when that pair of strategies is used.
neous games are shown in a matrix format, as is done in this thesis. Table 2.1 shows an examplematrix game. By convention, the friendly side will be the row player and refered to as PlayerI, and each row represents a different strategy that Player I can decide to use. The enemy willbe the column player, Player II, and the columns represent the strategies available to him. Thesize of games can vary greatly. The simplest one is a two-person game where each side hastwo strategies to choose from, resulting in a 2 × 2 matrix as shown. However, a game canhave any number of players, and each player can have a different number of multiple strategies.Our game will be a two-person game consisting of the friendly force defenders and the enemyattackers.
The solution to a game refers to the optimal strategies that each player should decide to use.This can be a single, pure-strategy solution, or a mixed-strategy solution in which the playeruses multiple strategies. The value of the game (but not the solution) is the resulting benefitthat each player receives when he employs his optimal solution strategy. In the example gamein Table 2.1, if Player I chooses strategy B and Player II chooses strategy D, Player I receives abenefit value of 2. Since this is a zero sum game, Player II loses a value of 2. The solution tothe game is to use strategies B and D, and the value of the game is 2.
One final important consideration in game theory is the idea of repeated versus one-time games.The theory is most applicable to situations that are repeated multiple times. Solving a game re-sults in the optimal strategies that yield the greatest expected value. This is the average valuethat should be expected over the course of many iterations of the game. The strategy solutionsmight consist of mixed strategies. This indicates that more than one strategy should be used,each a certain optimal percentage of the time. In repeated games, following a mixed strategy ispossible, but in a one-time game where the decision is made only once, only one strategy canbe used. In this situation, the decision maker should randomly choose between the strategiesaccording to the weighted optimal mixed strategy solution, and the optimal value of the game(the expected value) might not even be a possible result in this case. One-time games have a
12
problem with risk that affect the decision making: since risk is not spread out over many it-erations, the worst-case value of the chosen strategy might occur in a one-time game, ratherthan the expected value given by the optimal solution. The game in our scenario is considereda repeated game from the defender’s point of view. They will make this decision many times,possibly every day, and so can employ a mixed strategy if called for. From the enemy perspec-tive, this is perhaps a one-time decision, since putting together a VBIED attack is a large anddifficult operation, although the enemy could possibly conduct repeated attacks.
To solve a game such as we will develop for this scenario, linear programming is used [17].Player I has n pure strategies available and chooses mixed strategy X = (x1, x2, ..., xn) suchthat xi is the percentage of time he uses strategy i. Player I must always choose X such that
n∑i=1
xi = 1
This is the first constraint used in the linear program.
Player II has m strategies to choose from, indexed by the subscript j, and the game matrix isgiven by A (i.e., ai,j = the value in the matrix for row i and column j.) Player I’s value of thegame is given by:
E(X, j) = XAj = x1a1,j + x2a2,j + ...+ xnan,j ∀ j ∈ set of mstrategies
E(X, j) is the Expected Value of following strategyX when Player II uses pure strategy j.Also,by convention, Player I is usually maximizing, but in this case, the game matrix will representa cost function and not the usual utility value, so Player I wants to minimize the expected valueof the game, v. This gives the second constraint:
n∑i=1
(ai,jxi) ≤ v ∀ j
This is a set of constraints, with one for each column or strategy j that Player II can employ.If Player I has chosen his strategy optimally, his value of the game will always be at least asgood as v, no matter which strategy Player II chooses. Solving this linear program with an
13
optimization solver results in the optimal value of the game and the optimal solution strategyfor Player I. Solving for the dual problem will give the optimal strategy for Player II, and by theDuality Theorem will always result in the same optimal value for the game [18].
14
CHAPTER 3:Surveillance and Interdiction Model Development
3.1 UAV Search MethodThis research focused on a barrier patrol technique, as described in the previous chapter. TheUAV is sent in a somewhat circular path from one road to the next, rather than searching alongthe roads. Intuitively, when most people think about this problem, their initial answer is usuallythat the UAV should travel along the roads in some fashion. This maximizes the time searchingand should therefore increase the chances of detecting the target. That is a reasonable conclu-sion, and future research should certainly look at that strategy. However, this project insteadfocuses on a barrier-patrol method in which the UAV crosses and searches each road at a singlenode. This was done partially for reasons of analysis (as discussed below), but also becausehaving the UAV cover the area in between the roads can be useful as well. Depending on theterrain, vehicles are not restricted to roads. Although off-road travel will be slower, in many ar-eas, driving off road is feasible, and if the defenders never search the off-road areas, the enemycan pick up on that and will then utilize those approaches to attack the base. Also, insurgentsoften video record their attacks for use as propaganda or in an Information Operations cam-paign. The recorder will be located in an isolated area off of the main roads. Finally, in somecases, VBIEDs are remotely detonated. In these cases, the person detonating the VBIED willalso likely be in an isolated area away from the main road where he can observe and initiatethe explosion without being seen. Therefore, having a UAV cover the space in between roadsis useful and can increase the likelihood of the defenders detecting these people, while ignoringthose area will leave a vulnerable avenue of approach open for exploitation.
There are also some analytical reasons for utilizing a barrier patrol method instead of a linearsearch along the roads. Barrier Patrol techniques are an established search method with anexisting robust literature and analysis supporting them. It is a well-studied search method, andpart of the goal of this research is to determine how well this method can be applied to newareas such as in this scenario. A Barrier Patrol method also allows for a discrete modelingtechnique, whereas searching along the roads requires a continuous model. For example, if theUAV is searching along a road traveling away from the base and the VBIED is traveling towardthe base on the same road, if the model uses discrete time steps it is possible for the UAV andVBIED to jump past each other without the possibility of a detection. Although this particular
15
problem does not play a major role in this thesis, it does impact related work on this project,and therefore it was a consideration in selecting a barrier patrol technique to focus on.
3.2 UAV Employment FactorsThere are a vast number of factors that can be considered when working with UAVs, includingthe many different types of UAVs themselves. This project focuses on the small, tactical typeof UAVs, for which the primary defining characteristic important here is being launched, con-trolled, and recovered from the area of operations. Even in this narrow subset of UAVs thereare still many different factors that impact UAV performance. These include maximum speed,loiter speed, turning radius, control and communications range, endurance (maximum time offlight), impact of weather conditions, altitude, and others. The sensor on the UAV also has manyimportant characteristics to consider: type such as optical, infrared or thermal and full motionvideo versus still pictures, day or night capable, resolution, and fixed or moveable.
Each type of UAV and sensor combination will have specific characteristics related to detectionprobabilities, both false alarms and missed detections. Although false alarms (when a detectionis thought to be made but it turns out to be not a VBIED) are important considerations, thisproject does not specifically focus on those issues. Rather, the focus is primarily on misseddetections, when a VBIED is actually there and the UAV does not detect it. Although a falsealarm will result in deploying the QRF unnecessarily, it is clearly not as significant as a misseddetection which puts the base at a greater risk.
While specific detection probabilities are important considerations, this project looks at theemployment methods for a generic UAV without considering the specific characteristics of dif-ferent, individual UAVs and sensors. If the model is used in a specific situation with a givenUAV and sensor with known probabilities of detection, the model can be easily updated to re-flect those specific numbers. For the development of this model, however, the UAV sensor isconsidered to be perfect, and the probability of a missed detection or a false positive is ignored.In other words, if the target enters the UAV sensor sweep, a correct detection is assumed, and sothis project is more concerned with the employment methods of a general UAV rather than thedetection characteristics of a specific sensor type, which can be investigated more extensivelyin future work.
For this analysis, the basic route of the UAV is set going from one road to the next at a fixedroad distance from the FOB. The key variable for the UAV is the radius of its patrol from the
16
FOB. There are three measures of effectiveness to determine how well the UAV is employed:Patrol Efficiency, Search Effectiveness, and Patrol Success.
3.2.1 Patrol EfficiencyPatrol Efficiency is defined as the ratio of the amount of time the UAV spends searching to thetotal time of the UAV’s patrol. To calculate Patrol Efficiency, the UAV’s flight path must firstbe determined. As described, the flight path follows a periodic search pattern, going from asearch node on one road to a node on the next road all the way around and back to the originalnode to complete one circuit. A full patrol is made up of repeated circuits following the samesearch pattern. Because of this, the bulk of the patrol consists of flying these circuits, and theinitial transit from the base to the starting search node and the final transit back to the base aresmall parts of the overall patrol. To simplify the model, these two legs are ignored, and the UAVpatrol is considered to be just the route between search nodes. The starting point can thereforebe arbitrarily selected, and the patrol is considered symmetric, so the direction (clockwise vs.counterclockwise) is immaterial.
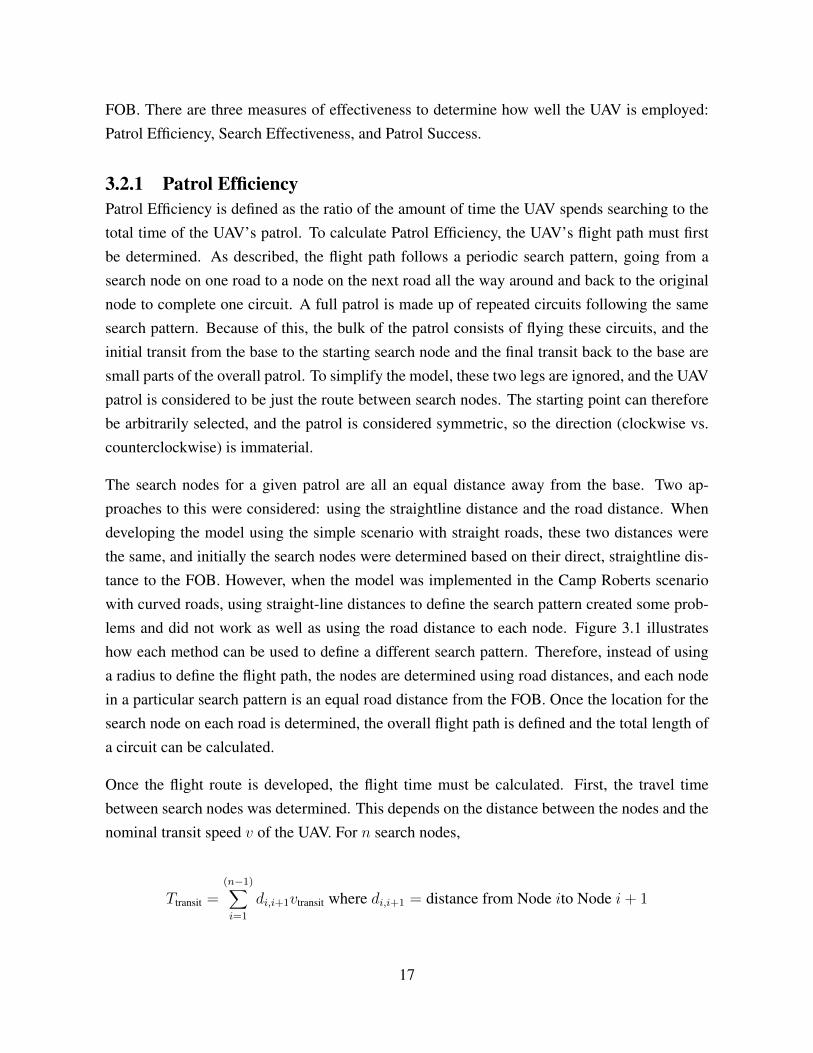
The search nodes for a given patrol are all an equal distance away from the base. Two ap-proaches to this were considered: using the straightline distance and the road distance. Whendeveloping the model using the simple scenario with straight roads, these two distances werethe same, and initially the search nodes were determined based on their direct, straightline dis-tance to the FOB. However, when the model was implemented in the Camp Roberts scenariowith curved roads, using straight-line distances to define the search pattern created some prob-lems and did not work as well as using the road distance to each node. Figure 3.1 illustrateshow each method can be used to define a different search pattern. Therefore, instead of usinga radius to define the flight path, the nodes are determined using road distances, and each nodein a particular search pattern is an equal road distance from the FOB. Once the location for thesearch node on each road is determined, the overall flight path is defined and the total length ofa circuit can be calculated.
Once the flight route is developed, the flight time must be calculated. First, the travel timebetween search nodes was determined. This depends on the distance between the nodes and thenominal transit speed v of the UAV. For n search nodes,
Ttransit =(n−1)∑i=1
di,i+1vtransit where di,i+1 = distance from Node ito Node i+ 1
17
Figure 3.1: Straight-Line vs. Road Distance Search Pattern: This diagram shows how the flight path can differ whendetermining the search nodes based on the straight-line distance or the road distance from the FOB. As shown, inthe straight-line search pattern there can be multiple search nodes on one road.
This is obviously a simplification and ignores several important factors, including wind andturning radius. As mentioned, the model treats the flight path as symmetric and does not con-sider direction, and so assumes there are no wind effects. The model also does not consider theturning radius of a UAV, which will be different depending on the specific type of UAV used.For these calculations, the UAV is assumed to pivot and move directly from one azimuth toanother. The impact of this assumption depends upon the specific road network. In the simplecase of straight roads, the azimuths of each leg of the route will always be the same regard-less of the radius to the search nodes, so this simplification removes a constant value from theoverall patrol length for each search pattern. As the road network gets more complicated withcurved roads, the impact of this assumption varies: in general, the greater the change in azimuthbetween legs, the more impact this simplification has.
Once the travel time between nodes is determined, the search time is calculated. Dependingon the UAV, it may fly slower when searching a node from its transit speed travelling between
18
search nodes. This speed and the distance of each search node determine the search time.
Tsearch =∑n
[dnvsearch
]∀ Search Nodes n where dn = distance across Node n
dn defines how big the search area at Node n is. For instance, a small rural road 8 m widerequires less time for the UAV to fly over and search than a four-lane divided highway that is80 m wide. The search distance can also be used to have the UAV spend extra time searching.The UAV could fly one or more circles over a search node, increasing the loiter time at thatnode. To represent this in the model, the distance of the search node is increased.
Adding the total search time to the total travel time results in the total patrol time. PatrolEfficiency is the time spent searching out of the total patrol time.
Patrol Efficiency =Tsearch
Ttransit + Tsearch
3.2.2 Search EffectivenessA measure of Search Effectiveness is then created, which combines the Patrol Efficiency withthe likely location of the VBIED. Search Effectiveness is the probability that the UAV detectsthe target (assuming perfect detection; more accurately this is the probability that the targetenters the UAV sensor sweep). Effectiveness equals the sum of efficiencies for Node c, where cis on Road j, times the probability that the VBIED is on that road.
Search Effectiveness =R∑
j=1
(Tsearch(Node j)
Ttransit + Tsearch
)P(VBIED on j)
Because this formulation sums over the roads and not the search nodes, it assumes the searchpattern contains only one node per road. This is in keeping with the barrier patrol technique asdescribed earlier. It also offers one reason why the search nodes are defined by road distancerather than straight-line distance, since as Figure 3.1 shows, the later method can result in mul-tiple search nodes per road. Figure 3.2 graphically demonstrates the ideas of Patrol Efficiencyand Search Effectiveness.
Consider a special case where all nodes and routes are equal. Since each search node is of equaldistance, the efficiency related to each node is equal. If the enemy is equally likely to use any
19
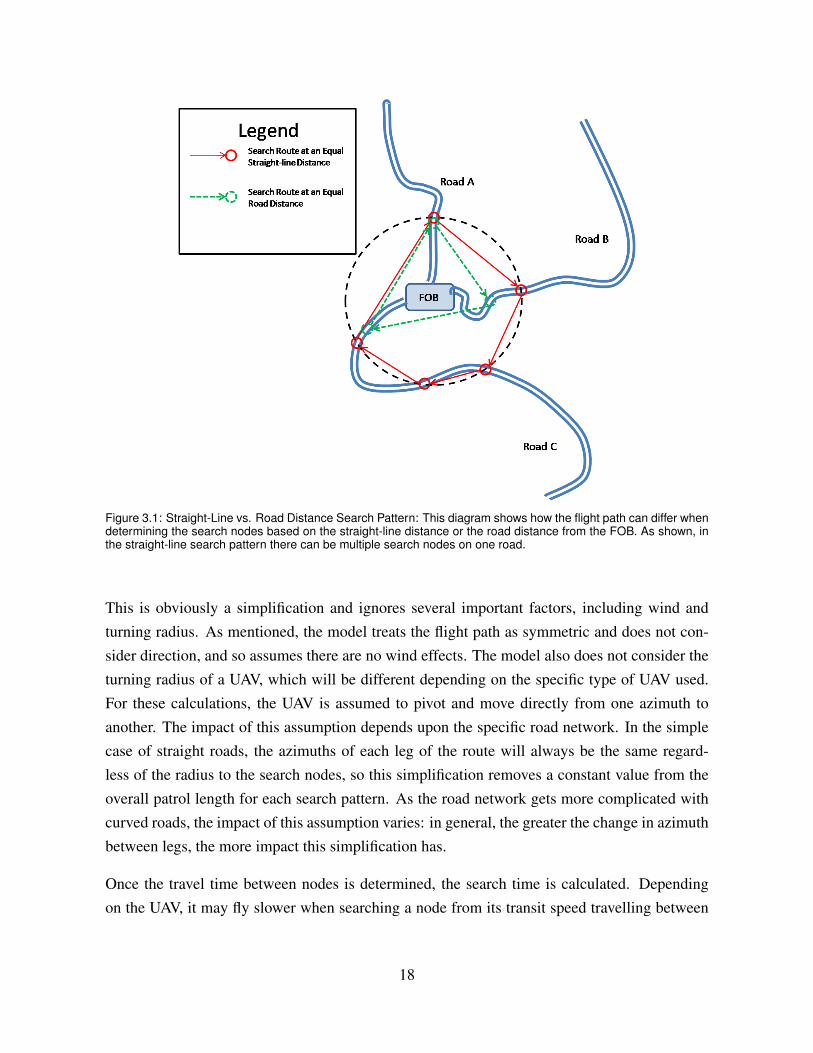
Figure 3.2: Impact of Search Distance: This graph shows the values of Patrol Efficiency and Search Effectivenessfor various distances.
of the routes, the probability that the VBIED is on a given route is 1/ (# of routes), assumingthat the enemy is definitely conducting an attack and the probabilities for each route sum to 1.Multiplying this probability times the efficiency gives the search effectiveness, which in thiscase is constant for each node. Therefore, in this special case of uniform target likelihoods andidentical roads, overall Search Efficiency = Patrol Effectiveness
# of routes .
3.2.3 Patrol SuccessThe final measure of effectiveness to be considered in this model of UAV employment is thePatrol’s Success. This is a measure of interdicting the VBIED and actually stopping the attack.It is a function of the Search Effectiveness and how far from the base the detection occurs.In order to be considered a success, the patrol must not only detect the VBIED, it must allowsufficient time and distance for a ground force to stop the target before it can cause damage tothe base.
Blast RangeTo begin with, a blast range for the VBIED is estimated. For this project, the blast range isarbitrarily set at 500 m. In practice, this range would be determined from intelligence estimatesthat predict the potential size of the VBIED and then using a look-up table to determine theblast range for VBIEDs of that size. The blast range represents the straight-line distance from
20
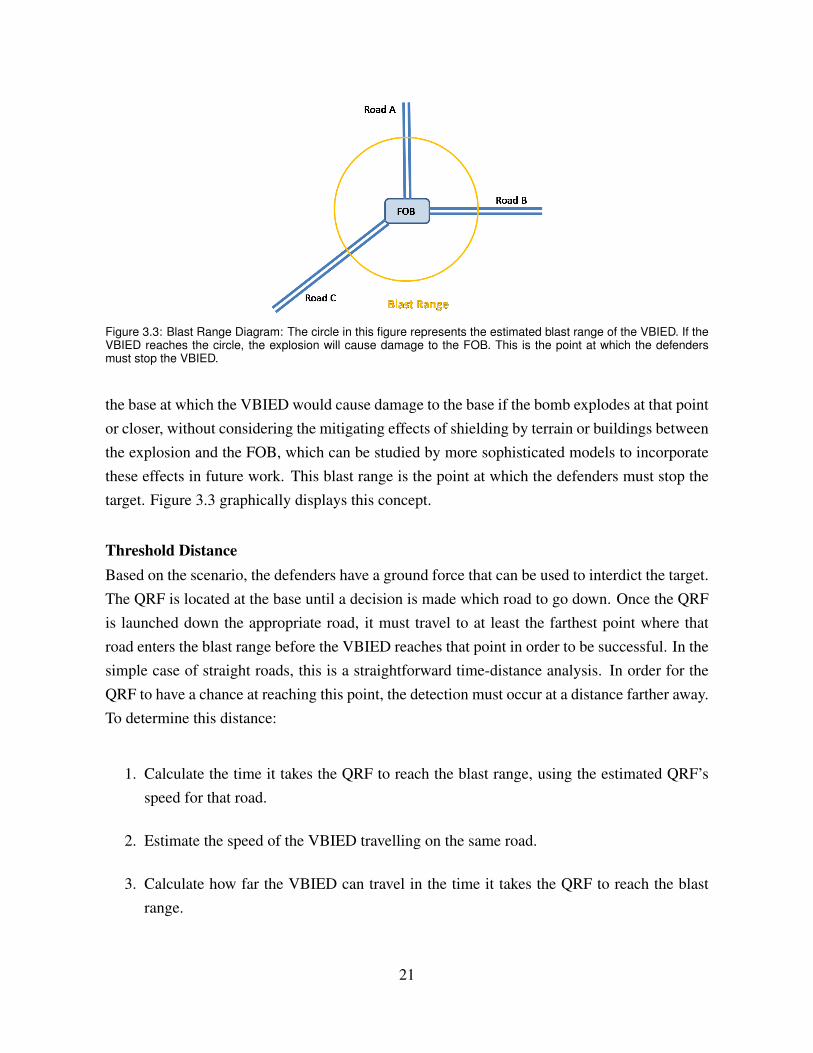
Figure 3.3: Blast Range Diagram: The circle in this figure represents the estimated blast range of the VBIED. If theVBIED reaches the circle, the explosion will cause damage to the FOB. This is the point at which the defendersmust stop the VBIED.
the base at which the VBIED would cause damage to the base if the bomb explodes at that pointor closer, without considering the mitigating effects of shielding by terrain or buildings betweenthe explosion and the FOB, which can be studied by more sophisticated models to incorporatethese effects in future work. This blast range is the point at which the defenders must stop thetarget. Figure 3.3 graphically displays this concept.
Threshold DistanceBased on the scenario, the defenders have a ground force that can be used to interdict the target.The QRF is located at the base until a decision is made which road to go down. Once the QRFis launched down the appropriate road, it must travel to at least the farthest point where thatroad enters the blast range before the VBIED reaches that point in order to be successful. In thesimple case of straight roads, this is a straightforward time-distance analysis. In order for theQRF to have a chance at reaching this point, the detection must occur at a distance farther away.To determine this distance:
1. Calculate the time it takes the QRF to reach the blast range, using the estimated QRF’sspeed for that road.
2. Estimate the speed of the VBIED travelling on the same road.
3. Calculate how far the VBIED can travel in the time it takes the QRF to reach the blastrange.
21
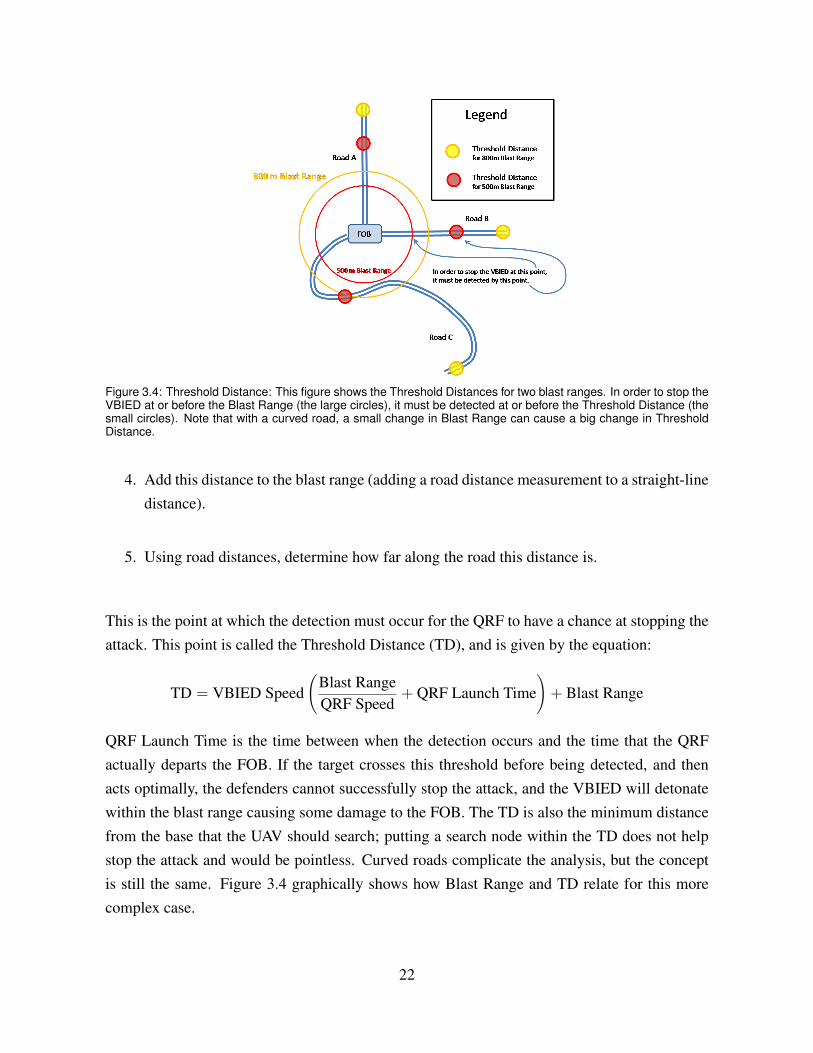
Figure 3.4: Threshold Distance: This figure shows the Threshold Distances for two blast ranges. In order to stop theVBIED at or before the Blast Range (the large circles), it must be detected at or before the Threshold Distance (thesmall circles). Note that with a curved road, a small change in Blast Range can cause a big change in ThresholdDistance.
4. Add this distance to the blast range (adding a road distance measurement to a straight-linedistance).
5. Using road distances, determine how far along the road this distance is.
This is the point at which the detection must occur for the QRF to have a chance at stopping theattack. This point is called the Threshold Distance (TD), and is given by the equation:
TD = VBIED Speed(
Blast RangeQRF Speed
+ QRF Launch Time)+ Blast Range
QRF Launch Time is the time between when the detection occurs and the time that the QRFactually departs the FOB. If the target crosses this threshold before being detected, and thenacts optimally, the defenders cannot successfully stop the attack, and the VBIED will detonatewithin the blast range causing some damage to the FOB. The TD is also the minimum distancefrom the base that the UAV should search; putting a search node within the TD does not helpstop the attack and would be pointless. Curved roads complicate the analysis, but the conceptis still the same. Figure 3.4 graphically shows how Blast Range and TD relate for this morecomplex case.
22
The Threshold Distance represents the minimum threshold given ideal circumstances and reli-able estimates. However, any number of factors could allow a successful VBIED attack even ifa detection occurs outside the TD. If the size of the bomb is underestimated and it is really largerthan anticipated, the actual blast range will be larger, and so even if the QRF stops the VBIEDat what was planned for as the blast range, the base could still be damaged in the explosion. Theestimates for travel speed could be wrong: the VBIED might go faster or the QRF could travelslower or road conditions might delay the QRF. In either case, if the detection happens right atthe TD, the defenders risk not being able to stop the VBIED in time. This also assumes the timeto launch the QRF once a detection is made is known. In practice this is highly variable: some-one will have to analyze the UAV image or video and decide if it is a legitimate detection, andthen decide to launch the QRF, and unless the QRF is sitting at the gate with the vehicle enginesrunning (which may not be feasible), there will also be time between the decision to launch theQRF and when it actually starts moving. All of these factors contribute to the possibility thatthe VBIED attack might be successful even if a detection occurs before the Threshold Distance.These facts motivate the need to study the robustness and sensitivity of any strategy employedby the defenders.
QRF Reward ValueTo mitigate these risks and allow the QRF the best opportunity to stop the VBIED at a safedistance, the defenders will want to maximize the distance at which the detection occurs. How-ever, the farther away from the base that the UAV flies, the less effective the search becomes, asdefined above. To maximize Search Effectiveness, the UAV should be flown as close to the baseas possible, thus minimizing the travel time between search nodes, which increases the PatrolEfficiency and leads to increased Search Effectiveness. These two competing interests conflictwith each other: one suggests flying the UAV as far away as possible (for earlier detection) andthe other flying the UAV as close to the base as possible (for increased chance of detection).
Patrol Success, then, combines these two conflicting measures of effectiveness. To do this, aQRF Reward Function is used to measure the value of detecting the target at a distance greaterthan the Threshold Distance. For this project, a simple linear function is used. If the detectiondistance is below the TD, the QRF reward value is negative, indicating the QRF has no chance ofsuccessfully stopping the attack. At the TD, the value function crosses the x axis; at this distancethe QRF reward value is zero, showing this is the minimum distance at which the defenders canbe successful. The function increases linearly, indicating that as the detection distance increases,the value for the QRF also continues to increase. However, a more accurate function can also
23
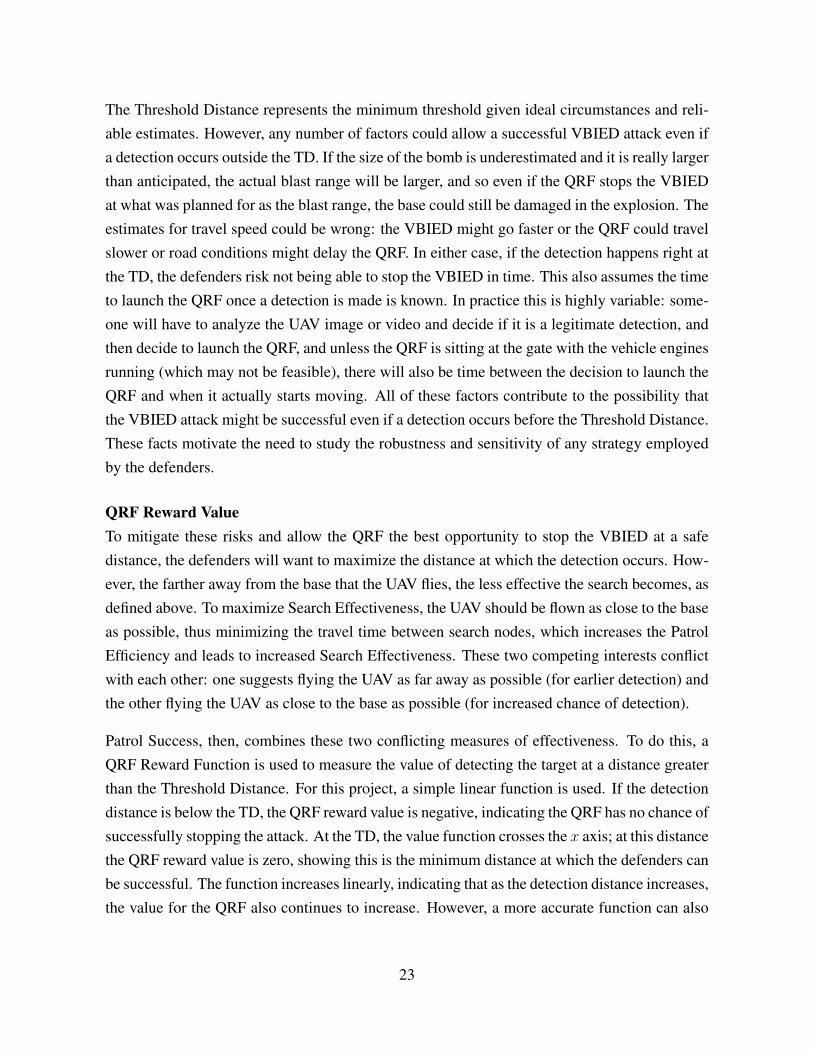
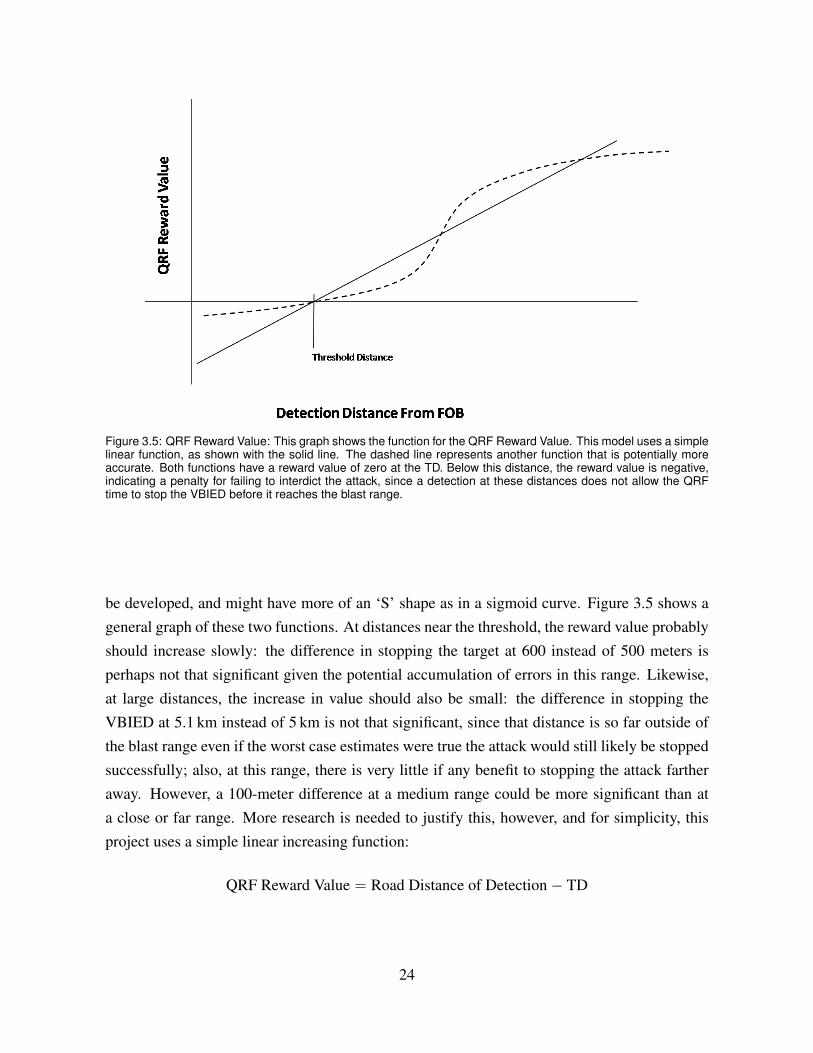
Figure 3.5: QRF Reward Value: This graph shows the function for the QRF Reward Value. This model uses a simplelinear function, as shown with the solid line. The dashed line represents another function that is potentially moreaccurate. Both functions have a reward value of zero at the TD. Below this distance, the reward value is negative,indicating a penalty for failing to interdict the attack, since a detection at these distances does not allow the QRFtime to stop the VBIED before it reaches the blast range.
be developed, and might have more of an ‘S’ shape as in a sigmoid curve. Figure 3.5 shows ageneral graph of these two functions. At distances near the threshold, the reward value probablyshould increase slowly: the difference in stopping the target at 600 instead of 500 meters isperhaps not that significant given the potential accumulation of errors in this range. Likewise,at large distances, the increase in value should also be small: the difference in stopping theVBIED at 5.1 km instead of 5 km is not that significant, since that distance is so far outside ofthe blast range even if the worst case estimates were true the attack would still likely be stoppedsuccessfully; also, at this range, there is very little if any benefit to stopping the attack fartheraway. However, a 100-meter difference at a medium range could be more significant than ata close or far range. More research is needed to justify this, however, and for simplicity, thisproject uses a simple linear increasing function:
QRF Reward Value = Road Distance of Detection− TD
24
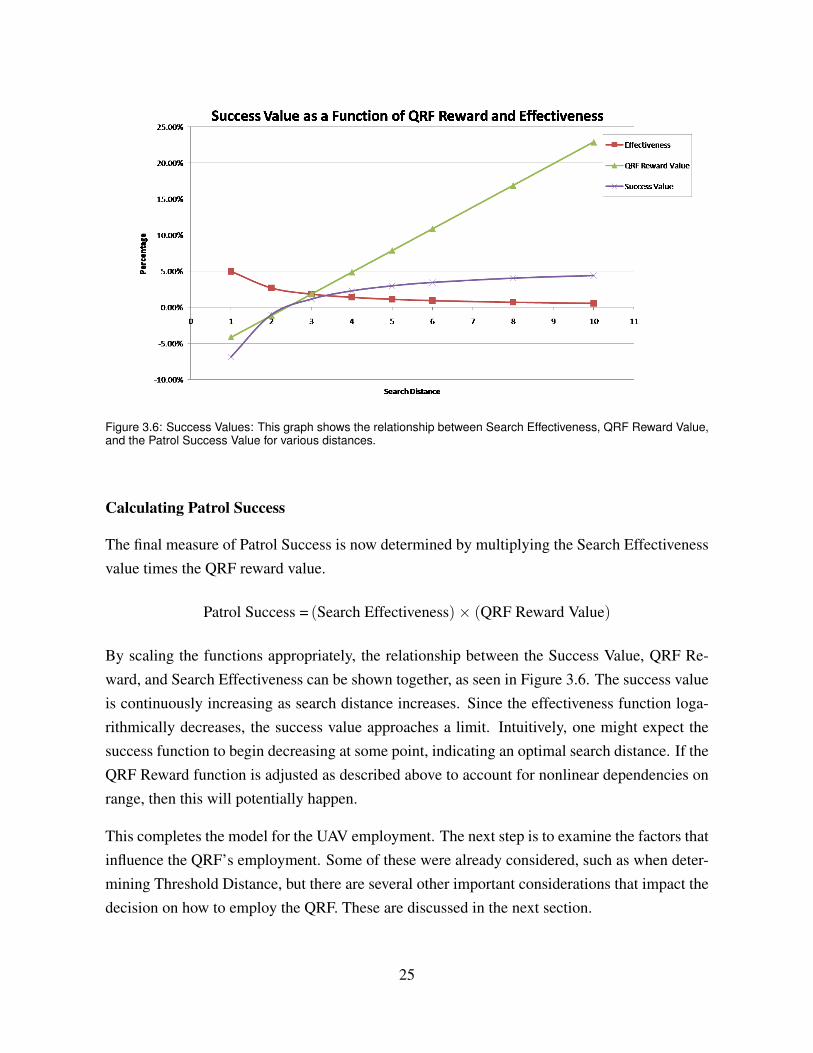
Figure 3.6: Success Values: This graph shows the relationship between Search Effectiveness, QRF Reward Value,and the Patrol Success Value for various distances.
Calculating Patrol Success
The final measure of Patrol Success is now determined by multiplying the Search Effectivenessvalue times the QRF reward value.
By scaling the functions appropriately, the relationship between the Success Value, QRF Re-ward, and Search Effectiveness can be shown together, as seen in Figure 3.6. The success valueis continuously increasing as search distance increases. Since the effectiveness function loga-rithmically decreases, the success value approaches a limit. Intuitively, one might expect thesuccess function to begin decreasing at some point, indicating an optimal search distance. If theQRF Reward function is adjusted as described above to account for nonlinear dependencies onrange, then this will potentially happen.
This completes the model for the UAV employment. The next step is to examine the factors thatinfluence the QRF’s employment. Some of these were already considered, such as when deter-mining Threshold Distance, but there are several other important considerations that impact thedecision on how to employ the QRF. These are discussed in the next section.
25
3.3 QRF Employment Factors3.3.1 CharacteristicsOnce the VBIED is detected, the second part of the defense takes place: interdicting or stoppingthe attack by the QRF. This is a ground-based unit that the defenders control and will use tointerdict the VBIED attack. Its specific characteristics will vary with the unit and locationinvolved, but in general, assume that the QRF meets the appropriate minimum requirementsof the given unit for a combat patrol to interdict a suspected VBIED. For many units, thoughnot all, this means at least two or three vehicles with three or more people per vehicle. It willalso have the appropriate weapons, communications, counter-IED equipment, and other missionspecific equipment in accordance with that unit’s Standing Operating Procedure (SOP). For thepurposes of this scenario, the QRF is modeled based on a SOF team with limited manpower andresources such that it cannot split into two separate elements: the defenders only have enoughforces to conduct one regular patrol at a time. Regardless of its specific characteristics, assumethat the QRF can perform the VBIED interdiction mission as given in this scenario.
Similar to the UAV, there are numerous methods of employment for the QRF. As stated in thescenario description, for the purposes of this project, the QRF is held on stand-by at the FOBwaiting for the detection of the VBIED and a decision to launch the QRF. Ideally, the UAVmakes this detection away from the base, but as a last line of defense the QRF can also self-detect the VBIED once it is in visual range of the base. Although in the field experiments theQRF did self-detect, the following analysis assumes that the UAV must make the detection.
3.3.2 Employment PossibilitiesThe key independent variable related to the QRF employment to be examined here is when tolaunch it. There is a finite range of feasible alternatives, from launching as soon as a detectionis made to waiting until the last possible moment that would still allow the QRF to stop theattack outside the blast range. There are several dependent variables used to evaluate the resultsof these alternatives, including various types of risk and costs.
At one end of the range of possibilities, the defenders could launch the QRF as soon as apossible VBIED is detected. This would ensure the target is interdicted as far from the baseas possible, limiting the chances of the facility suffering any effects from that attack. In asimple, straightforward scenario in which a single VBIED is the only threat, this would leadto maximizing the base’s security and is the best option. However, other factors complicate
26
the situation. By launching the QRF as soon as possible and having it stop the VBIED as farfrom the base as possible, the defenders reduce the opportunity for the QRF to respond to asecond threat coming on a different road. The identified target could possibly be a decoy, or asmentioned in the introduction, the use of multiple VBIEDs is not unheard of. Therefore, sometrade-off exists. Does the QRF maximize its chances of successfully interdicting the alreadyidentified target at the increased risk of an as yet unidentified second attack? Additionally,there are some other costs associated with deploying the QRF to stop the target as far away aspossible.
Travelling farther out to stop the VBIED also has a cost of increased risk to the QRF. Areasthreatened with VBIED attacks are also likely to face roadside IEDs, and so every extra miledriven puts that unit at increased risk of attack. If the QRF drives five miles to stop the VBIEDwhen it could have just as effectively stopped it at one mile away, then that is an extra eightmiles round trip that the QRF is exposed to a possible IED or ambush attack. Also, the fartheraway from the base the QRF goes, the more difficult it will be for the defenders to send out arescue team to help if the QRF is ambushed or to conduct a Medical Evacuation in the case ofcasualties. So by sending the QRF farther from the base, it is more likely to be attacked and theresults of an attack are likely to be more damaging.
There is also an increased cost of the QRF’s time spent travelling farther away. Dependingon the environment and Operations Tempo (OPTEMPO), even a small time increase could besignificant. For example, in 110-plus degree heat while wearing full battle gear, and extra 20 or30 minutes on a combat patrol will negatively impact effectiveness. Also, if the members of theQRF are kept too busy due to a high OPTEMP, fatigue can become a problem, and even a shortextension of a patrol may have a big impact.
Finally, there is also a small but increased cost for fuel and wear and tear on the vehicles byhaving them drive farther to interdict the VBIED. This is perhaps a negligible cost, and in gen-eral logistical considerations such as this should not drive operational decisions such as howto employ a QRF. However, in certain situations this cost might have greater importance. Forinstance, in a remote base where either the enemy or weather has temporarily cut off resup-ply, every gallon of fuel saved might be significant, and in this case the logistical costs of analternative should certainly have a greater weight in the decision making process.
Although interdicting the VBIED as far from the base as possible may seem like the idealsituation, for all of these reasons launching the QRF as soon as a detection is made might not be
27
the optimal decision. At the other end of the range of possibilities, the defenders could launchthe QRF as late as possible in order to interdict the VBIED at the blast radius (the minimumdistance from the base to avoid any blast effects against the facility). In other words, delaysending the QRF until it will reach the blast radius at just the right time to stop the target at thatpoint. This has the desired effects of minimizing the costs identified above associated with usingthe QRF (resources, time, risk) as well as increasing the chances that the QRF can successfullyrespond to a second attack. However, this strategy puts the base at increased risk. As mentionedin the discussion of the threshold distance, all of the factors that determine when the QRF shouldbe launched in this case are estimates, including speed of the VBIED, size and blast range ofthe bomb, and speed and response time of the QRF. Even if some of these factors are known,they may change once the decision is made. For instance, the UAV might be able to determinethe VBIED’s exact speed at the time of detection, but there is no way to predict its future speedwith complete accuracy and reliability. If the defenders use that information to decide whento launch the QRF in order to interdict the target at exactly the blast radius, and the VBIEDthen speeds up, the bomb will get inside the blast range and will cause blast effects against thebase. Similarly, the other factors used to make this decision are estimates and/or can changedepending on conditions of each specific situation. If any of these assumptions or estimatesare wrong or change, and the defenders delay so as to launch the QRF as late as possible, theVBIED could easily get within the blast range and damage the facility. Therefore, the strategyof waiting to launch the QRF as long as possible involves some amount of risk.
Ideally, some middle ground strategy between these two extremes can be found and used. Asmentioned, the trade-offs are amount of risk to the base against efficient use of the limited QRFresource. For the purposes of this project, the QRF employment methods are divided into threealternatives: launch as early as possible, as late as possible, and at a mid-point in between thetwo extremes.
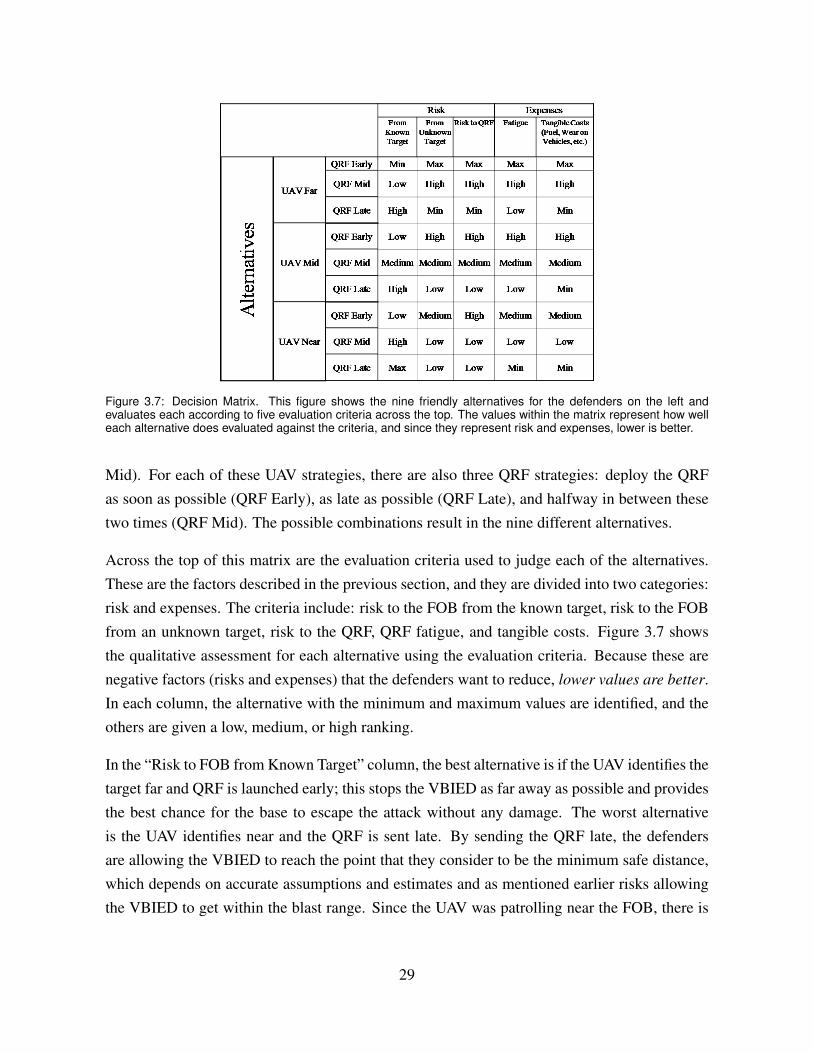
3.3.3 Decision MatrixAll of these factors are combined in a decision matrix to show how they all fit together, as shownin Figure 3.7. This is a 9x5 matrix: on the left are the nine friendly alternatives for the defendersand across the top are the evaluation criteria.
The alternatives are made up of the different UAV and QRF employment methods. There arethree UAV strategies: patrol far from the base (UAV Far), patrol near the base, but still outsidethe Threshold Distance (UAV Near), and patrol at a middle distance between these two (UAV
28
Figure 3.7: Decision Matrix. This figure shows the nine friendly alternatives for the defenders on the left andevaluates each according to five evaluation criteria across the top. The values within the matrix represent how welleach alternative does evaluated against the criteria, and since they represent risk and expenses, lower is better.
Mid). For each of these UAV strategies, there are also three QRF strategies: deploy the QRFas soon as possible (QRF Early), as late as possible (QRF Late), and halfway in between thesetwo times (QRF Mid). The possible combinations result in the nine different alternatives.
Across the top of this matrix are the evaluation criteria used to judge each of the alternatives.These are the factors described in the previous section, and they are divided into two categories:risk and expenses. The criteria include: risk to the FOB from the known target, risk to the FOBfrom an unknown target, risk to the QRF, QRF fatigue, and tangible costs. Figure 3.7 showsthe qualitative assessment for each alternative using the evaluation criteria. Because these arenegative factors (risks and expenses) that the defenders want to reduce, lower values are better.In each column, the alternative with the minimum and maximum values are identified, and theothers are given a low, medium, or high ranking.
In the “Risk to FOB from Known Target” column, the best alternative is if the UAV identifies thetarget far and QRF is launched early; this stops the VBIED as far away as possible and providesthe best chance for the base to escape the attack without any damage. The worst alternativeis the UAV identifies near and the QRF is sent late. By sending the QRF late, the defendersare allowing the VBIED to reach the point that they consider to be the minimum safe distance,which depends on accurate assumptions and estimates and as mentioned earlier risks allowingthe VBIED to get within the blast range. Since the UAV was patrolling near the FOB, there is
29
little time between detection and when the QRF must launch, and the defenders will not haveas much opportunity to update their estimates based on any information from the UAV (i.e., ifthe defenders had planned for a medium sized vehicle, but the UAV detects a large truck, theblast range should be increased.) In this alternative, there may not be time to accomplish thatanalysis and make the adjustments. If the UAV patrols farther out, the defenders will have moretime to analyze the information from the UAV and update the model.
The values in the “Risk to FOB from Unknown Target” are nearly reversed. The UAV Far andQRF Early alternative is the worst (Max) for this criterion, while it was the best previously. Inthis alternative, the QRF will be farther away from the FOB than in any other alternative, and soit will be less able to react to a new threat and interdict a second VBIED on a different road. Forthis criterion, deploying the QRF Late is the best alternative (Min), although rather than pairingit with UAV Near, which is the worst alternative in the previous column, in this case it is pairedwith UAV Far. This alternative provides the most time between detection and deploying theQRF to allow for more planning and to allow the UAV or QRF itself to detect a second threat.
The values in the “Risk to QRF” column are relatively straightforward. This criterion encom-passes the probability of a mishap to the QRF and the severity of the consequences. The prob-ability of the QRF being ambushed or attacked by a roadside IED is strictly a function of howfar it travels. The severity of the consequences is a function of both how far the QRF travelsand how much time it has before deploying. The farther the QRF is from the FOB, the longerand more difficult it will be for the defenders to send aid to assist the QRF if needed, resultingin more exposure to enemy fire and longer times to evacuate casualties, both of which tend toresult in more severe consequences. The values for this criterion are very similar to the previousone. Just as with that one, the UAV Far and QRF Early alternative is the worst because it has theQRF the farthest from the FOB. As the required QRF distance decreases, the risk also decreases.The three QRF Late alternatives all have the QRF traveling basically the same distance: out tothe estimated blast range. In these cases, the increased reaction time between detection anddeployment cause the values for UAV Far and UAV Mid to be better. This extra time betweenfinding out which route to take and deploying allows the QRF to do last-minute planning andcoordination along a specific route. This serves as a risk mitigation factor, so the best alternativeis UAV Far and QRF Late. Although these two columns are similar in this general model, eachrepresents a different criterion used to evaluate the alternatives. In a specific situation, condi-tions might be such that the values become different or the weighting of the criteria (discussedin the next section) changes, and so keeping these criteria separate is necessary.
30
Similarly, the last two criteria are also closely related but kept separate. The “Fatigue” columnrepresents how much the QRF is employed: this is the ‘wear and tear’ on the personnel inthe QRF. Again, the UAV Far and QRF Early alternative is the worst, because it requires theQRF to do and travel the most. As the QRF distance decreases, the fatigue value gets better.This also takes into account the time between detection (and when the QRF is put on alert)and deployment. The UAV Far and QRF Late alternative has the most time between alert anddeployment when the QRF is all prepared and ready to go. Although not as stressful as beingoutside the base on patrol, standing-by like this is not as good in terms of fatigue as relaxingwhile waiting to get an alert. Therefore, the best alternative for this criterion is UAV Near, QRFLate.
Finally, the “Tangible Costs” criterion simply measures such expenses as fuel, maintenance,and repair parts. These values are strictly a function of how far the QRF travels. Since the threeQRF Late alternatives have the QRF go the same distance to the blast range, these three are allthe same, with a Min value. This is the only column in which there are multiple Min or Maxvalues.
3.3.4 WeightsEach of the five evaluation criteria is given a weight which all together sum to one to showits relative importance to the others. These weights can be assessed through various meanscommonly used in Decision Theory analysis, such as direct assessment, equal weighting, rankreciprocal, or swing weighting. These weights will change based on the individuals involvedand the specific conditions of a given scenario. Figure 3.7 shows an example weighting in therow highlighted in gray, subjectively assessed for the given scenario. In this case, the risk fromthe known target is determined to be the most important consideration, and it is given the highestweight of 0.5. The risk from an unknown target and the risk to the QRF are considered equallyimportant, and both have weights of 0.2. For the expenses criterion, fatigue is weighted at 0.15,just slightly lower than the two previous risk criteria. As mentioned earlier, the Tangible Costscriterion is usually not an important consideration in this level of decision making, and so it isgiven a small weight of 0.05.
If circumstances change, these weights could change as well. For example, most deployed unitsnow have armored vehicles. If the defenders in this scenario have two of the better armoredvehicles, such as a Mine Resistant Ambush Protected (MRAP) vehicle, at the base for the QRFto use, the decision maker might feel that a weight of 0.2 for Risk to QRF is appropriate since
31
the QRF is secure in their armored vehicles. However, if both vehicles go out of service formaintenance problems and the QRF is forced to use unarmored vehicles for the next patrol,the decision maker should consider the Risk to QRF to now be a more important considerationand increase its weight accordingly until the armored vehicles are back in service. Similarly,the Tangible Costs criterion is usually not a significant factor, but based on the discussion inthe previous section it could become significant in certain situations, and if that happens itshould be given a greater weight. The other criteria weights, too, can change based on changingcircumstances.
3.3.5 Cost FunctionThe expected cost function for each alternative now needs to be calculated. Remember that thistable is measuring risk and expenses, so lower values are better. The qualitative values fromFigure 3.7 are converted to quantitative values as follows:
• Min = 0
• Low = 1 to 3
• Medium = 4 to 6
• High = 7 to 9
• Max = 10
The specific numbers within the low, medium, and high categories are subjectively assessed.The five values for each alternative are multiplied by the corresponding weight and then addedtogether. The value of the cost function, C, is given by the equation:
Ci =5∑
n=1
wnvi,n∀ i ∈ Set of Friendly Alternatives,
where vi,n = the value of alternative i evaluated against criteria n
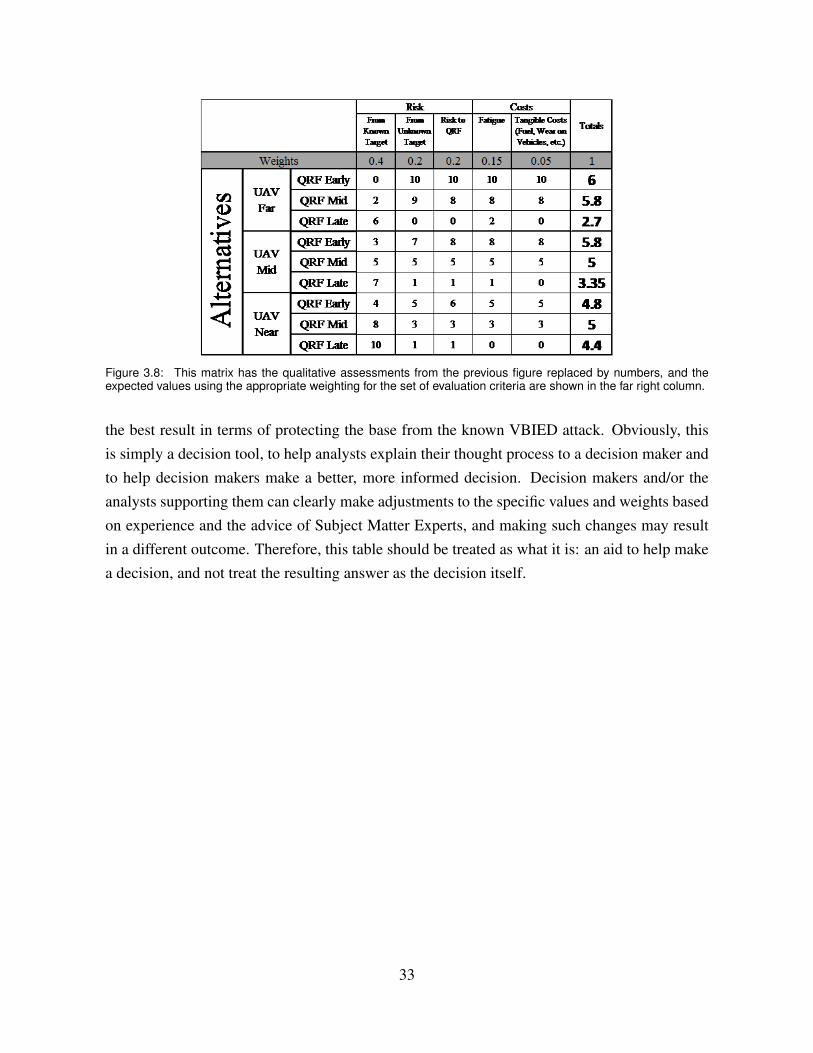
Figure 3.8 shows the final matrix, with qualitative assessments replaced by numbers, weights,and the total value of the cost function shown in the far right column.
In this example, the UAV Far and QRF Late alternative is the best, at 4.3. UAV Near and QRFEarly is second, at 4.6. UAV Mid and QRF Mid is the worst alternative at 6, although it provides
32
Figure 3.8: This matrix has the qualitative assessments from the previous figure replaced by numbers, and theexpected values using the appropriate weighting for the set of evaluation criteria are shown in the far right column.
the best result in terms of protecting the base from the known VBIED attack. Obviously, thisis simply a decision tool, to help analysts explain their thought process to a decision maker andto help decision makers make a better, more informed decision. Decision makers and/or theanalysts supporting them can clearly make adjustments to the specific values and weights basedon experience and the advice of Subject Matter Experts, and making such changes may resultin a different outcome. Therefore, this table should be treated as what it is: an aid to help makea decision, and not treat the resulting answer as the decision itself.
33
THIS PAGE INTENTIONALLY LEFT BLANK
34
CHAPTER 4:The Enemy Attacker
So far, everything presented in the model has been focused on the defenders and their options;the enemy thus far has been presented as an unthinking element, reduced to a VBIED attackthat the defenders know will happen but not when or where. In reality, the enemy is a thinkingopponent who has his own alternatives and strategies available to maximize the chances of hissuccess. To account for that, this project takes a game theoretic approach and examines thestrategic interactions between attacker-defender in this scenario.
4.1 Enemy CharacteristicsFor this project, the enemy is considered to be an insurgent or terrorist group opposing U.S.military forces in a combat zone, such as is found in Afghanistan. We assume the enemy isfully capable of conducting a VBIED attack as described in this scenario (i.e., they have accessto sufficient explosives and expertise to assemble a suitable IED as well as a commited driverwilling to conduct a suicide attack.) Additionally, we assume the enemy is secure during theplanning and preparation for the attack, to the point that the local defenders cannot disrupt theattack during this phase. Ideally, Counter-IED strategy focuses on disrupting the IED networkand the attack before it is implemented, but in this case we force the defenders to deal with theVBIED attack as it happens.
Although the enemy is assumed to be a fully capable, rational actor committed to the attack,this is a worst case scenario and the defenders should not ignore the possibility that unexpectedcircumstances will create a less than optimal enemy attack. If the defenders are following aQRF Late strategy, and the QRF has an unexpected delay leaving the FOB, they might assumethat there is no chance of stopping the attack if they believe the enemy will act optimally. Inthis case, the defenders might switch strategies completely, and rather than continue to sendout the QRF they might try to move everyone to a bomb shelter. In reality, there are numerousreasons why the attack may not proceed as well as the enemy would hope: the vehicle maybreak down, the road could be blocked, or the driver could have a change of heart and delay theattack. Although planning for the worst case is fine and appropriate, the defenders must alsorealize that the worst-case scenario might not happen and therefore not base all decisions solelyon that assumption.
35
4.2 Route Factors4.2.1 Enemy Use ProbabilityAlthough the simple scenario presented earlier assumes the enemy is equally likely to use anyroute, there are factors that would cause the enemy to prefer one route over another, and themodel developed in the previous chapter allows for this change in probability. These factorsare grouped into four general categories: security factors, physical terrain, human terrain, andimpacts on detection and interdiction. The defenders’ intelligence analysts should have anunderstanding of these factors and be able to provide information needed to develop an estimateof the probability that the enemy would use a particular route.
Security FactorsEach road will have a different level of security associated with it related to the presence oflocal or foreign military security forces. Roads that primarily go through insurgent controlledterritory where the U.S. military and local national security forces do not have a strong presencewill be more favorable for the enemy. The enemy will also want a secure location out of whichto stage the VBIED. If one of the three roads in this scenario passes through a village knownto be an insurgent stronghold or safe haven, the defenders should be more likely to expect theattack to come from that road. Conversely, roads through areas that are firmly controlled byfriendly forces or that pass by friendly or host nation forces’ facilities are less favorable for theenemy. If a particular road passes next to a police station or through a permanent checkpoint,for example, the enemy might be more reluctant to use that route than another one that avoidssuch locations.
Physical TerrainThe roads themselves factor into the probability of which route the enemy prefers to use. Forinstance, if the defenders expect a large truck VBIED, then the roads considered must supportthat vehicle. If a route crosses a small bridge or goes through a town with narrow streets andtight turns, the enemy will be less likely to use that route for a large VBIED. There would bea greater chance of the attack being disrupted by the truck getting stuck in the town or by thebridge breaking, and so although the route might remain a possibility it would be less likely tobe used. Speed of travel on the road is also a consideration. A road that consists of portionsthat are little more than rocky dirt tracks through the mountains means very slow travel, whichcreates more exposure for the VBIED and more time for the bomber to change his mind, sothe enemy might be less likely to use that route. Various other similar factors can influence
36
the likelihood that the enemy will use a particular route. For each specific situation, the roadnetwork must be analyzed to determine an estimation of these probabilities.
Human TerrainThe people along a route are also a consideration in determining how likely the enemy is to usea particular road. Different from the Security Factors which focuses on the military and policecontrol of an area, this factor considers the sentiments of the local people and whether theyfavor the insurgents or the defenders. The enemy will prefer a road that travels through areaswhere the local people support the enemy’s cause. If the vehicle develops mechanical problemsor if the defenders’ actions require a delay in the attack, the enemy will be more likely to findsanctuary and support along a road that is in such an area. In an area where the people areagainst the insurgents and support the friendly forces, the enemy might not find the neededsupport from the local people. Also, people unfriendly to the insurgents will be more likely toreport to the defenders if they notice an outsider or suspect something is wrong. Consider thesituation in Iraq during the high point of Sunni/Shia tensions. Imagine the results if a Sunniinsurgent drove through a Shia town on his way to conduct a VBIED attack and the car brokedown in that town: he most likely would not find anyone sympathetic to his plight willing toprovide supprt, and the defenders might receive a good tip on the attack from one of the locals.Ideally, the enemy will avoid this situation and try to stay in areas that are friendly or at leastneutral towards them.
Impacts on UAVIn addition to impacting the probability that the enemy will use a particular route, unique localconditions along each route also impact the ability of the UAV to make an accurate detection.As stated earlier, this project does not consider the impacts of different UAV sensors or theirspecific probabilities of missed detection. However, variations in the probability of missed de-tection in different areas due to local conditions are important factors considered in this project.There are many different reasons for these variations, several of which are explained here, andfor each specific situation these factors will have to be analyzed to determine the appropriateprobabilities.
To analyze these variations, start with the baseline probability of a missed detection, β, whichwill be unique to each sensor. Imagine that the VBIED is in the ideal setting with perfectconditions to make an accurate detection: the probability of a missed detection in this case issimply β based solely on the sensor. In such a situation, the target is most likely stationary, or at
37
least slowly moving at a constant speed, on a straight and level road. The lighting conditions areperfect for the particular sensor being used, and there are no obstructions that could block theVBIED from the sensor’s view. Of course in the real world perfect conditions do not exist andthere will be numerous factors that degrade the sensor’s ability to make an accurate detection.
For example, the road could travel through a forested area with large trees where the vegetationobstructs the UAV’s sensor, or it could go through an urban area with tall buildings that willmask the road from the UAV’s view unless the UAV is directly over the road. Both situationswill limit the UAV’s ability to detect the target, increasing the probability of a missed detection.Rolling terrain will also negatively impact the probability of detection compared to flat terrain;in general, the steeper and higher the hills, the harder it will be for the UAV to see the target.
Environmental factors might also be a significant impact. Depending on the size of the areabeing searched, environmental factors might impact the whole area equally, such as overcastskies or heat shimmer from high temperatures. However, if in a particular situation there arein fact environmental factors that impact only a specific area, they should be considered. Forexample, if one road travels through an area that always has thick morning fog and there israrely fog on the other roads, then the area prone to fog should have a higher probability ofmissed detection. Similarly, a road might pass by a land fill that burns trash, resulting in smokeand haze along that section of road, which will reduce the UAV’s ability to detect the targetthere.
Finally, background noise along each route is also a consideration when assessing probabilitiesof missed detection. This model assumes that the UAV is able to determine which vehicleis a VBIED, thus making an accurate detection. How this is accomplished is not addressed:perhaps the area is remote enough that the defenders know all of the local vehicles and canrecognize a vehicle that does not belong in the area and will assume it to be the VBIED, or futuretechnology is able to accurately detect the VBIED itself rather than just the vehicle (explosivessensors as called for in the DHS solicitation for research). In any case, the mechanics of howthe determination is made are not important here—except that however it is done, increasedbackground noise will make that detection more difficult. If the target is the only vehicle onthe road and the sensor and analyst are able to focus exclusively on it, the probability of a gooddetection is higher than if the target is mixed in with many other vehicles and the sensor andanalyst must examine all of them. Therefore, traveling through areas with other vehicles willtend to increase the probability of a missed detection.
38
Impacts on QRFJust as local conditions along the roads impact the UAV’s ability to detect the VBIED, they canalso impact the QRF’s ability to interdict the VBIED. In a similar manner, these factors needto be identified and analyzed, and a probability of missed interdiction can be developed foreach area. For example, just as an increased number of vehicles can make detecting the targetmore difficult, it can also make stopping the target more difficult. Imagine that the QRF hasto stop a single vehicle traveling along an otherwise empty highway; now compare that withtrying to pick out and stop a specific vehicle on a busy highway where there might be dozensof vehicles passing by every few seconds. Interdicting the VBIED in the second situation issignificantly more difficult, and unless the QRF has sufficient resources to enforce a checkpointon the highway, the probability of a missed interdiction at that location will be higher thanin the situation where the target is the only vehicle on the road. Similarly, other factors willalso influence the likelihood of the QRF successfully stopping the VBIED or having a missedinterdiction and letting the VBIED get past.
4.3 Probability TablesBased on the above route factors, two tables are developed to reflect the information about theimpacts of local conditions along the different routes that the enemy can attack on: a probabilityof missed detection table and a probability of missed interdiction table. These probabilities aresubjectively assessed and are not based on analytical or experimental data. These tables areprimarily used to represent the relative likelihood of a missed detection or interdiction at agiven area versus another, rather than the actual value of that probability. In keeping with theemployment methods of both the UAV and QRF, in which they are sent far from the FOB, keptnear the FOB, or sent to a mid-point, the attack routes are also divided into far, mid, and nearareas.
4.3.1 Missed Detection TableThis table deals with the UAV, so each row represents a UAV strategy: Far, Mid, and Near. Foreach road, the probability of a missed detection at those three distances is assessed. We assumea baseline probability of missed detection of 0.2 and increase that for local conditions. Table 4.1shows an example based on the scenario set at Camp Roberts. See Appendix A for an annotatedmap of this area showing the FOB location and three roads under consideration.
Road 1 is fairly open with good visibility along its entire length, which is good for low misseddetection rates, but at the near and far distances, there are some steep and curvy sections where
Table 4.1: Missed Detection Table. This table shows the probability of a missed detection by the UAV at differentareas (far, mid, and near) along each road.
the road goes over and around hills, raising the missed detection rate. The entry node for Road1 is at an intersection with a larger main road, so there is potentially more traffic in that area,and this background noise raises the missed detection rate slightly higher as well. For Road 1,the probabilities of missed detection are 0.6, 0.3, and 0.5 at the far, mid, and near distances.
Road 2 is named Canyon Road and, as might be expected, it travels through a small canyon,with steep and tall hills on both sides of the road. The terrain along this road limits the abilityof the UAV to clearly see a vehicle on the road except when the UAV is nearly or directly overthe road (i.e., when the UAV is approaching the road the hills mask the road at the bottom ofthe canyon until the UAV is close, whereas when the UAV approaches the other roads, it cansee those roads from a greater distance.) Additionally, there is a small riverbed at the bottomof this canyon along the length of the road, and so the vegetation along Road 2 is significantlygreater than along either of the other roads, especially the trees which are larger and morenumerous. Both of these factors, the terrain and vegetation, result in higher probabilities ofmissed detection along Road 2, which gets values of 0.6, 0.7, and 0.6.
The entry node for Road 3 is near an airfield which also serves as the base area for everyoneinvolved in the various field experiments, so this area is busy and the extra vehicles (i.e., back-ground noise) make an accurate detection more difficult. Also, the airspace near the airfieldis sometimes restricted limiting the UAV’s ability to search that area. Therefore, the UAV Fararea on Road 3 has the worst probability of detection at 0.8. The middle section of this road isstraight, flat and open, which make for good detection rates when the UAV can fly in that area,but it is still within the airfield’s airspace which can limit the UAV’s flight; this section of roadgets a value of 0.5. The near section is out of the restricted airspace, but hilly terrain in this areapartially masks the road, so this section also gets a value of 0.5.
4.3.2 Missed Interdiction TableThis table deals with the QRF and each row represents a QRF strategy and how far from theFOB the QRF will travel. As with the previous table, for each road the probability of a missed
Table 4.2: Missed Interdiction Table. This table shows the probability of the QRF missing the target for each QRFalternative on each Road.
interdiction at each of those distances is assessed. Table 4.2 shows the results of the exampleanalysis done for the Camp Roberts scenario.
The probabilities of missed interdictions along Road 1 are given as 0.5, 0.6, and 0.3 for QRFdeploying Early, Mid, and Late, respectively. In addition to the intersection with a main roadat the end of Road 1, there are two facilities along the middle section of this road which cangenerate traffic. If the QRF deploys Early or Mid, it may encounter extra vehicles that couldinterefer with stopping the VBIED. Also, the middle section of this road has several easilyaccessible side roads that dip behind the rolling terrain on which the VBIED could hide toescape notice of the QRF (particularly if the driver notices the dust cloud from the QRF vehicleor if a spotter informs the VBIED driver that the QRF is approaching). Therefore, the middlesection gets the highest value for this road.
Road 2 is the easiest attack route on which the defenders can interdict the target. Although theriverbed and hilly terrain make detecting the VBIED difficult, they also make interdicting thetarget easy. Once the VBIED is on the road, it is very hard to get off the road until reaching theFOB location. There are only a few sites at which a vehicle can cross the riverbed, and the fewjeep trails leading up the hill sides are steep and difficult to drive on. This is also a smaller roadwith little traffic to interfere with the QRF. Therefore, the probabilities that the QRF will fail tointerdict the VBIED on this road are small, and they are assessed as 0.3, 0.1, and 0.2 when theQRF deploys Early, Mid, and Late.
If the QRF deploys Early on Road 3, it will encounter the heavy traffic around the airfield andheadquarters area. Therefore, the probability of a missed interdiction in this area is high, givenat 0.8. However, the rest of this road is relatively clear and the QRF should have little or nointereference. There are a few opportunities for the VBIED to slip off the road along the middlesection, though not as much as on Road 1, and as this road gets closer to the FOB the easier itbecomes to interdict the VBIED. The Mid section gets a value of 0.5, and if the QRF deploysLate the missed interdiction rate is assessed at 0.3.
Now that both the defender and attacker considerations have been examined and a model foreach developed, this project considers the strategic interactions between the two sides. UsingGame Theory, we determine the optimal strategies that each side should employ. This scenarioresults in a two-person, zero-sum game. A generalized formulation is presented first followedby a specific example based on the previous Camp Roberts scenario, and then a solution methodusing linear programming is developed. Several different examples are shown to highlight howthe solution changes as the variables in the scenario change, and finally sensitivity analysisshows how to determine when to expect the solution to change.
5.1 Game Matrix DevelopmentTo examine the strategic interactions between the defenders and attacker in this scenario a two-person, zero-sum game is used. Table 5.1 shows the game matrix for this scenario with examplepayoffs. Player I, the row player, represents the defenders; Player II, the column player, is theattacker. The defenders have nine strategies available, as explained earlier: combinations ofthe three UAV strategies of far, mid and near, with the three QRF strategies of early, mid, andlate. These nine strategies are set and will not change with different scenarios. The strategiesfor the attackers are simply the roads available on which to conduct the attack. In a generalizedformat, there are as many attacker strategies as there are roads, and in the specific Camp Robertsscenario there are three.
Figure 5.1: Payoff Matrix: This is the game matrix for the specific given scenario. It shows the nine defender strate-gies and the three attacker strategies, along with the corresponding payoff value for each pair of attacker/defenderstrategies.
43
The payoffs in the matrix represent the likelihood that the VBIED attack will be successful.Therefore, the defenders are minimizing and the attackers are maximizing. For this purpose, thegame is zero-sum: if the defenders succeed then the attackers fail, and vice versa. In order forone side to do better or gain an advantage, the other side must do worse or have a correspondingdisadvantage.
The payoff values are determined based on three components: the measure of risk and expense,the probability of a missed detection, and the probability of a missed interdiction. Figure 3.8shows the cost function for each defender strategy, Table 4.1 shows the likelihood of the UAVmissing the target on a given road for each UAV employment method, and Table 4.2 shows thelikelihood of the QRF failing to interdict the target on a given road for each QRF employmentmethod. These three values are multiplied together for each cell in the game matrix to completethe payoff values, as shown in Figure 5.2.
5.1.1 General FormulationThe game matrix is given by the following formulation:
Indicess: Defender strategiesu: UAV employment methodq: QRF employment methodr: Attacker strategies (i.e., which road the VBIED is on)n: the number of roads leading to the FOB
SetsU : set of UAV employment methods, for u ∈ U = {Far, Mid, Near}Q: set of QRF employment methods, for q ∈ Q = {Early, Mid, Late}SU,Q: set of defender strategiesR: set of attacker strategies, for r ∈ R = {1, ..., n}
DataCsu,q = cost function of strategy sDu,r = Probability of Missed Detection on Road rusing UAV employment method uIq,r =Probability of Missed Interdiction on Road r using QRF employment method qPsu,qr = Csu,qDu,rIq,r: Payoff value given defender strategy s and attacker strategy r
44
5.1.2 Scenario Specific MatrixUsing the method described above, the specific payoff matrix for the given scenario is devel-oped. Figure 5.1 shows this example game matrix, based on the values used previously.
5.2 Game Solutions5.2.1 General SolutionTo solve this game and determine the optimal strategy or mixed strategy solution, linear pro-gramming is used. The Objective Function, Z, is the payoff value resulting from the strategiesused, which the defenders wish to minimize. The decision variables are how much the defend-ers should use each of their nine strategies, given as a percentage. These variables are labeledXs∀s ∈ S. In a pure strategy solution, exactly one of these variables will have a solution valueof one and the others will all be zero. In a mixed-strategy solution, all of the variables will havea solution greater than or equal to zero but less than one, and the sum of all nine variables mustequal one.
To determine the Objective Function value, consider each of the attacker strategies in turn. Ifthe enemy chooses route 1, then the resulting objective function will be the sum of the payoffvalues for route 1 for each defender strategy times the percentage of time that strategy is used,
∑s∈S
Ps,1Xs
If the defenders have chosen an optimal strategy solution, this sum will be no greater than theoverall optimal objective function (i.e., the value that is mutually optimal to both the defendersand attackers). If the enemy chooses a sub-optimal strategy, the defenders could do betterthan this optimal objective function, but they are guaranteed to do no worse. Therefore, thisrelationship results in the following constraint:
∑s∈S
Ps,1Xs ≤ Z
A similar constraint is developed for each of the other attacker strategies, given by the generalform: ∑
s∈SPs,rXs ≤ Z ∀ r ∈ R
45
The final constraint, which was previously mentioned, is that the sum of the decision variablesequals one: ∑
s∈SXs = 1
These constraints provide the means to solve the linear program and determine both the optimalstrategy solution and the objective function value for the game. This linear program was im-plemented in the General Algebraic Modeling System (GAMS) as shown in Appendix B. Theattackers’ optimal strategy solution can be obtained in a similar fashion, or more directly fromthe dual problem.
5.2.2 Scenario Solution
As an example of a specific solution, the Camp Roberts scenario is solved using the data pre-sented previously. Figure 5.2 compiles all of the relevant information and shows how it isrelated in one diagram. With this payoff matrix, the solution is for the defenders to use thestrategy UAV Mid/QRF Mid, while the attackers’ optimal solution is to attack from Road 3.The optimal objective function value is 0.8.
As developed, this particular scenario results in a pure strategy solution. Different data mayresult in different solutions, and in some cases a mixed strategy solution. Consider the MissedDetection Probability value for UAV Far on Route 3, which is the highest value in the table.Now assume that the reasons for that high value change: for example, perhaps that section ofroad went through a dense forest area resulting in a high chance of a missed detection, and so thedefenders decide to cut down the trees along the road. Without judging the other consequencesof such an action, it does have the result of making it easier for the UAV to detect a vehicleon the road in that area. Therefore, the Missed Detection Probability could go from 0.8 to 0.3,resulting in a new payoff matrix as shown in Figure 5.3. As expected since the defenders haveimproved their detection ability, the objective function value has also improved, from 0.8 to0.55. The defenders now have a mixed strategy solution and should employ UAV Far/QRF Mid65% of the time, and UAV Far/QRF Near 35% of the time. The attackers also have a mixedoptimal strategy solution. They should still use Road 3, but only 68% of the time, along withRoad 1 32% of the time.
46
Figure 5.2: Payoff Matrix Development: This figure shows how the cost function values, the Probability of MissedDetection and Probability of Missed Interdiction are multiplied together to create the payoff matrix for a specificscenario.
5.3 Sensitivity AnalysisChanging the values in the probability tables as described above generally requires changing theconditions of the scenario and cannot be arbitrarily done. However, the other component of thepayoff values, the cost function, does have an element of arbitrariness: the weighting applied tothe values of the evaluation criteria is arbitrarily determined by the analyst or decision makerbased on what they consider to be more or less important. Determining the sensitivity of thesolution to changes in these weights is a useful approach to analyzing the problem. As it is setup, the linear program does not lend itself to easy sensitivity analysis on the weights becausethese elements become part of the constraint matrix. Converting to the dual problem shifts
47
Figure 5.3: Revised Payoff Matrix: This game matrix shows the revised payoff values after a change in conditionschanges the Missed Detection Probability for UAV Far on Road 3 from 0.8 to 0.3.
the constraint matrix A in the primal problem to the costs of the objective function in the dualproblem. The weights now are part of the costs C, to which sensitivity analysis can be applied.For each specific game, this will provide a range for the weights for which that solution remainsvalid.
48
CHAPTER 6:Field Experiments
As part of this research project, several field experiments were conducted to collect additionaldata and to validate the results. These experiments were primarily done at Camp Roberts ArmyNational Guard Base in California, through the NPS-SOCOM Cooperative Field Experimenta-tion Cooperative. The first set of experiments was conducted in November, 2009, and was usedmainly to confirm the suitability and realistic nature of the scenario as well as the viability ofthe technology available to support the experiment. At this time, the parameters of the scenariowere determined, including the FOB location, road network to be considered, and the distancesfor the search and entry nodes. The UAV and its sensors were also tested. The primary UAVavailable was the NPS Rascal with a high-resolution full-motion video camera. The alternateplatform available was the Raven UAV. Both UAVs were determined to be feasible in order tosupport the experiment, although the Raven was determined to be inadequate from an opera-tional perspective. After confirming the details of the scenario in this initial testing period, thefield experiment was further refined and developed and fully implemented in May 2010.
6.1 Experiment ProceduresAppendix C contains the procedures used for this experiment as briefed to the participants. Thepurpose is to test the model that was developed and described previously. To do this, a singleQRF consisting of a driver and navigator in a tactical military vehicle was stationed at the three-way intersection where the notional FOB was positioned. Two other drivers in civilian vehiclesplayed the role of VBIED attackers. On a pre-determined schedule, these vehicles departed theirdesignated entry nodes on each of the three roads and drove towards the FOB. The UAV wasflying its designated patrol route of either far, mid, or near to the FOB. The entire experimentwas controlled from the experiment facility’s Tactical Operations Center (TOC), where the UAVvideo feed was monitored. If the attacking VBIED was detected by the UAV, the TOC informedthe QRF which then moved down the appropriate road to interdict the target. If the UAV missedthe target and the QRF was able to detect it, the QRF would initiate movement on its own tostop the attack. If neither element detected the VBIED, which happened occasionally, then theVBIED would reach the intersection and that iteration would be considered a successful attack.At the conclusion of each attack, the VBIED returned to its starting point and the QRF returnedto the FOB location and awaited detection of the next VBIED.
49
Ideally, the full model would have been tested, with multiple iterations conducted for each of thenine friendly alternatives. Due to time constraints and the limited availability of the UAV, onlythree separate runs were planned, each for a one hour time period, which was the approximateflight time for the UAV. Each UAV flight was to represent a different search radius (far, mid,or near), but only the QRF Early alternative was tested each time (i.e., the QRF was alwayslaunched as soon as a detection was made; this experiment did not try to test for delaying theQRF launch under the mid or late alternatives). Due to weather, technology, and schedulingproblems, only two successful UAV flights were actually conducted, one at the far and one atthe near search ranges.
To determine the accuracy of the model, the following data was to be collected:
• Time each VBIED began moving
• Time and location the VBIED was detected
• Time the QRF began moving Time and location that the VBIED was stopped
• Time the VBIED reached the intersection (if not detected and stopped)
6.2 ResultsIn this experiment, a total of twelve iterations were conducted. In only two iterations did theUAV make a detection (reasons for this low success rate are discussed below). Due to the lackof data and good runs, no significant analytical conclusions can be drawn from these results.However, the results are instructive to demonstrate how the experiment procedures are supposedto work as well as for developing a future framework for analyzing results from the follow-oncapstone experiment.
The UAV first detected a VBIED on Road 1 at 1144 hours at the second search node (approx-imately 2 km from the FOB). The QRF was tasked to interdict the VBIED and left the FOBat 1145. At 1150 the QRF interdicted the target at approximately grid 004571. This shows asuccessful operation using strategies UAV Mid and QRF Early.
The second detection occured at 1159 on Road 2, where the UAV detected another VBIED. Thisdetection was in the vicinity of grid 009559, approximately 500 meters from the FOB. This wasnot at a search node and was within the range of the first node. The QRF immediately departed
50
and interdicted the VBIED at 1200 at approximately grid 004995, about 150 meters from theFOB. Although this iteration demonstrates the ideal interaction between the UAV and QRF,since the detection occured within the Threshold Distance it was not a successful operation, andthe VBIED was able to get close to the base.
Of the remaining eight iterations, the QRF detected the VBIED on its own five times, but theinterdictions in those cases were all within 500 meters. On three iterations, the VBIED was notdetected at all and was able to drive all the way to the FOB location.
6.3 ObservationsIn addition to the analytical results, several other observations and lessons learned resultedfrom this experiment. In particular, the Raven proved to be an inadequate platform for thistask. The speed and sensor capabilities of this UAV were not sufficient to conduct the searchover such a large area. Its flight characteristics and handling capability in windy conditionsalso made flying a designated search route difficult. The network reliability and connectivitywith the Raven system also made controlling the experiment from the TOC difficult. Otherrelated experiments within this research project utilize the Raven to track a known target, andthe Raven seems better suited for that task, although when flying into even a moderate headwindthe Raven’s slow speed was still a problem when tracking a vehicle. For the task of flying arepeated search pattern to detect an unknown target, the Raven was particularly ill-suited. Sincethe Raven is the primary UAV system used by frontline tactical units (including SOF teams),the surveillance and interdiction method developed in this model may not be appropriate forthose units to employ if they have to rely on the Raven. This method is better reserved for unitsthat have access to a larger UAV system.
Another significant observation related to the UAV comes from the fact that they were support-ing the experiment but did not actually belong to the experiment controllers. Just as in the realworld, these UAVs had other tasks to accomplish and competing priorities created problemsaccomplishing this experiment. Deployed units often face a similar situation with limited airassets. In order to fully implement this model of surveillance and interdiction, it is importantfor the defenders to own and completely control the UAV. Otherwise, they risk the UAV be-ing tasked away or unavailable when needed. This requires the defenders to find some middleground between using the inadequate but more ubiquitous and locally controlled Raven and alarger and better UAV, which is controlled by a higher headquarters.
51
Feedback from the participants provided some good lessons that can be applied in this situation.A specific plan is needed for the QRF to self-detect the VBIED if the UAV misses it. Visibilityfrom inside an up-armored vehicle is so bad and restricted that the QRF missed the VBIED sev-eral times. Even from the gun turret, the terrain and vegetation limited how well the QRF coulddetect an approaching vehicle. If the FOB location does not allow the QRF to be positionedat a place with good observation (as in this scenario), an observation tower, either manned orelectronic, should be used.
The speed of the VBIED was also determined to be a significant variable, as discovered previ-ously by Byers [19]. One of the two VBIED drivers drove as expected at a moderate speed ap-proximately at the posted speed limit. The other driver went considerably faster, which caughtboth the QRF and exercise controllers by surprise. Obviously, an enemy attacker is able tochoose any speed to conduct the attack, and although driving excessively fast might draw atten-tion to the vehicle, it can also catch the defenders off guard. However, as a counterpoint, one ofthe experiment participants pointed out that driving a vehicle full of improvised explosives thatfast on a rough dirt road has other risks such as a premature detonation.
Other than problems associated with the UAV, this experiment was successful and demonstratedthe utility of the approach of this model to surveillance and interdiction operations.
52
CHAPTER 7:Conclusion
7.1 ConclusionsThis project demonstrates a good technique for combining surveillance and interdiction opera-tions to better defend against VBIEDs. UAVs are a rapidly expanding technology, both in termsof quantities and capabilities, and research such as this is needed to better inform decisions onhow to employ them. Tactical UAVs are such a rapidly emerging field that today’s commandersmay not have used or been trained on them in previous assignments, rendering intuitive deci-sion making based on experience difficult. Analytical research such as this, which develops adecision tool to aid decision makers, is particularly useful in this situation.
Additionally, VBIEDs are a particularly difficult threat that has not been adequately researched.A great deal of effort has gone into the Counter-IED fight, but that has been almost exclusivelyfocused on roadside IEDs targeting convoys, especially in the military and through JIEDDO.Very little research has focused on defeating VBIED attacks against fixed facilities. The DHShas made some progress in this field to protect domestic targets, but the military has largelytaken a passive approach towards defending against VBIEDs, using perimeter security and hard-ened defenses as protection. When dealing with small bases or very large truck bombs, thesemeasures are insufficient and a proactive approach to interdict the VBIED before it reaches theFOB is needed.
This project has addressed both of these shortcomings: how to better employ an emergingnew technology (tactical UAVs) and how to better interdict a VBIED attack before it reachesthe intended target. The development of the decision matrix provides a theoretical model thatcan help analysts organize and think about the information needed to accurately determinethe optimal employment methods for both a UAV and QRF. The development of the GameTheory model also highlights the important factors that should be considered in this scenario,and shows the impacts of the strategic interactions between attacker and defender. These modelsare flexible enough to be adjusted to specific circumstances yet hopefully detailed enough fullyexplain their development and use. Together, these models will aid analysts and decision makerswho have to combine surveillance and interdiction operations to defend their base.
Although this project focused on a specific military scenario to illustrate the concepts, it is
53
applicable to other scenarios as well. The ideas developed in this project have already beenemployed to protect moving convoys in military exercises. Other, non-military, applications inwhich an important fixed facility needs to be protected against attack are also feasible. Thesemight include embassies, oil facilities, transportation hubs, and any other key location wheresurveillance and interdiction operations can be combined to defend against an attack. Futurework might also extend this project to situations that do not necessarily involve protecting afacility but still utilize surveillance and interdiction operations, such as the Border Patrol moni-toring and stopping illegal border crossings.
7.2 Future WorkThis thesis was part of a larger research project. Related work includes the Situational Aware-ness for Surveillance and Interdiction Operations (SASIO) tool, developed at the Naval Post-graduate School. This tool has been briefed at the Navy Fleet level and was employed in JointExpeditionary Forces Experiment 10-3 at Norfolk, Virginia. A concurrent master’s thesis looksat employing multiple UAVs in surveyor and tracker roles in a variety of missions. In this case,a larger, theater level UAV conducts a search, and then the ground force launches an organictactical UAV to track the target until the ground force can interdict it. In August 2010, a cap-stone Field Experiment is planned at Camp Roberts which will more rigorously test all of thesemodels and combine them into a realistic capstone exercise.
Specific future work that could be done to expand this project includes a greater sensitivityanalysis on the game matrix. Analytical development of the tables and matrices for specificUAV and sensor combinations could also be done, since this project only considered a genericUAV without specific sensor characteristics.
54
55
List of References
[1] M. Dupee. "FOB Salerno withstands 2-day Taliban onslaught," August 19, 2008. Accessed
June 2, 2010, from http://www.longwarjournal.org/archives/2008/08/fob_salerno_
[11] Headquarters, Department of the Army. FM 3-04.15: Multi-service Techniques for the
Tactical Employment of Unmanned Aerial Systems (UAS), August 2006.
[12] Office of the Secretary of Defense. Unmanned aircraft systems roadmap 2005-2030, July
2005. Accessed June 5, 2010, from http://www.acq.osd.mil/usd/ Roadmap Final2.pdf.
[13] B.O. Koopman. Search and Screening: General Principles with Historical Applications.
Pergamon New York, 1980.
[14] A.R. Washburn. Search and Detection. Institute for Operations Research and the
Management Sciences, 4th edition, 2002.
[15] W.J. Nash. Calculation of barrier search probability of detection for arbitrary search
tracks.M.S. thesis, Naval Postgraduate School, Monterey, CA, March 2000.
[16] G. Romp. Game Theory: Introduction and Applications. Oxford University Press
(NewYork), 1997.
[17] E.N. Barron. Game Theory: An Introduction. John Wiley and Sons (Hoboken, NJ), 2008.
[18] R.L. Rardin. Optimization in Operations Research. Prentice Hall, 1998.
[19] K. Byers. Situational awareness for surveillance and interdiction operations (SASIO):
Tactical installation protection. M.S. thesis, Naval Postgraduate School, Monterey, CA,
March 2010.
APPENDIX A:Camp Roberts Map
This is the map of the Camp Roberts training area where the Field Experiments were conducted.
57
THIS PAGE INTENTIONALLY LEFT BLANK
58
APPENDIX B:Linear Programming to Solve the Game
The following code1 is the GAMS program written to solve the game. It returns the objectivefunction Z, which is the optimal payoff value in the game, as well as the optimal solutionstrategies. It requires three input files: R.txt for the number of routes, S.txt for the numberof friendly alternatives, and Game_Payoffs.csv which is a comma separated data table for thegame payoff values.
$TITLE Zero_Sum_Game
$offlisting
options limcol=0, limrow=0, solprint=off;
SET S friendly strategies /
$Include S.txt /;
SET R routes enemy strategies /
$Include R.txt /;
$ondelim
TABLE p(s,r) payoffs
$Include Game_Payoffs.csv;
$offdelim
POSITIVE VARIABLES X(s);
VARIABLE Z Total Value;
EQUATION Cover_Enemy; Cover_Enemy(r).. Z =G= SUM(s, p(s,r)*X(s));
1GAMS code developed with the assistance of Professor Javier Salmeron, NPS Operations Research Depart-ment.
59
DISPLAY Z.l, X.l;
Input Files:R.txt
* Enemy routes
r1 route 1
r2
r3
S.txt
* My friendly strategies
s1 UAV Far QRF Early
s2 UAV Far QRF Mid
s3 UAV Far QRF Late
s4 UAV Mid QRF Early
s5 UAV Mid QRF Mid
s6 UAV Mid QRF Late
s7 UAV Near QRF Early
s8 UAV Near QRF Mid
s9 UAV Near QRF Late
Game_Payoffs.csv is the game matrix saved as a comma delimited CSV file.
,r1,r2,r3
s1,1.500,0.240,0.960
s2,0.300,0.600,1.920
s3,0.825,0.330,1.584
s4,0.915,0.610,0.488
s5,0.165,1.375,0.880
s6,0.608,1.013,0.972
60
s7,1.300,0.520,0.624
s8,0.290,1.450,1.392
s9,1.350,1.350,1.944
61
THIS PAGE INTENTIONALLY LEFT BLANK
62
APPENDIX C:Field Experiment Procedures
This is the write-up for the Field Experiment procedures and script that was used for the 9 May,2010, experiments at Camp Roberts.
BackgroundThis experiment is intended to test a Surveillance and Interdiction model utilizing a tacticalUAV and ground based QRF to interdict a VBIED attack. A notional Forward Operating Base(FOB) located near a three-way intersection at grid 004558 is the target of the attack. In thescenario, the defenders receive an intelligence warning of an impending VBIED attack, but thetime and direction of the attack are unknown. The defenders want to interdict and stop the attackas far from the base as possible, and they have a ground based QRF available to do that task.However, the QRF cannot leave until it knows which road the attack is coming from, otherwiseif they guess wrong the VBIED could travel all the way to the base. The defenders also havetactical UAV available for surveillance, which they will use to attempt to identify which roadthe VBIED is traveling on. After this detection is made, the QRF is then able to depart the baseand interdict the attack. As a last line of defense, the QRF can self-detect the VBIED when itis in sight of the FOB and then move to stop it, although in this case the VBIED will likely getwithin blast range of the FOB.
Requirements1 UAV (NPS Rascal or Raven) with video imaging and all supporting equipment and software tocontrol the flight and view the images from the Experiment Tactical Operations Center (TOC).1 QRF consisting of a vehicle (tactical HMMWV) equipped with a tracking device similar toa Blue Force tracker. If available, QRF should also have a laptop computer that can view theUAV image feed real-time.2-3 vehicles to simulate VBIEDs. These vehicles should be high clearance SUVs or truckscapable of driving the roads and trails throughout the Camp Roberts training area. They will bemarked with an orange marker panel secured to the hood or roof. Each VBIED driver shouldhave a GPS unit or tracking device to give a grid coordinate and determine the vehicle’s location.Communications: All elements need radio communication with the exercise controller at theTOC.
63
ProceduresUAVThe UAV will fly a designated patrol route. Each route will be flown repeatedly for about onehour (based on the UAV’s flight endurance). Three separate flights will be conducted, one foreach patrol route. The search nodes for each route are given below, in Military Grid ReferenceSystem coordinates.
VBIEDThe VBIEDs will stage at designated entry nodes on each road. At the designated time (or onorder from the TOC if the timeline changes), the VBIED will begin moving towards the FOBto simulate an attack. VBIEDs should drive at approximately 20-25 MPH. When stopped bythe QRF, the VBIED driver should record the time and location. If not stopped, record the timethat the VBIED reaches the FOB. After each attack, the VBIED moves to the next entry pointand waits to begin the next attack.
The QRF will stage from the notational FOB location at the three-way road intersection locatedat grid 00475590. When the UAV detects the VBIED the QRF then moves along the correctroad to interdict the VBIED. If the QRF is able to see the UAV video it can self launch, and theTOC will confirm; otherwise the TOC will initiate the QRF movement. If the UAV does notdetect the VBIED, the QRF will begin moving when it detects the VBIED itself.
Interdiction Procedures
QRF will record the time it departs the FOB and then drive towards the VBIED. Approximately100m from the target vehicle, the QRF should stop and block the road. The VBIED will stopnext to the QRF and confirm that it is the correct vehicle (and not miscellaneous traffic movingthrough the exercise area). Both drivers will record the time and location of the stop and theQRF will report by radio to the TOC. The QRF will then return to the FOB and the VBIED willmove to its next entry node.
Timeline
The exercise consists of three sessions or flights, tentatively scheduled for 1000-1200 and 1300-1500. At the completion of the exercise, turn in the log sheets and equipment at the TOC.
NLT COB 8 May: Identify the QRF and VBIED vehicles and drivers
1. Defense Technical Information Center Ft. Belvoir, Virginia 2. Dudley Knox Library Naval Postgraduate School Monterey, California 3. Joint Special Operations University Hurlburt Fld., Florida 4. SOCOM J-7 MacDill AFB, Florida 5. HQ USSOCOM Library MacDill AFB, Florida