34
Wireless Channel Propagation Model Small-scale Fading

Wireless Channel Propagation Model
Small-scale Fading

Basic Questions
Desert Metro Street Indoor
What will happen if the transmitter - changes transmit power ? - changes frequency ? - operates at higher speed ?
What will happen if the receiver moves?
What will happen if we conduct this experiment in different types of environments?
Channel effects
Effect of mobility
Transmit power, data rate, signal bandwidth, frequency tradeoff
Tx
Rx

Fading is caused by interference between two or more versions of the transmitted signal which arrive at the receiver at slightly different times.
Fading is used to describe the rapid fluctuation of the amplitude of the radio over a short period of time or travel distance so that the large scale path loss effect may be ignored.
Small-scale fading refers to the dramatic changes in signal amplitude and phase that can be experienced as a result of small changes (as small as a half wavelength) in the spatial positioning between a receiver and a transmitter. Small-scale fading manifests itself in two mechanisms: time-spreading of the signal (or signal dispersion) and time-variant behavior of the channel.
Small Scale Fading

Small Scale Multipath Propagation
Multipath in the radio channel creates small-scale fading effects. The three most important effects are:
1. Rapid changes in signal strength over a small travel distance or time interval.
2. Random frequency modulation due to varying Doppler shifts on different multipath signals.
3. Time dispersion caused by multipath propagation delays.

• Multi-path propagation The presence of reflecting objects and scatterers in the propagation path (buildings, signs, trees, fixed and moving vehicles)
• Speed of the Mobile Random Frequency Modulation due to different Doppler shifts of each of the multipath components
• Speed of the surrounding objects Time varying Doppler shift on multipath components If the surrounding objects move at a greater rate than the mobile , then this effect dominates the small scale fading
• The transmission bandwidth of the signal If the transmitted radio signal bandwidth is greater than the bandwidth of the multipath channel, the received signal will be distorted
Factors Influencing Small Scale Fading

Review of basic concepts
Channel Impulse response Power delay profile Inter Symbol Interference Coherence bandwidth Coherence time

Channel Impulse Response
)(tx
Channel
)(ty

8
Time Dispersion Parameters
τ
( )
∑
∑
∑
∑==
−=
kk
kkk
kk
kkk
P
P
a
a
)(
))(( 2
2
22
2
22
τ
ττττ
ττστ
Determined from a power delay profile.
Mean excess delay( ):
Rms delay spread (στ):
∑
∑
∑
∑==
kk
kkk
kk
kkk
P
P
a
a
)(
))((
2
2
τ
ττττ

Example (Power delay profile)
-30 dB
-20 dB
-10 dB
0 dB
0 1 2 5
Pr(τ)
(µs)
τ
=++++++= sµτ 38.4]11.01.001.0[
)0)(01.0()2)(1.0()1)(1.0()5)(1(_
=+++
+++= 2
2222_2 07.21
]11.01.001.0[)0)(01.0()2)(1.0()1)(1.0()5)(1(
sµτ
=−= sµστ 37.1)38.4(07.21 2
1.37 µs 4.38 µs

10
Noise Threshold
The values of time dispersion parameters also depend on the noise threshold (the level of power below which the signal is considered as noise).
If noise threshold is set too low, then the noise will be
processed as multipath and thus causing the parameters to be higher.
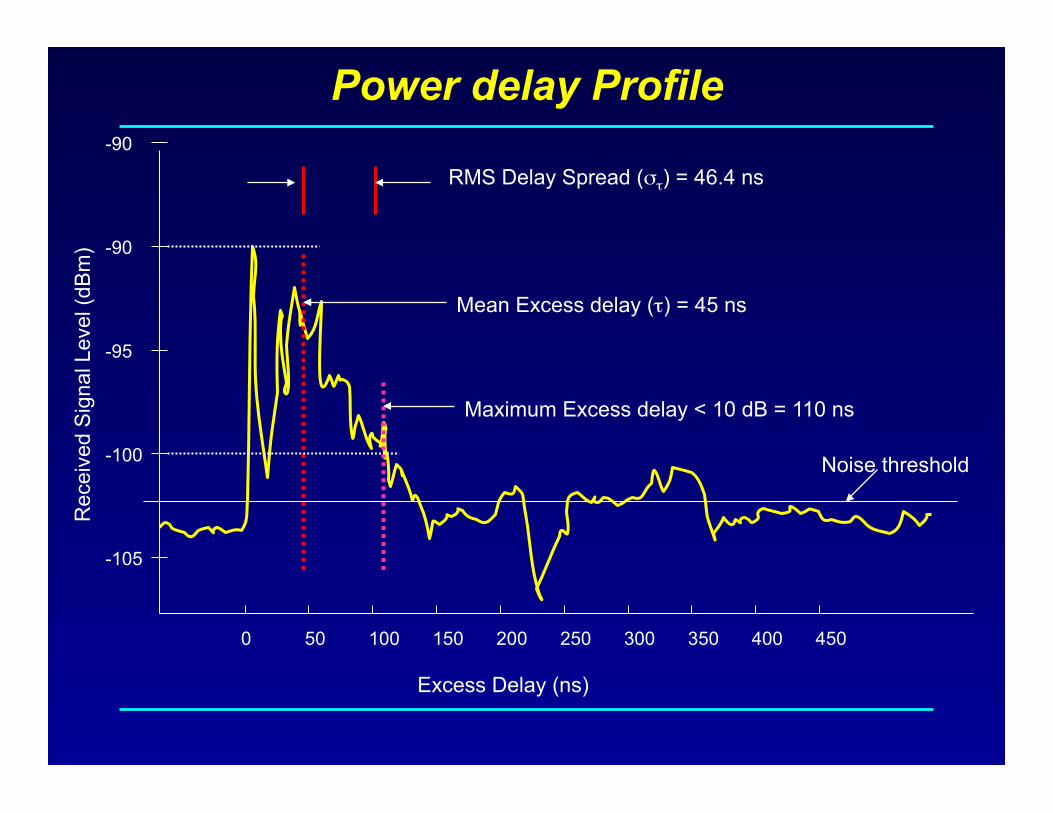
Power delay Profile R
ecei
ved
Sig
nal L
evel
(dB
m)
-105
-100
-95
-90
-90
0 50 100 150 200 250 300 350 400 450
Excess Delay (ns)
RMS Delay Spread (στ) = 46.4 ns
Mean Excess delay (τ) = 45 ns
Maximum Excess delay < 10 dB = 110 ns
Noise threshold

RMS Delay Spread: Typical values
10ns 50ns 150ns 1µs 2µs 5µs 10µs 25µs 500ns
Office building 1
San Francisco
Manhattan
Suburban
Office building 2 SFO
Delay spread is a good measure of Multipath
3m 15m 45m 150m 300m 600m 3Km 7.5Km

Inter Symbol Interference
-30 dB
-20 dB
-10 dB
0 dB
0 1 2 5
Pr(τ)
(µs)
τ
1.37 µs 4.38 µs
0 1 2 5 (µs)
Symbol time
4.38
στ
Symbol time > 10* στ --- No equalization required
Symbol time < 10* στ --- Equalization will be required to deal with ISI
In the above example, symbol time should be more than 14µs to avoid ISI. This means that link speed must be less than 70Kbps (approx)

14
Coherence Bandwidth (BC)
Range of frequencies over which the channel can be considered flat (i.e. channel passes all spectral components with equal gain and linear phase).
ü It is a definition that depends on RMS Delay Spread.
Two sinusoids with frequency separation greater than Bc are affected quite differently by the channel.
Receiver
f1
f2
Multipath Channel Frequency Separation: |f1-f2|

Coherence Bandwidth
)(tx
Time domain view
High correlation of amplitude between two different freq. components
Range of freq over which response is flat
Bc στ delay spread
)( fX
Freq. domain view
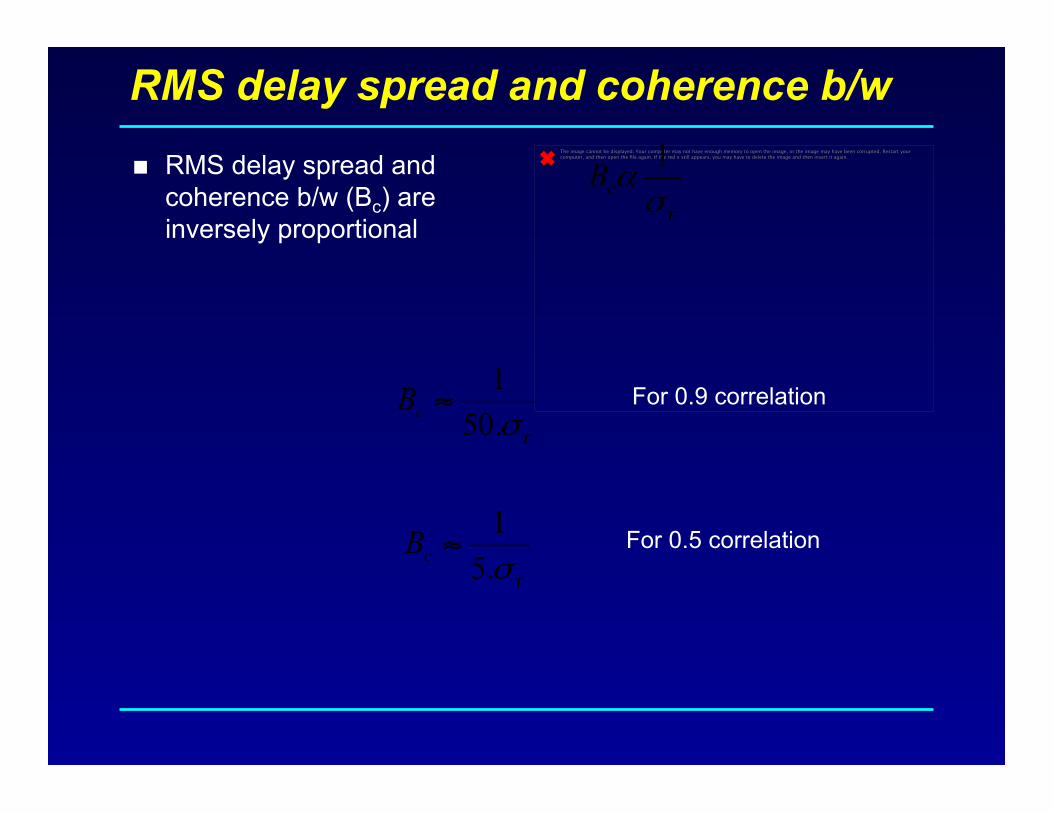
RMS delay spread and coherence b/w
RMS delay spread and coherence b/w (Bc) are inversely proportional
The image cannot be displayed. Your computer may not have enough memory to open the image, or the image may have been corrupted. Restart your computer, and then open the file again. If the red x still appears, you may have to delete the image and then insert it again.
τσα1
cB
τσ.501
≈cB For 0.9 correlation
τσ.51
≈cB For 0.5 correlation

Time dispersive nature of channel
RMS delay spread (στ) Coherence b/w (Bc)
Time domain view Freq domain view
Delay spread and coherence bandwidth are parameters which describe the time dispersive nature of the channel.
channel 1
channel 2
channel 3
Sig
nal
Cha
nnel
Symbol Time (Ts) Signal bandwidth (Bs)
signal 1
signal 2

Revisit Example (Power delay profile)
-30 dB
-20 dB
-10 dB
0 dB
0 1 2 5
Pr(τ)
(µs)
τ
= sµτ 38.4_
= 2_2 07.21 sµτ
= sµστ 37.1
1.37 µs 4.38 µs
kHzBcoherence c 146.51)%50( =≈−τσ
Signal bandwidth for Analog Cellular = 30 KHz Signal bandwidth for GSM = 200 KHz

Doppler Shift
λθcosvf =Δv θ�
Doppler shift
Example - Carrier frequency fc = 1850 MHz (i.e. λ = 16.2 cm) - Vehicle speed v = 60 mph = 26.82 m/s
- If the vehicle is moving directly towards the transmitter
- If the vehicle is moving perpendicular to the angle of arrival of the
transmitted signal
Hzf 165162.082.26
==Δ
0=Δf

Coherence Time Time domain view Frequency domain view
Coherence Time: Time interval over which channel impulse responses are highly correlated
Tc
signal bandwidth symbol time
fc+fd fc-fd

Doppler spread and coherence time
Doppler spread and coherence time (Tc) are inversely proportional
The image cannot be displayed. Your computer may not have enough memory to open the image, or the image may have been corrupted. Restart your computer, and then open the file again. If the red x still appears, you may have to delete the image and then insert it again.
mc fT 1α
mc fT 423.0≈ Rule of thumb
mc fT
π169
≈ For 0.5 correlation
fm is the max doppler shift
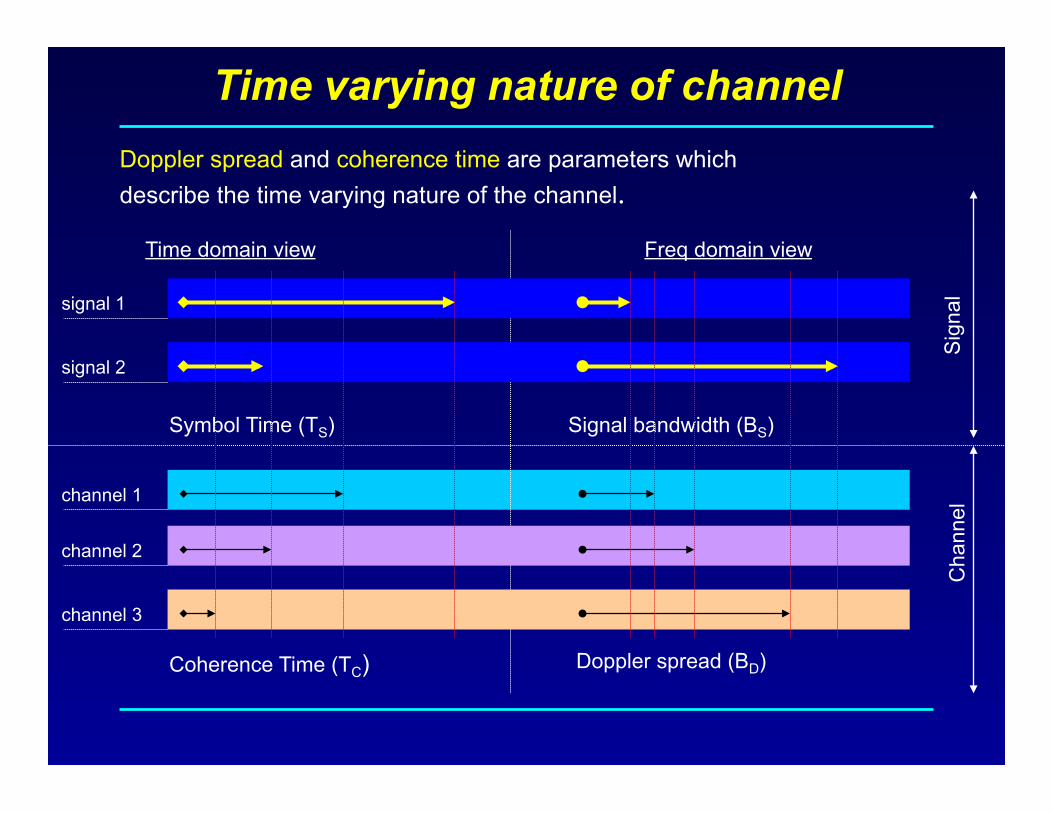
Time varying nature of channel
Coherence Time (TC) Doppler spread (BD)
Symbol Time (TS) Signal bandwidth (BS)
Time domain view Freq domain view
Doppler spread and coherence time are parameters which describe the time varying nature of the channel.
channel 1
channel 2
channel 3
Sig
nal
Cha
nnel
signal 1
signal 2

Small scale fading
Multi path time delay
Doppler spread
Flat fading BC
BS
Frequency selective fading BC
BS
TC
TS Slow fading
Fast fading TC
TS
fading

24
Flat Fading
Occurs when the amplitude of the received signal changes with time
For example according to Rayleigh Distribution
Occurs when symbol period of the transmitted signal is much larger than the Delay Spread of the channel
– Bandwidth of the applied signal is narrow.
May cause deep fades. – Increase the transmit power to combat this situation.

25
Flat Fading
h(t,τ) s(t) r(t)
0 TS 0 τ 0 TS+τ
τ << TS
Occurs when: BS << BC
and TS >> στ
BC: Coherence bandwidth BS: Signal bandwidth TS: Symbol period στ: Delay Spread

26
Frequency Selective Fading
Occurs when channel multipath delay spread is greater than the symbol period. Symbols face time dispersion Channel induces Intersymbol Interference (ISI)
Bandwidth of the signal s(t) is wider than the channel impulse response.

27
Frequency Selective Fading
h(t,τ) s(t) r(t)
0 TS 0 τ 0 TS+τ
τ >> TS
TS
Causes distortion of the received baseband signal Causes Inter-Symbol Interference (ISI)
Occurs when: BS > BC
and TS < στ
As a rule of thumb: TS < στ

28
Fast Fading
Due to Doppler Spread Rate of change of the channel characteristics
is larger than the Rate of change of the transmitted signal
The channel changes during a symbol period. The channel changes because of receiver motion. Coherence time of the channel is smaller than the symbol
period of the transmitter signal
Occurs when: BS < BD
and TS > TC
BS: Bandwidth of the signal BD: Doppler Spread TS: Symbol Period TC: Coherence Bandwidth

29
Slow Fading
Due to Doppler Spread Rate of change of the channel characteristics
is much smaller than the Rate of change of the transmitted signal
Occurs when: BS >> BD
and TS << TC
BS: Bandwidth of the signal BD: Doppler Spread TS: Symbol Period TC: Coherence Bandwidth

30
Different Types of Fading
Transmitted Symbol Period
Symbol Period of Transmitting Signal
TS
TS
TC
στ
Flat Slow Fading
Flat Fast Fading
Frequency Selective Slow Fading
Frequency Selective Fast Fading
With Respect To SYMBOL PERIOD

31
Different Types of Fading
Transmitted Baseband Signal Bandwidth BS
BD
Flat Fast Fading
Frequency Selective Slow Fading
Frequency Selective Fast Fading
BS
Transmitted Baseband
Signal Bandwidth Flat Slow Fading
BC
With Respect To BASEBAND SIGNAL BANDWIDTH
32
Fading Distributions
Describes how the received signal amplitude changes with time.
Remember that the received signal is combination of multiple signals arriving from different directions, phases and amplitudes.
With the received signal we mean the baseband signal, namely the envelope of the received signal (i.e. r(t)).
Its is a statistical characterization of the multipath fading.
Two distributions Ø Rayleigh Fading Ø Ricean Fading

33
Rayleigh and Ricean Distributions
Describes the received signal envelope distribution for channels, where all the components are non-LOS:
i.e. there is no line-of–sight (LOS) component.
Describes the received signal envelope distribution for channels where one of the multipath components is LOS component.
i.e. there is one LOS component.

PHY Layer Design Choices ?
Required Data Rates Determines channel : frequency selective or flat fading; fast
or slow fading
Required QoS at the PHY: bit-error-rate (BER), packet-error-rate (PER), Frame-error-rate (FER) May be determined by application needs (higher layers) Affected by Interference and Noise levels
PHY layer choices include selection of Modulation/Demodulation Techniques to mitigate fading: diversity, equalization, OFDM,
MIMO Techniques to mitigate interference (if necessary) Error correction Coding


