THE ECONOMIC WEEKLY January 25. 1964 Working Population of India S K Rao The ago structure of the population of India shows a very high proportion of children below 14 years. This throws a heavy burden on the economically active population. However, during the decade 1951-61 the rate of increase of the working force was higher than the rate of increase of the population of working age. The impact of economic development is seen in the increase in the participation rate which has been marked in manufacturing, construction, and transport and commu- nimtions. Though the overall distribution of the working force among the different sectors has changed little as yet, during 1951-61 the working force in the secondary sector expanded faster than that in the primary and tertiary sectors. If these relative rates of change are maintained, the overall pattern of distribution of the working force will soon begin to show change. THE economically active popula- tion of a country refers to only those who are of the age to work. For while they have their own wants to be met, they can provide the re- sources out of which these wants can be satisfied. Viewed from this point, the age-structure of the population in India reveals a heavy burden on the active population due to the high proportion of children. Out of the population of 439.235 million, according to the 1961 Census, 40.2 per cent belonged to the age-group 0-15. The agf-composition of the popu- lation as revealed by the 1961 Cen- sus and some earlier Censures are given in Table 1. It will be seen from the table that the percentage of the persons below 15 years was continuously high during the period 1911-61 and the range of variation in the proportion was between 36 and '40 only. This might be due to the high birth rate and low ex- pectation of life in the higher age groups. According to Sundburg, the pro- portion of the age-group 0-14 per 100 persons should be around 40, 33 and 20 in progressive, stationary, and regressive populations respec- tively. The figures in Table 1 em- phasise how the Indian population is still progressive and youthful with a steady increase in the expec- tation of life, contrary to the European experience of a stationary or even regressive and ageing popu- lation. Table 2 presents a broad comparison of the proportion of the different age-groups in a few coun- tries. Even among the working age- group of 15-64 years, not all the people work. Similarly some per- sons outside the age-group 15-64 years may work. The people who are actually working or are looking for jobs, i e, the employed and the unemployed, constitute the labour force. According to the 1961 Census, the working population of India was about 188 millions, out of which 129 millions are males and 59 milli- ons females. The labour force con- stitutes 78.7 per cent of the working ago (15-64) population and 39.1 per cent of the total population. The percentage of working force to the working age population is high compared to other countries, parti- cularly among males. Table 3 compares the indices of (a) growth of total population (b) population of working age 15-60 and (c) population recorded as at work in each census. The year 1901 has been taken as the base. It will be seen that while population has gained 83 points in sixty years the population of working age and the population at work have gained only 69 points during the same period. In other words the growth of popu- lation of working age and that of population at work has been trail- ing behind population growth. Table 4 (on page 130) gives the participation rates in different age- groups of population in India and some other countries. It will be noted from the table that the overall participation rate is appreciably lower in under- developed countries, due apart from the factor of low industrialisation and lack of many avenues for ab sorption of labour, to a higher pro- portion of population being in the age-group below 15 years. There are also social and economic reasons for the low participation rate. Em- ployment of women is still not socially acceptable in many under- developed countries and their sphere
Transcript
T H E E C O N O M I C W E E K L Y January 25. 1964
Working Population of India S K Rao
The ago structure of the population of India shows a very high proportion of children below 14 years. This throws a heavy burden on the economically active population.
However, during the decade 1951-61 the rate of increase of the w o r k i n g force was higher than the rate of increase of the population of working age. The impact of economic development is seen in the increase in the participation rate which has been marked in manufacturing, construction, and transport and commu-nimtions.
Though the overall distribution of the working force among the different sectors has changed little as yet, during 1951-61 the working force in the secondary sector expanded faster than that in the primary and tertiary sectors.
If these relative rates of change are maintained, the overall pattern of distribution of the working force will soon begin to show change.
T H E economical ly active popula t i on of a country refers to only
those who are of the age to work . For w h i l e they have their own wants to be met, they can provide the resources out of which these wants can be satisfied. Viewed f rom this po in t , the age-structure of the popu la t ion in I n d i a reveals a heavy burden on the active popu la t ion due to the high p ropor t ion of ch i ld ren . Out of the popu la t ion of 439.235 m i l l i o n , according to the 1961 Census, 40.2 per cent belonged to the age-group 0-15.
The agf-composi t ion of the popul a t i on as revealed by the 1961 Census and some earlier Censures are given in Table 1. I t w i l l be seen f rom the table that the percentage of the persons below 15 years was continuously h igh d u r i n g the per iod 1911-61 and the range of va r ia t ion in the p ropo r t i on was between 36 and ' 4 0 on ly . This m i g h t be due to the h i g h b i r t h rate and low expectation of l i fe in the higher age groups.
Acco rd ing to Sundburg , the propor t ion of the age-group 0 -14 per 100 persons should be around 40, 33 and 20 in progressive, stat ionary, and regressive popula t ions respect i ve ly . The figures in Tab le 1 emphasise how the I n d i a n popula t ion is s t i l l progressive and you th fu l w i t h a steady increase in the expect a t ion of l i fe , con t ra ry to the European experience of a stationary or even regressive and ageing popul a t i o n . Table 2 presents a broad comparison of the p r o p o r t i o n of the different age-groups in a few coun-tries.
Even among the w o r k i n g age-g roup of 15-64 years, no t a l l the people w o r k . S i m i l a r l y some per-
sons outside the age-group 15-64 years may work . The people who are actual ly w o r k i n g or are look ing for jobs, i e, the employed and the unemployed, constitute the labour force.
Accord ing to the 1961 Census, the w o r k i n g popula t ion of I n d i a was about 188 mi l l ions , out of w h i c h 129 m i l l i o n s are males and 59 m i l l i ons females. The labour force constitutes 78.7 per cent of the w o r k i n g ago (15 -64 ) popula t ion and 39.1 per cent of the total popu la t ion . The percentage of w o r k i n g force to the w o r k i n g age popu la t ion is h igh compared to other countries, par t i cu la r ly among males.
Table 3 compares the indices of (a ) g rowth of total popula t ion ( b ) popu la t ion of w o r k i n g age 15-60 and (c) popula t ion recorded as at work in each census. The year 1901 has been taken as the base. I t w i l l be seen that whi le popula t ion has gained 83 points in sixty years the popu la t ion of w o r k i n g age and the popula t ion at work have gained on ly 69 points d u r i n g the same per iod . In other words the g rowth of popula t ion of w o r k i n g age and that of popula t ion at work has been t r a i l i ng behind popu la t ion growth .
Table 4 (on page 130) gives the pa r t i c ipa t ion rates in different age-groups of popula t ion in I n d i a and some other countries. I t w i l l be noted f r o m the table that the overa l l pa r t i c ipa t ion rate is appreciably lower in underdeveloped countries, due apart f rom the factor of low indus t r ia l i sa t ion and lack of many avenues for ab sorpt ion of labour , to a higher prop o r t i o n of popula t ion being in the age-group below 15 years. There are also social and economic reasons
for the low par t ic ipa t ion rate. Employment of women is s t i l l not socially acceptable in many underdeveloped countries and their sphere
January 25, 1964 T H E E C O N O M I C W E E K L Y
of economic ac t iv i ty is s t i l l l imned to the household. The noto-migra-tory character o f r u ra l labour in some cases is another reason.
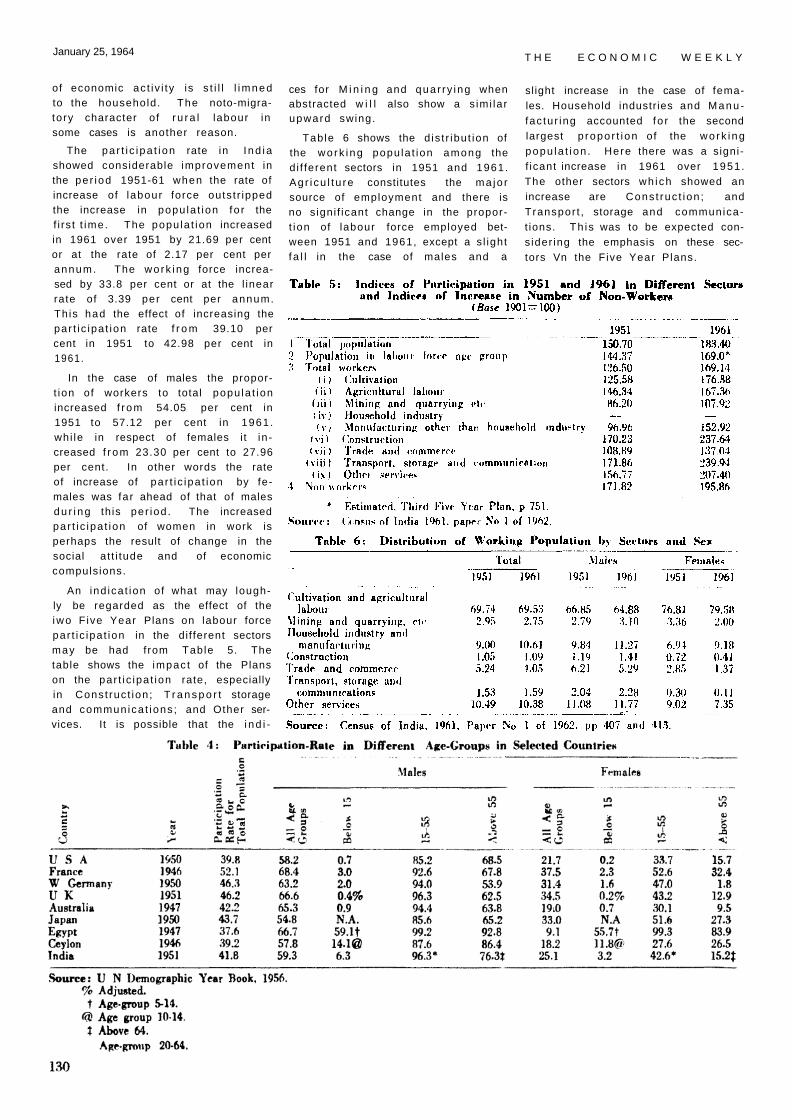
The pa r t i c ipa t ion rate in I nd ia showed considerable improvement in the per iod 1951-61 when the rate of increase of labour force outs t r ipped the increase in popu la t ion fo r the f i rs t t ime. The popu la t ion increased in 1961 over 1951 by 21.69 per cent or at the rate of 2.17 per cent per annum. The work ing force increased by 33.8 per cent or at the l inear rate of 3.39 per cent per annum. This had the effect of increasing the par t i c ipa t ion rate f r o m 39.10 per cent in 1951 to 42.98 per cent in 1961.
In the case of males the proport ion of workers to total popu la t ion increased f r om 54.05 per cent in 1951 to 57.12 per cent in 1961. whi le in respect of females i t in creased f r om 23.30 per cent to 27.96 per cent. In other words the rate of increase of par t i c ipa t ion by females was far ahead of that of males d u r i n g th is per iod . The increased par t i c ipa t ion of women in work is perhaps the result of change in the social a t t i tude and of economic compuls ions.
An ind ica t ion of what may lough-ly be regarded as the effect of the iwo F ive Year Plans on labour force par t ic ipa t ion in the di f ferent sectors may be had f rom Table 5. The table shows the impac t of the Plans on the par t ic ipa t ion rate, especially in Const ruc t ion ; T r a n s p o r t storage and communica t ions ; and Other services. It is possible that the i n d i
ces for M i n i n g and quar ry ing when abstracted w i l l also show a s imi lar upward swing.
Tab le 6 shows the d is t r ibut ion of the wo rk i ng popu la t ion among the d i f ferent sectors in 1951 and 1961. Ag r i cu l tu re constitutes the ma jo r source of employment and there is no s igni f icant change in the proport ion of labour force employed between 1951 and 1961, except a s l ight f a l l in the case of males and a
sl ight increase in the case of females. Household industr ies and M a n u fac tur ing accounted fo r the second largest p ropor t i on of the wo rk ing popu la t ion . Here there was a signif icant increase in 1961 over 1951 . The other sectors wh ich showed an increase are Cons t ruc t ion ; and Transpor t , storage and communicat ions. Th is was to be expected con-s ider ing the emphasis on these sectors Vn the Five Year Plans.
THE ECONOMIC WEEKLY January 25 , 1964
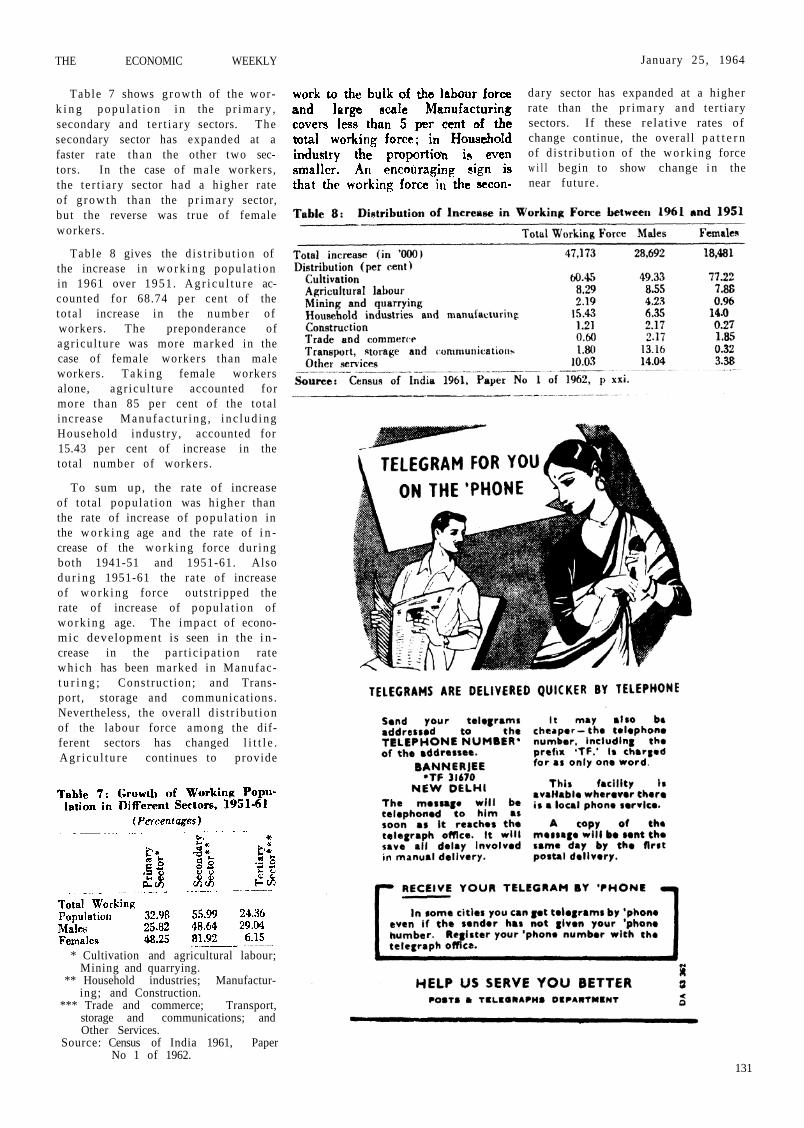
Table 7 shows g rowth of the work i n g p o p u l a t i o n i n the p r i m a r y , secondary and t e r t i a ry sectors. The secondary sector has expanded at a faster rate t han the other two sec-tors. In the case of ma le workers, the t e r t i a ry sector had a h igher rate of g r o w t h than the p r i m a r y sector, but the reverse was true of female workers .
Table 8 gives the d i s t r i bu t i on of the increase in w o r k i n g popula t ion in 1961 over 1951 . A g r i c u l t u r e accounted for 68.74 per cent of the to ta l increase in the number of workers. The preponderance of agr icu l ture was more marked in the case of female workers than male workers. T a k i n g female workers alone, agr icu l tu re accounted for more than 85 per cent of the total increase M a n u f a c t u r i n g , i n c l u d i n g Household industry , accounted for 15.43 per cent of increase in the total number of workers.
To sum up, the rate of increase of tota l popu la t ion was h igher than the rate of increase of popu la t i on in the w o r k i n g age and the rate of i n crease of the w o r k i n g force du r ing both 1941-51 and 1951-61. Also d u r i n g 1951-61 the rate of increase of w o r k i n g force outs t r ipped the rate of increase of popu la t ion of w o r k i n g age. The impact of economic development is seen in the i n crease in the pa r t i c ipa t ion rate wh ich has been marked in Manufact u r i n g ; Const ruct ion; and Transport , storage and communicat ions. Nevertheless, the overall d i s t r ibu t ion of the labour force among the different sectors has changed l i t t l e . A g r i c u l t u r e continues to provide
dary sector has expanded at a higher rate than the p r i m a r y and ter t iary sectors. If these relat ive rates of change continue, the overal l p a t t e r n of d i s t r i bu t ion of the w o r k i n g force w i l l begin to show change i n the near future .
131
* Cultivation and agricultural labour; Mining and quarrying.
** Household industries; Manufacturing; and Construction.
*** Trade and commerce; Transport, storage and communications; and Other Services.
Source: Census of India 1961, Paper No 1 of 1962.
January 25 , 1964 T H E E C O N O M I C W E E K L Y