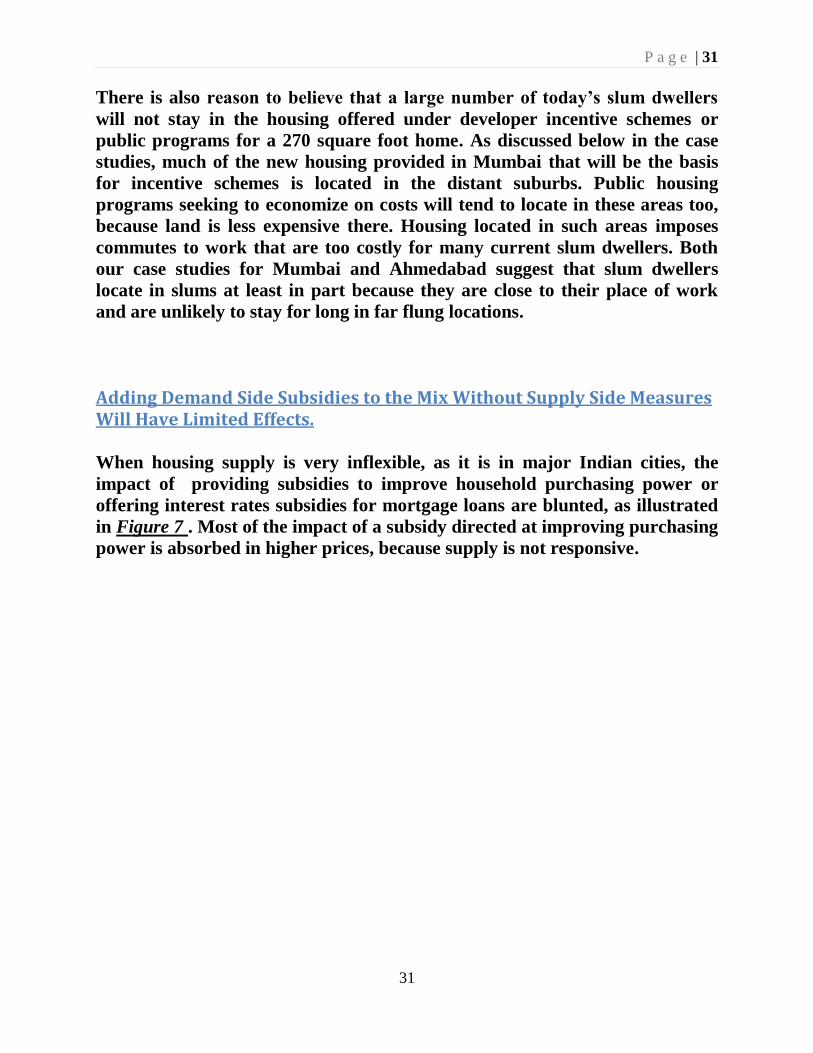
Page | 1 “Working with the Market: a New Approach to Reducing Urban Slums in India” Patricia Annez, Alain Bertaud, Bimal Patel and V. K. Phatak 1 Abstract This paper examines the policy options for India as it seeks to improve living conditions of the poor on a large scale and reduce the population in slums. Addressing the problem requires first a diagnosis of the market at the city level and a recognition that slums are a result of the working of the market — not a failure of the market. We show that government programs that directly provide housing would cost, on conservative estimates, about of 20 to 30 per cent of GDP, and cannot solve a problem on the scale of India‘s. Using two case studies, for Mumbai and Ahmedabad, we offer a critical examination of government policies that shape the real estate market and make formal housing unaffordable for a large part of the population. We then illustrate how simple city level market diagnostics can be used to identify policy changes and design smaller assistance programs that can reach the poor. We examine the linkage between chronic infrastructure backlogs and policies that make housing unnecessarily expensive. Increasing the carrying capacity of cities is essential for gaining acceptance of real estate policies suited to Indian cities. We propose approaches for funding major investments to achieve this. A. Introduction Two powerful principles have guided urban land management policies in India, at least since the 1970‘s. First, keeping India‘s cities livable means discouraging people from coming to large cities and distributing growth to rural areas and small secondary cities. Second, planning and other regulatory and financial policies coupled with rationing of urban services will actually 1 Brookings Institution, Independent Consultant, Environmental Planning Collaborative, and Independent Consultant respectively. Views expressed are personal and do not necessarily represent the policies of the Brookings Institution or the World Bank. The authors would like to thank the Rockefeller Foundation for financial support to conduct this research.
Transcript
P a g e | 1
“Working with the Market: a New
Approach to Reducing Urban Slums in India”
Patricia Annez, Alain Bertaud, Bimal Patel and V. K. Phatak1
Abstract
This paper examines the policy options for India as it seeks to improve living
conditions of the poor on a large scale and reduce the population in slums.
Addressing the problem requires first a diagnosis of the market at the city
level and a recognition that slums are a result of the working of the market—
not a failure of the market. We show that government programs that directly
provide housing would cost, on conservative estimates, about of 20 to 30 per
cent of GDP, and cannot solve a problem on the scale of India‘s. Using two
case studies, for Mumbai and Ahmedabad, we offer a critical examination of
government policies that shape the real estate market and make formal
housing unaffordable for a large part of the population. We then illustrate
how simple city level market diagnostics can be used to identify policy changes
and design smaller assistance programs that can reach the poor. We examine
the linkage between chronic infrastructure backlogs and policies that make
housing unnecessarily expensive. Increasing the carrying capacity of cities is
essential for gaining acceptance of real estate policies suited to Indian cities.
We propose approaches for funding major investments to achieve this.
A. Introduction
Two powerful principles have guided urban land management policies in
India, at least since the 1970‘s. First, keeping India‘s cities livable means
discouraging people from coming to large cities and distributing growth to
rural areas and small secondary cities. Second, planning and other regulatory
and financial policies coupled with rationing of urban services will actually
respectively. Views expressed are personal and do not necessarily represent the policies of the Brookings Institution
or the World Bank. The authors would like to thank the Rockefeller Foundation for financial support to conduct this
research.
P a g e | 2
prevent people from moving to cities and hence make them more livable.
Together, these two principles are part of a broader philosophy underlying
the thicket of policies commonly referred to as the ―license raj‖ that grew up
after Independence in India. This contrasts to the overall policy approach post
reform in 1991, which—very successfully—unleashed the sources of economic
growth and sought to manage economic decisions less directly. Here, we argue
that, whatever their merits in the past, existing urban land management
policies that seek to control the urban land market tightly are no longer suited
to an India which is growing at rates exceeding 8% for sustained periods and
in which 70% of new employment is generated in its cities. These policies have
made formal housing expensive and unattainable to a large share of the
population, reinforced both chronic urban infrastructure shortages city-wide
and squalid, precarious living conditions in urban slums.
The government of India (GoI) is to be applauded for wishing to turn this
around-- taking on the ambitious and worthwhile task of dramatically
improving living conditions in India‘s cities, with the ultimate goal of Cities
without Slums. Substantial increases in central budgetary support to major
programs that will improve slums in Indian cities are in the works. It is
timely to consider the design of a major program shift such as this. In spite of
India‘s rapid growth, ensuring that good housing standards are affordable to
all who wish to live in cities will probably take a generation, and getting off to
the right start with the first major central slum program is key.
As we argue below, a housing policy that supports ―cities without slums‖
should involve: (1) making the market work better so that market-priced
housing is more affordable; and (2) subsidies targeted primarily to the
substantial share of the urban population that will still be too poor to afford
socially acceptable minimum shelter conditions. Assistance to all those
households, even if targeted carefully, will be large in relation to fiscal
capacity. This paper proposes an approach designed make the lofty goal of
improving living conditions for all of India‘s urban poor attainable, and
maximize the effectiveness of government resources dedicated to this effort.
Without government action, slum populations can be expected to grow in
urban India even in the face of rapid income growth. Table 1 below illustrates
a variety of scenarios for populations under the poverty line in India. These
scenarios use the population projections from McKinsey (2010) and draw
from the range of estimates of the elasticity of poverty headcount percentages
with respect to economic growth. (Murgai and Zagha: 2010). Even with
P a g e | 3
sustained rapid income growth, millions in cities are likely to remain poor and
be unable to afford access to formal housing. This is because the urban
population in India is due to grow considerably over the next 20 years. Even
with rapid income growth, and much lower poverty incidence, the numbers of
poor people in cities will continue to be substantial. Even with the arguably
implausibly optimistic scenario of reaching a 2% poverty incidence in India‘s
cities, 11 million people will be poor. A more likely scenario suggests that
twenty years from now, somewhere between 30 and 40 million people in urban
India will be poor, even if the economy performs very well over the long term.
Scenarios of # of Poor in Cities
Elasticity of Poverty with respect to Income Growth
Income Growth pa
Period in Years
# of Urban Poor 2030 M
Urban Poverty incidence
Total Urban Population 2030 M
0.5 8% 20 65 11.1% 590
1 8% 20 28 4.7% 590
1 6% 20 43 7.3% 590
1.2 10% 20 11 1.9% 590
Table 1: Number of people under the poverty line in urban India under
different poverty elasticity assumptions Source: Authors‘ calculations.
This paper outlines a new strategy in four main sections:
1) Shaping the market to ‗right-size‘ the need for subsidies. The supply
of urban real estate markets in India is deeply constrained by
misguided or outdated government policies. These policies have a
dramatic effect on prices and the quite unsurprising result is by far
the largest slum population of any country in the world. India‘s vast
and growing slums are not an inevitable result of fast urban growth
or poverty. Vietnam‘s cities are growing at twice the rate in India,
per capita income is roughly similar, but the incidence of slums is
much smaller. Other once-poor Asian countries like Thailand have
passed through the early phases of their urban transition with far
smaller slum populations. Hong Kong accommodated one of the most
rapid influxes of poor migrants in the 1950s and 1960s, while rapidly
accommodating them in decent housing. If India wishes to deal with
the slum problem on a large scale, it must wind down the phalanx of
P a g e | 4
policies that artificially raise the price of housing and make the slum
problem larger than it need be. The first section discusses these
distortions and their impacts.
2) Shortcuts to Reform through Direct Housing Provision: Can they
Work? The very distortions that restrict supply and inflate the cost
of housing also give the impression that there are affordable
shortcuts to the market reforms and targeted subsidies. Ideas like
cross subsidizing housing for slum dwellers out of the costs of putting
up new housing developments for the non-poor2 are popular with
governments around the world, because they have no visible
budgetary costs. In India, they are particularly attractive because
supply is so tightly rationed and housing prices so inflated that often
developers will accept these implicit taxes without complaint. Their
costs can easily be passed on to buyers. Because slums have grown so
rapidly in the face of rising prosperity, many have come to believe
that a rights driven approach for national standards of decent
housing funded by central subsidies can eradicate slums. In this
section we show that these ‗solutions‘ are both prohibitively
expensive and even under the most favorable assumptions would
take a generation to complete the enormous task of housing the
current slum population. Such programs are likely to shift the
affordability problem from households to governments. They may
offer expansive promises, but will fail to deliver. A few lucky or well
connected beneficiaries will receive a deep subsidy while the majority
of the target population will be excluded.
3) One Size Does Not Fit All: Illustration from Case Studies of
Ahmedabad and Mumbai In this section, we examine data on the
housing market outcomes, prices, sizes and locations of homes, plus
specific constraints to supply in each city. This analysis demonstrates
that an efficient approach to subsidizing a minimum shelter3
2 In India, these most commonly take the form of reservations requiring a certain percentage of houses for the poor
to be built in all new developments (one of the JNNURM reforms) or else provision of regulatory relief against
provision of homes to low income groups (TDR schemes). 3 We refer to shelter here because it includes not only housing but basic services that provide environmental
amenities to households such as safe water and clean and safe streets. In India, these services are rationed all over
the country and are of higher priority for government programs because these are much more problematic and more
expensive for individuals to provide on their own.
P a g e | 5
standard across all Indian cities must take into account market
conditions specific to each city. We demonstrate how this analysis
can be used to determine the scope, design and cost of government
assistance to address the slum problem in a given city.
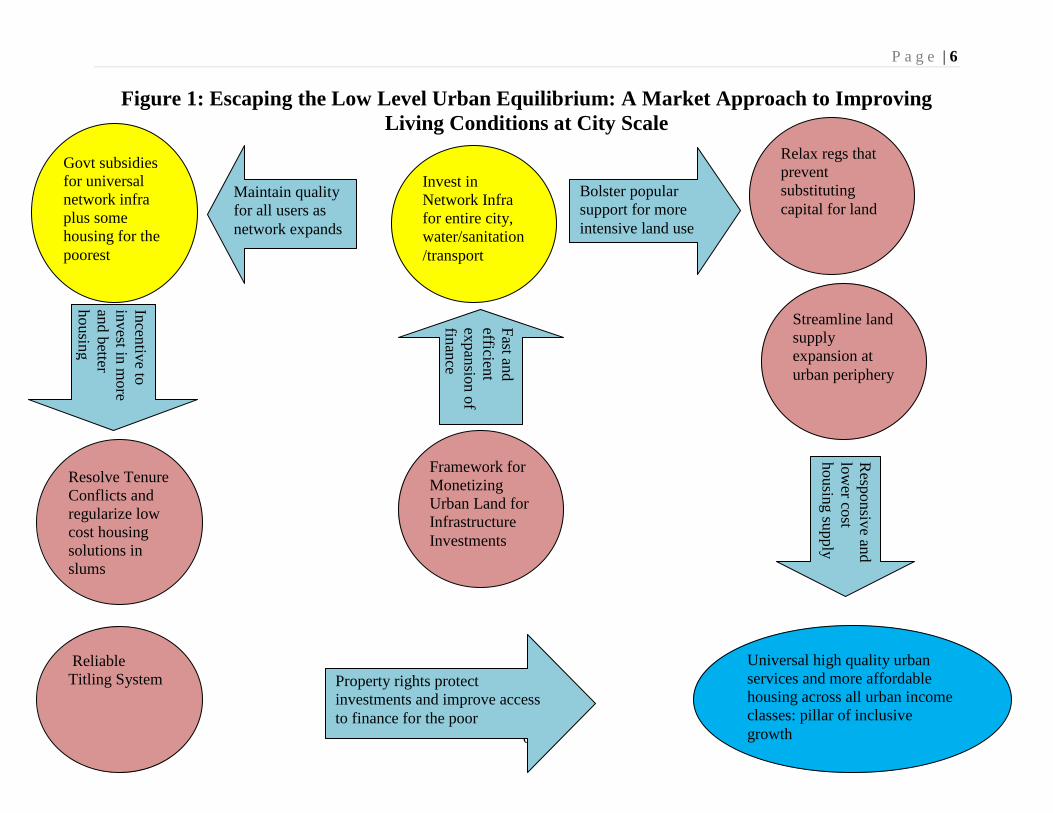
4) Key Elements for Government Slum Policy In conclusion, the
findings from the first three sections are recapitulated to discuss the
key elements of a strategy for improving the living conditions for
slum dwellers on a large scale—and city by city. Figure 1 below
recapitulates the key elements of such a strategy.
P a g e | 6
6
Figure 1: Escaping the Low Level Urban Equilibrium: A Market Approach to Improving
Living Conditions at City Scale
Streamline land
supply
expansion at
urban periphery
Relax regs that
prevent
substituting
capital for land
Invest in
Network Infra
for entire city,
water/sanitation
/transport
Resolve Tenure
Conflicts and
regularize low
cost housing
solutions in
slums
Govt subsidies
for universal
network infra
plus some
housing for the
poorest
Framework for
Monetizing
Urban Land for
Infrastructure
Investments
Reliable
Titling System
Bolster popular
support for more
intensive land use
Fast an
d
efficient
expan
sion
of
finan
ce
Resp
onsiv
e and
low
er cost
housin
g su
pply
Incen
tive to
invest in
more
and b
etter
housin
g
impro
ve
housin
g
Property rights protect
investments and improve access
to finance for the poor
Universal high quality urban
services and more affordable
housing across all urban income
classes: pillar of inclusive
growth
Maintain quality
for all users as
network expands
P a g e | 7
7
B. Right sizing the Need for Subsidies to Slum Dwellers:
The growth of slums is a market response
Contrary to the conventional view, the existence of slums is not a sign of
market failure. The growth of slums is a market response to the demand for
housing amongst low income households. The existence of slums demonstrates
that the private informal sector is able to devise housing solutions for even the
lowest income groups. Governments have an important role to play, however.
They determine whether these low-cost settlements get basic services.
Governments also decide on which protections they extend under the law for
acquired property rights and investments in informal structures. Likewise
government policies, by shaping the allowable options for a private sector
supply response, determine the share of total housing demand that can be met
in the formal sector, and how much must be met by informal slum
settlements.
Why is the share of the informal housing sector increasing in India while
urban productivity and households‘ income have been steadily increasing over
the last 20 years? Regulatory constraints and land supply bottlenecks created
by government prevent the formal housing market from offering products
that low income groups can afford. Dramatic under-provision of network
infrastructure that accommodates intensive land use and permits
concentration of population where people want and need to live considerably
compounds the problem. It reinforces pressures to regulate the supply of
built space and rations access to basic environmental services in informal
settlements. Removing these constraints could enable the formal sector to
meet a much larger part of the demand of households currently living in
slums. Government policy can also reduce the vulnerability of those who still
can only afford to live in informal settlements.
The appropriate frame of reference for policies to reduce the slum problem is the potential supply response across the entire housing stock.
Slums are not static entities. New households move into slums every day. The
new comers may be new migrants to the city or households who can no longer
afford formal housing. Some households currently living in slums may be able
to leave them and move to formal housing. Some slums may be improved to
P a g e | 8
8
the point that when their tenure is formalized, and their standards are similar
to formal housing.
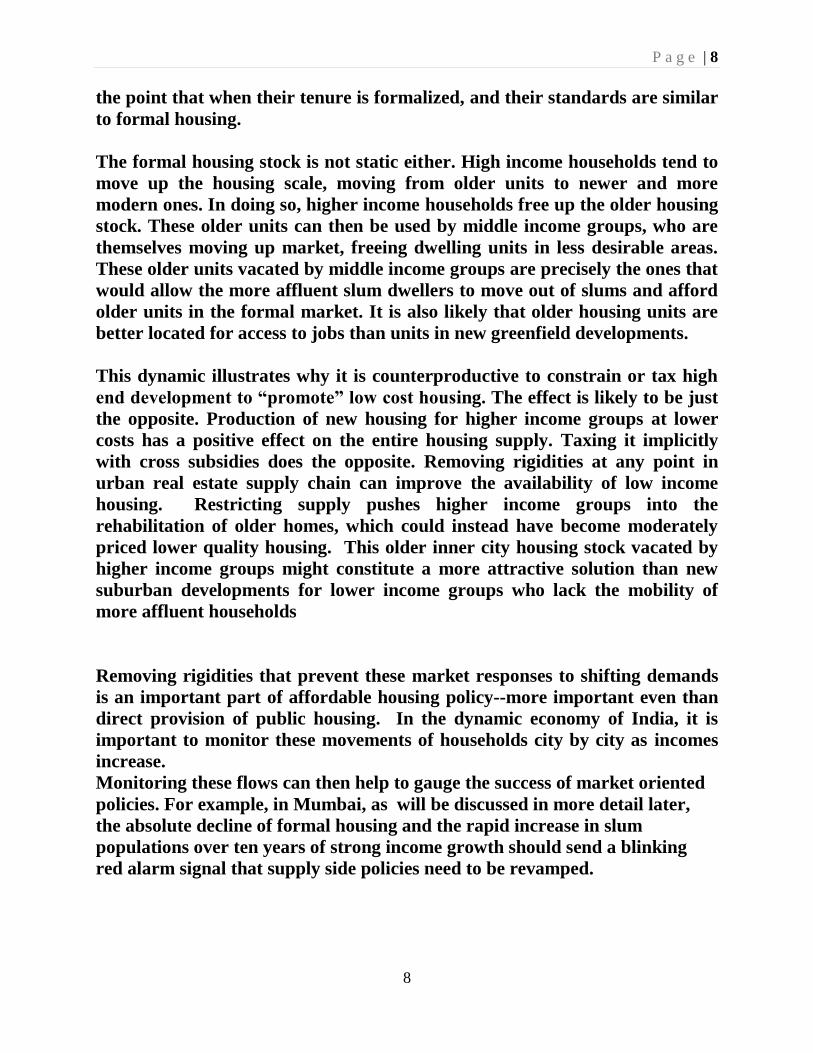
The formal housing stock is not static either. High income households tend to
move up the housing scale, moving from older units to newer and more
modern ones. In doing so, higher income households free up the older housing
stock. These older units can then be used by middle income groups, who are
themselves moving up market, freeing dwelling units in less desirable areas.
These older units vacated by middle income groups are precisely the ones that
would allow the more affluent slum dwellers to move out of slums and afford
older units in the formal market. It is also likely that older housing units are
better located for access to jobs than units in new greenfield developments.
This dynamic illustrates why it is counterproductive to constrain or tax high
end development to ―promote‖ low cost housing. The effect is likely to be just
the opposite. Production of new housing for higher income groups at lower
costs has a positive effect on the entire housing supply. Taxing it implicitly
with cross subsidies does the opposite. Removing rigidities at any point in
urban real estate supply chain can improve the availability of low income
housing. Restricting supply pushes higher income groups into the
rehabilitation of older homes, which could instead have become moderately
priced lower quality housing. This older inner city housing stock vacated by
higher income groups might constitute a more attractive solution than new
suburban developments for lower income groups who lack the mobility of
more affluent households
Removing rigidities that prevent these market responses to shifting demands
is an important part of affordable housing policy--more important even than
direct provision of public housing. In the dynamic economy of India, it is
important to monitor these movements of households city by city as incomes
increase.
Monitoring these flows can then help to gauge the success of market oriented
policies. For example, in Mumbai, as will be discussed in more detail later,
the absolute decline of formal housing and the rapid increase in slum
populations over ten years of strong income growth should send a blinking
red alarm signal that supply side policies need to be revamped.
P a g e | 9
9
How Urban Policies have Constrained the Private Sector Housing Supply Response in India
Policies that affect urban land use are at the heart of supply constraints.
Urban agglomeration economies are derived from locating in close proximity
to other productive activities. One of the most important features of any
residence is location close to jobs, services and amenities. As such, well located
urban built space is a valuable factor of production for all urban economic
activities and workers, and its price will be determined in a fierce competition
amongst all possible uses. Well located land is necessarily limited in any city.
In India, government policies further constrain the supply of land and floor
space while also inflating demand for land by:
1) Reducing the scope for substituting capital (building more stories) for
land
2) Imposing rigid requirements on consumption of land per area of usable
built space with little regard to its costs in terms of affordability
3) Raising the costs and time required for expanding land at the urban
periphery.
4) Freezing use of prime land for redevelopment regardless of its market
value, due either to public ownership, pervasive reservations of private
lands, tight regulations that make existing land use illegal, or
ambiguities in land tenure.
5) Chronically underinvesting in network and connectivity infrastructure
that permits a manageable and productive increase in urban densities.
Substituting Capital for Land
The typical solution to scarce and costly urban land is to substitute a cheaper
and more readily expandable factor, capital, for land by building multiple
stories. This permits production of more floor space in good locations. Rules
that limit the amount of floor space that can be built on a given piece of land
reduce the availability of well located floor space and bid up the supply price
of a given amount of floor area provided in cities to meet all demands,
including housing. This particular regulation is commonly referred to as a
maximum floor area ratio (FAR)4. Most countries use maximum permissible
FARs, but the FARs in large Indian cities are small fractions of those used in
most other large cities in the world, including in other low and middle income 4 Also referred to as maximum floor space index (FSI). These two are used interchangeably in this paper.
P a g e | 10
10
countries. The low values for FAR in many cities of India are exceptional as
can be seen in Figure 3. These low FAR in India also vary little with distance
from the city center unlike most other countries.
Figure 2: FAR variations with distance in Mumbai and other cities in the
world
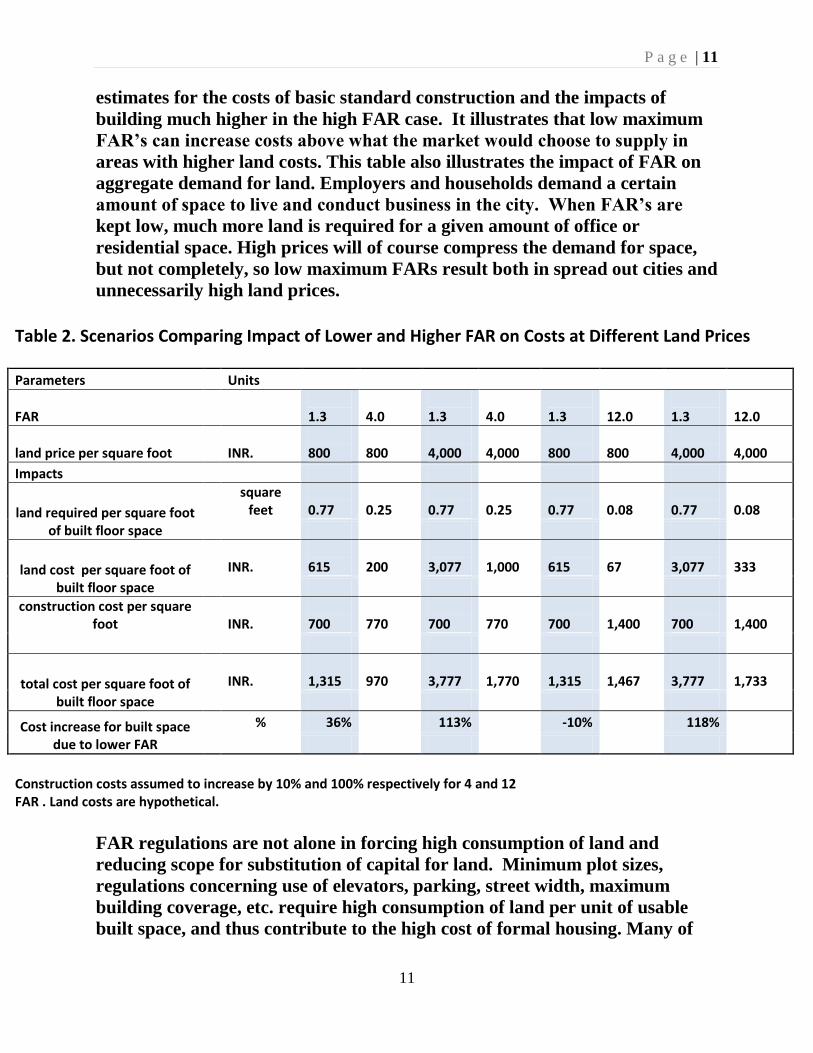
Table 2 illustrates how reducing FARs can raise the costs of providing living
space. This example uses land values representing relatively low and higher
values for large metro cities like Delhi or Mumbai and taking reasonable
P a g e | 11
11
estimates for the costs of basic standard construction and the impacts of
building much higher in the high FAR case. It illustrates that low maximum
FAR‘s can increase costs above what the market would choose to supply in
areas with higher land costs. This table also illustrates the impact of FAR on
aggregate demand for land. Employers and households demand a certain
amount of space to live and conduct business in the city. When FAR‘s are
kept low, much more land is required for a given amount of office or
residential space. High prices will of course compress the demand for space,
but not completely, so low maximum FARs result both in spread out cities and
unnecessarily high land prices.
Table 2. Scenarios Comparing Impact of Lower and Higher FAR on Costs at Different Land Prices
Parameters Units
FAR 1.3
4.0
1.3
4.0
1.3
12.0
1.3
12.0
land price per square foot INR. 800
800
4,000
4,000
800
800
4,000
4,000
Impacts
land required per square foot of built floor space
square
feet 0.77
0.25
0.77
0.25
0.77
0.08
0.77
0.08
land cost per square foot of built floor space
INR. 615
200
3,077
1,000
615
67
3,077
333
construction cost per square foot INR.
700
770
700
770
700
1,400
700
1,400
total cost per square foot of built floor space
INR. 1,315
970
3,777
1,770
1,315
1,467
3,777
1,733
Cost increase for built space due to lower FAR
% 36% 113% -10% 118%
Construction costs assumed to increase by 10% and 100% respectively for 4 and 12 FAR . Land costs are hypothetical.
FAR regulations are not alone in forcing high consumption of land and
reducing scope for substitution of capital for land. Minimum plot sizes,
regulations concerning use of elevators, parking, street width, maximum
building coverage, etc. require high consumption of land per unit of usable
built space, and thus contribute to the high cost of formal housing. Many of
P a g e | 12
12
these regulations are normative and not based on any economic assessment of
the costs (including the price of land) they impose on consumers of housing in
a given city. In some areas, these additional restrictions are such that they
prevent a developer from using even all the available FAR. The private formal
sector could provide more housing for low income groups if these regulations
were audited to insure that land use regulations are consistent with
purchasing power and urban land costs in different areas of the city. The cost
of reserving land for wide streets and parking lots even in areas where most
residents don‘t own cars and walk in their immediate neighborhood is much
higher in a mega-city like Delhi than a secondary town in a backward area.
Yet rarely do the regulations, typically established with strong guidance from
the State, reflect the costs imposed by rigid adherence to norms across cities
or neighborhoods. (See Annex 1 for some illustrative examples from the
Ahmedabad by-laws that make it hard to provide market responsive formal
housing for low income groups.)
Figures3a and b below illustrate the major impact of these regulations on fast-
growing economically vibrant cities. In Mumbai, regulations have driven
down permitted maximum FARs over the years, with the final reduction in
1991 (ironically coinciding with the dismantling of the license raj in other
parts of the economy) to a 1.33 Maximum Allowable FAR for the entire
greater Mumbai. Nearly all of the population increase over time has been
absorbed in slums even as income has increased rapidly. Now 54 per cent of
the population lives in slums. Mumbai has a much higher share of slum
population in spite of being better off. In Ahmedabad, over the period where
highly restrictive planning and regulatory policies were pursued, the
percentage of the population living in slums grew. (see Box 2). New census
information will be very useful to assess the impact of the policy changes that
were introduced in Ahmedabad in the 2000 plan.
Figures 4a and b illustrate, showing the household income class distribution
for Mumbai and Ahmedabad.
P a g e | 13
13
Figure3a. Mumbai --Population living in Formal Dwellings and Slums over Time
Figure 3b. Ahmedabad-Population Living in Formal Dwellings and Slums over time
0
10
20
30
40
50
60
0
2000000
4000000
6000000
8000000
10000000
12000000
1961 1968 1971 1976 1981 1984 1991 1996 2001
Pe
rc
en
t o
f S
lum
Po
pu
lati
on
Mumbai: Change in Slum and Non-Slum Population
Population Living in Slums
Population Living in Formal Housing
% of Slum Population
0
5
10
15
20
25
30
0
500,000
1,000,000
1,500,000
2,000,000
2,500,000
3,000,000
3,500,000
4,000,000
1971 1981 1991 2001
Pe
rc
en
t o
f S
lum
Po
pu
lati
on
Ahmedabad: Change in Slum and Non-Slum Population
Population living in Slums
Population living in Formal Housing
Percent of Slum Population
P a g e | 14
14
Figure 4a. Income Distribution in Ahmedabad
Figure 4b. Income Distribution in Mumbai
0 20000 40000 60000 80000 100000 120000
0
10
20
30
40
50
60
70
80
90
100
0
2
4
6
8
10
122
50
0
50
00
75
00
10
00
0
12
50
0
15
00
0
17
50
0
20
00
0
22
50
0
25
00
0
27
50
0
30
00
0
32
50
0
35
00
0
37
50
0
40
00
0
42
50
0
45
00
0
47
50
0
50
00
0
52
50
0
55
00
0
57
50
0
60
00
0
62
50
0
65
00
0
67
50
0
70
00
0
72
50
0
75
00
0
77
50
0
80
00
0
82
50
0
85
00
0
87
50
0
90
00
0
92
50
0
95
00
0
97
50
0
10
00
00
10
25
00
10
50
00
10
75
00
11
00
00
11
25
00
11
50
00
11
75
00
12
00
00
Cu
mu
lati
ve P
erc
en
t o
f H
ou
seh
old
s
Pe
rce
nt
of
Ho
use
ho
lds
Monthly Household Income-INR
Ahmedabad: Household Income Distribution
0 20000 40000 60000 80000 100000 120000
0
10
20
30
40
50
60
70
80
90
100
0
1
2
3
4
5
6
7
8
9
10
25
00
50
00
75
00
10
00
0
12
50
0
15
00
0
17
50
0
20
00
0
22
50
0
25
00
0
27
50
0
30
00
0
32
50
0
35
00
0
37
50
0
40
00
0
42
50
0
45
00
0
47
50
0
50
00
0
52
50
0
55
00
0
57
50
0
60
00
0
62
50
0
65
00
0
67
50
0
70
00
0
72
50
0
75
00
0
77
50
0
80
00
0
82
50
0
85
00
0
87
50
0
90
00
0
92
50
0
95
00
0
97
50
0
10
00
00
10
25
00
10
50
00
10
75
00
11
00
00
11
25
00
11
50
00
11
75
00
12
00
00
Cu
mu
lati
ve P
erc
en
t o
f H
ou
seh
old
s
Pe
rce
nt
of
Ho
use
ho
ld
Monthly Household Income _ INR
Mumbai: Household Income Distribution
P a g e | 15
15
The existing land registration and tenure system freezes land in current use, perpetuates fuzzy property rights that impede investment, and makes expansion of urban land use at the periphery costly and time-consuming.
In India, the transmission of land tenure and changes of land use are subject
to multiple layers of legislation, some dating from colonial times. Several
government agencies, from ministries of agriculture to the ministries of
finance and revenue have to provide an authorization for a simple change
from agricultural to urban use, even for lots already within the perimeters of
municipalities or development authorities. Oftentimes, urban land
transactions require time consuming coordination between state level
authorities in the revenue department and local government authorities,
whose systems operate on different principles.
Many lots in and around cities are sold and bought in good faith but without
always following the intricate procedures required by legislation, These lots
are then tainted with a ―fuzzy‖ or dubious title and any sale or re-
development of the land will potentially incur high risk and potential law suits
or a ―stay order‖. Oftentimes either old laws like the Urban Land Ceilings
Act, or restrictive land use regulations, now repealed, placed reservations on
plots which prevented normal legal transactions or made any formal use of
the land illegal. These plots were sometimes rented or ―sold‖ to unsuspecting
buyers who were unaware of the restrictions. Meanwhile the original owners
sometimes sought to regularize the land use while retaining formal title. This
cycle of regulation and creation of ―grey rights‖ results in competing claims
on these lands. Because of this legal uncertainty, many urban lots are de facto
frozen, preventing formal development or sale transactions. The number of
urban lots in Indian cities that are frozen and therefore removed from the
formal market is not known, but such frozen plots impede the intensification
of land use that is a normal part of the urbanization process. In some cities
lots with problematic tenure may amount to a large percentage of the formal
land market.
Lots with fuzzy tenure are often located in already urbanized and serviced
areas. The occupants who bought the land but do not have clear tenure are
likely to be able to resist eviction, but they are unlikely to invest in valuable
improvements. It is costly and time consuming to aggregate plots of land in
this condition, so redevelopment is very difficult. Yet these lots are well
located and may benefit from access to existing infrastructure networks. But
because these lots are frozen for formal development, a part of the existing
P a g e | 16
16
infrastructure cannot be fully used and the municipality or development
authority is obliged to develop more land in suburban areas.
In addition, even when land and property titles are clear, the high transaction
cost and time involved in transmitting titles act as supply constraints. High
stamp duties are not the only transaction costs. The time and expertise
required to transmit titles legally might discourage formal transactions for
small lots, although these are precisely the type of lots that should be readily
marketable! They allow for an efficient expansion of built space in local areas
without requiring major infrastructure expansion. Simplifying the procedure
for changing land use and transmitting title would increase immediately the
number of urban lots that could be developed and would contribute to
alleviating the land and floor space shortages in Indian cities.
We illustrate the specific difficulties and types of transactions costs incurred
using an analysis of land conversion at the urban periphery taken from
Ahmedabad.
Conversion of land at the urban periphery. The topography of the
surrounding countryside does not pose an impediment to the expansion of the
city. However, before anyone can legally build there, land surrounding the
city that is classified as agricultural5 has to be legally converted to urban land.
This is a complex process involving a number of physical, cadastral and
tenure related transformations. Completing each of those steps involves a
great deal of time, financial outlays, and risks for a developer. These in turn
drive costs which must ultimately be built into the price of the final housing
product (or commercial or industrial space). Interest during construction is
one of the most important cost drivers for developers. It accounts for about
half of total development costs in a typical development project in a relatively
expeditious regulatory environment. The cost burden, direct and indirect, of
these procedures can be very substantial.
Key steps in the entire process, starting from the conversion of agricultural
land up to sale of housing as well as the different agencies involved are listed
in Figure 5 below. All new housing provided on the periphery of Ahmedabad
must pass through these laborious procedures. The process for redeveloping
and intensifying land use on existing plots within the city is similar except that
steps 4 to 8 are not relevant—if the plot has already passed through the
5 By agricultural land, we mean land classified as agricultural. This can be the case where or not the land is under
cultivation.
P a g e | 17
17
agricultural to urban conversion process, which is not the case for many plots
in the city.
Figure 5: Process for Adding to the Housing Stock on the Urban Periphery in
Ahmedabad
Sources:
1. From unpublished research project undertaken by Environmental Planning
Collaborative, Ahmedabad, 2009. For complementary details see Patel Bimal, et alia
(2009)
High minimum regulatory standards not only raise the costs of a legal dwelling and impose heavy costs on low income groups: they also block a potential source of investment in low cost housing
P a g e | 18
18
Households living in slums are penalized in many ways in addition to living in
an unsanitary and crowded environment. These penalties include difficulties
of access to normal urban services ranging from solid waste removal to water
supply and sanitation. However, one of the most important social and
economic penalties imposed by high standards is the exclusion of slum
dwellers‘ housing from the protection of the law normally accorded through
the property rights system. Any real estate transaction is illegal in slums.
Transactions however are indispensable and occur as often in slums as in the
formal real estate sector. Any dispute over contracts can be solved only by
using force, because contracts passed in the informal sector are unenforceable
in a normal court of law. Slum dwellers are also subject to evictions and loss
of all they have invested in their homes and land, and may pay regular
protection money to avoid this. Yet, one of the best sources of supply of well
located low cost housing is current slum dwellers, who, if they have sufficient
security of tenure will invest in additional housing space which can be sold or
rented out to even lower income groups. Maintaining strict and inflexible
standards increases vulnerability and thus cuts off this potential supply. This
situation contrasts sharply with urban China, for example, where the urban
villages system protects ‗peasant‘ landowners who have legal land tenure and
who do not need to adhere to normal urban building standards. These villages
provide an often very well located supply of low cost rental housing for the
low income population, including migrants. Measures to facilitate some form
of parallel formal housing market that permits lower standards in limited
areas of a city and provides explicit legal protections for owners of this
housing should be considered for India‘s cities.
Chronic under investment in primary infrastructure and rapid transit impede development at densities reflecting the economic potential of urban land and make it very difficult to rationalize land use regulations;
Failure to invest sufficiently in urban infrastructure has greatly contributed
to the current shortage of urban built space and extremely high real estate
prices. McKinsey
(2010) estimate that Indian cities make annual capital
investments of $14 as compared to $116 in Chinese cities! The lack of urban
roads and public transport contributes to the fragmentation of urban labor
markets and substantially reduces urban productivity. Poor quality public
transportation drives people to live near their work, further creating pressure
on well-located land. In Indian cities, shortages of water and power, drainage,
sewers and proper waste disposal facilities affect all income groups.
P a g e | 19
19
Government‘s perceived inability to expand and improve infrastructure
networks in response to reasonable demands for urban infrastructure is
responsible for what might be termed a Malthusian view of the carrying
capacity of cities. Infrastructure is so chronically undersupplied, and responds
to little to increases in population and economic activity that it is seen as a
fixed resource rather than a set of services managed to meet local demand.
The unpopularity of land use reform that would increase the intensity of land
use, whether it is to increase FAR or to redevelop obsolete cotton mills, is
symptomatic of this view and quite understandable. Without very substantial
improvements of basic infrastructure services that eliminate the chronic
shortages that all urban users face, it is more than likely that any increase in
local density will be perceived as decreasing the availability, quality, and
reliability of basic services for those already living in cities.
No low income housing policy with large scale impacts could succeed in India
without a massive investment to upgrade the quality of city-wide network
infrastructure, mostly water, power, storm drainage and transportation. It is
an essential facilitator of all the supply side regulatory changes we have
discussed above. After supply side reforms, the private sector may be able to
provide new low cost housing affordable to many current slum dwellers, but
the existing infrastructure could still not cope with the increased water and
power consumption that would be required—just as it cannot meet current
consumption requirements. Similarly, the TDR programs currently seen as a
budget neutral solution for the slum problem will place additional stresses on
already overstretched infrastructure systems in cities. Using the right fiscal
instruments, it is possible to intensify land use to increase the supply of
housing, and provide finance for more and better infrastructure.
To build critical local support for more rational land use policies, a dramatic
revamping of infrastructure systems in major cities is essential. This
infrastructure transformation would not only make higher densities
acceptable, but would have strong economic benefits as well, making more
agglomeration economies possible and economizing on the current high costs
imposed by enduring and appalling infrastructure gaps. Rather than playing
catch up and seeking to fulfill last year‘s needs, these programs should aim to
build for the city of the future reflecting plausible projections of population
and economic growth. Beyond improving the quality of basic services in cities,
better transport connectivity is essential for making real estate markets work
better. Reduced travel times in the city expand the land area that is
considered desirable for either working or living space. This approach would
P a g e | 20
20
be a dramatic departure from past practice in India. It has been the practice
in many fast growing East Asian countries like China, Singapore, Hong Kong
and Korea.
Such a program would take a lot more resources than are currently spent in
Indian cities, but it would not be unaffordable. McKinsey (2010) catalogues a
number of options for increasing resources for investment in urban
infrastructure. India‘s cities have large untapped resources of public lands
and other land asset related instruments at their disposal that could generate
funding many multiples of what has flowed into India‘s cities in the past.
These resources could be used to form the foundation of a finance package for
infrastructure improvements of unprecedented scale. A sale of a mere 13
hectares in Bandra Kurla in 2005 brought revenues equivalent to 10 times the
MMRDA‘s investment budget of that same year and 3.5 times the value of all
municipal bonds floated in all Indian cities in the decade following inception
of the program. The revenues raised, as astounding as they are, did not fully
exploit the potential of this land. Sold with an FAR of only 2, had the FAR
been set at 5 (still low by international standards) the revenues raised could
have been more than double—tantamount to over 20 years of MMRDA
capital spending in 2005 (Peterson:2009). Box 1. provides an example of one
such transaction in Ahmedabad that will help transform the city.
P a g e | 21
21
.
Box 1. Monetizing Government Land for Slum Improvements, Provision of High Quality
Urban Public Space and Basic Infrastructure: the Sabarmati Project in Ahmedabad.
Civic leaders in Ahmedabad had long dreamt of transforming the riverfront of the
Sabarmati into a focal point of high quality public space in the city. When the Narmada
dam transformed the Sabarmati‘s flow from seasonal water availability during the
monsoon to a continuous flow, it became possible to move from dreams to designs and
plans.
The concept was to undertake massive embankment and land reclamation works to create
a public realm along the river, improve the river‘s flood carrying capacity and to even out
and protect the very irregular unstable banks that characterized the Sabarmati‘s meander
through Ahmedabad. Interceptor sewers embedded in the reclaimed land would capture
untreated sewage coming through the storm water drainage lines and divert it to sewage
treatment station downriver, thus making the environment much cleaner and more
agreeable. Another very important project component involved relocation of the
population living in the slums on the riverbanks to basic housing in the vicinity of the river
At the end of the project, public promenades, parks, informal markets and a wide variety
of social amenities would be built on both sides of the river and less than a fifth of the land
would be offered for sale for commercial and residential development.
The project cost was substantial, estimated at INR .3.6 billion. (361crores) in 1998 . Not
many cities have the ability to raise such funding on capital markets or from banks.
However, in this case, the city used a very innovative financing strategy. The Ahmedabad
Municipal Corporation(AMC) obtained an agreement from the Government of Gujarat to
cede the property rights over the reclaimed river bed to them. Once the project was
completed, sales of a fraction of the reclaimed land were estimated to cover the costs fully
and the financing plan included loans against estimated land prices to be realized once
works are completed at which time loans will be paid back. Essentially this financing
method used an asset of little value before the project that was transformed by the project
itself. The key lay in obtaining agreement from the State to release their ownership rights
to the city.
Source: Authors
Much government controlled urban land is currently underused. If developed at an intensity commensurate with its market price, such land offers an important source of well located urban built space;
In Indian cities, as is the case in many other countries6, the several levels of
government and parastatal enterprises own large tracts of land, often located
in central, highly desirable urban areas well connected to existing
6 Research conducted for the World Bank’s Urban Growth Management Initiative indicates that publicly owned
land accounts for more than half of total city territory in 19% of the 120 cities in its sample, and more than one-
quarter of city territory in an additional 19% of cities. Rajack( 2007).
P a g e | 22
22
infrastructure networks. Large parts of these government land holdings are
often underused or even vacant. Because leasing or selling government land is
an extremely complex business, even very valuable land stays vacant or
underdeveloped. This frozen land decreases the land supply on the market
and contributes to high land and housing prices. For instance in Mumbai,
Port Authority land represents 9 km2 of prime land already served by
infrastructure and with potentially 10 km of sea frontage. This area
represents 12.5 % of the total land area of the island city! Allowing more
intensive redevelopment of this land, while maintaining space for the use of its
current owner, could still significantly expand well located built space in the
city, and reduce demands for land in the distant suburbs and help to avoid
costly expansion of infrastructure networks.
Removing Supply and Regulatory Constraints Helps to ―Right-Size‖ the
Requirement for Government Subsidies
Figure 6 illustrates how revising policies that shape the market also reduce the
need for direct government subsidies to improve living conditions in cities.
Undoing some of the damage associated with these policies can make formal
housing affordable to a larger share of the population and make the slum
problem more manageable.
P a g e | 23
23
Figure 6: Housing Policy, housing consumption and households‘ income
The upper left graph shows the current supply price and affordability of
housing by income group. The standards that the private sector supplies –
formal and informal – that are affordable to a given income group are
represented by the curve AB. These are dependent on regulatory supply
constraints and availability of urban infrastructure. The limit between the
formal and informal sector is established by the minimum regulatory
standards (C on the vertical axis) for the formal sector. The market cannot
produce formal housing units below a price dictated by the combination of
regulatory standards (minimum plot size, apartment size, maximum FAR,
etc) and market land and construction prices. The informal housing sector,
not constrained by these standards, produces housing units for the households
who cannot afford the cheapest unit produced by the formal sector. Policy
changes (and complementary infrastructure investments) that affect the
ability to substitute capital for land and make the supply of urban land more
responsive can lower the cost of producing a given housing standard, thus
P a g e | 24
24
increasing what every income group can afford. This can be seen in the shift
from AB to AF. Selective relaxation of rigid standards brings the most basic
formal dwelling unit from C to D.
The current household income distribution is represented in the lower left
part of the graph. No credible housing policy can be designed without
knowing the number of potential beneficiaries and therefore the total
resources that would be required. This is why the upper and lower graphs
should be considered together. The upper part of the graph shows housing
consumption, the lower one shows the number of households at each
consumption level. The removal of supply constraints and relaxation of
standards increases housing consumption of most former slum dwellers and
allows the private formal sector to provide housing units affordable to them.
However, even after these measures, some very low income households can
only afford extremely low housing standards. The government can economize
its own subsidy resources by concentrating its efforts first on direct provision
to this group by directing supply subsidies in the form of social services and
tertiary infrastructure7. We estimate roughly that it would cost about INR
40,000 per slum dweller. The unit cost is an order of magnitude less than the
costs of the more ambitious programs discussed below, and constitutes a
major, but manageable government program. The number of households that
would receive subsidies would be only a fraction of the number of households
currently living in slums. Over time, a number of households will move out of
much improved slum neighborhoods into the formal sector, although some of
them would be replaced by new unskilled migrants. In addition, since part of
the supply side measures include substantial improvements for infrastructure
networks, all income groups in the city would benefit.
C. Can Direct Housing Provision Work without Measures to Make the Market Work Better?
Because the existence of slums has been erroneously thought to be the
symptom of a private sector market failure, the traditional response of
governments has been to substitute itsel for the market. First, governments
often take on the costly proposition of substituting themselves for the private
sector by building housing directly for the poor, mandating that the private
sector do so, or providing private builders with subsidies to produce low 7 Local neighborhood level network extensions/improvements and household connections.
P a g e | 25
25
income housing. Second, governments also seek to stimulate purchasing power
of low income households through privileged access to credit, interest rates
subsidies or sometimes direct cash assistance for purchasing or renting homes.
In this section we examine the feasibility of some of these ―direct provision‖
solutions and their scope for solving the problem. We show that these
shortcuts to making the market work better are likely to have very limited
impacts, and cannot substitute for a strategy that takes on the policy issues
and on feasible goals.
The 270 square foot housing program for slum dwellers is prohibitively expensive
The government housing policy proposes to provide a formal 270 square foot
house to all current slum dwellers. McKinsey (2010) evaluates at 25 million
the total number of urban households in India who cannot afford a minimum
house. The same report evaluates the average cost of providing such a
minimum house in Indian cities at about INR 440,000 (US$ 9,700) including
land and tertiary infrastructure networks There are a number of reasons to
believe that this estimate represents a lower bound of the costs involved.
Providing access to such a large home for all slum dwellers will demand more
land and is likely to bid up the price. In Mumbai, as we will see below in the
detailed case study, the cost of a unit in a location in which current slum
dwellers currently choose to live would be about three times that figure. With
over 6 million slum dwellers in Mumbai alone, this could increase this
estimated cost of providing housing for all slum dwellers by 50%.
Even using these conservative cost estimates, the total cost of providing these
minimum standard dwellings for 25 million households would thus be at least
of 1,100,000 Crores INR (US$ 242.5 billion). This amounts to roughly 20% of
2008-2009 GDP. Taking into account the higher costs in Mumbai alone, the
bill could rise to 30% of GDP.
The costs for such a program do not stop with government-provided basic
housing. The increases in network infrastructure capacity, plus expansion of
primary and secondary infrastructure networks needed to accommodate the
increased consumption of all services that would arise from moving from
slums to formal housing will add a very significant additional cost. These
formal dwellings would include a kitchen and bath with running water which
would increase water consumption from 50 liter per capita per day (lpcd)—
P a g e | 26
26
the current average for slum dwellers to the minimum basic standard of 150
lpcd. The total additional water supply capacity to be added—just to support
the minimum housing program—would be at least 10 million cubic meters per
day (assuming an average household size of 4 and no leaks in the system). A
similar complement of incremental costs would arise both for sewers and
electricity. Such a dramatic infrastructure expansion is both costly and
unrealistic.
As appealing as the promise of a minimum standard home and the implicit
backing of central government to fund it may be, such a promise has no
likelihood of being fulfilled. Even if executed over a decade, such a program
could cost considerably more than the National Rural Employment Guarantee
Scheme, and would stretch fiscal capacity beyond a plausible ability to pay.
Developer Incentives Cannot Solve the Slum Problem on a Large Scale Because land regulations are extremely tight in India‘s major cities,
developers have been willing to provide some low cost housing as part of a
package that also allows them to use land more intensively in the form of
increased FAR. That is fact. The relative success of such transactions in the
past has led to the belief that a large part of the affordable housing problem
can be solved in this way. That is a fallacy.
Two types of proposals using developer incentives are commonly suggested
for housing slum dwellers at low cost.
1) Imposing a quota on new formal housing projects to oblige the
private sector to build EWS housing
2) Using tradeable development rights (TDR) to provide free housing to
slum dwellers
Both approaches, by loading the costs of social housing onto the production of
new housing units, operate by imposing a de facto tax on formal housing over
and above the current 27 % tax that is already collected by state and central
government on housing (McKinsey: 2010: 129). There are limitations to using
such cross subsidies.
First of all, taxing new formal housing on a large scale has the perverse effect
of making formal housing less affordable. Creating an additional tax on
formal housing, whether in the form of land quota for EWS or TDR, increases
P a g e | 27
27
its cost. This effect raises the number of households who must meet their
needs in the informal sector. The share of formal housing in big cities like
Mumbai where these schemes are particularly popular (see Table 3) has
shrunk in the last few years. Attempting further taxation of the formal sector
will merely aggravate this trend.
P a g e | 28
28
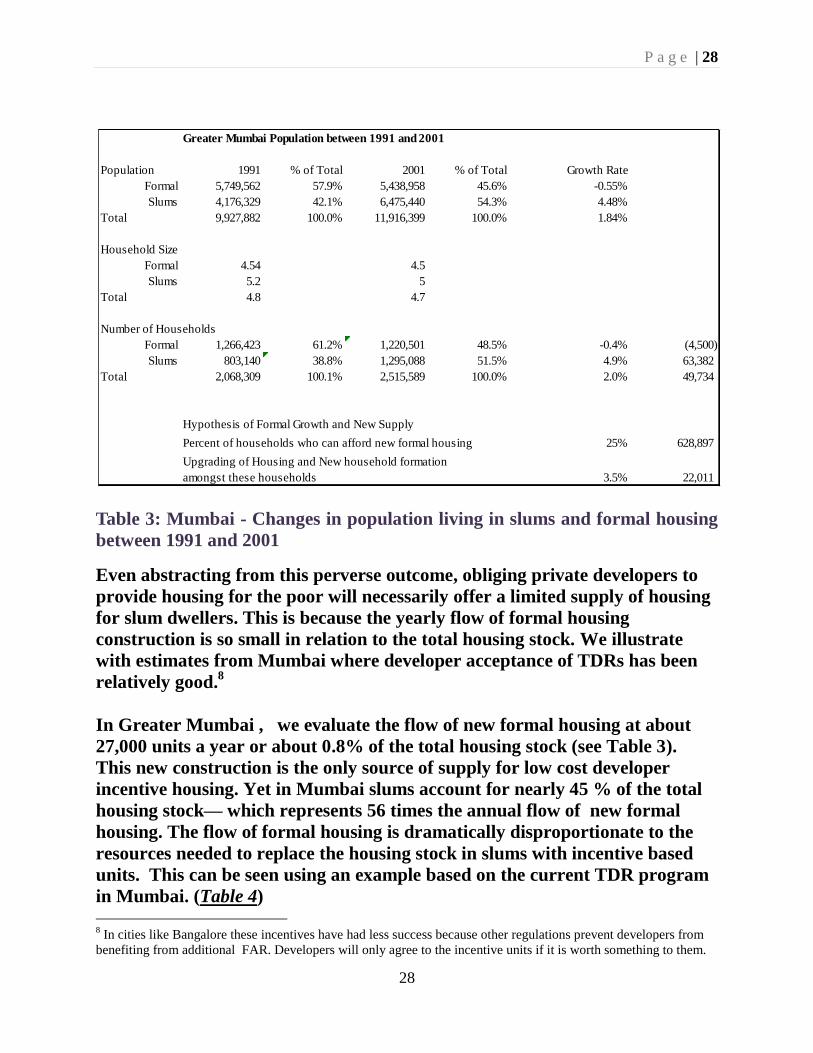
Table 3: Mumbai - Changes in population living in slums and formal housing
between 1991 and 2001
Even abstracting from this perverse outcome, obliging private developers to
provide housing for the poor will necessarily offer a limited supply of housing
for slum dwellers. This is because the yearly flow of formal housing
construction is so small in relation to the total housing stock. We illustrate
with estimates from Mumbai where developer acceptance of TDRs has been
relatively good.8
In Greater Mumbai , we evaluate the flow of new formal housing at about
27,000 units a year or about 0.8% of the total housing stock (see Table 3).
This new construction is the only source of supply for low cost developer
incentive housing. Yet in Mumbai slums account for nearly 45 % of the total
housing stock— which represents 56 times the annual flow of new formal
housing. The flow of formal housing is dramatically disproportionate to the
resources needed to replace the housing stock in slums with incentive based
units. This can be seen using an example based on the current TDR program
in Mumbai. (Table 4) 8 In cities like Bangalore these incentives have had less success because other regulations prevent developers from
benefiting from additional FAR. Developers will only agree to the incentive units if it is worth something to them.
Greater Mumbai Population between 1991 and 2001
Population 1991 % of Total 2001 % of Total Growth Rate
Peterson, George. 2009. Unlocking Land Values for Urban Infrastructure
PPIAF Trends and Policy Options Series No. 7, Washington DC: World Bank
Rajack , Robin. 2007. ―Does the Ownership and Management of Public Land
Matter to Market Outcomes?‖ Paper presented to World Bank Urban
Symposium, Urban Land Use and Urban Markets (Washington, DC: May
2007).
World Bank , 2005. Judy Baker, Rakhi Basu, Maureen Cropper, Somik Lall
and Akie Takeuchi ―Urban Poverty and Transport: The Case of Mumbai‖
World Bank Policy Research Working Paper 3693, September 2005
P a g e | 52
52
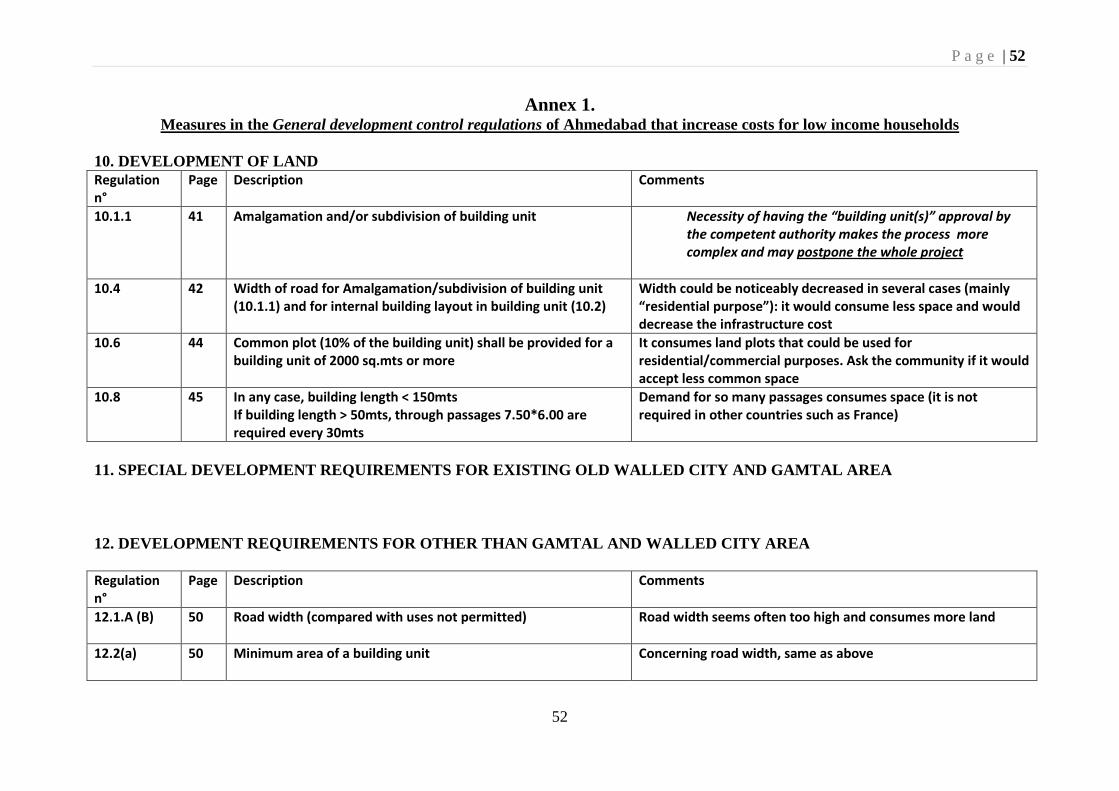
Annex 1. Measures in the General development control regulations of Ahmedabad that increase costs for low income households
10. DEVELOPMENT OF LAND
Regulation n°
Page Description Comments
10.1.1 41 Amalgamation and/or subdivision of building unit Necessity of having the “building unit(s)” approval by the competent authority makes the process more complex and may postpone the whole project
10.4 42 Width of road for Amalgamation/subdivision of building unit (10.1.1) and for internal building layout in building unit (10.2)
Width could be noticeably decreased in several cases (mainly “residential purpose”): it would consume less space and would decrease the infrastructure cost
10.6 44 Common plot (10% of the building unit) shall be provided for a building unit of 2000 sq.mts or more
It consumes land plots that could be used for residential/commercial purposes. Ask the community if it would accept less common space
10.8 45 In any case, building length < 150mts If building length > 50mts, through passages 7.50*6.00 are required every 30mts
Demand for so many passages consumes space (it is not required in other countries such as France)
11. SPECIAL DEVELOPMENT REQUIREMENTS FOR EXISTING OLD WALLED CITY AND GAMTAL AREA
12. DEVELOPMENT REQUIREMENTS FOR OTHER THAN GAMTAL AND WALLED CITY AREA
Regulation n°
Page Description Comments
12.1.A (B) 50 Road width (compared with uses not permitted) Road width seems often too high and consumes more land
12.2(a) 50 Minimum area of a building unit Concerning road width, same as above
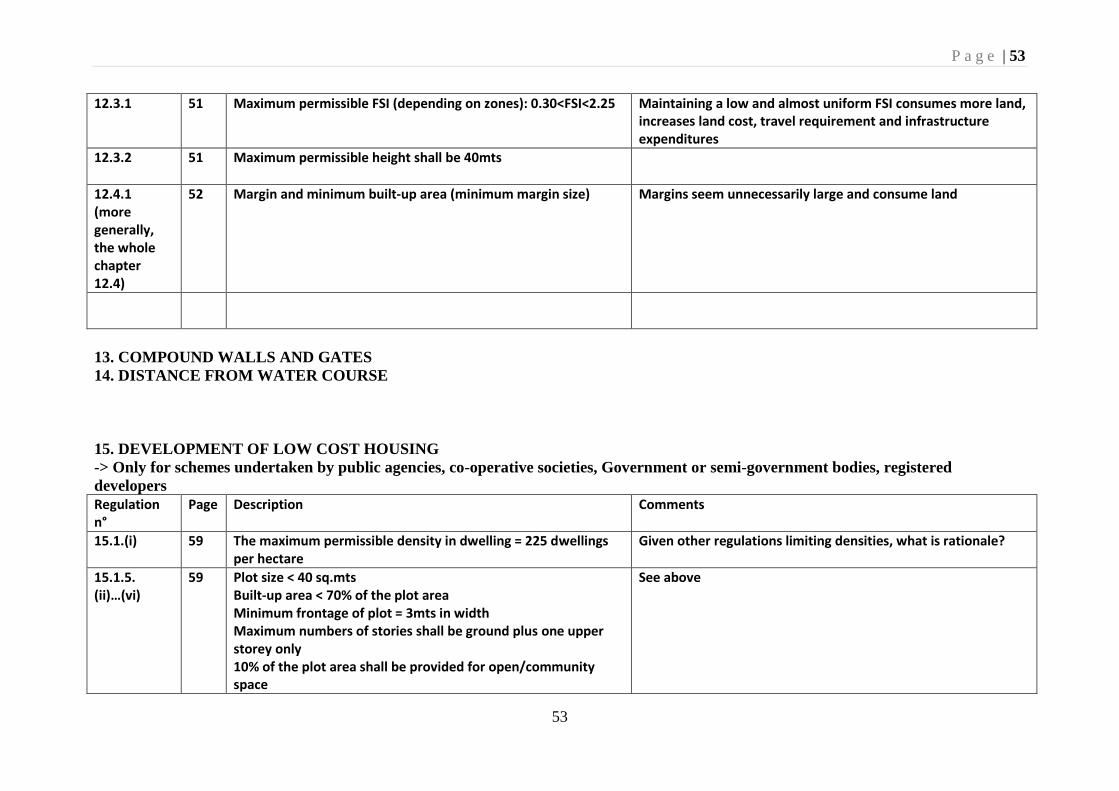
P a g e | 53
53
12.3.1 51 Maximum permissible FSI (depending on zones): 0.30<FSI<2.25 Maintaining a low and almost uniform FSI consumes more land, increases land cost, travel requirement and infrastructure expenditures
12.3.2 51 Maximum permissible height shall be 40mts
12.4.1 (more generally, the whole chapter 12.4)
52 Margin and minimum built-up area (minimum margin size) Margins seem unnecessarily large and consume land
13. COMPOUND WALLS AND GATES
14. DISTANCE FROM WATER COURSE
15. DEVELOPMENT OF LOW COST HOUSING
-> Only for schemes undertaken by public agencies, co-operative societies, Government or semi-government bodies, registered
developers
Regulation n°
Page Description Comments
15.1.(i) 59 The maximum permissible density in dwelling = 225 dwellings per hectare
Given other regulations limiting densities, what is rationale?
15.1.5. (ii)…(vi)
59 Plot size < 40 sq.mts Built-up area < 70% of the plot area Minimum frontage of plot = 3mts in width Maximum numbers of stories shall be ground plus one upper storey only 10% of the plot area shall be provided for open/community space
See above
P a g e | 54
54
15.2 (2) 59 Maximum permissible FSI = 1.8
16. PROVISIONS FOR SPECIAL DEVELOPMENTS
17. GENERAL BUILDING REQUIREMENTS
Regulation n°
Page Description Comments
17.1 (i) 65 Lift shall be provided in case of building having height more than 13 mts from ground level
Communities say they would accept 4 floors building without elevators
17.1 (iii) 65 In case of building with 21 mts or more in height, at least two lifts shall be provided
Same as above
17.20.8 17.20.13
77 Maintaining skyline and architectural harmony Blanket restriction. Need for such rules depends on the number and the location of precincts (vague)including listed heritage buildings.
18. REGULATIONS FOR SPECIAL STRUCTURES (cinema, theater, meeting hall…)
19. PARKING
Regulation n°
Page Description Comments
19.1 91 For residential area, parking space required is 15% of maximum permissible FSI
For low income residents there a real demand for such a parking area which is costly and consumes land? This rule combines with height restrictions and requirements for elevators to increase demand for land or require higher costs for elevators.
DRAFT FOR REVIEW ONLY –PLEASE DO NOT QUOTE
55
Annex 2. Ahmedabad and Mumbai: Computation of Income Distributions and Allocation of Households
Across Housing Stocks
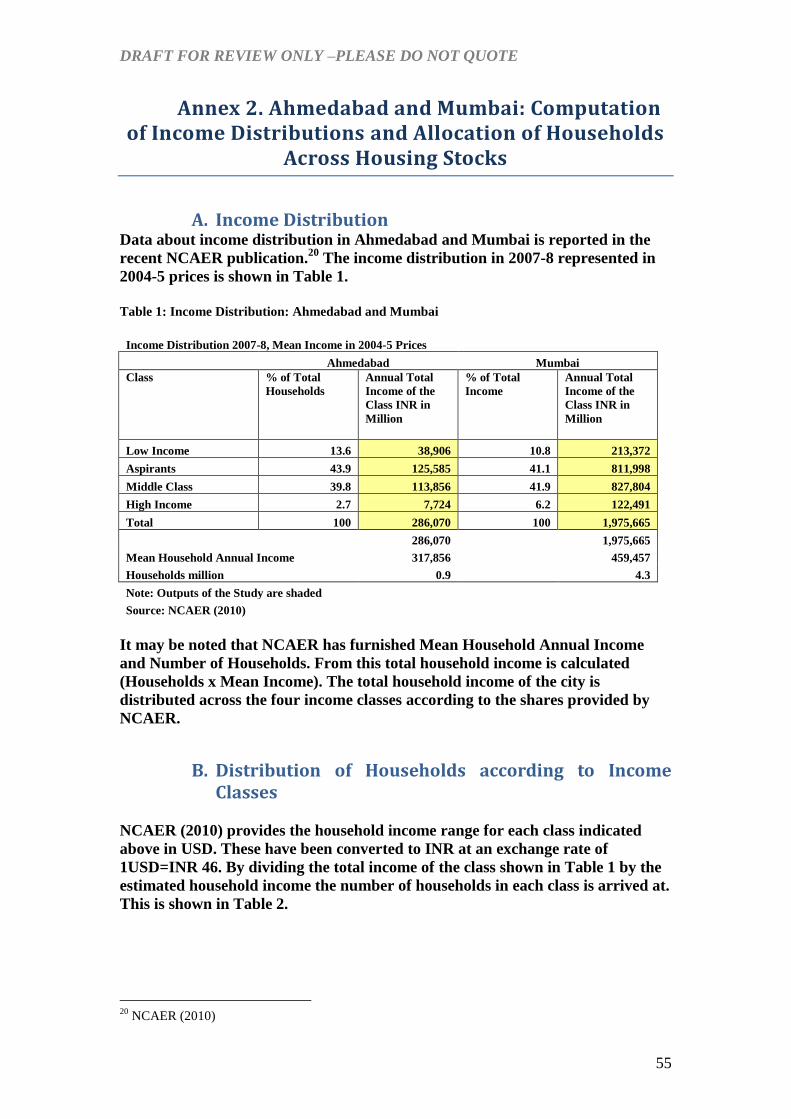
A. Income Distribution Data about income distribution in Ahmedabad and Mumbai is reported in the
recent NCAER publication.20
The income distribution in 2007-8 represented in
2004-5 prices is shown in Table 1.
Table 1: Income Distribution: Ahmedabad and Mumbai
Income Distribution 2007-8, Mean Income in 2004-5 Prices
Ahmedabad Mumbai
Class % of Total
Households
Annual Total
Income of the
Class INR in
Million
% of Total
Income
Annual Total
Income of the
Class INR in
Million
Low Income 13.6 38,906 10.8 213,372
Aspirants 43.9 125,585 41.1 811,998
Middle Class 39.8 113,856 41.9 827,804
High Income 2.7 7,724 6.2 122,491
Total 100 286,070 100 1,975,665
286,070 1,975,665
Mean Household Annual Income 317,856 459,457
Households million 0.9 4.3
Note: Outputs of the Study are shaded
Source: NCAER (2010)
It may be noted that NCAER has furnished Mean Household Annual Income
and Number of Households. From this total household income is calculated
(Households x Mean Income). The total household income of the city is
distributed across the four income classes according to the shares provided by
NCAER.
B. Distribution of Households according to Income Classes
NCAER (2010) provides the household income range for each class indicated
above in USD. These have been converted to INR at an exchange rate of
1USD=INR 46. By dividing the total income of the class shown in Table 1 by the
estimated household income the number of households in each class is arrived at.
This is shown in Table 2.
20
NCAER (2010)
DRAFT FOR REVIEW ONLY –PLEASE DO NOT QUOTE
56
Table 2: Distribution of Households by Income Classes
It may be clarified that since the mean income in the above table is calculated at
the top end of the income bracket it is deliberately allowed to be higher than that
shown in Table 1. This has enabled household income distribution at finer and
uniform income intervals of INR 2500 to result in final mean income (after some
iterations) to be in tune with that shown in Table 1.
C. Distribution of Households in Finer Income Classes
The above household distribution in broad income classes has been translated
into distribution across finer income classes. The distribution of households in
finer income classes for the Ahmedabad and Mumbai is depicted in Graphs in
the text. Although the household distribution has been worked out for income
ranging from INR 2500 to INR 300,000 the graphs show incomes from INR 2500
to INR 120,000. These account for 97% and 95% of the household in
Ahmedabad and Mumbai respectively.
DRAFT FOR REVIEW ONLY –PLEASE DO NOT QUOTE
57
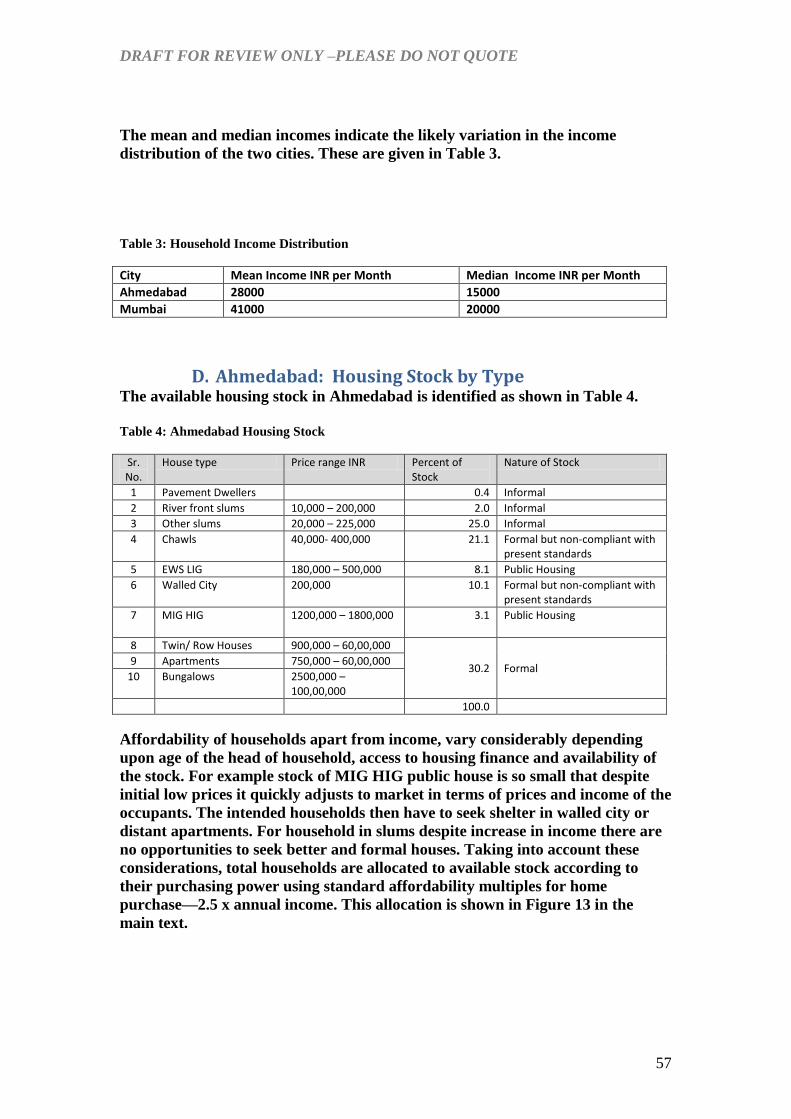
The mean and median incomes indicate the likely variation in the income
distribution of the two cities. These are given in Table 3.
Table 3: Household Income Distribution
City Mean Income INR per Month Median Income INR per Month
Ahmedabad 28000 15000
Mumbai 41000 20000
D. Ahmedabad: Housing Stock by Type The available housing stock in Ahmedabad is identified as shown in Table 4.
Table 4: Ahmedabad Housing Stock
Sr. No.
House type Price range INR Percent of Stock
Nature of Stock
1 Pavement Dwellers 0.4 Informal
2 River front slums 10,000 – 200,000 2.0 Informal
3 Other slums 20,000 – 225,000 25.0 Informal
4 Chawls 40,000- 400,000 21.1
Formal but non-compliant with present standards
5 EWS LIG 180,000 – 500,000 8.1 Public Housing
6 Walled City 200,000 10.1 Formal but non-compliant with present standards
7 MIG HIG
1200,000 – 1800,000 3.1 Public Housing
8 Twin/ Row Houses 900,000 – 60,00,000
30.2 Formal 9 Apartments 750,000 – 60,00,000
10 Bungalows 2500,000 – 100,00,000
100.0
Affordability of households apart from income, vary considerably depending
upon age of the head of household, access to housing finance and availability of
the stock. For example stock of MIG HIG public house is so small that despite
initial low prices it quickly adjusts to market in terms of prices and income of the
occupants. The intended households then have to seek shelter in walled city or
distant apartments. For household in slums despite increase in income there are
no opportunities to seek better and formal houses. Taking into account these
considerations, total households are allocated to available stock according to
their purchasing power using standard affordability multiples for home
purchase—2.5 x annual income. This allocation is shown in Figure 13 in the
main text.
DRAFT FOR REVIEW ONLY –PLEASE DO NOT QUOTE
58
E. Mumbai: Housing Stock by Type Following methodology similar to that of Ahmedabad Mumbai‘s housing stock is
categorized as shown in Table 5.
Table 5: Mumbai Housing Stock
Sr. No.
House type Price range INR Percent of Stock Nature of Stock
1 Pavement Dwellers 300,000 – 23,50,000
3 Informal
3 Slums 45 Informal
4 Chawls
20,00,000 – 40,00,000
15
Formal but non-compliant with present standards
5 Slum Rehabilitation 2 Formal initially free to slum dwellers