With a special focus on Rwanda’s pathway out of poverty Maintaining Momentum May 2013 | Edion No. 4 Working for a World Free of Poverty Public Disclosure Authorized Public Disclosure Authorized Public Disclosure Authorized Public Disclosure Authorized Public Disclosure Authorized Public Disclosure Authorized Public Disclosure Authorized Public Disclosure Authorized
Transcript
With a special focus on Rwanda’s pathway out of povertyMaintaining Momentum
May 2013 | Edition No. 4
Working for a World Free of Poverty
Pub
lic D
iscl
osur
e A
utho
rized
Pub
lic D
iscl
osur
e A
utho
rized
Pub
lic D
iscl
osur
e A
utho
rized
Pub
lic D
iscl
osur
e A
utho
rized
Pub
lic D
iscl
osur
e A
utho
rized
Pub
lic D
iscl
osur
e A
utho
rized
Pub
lic D
iscl
osur
e A
utho
rized
Pub
lic D
iscl
osur
e A
utho
rized
wb452162
Typewritten Text
78229
With a special focus on Rwanda’s pathway out of povertyMaintaining Momentum
Rwanda Economic Update
TABLE OF CONTENTS
ABBREVIATIONS AND ACRONYMS iPREAMBLE iiEXECUTIVE SUMMARY iiiI. RECENT ECONOMIC DEVELOPMENTS 1 1.1. Rwanda’s Economy — Resilience in the face of uncertainty 2 1.2. Inflation — Declining, but risks remain as import prices rise 8 1.3. External Position — A growing export base, but highly dependent on aid 9 1.4. Monetary Policy, the Exchange Rate — Ongoing reforms, conflicting pressures 14 1.5. Fiscal Policy — Strong performance in spite of enormous challenges 17 1.6. Economic Outlook and Risks 22 1.6.1. The Global Outlook — Gathering momentum? 22 1.6.2. Rwanda’s Outlook — Positive but highly uncertain 23 1.6.3. Risk Scenario — How a large “aid shock” would affect the Rwandan economy 25
II. FOCUS SECTION: RWANDA’S PATHWAY OUT OF POVERTY 29 2.1. Introduction 30 2.2. A Decade of Growth and Poverty Reduction 31 2.2.1. Strong Household Consumption growth and Poverty Reduction 31 2.2.2. Absolute Gains for Everyone, but Largest for the Very poor and the Very Rich 33 2.2.3. A Small Decrease in Inequality and a Relative Loss for the Middle Class in Kigali 36 2.2.4. Poverty Still High, Though Depth and Severity are Decreasing 38 2.3. Different Patterns in Both Parts of the Decade 38 2.3.1. 2001-2006: Weak Poverty Reduction despite Growth 39 2.3.2. 2006-2011: Strong Growth, Decreasing Inequality and Impressive Poverty Reduction 40 2.4. The Drivers of Consumption Growth and Poverty Reduction 41
2.4.1. Key Evolutions during the Previous Decade 42 2.4.2. What Explains the Growth in Household Consumption in Rwanda? 46 2.5. Poverty Reduction in Rwanda: The Way Forward 50
ANNEXES 53 REFERENCES 70
LIST OF FIGURES
Figure 1: Agriculture Accounted for the Bulk of National Poverty Reduction viFigure 2: Rwanda’s growth remained solid in 2012… 2Figure 3: …and continued to outpace EAC peers 2Figure 4: Prices of Rwanda’s Major Export products were among the volatile prices 3Figure 5: Rwanda’s recent growth has been resilient amidst a weaker global environment 3Figure 6: The services sector has regained its role as the key driver of growth in 2012… 4Figure 7: …with private sector services, especially trade, transport and communications, 4 driving services growth Figure 8: Mobile Phone Penetration in Rwanda 5Figure 9: The ICT sector was the main destination of FDI 5Figure 10: After the very strong growth of 2011, construction activity slowed in 2012, 6 reducing overall growth in the industrial sector
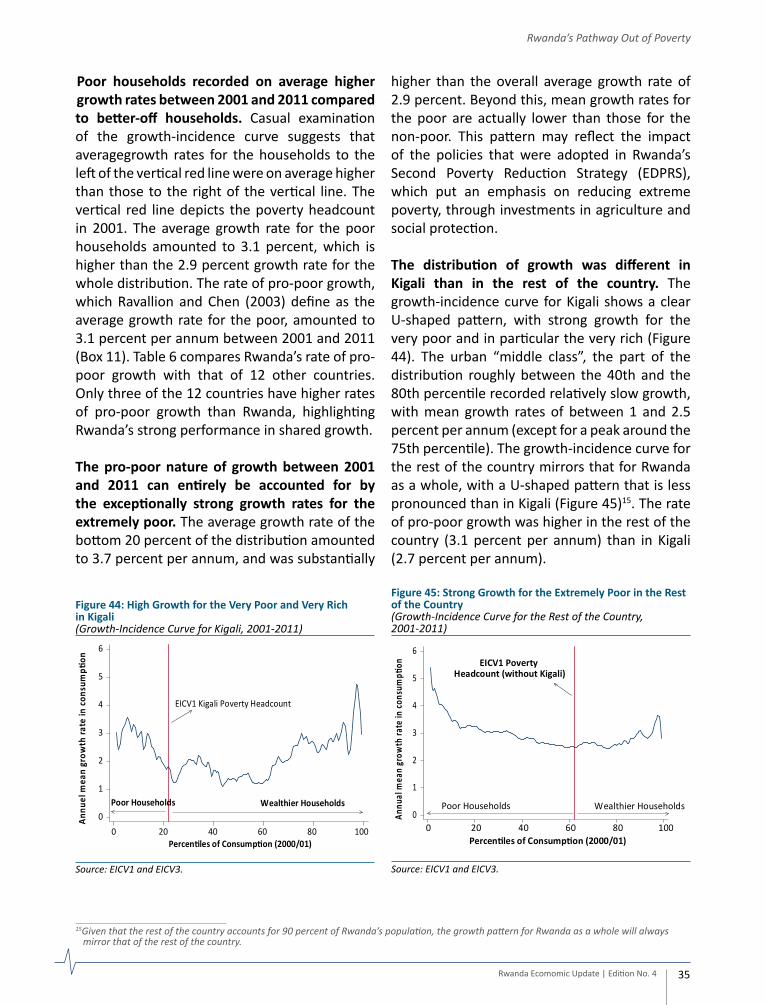
Figure 11: Rwanda’s banking sector has recorded a strong performance 7Figure 12: Financial inclusion in Rwanda has improved significantly in recent years 7Figure 13: Agricultural growth continued its downward trend 8Figure 14: Inflation eased off in the second half of 2012… 9Figure 15: Rwanda’s inflation is low compared to other EAC countries, but higher than 9 the SSA average Figure 16: Imports growth accelerated in 2012, driven by strong growth in capital and 10 raw materials… Figure 17: …and this increase in imports is widening Rwanda’s trade deficit 10Figure 18: High growth in non-traditional sectors suggests a potential diversification of 11 Rwanda’s narrow export base Figure 19: Rwanda’s main exports did not have a good year in 2012 11Figure 20: Foreign aid inflows fell dramatically and as a result the Balance of Payments 13 turned negative in 2012 Figure 21: …which have been the main source of foreign exchange reserves 13Figure 22: Central Banks across the EAC moved into an expansionary phase in 2012, 16 while the BNR held its policy rate unchanged Figure 23: The Rwf depreciation gathered pace in H2 2012 as delays in aid disbursement lengthened 16Figure 24: The real exchange rate depreciated, though slightly as Rwanda’s inflation was 16 lower than key trading partners Figure 25: Rwanda’s tax collection remains among the lowest in SSA… 18Figure 26: …with donor funding making up for the shortfall 18Figure 27: Aid flows for Rwanda has increased substantially 19Figure 28: The main disbursement channel of aid to Rwanda is now through the public budget 19Figure 29: Social spending comprises the majority of ODA-financed activities 20Figure 30: Aid flows constitute a major source of financing of public expenditures in Rwanda 20Figure 31: Growth across Rwanda’s Major Trading Partners is expected to rise modestly 22 in 2013 and 2014 Figure 32: Global commodity prices are expected to track global growth, with prices 22 relatively flat through 2013, before increasing modestly in 2014 Figure 33: However, Rwanda is still projected to outperform regional peers and the 23 sub-Saharan average in 2013 and 2014 Figure 34: Transmission Mechanisms of a Reduction in Aid to the Rwandan Economy 25Figure 35: The current account will remain at around historic highs under each scenario… 26Figure 36: …with GDP growth slowing to the lowest rate since 2007 under the worse-case scenario 26Figure 37: An aid shortfall of 50 percent in budget support in FY2012/13 could hold back poverty 28 reduction by 1.4 percentage points by 2013 Figure 38: This would imply that approximately 150,000 people in Rwanda will not be able 28 to escape poverty by 2013 relative to a situation in which the aid shortfall would not have taken place Figure 39: An Aid Shortfall Could Significantly Delay the Attainment of Universal Primary Education 28Figure 40: The Percentage of people Below the Poverty Line Sharply Decreased 33Figure 41: Though the Absolute Number of People in Poverty Declined only Marginally due to 33 Population Growth Figure 42: The Poor Grew Faster than the Non-Poor Between 2001 and 2011 33Figure 43: Only Two Regions Experienced a Drop in the Number of Poor 34Figure 44: High Growth for the Very Poor and Very Rich in Kigali 35Figure 45: Strong Growth for the Extremely Poor in the Rest of the Country 35Figure 46: The Consumption Share of the Poorest 10% and 20% Increased Between 2001 and 2011 36
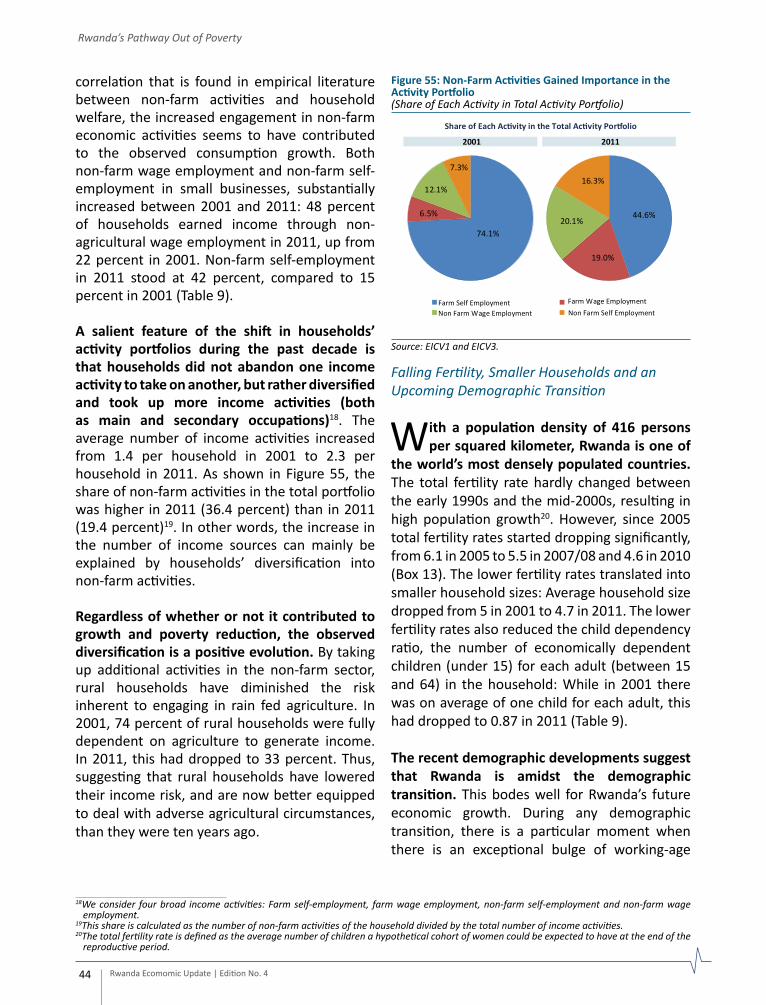
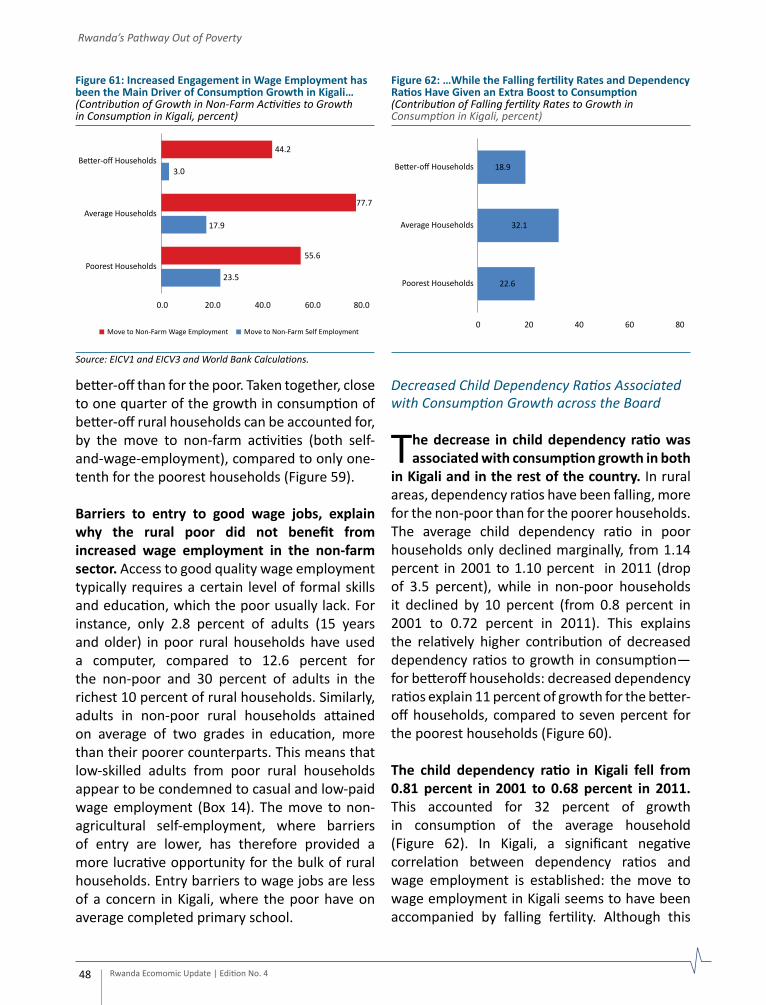
Figure 47: Falling Consumption Shares of the Wealthiest Groups and of the Kigali Middle Class 37Figure 48: Decrease in Inequality, Particularly Among the Poor 37Figure 49: The Poor Have Moved Closer the Poverty Line between 2001 and 2011 38Figure 50: The Non-Poor Grew Faster than the Poor between 2001 and 2006… 39Figure 51: While the Poor Grew Faster than the Non-Poor between 2006 and 2011 39Figure 52: The Consumption of the Poor Moved closer to the Poverty Line Between 2001 and 2006 40Figure 53: Production of Cereals, Pulses and Roots and Tubers Increased Substantially over 42 the Past Decade Figure 54: Agricultural Yields Increased Sharply over the Past Five Years 43Figure 55: Non-Farm Activities Gained Importance in the Activity Portfolio 44Figure 56: Rwanda is Entering the Demographic Transition 45Figure 57: Agriculture is the main driver of consumption growth in rural areas; in Kigali 46 it is the move to wage employment Figure 58: The Growth in the Agriculture Sector has Significantly Contributed to the Rise 47 in Consumption in Both Poor and Richer Households Figure 59: Diversification into Non-farm Self-Employment has Been More Important than Wage 47 Employment, Especially for the Rural Poor Figure 60: Decreased Dependency Ratios Spurred by Falling Fertility Rates also Contributed 47 Significantly to Consumption growth Figure 61: Increased Engagement in Wage Employment has been the Main Driver of 48 Consumption Growth in Kigali… Figure 62: …While the Falling fertility Rates and Dependency Ratios Have Given an Extra 48 Boost to Consumption Figure 63: A Substantial Number of Wage Jobs Were Created between 2001 and 2011 49Figure 64: Agriculture Accounted for the Bulk of National Poverty Reduction 50
LIST OF TABLES
Table 1: Foreign inflows to Rwanda are dominated by donor inflows, while exports and 12 private sector financial flows remain relatively small Table 2: Foreign assistance inflows have dramatically declined since mid-2012 17Table 3: Government Operations, 2009/10 – 2012/13 21Table 4: The reduction in aid flows is projected to slow down growth in 2013 before a partial 24 recovery in 2014 Table 5: Solid Household Consumption Growth and Poverty Reduction Between 2001 and 2011 32Table 6: Growth in Rwanda was Pro-Poor but Poverty was relatively Inelastic to Growth 32Table 7: The Number of People in Poverty Decreased in the Regions With Below 34 Average Population Growth Table 8: The Boom in Agricultural Production Happened in the Last Five years 42Table 9: Significant Changes in Household Consumption, Income Activities, and Human Capital during the Past Decade 43Table 10: Changes in Women’s Education and Behaviors are Driving Down Fertility 45
Annex 6: Rwanda Exchange rate (Rwf/US$) 60Annex 7: Food crop production trends in Rwanda, 2007-2012 61Annex 8: Rwanda – Gross Reserves 63Annex 9: Different Patterns of Growth and Poverty Reduction in Both Halves of the Decade 64Annex 10: Summary Tables of Descriptive Statistics by Welfare Groups 65Annex 11: Statistical Decomposition Methods and Results 67
LIST OF BOXESBox 1: Understanding Aid Dependency iv How the shortfall in aid can affect the Rwandan economyBox 2: Weakened, with a cloudy outlook 3 Recent development in the Global EconomyBox 3: Getting Connected 5 Rwanda’s communications revolutionBox 4: Making the Money Flow 7 Recent financial sector developments in RwandaBox 5: With a Little Help From My Friends 12 How foreign aid enters the Rwandan economyBox 6: Planning for the Future 18 Rwanda’s AGACIRO Development FundBox 7: What’s in Your Wallet? 19 Using aid flows to create fiscal space for public investmentBox 8: Progress, Interrupted? 27 Estimated social and poverty impacts of an aid shortfall to RwandaBox 9: The Cost of Basic Needs 32 Rwanda’s Poverty LineBox 10: Relatively Better than Absolute 34 Absolute Number of Poor Fell Only Slightly Due to High Population GrowthBox 11: Sharing is Caring 36 The Definition of Pro-Poor GrowthBox 12: Kigali’s Missing Middle 37 A Falling Consumption Share for the Middle Class in KigaliBox 13: Multiplying a Lot Less 45 Determinants of Fertility are Moving in the Right DirectionBox 14: A Hard Day’s Work Multiplying a Lot Less 49 Wage Employment Has Not paid Off for the Poor
Rwanda Ecomomic Update | Edition No. 4 i
AfDB African Development BankAgDF Agaciro Development FundATMs Automated Teller MachinesBNR Banque Nationale du RwandaBoP Balance of Payments CAADP Comprehensive African Agricultural Development ProgramsCIP Crop Intensification ProgramDEC Development EconomicsDHS Demographic and Health SurveysDRC Democratic Republic of CongoEAC East African CommunityEC European CommissionEDPRS Economic Development and Poverty Reduction Strategy EICV Enquête Intégrale des Condition de Vie des ménagesFDI Foreign Direct InvestmentFSC Financial Stability CommitteeFY Fiscal YearGDP Gross Domestic ProductGoR Government of RwandaHa Hectare HIPC Highly Indebted Poor Countries ICT Information and Communication Technologies KCC Kigali Convention CenterKg Kilogram L-T-D Loan to DepositLWH Land Husbandry, Water Harvesting and Hillside IrrigationMBD Major bilateral MINECOFIN Ministry of Finance and Economic PlanningMPC Monetary Policy Committee MTD Major Trading PartnersNISR National Institute of Statistics of RwandaNPL Non-Performing LoansODA Official Development LoansOECD Organization for Economic Cooperation and DevelopmentPEFA Public expenditure Framework Assessment PPP Purchasing Power ParityPRSP Poverty Reduction Strategy PaperREU Rwanda Economic UpdateRSSB Rwanda Social Security BoardRwf Rwandan FrancSACCOs Saving and Credit CooperativesSMS Short Message ServiceSSA Sub-Saharan AfricaSSFR Social Security Fund of RwandaUK United KingdomUN United NationsUS United States
ABBREVIATIONS AND ACRONYMS
Rwanda Ecomomic Update | Edition No. 4 ii
The Rwanda Economic Update reports and synthesizes recent economic developments and places them in a medium term and global context. It analyzes the implications of these developments
and policies for the outlook of Rwanda’s economy. In this way, these reports contribute to the implementation of the Bank’s Africa Strategy. The Economic Update reports cover in each edition a special feature on a selected topic. It is intended for a wide audience, including policy makers, business leaders and other market participants, and the community of analysts, engaged in Rwanda’s economy.
The fourth edition of Rwanda Economic Update was prepared by the Poverty Reduction and Economic Management team at the World Bank Country Office in Rwanda. The team was led by Marco Antonio Hernandez (Country Economist). Tom Bundervoet (Poverty Economist) led the Focus Section on Rwanda’s Pathway out of Poverty. Peace Aimee Niyibizi (Economist) led the analysis of recent economic developments. The team was supported by David Stephan, Andrew Blackman, and Roger Sullivan. Wolfgang Fengler (Lead Economist) supervised the team. Johannes Zutt (Country Director), Carolyn Turk (Country Manager), Pablo Fajnzylber (Sector Manager), and Paolo B. Zacchia (Acting Sector Manager) provided overall guidance.
The findings, interpretations, and conclusions expressed herein are those of the authors, and do not necessarily reflect the views of the World Bank’s Board of Executive Directors or the countries they represent. The World Bank does not guarantee the accuracy of the data included in this report, nor does it endorse the boundaries, colors, denominations, and other information shown on any map in this report.
For more information about the World Bank and its activities in Rwanda, please visit: www.worldbank.org/rw. If you would like to be included in the email distribution list of this semi-annual series and related publications, please contact [email protected].
For questions and comments related to this publication, please contact Marco Antonio Hernandez at [email protected].
PREAMBLE
Rwanda’s economy is estimated to have grown by a robust 8 percent in 2012, continuing a
decade-long period of strong economic growth. The economic expansion was driven by buoyant private sector activity, particularly in the services sector—where growth exceeded expectations. This strong economic performance has allowed Rwanda to claim for the third year in a row, the title of the fastest growing economy in the East African Community.
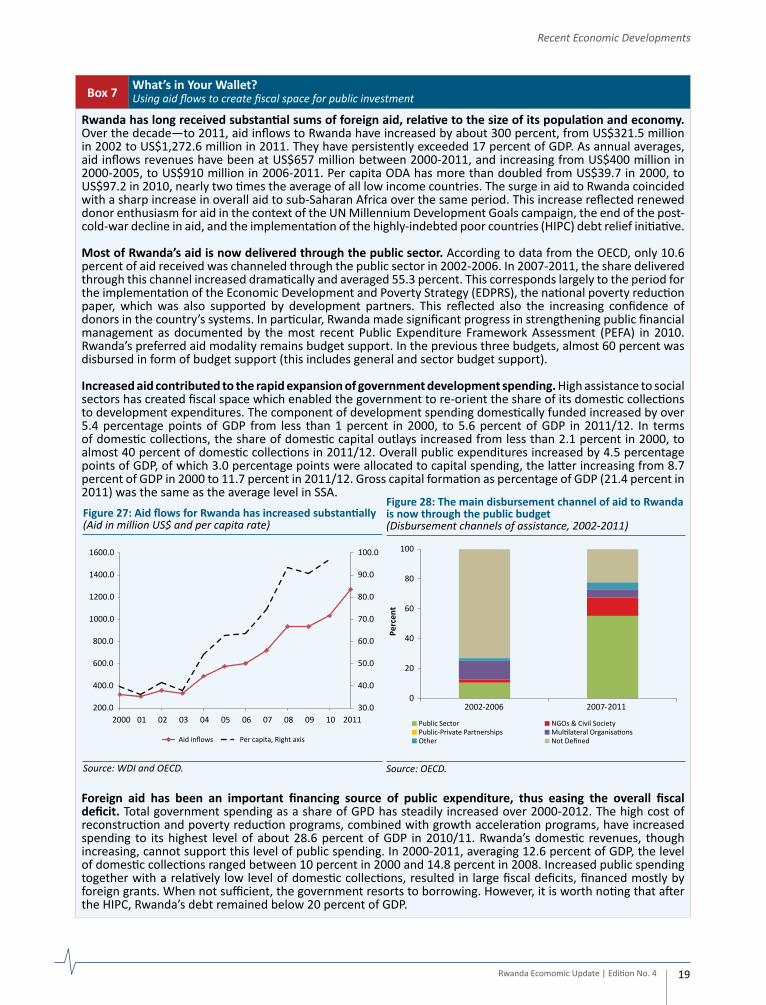
The domestic economy remained strong despite an estimated 20 percent reduction in Official Donor Assistance (ODA) in 2012, following the intensifying of the conflict in Eastern Congo.1 ODA represents a significant source of government financing and foreign exchange, equivalent to around 12 percent of GDP and over 40 percent of public expenditures. In the current fiscal year, the Government was expecting around US$400 million of donor budget support, as noted in its original budget. The Government revised its budget in March 2013, which projects budget support at US$311 million, about 80 percent of what had been expected in the original budget. This reduction in aid is creating challenges for the Government to maintain its economic growth and poverty reduction momentum.
The Government has so far been able to offset the aid reduction, through drawing down foreign reserves and increasing domestic borrowing. This enabled non-discretionary spending for wages, interest payments, social expenditures and transfers to continue. The government also reprioritized spending, and maintained prudent
monetary policy, aimed at curtailing inflationary pressures. The private sector, especially transport and telecommunications, performed strongly, taking up much of the slack created by reduced public expenditures. In spite of what could have been a significant blow, so far, the economic impacts of the aid shortfall have been relatively muted.
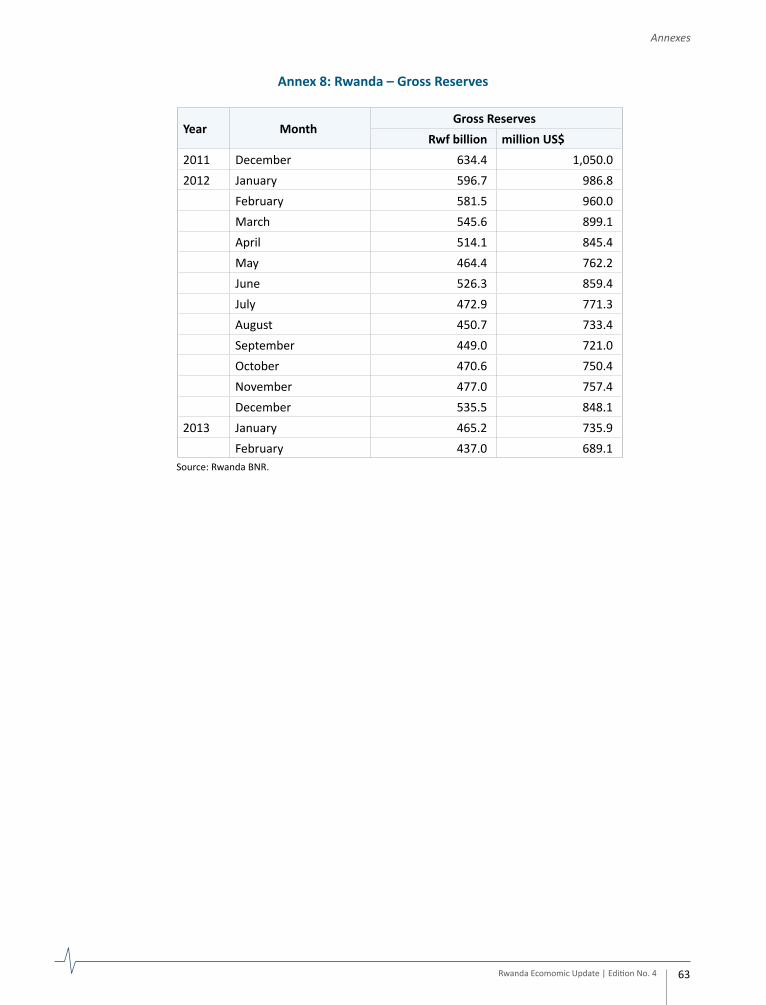
While Rwanda’s macroeconomic response has been effective, so far, in stabilizing the economy, the Government cannot indefinitely drawdown foreign reserves and increase domestic borrowing. These policies have already driven up interest rates and led to a depreciation in the currency. Rwanda thus entered 2013 with a smaller buffer of foreign reserves (covering around 3.2 months of imports as of February 2013) in comparison to the situation a year ago (about 5 months of imports).
Because Rwanda remains highly reliant on official development aid, its projected growth is correlated with the level of external aid flows. Simulation analysis projects that in a scenario in which the level of budget support is 50 percent below the expected level in the original budget for the current fiscal year, GDP growth in 2013 would be over 1.5 percentage points, lower than in a scenario without a shortfall in aid. This slower growth rate would be a substantial setback in Rwanda’s journey towards the ambitious poverty targets set in the Government’s forthcoming Economic Development and Poverty Reduction Strategy, the EDPRS II, and its ‘Vision 2020’ policy framework.
EXECUTIVE SUMMARY
Rwanda Ecomomic Update | Edition No. 4 iii
1 The United Nations issued a report in mid-2012 on activities in the neighboring Republic of the Congo by groups that were allegedly back by the Government of Rwanda. Although the Government of Rwanda strongly denied the report’s findings, several donors suspended or reduced their ODA.
Rwanda Ecomomic Update | Edition No. 4 iv
Executive Summary
Strong Growth despite Weaknesses in some Critical Sectors, but Rising Risks
Growth in 2012 was fuelled by the services sector, which registered double
digit growth, while the performance of the agriculture sector was modest. Trade, transport and telecommunications services were the main drivers of growth in the services sector, generating about 40 percent of the growth in real GDP in 2012. Continued execution of most planned government expenditures has helped to maintain momentum in service sectors, such as communications and finance. Growth in the industrial sector slowed due to a decline in tin production, and increased electricity prices. Meanwhile, agriculture, a central part of the Rwandan economy contributing about 13 percent to GDP growth in 2012, recorded modest growth of 3 percent. Adverse weather conditions were the primary cause of a lower producing-than-expected food harvest.
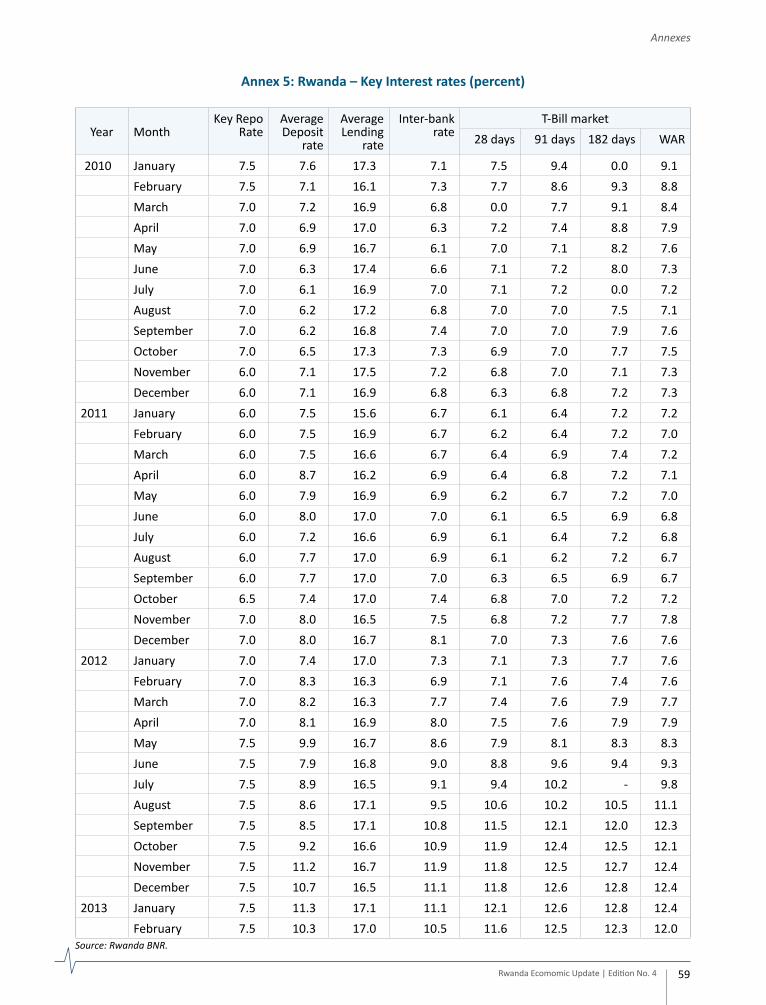
Inflation declined throughout the second half of 2012, reflecting lower growth in import prices and prudent monetary policies. Lower international energy prices and a moderation in food prices as well as the Central Bank’s tighter monetary policies, have supported declining inflation; between October 2011 and May 2012, the BNR increased its policy rate from 6.0 percent to 7.5 percent. However, inflationary pressures
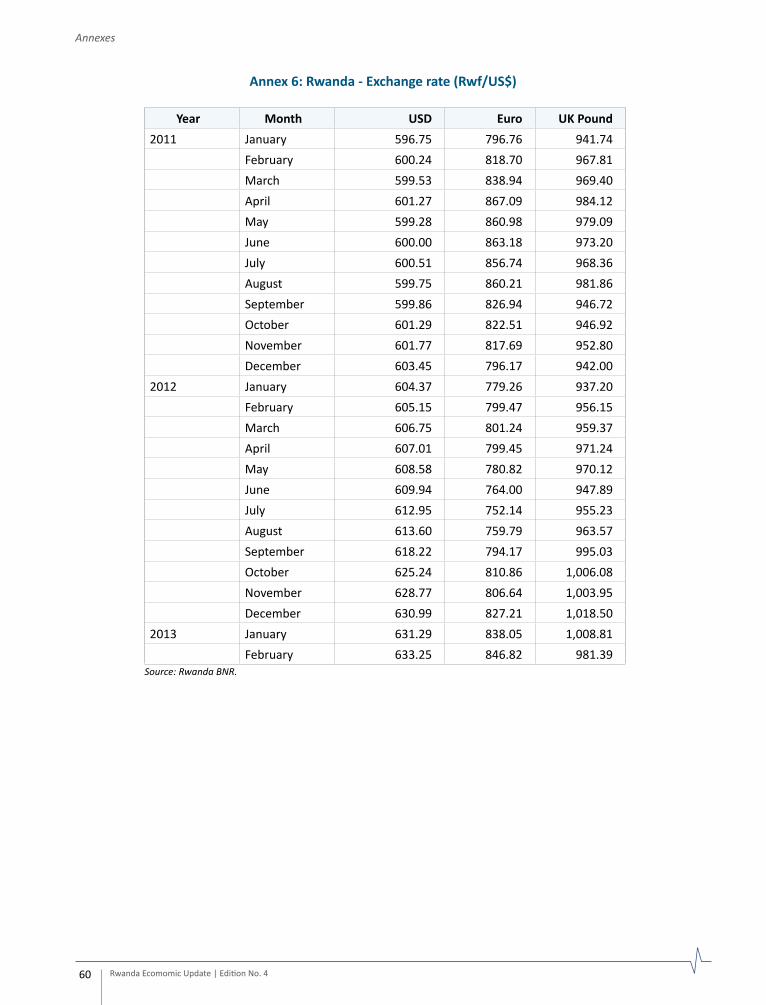
remain. While the headline rate remains low, at 3.9 percent in December 2012, the depreciation of the currency—which fell by 3 percent in the second half of 2012—is beginning to put upward pressure on import prices, which rose in October 2012, after falling for 14 consecutive months.
Rwanda’s current account deficit is projected to have reached a record 11.4 percent of GDP in 2012, reflecting the significant impact of the shortfall of aid, and the imbalance of imports and exports. The reduction in aid flows, which account for most foreign inflows, has widened the current account deficit. Import levels have remained high, reflecting robust activity in the private sector. Exports have also grown recently, especially non-traditional export products, helping to diversify Rwanda’s exports beyond its traditional products, namely minerals, coffee and tea. However, this has not been enough to offset the growth of imports, and the trade deficit has widened. The widening of the current account deficit pushed the Balance of Payments into deficit for the first time since 2003, reducing international reserves by almost 20 percent during 2012.
The execution of the budget has remained high despite the difficulties created by aid shortfalls. The government covered some of the aid shortfall through domestic borrowing, and most importantly, was able to execute 90.4
Lower aid inflows can reduce economic growth through a series of direct and indirect transmission channels. The main impact on activity would come from a reduction in public expenditure in response to lower budget revenues, with the government reducing investment spending and consumption of goods and services. As the biggest single employer, cuts to government operations could also reduce employment. These factors would have spillover effects to the private sector through lower incomes, slowing overall economic activity and employment. Lower aid inflows would decrease foreign currency liquidity, and would likely lead to a further depreciation of the exchange rate and increased borrowing costs. These factors could push up the cost of imported inputs, constrain the private sector’s ability to invest, and reduce access to foreign-currency working capital for importers and exporters. Overall, these effects would likely lead to larger budget and current account deficits, put upward pressure on inflation, and eventually slow down investment and growth.
Lower aid inflows can also have significant consequences for the poor in Rwanda. In addition to its macroeconomic impact, a reduction in donor funding has the potential to significantly slow the progress Rwanda has made over the last decade in reducing poverty and improving the living conditions of its citizens. A close link between government spending funded by ODA and poverty reduction, highlights the vulnerability of Rwanda’s development achievements to a sudden reduction in foreign aid.
Box 1 Understanding Aid DependencyHow the shortfall in aid can affect the Rwandan economy
Source: World Bank staff.
percent of its original budget for the first half of the fiscal year 2012/13 (July to December 2012). The Government prioritized spending on non-discretionary items such as wages and social spending; the pace of other expenditures resumed towards the end of 2012, after the government increased its borrowing. However, some externally-funded capital expenditures were delayed. Improvements in tax administration including higher non-tax revenue collection, receipts from the UN peacekeeping operations, and the strength of the private sector, helped to increase domestic tax collections, which in turn helped to ease the financing constraints created by the aid shortfall.
The outlook for Rwanda’s economy remains broadly positive, with growth, projected at 7.0 percent in 20132 and 7.5 percent in 2014. The positive economic outlook is contingent on continued strong economic management by the government, along with external borrowing to offset lower ODA inflows compared to previous fiscal years. If the aid shortfall were to reverse, increased government expenditure and increased foreign currency inflows could spur even faster economic growth.
Rwanda’s medium-term social and economic outlook remains positive, but the economy will need to strengthen its resilience, given the uncertainty over future external financial flows. Rwanda’s quick reaction to the 20 percent decline, year-on-year, in ODA in 2012 has maintained the economy on a steady keel. However, the short term measures that included a drawdown of foreign reserves and domestic borrowing, are not a long term solution to declining ODA levels. Rwanda has available a number of options that can bolster its resilience to diminishing aid flows and other external shocks. They include accelerating efforts to expand the domestic tax base and the export
base further, and strengthening the financial system’s ability to mobilize savings and spur private sector investment. In addition to the growing service sector, agriculture is another area where Rwanda has substantial capacity to build on current success, and continue expanding productivity and job creation, including in off-farm activities.
Besides resilience, becoming more competitive will enable Rwanda to reduce its aid dependency over the medium-term. One of the most effective strategies for improving competitiveness is to invest in upgrading the skills of the labor force. Given the expected growth in the telecommunications and services sector, specific training programs in these areas could have strong economic benefits. Improving the supply of skilled labor, along with regulatory reform in the financial sector, could help attract foreign direct investment (FDI); another sign of a more competitive economy building on recent progress made in terms of the simplification of business regulations.3 FDI flows represent a vote of confidence in the country’s macroeconomic framework, and also helps to finance the current account deficit, without creating debt. Finally, as a small, high density, landlocked country, Rwanda has all the incentives to favor an aggressive regional integration process to exploit economies of scale and specialization.
Rwanda’s Decade of Poverty Reduction
Standards of living for all Rwandans improved significantly over the past decade, resulting
in rapid poverty reduction and decreased inequality. Household consumption per adult-equivalent grew at 2.5 percent per annum, and was stronger for the poor than for the non-poor, leading to decreased inequality and a 14 percentage point drop in the poverty headcount rate to 44.9 percent in 2011. In addition, the
Rwanda Ecomomic Update | Edition No. 4 v
Executive Summary
2 The Government projects a 7.5 percent growth in 2013.3 Rwanda has made progress in improving business regulation. TheWorld Bank Group’s 2013 Doing Business reports ranks Rwanda 52 out of the 185 economies. It also names Rwanda the number 2 improver globally and top improver in Sub-Saharan Africa since 2005 (see www.doingbusiness.org).
Rwanda Ecomomic Update | Edition No. 4 vi
Executive Summary
Government’s focus on eradicating extreme poverty was associated with particularly strong growth in consumption for those Rwandan’s living in extreme poverty (less than US$0.81 a day), with the incidence of extreme poverty falling by sixteen percentage points over the decade.
However, the patterns of growth and poverty reduction differed substantially between the first and second half of the decade. In the first half of the decade, consumption growth was concentrated in Kigali, where only a fraction of Rwanda’s poor live. The growth in rural areas was weaker and disproportionally benefited wealthier households. The result was a reduction in poverty of only two percentage points, and a sharp increase in inequality. In comparison, the experience in the second half of the decade was remarkable. Growth was stronger in rural areas than in Kigali, and benefited the poor much more than the non-poor. The net result was a 12 percentage point fall in the poverty headcount rate, and a significant decrease in inequality.
Higher agriculture productivity has been the main driver of growth and poverty reduction. Although the share of agriculture in GDP decreased significantly over the past decade, agriculture remains the backbone of the Rwandan economy, in terms of employment and income-generation for the majority of households. Driven by increased investments in agricultural inputs, land consolidation and infrastructure, agricultural production at household level, more than doubled during the past decade. Together with increased commercialization, reflected in the rising share of harvests sold on local markets, the increase in production accounted for about 45 percent of the reduction in poverty, observed over the last decade.
The move towards income-generating activities in the non-farm sector emerged as an important secondary driver of poverty reduction. During
the past ten years, the fraction of Rwandan households engaged in non-farm activities, in addition to agriculture which more than doubled. This is true for both self-employment and wage employment. As a result, the average number
of income sources of Rwandan households has increased sharply. The observed diversification had two positive effects. First, diversification has reduced income risk inherent to engaging in rain-fed agriculture, as households now have other income activities, to cushion a potential shock. Second, diversification also explains the rise in consumption among both the rural and urban poor. While taking up non-farm self-employment in small informal household businesses has been important for rural households, the move towards non-farm wage employment emerged as the single main driver of household consumption growth in Kigali. Taken together, the move to non-farm activities explains 16 percent of the overall reduction in poverty during the last ten years. At the national level, self-employment has been far more important for growth and poverty reduction, than wage employment.
Rwanda’s rapid poverty reduction is associated with the beginning of a demographic transition.
Figure 1: Agriculture Accounted for the Bulk of National Poverty Reduction(Contribution of the Various Factors to Poverty Reduction between 2001 and 2011, percent)
Increased Agricultural Production
35%
Increased Agricultural Commercialization
10%Decreased
Dependency Ratio 9%
Non-Farm Self Employment
13%
Non-Farm WageEmployment
3%
Other Factors andUnexplained Part
30%
Source: EICV1 and EICV3 and World Bank staff calculations.
Rwanda Ecomomic Update | Edition No. 4 vii
Executive Summary
Falling fertility rates have decreased the nation’s average family size and child dependency ratio, which have been associated with increased disposable incomes. The proportion of working-age adults in total population will increase over the coming decade, opening the door for a potential demographic dividend.
Although Rwanda’s performance in terms of shared growth and poverty reduction has been remarkable, several factors merit close attention. Despite the downward trend on a national level, inequality in Kigali increased over the past decade, due to sluggish growth of the ‘middle class’—defined as the share of the population between the 40th and 80th percentile of the income distribution—which resulted in a falling share of total consumption. Another concern is the stagnation in the number of people below the poverty line. Despite the large decrease in poverty headcount, the absolute number of people in poverty declined by only 1 percent, due to high population growth.
The transition from independent farming to other forms of employment has been a mixed success. While the transition to self-employment in small informal, non-farm businesses has been associated with welfare gains across the board, the observed move to wage employment has not helped the rural poor. While the proportion of poor rural households engaged in non-farm wage employment tripled over the past decade, this has not been associated with consumption gains. Factoring in the move to wage employment in the farm sector, the increased engagement in wage employment has been largely negative for the rural poor. Given their small landholdings and large household sizes, independent farming cannot absorb all labor available in poor rural households. Because of their low levels of education and skills, in most cases, the only alternative is unattractive wage labor in the informal rural economy.
Maintaining Momentum for the Decade Ahead
Further increases in agricultural productivity will likely be the main driver of poverty
reduction in the decade to come, especially if combined with increased business activity related to the boom in agriculture. Since virtually all of Rwanda’s poor depend on agriculture to generate income, scaling up agricultural intensification and commercialization will be the quickest way to get significant numbers of people out of poverty. Currently, the Government’s and development partners’ main agricultural programs cover only a small part of available land, which means that there is the opportunity to expand them, and significantly reduce poverty further. The scaling up of agricultural programs should be linked to the promotion and facilitation of business activities that can thrive on increased agricultural production, especially related to trade, post-harvest storage and processing activities.
Providing jobs to the two million people who will enter the workforce in the decade to come will be crucial to sustaining Rwanda’s achievements. The agriculture sector already suffers from high rates of underemployment, and will, given productivity increases, likely require less labor in the decade to come, meaning that agriculture will not be able to absorb the extra labor. Since less than 20 percent of working-age Rwandans will have completed secondary education by 2020, most of them will not qualify for modern wage jobs in the formal economy. This suggests that the bulk of job creation will have to come from informal businesses, in the non-farm (or agricultural processing) sector. Household businesses have been an important source of jobs in Rwanda over the past decade. Improving the business environment for these small firms, and establishing policies to facilitate their operation could potentially offer significant returns in terms of job creation, and future growth and poverty reduction.
Recent Economic DevelopmentsPART ONE
Rwanda Ecomomic Update | Edition No. 4 2
Rwanda’s economy grew by 8 percent in 2012, making it the strongest performer in the East African Community (EAC), and one of the fastest-growing economies in the world. Rwanda has followed
a course of prudent macroeconomic management (including the effective use of aid), pursuing sound fiscal and monetary policies, which have underpinned its strong economic performance, and increased its resilience during a period when the global economy has been turbulent. Nonetheless, risks rose significantly due to a shortfall of aid in the second half of 2012. The impact of this shortfall on the real economy has so far been muted because of swift and positive actions taken by the Government. Increased domestic borrowing has enabled the government to execute most of its budget, including social expenditures and wages. This has supported activity in the private sector, especially in the services sectors like communications and finance, with overall growth exceeding expectations. However, this growth has not been without cost, with the increase in public domestic borrowing, leading to a sharp increase in interest rates. Rising demand for imports and a shortage of foreign currency, have also led to the depreciation of the exchange rate.
The economic environment in Rwanda has changed significantly since mid-2012. In the
July 2012’s Rwanda Economic Update, the outlook for the Rwandan economy was positive with growth in the first half of 2012 close to 8.5 percent, and a lower than predicted budget deficit. However, following the publication of a UN report alleging that the Government supported a rebel group in the Democratic Republic of Congo (DRC), various donors have delayed or cancelled their planned aid to Rwanda. As a result, only 40 percent of expected budgetary grants for the first half of the fiscal year 2012/13—July to December 2012—have been disbursed.
In response to the aid shortfall, the Government of Rwanda (GoR) moved quickly to implement policies that have maintained robust growth in the economy. The government has financed some of the aid shortfall, through increased domestic borrowing. This has meant that the execution of non-discretionary spending such as wages and social expenditures has remained high. The maintenance of public spending has had positive spillovers to the private sector, especially services. Indeed, the Rwandan economy grew by 8.0 percent
in 2012, higher than the 7.4 percent growth rate projected in the July 2012 Rwanda Economic Update, prepared prior to the shortfall of aid.4
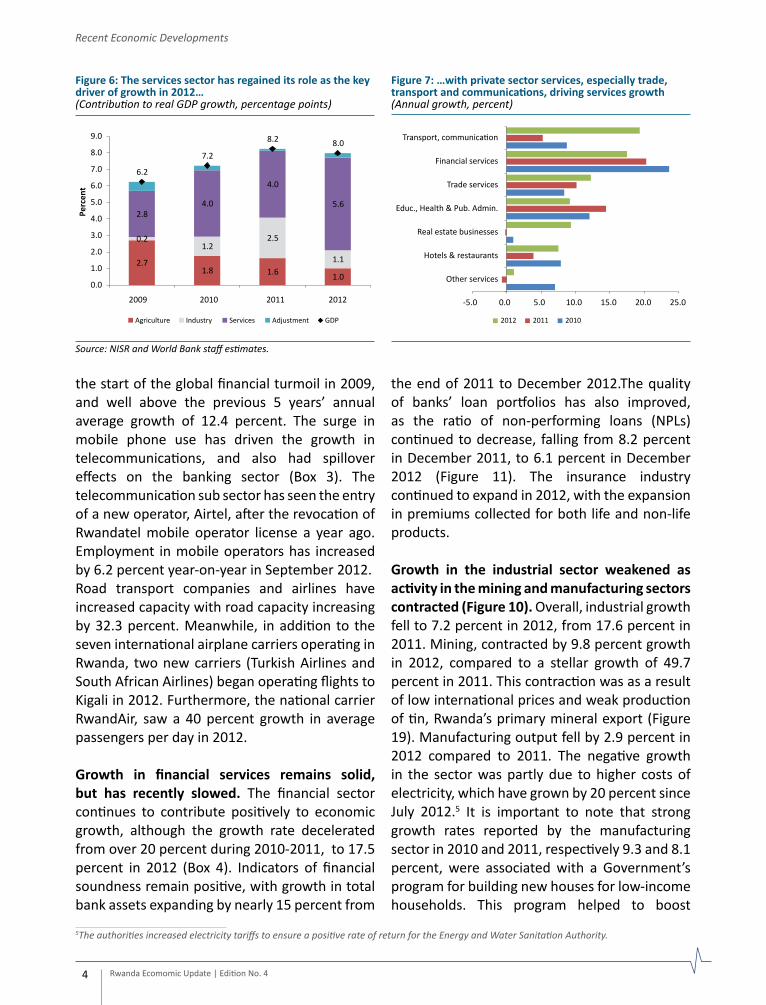
The service sector was the key driver of growth in 2012. In 2012, the sector expanded by 12.2 percent, year-on-year, compared to a rate of 8.9 percent in 2011 (Figure 2). This expansion was driven mainly by trade services and transport and communication activities. Service sectors are heavily influenced by income growth. The government’s ability to continue executing most budgeted expenditures has helped to maintain growth in services such as public administration, health and education. After 3.9 percent in 2011, hotels and restaurants grew by 7.5 percent, as the number of tourists to Rwanda increased by 18.5 percent from 2011 to reach over one million arrivals. The number of park visitors grew by 6.2 percent during the year.
The fastest growing services sub sector in 2012 was transport and communications. The sub sector grew by 19.3 percent year-on-year, in 2012, up strongly from 5.3 percent in 2011 (Figure 7). This is the highest growth rate since
Rwanda Ecomomic Update | Edition No. 4 2
Recent Economic Developments
1.1. Rwanda’s Economy — Resilience in the face of uncertainty
4It is important to note that the Government’s projection was 7.7 percent growth for 2012.
Figure 2: Rwanda’s growth remained solid in 2012…(Real GDP growth, percent, year-on-year)
6.2
7.2
8.2 8.0
2.0
4.0
6.0
8.0
10.0
Perc
ent
2009 2010 2011 2012
Source: National Statistics Office of Rwanda (NISR), and World Bank‘s Global Economic Prospects.
Figure 3: …and continued to outpace EAC peers(Real GDP growth, percent)
Perc
ent
8.0
6.86.5
4.3
2.0
4.0
6.0
8.0
10.0
Rwanda Uganda Tanzania Kenya
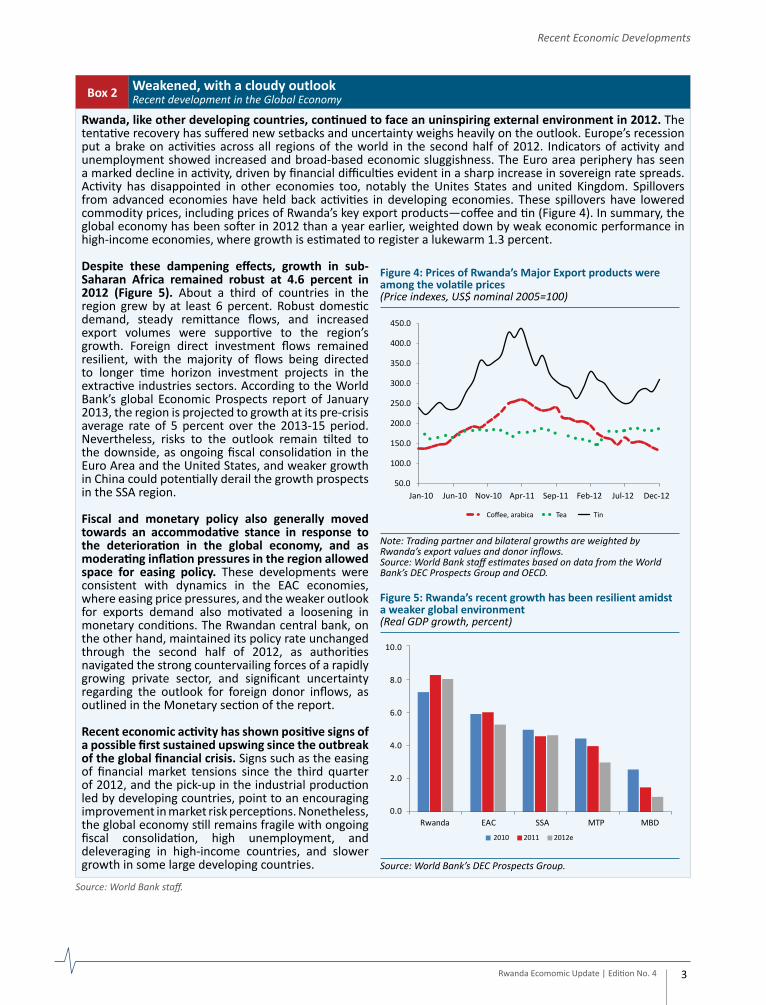
Rwanda, like other developing countries, continued to face an uninspiring external environment in 2012. The tentative recovery has suffered new setbacks and uncertainty weighs heavily on the outlook. Europe’s recession put a brake on activities across all regions of the world in the second half of 2012. Indicators of activity and unemployment showed increased and broad-based economic sluggishness. The Euro area periphery has seen a marked decline in activity, driven by financial difficulties evident in a sharp increase in sovereign rate spreads. Activity has disappointed in other economies too, notably the Unites States and united Kingdom. Spillovers from advanced economies have held back activities in developing economies. These spillovers have lowered commodity prices, including prices of Rwanda’s key export products―coffee and tin (Figure 4). In summary, the global economy has been softer in 2012 than a year earlier, weighted down by weak economic performance in high-income economies, where growth is estimated to register a lukewarm 1.3 percent.
Despite these dampening effects, growth in sub-Saharan Africa remained robust at 4.6 percent in 2012 (Figure 5). About a third of countries in the region grew by at least 6 percent. Robust domestic demand, steady remittance flows, and increased export volumes were supportive to the region’s growth. Foreign direct investment flows remained resilient, with the majority of flows being directed to longer time horizon investment projects in the extractive industries sectors. According to the World Bank’s global Economic Prospects report of January 2013, the region is projected to growth at its pre-crisis average rate of 5 percent over the 2013-15 period. Nevertheless, risks to the outlook remain tilted to the downside, as ongoing fiscal consolidation in the Euro Area and the United States, and weaker growth in China could potentially derail the growth prospects in the SSA region.
Fiscal and monetary policy also generally moved towards an accommodative stance in response to the deterioration in the global economy, and as moderating inflation pressures in the region allowed space for easing policy. These developments were consistent with dynamics in the EAC economies, where easing price pressures, and the weaker outlook for exports demand also motivated a loosening in monetary conditions. The Rwandan central bank, on the other hand, maintained its policy rate unchanged through the second half of 2012, as authorities navigated the strong countervailing forces of a rapidly growing private sector, and significant uncertainty regarding the outlook for foreign donor inflows, as outlined in the Monetary section of the report. Recent economic activity has shown positive signs of a possible first sustained upswing since the outbreak of the global financial crisis. Signs such as the easing of financial market tensions since the third quarter of 2012, and the pick-up in the industrial production led by developing countries, point to an encouraging improvement in market risk perceptions. Nonetheless, the global economy still remains fragile with ongoing fiscal consolidation, high unemployment, and deleveraging in high-income countries, and slower growth in some large developing countries.
Box 2 Weakened, with a cloudy outlook Recent development in the Global Economy
Source: World Bank staff.
Rwanda Ecomomic Update | Edition No. 4 3
Recent Economic Developments
Figure 5: Rwanda’s recent growth has been resilient amidsta weaker global environment(Real GDP growth, percent)
2010 2011 2012e
0.0
2.0
4.0
6.0
8.0
10.0
Rwanda EAC SSA MTP MBD
Source: World Bank’s DEC Prospects Group.
Figure 4: Prices of Rwanda’s Major Export products wereamong the volatile prices(Price indexes, US$ nominal 2005=100)
Note: Trading partner and bilateral growths are weighted by Rwanda’s export values and donor inflows.Source: World Bank staff estimates based on data from the World Bank’s DEC Prospects Group and OECD.
the start of the global financial turmoil in 2009, and well above the previous 5 years’ annual average growth of 12.4 percent. The surge in mobile phone use has driven the growth in telecommunications, and also had spillover effects on the banking sector (Box 3). The telecommunication sub sector has seen the entry of a new operator, Airtel, after the revocation of Rwandatel mobile operator license a year ago. Employment in mobile operators has increased by 6.2 percent year-on-year in September 2012. Road transport companies and airlines have increased capacity with road capacity increasing by 32.3 percent. Meanwhile, in addition to the seven international airplane carriers operating in Rwanda, two new carriers (Turkish Airlines and South African Airlines) began operating flights to Kigali in 2012. Furthermore, the national carrier RwandAir, saw a 40 percent growth in average passengers per day in 2012.
Growth in financial services remains solid, but has recently slowed. The financial sector continues to contribute positively to economic growth, although the growth rate decelerated from over 20 percent during 2010-2011, to 17.5 percent in 2012 (Box 4). Indicators of financial soundness remain positive, with growth in total bank assets expanding by nearly 15 percent from
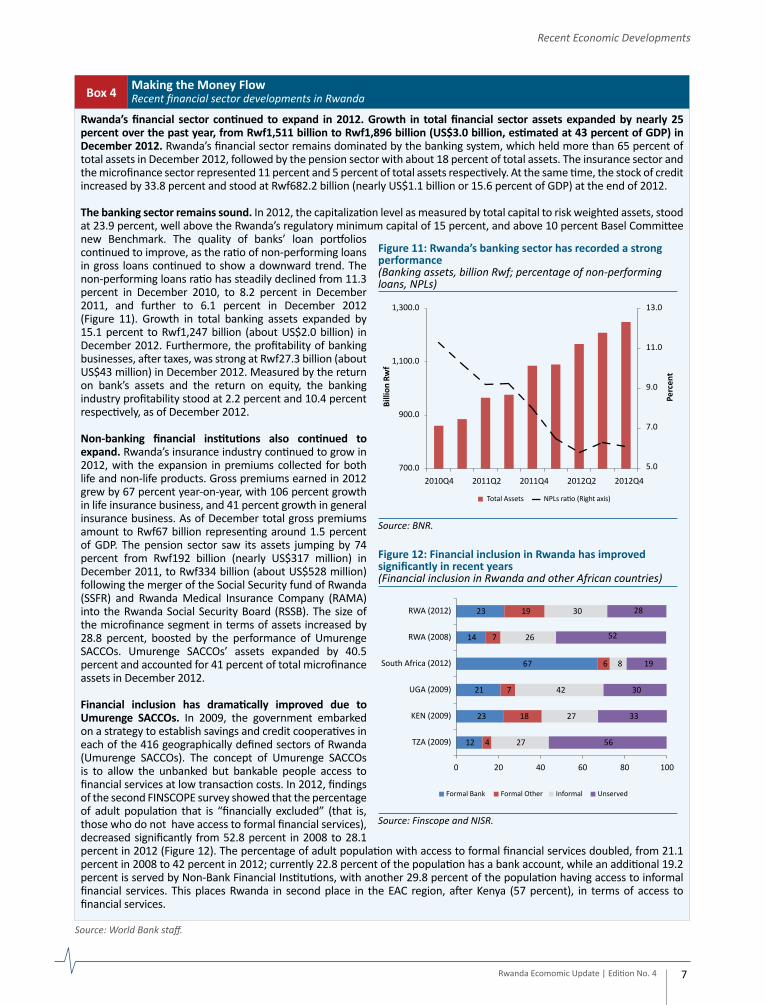
the end of 2011 to December 2012.The quality of banks’ loan portfolios has also improved, as the ratio of non-performing loans (NPLs) continued to decrease, falling from 8.2 percent in December 2011, to 6.1 percent in December 2012 (Figure 11). The insurance industry continued to expand in 2012, with the expansion in premiums collected for both life and non-life products.
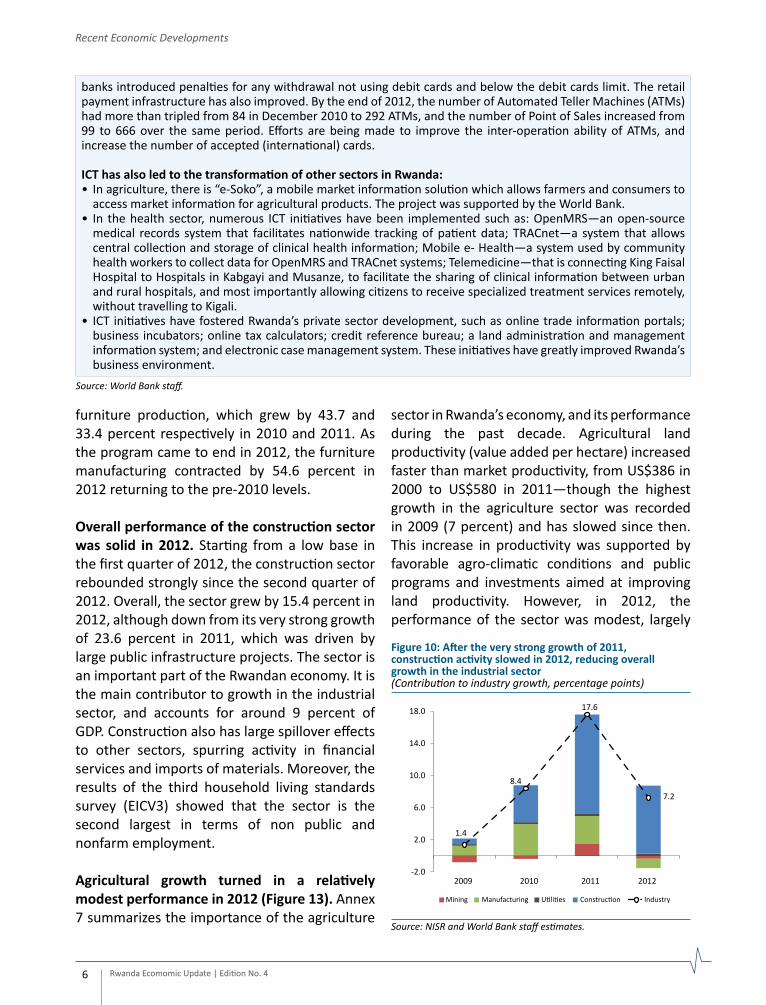
Growth in the industrial sector weakened as activity in the mining and manufacturing sectors contracted (Figure 10). Overall, industrial growth fell to 7.2 percent in 2012, from 17.6 percent in 2011. Mining, contracted by 9.8 percent growth in 2012, compared to a stellar growth of 49.7 percent in 2011. This contraction was as a result of low international prices and weak production of tin, Rwanda’s primary mineral export (Figure 19). Manufacturing output fell by 2.9 percent in 2012 compared to 2011. The negative growth in the sector was partly due to higher costs of electricity, which have grown by 20 percent since July 2012.5 It is important to note that strong growth rates reported by the manufacturing sector in 2010 and 2011, respectively 9.3 and 8.1 percent, were associated with a Government’s program for building new houses for low-income households. This program helped to boost
Rwanda Ecomomic Update | Edition No. 4 4
Recent Economic Developments
Figure 6: The services sector has regained its role as the keydriver of growth in 2012…(Contribution to real GDP growth, percentage points)
2.71.8 1.6 1.0
0.21.2
2.5
1.1
2.84.0
4.0
5.6
6.2
7.2
8.2 8.0
0.0
1.0
2.0
3.0
4.0
5.0
6.0
7.0
8.0
9.0
2009 2010 2011 2012
Agriculture Industry Services Adjustment GDP
Perc
ent
Source: NISR and World Bank staff estimates.
Figure 7: …with private sector services, especially trade,transport and communications, driving services growth(Annual growth, percent)
-5.0 0.0 5.0 10.0 15.0 20.0 25.0
Other services
Hotels & restaurants
Real estate businesses
Educ., Health & Pub. Admin.
Trade services
Financial services
Transport, communication
2012 2011 2010
5The authorities increased electricity tariffs to ensure a positive rate of return for the Energy and Water Sanitation Authority.
Rwanda Ecomomic Update | Edition No. 4 5
Recent Economic Developments
Mobile phone penetration started to accelerate in 2007. In 2006, only 6.2 percent of Rwandan households owned a telephone, and less than 4 in 100 Rwandan adults had mobile phone service, after 9 years after mobile phone services begun in Rwanda. By the end of 2012, there were 5,690,751 mobile subscribers, or 53 mobile phone subscriptions for every 100 people in Rwanda (Figure 8). According to Enquête Intégrale des Conditions de Vie des Ménages, EICV-3, the percentage of households with at least one mobile phone has increased to 45.2 percent, with the highest rate being in Kigali (80 percent) and in the Eastern Province (48 percent). Today 3 mobile phone operators are competing in Rwanda’s Market: MTN Rwanda since 1998, TIGO established in late 2009 and Airtel launched in March 2012. It is important to note that in April 2011, a mobile operator license of Rwandatel was revoked because of the failure to implement its license obligations such as coverage and roll out obligation, quality services, among other requirements.
The increase in mobile phone services has been accompanied by decreased costs of connections and handsets. In 2007, the cost of a handset was around Rwf90,000 (US$165) and in 2012 it was about Rwf12,000 (US$20). The cost of using mobile phone services decreased: monthly connection fees fell from Rwf2,500 to Rwf1,250 in 2004, and were eliminated in 2005. Moreover, with the entries of other operators, the market has become more competitive, leading mobile phone operators to reduce their calling rates in order to attract more customers. In 2006, the calling rate was Rwf147 (nearly US$0.30) per minute for prepaid services. As of September 2012, calling rates were ranging from Rwf20 to 30 (nearly US$0.04) for call within the same operator, and from Rwf50 to 90 (about US$0.08 to US$0.14) for calls to different operators for local calls.
Information and Communication has been the main investment destination (Figure 9). According to Foreign private Investment Survey reports, almost half of Foreign Private investment to Rwanda between 2008 and 2011 was for the information and communication sector. This was mainly driven by the entries of new mobile operators, and new investment for the existing ones.
Increased ICT and mobile use have helped to modernize Rwanda’s banking sector, and strengthen financial inclusion. Like in other EAC countries, one of the most popular fixtures is mobile money. Starting with MTN Mobile Money which was launched in February 2010, and later joined by TIGO Cash in May 2011. Mobile money has become a common feature in the lives of Rwandans, extending a refined system to provide financial services to the under-served populace. By the end of 2012, the mobile money system had increased to 1,440,541 subscribers (equivalent to nearly a quarter of total mobile phone subscribers) from slightly over 200,000 subscribers in 2010. Several banks offer mobile banking services to their clients (such as account balance, electricity and airtime purchase, salary SMS alerts, among others.) By December 2012, seven banks were offering mobile banking services. To ease retail payments, banks started promoting bank payment cards and providing electronic banking services to their clients. Debit cards increased from 41,377 in December 2010, to 389,289 cards in December 2012. In 2012, some
Source: BNR, Foreign Private investment and investors reports.
Rwanda Ecomomic Update | Edition No. 4 6
Recent Economic Developments
banks introduced penalties for any withdrawal not using debit cards and below the debit cards limit. The retail payment infrastructure has also improved. By the end of 2012, the number of Automated Teller Machines (ATMs) had more than tripled from 84 in December 2010 to 292 ATMs, and the number of Point of Sales increased from 99 to 666 over the same period. Efforts are being made to improve the inter-operation ability of ATMs, and increase the number of accepted (international) cards.
ICT has also led to the transformation of other sectors in Rwanda:• In agriculture, there is “e-Soko”, a mobile market information solution which allows farmers and consumers to
access market information for agricultural products. The project was supported by the World Bank.• In the health sector, numerous ICT initiatives have been implemented such as: OpenMRS—an open-source
medical records system that facilitates nationwide tracking of patient data; TRACnet—a system that allows central collection and storage of clinical health information; Mobile e- Health—a system used by community health workers to collect data for OpenMRS and TRACnet systems; Telemedicine—that is connecting King Faisal Hospital to Hospitals in Kabgayi and Musanze, to facilitate the sharing of clinical information between urban and rural hospitals, and most importantly allowing citizens to receive specialized treatment services remotely, without travelling to Kigali.
• ICT initiatives have fostered Rwanda’s private sector development, such as online trade information portals; business incubators; online tax calculators; credit reference bureau; a land administration and management information system; and electronic case management system. These initiatives have greatly improved Rwanda’s business environment.
Source: World Bank staff.
furniture production, which grew by 43.7 and 33.4 percent respectively in 2010 and 2011. As the program came to end in 2012, the furniture manufacturing contracted by 54.6 percent in 2012 returning to the pre-2010 levels.
Overall performance of the construction sector was solid in 2012. Starting from a low base in the first quarter of 2012, the construction sector rebounded strongly since the second quarter of 2012. Overall, the sector grew by 15.4 percent in 2012, although down from its very strong growth of 23.6 percent in 2011, which was driven by large public infrastructure projects. The sector is an important part of the Rwandan economy. It is the main contributor to growth in the industrial sector, and accounts for around 9 percent of GDP. Construction also has large spillover effects to other sectors, spurring activity in financial services and imports of materials. Moreover, the results of the third household living standards survey (EICV3) showed that the sector is the second largest in terms of non public and nonfarm employment.
Agricultural growth turned in a relatively modest performance in 2012 (Figure 13). Annex 7 summarizes the importance of the agriculture
sector in Rwanda’s economy, and its performance during the past decade. Agricultural land productivity (value added per hectare) increased faster than market productivity, from US$386 in 2000 to US$580 in 2011—though the highest growth in the agriculture sector was recorded in 2009 (7 percent) and has slowed since then. This increase in productivity was supported by favorable agro-climatic conditions and public programs and investments aimed at improving land productivity. However, in 2012, the performance of the sector was modest, largely
Figure 10: After the very strong growth of 2011, construction activity slowed in 2012, reducing overall growth in the industrial sector(Contribution to industry growth, percentage points)
1.4
8.4
17.6
7.2
-2.0
2.0
6.0
10.0
14.0
18.0
2009 2010 2011 2012
Mining Manufacturing Utilities Construction Industry
Source: NISR and World Bank staff estimates.
Rwanda Ecomomic Update | Edition No. 4 7
Recent Economic Developments
Rwanda’s financial sector continued to expand in 2012. Growth in total financial sector assets expanded by nearly 25 percent over the past year, from Rwf1,511 billion to Rwf1,896 billion (US$3.0 billion, estimated at 43 percent of GDP) in December 2012. Rwanda’s financial sector remains dominated by the banking system, which held more than 65 percent of total assets in December 2012, followed by the pension sector with about 18 percent of total assets. The insurance sector and the microfinance sector represented 11 percent and 5 percent of total assets respectively. At the same time, the stock of credit increased by 33.8 percent and stood at Rwf682.2 billion (nearly US$1.1 billion or 15.6 percent of GDP) at the end of 2012.
The banking sector remains sound. In 2012, the capitalization level as measured by total capital to risk weighted assets, stood at 23.9 percent, well above the Rwanda’s regulatory minimum capital of 15 percent, and above 10 percent Basel Committee new Benchmark. The quality of banks’ loan portfolios continued to improve, as the ratio of non-performing loans in gross loans continued to show a downward trend. The non-performing loans ratio has steadily declined from 11.3 percent in December 2010, to 8.2 percent in December 2011, and further to 6.1 percent in December 2012 (Figure 11). Growth in total banking assets expanded by 15.1 percent to Rwf1,247 billion (about US$2.0 billion) in December 2012. Furthermore, the profitability of banking businesses, after taxes, was strong at Rwf27.3 billion (about US$43 million) in December 2012. Measured by the return on bank’s assets and the return on equity, the banking industry profitability stood at 2.2 percent and 10.4 percent respectively, as of December 2012.
Non-banking financial institutions also continued to expand. Rwanda’s insurance industry continued to grow in 2012, with the expansion in premiums collected for both life and non-life products. Gross premiums earned in 2012 grew by 67 percent year-on-year, with 106 percent growth in life insurance business, and 41 percent growth in general insurance business. As of December total gross premiums amount to Rwf67 billion representing around 1.5 percent of GDP. The pension sector saw its assets jumping by 74 percent from Rwf192 billion (nearly US$317 million) in December 2011, to Rwf334 billion (about US$528 million) following the merger of the Social Security fund of Rwanda (SSFR) and Rwanda Medical Insurance Company (RAMA) into the Rwanda Social Security Board (RSSB). The size of the microfinance segment in terms of assets increased by 28.8 percent, boosted by the performance of Umurenge SACCOs. Umurenge SACCOs’ assets expanded by 40.5 percent and accounted for 41 percent of total microfinance assets in December 2012.
Financial inclusion has dramatically improved due to Umurenge SACCOs. In 2009, the government embarked on a strategy to establish savings and credit cooperatives in each of the 416 geographically defined sectors of Rwanda (Umurenge SACCOs). The concept of Umurenge SACCOs is to allow the unbanked but bankable people access to financial services at low transaction costs. In 2012, findings of the second FINSCOPE survey showed that the percentage of adult population that is “financially excluded” (that is, those who do not have access to formal financial services), decreased significantly from 52.8 percent in 2008 to 28.1 percent in 2012 (Figure 12). The percentage of adult population with access to formal financial services doubled, from 21.1 percent in 2008 to 42 percent in 2012; currently 22.8 percent of the population has a bank account, while an additional 19.2 percent is served by Non-Bank Financial Institutions, with another 29.8 percent of the population having access to informal financial services. This places Rwanda in second place in the EAC region, after Kenya (57 percent), in terms of access to financial services.
Box 4 Making the Money FlowRecent financial sector developments in Rwanda
Source: World Bank staff.
Figure 11: Rwanda’s banking sector has recorded a strongperformance(Banking assets, billion Rwf; percentage of non-performing loans, NPLs)
5.0
7.0
9.0
11.0
13.0
700.0
900.0
1,100.0
1,300.0
2010Q4 2011Q2 2011Q4 2012Q2 2012Q4
Perc
ent
Billi
on R
wf
Total Assets NPLs ratio (Right axis)
Source: BNR.
Figure 12: Financial inclusion in Rwanda has improvedsignificantly in recent years(Financial inclusion in Rwanda and other African countries)
12
23
21
67
14
23
4
18
7
6
7
19
27
27
42
8
26
30
56
33
30
19
52
28
0 20 40 60 80 100
TZA (2009)
KEN (2009)
UGA (2009)
South Africa (2012)
RWA (2008)
RWA (2012)
Formal Bank Formal Other Informal Unserved
Source: Finscope and NISR.
due to unfavorable weather conditions affecting the food crop harvest. The volume of food crops rose by only 1.9 percent, compared to 9.2 percent in 2011. The production of export crops contracted by 9.3 percent in 2012, compared to 2011. This was as a result of a weak harvest and declining international prices, especially for coffee. In 2012, growth of agricultural output was 3 percent, which was weaker than 4.7 percent in 2011 (Figure 13). As further elaborated in the focus section on poverty dynamics, agriculture is vital to Rwanda’s economy, with improvements in food production as a key driver of both economic growth and poverty reduction.
Rwanda Ecomomic Update | Edition No. 4 8
Recent Economic Developments
1.2. Inflation — Declining, but risks remain as import prices rise
Rwanda’s inflation rate has declined throughout the second half of 2012, as food and energy prices, large components of the consumption basket, have fallen. Monetary authorities have also
maintained a prudent policy stance, since the reduction of aid, which combined with declining import prices and a deceleration in inflation in the EAC region, contributed to the reduction in inflation. However, since October 2012, import prices have started to rise, reversing a 14-month downward trend. While the headline rate remains low, if the exchange rate continues to fall, inflationary pressures will generally start to build up throughout the economy.
Headline inflation declined over 2012, as food and energy prices fell. As of February 2013,
the headline inflation rate was 4.9 percent with core inflation at 5.1 percent (year-on-year, Figure 14). Food prices, which account for 35 percent of the consumption basket, declined through the year, but remained elevated at about 8 percent at the end of 2012. At the disaggregated level, the easing in prices of bread and cereals, in mid-to-late 2012 was largely offset by an increase in the price of vegetables. The decline in energy prices has followed the decline in international prices, with oil prices falling from early year high levels. In January, there was an uptick in headline inflation as local and imported food prices rose. Core inflation, which excludes food and energy, continued to fall throughout 2012, ending the year at 2.6 percent, down from 8.3 percent at the end of 2011. Inflationary pressures have been moderated by cautious monetary policy. After raising rates up to May 2012, authorities
have balanced the risks of slowing domestic prices and rising import prices, to maintain price stability.
The depreciation of the Rwandan franc is beginning to put upward pressure on inflation. As the Rwandan Franc begun to depreciate since late 2012, import prices (which account for 20 percent of the basket) have begun to rise. From October 2012, import prices have reversed their 14 month downward trend, increasing from 1.2 percent in September, to 3.2 percent at the end of 2012. Transport prices, which were trending down through 2011 until October 2012, have been increasing, because the imported component of transport (for example airplane tickets) is paid in US dollars. As the exchange rate continues to depreciate, higher imported prices will begin to feed into prices more generally, resulting in higher core and headline inflation.
Figure 13: Agricultural growth continued its downwardtrend(Contribution to agricultural growth, percentage points)
7.7
5.0 4.7
3.0
-1.0
1.0
3.0
5.0
7.0
9.0
2009 2010 2011 2012
Food crops Export crops Others Agriculture
Source: World Bank staff estimates.
Rwanda Ecomomic Update | Edition No. 4 9
Recent Economic Developments
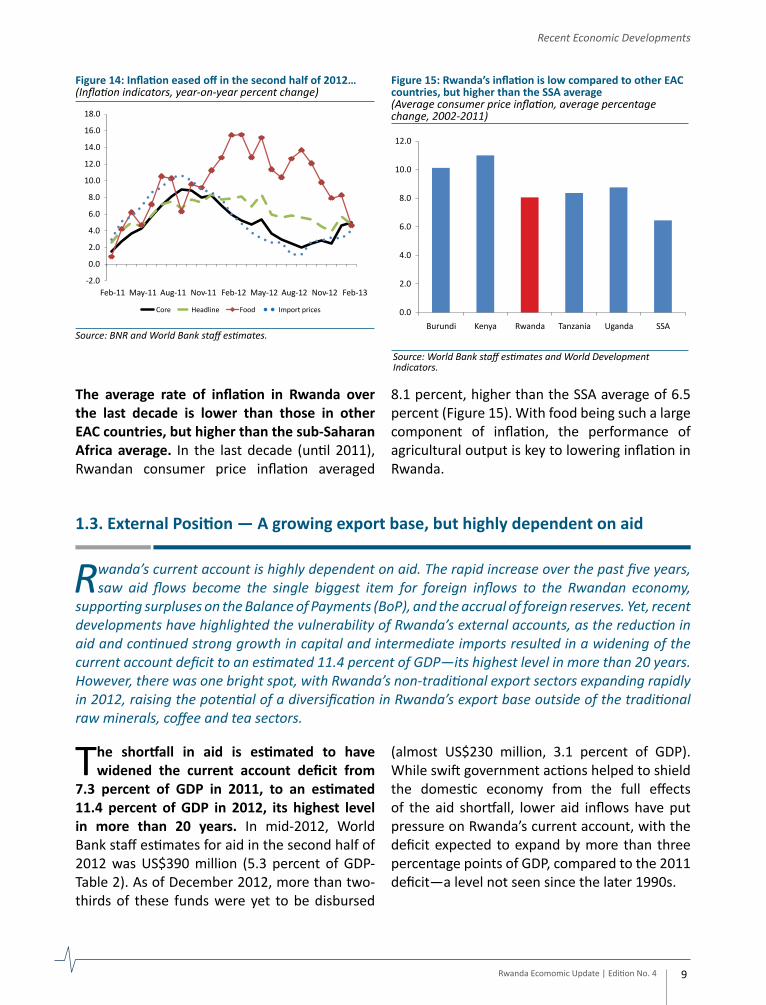
Figure 14: Inflation eased off in the second half of 2012…(Inflation indicators, year-on-year percent change)
Figure 15: Rwanda’s inflation is low compared to other EACcountries, but higher than the SSA average(Average consumer price inflation, average percentage change, 2002-2011)
0.0
2.0
4.0
6.0
8.0
10.0
12.0
Burundi Kenya Rwanda Tanzania Uganda SSA
Source: World Bank staff estimates and World Development Indicators.
The average rate of inflation in Rwanda over the last decade is lower than those in other EAC countries, but higher than the sub-Saharan Africa average. In the last decade (until 2011), Rwandan consumer price inflation averaged
8.1 percent, higher than the SSA average of 6.5 percent (Figure 15). With food being such a large component of inflation, the performance of agricultural output is key to lowering inflation in Rwanda.
1.3. External Position — A growing export base, but highly dependent on aid
Rwanda’s current account is highly dependent on aid. The rapid increase over the past five years, saw aid flows become the single biggest item for foreign inflows to the Rwandan economy,
supporting surpluses on the Balance of Payments (BoP), and the accrual of foreign reserves. Yet, recent developments have highlighted the vulnerability of Rwanda’s external accounts, as the reduction in aid and continued strong growth in capital and intermediate imports resulted in a widening of the current account deficit to an estimated 11.4 percent of GDP―its highest level in more than 20 years. However, there was one bright spot, with Rwanda’s non-traditional export sectors expanding rapidly in 2012, raising the potential of a diversification in Rwanda’s export base outside of the traditional raw minerals, coffee and tea sectors.
The shortfall in aid is estimated to have widened the current account deficit from
7.3 percent of GDP in 2011, to an estimated 11.4 percent of GDP in 2012, its highest level in more than 20 years. In mid-2012, World Bank staff estimates for aid in the second half of 2012 was US$390 million (5.3 percent of GDP-Table 2). As of December 2012, more than two-thirds of these funds were yet to be disbursed
(almost US$230 million, 3.1 percent of GDP). While swift government actions helped to shield the domestic economy from the full effects of the aid shortfall, lower aid inflows have put pressure on Rwanda’s current account, with the deficit expected to expand by more than three percentage points of GDP, compared to the 2011 deficit―a level not seen since the later 1990s.
Rwanda Ecomomic Update | Edition No. 4 10
Recent Economic Developments
While aid inflows have dried up since mid-2012, imports have continued to rise, consistent with the strong uptick in private sector activities. In 2012, goods imports continued to expand rapidly, growing by an estimated 25.6 percent to reach almost US$2 billion. This was primarily driven by rapid growth in capital and intermediary goods imports, which increased by 26.7 percent and 18.3 percent, respectively, during 2012 (Figure 16), consistent with the rebound in private sector activities. This strong momentum was maintained over the second half of 2012, with imports growing by over 10 percent, compared to the first half of 2012, primarily due to increasing consumption goods and industrial products. Sustained strong growth in capital goods and intermediate goods imports, have seen these two components rapidly increase as a share of total goods imports; with these two together with consumption goods now each representing over a quarter of the total imports bill. Consumer goods remain the largest component of the import bill, accounting for 28.5 percent of total goods imports. Given Rwanda’s nascent domestic manufacturing sector, these consumer goods mainly comprise of non-food items. Food products accounted for only 10.4 percent of the import bill in 2012, down from over 11 percent in the past two years. The expansion in energy-
related imports eased to 4.6 percent in 2012, down from the breakneck pace of 63.9 percent in 2011, as oil prices followed the volatility in global markets, while demand remained firm.
Exports also expanded rapidly, but this was not enough to offset the rise in imports, and so the trade deficit widened (Figure 17). Export earnings are estimated to have expanded to US$590.8 million in 2012, with annual growth of 27.3 percent outpacing growth in imports. Almost 60 percent of export sales came in the second half of 2012, as international prices of Rwanda’s main export products rebounded during the second half of the year. By destination, the EAC continued to account for around three-quarters of Rwandan exports in 2012, while the DRC accounted for 15 percent of exports. Thus, Rwanda’s export performance remains heavily reliant on economic conditions within its closest neighbors, and makes export earnings vulnerable to regional shocks. Despite the strong growth in exports in 2012, the much lower base of exports meant that the slightly stronger growth than imports could not prevent a widening in the trade deficit, which is estimated to have expanded to US$1,376 million in 2012 (about 20 percent of GDP), up from US$1,102 million in 2011 (17.3 percent of GDP).
Figure 16: Imports growth accelerated in 2012, driven bystrong growth in capital and raw materials…(Growth in import values in 2012)
2012 2011
63.9
26.0
37.9
30.1
4.6
13.2
18.3
26.7
0.0 10.0 20.0 30.0 40.0 50.0 60.0 70.0
Energy produtcs (16.1%)
Consummer goods (28.5%)
Intermediary goods (28.3%)
Capital goods (26.8%)
Source: BNR and World Bank staff estimates.
Figure 17: …and this increase in imports is widening Rwanda’s trade deficit(Formal trade, million US$)
Exports Imports Trade balance (Right Axis)
-1,600.0
-1,400.0
-1,200.0
-1,000.0
-800.0
-600.0
-400.0
-200.0
0.00.0
500.0
1,000.0
1,500.0
2,000.0
2,500.0
2009 2010 2011 2012
Rwanda Ecomomic Update | Edition No. 4 11
Recent Economic Developments
6According to Rwandan Authorities, traditional exports are coffee, tea, and minerals, especially tin.
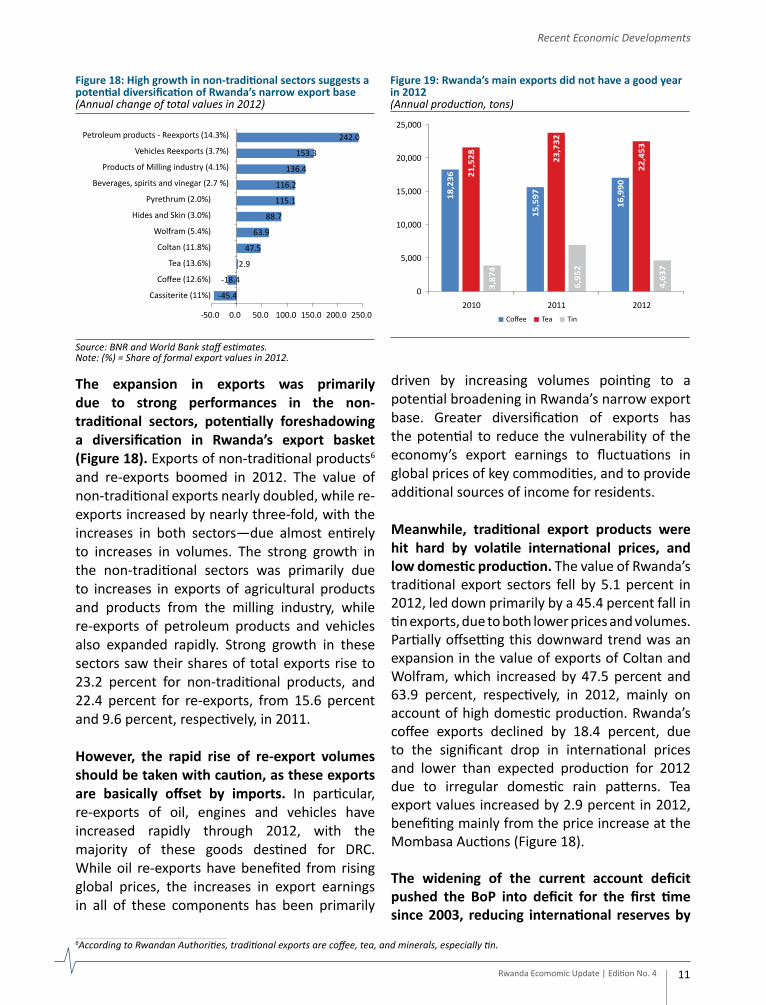
The expansion in exports was primarily due to strong performances in the non-traditional sectors, potentially foreshadowing a diversification in Rwanda’s export basket (Figure 18). Exports of non-traditional products6 and re-exports boomed in 2012. The value of non-traditional exports nearly doubled, while re-exports increased by nearly three-fold, with the increases in both sectors—due almost entirely to increases in volumes. The strong growth in the non-traditional sectors was primarily due to increases in exports of agricultural products and products from the milling industry, while re-exports of petroleum products and vehicles also expanded rapidly. Strong growth in these sectors saw their shares of total exports rise to 23.2 percent for non-traditional products, and 22.4 percent for re-exports, from 15.6 percent and 9.6 percent, respectively, in 2011.
However, the rapid rise of re-export volumes should be taken with caution, as these exports are basically offset by imports. In particular, re-exports of oil, engines and vehicles have increased rapidly through 2012, with the majority of these goods destined for DRC. While oil re-exports have benefited from rising global prices, the increases in export earnings in all of these components has been primarily
driven by increasing volumes pointing to a potential broadening in Rwanda’s narrow export base. Greater diversification of exports has the potential to reduce the vulnerability of the economy’s export earnings to fluctuations in global prices of key commodities, and to provide additional sources of income for residents.
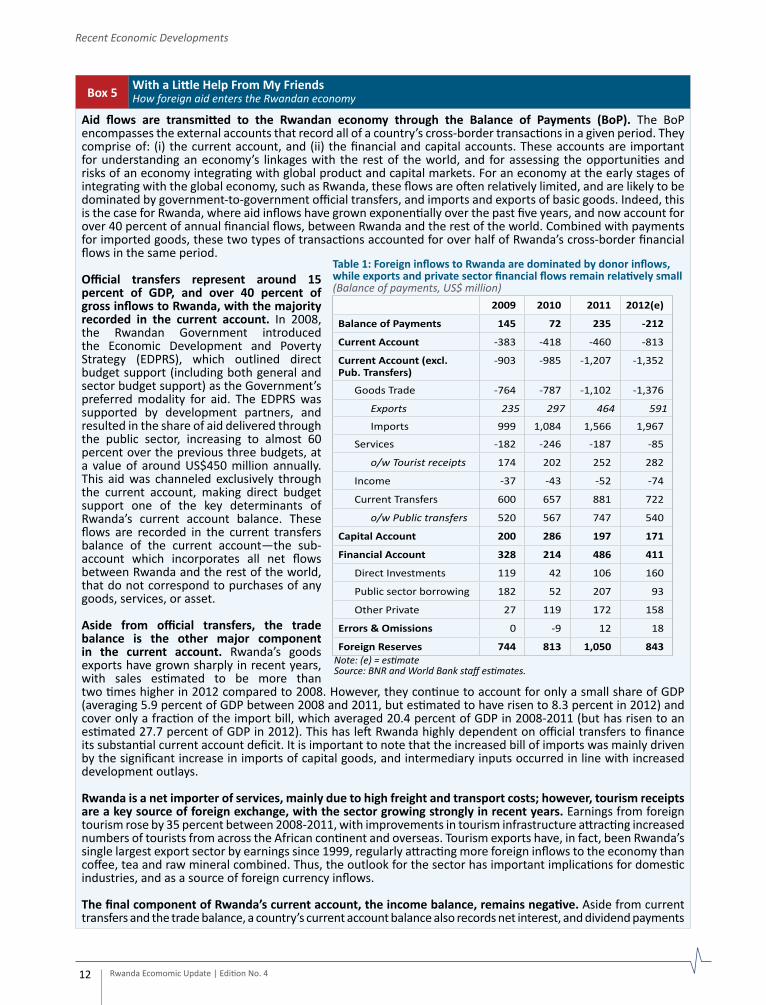
Meanwhile, traditional export products were hit hard by volatile international prices, and low domestic production. The value of Rwanda’s traditional export sectors fell by 5.1 percent in 2012, led down primarily by a 45.4 percent fall in tin exports, due to both lower prices and volumes. Partially offsetting this downward trend was an expansion in the value of exports of Coltan and Wolfram, which increased by 47.5 percent and 63.9 percent, respectively, in 2012, mainly on account of high domestic production. Rwanda’s coffee exports declined by 18.4 percent, due to the significant drop in international prices and lower than expected production for 2012 due to irregular domestic rain patterns. Tea export values increased by 2.9 percent in 2012, benefiting mainly from the price increase at the Mombasa Auctions (Figure 18).
The widening of the current account deficit pushed the BoP into deficit for the first time since 2003, reducing international reserves by
Figure 18: High growth in non-traditional sectors suggests apotential diversification of Rwanda’s narrow export base(Annual change of total values in 2012)
-45.4
-18.4
2.9
47.5
63.9
88.7
115.1
116.2
136.4
153.3
242.0
-50.0 0.0 50.0 100.0 150.0 200.0 250.0
Cassiterite (11%)
Coffee (12.6%)
Tea (13.6%)
Coltan (11.8%)
Wolfram (5.4%)
Hides and Skin (3.0%)
Pyrethrum (2.0%)
Beverages, spirits and vinegar (2.7 %)
Products of Milling industry (4.1%)
Vehicles Reexports (3.7%)
Petroleum products - Reexports (14.3%)
Source: BNR and World Bank staff estimates.Note: (%) = Share of formal export values in 2012.
Figure 19: Rwanda’s main exports did not have a good yearin 2012(Annual production, tons)
18,2
36
15,5
97
16,9
90
21,5
28 23,7
32
22,4
53
3,87
4
6,95
2
4,63
7
0
5,000
10,000
15,000
20,000
25,000
2010 2011 2012Coffee Tea Tin
Rwanda Ecomomic Update | Edition No. 4 12
Recent Economic Developments
Aid flows are transmitted to the Rwandan economy through the Balance of Payments (BoP). The BoP encompasses the external accounts that record all of a country’s cross-border transactions in a given period. They comprise of: (i) the current account, and (ii) the financial and capital accounts. These accounts are important for understanding an economy’s linkages with the rest of the world, and for assessing the opportunities and risks of an economy integrating with global product and capital markets. For an economy at the early stages of integrating with the global economy, such as Rwanda, these flows are often relatively limited, and are likely to be dominated by government-to-government official transfers, and imports and exports of basic goods. Indeed, this is the case for Rwanda, where aid inflows have grown exponentially over the past five years, and now account for over 40 percent of annual financial flows, between Rwanda and the rest of the world. Combined with payments for imported goods, these two types of transactions accounted for over half of Rwanda’s cross-border financial flows in the same period.
Official transfers represent around 15 percent of GDP, and over 40 percent of gross inflows to Rwanda, with the majority recorded in the current account. In 2008, the Rwandan Government introduced the Economic Development and Poverty Strategy (EDPRS), which outlined direct budget support (including both general and sector budget support) as the Government’s preferred modality for aid. The EDPRS was supported by development partners, and resulted in the share of aid delivered through the public sector, increasing to almost 60 percent over the previous three budgets, at a value of around US$450 million annually. This aid was channeled exclusively through the current account, making direct budget support one of the key determinants of Rwanda’s current account balance. These flows are recorded in the current transfers balance of the current account―the sub-account which incorporates all net flows between Rwanda and the rest of the world, that do not correspond to purchases of any goods, services, or asset.
Aside from official transfers, the trade balance is the other major component in the current account. Rwanda’s goods exports have grown sharply in recent years, with sales estimated to be more than two times higher in 2012 compared to 2008. However, they continue to account for only a small share of GDP (averaging 5.9 percent of GDP between 2008 and 2011, but estimated to have risen to 8.3 percent in 2012) and cover only a fraction of the import bill, which averaged 20.4 percent of GDP in 2008-2011 (but has risen to an estimated 27.7 percent of GDP in 2012). This has left Rwanda highly dependent on official transfers to finance its substantial current account deficit. It is important to note that the increased bill of imports was mainly driven by the significant increase in imports of capital goods, and intermediary inputs occurred in line with increased development outlays.
Rwanda is a net importer of services, mainly due to high freight and transport costs; however, tourism receipts are a key source of foreign exchange, with the sector growing strongly in recent years. Earnings from foreign tourism rose by 35 percent between 2008-2011, with improvements in tourism infrastructure attracting increased numbers of tourists from across the African continent and overseas. Tourism exports have, in fact, been Rwanda’s single largest export sector by earnings since 1999, regularly attracting more foreign inflows to the economy than coffee, tea and raw mineral combined. Thus, the outlook for the sector has important implications for domestic industries, and as a source of foreign currency inflows.
The final component of Rwanda’s current account, the income balance, remains negative. Aside from current transfers and the trade balance, a country’s current account balance also records net interest, and dividend payments
Box 5 With a Little Help From My FriendsHow foreign aid enters the Rwandan economy
2009 2010 2011 2012(e)
Balance of Payments 145 72 235 -212
Current Account -383 -418 -460 -813
Current Account (excl. Pub. Transfers)
-903 -985 -1,207 -1,352
Goods Trade -764 -787 -1,102 -1,376
Exports 235 297 464 591
Imports 999 1,084 1,566 1,967
Services -182 -246 -187 -85
o/w Tourist receipts 174 202 252 282
Income -37 -43 -52 -74
Current Transfers 600 657 881 722
o/w Public transfers 520 567 747 540
Capital Account 200 286 197 171
Financial Account 328 214 486 411
Direct Investments 119 42 106 160
Public sector borrowing 182 52 207 93
Other Private 27 119 172 158
Errors & Omissions 0 -9 12 18
Foreign Reserves 744 813 1,050 843
Table 1: Foreign inflows to Rwanda are dominated by donor inflows, while exports and private sector financial flows remain relatively small(Balance of payments, US$ million)
Note: (e) = estimateSource: BNR and World Bank staff estimates.
Rwanda Ecomomic Update | Edition No. 4 13
Recent Economic Developments
and earnings of domestically owned firms operating abroad (the income balance). Given relatively low levels of foreign direct investment in Rwanda and small Rwandan direct investments abroad, these flows are relatively small, averaging a deficit of 1.0 to 1.5 percent of GDP over the past five years.
Current Account = Trade Balance + Income Balance + Current Transfers Balance
The other major accounts in the BoP are the capital and financial accounts. On one hand, the capital account is generally composed of in-kind capital grants to finance public projects and debt forgiveness. The financial account, on the other hand, records public and private sector lending activities with the rest of the world as well as FDI. For countries that are financially integrated with the global economy, the financial account is a relatively more important transmission channel, connecting domestic investors and savers with foreign financing and investment opportunities, as well as for channeling foreign direct investment (FDI) in long-term productive assets, such as land, capital, and new businesses. This is less true for Rwanda, where the capital account has averaged 3.5 percent of GDP during 2000-2011, while the financial account has averaged only 1.8 percent of GDP with 1.0 percent in FDI. Combined with high levels of foreign aid inflows, these net inflows on the capital and financial accounts have in the past mitigated the need for large external borrowing, to finance the deficit on goods, services, and income—which has averaged 15.8 percent of GDP over the decade.
Understanding these various elements can provide a holistic perspective on the various factors affecting net capital flows between Rwanda and the rest of the world. In addition, by disaggregating the BoP, key elements can be accurately identified, which drive Rwanda’s external accounts and therefore have a better understanding of how various shocks―such as the present sudden-stop in aid disbursement―might be transmitted to the domestic economy, and the potential implications of the stock on foreign reserves.
Rwanda has maintained a positive BoP in recent years, as official transfers have remained high (Figure 21). Over the period 2000-2011, the BoP surplus averaged 2 percent of GDP, as net capital grants, private transfers and net investments were more than sufficient to offset the trade deficit. Over the period 2000-2011, overall official transfers averaged 10.8 percent of GDP. Budgetary grants varied between 4.1 and 10.2 percent of GDP and averaged 6.9 percent of GDP. The contribution of private transfers, such as remittances, has been significantly low, averaging 1.7 percent of GPD in 2000-2011. As mentioned above, the capital account has averaged 3.5 percent of GDP over the same period. Combined, these high level of foreign aid inflows mitigated the need for large externally borrowing in order to finance an average deficit—on goods, services, and income—of 15.8 percent of GDP. As previously mentioned, the financial account has averaged 1.8 percent of GDP with 1.0 percent in foreign investments.
These BoP surpluses, financed by high official aid flows, have also led to an increase in foreign reserves. With the BoP registering an annual surplus in 10 of the 11 years in 2001-2011, net capital inflows have allowed the BNR to accrue foreign reserves, with the level of reserves rising almost six-fold. Over this period, the level of reserves has averaged 5.4 months of imports of goods and services, and in 9 out of 12 years, the level has been above the estimated optimal level of reserves, as calculated by the IMF (5.1 months of imports as per the IMF’s 4th review report of June 2012).Figure 20: Foreign aid inflows have fallen dramatically and as a result the Balance of Payments is projected to turn negative in 2012(Current account balance, percent of GDP)
Figure 21: …which have been the main source of foreign exchange reserves(Current account balance, US$ million)
500.0
1,000.0
1,500.0
2,000.0
2,500.0
2008 2009 2010 2011
Exports of G&S Remittances ODA FDI Gross Reserves
Source: World Bank staff.
Rwanda Ecomomic Update | Edition No. 4 14
Recent Economic Developments
almost 20 percent, to around US$845 million by the end of 2012. The sudden-stop in official inflows, combined with an expansion in the trade deficit, due to a record-high imports bill is estimated to have pushed the BoP from a surplus of US$235 million (3.7 percent of GDP) in 2011, to a deficit of around US$212 million (about 3.0 percent of GDP) in 2012 (Table 1 and Figure 20). Aside from official inflows, other public sector net inflows have also narrowed in 2012, as the spike in global financial market volatility in early 2012 resulted in a reduction of foreign demand for Rwandan Government sovereign debt, compared to 2011. Fluctuations in global financial markets and weakening foreign investor confidence, also pushed some African countries, including Rwanda, to delay their planned foreign-currency denominated bond issuances (Eurobonds) until market conditions improve. Rwandan authorities are yet to announce further plans for the issuance of a potential Eurobond of US$350 million. Finally, foreign direct investment (FDI) has continued to rise steadily―predominantly in the mineral, and hotel and leisure sectors―although at US$160 million (around 2.0 percent of GDP) in December 2012, these net inflows remain small relative to aid and trade flows. To offset net capital outflows
during 2012, the BNR has ran down international reserves by about US$200 million, to around US$845 billion in December 2012 (less than 4 months of imports).
Recent developments highlight the vulnerability of Rwanda’s external accounts to a sudden-stop of aid inflows. The significant scaling up of aid inflows over recent years has enabled the National Bank of Rwanda to accrue foreign reserves. While the level of reserves have risen five-fold since 2000, booming imports have resulted in a slight downward trend in the number of months of imports that could be covered by reserves if Rwanda were to completely lose access to foreign financing. This suggests that Rwanda’s external accounts remain vulnerable to fluctuations in the supply of foreign financing, particularly aid inflows, which remain the largest single source of foreign exchange. While the BNR has been able to offset the small net outflows on the BoP in recent months, this has come at a great cost to budget expenditures. With US$220 million of reserves exhausted through the second half of 2012, authorities have only a limited scope to intervene, should net capital outflows continue―highlighting the ongoing vulnerability of Rwanda’s external accounts.
Challenged by strong countervailing forces over the second half of 2012, authorities sought to maintain prudent monetary policy settings to support domestic economic stability, while managing
inflationary pressures. Over the second half of 2012, Rwandan authorities maintained the policy rate at 7.5 percent, balancing these countervailing forces, and helping to mute the impact of the aid shortfall on the domestic economy. Yet, interest rates in the economy were pushed up by the rapid pace of domestic credit growth, and the government’s increased domestic borrowing to finance the budget shortfall. In parallel, the National Bank of Rwanda (BNR), Rwanda’s Central Bank, continued its reform agenda, pushing ahead with critical reforms to improve monetary policy operations, and establish a Financial Stability Committee to oversee financial sector stability to mitigate systemic risk.
Rwanda Ecomomic Update | Edition No. 4 15
Recent Economic Developments
Authorities have continued to move ahead with reforms to monetary policy, with the
BNR adopting measures to strengthen liquidity management and improve monitoring and regulation of the financial sector. The BNR implemented a series of reforms during the second half of 2012, particularly focused on enhancing the effectiveness of monetary policy operations, and transmission mechanisms, and improving crisis preparedness. Beginning June 2012, the BNR adopted a seven-day-maturity repurchase agreement (repo) as its key debt instrument to manage system liquidity, in place of existing repo instruments of various maturities, in an effort to streamline its liquidity operations. In order to enhance operations of the interbank money market and improve overnight liquidity management, the BNR has introduced standing and lending facilities, and improved the reserve requirement system, by extending the reserve maintenances period from one week to two weeks. In line with other EAC countries, Rwandan authorities have also taken measures to reduce the economy’s reliance on foreign currencies, with the BNR mandating that all reserves requirements―for both local and foreign currency deposits―must be held in local currency, and introducing a new rule which limits banks’ overall foreign exchange exposures to about 10 percent of their core capital, in line with the practice of other EAC countries.
In light of growing concerns over financial sector stability, in July 2012, the BNR created the Financial Stability Committee (FSC) to monitor financial market conditions and risks. The FSC is an advisory body to the BNR Board of Directors, with responsibility to support financial sector stability, through the development of guidelines and strategies for mitigating systemic risk, in particular by carrying out periodic assessments of the pension and insurance sectors―neither of which were regulated until 2008. By establishing the committee, Rwanda joins a range of other developing nations that have established an authority to advise on issues related to financial
stability and systemic risk. As this new body matures, authorities could further strengthen financial system monitoring, by tasking the FSC to develop a national crisis management framework, which could be used in response to a systemic shock, including liquidity or solvency problems in the domestic banking sector. The group could also be a suitable body to develop comprehensive lender-of-last resort policies and procedures, and to enhance cooperation with overseas supervisors—especially as Rwanda’s linkages to overseas banks and financial markets grows over the coming years.
With strong countervailing forces affecting the domestic economy, the BNR kept the benchmark policy rate unchanged through the second half of 2012. Authorities faced two conflicting pressures affecting the Rwandan economy, through the second half of 2012. On the one hand, domestic economic conditions indicated that tighter monetary policy may be necessary, as the strong expansion in private domestic demand fueled rapid credit growth, and high demand for imports. In addition, the aid shortfall was accompanied by a depreciation of the Rwf against the US dollar, raising pressure on the BNR to raise the policy rate to stymie further capital outflows. On the other hand, domestic price pressures eased significantly, with low growth in broad money, and core inflation dropping from 9.0 percent in September 2011 to below 3.0 percent through the second half of 2012. In addition, the uncertainties surrounding aid flows, heightened external and fiscal risks, and monetary policy easing in some EAC countries (Figure 22), all suggested more accommodative monetary policy may be prudent. The Monetary Policy Committee (MPC) of the BNR responded prudently, by maintaining its benchmark interest rate at 7.5 percent throughout the second half of 2012, while working closely with the government to increase preparedness in the event that domestic economic conditions could begin to deteriorate. In its recent quarterly meeting held in March 2013, the MPC kept the benchmark interest rate unchanged.
Despite an unchanged policy rate, interest rates rose significantly in the second half of 2012. Although the BNR kept the policy interest rate unchanged, other market interest rates continued to rise over the period. Treasury bill rates rose by 310 basis points from 9.3 percent in June 2012 to 12.4 percent at the end of 2012, as the government turned to domestic borrowing, to fill the budget financing gap caused by the aid shortfall. Rwf262.5 billion (US$420 million) of T-bills were sold in the second half of 2012; almost twice as much as the same period in 2011. Deposit rates also increased by 324 basis points, as bank deposit growth eased relative to very strong credit growth.
The trend depreciation in the Rwandan franc continued in the second half of 2012, as net foreign capital inflows reversed. After easing by 1.6 percent in 2011 and a further 1.4 percent in the first half of 2012, the franc depreciation gathered speed in the six months to December 2012, moving down by 3.1 percent against the US dollar, despite Central Bank’s interventions on the domestic foreign exchange market. Rwanda’s real effective exchange rate has depreciated by
2.0 percent as of December 2012, compared to an appreciation of 0.7 percent in 2011. The depreciation was mainly due to lower inflation in Rwanda, compared to the nation’s major trading partners, as well as a nominal depreciation of the Rwf against the US dollar―with the dollar remaining the primary currency used in external trade (Figure 23 and Figure 24).
Rwanda Ecomomic Update | Edition No. 4 16
Recent Economic Developments
Figure 22: Central Banks across the EAC moved into anexpansionary phase in 2012, while the BNR held its policyrate unchanged(Bank policy rate, percent)
23
18
7.0
21
18
7.5
1211
7.5
0
5
10
15
20
25
Uganda Kenya Rwanda
Dec-11 May-12 Dec-12
Source: World Bank staff estimates based on data from Central Banksof Rwanda, Kenya and Uganda.
Figure 24: The real exchange rate depreciated, though slightly as Rwanda’s inflation was lower than key trading partners(Rwanda’s real effective exchange rate, Jan 2005=100)
75
80
85
90
95
100
105
Dec-10 Apr-11 Aug-11 Dec-11 Apr-12 Aug-12 Dec-12
Real Effective Nominal Effective
Figure 23: The Rwf depreciation gathered pace in H2 2012as delays in aid disbursement lengthened(Rwf against the US dollar)
590.0
600.0
610.0
620.0
630.0
640.0
Jan-11 Jun-11 Nov-11 Apr-12 Sep-12 Feb-13
Daily rate Annual average
Depreciation of 1.6 % in 2011
Depreciation of 1.4 % in H1-2012
Depreciationof 3.1 % in H2
2012
Source: World Bank staff estimates based on data from the BNR.
Rwanda Ecomomic Update | Edition No. 4 17
Recent Economic Developments
The reduction in aid inflows highlighted their importance to Rwanda’s fiscal
position. Compared to committed aid for the first half of FY2012/13, less than 40 percent was disbursed (Table 2). Since July 2012, development partners have suspended or delayed their planned budget support to Rwanda. As a result, the gap between expected and actual budget support reached US$232 million or 10 percent of the budget by the end of December 2012.
Despite the challenges, the GoR has managed the fiscal situation well. Improved tax administration and robust private sector activity increased domestic tax collections. Domestic revenue achieved 100.1 percent of its targets in the first half of FY2012/13, with 99 percent in tax revenues and 109 percent in non-tax revenues. To further offset the funding shortfall, the GoR has increased domestic borrowing (i.e., issuance of T-bills). This has enabled the government to continue spending on non-discretionary items such as salaries and wages, interest payment, transfers and expenditures. The overall budget execution rate was about 90.4 percent, with 107 percent in recurrent expenditure and 94.9 percent in capital expenditure (Table 3). Furthermore, the GoR launched a foreign fund, Agaciro Development Fund (AgDF), a homegrown solution aimed at improving the level of financial autonomy of Rwanda, as a nation (Box 6).
However, sustaining priority spending has not been without cost. Increased domestic borrowing was accompanied by a rapid increase in the weighted average rate of Treasury Bills. As outlined in the monetary section, Treasury bill rates rose by 310 basis points from 9.3 percent in June 2012, to 12.4 percent at the end of 2012. Because the rate of borrowing was not sufficient to cover all aid reductions, the government incurred arrears. As of December 2012, arrears amounted to Rwf34.4 billion, equivalent to 1.2 percent of GDP. The accumulation of arrears could have an impact on the confidence of private enterprises and households in the soundness of government financial operations.
1.5. Fiscal Policy — Strong performance in spite of enormous challenges
The reduction in aid posed significant challenges to fiscal policy in 2012. Authorities were able to cover some of the shortfall through increased domestic borrowing, and greater than expected
tax collections. The resulting shortfall in funding meant that the government had to cut spending in some categories and accumulate arrears. Despite these challenges, the government was still able to execute 90.4 percent of the revised budget levels. This enabled it to maintain spending in priority categories such as wages, interest payments, transfers and social spending.
Original budget
July-December 2012
Revised budget
Excepted Disbursed
General budget support 274.1 274.1 70.8 229.5
Agriculture 37.9 37.9 25.9 25.9
Education 34.0 34.0 34.0 34.0
Social Protection 21.6 11.6 11.6 11.6
Health 8.1 6.1 - -
Justice 14.9 14.9 4.1 10.9
Total 390.7 378.7 146.4 311.9
Percent of GDP 5.3 5.1 2.0 4.2
Percent of budget 18.3 17.7 6.9 13.1
Table 2: Foreign assistance inflows have dramatically declined since mid-2012(Donor budget support in 2012/13, US$ million)
Source: World Bank staff estimates based on information from MINECOFINand the media.
Rwanda Ecomomic Update | Edition No. 4 18
Recent Economic Developments
In March 2013, Parliament approved a revised 2012/13 budget, which reflects the uncertainty about future aid inflows. To respond to the fiscal pressures arising from the delays in budget support, the Government identified expenditure cuts of about 1 percent of GDP. The revised budget also includes contingent expenditures of Rwf107.6 billion (2.2 percent of GDP). It is important to note that the share of capital expenditure accounts for 30 percent of proposed budget cuts, and 67 percent of contingent items.
Tapping into the international bond market will be necessary in order to finance the completion
of some key strategic projects. The revision of the 2012/13 budget also includes proceeds from Euro Sovereign bonds worth Rwf227 billion (approximately US$350 million) to support the Kigali Convention Center (KCC) and RwandAir to offset expensive loans (US$200 million) and to finance the completion of the KCC project (US$150 million) before the end of 2013.7 This will be the first time that Rwanda issues an international bond. According to the World Bank’s Global Economic Prospects report of January 2013, low-risk investment-grade deals outnumbered riskier issues by a ratio of 3 to 1, during 2012.
Rwanda set up a sovereign fund, the Agaciro Development Fund, in August 2012, following a proposal floated among senior government leaders and citizens during the last National Dialogue held in December 2011. The Agaciro Development Fund is Rwanda’s first solidarity fund, based on voluntary donations. Agaciro is a Kinyarwanda word which can be loosely translated as “dignity”. The process is supported by Rwandans in the Diaspora, with support from their compatriots in Rwanda. The timing of the Fund is significant, coming at a time when several development partners have announced delays in budget support to Rwanda. There has been considerable promotional activity around the fund in the private and public sectors, with public servants being encouraged to contribute through monthly payroll deductions. As of February 2013, an amount of about Rwf29billion (nearly US$46 million) has been pledged.
Box 6 Planning for the FutureRwanda’s AGACIRO Development Fund
Source: World Bank staff.
Figure 25: Rwanda’s tax collection remains amongthe lowest in SSA…(Tax Revenue/GDP, percent; GDP per capita, US$)
Benin
DRC
EthiopiaGhana
KenyaMalawi
Rwanda
Senegal
Tanzania
Togo
Uganda
Zambia
10
12
14
16
18
20
22
0 200 400 600 800 1,000 1,200 1,400
Tax
Reve
nue/
GD
P
GDP per Capita
Source: World Bank’s World Development Indicators, MINECOFIN, and BNR.
Figure 26: …with donor funding making up for the shortfall(Government Operations as a share of GDP, percent)
0.0
5.0
10.0
15.0
20.0
25.0
30.0
2008 2009 mini 2009/10 2010/11 2011/12Domestic Revenues Grants Current expenditureCapital expenditure Net lending
7The amount of the Eurobond has been revised upward to US$400 million to accommodate an additional US$50 million to finance hydro-power projects meant to generate 28 megawatts.
Rwanda Ecomomic Update | Edition No. 4 19
Recent Economic Developments
Rwanda has long received substantial sums of foreign aid, relative to the size of its population and economy. Over the decade—to 2011, aid inflows to Rwanda have increased by about 300 percent, from US$321.5 million in 2002 to US$1,272.6 million in 2011. They have persistently exceeded 17 percent of GDP. As annual averages, aid inflows revenues have been at US$657 million between 2000-2011, and increasing from US$400 million in 2000-2005, to US$910 million in 2006-2011. Per capita ODA has more than doubled from US$39.7 in 2000, to US$97.2 in 2010, nearly two times the average of all low income countries. The surge in aid to Rwanda coincided with a sharp increase in overall aid to sub-Saharan Africa over the same period. This increase reflected renewed donor enthusiasm for aid in the context of the UN Millennium Development Goals campaign, the end of the post-cold-war decline in aid, and the implementation of the highly-indebted poor countries (HIPC) debt relief initiative.
Most of Rwanda’s aid is now delivered through the public sector. According to data from the OECD, only 10.6 percent of aid received was channeled through the public sector in 2002-2006. In 2007-2011, the share delivered through this channel increased dramatically and averaged 55.3 percent. This corresponds largely to the period for the implementation of the Economic Development and Poverty Strategy (EDPRS), the national poverty reduction paper, which was also supported by development partners. This reflected also the increasing confidence of donors in the country’s systems. In particular, Rwanda made significant progress in strengthening public financial management as documented by the most recent Public Expenditure Framework Assessment (PEFA) in 2010. Rwanda’s preferred aid modality remains budget support. In the previous three budgets, almost 60 percent was disbursed in form of budget support (this includes general and sector budget support).
Increased aid contributed to the rapid expansion of government development spending. High assistance to social sectors has created fiscal space which enabled the government to re-orient the share of its domestic collections to development expenditures. The component of development spending domestically funded increased by over 5.4 percentage points of GDP from less than 1 percent in 2000, to 5.6 percent of GDP in 2011/12. In terms of domestic collections, the share of domestic capital outlays increased from less than 2.1 percent in 2000, to almost 40 percent of domestic collections in 2011/12. Overall public expenditures increased by 4.5 percentage points of GDP, of which 3.0 percentage points were allocated to capital spending, the latter increasing from 8.7 percent of GDP in 2000 to 11.7 percent in 2011/12. Gross capital formation as percentage of GDP (21.4 percent in 2011) was the same as the average level in SSA.
Foreign aid has been an important financing source of public expenditure, thus easing the overall fiscal deficit. Total government spending as a share of GPD has steadily increased over 2000-2012. The high cost of reconstruction and poverty reduction programs, combined with growth acceleration programs, have increased spending to its highest level of about 28.6 percent of GDP in 2010/11. Rwanda’s domestic revenues, though increasing, cannot support this level of public spending. In 2000-2011, averaging 12.6 percent of GDP, the level of domestic collections ranged between 10 percent in 2000 and 14.8 percent in 2008. Increased public spending together with a relatively low level of domestic collections, resulted in large fiscal deficits, financed mostly by foreign grants. When not sufficient, the government resorts to borrowing. However, it is worth noting that after the HIPC, Rwanda’s debt remained below 20 percent of GDP.
Box 7 What’s in Your Wallet?Using aid flows to create fiscal space for public investment
Figure 27: Aid flows for Rwanda has increased substantially(Aid in million US$ and per capita rate)
30.0
40.0
50.0
60.0
70.0
80.0
90.0
100.0
200.0
400.0
600.0
800.0
1000.0
1200.0
1400.0
1600.0
2000 01 02 03 04 05 06 07 08 09 10 2011
Aid inflows Per capita, Right axis
Source: WDI and OECD.
Figure 28: The main disbursement channel of aid to Rwandais now through the public budget(Disbursement channels of assistance, 2002-2011)
0
20
40
60
80
100
Perc
ent
2002-2006 2007-2011
Public Sector NGOs & Civil SocietyPublic-Private Partnerships Multilateral OrganisationsOther Not Defined
Source: OECD.
Rwanda Ecomomic Update | Edition No. 4 20
Recent Economic Developments
Rwanda has used aid effectively to reduce poverty in recent years (See Focus Section for further details). In the 2011 OECD Paris Declaration survey on aid effectiveness, Rwanda was one of the only countries to receive an “A” rating on the operationality of its national development strategy. Of the 13 indicators with applicable targets in the survey, Rwanda has met 8, with the remaining five being close to the targets.
Figure 29: Social spending comprises the majority of ODA financed activities(Sector breakdown of aid, 2002-11)
Social Infrastructure
& Services48%
Economic Infrastructure & Services
8%
Production Sectors
6%
Multi-Sector / Cross-Cutting
5%
Commodity Aid /General Prog. Ass.
18%
Action Relating to Debt
10%
Humanitarian Aid3% Non unclassified
somewhere else2%
Source: OECD.
Figure 30: Aid flows constitute a major source of financing of public expenditures in Rwanda(Sources of fiscal revenues, 2008-2013)
23
35
22
24
16
12
15
16
17
16
0 20 40Percent
60 80 100
2008/09
2009/10
2010/11
2011/12
2012/13 est.
Domestic collections Budgetary grants Capital/project Grants Other financing
Source: MINECOFIN.
Source: World Bank staff.
Rwanda Ecomomic Update | Edition No. 4 21
Recent Economic Developments
Source: MINECOFIN.
2010/11 2011/12 2012/13
Budget Actual Budget Actual Original Budget
Budget Actual Revised Budget
Revenue and grants 1,029.8 1,049.1 1,220.5 589.4 545.3 1,149.5
Table 3: Government Operations, 2009/10 – 2012/13(Billion of Rwf, unless otherwise indicated)
Rwanda Ecomomic Update | Edition No. 4 22
Recent Economic Developments
The 2013-2014 forecasts generally present positive but highly uncertain external conditions for Rwanda. Weak economic growth will continue to be the norm in developed countries, with low or negative rates of growth, including in Rwanda’s major bilateral donors (MBD). However, economic activity in EAC countries―which account for 75 percent of Rwanda’s 2012 exports―is expected to remain strong, as modest increases in global commodity prices, and recent easing in monetary policy across the region, support strong domestic demand. Overall, growth in Rwanda’s major trading partners is expected to rise to 5.9 percent in 2013, and 5.8 percent in 2014 (Figure 31). Commodity prices are expected to remain broadly stable in 2013, before a gradual rise in 2014. This would have mixed results for Rwanda; it will curb the growth of the energy import bill but increase the price of food. Coffee prices are expected to continue trending down, while tea prices would remain flat. On the positive side, prices for tin are expected to increase towards their January 2012 levels.
Although major risks to the global economy have receded somewhat in recent months, they remain firmly tilted to the downside. Financial market uncertainty and fiscal consolidation in advanced economies are likely to be recurring sources of volatility for the foreseeable future. While Rwanda’s direct trade and financial linkage to Europe, the US, China and India are small, it
Figure 31: Growth across Rwanda’s Major Trading Partners is expected to rise modestly in 2013 and 2014(Real GDP growth, percent)
0.0
2.0
4.0
6.0
8.0
10.0
Rwanda EAC SSA MTP MBD
of Rwanda
2012e 2013p 2014p
Figure 32: Global commodity prices are expected to trackglobal growth, with prices relatively flat through 2013, before increasing modestly in 2014(Commodity price index, 2007=100)
Dec-07 Jan-09 Jan-10 Jan-11 Jan-12 Jan-13 Jan-14
Energy
Non-energy
Agriculture
50
75
100
125
150
175
200
Note: Trading partner and bilateral growths are weighted by Rwanda’s export values and donor inflows.Source: World Bank staff estimates based on data from the WorldBank’s DEC Prospects Group.
1.6. Economic Outlook and Risks
1.6.1. The Global Outlook—Gathering momentum?
The global economy remains fragile, but there are some signs of improvement. The World Bank forecasts global activity to gradually improve during 2013 and 2014, leading to higher global
commodity prices. These trends are expected to support a gradual strengthening in growth across sub-Saharan Africa, including EAC economies―where GDP growth is expected to rise to 4.6 percent in 2013, and 4.9 percent in 2014―supporting the outlook for Rwandan exports. However, a general climate of uncertainty continues to cloud the global economy, with ongoing concerns regarding the ability of European policymakers to address fiscal and debt issues in the Euro Zone, and for US officials to resolve the debt-ceiling debate. Hence, the possibility of another episode of financial market dislocations and deterioration in global economic momentum, cannot be ruled out.
Rwanda Ecomomic Update | Edition No. 4 23
Recent Economic Developments
is likely that any moderate-to-large shock to the global economy would have indirect effects on Rwanda through both trade and aid channels, as a shock to global financial markets and/or global
demand would likely impact economic activities in the other EAC economies, and could add further pressure to already tight fiscal conditions, in some of Rwanda’s key donor partners.
Rwanda’s GDP growth is forecast to slow in 2013 as the effects of aid reductions
begins to be felt throughout the economy. In the revised 2012/13 budget, donor grant disbursements are projected to be US$311 in the fiscal year 2012/13 (nearly 80 percent of originally budgeted levels or 4.2 percent of GDP). This shortfall in budget revenue will require cuts in public spending, slowing public-expenditure led services, and spilling over into other private services such as trade and retail. However, government actions to protect priority development spending will help to offset some of these negative impacts. Agriculture will continue to receive public investment to boost productivity, while continued investments in public infrastructure projects will support growth in construction. The growth outlook for the industrial sector is subject to downside risks relating to the prices for mineral exports, but expected to strengthen in 2013 and 2014, supported by higher tin production (Table 4). While Rwanda’s growth outlook has weakened, its performance in 2013 and 2014 will continue to outperform its neighbors and the sub-Saharan African average (Figure 33).
The decline in services sector growth will weaken economic growth in 2013 but agriculture and industry sectors will provide some offsetting activity. Services growth is expected to slow as public expenditure-led services such as public administration, education and health, which have positively impacted economic growth in previous years, grow at a slower pace,
1.6.2. Rwanda’s Outlook—Positive but highly uncertain
World Bank staff forecast that Rwanda’s economy will grow by 7.0 percent in 2013 before recovering to 7.5 percent in 2014. The slowdown in 2013 growth is driven by lower public
expenditures associated with the aid reduction during the current fiscal year. While government actions have so far limited the impact on the economy, the reduction in public expenditure will begin to have a noticeable spillover effect into related private activities, leading to a slowdown in the services sectors, especially those with strong links to public expenditures. As aid money begins to be disbursed throughout 2013, the current account deficit will decline, however, it will still remain at a very high rate. The inflation rate is forecast to remain moderate. However, global food prices and a depreciating exchange rate will put upward pressure on prices. While Rwanda’s economic outlook remains positive, it is clouded by the risk of larger than projected falls in aid and associated negative spillover effects to economic growth, inflation, and poverty reduction. Over the recent years, high aid inflows have supported solid growth of the public sector and other related services. Further aid reductions could have serious costs for Rwanda’s development prospects.
Figure 33: However, Rwanda is still projected to outperformregional peers and the Sub-Saharan average in 2013 and 2014(Annual GDP growth, percent)
0.0
2.0
4.0
6.0
8.0
Rwanda Burundi Kenya Tanzania Uganda SSA
2013p 2014p
Source: World Bank staff estimates, and World Bank’s DEC Prospects Group.
Rwanda Ecomomic Update | Edition No. 4 24
Recent Economic Developments
Table 4: The reduction in aid flows is projected to slow down growth in 2013 before a partial recovery in 2014(Contribution to GDP growth, percentage points)
Source: World Bank staff estimates, and World Bank’s DEC Prospects Group.
given cuts in public spending. Other services such as transport are likely to be adversely impacted as the GoR significantly reduces its purchasing of goods and services. Agricultural activity will continue to benefit from substantial public investments in the sector, including in irrigation improvements and productivity increases. Preliminary data of the agricultural season suggests that if rain conditions do not change dramatically, crop output will improve in 2013 and 2014. Industrial growth is forecast to strengthen in 2013 and 2014 due to a projected increase in tin production, given recent private investment in the sector. Construction activities for 2013 will remain substantial, due to large ongoing public infrastructure investments.
After a significant widening of Rwanda’s current account deficit in 2012 due to the sudden-stop in official transfers, the current account deficit is expected to narrow in 2013, owing to a resumption of aid flows. After deteriorating sharply to a record-high of 10.6percent of GDP in 2012, the current account deficit is expected to narrow to 8.5 percent in 2013, given the expectation that both the aid shortfall recorded in 2012, and the projected aid inflows in 2013, are disbursed during the 2013 calendar year.
Inflation prospects for 2013 are expected to be moderate, but a further depreciation of the Rwandan franc, coupled with rising public domestic borrowing present upside risks.8 Starting October 2012, import prices, especially international transportation prices, started to trend upwards and reached 3.2 percent in December 2012. This reflects the effect of a weakening currency that has started to affect prices which are denominated in US dollars, such as air tickets. Furthermore, the inflation rate is expected to rise, due to higher domestic borrowing to finance the FY2012/13 budget as well as higher international food and fuel prices. Unlike the situation in 2012, when fiscal policy responded by reducing fuel taxes, there is limited space for a policy response in the current environment, to limit the pass-through of international prices to consumers. Food inflation will need to be carefully monitored given that it has been in double digits during 2012, and is expected to continue its upward trend.
The continued uncertainty of donor disbursements clouds the economic outlook for Rwanda. The baseline projections are based on a shortfall of donor funds in 2012/13, of 25 percent, relative to the originally budgeted
8The Rwandan Authorities project inflation of 7.5 percent by the end of 2013.
Rwanda Ecomomic Update | Edition No. 4 25
Recent Economic Developments
amounts at the start of the fiscal year (that is, a shortfall of US$104.4 million, equivalent to 1.4 percent of GDP). However, there is a risk that a larger shortfall will eventuate in the current fiscal year. In such a scenario, public spending would need to be cut even further than projected, with related spillovers to the private sector. The current account would increase substantially,
with foreign exchange levels falling further, placing additional pressure on the exchange rate and inflation. The fall in growth would have serious implications for Rwanda’s development prospects. A more detailed analysis of how a potential aid reduction would be transmitted to the economy is presented in the following section.
1.6.3. Risk Scenario — How a large “aid shock” would affect the Rwandan economy
Rwanda’s dependence on aid makes it vulnerable to volatility in disbursements. As outlined in the previous sections, the recent cut in donor support is projected to have a sizeable impact on
the Rwandan economy. When considering the risks from an aid shortfall, it is important to not only understand the transmission channels, but also to quantify potential impacts. As shown in Figure 34, the transmission of an aid shortfall to the Rwandan economy will flow through several channels. The main impact on activity will come from a reduction in public spending, both directly and indirectly, through private sector spillovers. An aid shortfall will have several indirect impacts on economic growth, by reducing foreign reserves, depreciating the exchange rate and raising borrowing rates. The current account deficit will remain significantly in deficit and inflation will rise. An aid shortfall will also have dire consequences on the poor in Rwanda. Specifically, it is estimated that the recent achievements that Rwanda has made in terms of poverty reduction and social development indicators, will be severely impacted by an aid shortfall. In this section, World Bank staff present different scenarios of aid reductions and their potential impacts on both economic and social indicators.
Figure 34: Transmission Mechanisms of a Reduction in Aid to the Rwandan Economy
Fiscal Revenues(Grants)
Foreign currencyliquidity
Aid Transfer on current account
CurrentAccount Deficit
Supplement to Domestic
Savings
Pressure onExchange
Rate
ImportPrices
Inflation
Credit toPrivateSector
Stock ofMoney
Interest Rates
GPD Growth(Aggregate demand)
GovernmentSpending
GovernmentDomestic
Borrowing
Overall FiscalDeficit
Drop in ForeignAid
Source: World Bank staff.
Rwanda Ecomomic Update | Edition No. 4 26
Recent Economic Developments
To illustrate the potential impact of a shortfall in aid (i.e., a reduction in budget support grants), a ‘worse-case’ scenario was simulated and compared to the baseline scenario.
▪ Baseline scenario: This scenario is the central forecast presented in the outlook section. It simulates the impact of a 25 percent drop in the originally planned general or sector budget support during the FY2012/13 (that is, a shortfall equivalent to US$104.4 million or 1.4 percent of GDP). In addition to budget cuts in the revised budget, it is assumed that the government would further adjust its spending proportionally to this shortfall in aid, by cutting contingent items.
▪ Worse-case scenario: This scenario simulates the impact of an additional 25 percent shortfall relative to the baseline scenario. That is, under this scenario, the shortfall of aid in FY2012/13 would be equivalent to US$194 million or 2.6 percent of GDP. In response to this shortfall in aid, the government is assumed to cut contingency items proportionally to this shortfall in aid.
World Bank staff estimate a reduction in budget support equivalent to 1 percent of GDP would lead to a reduction in GDP growth
of about 0.7 percentage points. Under the baseline scenario, which already considers a 25 percent reduction in budget support in comparison to the budgeted amount, GDP growth is estimated at 7.0 percent in 2013, and the current account deficit is projected at 8.5 percent of GDP. However, under the worse-case scenario, an additional 25 percent reduction in budget support, in comparison to the baseline, will reduce GDP growth further by 0.8 percentage points, that is, from a GDP growth rate of 7.0 percent to 6.2 percent. Meanwhile, the current account deficit under the worse-case scenario is projected to widen to 9.5 percent of GDP, which is 1 percentage point higher than the baseline scenario (though a mild improvement relative to the record-high current account deficit recorded in 2012). As noted earlier, the current account deficit is expected to improve in 2013, because part of the aid that was expected to be disbursed 2012 is projected to be disbursed in 2013.
When undertaking any scenario analysis, a number of simplifying assumptions must be made. In particular, they do not project an impact on the fiscal deficit, given that it is expected that the Government of Rwanda will cut spending in proportion to any shortfall in aid, in order to maintain its target for the fiscal
Figure 35: The current account will remain at around historic highs under each scenario…(Current account deficit, percent of GDP)
-7.3
-11.4
-8.5-9.5
-12
-10
-8
-6
-4
-2
0Baseline Worse Case
2011 2012e 2013p
Source: World Bank staff estimates.
Figure 36: …with GDP growth slowing to the lowest rate since 2007 under the worse-case scenario(Annual real GDP growth, percent)
8.2 8.0
7.0
6.2
1.0
2.0
3.0
4.0
5.0
6.0
7.0
8.0
9.0
Baseline Worse Case
2011 2012e 2013p
Over the last decade, there has been a strong correlation between government expenditures and the evolution of social indicators. Between 2001 and 2011, government expenditures tripled in real terms. This was associated with:• A three-fold increase in primary school completion rates from 24 percent in 2001 to 78.6 percent in 2011.• A reduction in the fraction of people living in poverty from 59 percent in 2001 to 45 percent in 2011.
The close correlation between Government expenditures and social outcomes is both good and bad news. It is good as it would suggest that Government spending has been effective in improving the living standards at the household level. It is bad, since it would suggest progress in social indicators is vulnerable to shocks in the Government budget.
Based on the trends spanning the last decade, it is estimated that social indicators will evolve under two alternative scenarios: 1. The aid shortfall never happened (counterfactual scenario): Here it is assumed that the level of aid would
have remained at the levels projected before the suspension of aid to Rwanda in mid-2012 (in other words, donor disbursements would be the same as those projected in the original FY2012/13 budget), and as a result, government expenditures would not be affected;
2. Worst-case scenario: Here the impact of a 50 percent shortfall in budget support in the 2012/13 fiscal year is stimulated, equivalent to US$194 million; as a result of this aid shortfall, the government is assumed to reduce spending proportionally by cutting contingency items.
The poverty impact from a shortfall in aid would be significant. If the level of aid would have been the same as what was projected in the original FY2012/13 budget, it is estimated that the poverty rate would have declined from 44.9 percent in 2011 to 41.4 percent in 2013. However, under an alternative scenario, where budget support
Rwanda Ecomomic Update | Edition No. 4 27
Recent Economic Developments
balance. In other words, the government is expected to preserve macroeconomic stability. Similarly, the scenarios presented here assume only first-order effects. That is, second-round impacts on the exchange rate or inflation, which would in turn affect economic activities further, are not considered. To account for changes in the trade balance, it is assumed that cuts in capital expenditures would have an import content of investment of 50 percent. Given the importance of aid inflows in the process of money creation in Rwanda—e.g., aid inflows contributed to more than 80 percent of money creation over the last decade—the scenarios assume that a shortfall in aid will negatively affect private investment, through credit squeezing. Based on key findings from a recent Enterprise Survey conducted in Rwanda in 2011—the survey shows that only 24 percent of firms in Rwanda use banks to finance their investments, while 76.3 percent of firms finance their investment using internal resources—it is assumed that the elasticity between a shortfall in aid to a reduction in private investment, is equivalent to about 5.7 percent.
In addition to its macroeconomic impact, a shortfall in aid has the potential to significantly slow down the progress Rwanda has made over the past decade, in reducing poverty and improving the living conditions of its citizens. A major reason for the social gains has been government development spending. A range of social indicators, such as school completion rates, are highly correlated to real government expenditure. This close link highlights the vulnerability of Rwanda’s poverty goals to government spending. By using this relationship, it is estimated that aid shortfall will have an impact on social indicators. The analysis predicts that the poverty level by the end of 2013 would be 1.4 percentage points higher (relative to the baseline) in the event of an aid shortfall equivalent to a 50 percent reduction in budget support (2.6 percent of GDP). While this estimate may seem small in scale, it is estimated that approximately 150,000 people would be unable to escape poverty in 2013, a figure equivalent to more than the combined population of Rwanda’s secondary cities Musanze and Rubavu together (Box 8).
Box 8 Progress, Interrupted?Estimated social and poverty impacts of an aid shortfall to Rwanda
drops by 50 percent, it is estimated that the poverty rate would be 42.8 percent in 2013, that is, 1.4 percentage points higher than a situation without an aid shortfall (Figure 37).
Although this may seem like a small impact in relative terms, it would mean that almost 150,000 people who would have otherwise escaped poverty by the end of 2013, would remain trapped under the poverty line. To illustrate, this is more than the combined population of Rwanda’s secondary cities Musanze and Rubavu combined; it is also more than the total population of some small countries across the world.
An aid shortfallis also projected to have impact on primary school completion rates as shown in Figure 39. While in the absence of anaid shortfall completion rates were projected to attain almost 100 percent by 2013, under a worse-case scenario the aid shortfall could hold back the increase by over 5 percentage points.
It should be noted that the simulations assume that the correlations between social indicators and government expenditure represent causal relationships. In reality, the improvements in social indicators have resulted from a complex set of interactions between government programs, GDP growth, and other factors, and there is a considerable level of uncertainty, as to the nature of that relationship. The analysis presented here should only be viewed as broad indicatives of the potential order of magnitude, of the effect of a drop in external assistance. Nevertheless, it is clear that a shortfall of budget support can substantially slow down Rwanda’s recent progress in social indicators.
Source: World Bank staff.
Rwanda Ecomomic Update | Edition No. 4 28
Recent Economic Developments
Figure 38: This would imply that more than 150,000 peoplein Rwanda will not be able to escape poverty by 2013relative to a situation in which the aid shortfall would nothave taken place(Estimated number of people living below the poverty line,thousands)
No Aid Crisis Worst-case scenario
4,731
4,615
4,476
84
150
4,200
4,400
4,600
4,800
2011 2012 2013
Source: World Bank staff estimates based on the EICV3.
Figure 39: An Aid Shortfall Could Significantly Delay theAttainment of Universal Primary Education(Estimated primary education attainment, percent)
Worst-case scenario No Aid Crisis
80.4
94.5
78.6
5.1
5.5
50
60
70
80
90
100
2011 2012 2013
Source: World Bank staff estimates based on the EICV3.
Figure 37: An aid shortfall of 50 percent in budgetsupport in FY2012/13 could hold back poverty reductionby 1.4 percentage points by 2013(Estimated headcount poverty rates in Rwanda, 2011-2013)
No Aid Crisis Worst Case Scenario
44.943.8
41.4
0.8
1.4
35
37
39
41
43
45
47
2011 2012 2013
Source: World Bank staff estimates based on the EICV3.
Focus Section: Rwanda’s Pathway Out of PovertyPART TWO
Rwanda Ecomomic Update | Edition No. 4 30
Rwanda’s Pathway Out of Poverty
2.1. Introduction
This Fourth Edition of the Rwanda Economic Update focuses on the improvements in
household living standards and the reduction in poverty, associated with Rwanda’s recent strong growth performance. Between 2001 and 2011, Rwanda averaged an annual growth rate of above 8 percent, and GDP grew by 60 percent in real terms. The strong macroeconomic growth performance was accompanied by substantial improvements in living standards, as witnessed by the two-thirds drop in child mortality, and the attainment of near-universal primary school enrolment. Household consumption grew rapidly, resulting in the poverty headcount falling from 59 percent in 2001 to 45 percent in 2011. Growth in Rwanda over the past decade has been pro-poor, with relatively larger consumption gains for the poor than for the non-poor. Inequality dropped as a result, albeit slightly. However, in the capital of Kigali, inequality increased during the 2000s, due to slow growth of the Kigali middle class. Overall, despite the high rate of poverty reduction and pro-poor growth, high population growth meant that the absolute number of poor in Rwanda only decreased by 1 percent.
Agriculture has been the main driver of growth and poverty reduction in Rwanda, significantly lifting rural households out of poverty. Although the share of agriculture in GDP decreased significantly over the past decade, agriculture remains the backbone of the Rwandan economy, in terms of employment and income-generation for the majority of households. Driven by increased investments in agricultural inputs, land consolidation and infrastructure, agricultural production at household level more than doubled between 2001 and 2011. Together with increased commercialization, reflected in the rising share of harvests being sold in local markets, the increase in production accounted for up to one-third of the growth of rural consumption over the past decade.
Rwandan households have diversified their income portfolios by taking up non-farm activities, in addition to their agriculture
activities. The percentage of households with at least one non-farm activity more than doubled from 30 percent in 2001 to 70 percent in 2011. This is true for both self-employment and wage employment. As a result, the average number of income sources of Rwandan households has increased sharply. The observed diversification had two positive effects. First, diversification has reduced income risk inherent to engaging in rain-fed agriculture as households now have other income activities to cushion a potential shock. Second, diversification also explains the rise in consumption, among both the rural and urban poor. Taking up non-farm self-employment in small informal households businesses have been particularly important for rural households, and the move has emerged as the single main driver of household consumption growth in Kigali.
The rapid fall in fertility rates in Rwanda over the past decade has reduced the nation’s average family size. This has significantly brought down the child dependency ratio—the number of economically dependent children for each working-age adult in the household—which has been associated with increased disposable income, both in Kigali and in the rural areas. Decreased dependency ratios have especially benefited the households in the middle of the income distribution, who experienced the largest relative fertility declines. Population projections show that Rwanda has entered the third phase of the demographic transition, which could spur future growth if the economy is able to absorb the bulge in working-age adults.
The results of the analysis suggest that if Rwanda can sustain increases in agricultural productivity over the medium term, poverty will continue to fall, especially if business activities increase along with the boom in agriculture. Since virtually all of Rwanda’s poor depend on agriculture to generate income, scaling up agricultural intensification and commercialization will be the quickest way to get significant numbers of people out of poverty. Currently, the Government’s and development
Rwanda Ecomomic Update | Edition No. 4 31
Rwanda’s Pathway Out of Poverty
partners’ main agricultural programs cover only a small part of available land, which means that there is an opportunity to expand them, and significantly reduce poverty. The Government should link the scaling up of agricultural programs with the promotion and facilitation of business activities, that can thrive on increased agricultural production, especially those related to trade, post-harvest storage and processing.
This special focus proceeds as follows. Section 2 uses data from three integrated household living standards surveys (implemented in 2000/1, 2005/6 and 2010/11) to paint a detailed picture of the evolution of poverty and inequality in Rwanda between 2001 and
2011. This section also elaborates on the different performance in terms of growth and poverty reduction in the first half of the previous decade (2001 to 2006), compared to the second half (2006 to 2011). In section 3, attempts will be made to explain the observed consumption growth and poverty reduction, by focusing on three key evolutions during the past decade: the boom in agriculture, increased diversification into non-farm activities and the changing demographic composition of Rwandan households. The first subsection of Section 3 sketches these evolutions, while the second subsection examines if, and to what extent, they have been associated with the improvements in living standards, followed by the conclusion in the final section.
2.2. A Decade of Growth and Poverty Reduction9
Household consumption in Rwanda increased by 28 percent in real terms over the past decade, resulting in a drop of 14 percentage points in the poverty headcount, from 59 percent in 2001
to 45 percent in 2011.In 2011, the average adult in Rwanda lived on US$2.5 a day, with a significant disparity between Kigali (US$7.6)and the rest of the country (US$1.9).10 Consumption growth over the past decade has been higher for poor households than for non-poor households, resulting in a decrease in inequality. However, in Kigali, inequality slightly increased over the past decade due to slow growth of the middle class, compared to the growth recorded by both the poor and the rich. Despite the impressive reduction in the poverty headcount, the number of people in Rwanda who live in poverty declined by only 1 percent, due to high population growth.
2.2.1. Strong Household Consumption growth and Poverty Reduction
The solid GDP growth in the last decade was associated with a substantial increase in
average household consumption as measured by the household living standards surveys (EICV). Total household consumption expenditures per adult equivalent recorded an increase of 28 percent between 2001 and 2011, translating into an annual growth rate of 2.5 percent. While the average household spent Rwf210,000 per adult
per year in 2001, this had risen to 270,000 in 201111. Consumption growth was a little lower in Kigali (27 percent) than in the rest of the country (30 percent)12. Despite the slower growth in Kigali, average consumption in 2011 was still almost four times higher in Kigali (Rwf826,000) than in the rest of the country (Rwf212,000—Table 5).
The growth in household consumption translated into impressive poverty reduction. Poverty headcount—the share of the national population living below the national poverty line
9A number of figures in this special focus are different from the numbers mentioned in the 2012 official Poverty Report (Republic of Rwanda, 2012). This can be explained by our different treatment of outliers.
10Based on the 2011 Purchasing Power Parity exchange rate of $1=Rwf297.1 (IMF, 2013).11Expenditures are expressed in constant 2011 prices.12Throughout this special focus we maintain the distinction between Kigali and the “Rest of the Country”. Although it would be more straightforward
to use the urban-rural distinction, the reclassification of enumeration areas following the 2002 census meant that some enumeration areas that were rural in the 2001 survey were classified as urban following the 2002 census. This implies that the urban-rural classifications in the 2001 and 2011 EICVs are not comparable and would lead to misleading representations. As a result, we use the distinction between Kigali and the Rest of the Country (which corresponds closely to the urban-rural difference).
(Box 9)—dropped from 59 percent at the start of the decade to 45 percent in 2011. In Kigali, home to 10 percent of Rwanda’s population poverty levels decreased by six percentage points, from 22.7 percent in 2001 to 16.8 percent in 2011. Starting from a much higher base, the rest of the country experienced a 15 percentage point drop in poverty (Table 5). Despite the slower growth recorded in Kigali, poverty reduction was relatively higher in Kigali than in the rest of the country: While poverty levels in Kigali decreased by 26 percent, in the rest of the country it decreased by 24 percent. This can be explained by the fact that the poor in Kigali were located closer to the poverty line than the poor in the rural areas, and hence, needed to grow less to cross the poverty line.
Despite the strong poverty reduction over the last decade, poverty was relatively irresponsive to growth. While consumption increased by 28 percent, poverty levels decreased by 24 percent, resulting in a growth-elasticity of poverty of -0.82. The growth elasticity of poverty measures the percentage change in the poverty headcount for each percentage change in consumption. Over the past decade, a 1 percent increase in average household consumption was associated with a 0.8 percent decrease in the poverty headcount,
which compares poorly with an estimated average global elasticity of -2 (Ravallion, 2001 and 2004).14 For the sake of comparison, Figure 6 shows the growth elasticity of poverty in a selection of countries for the decade between
Table 6: Growth in Rwanda was Pro-Poor but Poverty was relatively Inelastic to Growth(Rate of Pro-Poor Growth and Growth Elasticity of Poverty in a Selection of Countries)
Source: World Bank, 2005 .
Country Rate of Pro-Poor
Growth (%)
Growth Elasticity of
Poverty
Vietnam 4.3 -1.41
El Salvador 4.1 -1.04
Brazil 3.2 -0.78
Rwanda 3.1 -0.82
Uganda 2.7 -1.04
Ghana 2.1 -1.19
Bolivia 1.9 -0.73
Senegal 1.8 -0.95
India 1.2 -2.38
Tunisia 1.2 -1.79
Burkina Faso 1.0 -2.00
Bangladesh 0.7 -1.56
Romania -2.6 -2.03
Rwanda Ecomomic Update | Edition No. 4 32
Rwanda’s Pathway Out of Poverty
Table 5: Solid Household Consumption Growth and Poverty Reduction Between 2001 and 2011(Consumption per Adult Equivalent in 2011 Prices and Percentage of Population Below the Poverty Line, 2001-2011)
Source: EICV1 and EICV3.
Consumption per AE Poverty Headcount
2001 2011 2001 2011
Kigali 660,112 825,927 22.7 16.8
Rest of Country 162,844 211,625 63 47.8
Rwanda 210,043 270,921 58.9 44.9
To measure the incidence of poverty, Rwanda uses an absolute poverty line defined as a minimum food consumption basket that offers the required number of calories for a Rwandan adult involved in physically demanding work. The cost of this minimum food basket is the food poverty line, also called the extreme poverty line, and amounts to Rwf83,000 per adult per year in 2011 prices (about US$0.81 per adult per day). When augmented with an allowance for basic non-food consumption, the overall poverty line equals Rwf118,000 (about US$1.09 per adult per day). When referring to the “poor”, reference is made to people living in households with per adult equivalent expenditures below this amount13
Box 9 The Cost of Basic NeedsRwanda’s Poverty Line
Source: World Bank staff
13Conversions to US$ use the 2011 Purchasing Power Parity exchange rate of US$1=Rwf297.1 (IMF, 2012).14It is worth noting that the estimates of growth-elasticity of poverty can be sensitive to initial levels of GDP or consumption. For instance, at
a lower initial level of GDP, smaller absolute changes lead to higher growth rates; similarly if the initial poverty level is high (i.e., the initial average consumption level is low), smaller absolute changeslead to lower percentage changes. This means that if the initial level of GDP or consumption is low, the growth-elasticity of poverty can be underestimated.
Rwanda Ecomomic Update | Edition No. 4 33
Rwanda’s Pathway Out of Poverty
the early 1990s and the early 2000s. Only two countries in the table had growth elasticities lower than Rwanda’s over the past decade (the high inequality countries of Bolivia and Brazil). If Rwanda had had the growth elasticity of Ghana during the 1990s (-1.19), poverty headcount would have dropped by 20 percentage points, instead of the observed 14 percentage points.High population growth during the past decade meant that the absolute number of people
living in poverty only declined marginally, despite a large drop in the poverty headcount. The absolute number of people living below the poverty line increased from 4.79 million in 2001 to 5.26 million in 2006, and fell back to 4.73 million in 2011 (Figure 40 and Figure 41). While poverty headcount dropped by 24 percent between 2001 and 2011, the number of people living in poverty dropped by only 1 percent (Box 10).
Figure 40: The Percentage of people Below the Poverty LineSharply Decreased(Percentage of People Below the Poverty Line)
5957
45
40
50
60
70
2001 2006 2011
Source: EICV1, EICV2, EICV3, 2002 Census, 2012 Census and World Bank Calculations.
Figure 41: Though the Absolute Number of People inPoverty Declined only Marginally due to Population Growth(Number of people Below and Above the Poverty Line, ‘000)
4,788 5,259 4,731
3,3413,983
5,806
0
2,000
4,000
6,000
8,000
10,000
12,000
2001 2006 2011
Below Poverty Line ('000) Above Poverty Line ('000)
2.2.2. Absolute Gains for Everyone, but Largest for the Very poor and the Very Rich
Figure 42 summarizes average growth rates in consumption at every percentile of the
distribution. As can illustrated in the Figure titled the “growth-incidence curve”, the average growth rate is positive at every percentile, indicating a net gain in consumption between 2001 and 2011 in all wealth categories. From the shape of the curve, it is illustrated that average growth rates were highest for the poorest households (left-hand side of the figure) before dropping to about three percent at approximately the 25th percentile. The mean growth rate remained at three percent until the 35th percentile, after which it dropped and oscillated around 2.5 percent until the 90th percentile. At the top end of the distribution, mean growth rates increased again.
Figure 42: The Poor Grew Faster than the Non-Poor Between 2001 and 2011(Growth-Incidence Curve for Rwanda, 2001-2011)
2000/01 Poverty Headcount
Poor Households Wealthier Households2
3
4
5
6
Annu
al g
row
th in
cons
umpti
on (2
000/
01-2
010/
11)
0 20 40 60 80 100Percentiles of Consumption (2000/01)
Source: EICV1 and EICV3.
Rwanda Ecomomic Update | Edition No. 4 34
Rwanda’s Pathway Out of Poverty
Source: World Bank staff.
The 2012 Population and Housing Census put Rwanda’s population at 10.5 million, up from 8.1 million in 2002. The annual population growth rate of 2.6 percent is short of the annual pace of poverty reduction of 2.7 percent. As a result, the absolute number of people living in poverty (which combines the poverty headcount with population figures) declined by only 1 percent between 2001 and 2011, despite the 14 percentage point reduction in the poverty headcount (Figure 40).
The small drop in the number of people living below the poverty line can almost entirely be accounted for by the Northern Province. While the number of people living in poverty increased in the Southern and Eastern Provinces and Kigali, it dropped by 26 percent in the Northern Province (Figure 43). Not only did the Northern Province have the strongest pace of poverty reduction in all regions (annual drop of 4 percent compared to 2.7 percent globally), but it also had the slowest population growth (annual growth rate of 1 percent compared to 2.6 percent globally). The net result was a drop in the number of people below the poverty line from 1 million in 2001 to 0.74 million in 2011.
Table 7 shows the relationship between population growth, the rate of poverty reduction and the percentage change in the number of people below the poverty line. The absolute number of poor people increased in regions where the rate of population growth was higher than the rate of poverty reduction. The two regions with the largest increase in the absolute number of poor (Eastern Province and Kigali) are the regions with the highest population growth rates: 4.3 percent for Eastern province and 4.0 percent for Kigali. These two regions had the highest rate of poverty reduction in the early 2000s, which probably explains why to some extent, their high population growth was due to the influx of people from other regions (Table 7).
Despite the stagnation in the number of people living in poverty, there is hope on the horizon. If current trends in poverty reduction persist, there will likely be a substantial drop in the absolute number of poor over the next ten years. Data from the 2005 and 2010 Demographic and Health Surveys showed that total fertility rates are fast dropping from 6.1 in 2005 to 4.6 in 2010. This drop in fertility combined with strong reduction in the poverty headcount will—if sustained—translate to sharply falling poverty numbers, over the coming decades.
Box 10 Relatively Better than AbsoluteAbsolute Number of Poor Fell Only Slightly Due to High Population Growth
Figure 43: Only Two Regions Experienced a Drop in theNumber of Poor(The Absolute Number of Poor by Region, ‘000)
174
1,00
2
1,00
8
1,34
8
1,27
3
191
740
1,10
8
1,46
6
1,19
9
0
200
400
600
800
1,000
1,200
1,400
1,600
Kigali City Northern Province
Eastern Province
Southern Province
Western Province
2001 2011
Source: EICV1, EICV3, 2002 Census, 2012 Census.
Table 7: The Number of People in Poverty Decreased in the Regions With Below Average Population Growth(Population growth, Reduction in Headcount Poverty and The Change in the Number of People Below the Poverty Line)
Source: EICV1, EICV3, 2002 Census, 2012 Census
Region Annual Population Growth (percent)
Annual Pace of Reduction in the Poverty
Headcount (percent)
Percentage Change in # of People below Poverty
LineKigali 4.0 3.0 9.8
Northern Province 1.0 4.0 -26.1
Eastern Province 4.3 3.3 9.9
Southern Province 2.3 1.5 8.7
Western Province 1.9 2.5 -5.8
Rwanda Ecomomic Update | Edition No. 4 35
Rwanda’s Pathway Out of Poverty
Poor households recorded on average higher growth rates between 2001 and 2011 compared to better-off households. Casual examination of the growth-incidence curve suggests that averagegrowth rates for the households to the left of the vertical red line were on average higher than those to the right of the vertical line. The vertical red line depicts the poverty headcount in 2001. The average growth rate for the poor households amounted to 3.1 percent, which is higher than the 2.9 percent growth rate for the whole distribution. The rate of pro-poor growth, which Ravallion and Chen (2003) define as the average growth rate for the poor, amounted to 3.1 percent per annum between 2001 and 2011 (Box 11). Table 6 compares Rwanda’s rate of pro-poor growth with that of 12 other countries. Only three of the 12 countries have higher rates of pro-poor growth than Rwanda, highlighting Rwanda’s strong performance in shared growth.
The pro-poor nature of growth between 2001 and 2011 can entirely be accounted for by the exceptionally strong growth rates for the extremely poor. The average growth rate of the bottom 20 percent of the distribution amounted to 3.7 percent per annum, and was substantially
higher than the overall average growth rate of 2.9 percent. Beyond this, mean growth rates for the poor are actually lower than those for the non-poor. This pattern may reflect the impact of the policies that were adopted in Rwanda’s Second Poverty Reduction Strategy (EDPRS), which put an emphasis on reducing extreme poverty, through investments in agriculture and social protection.
The distribution of growth was different in Kigali than in the rest of the country. The growth-incidence curve for Kigali shows a clear U-shaped pattern, with strong growth for the very poor and in particular the very rich (Figure 44). The urban “middle class”, the part of the distribution roughly between the 40th and the 80th percentile recorded relatively slow growth, with mean growth rates of between 1 and 2.5 percent per annum (except for a peak around the 75th percentile). The growth-incidence curve for the rest of the country mirrors that for Rwanda as a whole, with a U-shaped pattern that is less pronounced than in Kigali (Figure 45)15. The rate of pro-poor growth was higher in the rest of the country (3.1 percent per annum) than in Kigali (2.7 percent per annum).
Figure 44: High Growth for the Very Poor and Very Rich in Kigali(Growth-Incidence Curve for Kigali, 2001-2011)
EICV1 Kigali Poverty Headcount
Poor Households Wealthier Households0
1
2
3
4
5
6
Annu
el m
ean
grow
th ra
te in
con
sum
ption
0 20 40 60 80 100Percentiles of Consumption (2000/01)
Source: EICV1 and EICV3.
Figure 45: Strong Growth for the Extremely Poor in the Rest of the Country(Growth-Incidence Curve for the Rest of the Country, 2001-2011)
EICV1 Poverty Headcount (without Kigali)
Poor Households Wealthier Households0
1
2
3
4
5
6
Annu
al m
ean
grow
th ra
te in
cons
umpti
on
0 20 40 60 80 100Percentiles of Consumption (2000/01)
Source: EICV1 and EICV3.
15Given that the rest of the country accounts for 90 percent of Rwanda’s population, the growth pattern for Rwanda as a whole will always mirror that of the rest of the country.
Rwanda Ecomomic Update | Edition No. 4 36
Rwanda’s Pathway Out of Poverty
There are two frequently used definitions of pro-poor growth. According to the first definition, growth is pro-poor if it benefits the poor more than it does the non-poor (Baulch and McCullock, 2000; Kakawani and Pernia, 2000). According to the second definition growth is pro-poor if it reduces poverty (Ravallion and Chen, 2003).
It is obvious that the first definition is more stringent than the second. Even if growth rates for the poor are high, the first definition will not consider this pro-poor if growth rates for the non-poor are higher. In contrast, the second definition will consider growth pro-poor if growth rates for the poor are strictly positive, regardless of the growth rates for the non-poor. In terms of inequality, the first definition requires falling inequality for growth to be considered pro-poor. Using the second definition pro-poor growth may well increase inequality, depending on the growth rates for the non-poor. Rwanda’s growth performance between 2001 and 2011 was pro-poor according to both definitions: It reduced poverty and benefited the poor more than the non-poor (reduced inequality).
Box 11 Sharing is CaringThe Definition of Pro-Poor Growth
Source: World Bank staff.
2.2.3. A Small Decrease in Inequality and a Relative Loss for the Middle Class in Kigali
The pattern of growth between 2001 and 2011 has mainly benefited the very poor.
The higher growth rates for the poor resulted in a declining share of total consumption for the top end of the distribution. Figure 46 shows the consumption shares of the poorest households between 2001 and 2011. The consumption share of the poorest 10 percent of households decreased from 1.9 percent in 2001 to 1.8 percent in 2006, but increased to 2.2 percent in 2011 (EICV3), higher than the share in 2001. In a similar fashion, the consumption share of the bottom 20 percent of household declined fast, from 4.8 percent in 2001 to 4.7 percent in 2006, and then increased substantially to end the decade, higher than it started (5.4 percent).
Focusing on the other end of the distribution, the exact opposite pattern is established. The consumption share of the richest 10 percent increased between 2001 (42.8 percent) and 2006 (44.7 percent) but fell back to 42 percent by 2011, still high but lower than the share at the start of the decade. A similar pattern is observed for the richest 20 percent, who saw
their consumption share decrease from 56.8 percent in 2001 to 55.9 percent in 2011. While the consumption share of the households in the middle (defined as the households between the 40th and the 80th percentile (Box 12) remained stable at the national level (30.1 percent in 2001 and 2011), the consumption share of the middle class dropped in Kigali: from 31.3 percent in 2001 to 28.3 percent in 2006, and 29.7 percent in 2011, recording a drop of 1.6 percentage points over the decade (Figure 47).
Figure 46: The Consumption Share of the Poorest 10% and20% Increased Between 2001 and 2011Share of Total Consumption of the Poorest 10 and 20 percent of the Population, 2001-2006-2011)
1.9 1.82.2
4.74.85.4
0
1
2
3
4
5
6
2001 2006 2011
Bottom 10% Bottom 20%
Source: EICV1, EICV2 and EICV3.
Rwanda Ecomomic Update | Edition No. 4 37
Rwanda’s Pathway Out of Poverty
The higher consumption shares of the poor resulted in a decrease in inequality, especially among the poor. Inequality as measured by the Gini coefficient increased between 2001 and 2006, but fell back to 0.490 in 2011, lower than the 2001 level (0.507-Figure 48). The Atkinson index of inequality, which is more sensitive to inequality among the poor, shows a larger drop from 0.52 in 2001 to 0.48 in 201116. A more thorough examination of inequality confirms that the drop in the Gini is entirely due to decreasing
inequality among the poor: While inequality among the poor decreased from 0.21 in 2001 to 0.16 in 2011, inequality among the non-poor remained stable at 0.46. In line with the loss of consumption share of the middle class (Box 12), inequality in Kigali was a little higher in 2011 (0.57) than in 2001 (0.56).
Given the small decrease in inequality, almost all of the poverty reduction in Rwanda between 2001 and 2011 can be accounted for by the
Figure 47: Falling Consumption Shares of the WealthiestGroups and of the Kigali Middle Class(Share of Total Consumption of the Wealthiest 10 percent and 20 percent of households and of The Middle Class in Kigali)
42.844.7
42
56.8 58.455.9
31.328.3 29.7
20
25
30
35
40
45
50
55
60
65
2001 2006 2011
Top 10% Top 20% Kigali Middle Class
Figure 48: Decrease in Inequality, Particularly Among the Poor(Gini Coefficient and Atkinson Coefficient of Inequality, 2001-2006-2011)
0.507
0.522
0.49
0.52
0.534
0.48
0.45
0.46
0.47
0.48
0.49
0.50
0.51
0.52
0.53
0.54
2001 2006 2011
The Gini Coefficient The Atkinson (2) Index
In contrast to poverty, there is no widely accepted definition of what constitutes the middle class. In this study, the middle class is defined as those households with per adult equivalent consumption expenditures of between the 40th and 80th percentile (located roughly in the middle of the consumption distribution). This corresponds quite well to the demarcation of the middle class used in other studies. In 2011, the households between the 40th and 80th percentile had daily per adult equivalent expenditures of between US$2.7 and US$9.1. For the sake of comparison, Banerjee and Duflo (2008) use two definitions of the middle class, ranging from US$2 to US$4 per capita per day for the lower middle class and US$6 to US$10 for the upper middle class. Easterly (2001) defines the middle class as those lying between the 20th and 80th percentile, but given that the daily consumption of the 20th percentile in the Rwanda data amounted to only US$1.5 in 2011, and these households cannot be considered as middle class.
The average consumption of the middle class in Kigali has grown substantially over the past decade, from US$4.2 per adult equivalent per day in 2001 to 5.1 in 2011 (in 2011 PPP prices). The consumption of the poor, and especially the rich, has grown even faster, resulting in a lower consumption share for the middle class. The share of consumption accounted for by the richest 10 percent of households in Kigali, has increased from 43 percent in 2001 to 45 percent in 2011. This explains the increase in the Kigali Gini coefficient between 2001 and 2011, given that the Gini is particularly sensitive to changes in the middle of the distribution. Consequently, the consumption ratios of both the very poor and the very rich relative to the middle have increased: Consumption of the bottom 10 percent was 0.26 times that of the middle in 2001 and increased to 0.3 in 2011. Similarly, consumption of the top 10 percent was 3.7 times that of the middle in 2001 and increased to 4.3 in 2011.
Box 12 Kigali’s Missing MiddleA Falling Consumption Share for the Middle Class in Kigali
Source: World Bank staff.
Source: EICV1, EICV2 and EICV3.
16In order to calculate the Atkinson index, the inequality aversion parameter was set at 2.
growth in consumption. Of the 14 percentage point reduction in poverty, 98.7 percent can be explained by growth in mean consumption expenditures, and 1.3 percent by redistribution in favor of the poor (the decrease in inequality). In Kigali the increase in inequality held back poverty reduction: While poverty fell by six percentage points in Kigali, it would have fallen by 7.8 percentage points if inequality had not changed.
2.2.4. Poverty Still High, Though Depth and Severity are Decreasing
Despite the large reduction in poverty over the past ten years, poverty remains
pervasive. 45 percent of Rwandans still live below the poverty line and 24 percent cannot meet their most basic food needs. The poor are however on the move. Average consumption of the poor increased by 15 percent between 2001 and 2011, bringing the poor closer to the poverty line (Figure 49). In 2001, the median distance from the poverty line amounted to 41 percent (of the poverty line’s value), indicating that the poor were on average still located far from the poverty line. In 2011, the median distance had decreased to 30 percent.
Given that the poor are now clustered closer to the poverty line, there is scope for rapid poverty reduction in the coming years, if
growth is sustained. In 2011, 15 percent of the poor were located within 10 percent of the poverty line, compared to 9 percent in 2001. These people need only a small push to be able to move out of poverty. Similarly, the fraction of poor located within 20 percent of the poverty line increased from 20 percent in 2001 to 30 percent in 2011. Equally important, the fraction of poor located more than 50 percent away from the poverty line has fallen from 38 percent in 2001 to 22 percent in 2011. All of this means that poverty, although still pervasive, is becoming less deep and severe, and that prospects for further poverty reduction look promising.
Rwanda Ecomomic Update | Edition No. 4 38
Rwanda’s Pathway Out of Poverty
Figure 49: The Poor Have Moved Closer the Poverty Line between 2001 and 2011(Kernel Density Estimation of Household Consumption, 2000 and 2011)
2.3. Different Patterns in Both Parts of the Decade
The strong reduction in poverty over the past decade can largely be attributed to the performance during the last five years. In the first half of the previous decade, household consumption grew at
two percent per year, but this growth did not translate into significant poverty reduction. However, between 2006 and 2011, consumption growth of three percent per year translated into a reduction in poverty by 12 percentage points. The difference between the two sub-periods can be explained by changes in the patterns of growth, between and within rural and urban areas. First, while growth in the first half of the decade was concentrated in Kigali, where only a marginal fraction of Rwanda’s poor live, growth in the last five years was largely concentrated in rural areas. Second, while growth was pro-rich in the first half of the decade, holding back poverty reduction and increasing inequality, growth in the second half of the decade disproportionally benefited the poor. This led to a substantial decrease in inequality which provided an extra boost to poverty reduction. The absolute number of people living in poverty decreased by over half a million, during the second half of the decade.
Rwanda Ecomomic Update | Edition No. 4 39
Rwanda’s Pathway Out of Poverty
The graphs in the preceding sections suggest a different pattern of growth and inequality in
the first and in the second halve of the decade. Figure 46 and Figure 47 show that consumption shares of the poorest households decreased between 2001 and 2006, while the shares of the wealthiest households increased, resulting in a rise in inequality (Figure 48). However, between 2006 and 2011, the consumption share of the wealthiest fell back to below the 2001 level, while the share of the poorest quintile rose quite substantially (by 15 percent) to end the decade, higher than where it started.
Figure 50 and Figure 51 confirm that the patterns of growth differed substantially between the first and second halves of the previous decade. Between 2001 and 2006, consumption growth was higher for the non-poor, than for the poor households (Figure 50). The richest households grew particularly fast during this period. The growth pattern in the second half of the decade is almost the exact mirror-image: Growth was higher for poor households than for non-poor households and was particularly strong for the extremely poor: Average growth per annum for the poorest 20 percent of households amounted to 6.2 percent between 2006 and 2011 (Figure 51). In this subsection the different patterns in both sub-periods are explored.
Between 2001 and 2006 consumption expenditures per adult equivalent grew
at a respectable rate of 2 percent per annum. However, poverty headcount dropped by only two percentage points (from 58.9 percent to 56.9 percent). Growth and poverty reduction were stronger in Kigali than in the rest of the country (Annex Table 2). Consumption grew at an annual rate of 3.1 percent in Kigali, compared to 2.2 percent in the rest of the country. In relative terms, poverty reduction was twice as strong in Kigali (reduction of 8.4 percent) than in the other areas (reduction of 4.4 percent).
Household consumption growth between 2001 and 2006 was pro-rich. The growth-incidence curve (Figure 50) shows that the average growth rates were higher for the non-poor (to the right of the vertical line) than for the poor, resulting in an increase in inequality. The increase in inequality negatively affected poverty reduction: Poverty would have decreased by 5.3 percentage points instead of the 2 percentage points—actually observed—if inequality had not changed. The pattern of growth in this period was different in Kigali than in the rural areas: While growth in Kigali was pro-poor, growth in the rural areas disproportionally benefited the wealthier households (Annex Figure 3).
Figure 50: The Non-Poor Grew Faster than the Poorbetween 2001 and 2006…(Growth-Incidence Curve for Rwanda, 2001-2006)
2001 Poverty Headcount
Poor Households Wealthier Households0
1
2
3
4
5
6
7
8
9
10
Mea
n gr
owth
rate
in co
nsum
ption
(200
1-20
06)
0 20 40 60 80 100Percentiles of Consumption (2000/01)
Source: EICV1 and EICV2.
Figure 51: While the Poor Grew Faster than the Non-Poorbetween 2006 and 2011Growth-Incidence Curve for Rwanda, 2006-2011)
2006 Poverty Headcount
Poor Households Wealthier Households0
1
2
3
4
5
6
7
8
9
10
Annu
al G
row
th in
Con
sum
ption
(%)
0 20 40 60 80 100Consumption Percentiles
Source: EICV1 and EICV2.
Rwanda Ecomomic Update | Edition No. 4 40
Rwanda’s Pathway Out of Poverty
Taken together, the disappointing performance in terms of poverty reduction in the first half of the decade was related to the urban-rural difference in both the magnitude and the distribution of growth. Growth in Kigali was strong and pro-poor but only benefited a marginal fraction of the poor (in 2001 Kigali accounted for only 3.9 percent of the national poor). Outside Kigali, where over 96 percent of the poor lived, growth was slow and pro-rich. The net result was weak poverty reduction, despite moderate consumption growth.
Despite the marginal reduction in poverty headcount between 2001 and 2006, the living standards of the poor increased, albeit slightly. Average consumption of the poor increased by slightly more than 6 percent, during the first half of the decade. The main effect of growth between 2001 and 2006 is that it brought poor households closer to the poverty line, paving the way for the strong poverty reduction in the subsequent five years. As shown in Figure 52, the distribution of consumption for the poor clearly shifted towards the poverty line between 2001 (blue curve in Figure 52) and 2006 (red curve).
2.3.2. 2006-2011: Strong Growth, Decreasing Inequality and Impressive Poverty Reduction
Between 2006 and 2011 consumption grew at a rate of 3 percent per annum, compared
to 2 percent in the previous five years. During the same period poverty decreased at an annual rate of 4.6 percent, resulting in an impressive 12 percentage point drop in poverty headcount. In contrast to the first half of the decade, consumption growth between 2006 and 2011 was higher in areas outside Kigali (3.1 percent per annum) than in Kigali (1.9 percent per annum; Annex Table 3).
Consumption growth between 2006 and 2011 was pro-poor. The growth-incidence curve in Figure 51 is downward-sloping, with higher average growth rates for the poor. The decrease in inequality during the second halve of the decade, gave an
extra boost to poverty reduction. Consumption growth alone accounted for 8.5 percentage points (71 percent) of the 12 percentage point reduction in poverty, while the decrease in inequality added another 3.5 percentage points (29 percent).
The extent to which poverty responded to growth in consumption was radically different in the first than in the second half of the decade. Between 2001 and 2006 a 10 percent increase in consumption was associated with a three
percent decrease in poverty, translating into an exceptionally low elasticity of -0.32, lower than any elasticity listed in Table 6. However, in the second half of the decade, poverty decreased by 21 percent, following a 17 percent increase in consumption. The resulting elasticity of -1.25 is almost four times higher than the one in the first half of the decade.
In sum, the different poverty performance between the first and second halves of the decade can largely be explained by differences in the magnitude and nature of growth. The first half of the decade (2001-2006) was characterized by high growth in Kigali and low pro-rich growth in the rest of the country, leading to an increase in inequality and modest poverty reduction. The second half of the decade (2006-
Figure 52: The Consumption of the Poor Moved closer tothe Poverty Line Between 2001 and 2006(Kernel density Estimation of Poor Households’ Consumption, 2001 and 2006)
Poverty LineDe
nsity
0 20000 40000 60000 80000
Yearly per Adult Equivalent Consumption Expenditures (2001 RwF)
Consumption of the Poor, 2001 Consumption of the Poor, 2006
Kernel Density Estimation of Poor Households' Consumption, 2001 and 2006
Source: EICV1 and EICV2.
Rwanda Ecomomic Update | Edition No. 4 41
Rwanda’s Pathway Out of Poverty
2011) experienced higher overall growth, mainly concentrated in rural areas, and recorded an exceptionally strong growth rate for the poor, in particular, the extremely poor. The net result is a decade of strong growth and poverty reduction, during which welfare gains were realized at each point in the distribution and were relatively higher for the poor.
It is worth mentioning that the two sub-periods largely coincide with Rwanda’s two latest poverty reduction strategies. The first Poverty Reduction Strategy (PRSP I) was implemented from 2002 to 2005 and focused largely on the transitional period of rehabilitation and reconstruction, which may explain the higher growth rate in Kigali during this period. Though progress had been made during
PRSP I, assessments showed that productive sectors, in particular agriculture, infrastructure and the private sector, were lagging behind in terms of performance (Republic of Rwanda, 2011). In response, the second poverty reduction strategy elaborated ambitious programmes to boost the productive sectors and reduce extreme poverty. This stronger focus on extreme poverty and on the rural areas is reflected in the second-period data, when growth was higher outside Kigali and benefited the extremely poor, more than it did the less poor and the non-poor. Although the data does not allow attribution, it appears that the second poverty reduction strategy paid off in terms of poverty reduction and raising the living standards of the extremely poor.
2.4. The Drivers of Consumption Growth and Poverty Reduction
The growth in household consumption was associated with rapid changes in factors that are typically associated with improvements in living standards. Increased agricultural production
and the move from a traditional production mode to a more market-oriented model, emerge as the main driver of the growth in consumption of Rwandan households, explaining almost half of the reduction in poverty over the past decade. At the same time, Rwandan households have diversified their income portfolios and reduced risk, by increasingly taking up self- and-wage-employment in the non-farm sector next to agriculture. Increased self-employment in small non-farm businesses has been the second main driver of consumption growth in Rwanda as a whole, while the move to wage employment emerges as the single most important driver of consumption growth in Kigali. The rapid fall in fertility rates in recent years has changed the demographic composition of Rwandan households, and has lowered the child dependency ratio, which has been associated with increased disposable income both in Kigali and in rural areas. The demographic developments suggest that Rwanda is amidst the demographic transition, and could reap a demographic dividend if sufficient jobs can be created in the coming decade.
Which factors have been associated with the improvements in household welfare?
The last decade has witnessed rapid changes in the economic and socio-demographic structure of the Rwandan economy. This section explores potential drivers of growth in household welfare between 2001 and 2011 using comparable household survey data from the EICV1 (2001)
and EICV3 (2011) surveys. Focus is made on three main factors: the boost in agricultural production and the increased market-orientation of agriculture; the changing structure of the labor market and households’ activity portfolios; and, the demographic changes spurred by rapidly falling fertility rates.
Rwanda Ecomomic Update | Edition No. 4 42
Rwanda’s Pathway Out of Poverty
2.4.1. Key Evolutions during the Previous Decade
Increased Agricultural Production and Commercialization
Agriculture is the backbone of the Rwandan economy. Although the share of agriculture
in GDP has fallen from 45 percent in 2001 to 34 percent in 2011, it remains the main occupation for over 70 percent of working Rwandans. Of the 1.4 million new people working in Rwanda between 2001 and 2011, the largest increase in new jobs is in agriculture (430,000). In terms of income, agriculture accounts for almost half of aggregate household income, and much more for poor households. The proportion of Rwandan households cultivating at least one plot of land has remained stable throughout the previous decade, at 90 percent.
Increasing agricultural productivity and transforming agriculture from subsistence-based to market-based was one of the priorities for both the first PRSP and the EDPRS. Driven by increased public and donor-funded investments in agriculture, especially on the flagship programs such as the Crop Intensification Program (CIP) and the Land Husbandry, and Water Harvesting and Hillside Irrigation (LWH) project, aggregate production increased starkly over the previous decade (Figure 53). Production of cereals more than tripled between 2000 and 2010, while production of pulses and roots increased by 58 percent and 79 percent respectively. This is also reflected in the household data (Table 9): the average value of agricultural production
more than doubled in real terms between 2001 (Rwf105,000 per household) and 2011 (Rwf223,000 in 2011 prices)17. The percentage of farmers who reported having purchased fertilizers also increased sharply, from 7 percent in 2001 to 30 percent in 2011. Since agriculture is the single most important income source for poor households, the increase in agricultural production is believed to have substantially contributed to consumption growth and poverty reduction. At the same time, commercialization of agriculture by households—defined as the share of harvest sold in the market—also increased: In 2011, the average household sold 21.4 percent of its total produce on the market, up from 13.4 percent in 2001.
The jump in agricultural production and productivity is a recent phenomenon. As shown in Table 8, the increase in agricultural production was a lot higher in the second half of the decade,
Figure 53: Production of Cereals, Pulses and Roots and Tubers Increased Substantially over the Past Decade(Percentage Increase in Production Quantity, 2001 to 2011)
211
58 79
-
50
100
150
200
250
Cereals Pulses Roots and Tubers
Source: FAOSTAT, 2013.
Table 8: The Boom in Agricultural Production Happened in the Last Five years(Production levels of Selected Crops in 2001, 2006 and 2011)
Source: FAOSTAT, 2013.
Production Level (tons) Production Increase (percent)
17Annex Table 4 and Annex Table 5 show the descriptive statistics by welfare group.
than in the first half: Aggregate production of cereals increased by 135 percent between 2006 and 2011, compared to 28 percent in the preceding five-year period. While the production of roots and tubers actually declined between 2001 and 2006, it almost doubled during the past five years. The same goes for the increase in agricultural productivity: while average yields grew timidly between 2001 and 2006, they sharply increased during the last five years (Figure 54). This likely reflects the priority laid out in Rwanda’s Economic Development and Poverty Reduction Strategy (2007-2012) of raising agricultural productivity, and transforming agriculture from subsistence-based to market-based.
Diversification of Income Portfolios Marked by a Move towards Non-Farm Activities
The changing composition of households’ economic activities is one of the most
remarkable evolutions in Rwanda over the past
decade. While engaging in non-farm income activities was still relatively rare at the start of the previous decade (less than 30 percent of households had a non-farm activity in 2001), 70 percent of households had an activity of this kind in 2011 (Table 9). Given the strong
Figure 54: Agricultural Yields Increased Sharply over the PastFive Years(Increase in Yields (Hg/Ha) between 2001 and 2006, and 2006and 2011)
22
138
73
23
52
0
20
40
60
Perc
ent
80
Cereals Pulses Roots/Tubers
Increase in Yields, 2001-2006 Increase in Yields, 2006-2011
Source: FAOSTAT, 2013.
Rwanda Ecomomic Update | Edition No. 4 43
Rwanda’s Pathway Out of Poverty
2001 (EICV1) 2011 (EICV3) Mean Difference
Consumption and Poverty
Consumption Expenditures per AE (2011 Rwf) 210,043 270,921 60,878***
Poverty Headcount (%) 58.9 44.9 -14.0***
Agriculture and Livestock
Value of Agricultural Production (2011 Rwf) 104,720 222,998 118,278***
Share of Harvest Sold 13.4 21.4 8.0***
Income Activities
Farm Self Employment (% of households) 90.7 91.2 0.5
Farm Wage Employment (% of households) 13.7 48.8 35.1***
Non-Farm Self Employment (% of households) 15.3 41.5 26.2***
Non-Farm Wage Employment (% of households) 21.8 48.4 26.6***
Any Non-Farm Activity (% of households) 29.9 69.7 39.8***
Education and Demographics
Household Size in Adult Equivalents 4.48 4.24 -0.24***
Dependency ratio 0.98 0.87 -0.11***
Household Head Educated (% Yes) 60.2 72.6 12.4***
Household Head Literate (% Yes) 45.0 61.4 16.4***
Proportion of Adults Educated (%) 66.6 79.1 12.5***
Proportion of Literate Adults (%) 50.0 66.6 16.6***
Table 9: Significant Changes in Household Consumption, Income Activities, and Human Capital during the Past Decade(Means of Key Variables in 2001 and 2011 with Differences in Means and Significance Levels)
Source: EICV1 and EICV3; ***: Difference statistically significant at the 1 percent level.
Rwanda Ecomomic Update | Edition No. 4 44
Rwanda’s Pathway Out of Poverty
correlation that is found in empirical literature between non-farm activities and household welfare, the increased engagement in non-farm economic activities seems to have contributed to the observed consumption growth. Both non-farm wage employment and non-farm self-employment in small businesses, substantially increased between 2001 and 2011: 48 percent of households earned income through non-agricultural wage employment in 2011, up from 22 percent in 2001. Non-farm self-employment in 2011 stood at 42 percent, compared to 15 percent in 2001 (Table 9).
A salient feature of the shift in households’ activity portfolios during the past decade is that households did not abandon one income activity to take on another, but rather diversified and took up more income activities (both as main and secondary occupations)18. The average number of income activities increased from 1.4 per household in 2001 to 2.3 per household in 2011. As shown in Figure 55, the share of non-farm activities in the total portfolio was higher in 2011 (36.4 percent) than in 2011 (19.4 percent)19. In other words, the increase in the number of income sources can mainly be explained by households’ diversification into non-farm activities.
Regardless of whether or not it contributed to growth and poverty reduction, the observed diversification is a positive evolution. By taking up additional activities in the non-farm sector, rural households have diminished the risk inherent to engaging in rain fed agriculture. In 2001, 74 percent of rural households were fully dependent on agriculture to generate income. In 2011, this had dropped to 33 percent. Thus, suggesting that rural households have lowered their income risk, and are now better equipped to deal with adverse agricultural circumstances, than they were ten years ago.
Falling Fertility, Smaller Households and an Upcoming Demographic Transition
With a population density of 416 persons per squared kilometer, Rwanda is one of
the world’s most densely populated countries. The total fertility rate hardly changed between the early 1990s and the mid-2000s, resulting in high population growth20. However, since 2005 total fertility rates started dropping significantly, from 6.1 in 2005 to 5.5 in 2007/08 and 4.6 in 2010 (Box 13). The lower fertility rates translated into smaller household sizes: Average household size dropped from 5 in 2001 to 4.7 in 2011. The lower fertility rates also reduced the child dependency ratio, the number of economically dependent children (under 15) for each adult (between 15 and 64) in the household: While in 2001 there was on average of one child for each adult, this had dropped to 0.87 in 2011 (Table 9).
The recent demographic developments suggest that Rwanda is amidst the demographic transition. This bodes well for Rwanda’s future economic growth. During any demographic transition, there is a particular moment when there is an exceptional bulge of working-age
18We consider four broad income activities: Farm self-employment, farm wage employment, non-farm self-employment and non-farm wage employment.
19This share is calculated as the number of non-farm activities of the household divided by the total number of income activities. 20The total fertility rate is defined as the average number of children a hypothetical cohort of women could be expected to have at the end of the
reproductive period.
Figure 55: Non-Farm Activities Gained Importance in theActivity Portfolio(Share of Each Activity in Total Activity Portfolio)
Farm Self EmploymentNon Farm Wage Employment
74.1%
6.5%
12.1%
7.3%
44.6%
19.0%
20.1%
16.3%
2001 2011
Share of Each Activity in the Total Activity Portfolio
Farm Wage EmploymentNon Farm Self Employment
Source: EICV1 and EICV3.
Rwanda Ecomomic Update | Edition No. 4 45
Rwanda’s Pathway Out of Poverty
adults. Because fertility is falling, there are relatively few children. And since life expectancy is still relatively low (55 years in Rwanda), there are relatively few elders to take care of. The result is a bulge in working-age adults, and a dramatic decline in the dependency ratio, what is called the “demographic dividend”21.
The bulge in working-age adults in Rwanda is approaching (Figure 56). Working-age population is set to grow by 2 million by 2022, hence, increasing its share in total population to almost 60 percent (up from 54 percent currently). And the transition is projected to accelerate after 2025, when working age
Figure 56: Rwanda is Entering the Demographic Transition(Share of Each Population Subgroup in Total Population, 1950-2050)
0
5
10
15
20
25
30
1950 1975 2000 2025 2050
Total Population Working Ages 15-64 Youth 0-14 Older 65+
Source: UN Population Prospects.
Total fertility rates have been dropping fast over the last ten years, from 5.8 in 2000 to 4.6 in 2010. In line with the overall reduction in poverty, the drop in fertility can be attributed to the last five years: While fertility marginally increased between 2000 (5.8) and 2005 (6.1), it dropped by 1.5 between 2005 and 2010, one of the largest drops in the history of the dhs surveys.
To what extent is the drop in fertility underpinned by evolutions in fertility determinants? The answer is: “to a large extent.” Table 10 shows that all fertility determinants have moved in the right direction between 2000 and 2010. The median level of education of women between 15 and 49 years of age has doubled (from a low base), and female literacy rates have increased by ten percentage points. The fraction of women using modern contraception has shot up from a mere three percent in 2000, to 25 percent in 2010, leading to a drop in unmet needs for family planning from 36 percent in 2000 to 21 percent in 2010. Given the importance of the institution of marriage in determining fertility in Rwanda, the increased age at first marriage and age at first birth have likely contributed to the drop in fertility. Finally, the large drop in the ideal number of children wished by women: while in 2000 the average woman in Rwanda wished to have five children, the number dropped to three in 2010.
Box 13 Multiplying a Lot LessDeterminants of Fertility are Moving in the Right Direction
Source: World Bank staff.
Table10: Changes in Women’s Education and Behaviors are Driving Down Fertility(Determinants of Fertility in Rwanda, 2000 and 2010)
Source: DHS, 2000 2010 .
2000 2010Total Fertility Rate 5.8 4.6Number of years of Education of Women (Median) 1.1 2.3Female Literacy (%) 66.1 76.9Ever Used Modern Contraception (%) 16.8 28.5Currently Using Modern Contraception (%) 3.4 25.2Never Married (%) 34.1 38.7Age at First Marriage (Median) 20.7 21.4Age at First Birth (Median) 22 22.9Women with Unmet Need for Family Planning (%) 36.4 20.8Ideal Number of Children (Mean) 4.9 3.3
21Bloom et al. (2003).
Rwanda Ecomomic Update | Edition No. 4 46
Rwanda’s Pathway Out of Poverty
population will grow much faster than both the youth (younger than 15-years of age) and the elderly. This demographic phenomenon has the potential to boost output, if the increase in working-age population can be accommodated with productive employment.
To summarize, the last decade has witnessed significant changes in a number of key economic and demographic variables, as shown in Table 9. The increase in household consumption was accompanied by rising levels of agricultural production and commercialization at the household level and the diversification of income portfolios. Average household size diminished due to falling fertility, resulting in lower child dependency ratios. The next section will explore how these evolutions have been related to the observed growth in welfare and poverty reduction.
2.4.2. What Explains the Growth in Household Consumption in Rwanda?
To examine to what extent the factors mentioned above were associated with
growth in household consumption, a statistical decomposition method will be used. The method is detailed in Annex 10. In simple terms, the method examines how much of the observed increase in consumption can be explained by the observed changes in underlying factors (such as the increase in agricultural production, and the move to non-farm activities). In this way, the contribution of each factor to growth in consumption can be quantified. These decompositions will be performed at three points of the distribution, representing three different welfare categories: The poorest households (bottom 25 percent), the median or average households (middle of the distribution), and the better-off households (the 75th percentile of the distribution). Given the different structure of economic activities in Kigali than in the rest of the country, separate decompositions for the two regions will be carried out.
Figure 57 summarizes the main results of the decompositions. For the areas outside of Kigali, which are predominantly rural, the increase in agricultural production emerges as the main driver of growth, followed by diversification into small-scale self-employment in non-farm activities. In Kigali itself, the bulk of consumption growth can be explained by the move to non-farm wage employment. Figure 57 can be interpreted in relative terms, as it has been rescaled for ease of representation. In the remainder of this section, the contribution of each factor to growth in consumption will be elaborated.
Agriculture is the Main Driver of Rural Consumption Growth
The increase in agricultural production over the past decade emerges as the main driver
of consumption growth, for both poor and wealthier households. Increased production explains over 19 percent of growth in median consumption for rural households in Rwanda (Figure 58). The increased commercialization of agriculture (the increased shares of harvests sold on the market) explains another 13 percent of rural consumption growth. Taken together, agricultural developments accounted for one third of growth in consumption of rural households between 2001 and 2011.
Figure 57: Agriculture is the main driver of consumption growth in rural areas; in Kigali it is the move to wage employment(Contribution of Selected Factors to growth in MedianConsumption between 2001 and 2011)
0
20
40
60
80
100Pe
rcen
t
Rest of Country Kigali City
Increased Agricultural Production Increased Commercialization of AgricultureMove to Non-Farm Self Employment Move to Non-Farm Wage EmploymentonDecreased Dependency ratio
Source: DHS, 2000 2010, EICV1, EICV2, EICV3.
Rwanda Ecomomic Update | Edition No. 4 47
Rwanda’s Pathway Out of Poverty
The increase in agricultural production has been more important for the wealthier households. While increased agricultural production accounts for 13 percent of consumption growth of the poorest households, it explains almost one quarter of consumption growth for the better-off households (Figure 58). This suggests that households with larger landholdings (wealthier households) have benefited the most from the boost in agricultural production. Increased commercialization of agriculture follows the opposite pattern, with a higher contribution to growth of poor households (12 percent) than of better-off households (10 percent).
Diversification into Non-Farm Activities Boosted Growth for both Rural and Urban Households
The diversification of income portfolios has been an important driver of growth, both
in rural areas and in Kigali. The increased self-employment in small non-farm business activities (so-called household enterprises), has been particularly important for households outside Kigali, and emerges as the second main driver of growth (Figure 59). The move to non-farm self-employment accounted for 15 percent of the growth in consumption of rural households (compared to 19 percent of increased agricultural production). In contrast, the move towards wage employment has been the single most important
factor in Kigali, explaining up to 78 percent of household consumption growth (Figure 61).
In rural areas, the move to non-farm wage employment has not increased consumption of poor households. While increased non-farm wage employment was associated with growth in consumption of better-off households, and to a lesser extent, average households, it has not contributed to consumption growth of the poor (Figure 59). Although poor rural households did increasingly take up wage employment in the non-farm sector, this has not been correlated with growth in consumption. The move to non-farm activities has been more important for the
Figure 58: The Growth in the Agriculture Sector hasSignificantly Contributed to the Rise in Consumption inBoth Poor and Richer Households(Contribution of Growth in Agriculture to Growth inConsumption of Rural Households, percent)
13.3
19.4
24.4
12
13.1
10.3
0 10 20 30 40
Poorest Households
Average Households
Better-off Households
Increased Agricultural Production Increased Commercialization of Agriculture
Source: EICV1 and EICV3 and World Bank Calculations.
Figure 59: Diversification into Non-farm Self-Employmenthas Been More Important than Wage Employment,Especially for the Rural Poor(Contribution of Growth in Non-farm Activities to Growthin Consumption of Rural Households, percent)
10
14.7
16.1
0
4.4
7.9
0 10 20 30 40
Poorest Households
Average Households
Better-off Households
Move to Non-Farm Self Employment Move to Non-Farm Wage Employment
Figure 60: Decreased Dependency Ratios Spurred byFalling Fertility Rates also Contributed Significantly toConsumption growth(Contribution of Falling fertility Rates to Growth inConsumption of Rural Households, percent)
7.3
9.9
11.2
0 10 20 30 40
Poorest Households
Average Households
Better-off Households
better-off than for the poor. Taken together, close to one quarter of the growth in consumption of better-off rural households can be accounted for, by the move to non-farm activities (both self-and-wage-employment), compared to only one-tenth for the poorest households (Figure 59).
Barriers to entry to good wage jobs, explain why the rural poor did not benefit from increased wage employment in the non-farm sector. Access to good quality wage employment typically requires a certain level of formal skills and education, which the poor usually lack. For instance, only 2.8 percent of adults (15 years and older) in poor rural households have used a computer, compared to 12.6 percent for the non-poor and 30 percent of adults in the richest 10 percent of rural households. Similarly, adults in non-poor rural households attained on average of two grades in education, more than their poorer counterparts. This means that low-skilled adults from poor rural households appear to be condemned to casual and low-paid wage employment (Box 14). The move to non-agricultural self-employment, where barriers of entry are lower, has therefore provided a more lucrative opportunity for the bulk of rural households. Entry barriers to wage jobs are less of a concern in Kigali, where the poor have on average completed primary school.
Decreased Child Dependency Ratios Associated with Consumption Growth across the Board
The decrease in child dependency ratio was associated with consumption growth in both
in Kigali and in the rest of the country. In rural areas, dependency ratios have been falling, more for the non-poor than for the poorer households. The average child dependency ratio in poor households only declined marginally, from 1.14 percent in 2001 to 1.10 percent in 2011 (drop of 3.5 percent), while in non-poor households it declined by 10 percent (from 0.8 percent in 2001 to 0.72 percent in 2011). This explains the relatively higher contribution of decreased dependency ratios to growth in consumption—for betteroff households: decreased dependency ratios explain 11 percent of growth for the better-off households, compared to seven percent for the poorest households (Figure 60).
The child dependency ratio in Kigali fell from 0.81 percent in 2001 to 0.68 percent in 2011. This accounted for 32 percent of growth in consumption of the average household (Figure 62). In Kigali, a significant negative correlation between dependency ratios and wage employment is established: the move to wage employment in Kigali seems to have been accompanied by falling fertility. Although this
Rwanda Ecomomic Update | Edition No. 4 48
Rwanda’s Pathway Out of Poverty
Figure 61: Increased Engagement in Wage Employment hasbeen the Main Driver of Consumption Growth in Kigali…(Contribution of Growth in Non-Farm Activities to Growthin Consumption in Kigali, percent)
23.5
17.9
3.0
55.6
77.7
44.2
0.0 20.0 40.0 60.0 80.0
Poorest Households
Average Households
Better-off Households
Move to Non-Farm Wage Employment Move to Non-Farm Self Employment
Source: EICV1 and EICV3 and World Bank Calculations.
Figure 62: …While the Falling fertility Rates and DependencyRatios Have Given an Extra Boost to Consumption(Contribution of Falling fertility Rates to Growth inConsumption in Kigali, percent)
22.6
32.1
18.9
0 20 40 60 80
Poorest Households
Average Households
Better-off Households
Rwanda Ecomomic Update | Edition No. 4 49
Rwanda’s Pathway Out of Poverty
The creation of jobs was one of the Government’s priorities under the 2008-2012 EDPRS. Between 2001 and 2011, wage employment grew by 13 percent per annum, resulting in the creation of an estimated 939,000 wage jobs (Republic of Rwanda, 2012). 578,000 of the new jobs were in the non-farm sector, while the remaining 361,000 were created in the farm sector (Figure 63).
Poor rural households have increasingly taken up non-farm wage employment between 2001 (14 percent of poor households) and 2011 (43 percent of poor households), but this has not been associated with higher consumption growth (Figure 60).Poor rural households have also increasingly taken up agricultural wage employment on other people’s farms, from 17 percent in 2001 to 69 percent in 2011. If we take the move to farm wage employment-a particularly unstable and low-paid activity- into account, the net effect of wage employment has been largely negative for the rural poor, holding back consumption growth for all but the richest rural households.
Box 14 A Hard Day’s Work Multiplying a Lot LessWage Employment Has Not paid Off for the Poor
Source: World Bank staff.
Figure 63: A Substantial Number of Wage Jobs WereCreated between 2001 and 2011(Number of Farm and Non-farm Wage Jobs, 2001 and2011, thousands)
129
260
490
838
0
100
200
300
400
500
600
700
800
900
Farm Wage Jobs (# of persons, '000)
Non Farm Wage Jobs(# of persons, '000)
2001 2011
Source: Republic of Rwanda, 2011.
is consistent with economic theory, it cannot establish causality with the data at hand (that is: did fertility decline because there were more people in wage employment? Or, Did people take up wage employment because fertility declined, and there were fewer children to take care of?).
Further decreases in the dependency ratio have the potential to boost consumption growth and poverty reduction in the coming decades. As illustrated in Figure 56, working-age population in Rwanda is projected to grow faster than the economically dependent population, which means that dependency ratios are expected to progressively decrease over the coming years. The decomposition results suggest that this will be associated with further improvements in household living standards.
What Does This Mean in Terms of Poverty Reduction?
The preceding analyses focus on the contribution of several key factors to growth
in household consumption. What has been the contribution of these factors to the observed reduction in poverty? As mentioned in Annex Table 3, poverty headcount decreased by 14 percentage points, from 59 percent in 2001 to 45 percent in 2011. To what extent was this drop associated with key evolutions highlighted in this report?
Almost half (45 percent) of Rwanda’s reduction in poverty between 2001 and 2011 can be accounted for by developments in agriculture (Figure 64). Increased agricultural production accounted for 35 percent of the overall drop in poverty while increased agricultural commercialization added another 10 percent. Taken together, these two factors explain more than six percentage points of the 14 percentage point drop in poverty over the previous decade.
In line with the findings presented earlier, the move towards non-farm self-employment has been far more important for poverty reduction than the move towards wage employment. While increased self-employment in small non-
agricultural businesses explains 13 percent of poverty reduction, wage employment accounts for a mere four percent. The low contribution of wage employment to poverty reduction at the national level, masks the fact that wage employment was the main driver of poverty reduction in Kigali. However, in rural areas where the bulk of Rwanda’s population lives, increased take-up of wage employment in the non-farm sector has not been associated with significant poverty reduction.
Finally, falling fertility rates and the associated decrease in dependency ratios, have given an extra impetus to poverty reduction. About 9
percent of the decrease in poverty between 2001 and 2011 can be explained by the changing demographic composition of households in Rwanda. This is twice as large as the impact from increased wage employment. The trend to lower dependency ratios is projected to continue, which has the potential to boost poverty reduction in Rwanda, in the years and decades to come.
To summarize, three key evolutions over the past decade explain a substantial part of the household consumption growth and poverty reduction between 2001 and 2011. Agriculture has been the main driver of consumption growth and poverty reduction for rural households in Rwanda. Since 90 percent of Rwanda’s population and 97 percent of Rwanda’s poor live outside Kigali, agriculture has also been the key driver of growth and poverty reduction at the national level. Diversification characterized by the move into non-farm activities has also been associated with consumption growth both in rural areas and in Kigali. While the move to non-farm self-employment has been particularly important for growth and poverty reduction in rural areas, wage employment emerges as the single main driver of consumption growth for households in Kigali. Finally, decreasing child dependency ratios spurred by rapidly falling fertility rates have boosted consumption growth across the distribution, both in Kigali and the rural areas.
Rwanda Ecomomic Update | Edition No. 4 50
Rwanda’s Pathway Out of Poverty
The key findings of this special focus provides a number of clues for future poverty
reduction in Rwanda. Over the past ten years the poor have moved closer to the poverty line, which means that there is scope for rapid poverty reduction in the years to come. Given that majority of Rwanda’s poor live in rural areas and still depend on agriculture (both self and wage)—for the bulk of their livelihood—further improvements in agriculture will likely be the main engine of poverty reduction over the medium term. In light of this, it is
important for the government to maintain its strong investment in agriculture, including the facilitation of market linkages, building rural infrastructure and enhancing agricultural skills necessary to raise productivity on small landholdings and make the transition to higher-value crops which require greater know-how. This should be accompanied by the promotion of small-scale business activities in the agro-processing and post-harvest storage sectors, which have the potential to thrive on increased agricultural production.
2.5. Poverty Reduction in Rwanda: The Way Forward
Figure 64: Agriculture Accounted for the Bulk of National Poverty Reduction(Contribution of the Various Factors to Poverty Reduction between 2001 and 2011, percent)
Increased Agricultural Production
35%
Increased Agricultural Commercialization
10%Decreased
Dependency Ratio9%
Non-Farm Self Employment
13%
Non-Farm Wage Employment
3%
Other Factors and Unexplained Part
30%
Source: EICV1 and EICV3 and World Bank calculations.
Rwanda Ecomomic Update | Edition No. 4 51
Rwanda’s Pathway Out of Poverty
Agriculture will however not be able to absorb the rapidly growing labor force. In the coming decade 200,000 new working-age adults are expected to join the labor force each year. Given the scarcity of farmland in Rwanda, independent farming, for long the traditional occupation in rural Rwanda, will no longer be a viable option for many of them. And given the relatively low skills and education of the labor force, a bulk of the newcomers will not qualify for modern wage employment in the formal economy. This implies that most of the growing labor force will try to make a living in the informal sector, both in wage-and-self-employment. This is already reflected in the most recent household data, which shows an increasing engagement in agricultural wage labor and self-employment in small micro and household enterprises. Investing more in apprenticeships and quality vocational training could provide youth with a way out of unattractive farm wage employment, and a pathway to enter the more lucrative and productive non-farm sector.
As more and more young Rwandans leave the family farm, the role of the informal sector in providing employment will likely continue to grow. Currently, there are 1.27 million household enterprises in Rwanda, providing employment to an even larger number of people, compared to less than 300,000 wage jobs in the formal private sector. Although Rwanda has made great strides in improving the regulatory and business climate for the formal enterprises, the same has not happened
for the informal enterprises. Improving the business climate for small informal enterprises and enabling them to access financial services, will be important for future job creation and poverty reduction. This is especially important in light of the sharp increase in young people working as laborers on other people’s farm, a notoriously unstable and low-paying activity. In the absence of alternatives, a non-negligible part of Rwanda’s rural youth risks getting “stuck” in low-paid unstable agricultural wage employment. A buoyant informal sector could provide a more attractive alternative, and could in the long-run increase domestic revenues, if some of the informal firms grow and enter the formal sector.
Given the onset of the demographic transition and the upcoming bulge in working-age adults, the future of growth and poverty reduction in Rwanda can be summarized in two words: Agriculture and Jobs. Rwanda’s population is expected to hit 13 million by 2020, which means that increases in agricultural production and productivity will be needed to feed the population and minimize food imports. As more young Rwandans will leave agriculture and increases in agricultural productivity will shed off farm labor, the bulge in working-age adults will be concentrated in the informal non-farm sector. Stimulating this sector and attracting foreign investment in the formal private sector will be crucial in creating sufficient good jobs to capitalize on the upcoming population trends, and reap the demographic dividend.
Inflation (%) End of period 22.3 5.7 0.2 8.3 3.9 Period average 14.5 2.0 2.3 5.7 6.3Exchange rate (Rwf/US$) End of period 558.9 571.2 594.45 604.1 631.4 Period average 546.9 568.3 583.3 600.3 614.3
1 On a fiscal-year basis (July–June). For example, the column ending in 2011 refers to FY2010/11.2 On a fiscal year basis after 2009.
Source: BNR, NISR, MINECOFIN and World Bank Estimates.
2013 January 631.29 838.05 1,008.81February 633.25 846.82 981.39
Annex 6: Rwanda - Exchange rate (Rwf/US$)
Source: Rwanda BNR.
Rwanda Ecomomic Update | Edition No. 4 60
Annexes
Annex 7: Food crop production trends in Rwanda, 2007-2012
The Agricultural sector has historically been the backbone of Rwanda’s economy. It
constitutes the second biggest component of the GDP, with an average of 36 percent over the last decade. The sector remains the main employer, generating about 73 percent of employment (especially for women), the main foreign currency earner with about 55 percent of export goods and the main of national food needed, about 80 percent. This gives the sector much strength as the driver of economic power in the country.
Agricultural productivity increased steadily in the past decade. Land productivity (agricultural valued added/cultivated land in ha, henceforth ha) increased in Rwanda from US$386 in 2000 to US$580 in 2011. The relatively high level of land productivity reflects the favorable agro-climatic potential resulting in two harvest seasons, as well as the intensive nature of the predominant agricultural production systems. In contrast, labor productivity did not follow the same trend; it increased from US$202 in to US$262 in 2011. This is related to the fact that Rwanda has the highest proportion of rural population, most of them engaged in labor intensive agriculture. It appears that most opportunities for future productivity gains lay in the area of making agricultural production less labor intensive, or in other words less subsistence based.
Food crops constitute 85 percent of agriculture GDP, or 30.3 percent of overall GDP. Over the last decade, they registered an average growth of 5.8 percent in terms of GDP. Food crops also dominate the cultivable land with almost 70 percent, reflecting the subsistence nature of Rwandan agriculture. In 2012, roots and tubers constituted the largest share of food crops’ harvest (53 percent) followed by bananas (28 percent), fruits and vegetables (8 percent), cereals (7 percent), and pulses including beans and peas
(4 percent). The cultivated area increased by only 1.4 percent between 2001 and 2011, while food crop output registered an average growth of 7.5 percent per year. However, between 2006 and 2011, the food outturn increased by 9.8 percent, almost double of the 5.4 percent of between 2001 and 2006. This reflects good productivity growth through intensification which is desirable to continue.
Annex figure 1: Although declining in recent years,agriculture remains the backbone of the Rwandaneconomy(Agriculture sector contributions, percent of GDP)
37
38
32
36
14
14
16
14
44
42%
46
44
0 20 40 60 80 100
2000
2006
2011
Avg. 2000-11
Agriculture Industry
PercentServices
Source NISR and World Bank staff estimates.
Annex figure 2: Land productivity has increased fasterthan market productivity(Agricultural productivity, US$)
0.0
500.0
1,000.0
1,500.0
2,000.0
2,500.0
2001 2006 2011Agric. VA (million) Agric., VA/worker Agric., VA/ha
Annex Table 1: Agriculture productivity was higher in the second half of the decade thanks to the crop-intensification program
(Growth trends in food crops)
Source: Ministry of Agriculture, BNR, and World Bank staff estimates.
Rwanda Ecomomic Update | Edition No. 4 62
Annexes
Agricultural productivity was strong in cereals, tubers and roots, especially since mid-2000s. Cereals have been the most dynamic category of food crops with production increasing at a rate of 12 percent per year from 2001 to 2011. Growth was more pronounced between 2006 and 2011, when production growth averaged about 19 percent per year, stimulated by the extension in cultivated area, but mostly boosted by improved productivity (yield in kg/ha), fueled mainly by the use of improved seeds and the land consolidation program. Roots and tubers
constitute the second growing category of crops, expanding at 14.6 percent—in volume—from 2006 to 2011, after a decline registered between 2001 and 2006. The growth was also driven by the productivity, especially between 2006 and 2011, when the overall productivity (yield in kg/ha) increased by 12.5 percent per annum, while the cultivated area rose only 4 percent. This was also as a result of the use of improved seeds and the land consolidation program. However, pulses, banana, fruits and vegetables registered modest performances from 2006 to 2011.
Rwanda Ecomomic Update | Edition No. 4 63
Annexes
Year MonthGross Reserves
Rwf billion million US$2011 December 634.4 1,050.02012 January 596.7 986.8
Annex 9: Different Patterns of Growth and Poverty Reduction in Both Halves of the Decade
Annex Table 2: Consumption Growth but Little Poverty Reduction between 2001 and 2006(Consumption per Adult Equivalent in 2011 Prices and Percentage of Population Below the Poverty Line, 2001-2006)
Annex Figure 3: Pro-Rich Growth in the Rural Areas between 2001 and 2006(Growth-Incidence Curve for Rural Areas, 2001-2006)
2001 poverty headcount outside Kigali
0
2
4
6
Mea
n gr
owth
rate
in co
nsum
ption
(200
1-20
06)
0 20 40 60 80 100Percentiles of Consumption (2000/01)
Source: EICV1 and EICV2.
Expenditures per AE Poverty Headcount2001 2006 2001 2006
Kigali 660,112 768,553 22.7 20.8Rest of Country 162,844 182,001 63 60.2Rwanda 210,043 231,871 58.9 56.9Source: EICV1 and EICV2.
Annex Table 3: Strong Poverty Reduction in Kigali and the Rest of the Country between 2006 and 2011
(Consumption per Adult Equivalent in 2011 Prices and Percentage of Population Below the Poverty Line, 2006-2011)
Expenditures per AE Poverty Headcount2006 2011 2006 2011
Kigali 768,553 825,927 20.8 16.8Rest of Country 182,001 211,625 60.2 47.8Rwanda 231,871 270,921 56.9 44.9Source: EICV2 and EICV3.
Rwanda Ecomomic Update | Edition No. 4 64
Annexes
Rwanda Ecomomic Update | Edition No. 4 65
Annexes
Anne
x 10
: Sum
mar
y Ta
bles
of D
escr
iptiv
e St
atisti
cs b
y W
elfa
re G
roup
s
Anne
x Ta
ble
4: S
igni
fican
t Cha
nges
in a
ll W
elfa
re G
roup
s bet
wee
n 20
01 a
nd 2
011,
Rur
al A
reas
(Mea
ns o
f Exp
lana
tory
Var
iabl
es in
200
1 an
d 20
11, R
ural
Rw
anda
)
Poor
est 2
0% o
f Hou
seho
lds
Mid
dle
60%
of H
ouse
hold
sRi
ches
t 20%
of H
ouse
hold
s20
01
(EIC
V1)
2011
(E
ICV3
)Di
ff.20
01
(EIC
V1)
2011
(E
ICV3
)Di
ff.20
01
(EIC
V1)
2011
(E
ICV3
)Di
ff.
Cons
umpti
on E
xpen
ditu
res
per A
E (2
011
Rwf)
52,5
0874
,254
21,7
46**
135,
310
170,
6935
,386
**48
0,16
168
8,70
220
8,54
1**
Valu
e of
Agr
icul
tura
l Pro
ducti
on
(201
1 Rw
f)52
,458
113,
414
60,9
56**
99,5
7122
9,32
312
9,75
2**
182,
933
351,
757
168,
824*
*
Shar
e of
Har
vest
Sol
d9.
614
.85.
2**
14.2
22.3
8.1*
*15
.626
.811
.2**
Farm
Sel
f Em
ploy
men
t (%
of h
ouse
hold
s)97
.997
.6-0
.398
.497
.6-0
.889
.688
.7-0
.9
Farm
Wag
e Em
ploy
men
t (%
of h
ouse
hold
s)22
.776
.754
.0**
13.6
53.6
40**
9.9
26.7
16.8
**
Non
-Far
m S
elf E
mpl
oym
ent
(% o
f hou
seho
lds)
8.7
31.3
22.6
**12
.340
.828
.5**
20.9
48.7
27.8
**
Non
-Far
m W
age
Empl
oym
ent
(% o
f hou
seho
lds)
13.6
43.3
29.7
**15
.643
.427
.8**
29.1
52.9
23.8
**
Hous
ehol
d Si
ze in
Adu
lt Eq
uiva
lent
s5.
144.
99-0
.15*
4.45
4.24
-0.2
1**
3.72
3.66
-0.0
6
Depe
nden
cy ra
tio1.
241.
2-0
.04
10.
89-0
.11*
**0.
70.
58-0
.12*
*So
urce
: EIC
V1 a
nd E
ICV2
.
Annex
Tab
le 4
and
Ann
ex T
able
5 d
isag
greg
ate
the
evol
ution
of
con
sum
ption
driv
ers
by w
elfa
re g
roup
. Th
e de
scrip
tive
stati
stics
for
thr
ee d
istinc
t gr
oups
is
pres
ente
d: T
he p
oore
st 2
0 pe
rcen
t of
hou
seho
lds;
the
ric
hest
20
perc
ent
of h
ouse
hold
s;
and,
the
60
perc
ent
of h
ouse
hold
s be
twee
n th
e 20
th a
nd t
he
80th
per
centi
le. A
nnex
Tab
le 4
sho
ws
that
the
re w
ere
signi
fican
t ev
oluti
ons
in d
river
s of
con
sum
ption
in a
ll w
elfa
re g
roup
s in
rur
al
Rwan
da b
etw
een
2001
and
2011
. The
mos
t not
able
find
ings
are
that
th
e pe
rcen
tage
of h
ouse
hold
s eng
aged
in in
depe
nden
t far
min
g di
d no
t cha
nge
betw
een
2001
and
201
1, re
gard
less
of w
elfa
re g
roup
, an
d th
at th
e ov
eral
l dec
reas
e in
dep
ende
ncy r
atios
larg
ely b
ypas
sed
the
poor
est 2
0 pe
rcen
t of r
ural
hou
seho
lds,
for w
hich
ferti
lity
rate
s an
d de
pend
ency
ratio
s rem
ain
high
.
Anne
x Ta
ble
5 pr
esen
ts th
e de
scrip
tive
stati
stics
by
wel
fare
gro
up
for
hous
ehol
ds i
n Ki
gali
City
. O
vera
ll, s
igni
fican
t ch
ange
s in
all
wel
fare
gro
ups
are
esta
blish
ed. T
he m
ost n
otab
le fi
ndin
gs a
re th
at
the
aver
age
depe
nden
cy ra
tio in
crea
sed
signi
fican
tly fo
r the
bott
om
20 p
erce
nt o
f hou
seho
lds,
goi
ng a
gain
st th
e ge
nera
l tre
nd, t
hat t
he
riche
st 2
0 pe
rcen
t of h
ouse
hold
s did
not
incr
ease
thei
r eng
agem
ent
in s
elf-e
mpl
oym
ent.
The
riche
st 2
0 pe
rcen
t of h
ouse
hold
s in
Kig
ali
are
alm
ost u
nifo
rmly
eng
aged
in fo
rmal
wag
e em
ploy
men
t.
Anne
x Ta
ble
5: S
igni
fican
t Cha
nges
in a
ll W
elfa
re G
roup
s bet
wee
n 20
01 a
nd 2
011,
Kig
ali C
ity(M
eans
of E
xpla
nato
ry V
aria
bles
in 2
001
and
2011
, Kig
ali C
ity)
Poor
est 2
0%
of H
ouse
hold
sM
iddl
e 60
%
of H
ouse
hold
sRi
ches
t 20%
of H
ouse
hold
s20
01
(EIC
V1)
2011
(E
ICV3
)Di
ff.20
01
(EIC
V1)
2011
(E
ICV3
)Di
ff.20
01
(EIC
V1)
2011
(E
ICV3
)Di
ff.
Cons
umpti
on E
xpen
ditu
res
per A
E (2
011
Rwf)
234,
130
264,
451
30,3
21**
438,
052
592,
849
154,
797*
*85
4,93
71,
244,
625
389,
688*
*
Non
-Far
m S
elf E
mpl
oym
ent
(% o
f hou
seho
lds)
17.8
45.3
27.5
**41
.952
10.1
**41
.246
.95.
7
Non
-Far
m W
age
Empl
oym
ent
(% o
f hou
seho
lds)
23.5
57.5
34.0
**67
.978
.310
.4**
8995
.86.
8**
Hous
ehol
d Si
ze in
Adu
lt Eq
uiva
lent
s4.
94.
5-0
.40*
4.68
4-0
.68*
*4.
173.
4-0
.77*
*
Depe
nden
cy ra
tio1.
031.
180.
15*
0.79
0.61
-0.1
8**
0.53
0.31
-0.2
2**
Sour
ce: E
ICV1
and
EIC
V3; *
**: S
tatis
tical
ly S
igni
fican
t at 1
%; *
Sta
tistic
ally
Sig
nific
ant a
t 10%
.
Rwanda Ecomomic Update | Edition No. 4 66
Annexes
Rwanda Ecomomic Update | Edition No. 4 67
Annexes
Annex 11: Statistical Decomposition Methods and Results
In general terms, statistical decomposition methods decompose changes in the mean of a variable in a part that can be explained by changes in covariates (the “explained” part) and a part that
can be explained by changes in coefficients (the “unexplained” part). In this special focus, interest is in decomposing the change in mean household consumption between 2001 and 2011, into a part that can be explained by changes in the means of the covariates (such as increased agricultural production and commercialization, and increased non-farm activity) and an unexplained part.
The Oaxaca-Blinder method is one of the best-known statistical decomposition methods, but it only decomposes changes in the mean of a variable (Oaxaca, 1973; Blinder, 1973). From a policy perspective, only focusing on the mean is of limited importance. In our case, we would like to know which factors were associated with consumption changes at various points of the distribution. That is, can the same factors explain consumption growth of both the poor and the rich, or were certain factors more important for the poor and vice versa?
To explore this, a novel method is applied, which generalizes the Oaxaca-Blinder method to all parts of the distribution instead of just the mean (Firpo, Fortin and Lemieux, 2007 2009). In this fashion, what has driven consumption growth at various points of the distribution is examined. We will focus on three key points of the distribution: The 25th percentile (the poorest households), the 50th percentile (the median households) and the 75th percentile (the better-off households). In technical terms, following decomposition is performed:
Where is a particular percentile, X is a vector of covariates and denotes the coefficients of the quantile regressions. The first part of the expression,
, is the explained part: The part of the difference in consumption between 2011 and 2001 that can be
explained by differences in the covariates (the X’s), using the coefficients from the pooled regression ( ). ). This part can further be decomposed into the contribution of each individual covariate. The second part
is the unexplained part: The part of the difference in consumption between 2011 and 2001, that is due to the difference in regression coefficients (the difference in returns to activities between 2001 and 2011). In this case, interest is in the explained part: To what extent can the difference in consumption between 2001 and 2011 be explained by the difference in covariates between 2001 and 2011? In other words, can the higher level of consumption in 2011 be explained by a higher level of consumption-driving covariates in 2011 compared to 2001?
Annex Table 6 shows the results of the decomposition for the rural areas and Kigali City. The first thing to notice is that the growth in consumption mirrors the growth-incidence curves for rural Rwanda (Figure 45 in main text) and Kigali (Figure 44 in main text):
Rural Areas Percentile Kigali City Percentile25th 50th 75th 25th 50th 75th
Ln (Consumption Growth) 0.301 0.252 0.242 0.243 0.184 0.265Part Explained by Changes in Covariates
Unexplained Part 0.113*** 0.029*** -0.002*** -0.133*** -0.190*** -0.045***Percentage of Consumption Growth Explained By:Increased Agricultural Production
13.2*** 19.4*** 24.5*** na na na
Increased Agricultural Commercialization
11.9*** 13.2*** 10.3*** na na na
Increased Non-Farm Wage Employment
0 4.6*** 7.9*** 55.5*** 77.7*** 43.8***
Increased Non-Farm Self Employment
10*** 14.9*** 16.2*** 23.6*** 17.9*** 3***
Decreased Dependency Ratio
7.2*** 10*** 11.1*** 22.6*** 32.3*** 18.9***
N 17784 17784 17784 2233 2233 2233
Annex Table 6: Quintile Decomposition of the Growth in Consumption, 2001-2011
Source: EICV1 and EICV3; ***: Statistically Significant at 1%.
In rural areas, growth was higher for the poorest households (25th percentile) than for
the median households (50th percentile) and the better-off households (75th percentile). In Kigali, the U-shaped pattern is found, with growth being higher for the poorest (24.3%) and better-off (26.5%) households than for the median households (18.4%).
On average, 88 percent of the growth in consumption in rural areas can be explained by the “growth” in covariates between 2001 and 2011. The explained part is higher for wealthier than for poorer households. This can potentially be explained by the fact that the model does not include social protection transfers that particularly benefit the extra poor. Since the social protection programs did not exist in 2001, they cannot be included in the model.
Focusing on the role of individual covariates, the increase in agricultural production between 2001 and 2011 which accounts for the lion’s share of the increase in household consumption
is established. Increased agricultural production explains 13 percent of consumption growth for the poorest households, 19 percent for the median households and 25 percent for the better-off households. Adding the role of increased agricultural commercialization, improvements in agriculture account for 24 percent of consumption growth at the 25th percentile, 33 percent at the 50th percentile and 35 percent at the 75th percentile.
The move to self-employment in non-agricultural businesses emerges as the second main correlate of consumption growth, explaining 15 percent of consumption growth at the median. Increased non-farm self-employment has been important for poorer and wealthier households alike. In contrast, the increase in non-farm wage employment has only been important for the better-off households, explaining 8 percent of their growth in consumption. For the poorest 25 percent of household, the move to nonfarm wage employment has not been associated with higher consumption levels.
Rwanda Ecomomic Update | Edition No. 4 68
Annexes
Rwanda Ecomomic Update | Edition No. 4 69
Annexes
The decrease in the child dependency ratio spurred by falling fertility rates has also been associated with consumption growth across the distribution. The role of decreased dependency ratios was smallest for the poorest householdswhich experienced the smallest declines in fertility rates and dependency ratios over the past decade.
In Kigali, the growth of consumption is “over-explained” by the changes in covariates. This
means that consumption in Kigali grew by less than would be expected, by the changes in covariates, suggesting that returns to activities diminished between 2001 and 2011. The increased engagement in non-agricultural wage employment has been the single main driver of consumption growth in Kigali, explaining 78 percent of consumption growth at the median. In contrast to rural areas, self-employment has been less important, especially at the higher ends of the distribution.
▪ Banerjee, A. and Duflo, E. (2008). “What is Middle Class about the Middle Classes around the World?” Journal of Economic Perspectives 22(2): 3-28.
▪ Barrett, C., Reardon, T. and Webb, P. (2001). “Nonfarm Income Diversification and Household Livelihood Strategies in Rural Africa: Concepts, Dynamics, and Policy Implications”. Food Policy 26(4): 315-331.
▪ Baulch, R. and McCulloch, N. (2000), “Tracking Pro-Poor Growth.” ID21 insights No. 31. Sussex: Institute of Development Studies
▪ Blinder, A. S. (1973). “Wage Discrimination: Reduced Form and Structural Estimates.” Journal of Human Resources 8: 436–455.
▪ Bloom, D. Canning, D. and Sevilla, J. (2003). “The Demographic Dividend: A New Perspective on the Economic Consequences of Population Change.” Santa Monica: The RAND Corporation.
▪ Easterly, W. (2001). “The Middle Class Consensus and Economic Development.” Journal of Economic Growth 6(4): 317-336.
▪ Firpo, S., Fortin, N. and Lemieux, T. (2007). “Decomposing Wage Distributions using Influence Function Projections.” Working paper. Department of Economics, University of British Columbia.
▪ Firpo, S., Fortin, N. and Lemieux, T. (2009). “Unconditional Quantile Regressions.” Econometrica 77(3): 953-973.
▪ IMF. (2012). “World Economic Outlook Database, October 2012.” Washington DC: The International Monetary Fund.
▪ Kakwani, N. and Pernia, E. (2000), “What Is Pro-Poor Growth?” Asian Development Review 18(1): 1-16.
▪ NISR. (2012a). “The Evolution of Poverty in Rwanda from 2000 to 2011: Results from the Household Surveys (EICV).” Republic of Rwanda: National Institute of Statistics of Rwanda.
▪ NISR. (2012b). “EICV3 Thematic report: Economic Activity.” Republic of Rwanda: National Institute of Statistics of Rwanda.
▪ Oaxaca, R. (1973). “Male–Female Wage Differentials in Urban Labor Markets.” International Economic Review 14: 693–709.
▪ Ravallion. M. and Chen, S. (2003). “Measuring Pro-Poor Growth.” Economic Letters 78(1): 93-99.
▪ Ravallion, M. . “Pro-Poor Growth: A Primer.”
▪ Reardon, T. (1997). “Using Evidence of Household Income Diversification to Inform Study of the Rural Nonfarm Labor Market in Africa,” World Development 25 (5): 735-748.
▪ Reardon, T., Berdegue, J., Barrett, C. and Stamoulis, K. (2006). “Household Income Diversification into Rural Nonfarm Activities.” IN: Haggblade, S., Hazell, P. and reardon, T. (eds.). “Transforming the Rural Nonfarm Economy.” Baltimore: Johns Hopkins University Press.
▪ United Nations (2011). “World Population Prospects: The 2010 Revision.” Department of Economic and Social Affairs, Population Division. New York: United Nations.
▪ World Bank. (2005). “Pro-Poor Growth in the 1990s. Lessons and Insights from 14 Countries.” Washington DC: The World Bank.