ZERO-ORDER DRAFT IPCC WGII AR5 Chapter 17 Do Not Cite, Quote, or Distribute 1 25 July 2011 Chapter 17. Economics of Adaptation 1 2 Coordinating Lead Authors 3 Myuyeye Chambwera (Zimbabwe), Geoff Heal (USA) 4 5 Lead Authors 6 Carolina Dubeux (Brazil), Stephane Hallegate (France), Liza Leclerc (Canada), Anil Markandya (Spain), Bruce 7 McCarl (USA), Reinhard Mechler (Austria), James Neumann (USA) 8 9 Review Editors 10 Eduardo Calvo (Peru), Ana Iglesias (Spain), Stale Navrud (Norway) 11 12 Volunteer Chapter Scientist 13 Terrence Kairiza (Zimbabwe) 14 15 16 Contents 17 18 Executive Summary 19 20 17.1. Climate Background 21 22 17.2. Adaptation as an Economic Problem 23 17.2.1. Forms of Adaptation Decisions and an Economic Distinction between Them 24 17.2.1.1. Broad Categorization of Planned Adaptation Strategies 25 17.2.1.2. Broad Definition of Benefits and Costs 26 17.2.2. Toward a Realistic Assessment of Strategy Attractiveness 27 17.2.2.1. Adaptation as an Investment 28 17.2.2.2. Adaptation as a Dynamic Issue 29 17.2.2.3. Project-Based Adaptation 30 17.2.2.4. Burden Sharing 31 17.2.3. Adaptation and Mitigation as Competitive Investments 32 17.2.4. Inter-Relationships between Adaptation Costs and Residual Damage 33 17.2.4.1. Defining Residual Damage 34 17.2.4.2. The Cost of Adaptation 35 17.2.5. Relating the Cost of Adaptation to Residual Damages 36 17.2.5.1. The Adaptation Deficit and Adaptive Capacity 37 17.2.5.2. Costs and Benefits at Alternative Levels of Aggregation 38 17.2.6. Methodological Considerations 39 17.2.6.1. Data Quality and Quantity 40 17.2.6.2. Costs and Benefits are Location-Specific 41 17.2.6.3. Costs and Benefits Depend on Socio-Economics 42 17.2.6.4. Discount Rates Matter 43 17.2.7. Adaptation and Development 44 45 17.3. Decisionmaking and Economic Context for Adaptation 46 17.3.1. Autonomous Adaptation and Planned Adaptation 47 17.3.2. What are the Objectives of Adaptation? 48 17.3.3. Information, Transaction Costs, and Market Barriers 49 17.3.4. Externalities, Agency Theory, and Market Failures 50 17.3.5. Behavioral Obstacles to Adaptation 51 17.3.6. Ethics and Political Economy 52 17.3.7. Marginal vs. Structural Adaptation 53 17.3.8. Economic Decisionmaking with Uncertainty 54
Transcript
ZERO-ORDER DRAFT IPCC WGII AR5 Chapter 17
Do Not Cite, Quote, or Distribute 1 25 July 2011
Chapter 17. Economics of Adaptation 1 2 Coordinating Lead Authors 3 Myuyeye Chambwera (Zimbabwe), Geoff Heal (USA) 4 5 Lead Authors 6 Carolina Dubeux (Brazil), Stephane Hallegate (France), Liza Leclerc (Canada), Anil Markandya (Spain), Bruce 7 McCarl (USA), Reinhard Mechler (Austria), James Neumann (USA) 8 9 Review Editors 10 Eduardo Calvo (Peru), Ana Iglesias (Spain), Stale Navrud (Norway) 11 12 Volunteer Chapter Scientist 13 Terrence Kairiza (Zimbabwe) 14 15 16 Contents 17 18 Executive Summary 19 20 17.1. Climate Background 21 22 17.2. Adaptation as an Economic Problem 23
17.2.1. Forms of Adaptation Decisions and an Economic Distinction between Them 24 17.2.1.1. Broad Categorization of Planned Adaptation Strategies 25 17.2.1.2. Broad Definition of Benefits and Costs 26
17.2.2. Toward a Realistic Assessment of Strategy Attractiveness 27 17.2.2.1. Adaptation as an Investment 28 17.2.2.2. Adaptation as a Dynamic Issue 29 17.2.2.3. Project-Based Adaptation 30 17.2.2.4. Burden Sharing 31
17.2.3. Adaptation and Mitigation as Competitive Investments 32 17.2.4. Inter-Relationships between Adaptation Costs and Residual Damage 33
17.2.4.1. Defining Residual Damage 34 17.2.4.2. The Cost of Adaptation 35
17.2.5. Relating the Cost of Adaptation to Residual Damages 36 17.2.5.1. The Adaptation Deficit and Adaptive Capacity 37 17.2.5.2. Costs and Benefits at Alternative Levels of Aggregation 38
17.2.6. Methodological Considerations 39 17.2.6.1. Data Quality and Quantity 40 17.2.6.2. Costs and Benefits are Location-Specific 41 17.2.6.3. Costs and Benefits Depend on Socio-Economics 42 17.2.6.4. Discount Rates Matter 43
17.2.7. Adaptation and Development 44 45 17.3. Decisionmaking and Economic Context for Adaptation 46
17.3.1. Autonomous Adaptation and Planned Adaptation 47 17.3.2. What are the Objectives of Adaptation? 48 17.3.3. Information, Transaction Costs, and Market Barriers 49 17.3.4. Externalities, Agency Theory, and Market Failures 50 17.3.5. Behavioral Obstacles to Adaptation 51 17.3.6. Ethics and Political Economy 52 17.3.7. Marginal vs. Structural Adaptation 53 17.3.8. Economic Decisionmaking with Uncertainty 54
ZERO-ORDER DRAFT IPCC WGII AR5 Chapter 17
Do Not Cite, Quote, or Distribute 2 25 July 2011
17.3.8.1. Risk and Portfolio Theory 1 17.3.8.2. Uncertainty in Future Climates and the Risk of Maladaptation 2
17.3.9. Non-Market Costs and Benefits 3 4 17.4. Ancillary Economic Effects of Adaptation Measures and Policies 5
17.4.1. Broad Economic Consideration of Adaptation 6 17.4.2. Examples of Ancillary Benefits from Adaptation Actions 7 17.4.3. Economic Consideration of Ancillary Effects 8 17.4.4. Correction of Market Outcomes 9 17.4.5. Possible Economic Co-Benefits from Economic Instruments 10 17.4.6. Examples of Multi-Metrics Decisionmaking for Adaptation 11
17.4.6.1. Assessing the Opportunity Cost of Funds Devoted to Adaptation 12 17.4.6.2. Adaptation Benefits of Conservation of Ecosystems 13
17.4.7. Review of Existing Global Numbers (Identifying Gaps and Limitations) 14 17.4.8. Consistency between Localized and Global Analysis 15
16 17.4.10. Case Studies on Sectors or Regions 17
17.4.10.1. Transportation 18 17.4.10.2. Agriculture and Forestry 19 17.4.10.3. Energy 20 17.4.10.4. Sea-Level Rise and Coastal 21 17.4.10.5. Infrastructure 22 17.4.10.6. Health 23 17.4.10.7. Buildings and urbanism 24 17.4.10.8. Water 25 17.4.10.9. Ecosystems and Ecosystem-Based Adaptation 26 17.4.10.10. Recreation and Tourism 27 17.4.10.11. Natural Disaster Risk 28
29 17.5 Summary 30 31 References 32 33 34 Executive Summary 35 36 [to be developed] 37 38 39 17.1. Climate Background 40 41 Significant climate change is now inevitable, and will bring with it the need to adapt to this new reality (Rose and 42 McCarl, 2007). In particular, Chapter 17 of the AR4 WGIII report makes it clear that we will experience substantial 43 climate change almost independent of the mitigation policies we adopt in the current decade: contributory factors are 44 the strong link between energy use and economic development, the slow turnover of capital stock and the long times 45 taken by the atmosphere to equilibrate to higher levels of GHGs. To elaborate on these points: 46
• Energy and development. Today emissions of greenhouse gasses are greater than in most of history, 47 having grown by 70% from 1970 to 2004, and are projected to increase by an additional 25% to 90% by 48 2030. AR4 data show these emissions mainly arise from energy use. Energy use and economic prosperity 49 are highly intertwined and it is unlikely that emissions will be reduced in the near future given the desire 50 for economic growth and the need for energy use to rise to accommodate that growth and as a response to 51 higher incomes. 52
• Capital stock and energy. There is major capital investment involved in shifting the energy system away 53 from fossil fuels and thus changes in emission regimes are likely to occur slowly. 54
ZERO-ORDER DRAFT IPCC WGII AR5 Chapter 17
Do Not Cite, Quote, or Distribute 3 25 July 2011
• GHG lifetime. The long atmospheric lifetimes of GHGs creates inertia in the climate system, which 1 implies that it will take time for the climate to stabilize once atmospheric greenhouse gas concentrations 2 stabilize. 3
4 Consequently most mitigation pathways show substantial warming up until mid century, with the choice between a 5 wide range of mitigation alternatives making little difference on that timescale. Collectively then these forces 6 indicate that the economic system is a causal factor in climate change and that a substantial degree of climate change 7 is inevitable. Changes in the climate will bring with them significant impacts on many aspects of human societies 8 (see XX), including changes in agricultural yields, hydrological cycles, weather patterns, and many more. It is 9 inevitable and in general sensible that societies will seek to adapt to these changes. 10 11 In this chapter we set out n economics framework for thinking about better to adapt to a changed climate. We 12 categorize adaptation into autonomous and planned adaptations, those that occur as a result of individuals and 13 corporations acting in their own best interests and those that occur as a result of collective and deliberate actions 14 organized by international groups, governments or communities. We ask why and when planned adaptations are 15 needed (a matter of understanding market failures, and in particular the occurrence of public goods, in the context of 16 adaptation) and then consider how governments or other agencies charged with choosing policies might evaluate the 17 options that face them; assess costs and benefits (both monetary and otherwise); account for uncertainties; take 18 account of co-benefits; account for futurity of benefits; and account for the distributional impact of climate change 19 and the policies designed for adaptation to it. We also address the establishment of an environment conducive to 20 autonomous adaptation and recognize limits to adaptation and the possibility of residual damages. 21 22 We begin in the balance of this section by setting out how economists view the problem of adaptation to a changing 23 climate, presenting the basic conceptual framework for assessing costs and benefits of adaptation and then consider 24 the scale of adaptation measures and their costs and benefits plus limits to adaptive actions. 25 26 In the second section we set the problem of adaptation in a decision-theoretic framework and then in the third 27 analyze how the uncertainties that are inevitable should affect the decision-making framework. In the final section 28 we focus on the ancillary effects of adaptation measures – many adaptation measures may be beneficial even in the 29 absence of climate change –and review empirical evidence on adaptation costs. 30 31 32 17.2. Adaptation as an Economic Problem 33 34 A policy maker considering adaptation to climate change will generally have to choose between a wide range of 35 possible adaptation strategies. For any particular adaptation measure, the decision-maker needs to judge whether the 36 benefits of using the strategy outweigh the implementation and usage costs. The benefits and costs need to be 37 broadly defined, taking into account social, environmental and economic costs and benefits (as elaborated on 38 below). The benefits, costs and resource usages considered in such an enterprise are not only current but also extend 39 into the future, possibly far into the future. Considering the uncertainty about future climates and future climate 40 change impacts (e.g., on ecosystems), a single forecast is usually insufficient, and uncertainty and risks need to be 41 considered (e.g., through risk-based analysis or robust decision-making methodologies). More generally when there 42 are important non-economic goals, decision-makers may need to decide what alternative can be employed to reach a 43 given goal at the highest net benefit or lowest net cost. 44 45 46 17.2.1. Forms of Adaptation Decisions and an Economic Distinction between Them 47 48 Adaptation actions in the context of the decision problem outlined above have been classified in the literature in two 49 categories, which are autonomous and planned (for example FAR, CH 17). The US National Academy Report 50 (2010) sharpens the distinction, stating that “Autonomous adaptations are actions taken voluntarily by decision-51 makers ……. whose risk management is motivated by information, market signals, co-benefits, and other factors. 52 Planned adaptations are interventions by governments to address needs judged unlikely to be met by autonomous 53 actions—often adaptations larger in scale and/or resource requirements.” The remainder of this chapter will deal 54
ZERO-ORDER DRAFT IPCC WGII AR5 Chapter 17
Do Not Cite, Quote, or Distribute 4 25 July 2011
with both planned and autonomous adaptation. Under planned adaptation we will deal with adaptations in the form 1 of policy choices or facilitation of private investment. 2 3 From an economic standpoint adaptation decisions can be separated into private and social decisions. Autonomous 4 adaptation is largely the outcome of actions by private individuals or corporations who select alternatives that are 5 beneficial to them relative to the costs that they bear, which are generally private costs. On the other hand planned 6 adaptations are ideally actions that are socially but not privately beneficial often because of some form of market 7 failure. Possible sources of market failure strategy include: 8
• Divergence between the social and private discount rates where for example individuals may operate with a 9 shorter time horizon and larger discount rate than the government 10
• The public good nature of some adaptation alternatives with widespread benefits but costs too high to merit 11 individual action and potential free riders, so the government steps in to reflect total social demand 12
• The differential value society might place on resolving inequities caused by climate change where for 13 example the government may wish to facilitate adaptation for disadvantaged groups 14
• The social value of any externalities resolved by the adaptation action where adaptation might for example 15 reduce flooding frequency or reduce air pollution 16
• The existence of differential risk aversion and risk perception between society and individuals where the 17 government may be more concerned about future climate change developments and risk than are private 18 individuals 19
• The existence of local barriers to adaptation where human or financial capital availability may be 20 preventing adoption of beneficial adaptation strategies 21
• Social concerns over threats to GDP, employment etc. where the government may act to reduce such 22 pecuniary externalities 23
• A difference in information availability regarding adaptation choices. For example cropping systems from 24 regions closer to the equator may be more suitable for a region than its traditional production system, but 25 the region has no experience of such cropping systems and sources of information are limited 26
• Land ownership or property rights may preclude adaptation efforts with land in public hands or subject to 27 multiple private claims 28
• Unmanaged areas are not subject to anthropogenic intervention and consequently do not have potential 29 adaptation systems that can respond to the pace of climate change. 30
31 Many of these points are elaborated on below. 32 33 34 17.2.1.1. Broad Categorization of Planned Adaptation Strategies 35 36 There is a large range of possible planned adaptations. These include: 37
• Direct capital investments in facilities 38 • Technology development 39 • Investment in the design of infrastructure to accommodate changed demands or capabilities brought on by 40
climate change (roads, processing facilities, export facilities) 41 • The dissemination of information (through the extension service or other communication vehicles) 42 • The creation of materials on adaptation alternatives (creation of publicly accessible information on how to 43
employ a particular adaptation alternative) 44 • Human capital enhancement (investment in education) 45 • Redesign of or development of new adaptation coping institutions 46 • Changes in norms and regulations to facilitate autonomous actions. 47
48 Not all adaptation is investment or is costly. Some adaptation actions will be costless or low cost although non cash 49 costs are also relevant. For instance, behavioral changes will play a role in the adaptation process (e.g., changes in 50 work day organization and timing or crop planting time). Also, some adaptation measures are not costless but 51 correspond more to recurring expenditures as opposed to investments: they require taking into account climate 52 change in policy design; changes in institutions and organization to make them able to include climate change in 53
ZERO-ORDER DRAFT IPCC WGII AR5 Chapter 17
Do Not Cite, Quote, or Distribute 5 25 July 2011
their operations; and increases in ex-post response capacity in case of disasters (e.g., strengthening of emergency 1 services). 2 3 4 17.2.1.2. Broad Definition of Benefits and Costs 5 6 It is generally not appropriate to treat the adaptation decision as purely a monetary one. Making good adaptation 7 decisions require considering the effects on a wide range of factors such as: 8
• Income distribution and poverty 9 • Contributions to the welfare of both current and future generations 10 • Regional distributions of economic activity, including employment, which are not typically considered in 11
benefit cost analysis 12 • Non-monetary implications of actions (e.g., altered water quality, habitat implications, human health, and 13
quality of life). 14 15 Generally adaptation measures will be evaluated by their net benefits, but there may be occasions when a 16 comprehensive evaluation entails multi-metric analysis unifying economic measures of costs and benefits with non-17 economic environmental quality and health measures and in some cases non-market valuation estimates. Material in 18 the section below on co-benefits and in Chapter 2 of this volume elaborates. 19 20 As elaborated in Hallegatte et al. (2011), climate change will have direct and indirect impacts, and adaptation 21 actions can aim at reducing direct and also indirect impacts. Direct impacts refer to the impacts changes in climate 22 conditions will have on productivity, installed productive capital, and amenities that affect the welfare function. 23 Indirect impacts refer to the total impact of climate change on welfare, including the impact of macroeconomic 24 effects (see, e.g., Fankhauser and Tol, 1995); general equilibrium issues and cross-sector interactions (Kemfert, 25 2002; Bosello et al., 2007); the adaptation needs and their crowding out effect on other investments (Hallegatte et 26 al., 2007) and on technical progress (Hallegatte and Dumas, 2008). Some adaptation actions can aim at reducing 27 indirect impacts. For instance, if urbanized areas cannot be protected against more intense storms with building 28 norms and dikes, the welfare effect of more disaster losses can be limited thanks to better access to insurance and the 29 creation of rainy-days funds to help affected population after disasters. An “optimal” adaptation portfolio is likely to 30 include actions that reduce direct losses and actions that reduce indirect losses (see, e.g., Ranger et al., 2011). 31 32 33 17.2.2. Toward a Realistic Assessment of Strategy Attractiveness 34 35 Given the wide variety of potential adaptation options it is obvious that some will not be chosen and also that perfect 36 adaptation is not achievable. There are a number of reasons why. The most straightforward is that while the options 37 technically would help adapt they cost in a broad sense more than the benefits obtained from implementing them. 38 39 Social and political limitations, resource competition and other factors limit the potential for strategy adoption and 40 perfect adaptation. In particular there are a number of factors that limit adaptation and also make it unlikely that 41 perfect adaptation will be achieved. A conceptual way of looking at this for a given adaptation endeavor is in Figure 42 17-1 where the various lines give the relationship between the effectiveness of adaptation which we will call welfare 43 here and adaptation investment. The lines depict various elements that limit the effectiveness of an adaptation 44 investment: 45
• A line on the far right-hand side that is the pre-climate-change welfare position showing the societal 46 welfare position before the influence of climate change which is not affected by adaptation investment, 47
• Next is a vertical line representing the engineering technical assessment of the potential of full adaptation 48 employing all available strategies but ignoring costs. This also shows some degree of unavoidable residual 49 damages. Namely under the full engineering potential, the pre climate change welfare state is not fully 50 restored and some residual damages remain, 51
• To the left of that the first sloped line portrays an economic potential measure which considers adaptation 52 costs for a strategy. This shows that the effectiveness of adaptation increases as more investment is made. It 53
ZERO-ORDER DRAFT IPCC WGII AR5 Chapter 17
Do Not Cite, Quote, or Distribute 6 25 July 2011
also shows that no adaptation investment leads to the lowest welfare position and an increase in investment 1 restores welfare back toward the pre climate change welfare state. 2
• Further to the left is a line reflecting resource limitations. This shows when multiple adaptation strategies 3 are considered they compete for common resources like land or scarce capital. 4
• Finally even further to the left is the barrier adjusted adaptation adoption curve and the amount of actual 5 adaptation that occurs which reflects limited information, and imperfect capital markets in the region where 6 the adoption would have gone on. 7
• Transactions cost of distributing adaptation funds or knowledge would also play a role. 8 9 [INSERT FIGURE 17-1 HERE 10 Figure 17-1: Title, source?] 11 12 Another way of thinking about this is that in an ideal world, adaptation would be capable of cancelling all negative 13 impacts of climate change on welfare. Of course, this will be impossible in the real world, and adaptation will not 14 prevent all climate change impacts, for several reasons: First, because the laws of physics make it impossible to 15 cancel all impacts (e.g., it will be impossible to restore outdoor comfort where temperatures get very high); Second, 16 because technical limits and insufficient knowledge will reduce our ability to reduce impacts and benefit from 17 opportunities; Third, because it will be undesirable to reduce some impacts, as the social or private cost of doing so 18 would exceed the social or private benefits. For instance, it might be possible to continue growing the same crop in 19 spite of temperature increase but it would require additional investments in irrigation infrastructure that are larger 20 than the cost of shifting to another production; Fourth, because barriers, obstacles, financial constraints and other 21 market failure will make it impossible to implement some of the economically desirable adaptation options. 22 23 This chapter discusses two policy-relevant economic questions related to adaptation: how to determine which 24 actions are socially and economically desirable? and how to remove barriers and obstacles in such a way that 25 socially and economically desirable actions are actually implemented? 26 27 A related concept which we will discuss further below is the concept of adaptation deficit (or adaptation gap) 28 (Burton, 2004). In particular, Burton observes that some regions are not well adapted to current climate and calls this 29 the “adaptation deficit”, because of the barriers and obstacles depicted in Figure 17-2. 30 31 [INSERT FIGURE 17-2 HERE 32 Figure 17-2: Title, source?] 33 34 Research on the economics of adaption has developed along two lines. A first one aims at helping decision-makers 35 to anticipate future climate change and implement policies and measures to reduce impacts as much as possible; 36 examples include Fankhauser, 1995; Yohe et al. 1995, 1996, 2011; Fankhauser et al., 1999; Dessai et al., 2009; 37 Hallegatte et al. 2011; Rosenzweig et al., and a large grey literature on adaptation options developed for different 38 regions (World Bank, ADB and others). It takes a normative point-of-view and tries to determine what should be 39 done to adapt to climate change. 40 41 A second research line aims at informing mitigation decisions by refining the assessment of the cost of climate 42 change by distinguishing adaptation costs and residual impacts, to clarify the types of adaptation efforts that have 43 been observed. This line takes a positive point-of-view and tries to determine what has been done in terms of 44 adaptation, and what its effect on climate change impacts will be (Nordhaus, 2004; Tol, 2002a,b; O’Brian et al., 45 2004; de Bruin and Dellink, 2011;Lecocq and Shalizi, 2007; Hallegatte, 2007). It is unlikely that all beneficial 46 adaptation actions will be undertaken and future adaptation may differ significantly from what is suggested by 47 normative adaptation analyses or observation of past adaptations. Depending on whether optimal or suboptimal 48 adaptation is assumed, assessments of future climate change impacts reach very different results. 49 50 51 52
ZERO-ORDER DRAFT IPCC WGII AR5 Chapter 17
Do Not Cite, Quote, or Distribute 7 25 July 2011
17.2.2.1. Adaptation as an Investment 1 2 One might anticipate that the returns to increasing levels of adaptation investment will decrease with effort. As is 3 argued in Parry et al (2009), initial benefits from adaptation can be achieved with relatively low levels of effort but 4 as the amount of adaptation increases the costs of implementation gets successively more expensive. This is 5 portrayed in Figure 17-3. 6 7 [INSERT FIGURE 17-3 HERE 8 Figure 17-3: Schematic of adaptation costs, avoided damages, and residual damage compared (a) at a point in time 9 and (b) over time.] 10 11 12 17.2.2.2. Adaptation as a Dynamic Issue 13 14 Adaptation is not a specific action, aimed at going from a stable situation to a new one that is different but stable as 15 well. On the contrary, societies will have to continually adjust to a climate that will change for centuries to come 16 (IPCC, AR5, WG1). The challenge is therefore to know how and at what price we can adapt life styles and 17 economic systems to a "perpetually changing" climate (Hallegatte, 2009). To address this challenge, it is important 18 to consider adaptation as a basically long-term transitory and transitional process. 19 20 Adaptation investments will often have persistent results. Consider the construction of seawalls, or the identification 21 of genes leading to drought resistant crop varieties. An appraisal of the desirability of a particular adaptation strategy 22 must consider the timing of investments versus the timing of benefits. This again brings up the general rubric of 23 investment analysis as virtually all investments require upfront expenditures and benefits that arise over time. 24 25 26 17.2.2.3. Project-Based Adaptation 27 28 The emergence of adaptation funds and the likelihood that substantial adaptation will be based on proposed 29 adaptation projects raises complex issues. In particular, a fund administration may examine a number of competing 30 adaptation strategies and decide upon “winners”. Much as in the language in the Kyoto Protocol regarding 31 mitigation possibilities, there are some issues conceptual that merit consideration. 32 33 The first of these are the linked concepts of baseline and additionality that arise where, as in the Kyoto Protocol 34 mitigation context, it is desirable to fund adaptation strategies that would not have occurred in the absence of that 35 funding (those that would not be autonomously adopted). This implies the need for additionality tests that check 36 whether an alternative needs to be supported given the possibility of autonomous investment. 37 38 A related concept involves adaptation strategies which expand infrastructure or augment existing infrastructure and 39 where that infrastructure addition is beneficial even in the absence of climate change. When considering a project 40 with both adaptation and development benefits, it is natural to enquire what fraction of total cost is eligible for 41 adaptation support, and what fraction should be financed by other funding. Among various possibilities, adaptation 42 funding could finance only the incremental cost attributable to adaptation, i.e. the additional cost of a development 43 project required for adaptation to anthropogenic changes in climate conditions. If a dike system is 10% more 44 expensive because of adaptation to sea level rise, this amount could be financed by an adaptation fund, while the rest 45 would be financed by other means. The adaptation of existing infrastructure might involve upgrades and thus an 46 incremental cost. These projects would be pure adaptation projects and be funded at 100%. 47 48 Some countries have investments that are currently below optimal levels (called in deficit below) that are also useful 49 in adapting to climate change. This investment in these potential adaptation strategies would be needed even in 50 absence of further climate change. In turn when considering that particular investment as an adaptation possibility 51 one has to choose whether to fund the correction of the existing deficit as well as additional adaptation needs. For 52 example irrigation investment may be beneficial under current conditions and even more so under additional climate 53 change. Funding only the additional needs may be efficient from a strict adaptation viewpoint (in economic terms), 54
ZERO-ORDER DRAFT IPCC WGII AR5 Chapter 17
Do Not Cite, Quote, or Distribute 8 25 July 2011
but to the extent that valuable currently-needed projects are not undertaken because of a lack of other funding this 1 can be inefficient in terms of overall resource use.. 2 3 Another important concept is that of leakage, where adaptation investments may augment or reduce commodity 4 production, in turn changing market prices and potentially negatively affecting adaptation decisions elsewhere: this 5 is explored in a mitigation context by Murray, McCarl and Lee. A test for whether leakage is significant is whether 6 there is any diversion of goods from traditional markets because of the adaptation. For example an adaptation that 7 manufactures wetlands on existing croplands should consider the leakage in adaptation elsewhere because 8 commodity production has been reduced and will be replaced elsewhere. 9 Third there is likely to be some need to deal with performance uncertainty in the effectiveness of adaptation 10 strategies: claims about the effectiveness in adapting to climate change are subject to substantial uncertainty (i.e. for 11 exactly how long a sea wall would provide protection). In such a case it may be worthwhile placing a lower 12 confidence interval on adaptation potential. See Kim and McCarl further development of this concept in mitigation 13 setting. 14 15 Finally there is the concept of permanence where one needs to consider the duration of the adaptation investment 16 and not assume that the result persists forever. 17 18 19 17.2.2.4. Burden Sharing 20 21 The existence of adaptation funds certainly raises the dual issues on the donor side of: Who funds adaptaion? and 22 How much? Similarly on the recipient side: Who should receive adaptation investment assistance? How much? and 23 For what? There has been work on this regarding general considerations of liability and ethics; political issues, 24 polluters pay principles and North-South issues. 25 26 27 17.2.3. Adaptation and Mitigation as Competitive Investments 28 29 AR4 WGII chapter 18 presents a discussion of trade-offs and synergies between adaptation, mitigation and climate 30 change damages. In a more general setting these are rival goods where investments in one strategy might preclude 31 investments in another whether it be an alternative adaptation or a mitigation strategy. There is also rivalry with 32 traditional production enhancing investment where large adaptation or mitigation investment programs preclude 33 productivity enhancing investment. Additionally there is resource competition where mitigation and adaptation may 34 well act on the same lever (e.g., infrastructure, land-use planning) and in fact compete with traditional production. 35 For example some adaptation strategies require land-use change as do some mitigation strategies and land is limited 36 plus can be used for traditional production of food, fiber and ecological goods. This implies a portfolio approach is 37 needed considering the overall returns across all three possibilities (See Wang and McCarl of De Bruno et al) 38 39 Adaptation and mitigation are however also complementary. Because mitigation reduces the uncertainty on future 40 changes in climate, it makes adaptation easier, and thus more efficient (Hallegatte et al., 2010). 41 42 Also, some adaptation policies have mitigation co-benefits, such as a better building insulation that reduces air 43 condition needs in summer, but also heating needs in winter. On the other hand, some adaptation policies have 44 mitigation co-costs, such as the generalization of air conditioning or sea water desalinization. 45 46 47 17.2.4. Inter-Relationships between Adaptation Costs and Residual Damage 48 49 Some adaptation to climate change, as noted above, is inevitable and needed under current conditions. There are at 50 least three reasons why in most cases complete adaptation will not be achieved: 1) Cost-effectiveness – while there 51 are many cases where the costs of adaptation are less than the damages of not adapting, there are also cases where 52 adaptation is much more expensive than the benefits it would generate; 2) Barriers – even if cost-effectiveness is not 53 a relevant criterion, it is not possible to adapt effectively to all effects of climate change due to technological or 54
ZERO-ORDER DRAFT IPCC WGII AR5 Chapter 17
Do Not Cite, Quote, or Distribute 9 25 July 2011
other barriers as discussed above; 3) Uncertainty in effects and benefits –the effects of climate change in some cases 1 may be unknown as may be the benefits to adaptation, making it impossible to react/adapt effectively or secure 2 investment in adaptation. If we accept that adaptation will not completely offset climate change then there will be 3 “residual” damages (Parry et al). In this section, we explore the relationships between adaptation and the extent of 4 residual damages. 5 6 7 17.2.4.1. Defining Residual Damage 8 9 Assessing impacts and adaptation options can be done using counterfactual “IAV (Impacts Adaptation and 10 Vulerability)-baseline” scenarios, i.e. scenarios that assume no climate change (and thus no impacts). A comparison 11 between an IAV-baseline and a scenario including climate change and its impacts gives information about the costs 12 and benefits of adaptation actions. 13 14 Adaptation would be undertaken in response to the threat of negative impacts from climate change – as a result, 15 impact assessment and adaptation analyses are usually linked. Impact assessment is usually undertaken by a linear, 16 step-by-step process that involves (1) estimating changes in climate; (2) estimating biophysical effects of those 17 changes in climate, (3) estimating the impacts on human and natural systems that result from those biophysical 18 effects, and then, in at least some cases (4) valuing or monetizing these effects. This step-by-step linear approach is 19 sometimes called the "damage function" approach. A damage function in its simplest form therefore links changes in 20 climate parameters to economic damage. Recent research suggests that the damage function approach, under some 21 conditions, may be both overly simplistic (Freeman, 2003) and sometimes is subject to serious errors (Strzepek and 22 Smith, 1995; Strezpek et al., 1999). Nonetheless, the concept is useful in thinking about adaptation. If we have a 23 damage function for impacts of climate change, then we can also imagine an adaptation benefits function that gives 24 the degree of avoided impacts as a function of adaptation investment. 25 26 As noted above there are constraints on fully adapting, which include cost, technical and about residual climate 27 change impacts. Unlike SRES scenarios that have been designed mainly to serve as baselines to assess mitigation 28 policies, IAV-baseline scenarios will be used to assess impacts and adaptation policies and may include emission 29 reduction policies. 30 31 IAV analyses based on this scenario approach frequently focus on a region or a subsystem (e.g., an ecosystem, an 32 economic sector), and assume that the rest of the world is left unaffected by climate change and follows the 33 evolution described in the baseline scenario. As a consequence, they often do not take into account the interactions 34 of climate change impacts among regions, such as through commodity trade, or subsystems such as when water, 35 energy, and agriculture interact. Moreover, this approach may create inconsistencies as it fails to include how the 36 impacts of climate change modify GHG emissions. 37 38 The scenario approach may also be questionable in cases of impacts that are so large that the scenario including 39 climate change differs substantially from the baseline scenario. In that case, the vulnerability determinants (e.g., the 40 number of people with no access to drinking water and sanitation) may be significantly different in the IAV-baseline 41 and in the climate-change scenarios, and baseline vulnerabilities cannot be used to assess climate change impacts. 42 Nevertheless, this methodology makes possible the investigation of individual regions and subsystems 43 independently from each other, a crucial advantage in IAV analysis. 44 45 There is another approach used to investigate IAV issues, based on global-scale Integrated Assessment Models 46 (IAMs) such as IMAGE, MiniCAM, MERGE, AIM, among others. These models do not share the same limits as 47 scenario-based approaches. In particular, they are able to provide insights on interactions among impacts and to 48 explore possible systemic changes due to climate. They can also include the feedback from impacts to emissions. 49 But IAMs cannot replace detailed local and subsystem IAV analyses, which are too complex for global-scale 50 analysis. 51 52 Adaptation would be undertaken in response to the threat of negative impacts from climate change – as a result, 53 impact assessment and adaptation analyses are usually linked. Impact assessment is usually undertaken by a linear, 54
ZERO-ORDER DRAFT IPCC WGII AR5 Chapter 17
Do Not Cite, Quote, or Distribute 10 25 July 2011
step-by-step process that involves (1) estimating changes in climate; (2) estimating biophysical effects of those 1 changes in climate, (3) estimating the impacts on human and natural systems that result from those biophysical 2 effects, and then, in at least some cases (4) valuing or monetizing these effects. This step-by-step linear approach to 3 effects estimation is sometimes called the "damage function" approach. A damage function in its simplest form 4 therefore links changes in climate parameters to economic damage. Recent research suggests that the damage 5 function approach, under some conditions, may be both overly simplistic (Freeman, 2003) and sometimes is subject 6 to serious errors (Strzepek and Smith, 1995; Tol, 1996; Strezpek et al., 1999). Nonetheless, the concept is useful in 7 thinking about adaptation. If we have a damage function for impacts of climate change, then we can also imagine an 8 adaptation benefits function that gives the degree of avoided impacts as a function of adaptation investment. 9 10 As noted above there are constraints on fully adapting, which include cost, physical barriers, and uncertainty in 11 effects. In the climate change context, these constraints also encompass the objective of prioritizing the response 12 between goals of mitigating and adapting to climate change. These constraints are neatly summarized in Parry et al. 13 (2009; see Figure 17-3). Here, the costs of adaptation, mitigation, and climate impacts are viewed as three sides of a 14 triangle, with the realization that all three cannot be simultaneously optimized and there are tradeoffs to contend 15 with. Allocating resources to mitigation and/or to adaptation are choices, while the levels of impacts represent an 16 outcome that results from the choice to invest in mitigation, adaptation, or both. They also involve diversion of 17 goods and services from non climate forms of investment and current consumption (de Bruno et al). This concept 18 therefore provides a definition to distinguish costs of adaptation from “residual” impacts, at least for planned 19 adaptation actions – that is, the costs of adaptation are planned investments, while residual damages result from the 20 inability to fully adapt. 21 22 In the climate change context, residual damages are those damages of climate change that remain after adaptation 23 (and mitigation) actions are taken. Some literature has attempted to more definitively define residual damages; the 24 U.S. National Academy of Sciences, for example, distinguishes potential impacts (defined as, “All impacts that may 25 occur given a projected change in climate, without considering adaptation”) from residual damages (defined as, 26 “The impacts of climate change that would occur after adaptation”) (U.S. National Academy of Science 2010). 27 Others have simply identified residual damages as those that remain after adaptation is implemented (World Bank 28 2010). Using the concept of an adaptation function, which illustrates the degree to which impacts may be avoided as 29 a result of investment in adaptation, residual damages are those that remain after an investment choice is made. In 30 the broadest context, however, residual damages could also include impacts for which no adaptation measure is 31 available to effectively mitigate the climate damages. 32 33 Straightforward examples of adaptation benefits and residual damages can be developed in the context of responding 34 to sea-level rise. Absent adaptation, sea-level rise is expected to lead permanent inundation of some coastal property, 35 accelerated erosion of beaches, more extensive damage from storm surges (owing to a higher “launch point” for 36 ocean surges), forced migration, loss of coastal wetlands, and increased intrusion of salt water to coastal freshwater 37 aquifers, among others. A multitude of adaptation options exist for responding to most of these impacts – most often 38 considered are seawalls, beach nourishment, and planned retreat of human settlements. Seawalls are expensive, but 39 they can be engineered to effectively mitigate permanent inundation, and a wide range of literature finds that their 40 costs are justified by this benefit (Nicholls et al. 2009; Hallegatte et al., 2011; Neumann et al. 2010, Neumann et al. 41 2011). Seawalls do nothing to reduce saltwater intrusion, however – and few options have been identified to 42 effectively adapt to the loss of freshwater resources. The saltwater intrusion impact would therefore be a residual 43 impact. In addition, seawalls may hasten the loss of wetlands resources, by preventing the natural process of wetland 44 migration (a process sometimes referred to as “coastal squeeze” – see USGCRP 2009). In the case of an adaptation 45 action itself leading to an adverse impact such as this, the definition of a residual impact is less clear – is the loss of 46 wetlands attendant to construction of seawalls a residual impact, or an additional, non-monetized cost of adaptation? 47 48 _____ START BOX 17-1 HERE _____ 49 50 Box 17-1. Disaster Risk Reduction, Adaptation, and Residual Risks 51 52 Adaptation and risk management have high synergies. But the residual risk from natural hazards will depend upon 53 how much adaptation is carried out. Risk and adaptation analyses provide comparisons of the impacts of sea level 54
ZERO-ORDER DRAFT IPCC WGII AR5 Chapter 17
Do Not Cite, Quote, or Distribute 11 25 July 2011
rise (in absence of adaptation) and the cost of adaptation (to cancel all impacts from sea level rise) for various 1 amplitudes of sea level rise. This is shown for the city of Copenhagen in Figure 17-4, which shows the mean annual 2 losses due to storm surges, as a function of the level of protection (in cm), for the current sea level and with 50 cm 3 of sea level rise. 4 5 [INSERT FIGURE 17-4 HERE 6 Figure 17-4. Illustrative example assuming a homogenous protection at 180 cm above current mean sea level (in the 7 ‘No SLR’ and ‘50 cm SLR’ cases). The vertical arrow shows the cost of SLR in absence of adaptation. The 8 horizontal arrow shows the need for adaptation to maintain mean annual losses unchanged.] 9 10 Assuming as an illustration that the city is homogenously protected by dikes at 180 cm above current mean sea 11 level, the vertical arrow shows the cost of 50 cm of SLR, which is the increase in mean annual losses due to a 50 cm 12 SLR in absence of adaptation (i.e. with no change in the 180 cm protection level).The horizontal arrow in Figure 17-13 4 shows the need for adaptation, i.e. by how much the protection level should be increased to maintain unchanged 14 the mean annual losses due to coastal floods. Using dike cost estimates, this need for adaptation can be translated 15 into adaptation costs. 16 17 Figure 17-4, therefore, shows both the cost of SLR in absence of adaptation, and the cost of adaptation to cancel 18 SLR impacts. These cases are two specific options, but other possibilities exist: for instance, one can decide to 19 upgrade protection so that annual mean losses are reduced compared with the current cases (i.e. to do more than 20 adaptation). This figure can be used to carry out cost-benefit analysis of coastal protection upgrades in a climate 21 change context. 22 23 Source: Hallegatte et al. (2011) 24 25 _____ END BOX 17-1 HERE _____ 26 27 28 17.2.4.2. The Cost of Adaptation 29 30 Many autonomous and planned adaptations are costly to implement, but not all studies have defined the costs of 31 adaptation in the same way. Some literature defines the cost of adaptation as simply an additional investment cost to 32 achieve a predefined goal, such as infrastructure provision – climate change in this case would simply be an 33 additional factor to be overcome to complete specific projects (use UNFCCC study as an example here?). A full 34 accounting for the costs of adaptation needs to consider capital, operating, and nonmonetary costs of adaptation, 35 perhaps considering a metric other than monetary units. Nonetheless, an economic approach to the total cost of 36 adaptation would consider at least some of the constraints noted above, and therefore would likely take one of two 37 definitions: 1) Costs of adaptation are the full range of costs incurred to undertake all adaptation measures where 38 these costs are less than their attendant benefits conferred; 2) Costs of adaptation are the full range of costs incurred 39 to restore economic welfare to pre-climate change levels (World Bank 2010 following classical economic literature 40 on compensation levels). In terms of individual projects this would include the costs of fully implementing a given 41 adaptation strategy including the opportunity cost of the funds used. 42 43 A further issue in defining the cost of adaptation is isolating costs incurred to adapt to climate change from costs that 44 might be incurred for other purposes. This is a common problem in economic analyses, and typically involves 45 specifying a reasonable counterfactual case. If such a baseline can be developed, the costs of adaptation can, in 46 theory, be isolated from costs of actions that would otherwise be undertaken. The task is complicated, however, by 47 the long time frames over which climate change will occur. For example, identifying a baseline for agriculture, with 48 climate change, over the next forty to 100 years is a formidable task, particularly because it can be argued that the 49 last two or more decades of history have already been affected by climate change. In addition, the presence of an 50 adaptation or development deficit also complicates the task. 51 52 In some cases, it may be argued that the distinction is not important – investments ought to be evaluated using the 53 best forecast of future conditions, which ought to include changing climate. Further, if an adaptive strategy is 54
ZERO-ORDER DRAFT IPCC WGII AR5 Chapter 17
Do Not Cite, Quote, or Distribute 12 25 July 2011
effective in responding to a climate challenge, such as reduced water availability for agriculture, but that same 1 strategy is determined to be a good investment in response to the current adaptation or development deficit, would 2 we label that strategy as climate adaptation? And should the costs of that measure be included among the costs of 3 adaptation, if the measure could have been justified as welfare-enhancing regardless of climate change? Many 4 analysts continue to struggle with these questions [add citations] 5 6 7 17.2.5. Relating the Cost of Adaptation to Residual Damages 8 9 Generally it is expected that as adaptation investment goes up residual damages will go down. But in this 10 relationship the expectation is that an increased increment in adaptation spending will have diminishing marginal 11 effects on residual damages.. 12 13 14 17.2.5.1. The Adaptation Deficit and Adaptive Capacity 15 16 Many regions can be considered to be well adapted to current climate. However many others exhibit an ‘adaptation 17 deficit,’ meaning that there are available adaptation strategies that could be beneficially implemented independently 18 of any change in the climate. A poor state of adaptation to current climate, which may involve deficiencies in some 19 or all of the above factors for any of a number of sectors vulnerable to climate change, is often characterized as an 20 adaptation deficit (World Bank 2009). Many developing countries have such a deficit with respect to current climate 21 and are likely to have a rising deficit as climate change evolves. 22 23 The potential for adaptation and thus alleviation of an adaptation deficit reflects social structures, institutional 24 capacity, knowledge and education, access to infrastructure and, financial resources. Many of the same factors that 25 contribute to an adaptation deficit to current climate are also indicative of low adaptive capacity for future climate 26 changes. 27 28 29 17.2.5.2. Costs and Benefits at Alternative Levels of Aggregation 30 31 This section reviews how to evaluate the costs and benefits of adaptation at different levels of aggregation, and 32 discusses key methodological issues raised by these questions. It provides a review of global figures, and examples 33 from sectors and/or regions. The assessment of costs and benefits of adaptation is a rapidly evolving field. As the 34 international community collectively has moved towards implementing adaptation measures, there has been 35 considerable progress in identifying the costs and benefits of adaptation since the last IPCC report. 36 37 38 17.2.6. Methodological Considerations 39 40 Over the last few years, a wide range of methodologies using different metrics, time periods and assumptions has 41 been developed and applied for assessing adaptation costs and benefits. For a recent survey focusing on Europe, 42 Watkiss and Hunt (2010) identify the following types of analysis: investment and financial flows, impact assessment 43 based adaptation analysis, macro-economic model assessments, risk management assessments, cost-benefit analysis, 44 cost-effectiveness analysis and portfolio/real options analysis (see Table 17-1). 45 46 [INSERT TABLE 17-1 HERE 47 Table 17-1: Methodologies for the economic assessment of climate change and adaptation.] 48 49 These methodologies serve different purposes, look at different time and spatial scales and assess adaptation to 50 different hazards (slow vs. sudden onset events). 51 52 53 54
ZERO-ORDER DRAFT IPCC WGII AR5 Chapter 17
Do Not Cite, Quote, or Distribute 13 25 July 2011
17.2.6.1. Data Quality and Quantity 1 2 Callaway (2004) highlights the fact that one of the major challenges in identifying the costs and benefits of 3 adaptation is the low quality and extent of sector level data, especially in many developing countries. Further, he 4 notes the importance of the informal economies and social networks in many countries, where the transactions that 5 are part of the adjustment to climate variability and climate change are unreported. 6 7 Hughes et al (XXXX) discuss the difficulty in identifying the costs of adaptation for water infrastructure in OECD 8 countries. Even in these countries, an assessment of adaptation costs was made difficult by patchy historical data 9 sets. Further, they note too that historical weather data is not sufficiently detailed to estimate climate data needed for 10 infrastructure planning, such as 24h precipitation. There is also very little data on the costs of retrofitting an existing 11 house for increased hurricane resistance in the US (Bjarnadottie et al. 2011) and estimates have a very broad range. 12 These are important for identifying the costs of different adaptation measures. There is very little discussion in the 13 literature on data gaps related to assessing the benefits of adaptation. 14 15 16 17.2.6.2. Costs and Benefits are Location-Specific 17 18 According to Hughes et al. (2010) different underlying growth rates between different regions may affect total costs 19 of adaptation. They found large regional differences in adaptation costs in water services between different regions 20 with a range going from about 13% of baseline costs for Eastern Europe to a small cost savings for North America. 21 22 Calculating distributional impacts requires detailed geographical knowledge, but these are a major source of 23 uncertainty in climate models. Compared with developed countries, there is also a limited understanding of the 24 potential market sector impacts of climate change in developing countries. 25 26 27 17.2.6.3. Costs and Benefits Depend on Socio-Economics 28 29 The future level of adaptive capacity in human and natural systems will affect how society will be impacted by 30 climate change. Assessments may under- or overestimate adaptive capacity, leading to under- or overestimates of 31 positive or negative impacts. It is sometimes assumed that climate will change but society will not (Pielke, 2007: cf. 32 Pielke and Sarewitz, 2005; Adger et al., 2003; Lorenzoni et al., 2000). Loss estimates do not in that case include the 33 likely increases in society’s exposure to extreme events (Pielke, 2007). 34 35 Future predictions of development affect estimates of future climate change impacts, and in some instances, 36 different estimates of development trends lead to a reversal from a predicted positive, to a predicted negative, impact 37 (and vice versa).Some studies have examined the impact of different regional growth rates on hurricane damage and, 38 as expected, higher growth rates present greater potential for higher damage because property is more exposed to 39 hurricane damage (Bjarnadottir, 2011). On the other hand, higher incomes allow to fund risk-reducing policies (from 40 flood protection to more robust buildings), which reduces vulnerability. 41 42 Lucena et al. (2010), in studying impacts on the Brazilian energy sector, note that there are socioeconomic costs and 43 benefits that are difficult to assess and measure and include direct damage caused by climate change impacts as well 44 as the cost involved in attenuating those impacts. They note that there are however significant market barriers that 45 obstruct the adoption of least-cost adaptation options. In a study on hurricane damage to houses in the US, the 46 analysis focused on benefits in terms of reduced building damage to home owners. However, other benefits, that, 47 although difficult to monetize, such as reduced social disruption, reduced business losses, reduced need for 48 emergency services which would make adaptation strategies more cost effective than shown (Bjarnadottir et al., 49 2011; Hallegatte and Przyluski, 2011). 50 51 52 53
ZERO-ORDER DRAFT IPCC WGII AR5 Chapter 17
Do Not Cite, Quote, or Distribute 14 25 July 2011
17.2.6.4. Discount Rates Matter 1 2 The core question is how much weight to place on future costs and benefits relative to present costs and benefits. 3 Opinions vary sharply on how to answer this question, leading to major debate (Baum, 2009). It is impossible to 4 know the preferences of future generations, which affects the valuation of costs and benefits (DeCanio, 2007:4). 5 Dietz et al (2007) note that a low discount rate is almost always needed for uncertain dangerous climate change in 6 the far-off future to matter. A low discount rate is one of the primary reasons why the estimates of climate damage 7 presented in the Stern Review are high. 8 9 It is important to recognize that there are two different discount rates – the pure rate of time preference or utility 10 discount rate, and the social discount rate, the two being related by the famous Ramsey formula: 11
12 where s is the social discount rate, d the utility discount rate, n elasticity of the marginal utility of consumption and 13 Rc the rate of growth of consumption. For the type of projects considered in this chapter, the relevant rate is the 14 social discount rate, the rate to be used in partial equilibrium project evaluation (see Heal …). The value of this 15 depends on the pure rate of time preference, which is now often taken to be very small - Stern takes this to be 0.1%, 16 Heal puts it at 0, as did Ramsey in his original study of optimal economic growth – and on the value assumed for the 17 elasticity. This is generally taken to be between 1 and 2.5, although there are no particularly good arguments for this 18 (see Heal). For project evaluation the growth rate is exogenous and whatever is appropriate for the economy under 19 consideration. As Heal ( ), Guesnerie ( ) and Sterner and Persson ( ) point out, allowing a flow of environmental 20 services to enter consumption can change the social discount rate substantially, as it is reasonable to assume that 21 climate change will affect the flow of environmental services negatively. This can generate a negative growth rate 22 and a low or even negative social discount rate. 23 24 Some authors have provided comprehensive sensitivity analysis of the effect of a range of value judgments (i.e. 25 discounting, time horizon calculations) and scientific uncertainties (damages, baseline, climate sensitivity and 26 abatement costs). Hof et al (2010) use social discount rates, which is the value that society places to present 27 consumption relative to future consumption (Guo et al. 2006: in Hof et al 2010). Nordhaus chooses a value of 1.5% 28 for the utility discount rate (which can be combined with the elasticity of marginal utility of consumption to lead to 29 the discount rate overall as in the Ramsey equation above) while Stern as mentioned uses a much lower value of 30 0.1%. Nordhaus emphasizes the consistency with the rate of return on investment as a driving rationale while Stern 31 points to ethical issues. Heal ( ) notes that the pure rate of time preference, being a value judgment, cannot be 32 derived from observational data: he describes Nordhaus’s argument as deriving an “ought” from an “is,” a 33 categorical error in philosophy. 34 35 Weitzman (2001, 2007) treats the discount rate as random and points out that we should in this case average 36 different discount factors instead of discount rates. Wen (in: Bjarnadottir et al (2011)) investigates the sensitivity of 37 optimal design against multi-hazards to discount rates varying from 0% to 9%. He proposes using a decreasing 38 discount rate, which is also that used by the Green Book of the UK Treasury for long-term appraisals (from Hof et 39 al, 2010). 40 41 42 17.2.7. Adaptation and Development 43 44 It may be important to consider the relationship between actions taken to improve adaptive capacity and actions 45 taken to enhance economic development, particularly in lesser developed countries. Development goals can be 46 consistent with goals to improve adaptive capacity, but adaptation and development goals will not always align. 47 Depending on the context, economic development goals may focus on improving education, public health, 48 infrastructure, agricultural productivity, technology, or governance, among others. Many of these priorities could be 49 enhanced thorough adaptation actions. For example, road construction practices might be altered to accommodate 50 higher temperatures and more intense rainfall (World Bank 2009); agricultural investments might increase drought 51 resiliance (Strzepek et al. 2010); and public health investments might be oriented toward increasing resistance to 52
s = d + n.Rc
ZERO-ORDER DRAFT IPCC WGII AR5 Chapter 17
Do Not Cite, Quote, or Distribute 15 25 July 2011
climate-enhanced diseases (Tol and Dowlatabadi 2001; Samet 2009). It is also the case that development in general 1 will make more resources available for adaptations such as flood protection and infrastructure strengthening. 2 3 A relevant question therefore concerns whether economic development should be considered a form of adaptation. If 4 it is reasonable to assume that GDP-enhancing adaptation would diminish the effects of residual damages it may be 5 a better investment than either greenhouse gas mitigation or climate adaptation projects (Schelling 1992, Schelling 6 1997, Tol 2005). Very little research has yet been conducted to resolve this question, although efforts have begun to 7 assess the effect of investments in adaptation on overall economic productivity. Models that include dynamic effects 8 suggest that reductions in economic output and diversions of capital to defend again climate impacts through 9 adaptation could have larger implications for economic growth over time than the direct effects of climate change 10 (Fankhauser and Tol 2005) [also cite World Bank EACC country studies here?]. 11 12 There certainly will be tradeoffs between economic development and adaptation due to scarcity of financial 13 resources (Tol 2005, Fankhauser and Tol 2005). Broad generalizations on the relationship between growth and 14 climate adaptation should be avoided, however, because the limits to growth vary substantially in each country as 15 does the degree to which growth and adaptation goals overlap, and therefore we could expect that the relative value 16 of investments in sustained growth and adaptation will differ by country and even within countries. What is needed 17 is detailed bottom-up analyses of the effects of adaptation in the short- and long-term, coupled with top-down 18 analyses that take better account of the effect of economic dynamics such as capital accumulation and how those 19 dynamics are affected by climate, adaptation, and economic development policies. 20 21 [Investigate the link with sustainable development and resilience literature {SH} – see Bowen and Fankhauser 22 2010? More about green growth than adaptation, though. World Bank 2009a [not sure how to address this one…just 23 defining sustainable development is not easy.] 24 25 The IPCC Special Report on extreme events, disaster risk management and adaptation shows that sustainable 26 development is an international goal that can be threatened in some areas by climate change, thus climate change 27 adaptation is a component long-term sustainability (Wilbanks and Kates, 2010). The most widespread definition of 28 sustainable development comes from the Brundtland Commission Report, which defined sustainable development as 29 “development that meets the needs of the present without compromising the ability of future generations to meet 30 their own needs” (WCED, 1987). A number of principles of sustainable development have emerged, including the 31 achievement of a standard of human well-being that meets human needs and provides opportunities for social and 32 economic development; that sustains the life support systems of the planet; that broadens participation in 33 development processes and decisions; and that accelerates the movement of knowledge into action in order to 34 provide a wider range of options for resolving issues (WCED, 1987; NRC, 1999; Meadowcroft, 1997; Swart et al., 35 2003; MEA, 2005). 36 37 Discussions of relationships between sustainable development and climate change have increased over the past 38 decades (Cohen et al., 1998; Yohe et al., 2007; Davis, 2001; Garg et al., 2009; Bizikova et al. 2010). Climate 39 change-related environmental changes may threaten sustainable development, especially if the trends or events are 40 severe enough require significant adjustment of development paths(e.g., the relocation of population or economic 41 activities to less vulnerable areas). In such cases, adaptation is necessary for sustainable development. 42 43 Resilience refers to a systems concept and approach that examines how systems deal with and shape disturbance and 44 surprise (Walker and Salt, 2006; Folke, 2006; Brand and Jax, 2007). Approaches that focus on resilience emphasize 45 the need to manage for change, to see change as an intrinsic part of any system, social or otherwise, and to ‘expect 46 the unexpected’. Resilience thinking contrasts with the conventional engineering systems emphasis on capacity to 47 control and absorb external shocks in systems assumed to be stable, towards managing the capacity of evolving 48 social-ecological systems to cope with, adapt to and shape change (Folke, 2006). Because of its focus on how to deal 49 with uncertainty, the adaptation literature has increasingly included resilience in its approaches and methodologies. 50 51 [Adapted from the SREX report, Chp 8] 52 53 54
ZERO-ORDER DRAFT IPCC WGII AR5 Chapter 17
Do Not Cite, Quote, or Distribute 16 25 July 2011
17.3. Decisionmaking and Economic Context for Adaptation 1 2 This section will cover the nature of adaptation activities and the actors who might implement them. We will focus 3 on decision-making, and on limits and obstacles to efficient adaptation. Existing assessments have shown that, 4 depending on whether adaptation is carried out with perfect information and anticipation, its impacts will eventually 5 be very different. Examples include building and urbanism (Hallegatte et al., 2007), coastal zone management (Yohe 6 et al. 1995, 1996, 2011; Hallegatte et al. 2011;West et al., 2001), agriculture; water (agriculture and water?).?). 7 8 9 17.3.1. Autonomous Adaptation and Planned Adaptation 10 11 By definition autonomous adaptation actions will be undertaken by individuals and groups in their own best interest. 12 A substantial degree of adaptation can be observed in any climate dependent industry where for example agricultural 13 cropping patterns vary geographically, adapting to local temperature and rainfall conditions. Furthermore, 14 autonomous adaptation is facilitated by depreciation in capital stocks and obsolescence of technology. Tractors wear 15 out and pesticides become less effective over time. In such settings there is continuous replacement investment, 16 which provides opportunities that facilitate autonomous adaptation. 17 18 By definition autonomous adaptation actions will be undertaken by individuals and groups in their own best interest. 19 A substantial degree of adaptation can be observed in any climate dependent industry where for example agricultural 20 cropping patterns vary geographically, adapting to local temperature and rainfall conditions. Furthermore, 21 autonomous adaptation is facilitated by depreciation in capital stocks and obsolescence of technology. Tractors wear 22 out and pesticides become less effective over time. In such settings there is continuous replacement investment, 23 which provides opportunities that facilitate autonomous adaptation. 24 25 Climate change adaptation will require action by many actors, including individuals and households, firms and 26 businesses, communities, labor unions, interest groups, NGOs, the public sector (including government and local 27 authorities), international agencies and regional and bilateral collaboration organizations. But their action is 28 influenced the existence of incentives. 29 30 The mitigation of climate change is a public good: it affects everyone, and those who do not pay for it cannot be 31 prevented from benefitting from it. The case of adaptation is different. Adaptation only reduces certain risk 32 categories, most often in very specific geographic zones, and the adapting agent often captures the benefits.In many 33 cases economic actors have thus a direct incentive to adapt. In economic terms, there are cases where adaptation 34 produces private goods. For example, reinforcing a building so that it will be able to withstand bigger storms is 35 largelyof benefit to the inhabitants of this building. In certain cases, adaptation can also produce what areknown as 36 "club" goods or services, i.e., access to a seasonal forecasting system for a fee. It can produce public goods, but ones 37 that are most often related to a specific region or a specific sector, i.e., a seawall that indiscriminately protects all of 38 the people who live behind it. Indeed adaption of a large apartment building is a local public good or a club good, as 39 it benefits all who live in the building and perhaps those in the surrounding area. 40 41 Economic theory suggests that in an ideal world, private goods like privately beneficial autonomous adaptations 42 would be produced by the individuals or firms whobenefit from them, and not by governments. For example, if an 43 individual installs an air-conditioner in his home, he will take advantage of it during the next heat wave. 44 45 However, there are circumstances in which the private production of adaptation by households or firms (sometimes 46 referred to as "spontaneous adaptation") risks being insufficient, and where public intervention for adaptation is 47 justified from the point of view of economic theory for reasons of equity and/or efficiency (Lecocq and Shalizi, 48 2007; Hallegatte et al., 2011). These reasons can be organized in a few categories: difference in definitions of 49 adaptation; issues related to information, transaction costs and market barriers; issues related to externalities, moral 50 hazards, and other market failures; issues related to the assessment of risk and to behavioral economics. 51 52 53 54
ZERO-ORDER DRAFT IPCC WGII AR5 Chapter 17
Do Not Cite, Quote, or Distribute 17 25 July 2011
17.3.2. What are the Objectives of Adaptation? 1 2 Adaptation is a process dedicated to responding to climate change, but its objectives can be diverse. At one extreme 3 we might have the objective of cancelling all impacts (negative and positive) of climate change and maintaining 4 maintain the status quo ante. Another possible objective is to cancel all adverse impacts and capture all positive 5 opportunities, so that the welfare gain (or loss) from climate change is maximized (or minimized).This is the IPCC 6 (2007) definition of adaptation. But these general objectives can be translated in many ways into operational rules. 7 The effects and outcomes of policies are often measured using classical economic indicators like GDP or cost 8 benefit tests. The limits of such indicators are well known, and have been summarized in several recent reports (e.g., 9 CMEPSP, 2009; OECD, 2009). These limits include taking into account depletion of natural resources, welfare 10 impacts of environmental change, and distributional issues. 11 12 Aggregated impacts of climate change can indeed hide large redistributive impacts (Tol et al., 2004, Stern, 2006; 13 O’Brian et al., 2004), and adaptation may also consider limiting or cancelling these impacts. In that case, adaptation 14 can include redistribution from winners to losers (or, equivalently, for those who lose little to those who lose a lot), 15 and compensation of welfare losses. This redistribution issue is linked to the question of historical responsibility, 16 which is largely discussed in the literature on adaptation support and funding (O’Brien et al., 2010b; Farber, 2007). 17 Climate change impacts are also cultural (e.g., loss of historical heritage, loss of traditional livelihood) (literature) or 18 environmental (e.g., loss of coastal wetland) (literature), and adaptation can aim at preserving these assets. The 19 economic value attributed to these assets is linked to the services they provide (literature) and to ethical 20 considerations (literature). 21 22 Cancelling all impacts of climate change is likely to be impossible, for reasons linked to the law of physics (e.g., it 23 will be impossible to restore outdoor comfort where temperatures get very high) and to technical limits. 24 But doing so would anyway be undesirable, as the cost would exceed the benefits. For instance, it might be possible 25 to continue growing the same crop in spite of temperature increase but it would require additional investments in 26 irrigation infrastructure that are larger than the cost of shifting to another production (example from the agriculture 27 literature). 28 29 A part of the branch of the literature in this area insists on the need to see adaptation as a continuous, adaptive, 30 flexible process, based on learning and adjustments. This branch emphasizes the need for change to preserve welfare 31 in spite of climate change, and opposes the static view of adaptation as aiming to maintain a status quo (literature 32 from SREX Chp 8). Consistently, many adaptation projects emphasize the role of learning, experimenting, and using 33 reversible and adjustable strategies (Berkhout et al., 2006; Pelling et al., 2007; Leary et al., 2008; McGray et al., 34 2007; Hallegatte, 2009; Hallegatte et al., 2011c). 35 36 Adapting to climate change will imply trade-offs with other policy goals such as economic development and poverty 37 reduction (Barnett and O’Neill, 2010; Beckman, 2011; Bigio and Hallegatte, 2011; Viguie and Hallegatte, 2011; 38 Owour et al., 2011; Ericksen et al., 2011), mitigation policy objectives and other environmental goals (Wilbanks and 39 Sathaye, 2007; Wilbanks, 2010; Hallegatte, 2009; Yohe and Leichenko, 2010; Bizikova et al., 2010), or among 40 scales of action (from communities and cities to regions and states, see Wilbanks, 2007, Corfee-Morlot et al., 2011). 41 42 43 17.3.3. Information, Transaction Costs, and Market Barriers 44 45 A transaction cost is a cost incurred in making an economic exchange (Coase, Williamson). Transaction costs 46 include the cost of accessing markets, the cost of accessing information, and the cost of reaching an agreement 47 among economic parties. When contracts are incomplete, transaction costs also include enforcement costs, to make 48 sure parties respect contracts. Because of transaction costs, an exchange that is beneficial to two parties may be 49 impossible. Some adaptation actions may be impeded by transaction costs. 50 51 For instance, experience suggests that information on climate change and its impacts and on adaptation options is 52 not available today in sufficientquantities, particularly in developing countries (citation World Bank WDR 2010?). 53 This creates situations of asymmetrical information that may lead, on the one hand, to failure to adapt where 54
ZERO-ORDER DRAFT IPCC WGII AR5 Chapter 17
Do Not Cite, Quote, or Distribute 18 25 July 2011
adaptation is possible and beneficial and, on the other, may stand in the way of good market operation, creating 1 location advantages and producing new inequalities (between and within countries).As for other transaction costs, 2 public authorities and the international community have an important role to play in this case in the production of 3 information (fundamental research, R&D) and in the dissemination of this information between countries and to 4 households, firms and local communities within countries (citation on information dissemination). 5 6 Because of transaction costs, some adaptation measures that are beneficial from a social point-of-view may not be 7 beneficial at the individual level. For instance, it may not be profitable enough for a homeowner to insulate his home 8 to reduce energy consumption linked to air-conditioning, when transaction costs are accounted for, whereas the 9 collective benefit is considerable if a large number of homeowners do it (Hallegatte et al., 2007). This type of sub-10 optimality has been referred to as a “market barrier,” as they appear even in absence of market failure (Jaffe et al., 11 2004). 12 13 14 17.3.4. Externalities, Agency Theory, and Market Failures 15 16 In addition to market barriers and transaction costs, adaptation may face market failures and create externalities and 17 moral hazards. In particular, with the combination of private actors and public authorities, actions have to be 18 designed to provide the correct incentives. Some adaptation actions are not profitable from the private point of view 19 but may be for the community at large. For example, it may not be privately profitable to conserve a forest and forgo 20 the revenue that can be obtained from timber and using cleared land for farming, but it may nevertheless be 21 attractive socially as conservation leads to carbon sequestration and biodiversity conservation. Along the same lines, 22 it may be profitable for a developer to build in a flood-prone area, whereas the cost of flooding for the community is 23 much greater (pressure on the healthcare system, temporary relocation of flood victims, etc.). In fact in many 24 countries the risks of building in flood plains are assumed by the community through social insurance agencies such 25 as FEMA in the U.S., so that there is a direct transfer of risk from the private builders and owners to the community 26 (reference Kunreuther). There are also synergies and trade-offs between adaptation actions and mitigation goals (see 27 below section 3, and also Wilbanks and Sathaye, 2007; Wilbanks, 2010; Hallegatte, 2009; Yohe and Leichenko, 28 2010; Bizikova et al., 2010). For instance, the massive use of air-conditioning or the desalination of seawater can 29 increase energy consumption. There are also trade-offs and synergies with other policy goals, such as economic 30 development (Barnett and O’Neill, 2010; Beckman, 2011; Bigio and Hallegatte, 2011; Viguie and Hallegatte, 2011; 31 Owour et al., 2011; Ericksen et al., 2011). 32 33 An optimal action for one stakeholder may therefore have negative external impacts on other stakeholders and not 34 correspond to the socially optimal action, thus requiring public actions (e.g., norms and standards, tax measures or 35 institutions) in order to avoid these effects induced ex ante. 36 37 Institutional arrangements may also reduce incentives. Where adaptation planning is decentralized at the local level, 38 the community may need to provide anticipatory adaptive measures before impacts are felt. Support provided only 39 after impacts are observed may create disincentives for anticipatory action (Burby et al., 1991). The regulated 40 insurance schemes that have been created in many developed countries may need to be amended to maintain 41 incentives for businesses and households to adapt to new conditions. For instance, if flood-prone areas are changing, 42 regulations requiring special building norms in these areas will need to be changed. Also, some economic sectors are 43 highly regulated, to the point that stakeholders may not react to climate change since they only take environmental 44 and climatic aspects into account by complying with fixed regulations and standards. This is largely the case in the 45 civil engineering sector, for example (citation). In such situations, we cannot expect spontaneous adaptation without 46 additional incentives, and public action is therefore necessary for adaptation, either by modifying the standards and 47 regulations so as to take climate change into account, or to delegate adaptation to the stakeholders by changing 48 regulatory limits so that spontaneous adaptation becomes possible.Since standards are generally established to 49 compensate for a lack of incentives, delegating adaptation to stakeholders can only be done by establishing adequate 50 incentives. 51 52 53 54
ZERO-ORDER DRAFT IPCC WGII AR5 Chapter 17
Do Not Cite, Quote, or Distribute 19 25 July 2011
17.3.5. Behavioral Obstacles to Adaptation 1 2 Economic agents adapt continuously to climate conditions. However, they do so in an incomplete, ad hoc manner 3 and do not always use all available information, especially long-term projections on future conditions. This has been 4 well documented for adaptation to natural risks (Magat et al., 1987; Camerer and Kunreuther, 1989; and Hogarth 5 and Kunreuther, 1995). Also, it is observed that individuals defer choosing between ambiguous choices (Tversky 6 and Shafir 1992; Trope and Lieberman, 2003), which is a common situation where climate change adaptation is 7 concerned. Also, individuals value differently profits and losses, leading to systematic decision biases (Tversky and 8 Kahnman (1974). This behavior is consistent with what is observed in other domains (Shogren and Taylor, 2008); 9 for instance, in-depth studies show that these behavioral issues partly explain why households do not capture all 10 profitable investments in energy efficiency (see a review in Gillingham et al., 2009). 11 12 Both private and public investment decisions do not always adequately take long and very long-term consequences 13 into account (for public decisions, see Platt, 1999 and Michel-Kerjan, 2008; for private decisions, see Kunreuther et 14 al. 1978, and Thaler, 1999), which could justify public intervention. Focusing on protection against frequent events 15 may lead to greater vulnerability to larger and rarer extreme events (Burby, 2006). In the context of long-term 16 consequences, it has been observed for energy efficiency investments that households act in a way consistent with a 17 discount rate of 20 to 100%, which is inconsistent with other investment decisions (Train, 1985). But this is only 18 partially due to the lower weight attributed to decision consequences occurring far in the future, especially by poor 19 households (citation on preference for the present), and to the increasing uncertainty on remote futures. Part of the 20 difference has been attributed to non-rational behaviors (Reeder et al., 2009).). Also, the provision of basic services 21 by public authorities is often taken for granted by private actors, whereas major changes in climate conditions could 22 make these services impossible or too costly to provide (for example, access to water for agriculture on the long-23 term). Public decision-makers may want to give a large weight to the far future (in economic terms, to use a lower 24 discount rate than private decision-makers), justifying public action. 25 26 It is likely that these behavioral aspects play an important role in risk management today, and will be a limit to 27 adaptation (Repetto, 2008). Social norms, heuristics, “rules of thumb” are often use by many agents (e.g. on energy 28 use, see Allcott and Mullainathan, 2010) and adapting to large changes in climate conditions will challenge these 29 behavior rules (Tol et al. ,1998; Fankhauser et al. 1999; Batterbury, 2008). Tversky and Kahnman (1974) illustrate 30 important decision biases when new conditions are met and decision heuristics have to be changed. 31 32 33 17.3.6. Ethics and Political Economy 34 35 A difficulty in allocating resources to adaptation is that, in contrast to mitigation measures, there is no performance 36 indicator for adaptation measures (Fuessel?). In theory, we can always compare these measures to each other by 37 examining their monetary benefits in terms of damage avoided. However, these benefits are uncertain and not 38 always calculable ex ante (Fankhauser et al., 1999; Tol et al., 1998; Hallegatte, 2009). Limiting action to adaptation 39 measures that are subject to complete cost-benefit analyses could even be counter-productive since the choice would 40 always be biased towards projects with investments in physical capital, at the expense of "softer" adaptation 41 measures, often effective and less costly (Hallegatte, 2009;Allcott and Mullainathan, 2010), but more difficult to 42 assess with cost-benefit analyses. There are ways of ensuring fair competition between different adaptation 43 measures, for example, by explaining the advantages and disadvantages of the different measures considered using a 44 multi-criteria approach (citation). 45 46 Efficiency is important, but another major reason that justifies public intervention is equity. Climate change impacts 47 vary greatly by community, and many have suggested that the poorest are particularly vulnerable (e.g., Tol et al., 48 2004, Stern, 2006; O’Brian et al., 2004). Some individuals, firms, local communities and even countries may be 49 unable to afford adaptation measures themselves, even if these measures are in their own interest. Government 50 (local, regional, national or international) may want to help these actors through transfer mechanisms, e.g., fiscal, or 51 international transfers. Consideration of justice and fairness will play a role in how adaptation options are designed 52 (Pelling and Dill, 2009; O’Brien et al., 2009; Dalby 2009; Brauch, 2009a, 2009b; O’Brien et al., 2010b). 53 54
ZERO-ORDER DRAFT IPCC WGII AR5 Chapter 17
Do Not Cite, Quote, or Distribute 20 25 July 2011
In the case of the allocation of scarce resources, the economist's reflex reaction is to allocate the resources to 1 projects whose marginal benefits for society – i.e., the social benefit for the last dollar invested – are the highest. 2 This rule allows us to obtain a portfolio of projects whose benefit is the highest for a given cost. However, 3 application of this rule may raise distributional issues. 4 5 Adaptation creates distributional issues, especially because adaptation benefits are mainly local. Consequently, we 6 must compare measures whose benefits go to very different individuals. The economist's traditional approach in this 7 case is to argue that we have to choose the most cost-effective projects and then eventually resort to financial 8 transfers to satisfy any equity objective(citation on efficiency-equity separation). However this argument depends on 9 the economy satisfying a rather strong set of assumptions and being in a fully efficient initial state. In more realistic 10 second-best situations the equity-efficiency dichotomy is no longer so sharp. And in practical terms there is a 11 problem inthat the transfers needed to compensate for distributional impacts are difficult to organize and may not be 12 politically acceptable. At the international level, in particular, development aid is often politically controversial 13 (Bulir and Hamann, 2008). So in practice governments may need to build distributional goals into their polices, as 14 the equity-efficiency dichotomy is hard to realise. 15 16 17 17.3.7. Marginal vs. Structural Adaptation 18 19 For early or limited climate change, marginal modifications can be used to maintain the existing economic structure. 20 For instance, changes in planting dates can be sufficient to cope with a small warming in the agriculture sector. 21 Using artificial snow-making can allow low-altitude ski resort to maintain an economy based on ski tourism if 22 temperature increase remains limited. Beach nourishment can cope with limited sea level rise. For larger changes in 23 climate conditions, however, these marginal actions may not remain efficient, and structural changes may be 24 necessary. Different crops in agricultural regions (Rosenzweig et al., 2004), a shift toward other tourism activities in 25 ski resorts (Elsasser and Bürki, 2002), or even retreat from some coastal areas (Fankhauser, 1995) may become 26 necessary. Disasters also can overwhelm coping capacities of communities and require structural changes(e.g. 27 Blaikie et al., 1994; Sperling et al., 2008). 28 29 From a methodological point of view, it is more complicated to evaluate significant (non-marginal)economic shifts 30 and transitions than to assess marginal or incremental changes. In fact, two economic equilibrium states that are very 31 different from each other can be difficult to rank from an economic point of view. If tourism stops being a viable 32 economic activity, it can be replaced by many different sectors (from manufacturing to services, for example), and it 33 is not easy to anticipate which alternative activity is the best in terms of population welfare. Moreover, assessing the 34 difference between two economic trajectories is often a question of measuring transition costs, not only differences 35 between final equilibria. If tourism as a main local activity has to be replaced, the question is not really whether 36 manufacturing or services are better alternatives. The question is how one can create these alternative activities, and 37 at whatcost. These transitions are more difficult to evaluate because they require dynamic models. 38 39 As an example, some regions have developed their economies based on a single sector, like tourism or agriculture. 40 In most general equilibrium models used to assess the macroeconomic cost of climate change, if asector becomes 41 less profitable because of climate change, resources (labor and capital) shift to other more-profitable sectors and 42 climate change leads to a change in economic structure with no significant loss in terms of production and income. 43 In models that assume full employment, no economic shift can lead to a surge in unemployment and a large drop in 44 output. Accounting for transition costs is more difficult and few tools exist to do this (citation from the trade 45 literature). 46 47 48 49
ZERO-ORDER DRAFT IPCC WGII AR5 Chapter 17
Do Not Cite, Quote, or Distribute 21 25 July 2011
17.3.8. Economic Decisionmaking with Uncertainty 1 2 17.3.8.1. Risk and Portfolio Theory 3 4 Decisions about adaptation have to be made in the face of uncertainty. Future climate trends are not known with 5 precision, and the impact of adaptation measures is also generally subject to a significant margin of error. Sources of 6 uncertainty include: 7
• Uncertainty about global climate change scenarios. The impacts of climate change and their associated 8 risks depend on whether we choose a scenario in which anthropogenic emissions of greenhouse gases and 9 climate sensitivity lead to an average temperature increase of +2°C or one of +4°C. It would be dangerous 10 to plan with only one of these two scenarios today. Taking the 2°C scenario, we run the risk of putting off 11 taking the measures necessary to deal with the impacts of a 4°C scenario until it is too late. Taking the 4°C 12 scenario, we run the risk of overinvesting in adaptation actions and therefore wasting scarce resources. This 13 uncertainty is a combination of socio-economic and policy uncertainty (leading to uncertainty in future 14 GHG emissions) and a scientific uncertainty (on how the climate system will respond to GHG emissions). 15
• Uncertainty about how global scenarios will translate at the local level. For example, even for a given 16 amount of global warming (measured as a change in global mean temperature), climate models diverge on 17 the way in which climate change will affect the frequency and intensity of storm events in the north of 18 Europe. Similarly, half of the climate models project an increase in precipitation in West Africa; the other 19 half projects the opposite. Uncertainty is therefore exacerbated when we have to assess the local impacts of 20 climate change to establish an adaptation strategy. Moreover, local climate changes are obscured by natural 21 variability, making it particularly difficult to detect them. 22
• Uncertainty about the reaction of major cycles (e.g., water), ecosystems and societies to global and local 23 climate changes. The response of ecosystems and human communities to changes in local climates is also 24 extremely uncertain, but it influences what is an effective adaptation strategy. For example, the ability of 25 coral reefs to cope with sea water warming, sea level rise and ocean acidification is highly uncertainty, but 26 relevant adaptation options for small islands depend strongly on this issue. Adaptation strategy design 27 needs to include this uncertainty from the earliest stages. 28
29 Concepts from risk management and portfolio theory can provide a framework for thinking about these issues. In 30 particular, diversification across a range of adaptation measures may be desirable to manage overall adaptation risk, 31 as argued in AR4 chapter 18 where a diversified portfolio of adaptation and mitigation is suggested. 32 33 Next we summarize methods that allow us to compare adaptation measures within a context of uncertainty about the 34 future climate. 35 36 The first method is cost-benefit analysis with uncertainty (Arrow et al., 1996): In this approach subjective 37 probabilities (i.e., based on beliefs determined from scientific knowledge rather than relative frequencies of 38 occurence) are attributed to different climate futures, using expert knowledge or Baysian methods (e.g., Tebaldi et 39 al., 2005; New and Hulme, 2006). The “best” project will then be the one that maximizes the expected net present 40 value (i.e., the average of the costs and benefits weighted by the occurrence probabilities for every possible states of 41 the world). Risk aversion can be taken into account by seeking to maximize the expectation of a concave utility 42 function rather than working with monetary costs and benefits. The greater the degree of concavity, the greater the 43 degree of risk-aversion reflected in the utility function: with sufficiently risk-averse utility functions it is possible to 44 implement an approach that focuses largely on the worst possible outcomes, the so-called “max-min” approach. The 45 cost-benefit approach also allows one to consider basic needs and the asymmetry between profits and losses. 46 47 When relatively complete information is available, cost-benefit analysis is particularly useful because it makes it 48 possible to evaluate policies in a wide range of states, as well as enabling a detailed study of the differences between 49 measures, for example, when there are different consequences in terms of time or spatial distribution of costs and 50 benefits. Even when all of the information necessary for the calculation is not available, a sensitivity analysis often 51 makes it possible to reveal trade-offs that are not necessarily obvious beforehand. Illustrations of this method are 52 provided by Hallegatte (2006), others, to be completed. 53 54
ZERO-ORDER DRAFT IPCC WGII AR5 Chapter 17
Do Not Cite, Quote, or Distribute 22 25 July 2011
Application of cost-benefit analysis requires that the costs and benefits of adaptation measures can be evaluated in 1 monetary terms. In cases where the impacts are on the availability of goods and services traded in markets this is 2 straightforward: there are market prices available to value these items, although these prices may need to be 3 corrected to allow for the impacts of monopoly power or for external costs not reflected in market prices (see Little 4 and Mirrlees , Dasgupta Marglin and Sen , Squire and van der Tak ). 5 6 In cases where there are no market prices for evaluating the costs and benefits of adaptation, a range of non-market 7 approaches to valuation that can be adopted. These can be applied to benefits that are public goods, or benefits that 8 are private goods but are not marketed, as is the case with some environmental services (ecosystem services). These 9 non-market approaches can be divided into revealed preference approaches and stated preference approaches, and 10 are discussed in section X below. 11 12 An alternative to cost-benefit analysis when particularly disastrous outcomes are possible is the use of "risk 13 management" methods, whose aim is to limit the probability that losses reach a critical level or that a particularly 14 bad scenario is realized. What this means in practice is that adaptation policies are selected so that for example 15 scenarios with losses exceeding 1% of the GDP have a cumulative occurrence probability of less than one in a 16 thousand. The hazard threshold retained (1% of the GDP in this case) and the cumulated occurrence probability (one 17 in a thousand here) are subjective and have to be determined through a political process. 18 19 When conducting cost-benefit analyses under uncertainty, an important concept is that of option value or quasi 20 option value (Henry 1964, Arrow and Fisher 1974). The key point here concerns irreversible actions, such as the 21 destruction of an ancient monument or a unique environment. Because unlike normal choices such actions can never 22 be undone, we need to be particularly careful about carrying them out in the first place. There is an “option value” 23 associated with conserving something that can never be replaced: by conserving it we have the option of continuing 24 with it or not in the future, whereas we lose this option if we destroy it. The point is particularly important if we do 25 not really know the value of the item to be conserved, and may learn more about its value in the future. 26 27 These methods require subjective occurrence probabilities for each climate scenarios. However, it is often difficult 28 to determine these probabilities in the case of climate change. Climate problems are in the realm of ambiguity rather 29 than risk, meaning that while there is some information about the relative likelihoods of different outcomes, this 30 information does not constitute a probability density function (Gilboa 2009, 2010). There is little work that applies 31 such ideas to climate policy (see Henry and Henry and Millner Dietz and Heal 2010). One approach is to work with 32 a range of different scientific models describing the process of climate change, each stochastic, and posit the 33 existence of second-order subjective probabilities over these models being correct. These alternative models can be 34 thought of as scenarios. 35 36 In practice, a set of possible scenarios is often the only available information. In this case, scenario-by-scenario 37 decision approach can be used (see, e.g., Lempert and Schlesinger, 2000), looking for policies that are acceptable 38 within a maximum number of scenarios. The aim in this case is this no longer to maximize the benefits within a 39 given scenario (or within the average of a set of scenarios) but to remain above the acceptable level of benefits for 40 the set of scenarios (or for as many scenarios as possible). 41 42 The most rigorous version of this method, in which we try to remain above an acceptable level for all of the 43 scenarios, is similar to what is referred to as the "maximin approach", in which we simply attempt to optimize the 44 most pessimistic scenario. The disadvantage of this approach is that the set of strategies is determined on the basis of 45 the most pessimistic hypothesis that is generally highly unlikely. In a more flexible version, this approach aims at 46 implementing measures that are sufficiently effective within all the scenarios, i.e., uncertainty-robust measures or 47 measures that can be adjusted when new information becomes available (Groves and Lempert, 2007; Groves et al., 48 2007; Lempert and Collins, 2007; Lempert, 2007; Lempert and Collins, 2007; Dessai et al., 2009a; Dessai et al., 49 2009b; Hall, 2007; Fankhauser et al., 1999; Goodess et al., 2007; Hallegatte, 2009). 50 51 52 53
ZERO-ORDER DRAFT IPCC WGII AR5 Chapter 17
Do Not Cite, Quote, or Distribute 23 25 July 2011
17.3.8.2. Uncertainty in Future Climates and the Risk of Maladaptation 1 2 The combination of uncertainty on climate change and of the long asset lifespan leads to the risk of maladaptation. 3 Maladaptation is defined by the IPCC (2007) as "a change in natural or human systems that leads to an increase 4 rather than a decrease in vulnerability." Maladaptation is not just related to the future climate. In fact, our societies 5 are not necessarily adapted to today's climate. This current maladaptation is often referred to as an "adaptation 6 deficit." A distinction must be made between two sources of maladaptation. An “avoidable” maladaptation situation 7 can arise from a "poor choice" ex ante, i.e., from the inadequate consideration of all the information available. This 8 is the case, for example, if adaptation measures are established in view of a unique climate scenario, without 9 including uncertainty. 10 11 But a maladaptation situation ex post can result in entirely appropriate decisions based on the information that was 12 available ex ante. As a result of the uncertainty of the impacts of climate change, the analysis ex ante cannot provide 13 what will be the optimal solution ex post. For example, it may appear desirable today to better regulate new 14 construction in low coastal zones. However, if we realize in 2050 that the most optimistic scenario on the rise in sea 15 levels was the right one, this adaptation measure could then appear to be unnecessary, even if it appears desirable 16 with today’s information. This type of “unavoidable” maladaptation cannot be avoided and can only be regretted ex 17 post if all of the information available was not used ex ante. 18 19 The World Bank EACC study identifies limitations in handling climate uncertainty in the EACC and proposes the 20 need to consider more scenarios, Monte Carlo simulations and other probabilistic approaches as a way of managing 21 these uncertainties more explicitly. Monte Carlo Simulation is used by a number of authors to estimate damage risk 22 and incorporate uncertainty in changes to climate (Bjarnadottir et al (2011), Dietz et al. (2007)). Dietz et al (2007) 23 describes the incertitude attached to the consequences of GHG emissions as “Knightian” in that we do not know 24 their objective probabilities. The usefulness of CBA as a decision support tool depends on our ability to define 25 subjective probability distributions over relevant variables and on the accuracy of these probabilities. 26 27 One way to manage these uncertainties is to select “no-regrets” adaptation options. That is, those options whose 28 benefits are delivered regardless of the direction and extent of climate change. Hallegatte (2009) suggests a number 29 of no-regrets adaptation measures, including soft measures such as insurance and restrictive land use planning, 30 which are useful regardless of the direction and nature of future climate changes. The benefits of these will be more 31 robust than some irreversible measures such as building coastal defenses, which may not have any benefits in the 32 absence of increased storm surges. 33 34 35 17.3.9. Non-Market Costs and Benefits 36 37 As we noted above, the costs and benefits of adaptation measures will often be reflected in changes in the amounts 38 of non-market goods and services, so that there will be no prices available for valuation. The valuation of non-39 market impacts is now a large and well-developed field, with a good recent overview being National Research 40 Council (2004). The approaches available divide into two categories, revealed preference and stated preference. 41 42 Revealed preference approaches are based on the study of actions that people take that indirectly reveal the value 43 that they place on a non-market good or service. Asking how much extra a house is worth because it is in a clean air 44 district allows us to assess the value that buyers place on clean air: asking how much extra a house is worth because 45 it is near a good school allows us to evaluate the value that buyers place of access to good schools. Factoring out the 46 value of clean air or good schools can be done by hedonic regressions. 47 48 Stated preference approaches are based on interviews with a representative sample of potentially affected 49 individuals, who are asked to complete a carefully-structured questionnaire designed to elicit their willingness to pay 50 for the good or service affected by the adaptation project. 51 52 53 54
ZERO-ORDER DRAFT IPCC WGII AR5 Chapter 17
Do Not Cite, Quote, or Distribute 24 25 July 2011
17.4. Ancillary Economic Effects of Adaptation Measures and Policies 1 2 In addition to creating an economy that is more resilient to the effects of climate change, adaptation strategies often 3 have unintended ancillary effects of substantial importance. Specifically, environmental and economic co-4 benefits/costs can be generated by adaptation strategies. For example, while coastal protection can avoid loss of 5 property and damage to humans in the face of climate change, it can also benefit society in the face of severe storms 6 or Tsunamis. At the same time, sea walls can negatively affect tourism and recreation. Another example is that the 7 development of heat and drought resistant crop varieties can also be useful outside of the realm of climate change, 8 increasing productivity in bad years and in marginal agricultural areas. 9 10 Ancillary effects also arise when investment funds are devoted to mitigation or non climate related investments, as 11 we indicate below in the section on economic evaluation of ancillary effects. For example, action to reduce CO2 12 emissions from power plants, a classic case of mitigation, would simultaneously reduce emissions of oxides of 13 nitrogen (NOx) and particulates and in turn diminish consequent pollution-induced health effects (Burtraw et. al. 14 2003). These reductions are likely to be positive for adaptation to a warmer world. 15 16 17 17.4.1. Broad Economic Consideration of Adaptation 18 19 Because of ancillary effects, strategies that enhance adaptation can be attractive not only in the case of climate 20 change but also in more general settings. Given the uncertainty in the magnitude and timing of anthropogenically-21 induced shifts in climate, it is certainly beneficial to pursue "no regrets" adaptation strategies that generate 22 substantial benefits without climate change or in the face of other evolving societal/environmental forces. 23 24 Examples of climate-related strategies that have substantial co-benefits include the following: 25
• Sea walls that protect against sea level rise and at the same time protect against tsunamis – and as noted 26 above also affect the recreational value of coastal areas However they also have co costs causing damages 27 to further upcoast, fisheries and mangroves. 28
• Crop varieties that are adapted to droughts and heat – and also raise productivity in the absence of climate 29 change 30
• Better building insulation – which protects against heat but also reduces HVAC costs and mitigates 31 greenhouse gas emissions 32
• Public health measures targeted at insect-borne diseases whose range will expand in a warmer world – and 33 which have health benefits at present 34
• More efficient use of water –this is adaptation to a drier world and also to current conditions of water 35 scarcity. The development of lower-cost desalination methods has the same merits 36
• Locating infrastructure away from low-lying coastal areas – this provides adaption to sea level rise and 37 protection against tsunamis and storm surges 38
• Storm-resistant buildings, especially in cyclone-prone areas, and better flood protection and drainage 39 • Green roofs in urban areas – these mitigate by reducing interior temperatures and hence cooling loads, and 40
adapt in the same way and also by reducing storm water runoff, but they consume water 41 • Afforestation and reforestation can both mitigate by carbon sequestration and adapt by securing soil and 42
reducing water run-off. 43 • Reducing the use of coal-fired power plants, a mitigation strategy which can have adaptation benefits too – 44
see above 45 [WE PROBABLY NEED REFERENCES FOR EACH OF THESE BULLET POINTS 46 (and to say that these co-benefits/co-costs are context specific).] 47
48 This list implies that analyses of the benefits/costs of adaptation strategies should conducted so as to generate 49 information under both current and non-climate-change-related evolving future conditions. 50 51 52 53
ZERO-ORDER DRAFT IPCC WGII AR5 Chapter 17
Do Not Cite, Quote, or Distribute 25 25 July 2011
17.4.2. Examples of Ancillary Benefits from Adaptation Actions 1 2 The literature contains a wide variety of contributions identifying ancillary benefits from adaptation to climate 3 change. Table 17-2 gives a summary of some representative contributions in this setting. 4 5 [INSERT TABLE 17-2 HERE 6 Table 17-2: Title?] 7 8 9 17.4.3. Economic Consideration of Ancillary Effects 10 11 Consideration of ancillary effects in the climate adaptation arena has largely been discussed on a strategy by strategy 12 and sector specific basis, addressing for example adaptation in the form of coastal protection or crop varieties. Here 13 we discuss how ancillary effects influence the composition of the socially optimal portfolio of adaptation policies 14 adapting a similar discussion regarding mitigation by Elbakidze and McCarl, 2007). 15 16 To examine how the selection of a socially optimal portfolio of adaptation measures is affected by co-effects we 17 need an economic framework that characterizes the optimal portfolio composition. To do this we will use the classic 18 externalities model advanced in Baumol and Oates (1975). Suppose that a country decides to adapt to climate 19 change and formulates rules that permit a mixed portfolio of investments in coastal protection, agricultural 20 production and other endeavours to contribute to this effort. A given sum of money is set aside for adaptation and 21 has to be allocated between the two competing alternatives. Now suppose that the funds allocated to either activity 22 reduce damages from climate change but with diminishing returns, i.e. that the rate of reduction decreases as more is 23 spent on reduction. Coastal protection can reduce climate change related damages but at a diminishing rate. On the 24 other hand, when agricultural adaptation is employed, agricultural adaptation benefits rise but money is diverted 25 from coastal protection and the benefits there fall. Therefore, if we rely on agricultural adaptation, net climate 26 change damages decrease relative to a “do nothing” strategy but may or may not decrease relative to those that 27 would have arisen if we invested more in coastal protection. 28 29 Adaptation funds should ideally be allocated between the two activities so that the marginal returns to each are the 30 same. Following Baumol and Oates (1975) suppose Ccp(Icp) and CA(IA) are the private marginal returns to 31 expenditure in coastal protection (Icp) and the agricultural (IA) adaptation possibilities respectively. These functions 32 are assumed to be upward sloping and of similar shapes. In Figure 17-5, the horizontal axis represents the total 33 adaptation funds to be invested in the agricultural and coastal protection. Hence Icp is a proportion of total adaptation 34 investment in coastal protection and (IA) is the proportion in agriculture. 35 36 [INSERT FIGURE 17-5 HERE 37 Figure 17-5: Implications of externality consideration. NEED TO REDRAW THE GRAPH.] 38 39 Suppose that use of agricultural strategies generate positive ancillary effects. Assuming that the ancillary effects are 40 quantifiable, the social marginal return function CS
A(IA), which reflects positive ancillary effects, shifts upwards due 41 to the value of the ancillary effects. Thus, in Figure 17-5, social agricultural adaptation return function CS
A(IA) is 42 above the private marginal return function CA(IA). 43 44 Also, suppose that coastal protection generates positive ancillary benefits. In Figure 17-5, this can be represented by 45 a shift of the CCP(ICP) schedule upward to CS
CP(ICP). in turn then the socially optimal allocation of adaptation 46 investment will differ from the private optimum. In Figure 17-5, the positive ancillary effects from agricultural 47 investment happen to be larger than the positive ancillary effects from coastal protection adaptation investment, 48 hence due to the shift, the agricultural share of investment increases while the coastal protection share decreases. 49 The key is that the degree to which consideration of the ancillary effects shift the investment share in an adaptation 50 strategy depends on the relative magnitudes of the ancillary effects so both must be estimated. Furthermore 51 consideration of the ancillary effects of a single strategy presents a biased view that can only be resolves by looking 52 at the ancillary effects of all alternative strategies. In the mitigation case Elbakidze and McCarl argue that it may be 53 best to omit ancillary effects from consideration when deciding on investment allocation due to the complexity of 54
ZERO-ORDER DRAFT IPCC WGII AR5 Chapter 17
Do Not Cite, Quote, or Distribute 26 25 July 2011
complete consideration and estimates that the ancillary effects in the settings they examine are roughly of the same 1 magnitude. Others have argued for the inclusion of co-benefits and co-costs in the adaptation decision-making 2 process (e.g., Grafakos 2011, Kubal et al. 2009, De Bruin et al. 2009; Brouwer and van Ek 2004, Ebi and Burton 3 2008; Qin et al. 2008; Viguie and Hallegatte, 2011; many others!). However comprehensive estimation of these is a 4 large burden. 5 6 Here we have modeled how to select a set of adaptation activities given a budget for adaptation. But equally 7 important, and more difficult, is how to determine how much should be spent in total on adaptation versus other 8 climate-related categories such as mitigation, and versus all other demands on public expenditure. The general rule, 9 of course, is that the marginal social returns to all forms of expenditure should be the same, perhaps allowing for 10 distributional impacts by weighting benefits and costs to different income groups differently. (reference public 11 finance book). In practice governments try to achieve this by setting a hurdle rate of return for public expenditures: 12 if the marginal returns in all areas are equal to this then the equality of marginal rates is assured (reference again on 13 public finance). 14 15 16 17.4.4. Correction of Market Outcomes 17 18 As shown above and developed elsewhere (e.g. Baumol and Oates, 1975), the presence of ancillary effects can lead 19 to market failure and it may be socially desirable for government policy interventions to adjust market outcomes. 20 Theoretically, implementing market subsidies or taxes that reflect net ancillary effects between alternatives could 21 correct market failures. However, before such a policy could be implemented, we need to consider whether 22 regulatory intervention in the form of subsidization/taxation is justified based on differences between ancillary 23 effects. 24 25 One should also realize that ancillary effects are likely to vary across geographically distant adaptation regions that 26 use the same strategy. For example, adaptation actions that increase resilience to drought in West Africa would 27 result in different ancillary benefits as compared to increasing drought resilience in North America. This suggests 28 that the subsidy calculation needs to be carried out on a case by case basis in order to correctly reflect the values of 29 adaptation ancillary effects. 30 31 This calculation is also complicated by diversity and multiplicity of ancillary effects such as improved wildlife 32 habitat, biodiversity implications, improved soil and water quality, development of recreation sites, etc. Each of 33 these external effects is difficult and time-consuming to appraise, whether in monetary or other terms. In such 34 situations it is common to use benefit transfer techniques, adapting values calculated in similar studies. There are 35 however dangers to the extensive use of benefit transfers (see perhaps NRC study pr ..). 36 37 Evaluation of most of these co-effects requires application of advanced estimation techniques such as non-market 38 valuation analysis, crop production simulation, etc. (Plantinga 2003, Ribaudo 1989, Pattanayak at al. 2001, 39 Matthews et al. 2002). In addition, adaptation activities in remote regions could result in diverse ancillary effects on 40 biodiversity, soil and water characteristics, among other things, (Matthews et al 2002, Pattanayak et al 2001), which 41 could be difficult to compare to one another in terms of monetary values. For example, an altered mix of bird 42 population, caused by afforestation, is problematic to appraise relative to the prior bird mix. 43 44 In order for the subsidization/taxation of adaptation to be economically justifiable the magnitude of the benefits 45 gained from subsidization need to exceed the government expenditures plus transaction costs of estimating the 46 subsidy/tax levels and implementing the corrective policy (McCann and Easter, 2000, Stavins 1995). These costs 47 could be high (Alston and Hurd, 1990). Taking into account distributional issues (using distributional weight, basic 48 needs, or nonlinear utility function) may make some measure economically justified (Harberger, 1978, 1984). 49 50 51 52
ZERO-ORDER DRAFT IPCC WGII AR5 Chapter 17
Do Not Cite, Quote, or Distribute 27 25 July 2011
17.4.5. Possible Economic Co-Benefits from Economic Instruments 1 2 The above include a number of examples of co-benefits resulting from investments in various sectors. There are also 3 co-benefits to be gained from interventions through economic instruments. A case in point is the use of water, where 4 increasing scarcity can partly be addressed through pricing that more closely reflects the true cost of water. In the 5 Indian context water metering was found to be one of the more cost effective measures, increasing water efficiency 6 by as much as 30% (Markandya and Mishra, 2011). By including it in the list of measures used to bring supply and 7 demand into balance by 2030 with expected climate change, we also get the benefit of reduced state and central 8 level fiscal deficits, releasing resources that can be spent on other high value projects. We also gain in the sense that 9 expensive engineering solutions, whichhave their own external costs, are avoided. 10 11 The above include a number of examples of co-benefits resulting from investments in various sectors. There are also 12 co-benefits to be gained from interventions through economic instruments. A case in point is the use of water, where 13 increasing scarcity can partly be addressed through pricing that more closely reflects the true cost of water. In the 14 Indian context water metering was found to be one of the more cost effective measures, increasing water efficiency 15 by as much as 30% (Markandya and Mishra, 2011). By including it in the list of measures used to bring supply and 16 demand into balance by 2030 with expected climate change, we also get the benefit of reduced state and central 17 level fiscal deficits, releasing resources that can be spent on other high value projects. We also gain in the sense that 18 expensive engineering solutions, whichhave their own external costs are avoided. 19 20 21 17.4.6. Examples of Multi-Metrics Decisionmaking for Adaptation 22 23 Several decision-making tools can be used to choose and prioritize adaptation measures. Cost-effectiveness or 24 benefit–cost analysis require expression of benefits (e.g., avoided adverse impacts from adaptation) and costs in a 25 common metric, in order to allow benefits and costs to be compared to estimate whether the benefits exceed the 26 costs. This is often done by expressing benefits in monetary terms. However, this is not straightforward for benefits 27 that are not bought and sold in markets, such as human life or environment conservation. 28 29 Multi-criteria analysis is applicable where a single-criterion approach falls short, especially where significant 30 environmental and social impacts cannot be assigned monetary values. In this approach, criteria do not need to be 31 measured in common metrics, and can be weighted to reflect relative importance. It allows decision makers to 32 include a full range of social, environmental, technical, and economic criteria in a balanced manner—mainly by 33 quantifying and displaying trade-offs to be made between conflicting objectives that are difficult to compare 34 directly. Multi-criteria analysis is also useful when there is insufficient data to conduct a cost-benefit analysis or 35 cost-effectiveness analysis. For structuring problems and decisions, this type of analysis is sometimes considered to 36 be more useful than these methods (Brooks et al. 2009; Willows and Connell 2003). For instance, using traditional 37 risk management tools in dealing with the challenges of climate change is difficult, as the level and types of risk 38 uncertainty tend to be very different compared to more typical and better understood risks(Füssel 2007) : multi-39 criteria decision-making processes enable to include robustness (i.e. insensitivity to future climate conditions) as a 40 criterion (Hallegatte 2009). 41 42 This approach is widely applied on environmental issues, including climate change adaptation assessments. Recent 43 examples include urban flood risk in Bangladesh (Grafakos 2011) and in Germany (Kubal et al. 2009), adaptation 44 options for climate change in the Netherlands (De Bruin et al. 2009; Brouwer and van Ek 2004), climate change-45 related health risks (Ebi and Burton 2008), adaptation planning in Canada (Qin et al. 2008). Older examples include 46 identification of vulnerability in the agricultural sector and assessment of alternative crop options (Julius and 47 Scheraga 2000) and climate change adaptation options in Africa (Smith and Lenhart 1996). UNFCCC developed 48 guidelines for adaptation assessment process in least developed countries (the process of National Adaptation 49 Programmes of Action, NAPA), in which it suggests the use of multi-criterion analysis for the prioritization of 50 adaptation measures (UNFCCC 2002). In this context, (Burundi 2007) provides an example of standardized multi-51 criterion analysis scoring for a variety of adaptation actions. 52 53
ZERO-ORDER DRAFT IPCC WGII AR5 Chapter 17
Do Not Cite, Quote, or Distribute 28 25 July 2011
The set of criteria used to prioritize adaptation activities depends on the study. Several toolboxes exist for multi-1 criteria decision-making, and give detailed outline of the considerations that need to be taken into account when 2 identifying criteria (Janssen and Van Herwijnen 2006; Belton and Stewart 2002; Dodgson et al. 2009; Keeney and 3 Raiffa 1993). Criteria have generally to fulfill some qualitative attributes such as value relevance, understandability, 4 measurability, non-redundancy, independence, balancing completeness and conciseness, operationality and 5 simplicity (Belton and Stewart 2002). Stakeholders can be involved in the definition and weighing definition of the 6 criteria: this ensures that a wide range of perceptions is taken into account, and enhances stakeholders’ involvement 7 in the adaptation process(Brooks et al. 2009; Kiker et al. 2005). 8 9 Example of criteria are importance, urgency, no regret characteristics, co-benefits, and effects on mitigation effects 10 of policies (used in the Netherlands, De Bruin et al. 2009); sustainable environmental management, cost, aptitude to 11 adaptation, struggle against poverty, food security, prevention of climate risks, woman empowerment, economic 12 growth(Burundi 2007); vulnerability reduction, cost, enhancement of ecological condition, public and political 13 acceptance, employment generation, achievement of MDG, institutional and technical capacity(Grafakos 2011); 14 degree of adverse effects of climate change, poverty reduction, synergy with other environmental actions, cost 15 effectiveness(UNFCCC 2002). 16 17 (including co-benefits and non-monetary aspects) {Stephane Hallegatte} 18 19 20 17.4.6.1. Assessing the Opportunity Cost of Funds Devoted to Adaptation 21 22 In assessing the attractiveness of different climate policies, several factors play an important role, including: the 23 costs of reducing greenhouse gas emissions; the potential damages of climate change and our ability to adapt to 24 climate change, the relationship between GHG emissions, atmospheric GHG concentration and changes in climate, 25 the weighing of costs for different actors (intragenerational equity) and, other factors other than climate policy that 26 influence GHG emissions (Hof et al. 2010). 27 28 [Note that the distributional impacts of adaptation projects may be significant, particularly if the costs of failure to 29 adapt will fall mainly on low-income groups. Talk about how to account for distributional impacts in the evaluation 30 of adaptation costs and benefits. {Muyeye, SH, Marianne Fay}] 31 32 “When a monetary metric is used to aggregate costs and benefits across different communities, the aggregate 33 outcome will be biased towards the consequences of climate change policy in the richest subgroup” (Downlatabadi 34 (2007), p.655: in Baum (2009)). 35 36 Even among rich countries of the OECD the distribution of the burden of adapting to climate change is very uneven, 37 and the relative cost of adaptation in the water supply sector is greater in Eastern Europe compared to Western 38 Europe (Hughes et al. 2010) 39 40 Aggregate analysis is particularly sensitive to the weighting (i.e., relative importance) of impacts occurring in 41 different regions and at different times. Studies by Fankhauser et al. (1997) and Azar (1999) found that greater 42 concern over the distribution of impacts leads to more severe predictions of aggregate impacts. 43 44 45 17.4.6.2. Adaptation Benefits of Conservation of Ecosystems 46 47 [hard to value but still very important. Ecosystem conservation may be a form of adaptation – flood control etc.] 48 49 Hughes et al point out that assumptions made in calculating the costs of adaptation in water infrastructure is based 50 on an “engineering approach” to estimating the costs of adaptation and assumes that this is what will drive the costs. 51 They point out that it is worth considering how far alternative methods of adaptation might reduce costs. For 52 instance, by managing water use including by using price based tools. 53 54
ZERO-ORDER DRAFT IPCC WGII AR5 Chapter 17
Do Not Cite, Quote, or Distribute 29 25 July 2011
In the same way, Hallegatte (2009) notes that adaptation strategies can have other positive or negative side effects, 1 which must be considered. Sea-walls, for example, can threaten the tourism industry because they change the 2 landscape, ecosystem health, the quality of the environment and can have negatively affect fish stocks. Taking 3 account of environmental costs on ecosystems is thus essential. 4 5 However, Neumayer (1999) in: Dietz et al. (2007) remarks that CBA studies ignore that natural resources are 6 essential for human development and the loss of which can neither be reversed nor be compensated by increasing 7 production and consumption of other goods and services. Dietz et al (2007) notes of CBA studies that they tend to 8 avoid including impacts which are difficult to measure and value. 9 10 11 17.4.7. Review of Existing Global Numbers (Identifying Gaps and Limitations) 12 13 There have been a limited number of global and regional adaptation cost assessments over the last few years (World 14 Bank, 2006; Stern, 2006, Oxfam, 2007; UNDP, 2007, UNFCCC, 2007;, 2008; World Bank, 2010). Estimates range 15 from 4 to 100 billion USD per year with a bias towards the higher end of costs. 16 17 [INSERT TABLE 17-3 HERE 18 Table 17-3: Estimates of global costs of adaptation.] 19 20 These estimates fall into only three independent estimates. World Bank (2006) estimates the cost of climate proofing 21 foreign direct investments (FDI), gross domestic investments (GDI) and Official Development Assistance (ODA), 22 which was taken up and modified by the Stern Review (2006), Oxfam (2007) and UNDP (2007). UNFCCC (2007) 23 as the second source of cost estimates calculated existing and planned investment and financial flows, required for 24 the international community in order to effectively and appropriately respond to climate change impacts. World 25 Bank (2010) follows the UNFCCC (2007) methodology and improves upon this by using more precise unit cost 26 estimates, the inclusion of costs of maintenance as well as those of port upgrading as well as the risks from sea-level 27 rise and storm surges. 28 29 Regionally, the World Bank (2010) study estimates that for both “wet” and “dry” scenarios the largest absolute costs 30 would arise in East Asia and the Pacific, followed by the Latin American and Caribbean region as well as Sub-31 Saharan Africa. 32 33 [INSERT TABLE 17-4 HERE 34 Table 17-4: Regionalized annual costs of adaptation for wet and dry scenarios (billion USD 2010).] 35 36 As discussed by Parry et al (2009) the estimates are thus interlinked, which explains the seeming convergence of the 37 estimates in latter studies. As well, Parry et al. (2009) consider the estimates a significant underestimation by at least 38 a factor of two to three and possibly higher if also including other sectors such as ecosystem services, energy, 39 manufacturing, retailing, and tourism and considering the fact that the adaptation cost estimates are based mostly on 40 low levels of investment due to an existing adaptation deficit in many regions. Thus the numbers have to be treated 41 with caution. Another issue with the reviewed studies is that they do not explicitly separate extreme events from 42 gradual change. As well, those studies considering extreme events, and finding or reporting net benefits over a 43 number of key options (Parry et al., 2009; Agrawala and Fankhauser, 2008) do so by treating it in a similar way to 44 gradual onset phenomena and use deterministic impact metrics. 45 46 47 17.4.8. Consistency between Localized and Global Analysis 48 49 Adaptation costs and benefits are derived for two main purposes. Most studies are done on sectoral and project 50 levels, where cost and benefit estimates may inform investment decisions in terms of type and timing of 51 investments. In principle, the idea is to maximize net benefits in terms of avoided damages (the benefits) less the 52 adaptation costs. Also, estimates may be used, as often done in CBA, to select the most favorable projects amongst 53 alternatives. Global and regional costs and benefits as discussed above on the other hand are generally estimated to 54
ZERO-ORDER DRAFT IPCC WGII AR5 Chapter 17
Do Not Cite, Quote, or Distribute 30 25 July 2011
derive a “price tag” for overall funding needs for adaptation needs, which then can be used to deliberate on 1 identifying appropriate international, domestic, and private funding sources. These estimates generally follow the 2 Investment and Financial Flows (I&FF) methodology and do not aim at estimating benefits (Agrawala and 3 Fankhauser, 2008).). 4 5 Given the different purposes and methodologies of the available studies, it is unsurprising that it is very difficult to 6 compare “local”, i.e, national and sectoral with global numbers. In terms of available studies, sectoral studies 7 relatively well cover coastal zones and agriculture, for which geographical detail is reasonably good. Less is known 8 and many gaps remain for sectors such as water resources, energy, infrastructure, tourism and public health sectors, 9 and predominantly assessments are done in a developed country context (see table for an overview of costs and 10 benefits assessment). 11 12 [INSERT TABLE 17-5 HERE 13 Table17-5: Coverage of adaptation costs and benefits.] 14 15 However, as Fankhauser (2010) holds adaptation costs have shown little convergence across sectoral costs as well as 16 sectoral compared to global costs with coastal protection costs the sole exception. Fankhauser suggest that that the 17 global cost estimates using the I&FF methodology estimate the “true” costs of adaptation. On the other hand, there 18 is the World Bank (2010) study, which is innovative in terms of taking a two track approach assessing both national 19 (7 cases) and global adaptation costs. For a number of country studies (Bangladesh, Samoa and Vietnam) a 20 comparison was made, and results in terms of relative cost of GDP were broadly in reasonable agreement. For 21 strengthening infrastructure against windstorm, precipitation and flooding, for the studies of country at high risk, 22 costs were considered to be 10-20% higher compared to what global (average) numbers would suggested. 23 24 25 17.4.10. Case Studies on Sectors or Regions 26 27 17.4.10.1. Transportation [to be developed] 28 29 17.4.10.2. Agriculture and Forestry [to be developed] 30 31 17.4.10.3. Energy [to be developed] 32 33 17.4.10.4. Sea-Level Rise and Coastal [to be developed] 34 35 17.4.10.5. Infrastructure [to be developed] 36 37 17.4.10.6. Health 38 39 The health costs of adapting to climate change are based on expcted impacts through vector-, water and food borne 40 diseases, as well as thermal stress caused by heat waves and negative impacts of malnutrition (McMichael et al., 41 2004). Quantitative estimates of these impacts are bedeviled with a cascade of uncertainty, arising not only from a 42 lack of knowledge about the increased risks of individual health outcomes but also because of changing baseline 43 conditions (baseline risks are expected to fall with development) and changes in demographic make-up of areas with 44 an elevated risk (Ebi, 2008). Nevertheless estimates have been made based on median increases in incidence across 45 a range of scenarios, addressed through a combination of anticipatory (e.g. vaccination, water treatment) and 46 reactive (e.g. increased cost of treatment of people who fall ill) measures. One set of measures simply seeks to 47 reduce all additional impacts (leaving a zero residual damage). The study looks at vector- water and food- borne 48 diseases only and is considered an underestimate as it does not include some personal costs as well as some 49 infrastructure and health care maintenance costs (Ebi, 2008). The case for going for a zero residual target is strong if 50 one compares the additional costs with the costs of increased morbidity and mortality for those left untreated. For 51 example the cost per death avoided through disease control programs focusing on combined health interventions is 52 of the order of US$ 300-600. On moral grounds most of us would find it unacceptable to believe that a life is not 53 worth that much in even the poorest country. (Markandya and Chiabai, 2009). 54
ZERO-ORDER DRAFT IPCC WGII AR5 Chapter 17
Do Not Cite, Quote, or Distribute 31 25 July 2011
1 17.4.10.7. Buildings and urbanism 2 3 Writing in progress based on Rosenzweig (New York) and Ranger et al., (2011) on Mumbai. 4 5 17.4.10.8. Water 6 7 Writing in progress (contributing author: Patrice Dumas), based on Ward 2010 (global analysis), Kirshen 2005 8 (national analysis, China) and Medellín-Azuara 2008 (California), O'Hara and Georgakakos (2008) (small 9 catchment). 10 11 17.4.10.9. Ecosystems and Ecosystem-Based Adaptation 12 13 There have been a number of approaches to valuing the costs of climate changes to ecosystems. Velarde et al (2005) 14 quantifies the economic costs of climate change impacts on protected areas at a very disaggregated level in Africa. 15 Downscaled results from four Global Circulation Models (GCMs) are used to classify different ecosystems in 16 accordance with the Holdridge Life Zone (HLZ) system. A benefits transfer approach is then used to place an 17 economic value on the predicted ecosystem shifts resulting from climate change in protected areas. The results 18 provide approximations for the impacts on biodiversity in Africa under the business-as-usualscenario established by 19 the Intergovernmental Panel on Climate Change (IPCC) for the middle and end of the 21st century. 20 21 17.4.10.10. Recreation and Tourism [to be developed] 22 23 17.4.10.11. Natural Disaster Risk 24 25 Bouwer (2010) estimates future losses (the benefits of adaptation action) from river flooding to a Polder area in the 26 Netherlands. Most such studies have varied climate and weather variables, but kept other drivers constant. This risk 27 based study is one of the few that aims at identifying the key factors driving future losses under climatic, land use 28 and exposure change. The study arrives at a wide range of increases in losses of between 96 and 719% by 2040 as 29 compared to 2010. Exposure (asset) changes are identified as the key driver. These estimates are without additional 30 measures taken and thus represent a large share of the costs of inaction. 31 32 [INSERT FIGURE 17-6 HERE 33 Figure 17-6: Assessing future flood losses (Bouwer, 2010).] 34 35 36 17.5. Summary 37
[in process] 38 39 This chapter has noted in a number of places that ‘softer’ options for adaptation have a relative advantage: they 40 avoid taking actions that are irreversible and costly while they themselves consist of measures that are flexible and 41 that can be modified as and when more information becomes available. Such measures include education and 42 awareness-raising, moral suasion, and instruments such as taxes, charges and trade policies. Of all of these the last 43 set, which can broadly be classified as economic instruments probably offer the greatest potential. Examples would 44 be the following: 45
• Increasing charges for resources that will become scarcer with climate change. Principal among these is 46 water. 47
• Increase the functioning of insurance markets to cover Individuals facing increased risks will, where 48 possible, seek to insure against damages due to extreme events, along with other measures to reduce the 49 impacts on themselves. This is a cost-effective way to adapt to the increased variability as long as the 50 insurance markets are able to take the risk in a competitive market, as long as the individuals are able to 51 afford the costs of insurance and other adaptation and as long as they do not discount future impacts too 52 highly or under-adapt due to the ‘Samaritan’s Dilemma’1 (IMF, 2008). The public sector can have a role to 53 play in: (a) providing limited insurance cover where private insurers are unable to provide it (but only when 54
ZERO-ORDER DRAFT IPCC WGII AR5 Chapter 17
Do Not Cite, Quote, or Distribute 32 25 July 2011
this is due to market failure and not because the risk is too high – see below), (b) acting to correct market 1 failures that result in the private sector undertaking too little insurance, such as applying to high a discount 2 rate or acting in expectation of the Samaritan’s Dilemma and (c) subsidizing poor households who are 3 unable to afford the insurance or offering them alternative livelihoods in the light of the increased costs of 4 climate variability. Thus the public sector measures have to be designed in full awareness of how 5 individuals will act. 6
• Some energy firms are already a major user of weather derivatives for high probability events and 7 insurance against catastrophic events. E.g. Weather derivatives can hedge exposure to colder than expected 8 winter, reducing impacts on consumer bills. These can be used to stabilize revenues, control costs and 9 manage cash reserves. Unfortunately these instruments are mainly used in the US, although recently there 10 have been some transactions in Australia and India (ESMAP, 2011) 11
• In the same vein, trade can help address some climate impacts. In the energy sector for example, trading 12 power across borders can reduce the national impact of extreme events (to the extent the covariance of 13 these events is low across countries) and help diversify the energy system making it more resilient to 14 climatic variations. (ESMAP, 2011). 15
16 [INSERT FOOTNOTE 1 HERE: The Samaritan’s Dilemma is the tendency for under-insurance by those who 17 expect external help in the event of adversity: those supplying the help would wish to limit its extent by committing 18 to relatively low support—but their benevolence means they cannot do so credibly.] 19 20 21 References (incomplete) 22 23 Adams, R.M., R.A. Fleming, C.C. Chang, B.A. McCarl, and C. Rosenzweig (1995), ‘A Reassessment of the 24
Economic Effects of Global Climate Change on US Agriculture’, Climatic Change, 30, 147-167. 25 Adams, R.M., B.A. McCarl, K. Segerson, C. Rosenzweig, K.J. Bryant, B.L. Dixon, J.R. Conner, R.E. Evenson, and 26
D.S. Ojima (1999), ‘Economic Effects of Climate Change on US Agriculture’, in R. Mendelsohn and J. 27 Neumann (eds), The Impact of Climate Change on the United States Economy, Cambridge, UK and New York, 28 US: Cambridge University Press, pp.18-54. 29
Adger, W.N., 2003: Social capital, collective action, and adaptation to climate change. Economic Geography, 79 (4), 30 387-404. 31
Agrawala, S. and S. Fankhauser (eds.), 2008: Economic Aspects of Adaptation to Climate Change. Costs, Benefits 32 and Policy Instruments, Paris, OECD.ECA, 2009; 33
Alston, J.M., Hurd, B.H., 1990. Some neglected social costs of government spending in farm programs. American 34 Journal of Agricultural Economics 72 (1), 149–156. 35
Arrow, K.J., M.L. Cropper, G.C. Eads, R.W. Hahn, L.B. Lave, R.G. Noll, P.R. Portney, M. Russel, R.L. 36 Schmalensee, V.K. Smith, R.N. Stavins, 1996. Benefit-Cost Analysis in Environmental, Health, and Safety 37 Regulation, American Enterprise Institute Books and Monographs. 38
Barr, R., S. Fankhauser and K. Hamilton (2010), “Adaptation Investments: A Resource Allocation Framework” in: 39 Mitigation and Adaptation Strategies for Global Change, DOI: 10.1007/s11027-010-9242-1. 40
Batterbury, S., 2008: Anthropology and global warming: the need for environmental engagement. Australian Journal 41 of Anthropology ,1, 62-67. 42
Baumol, W.G., Oates, W.E., 1975. The Theory of Environmental Policy: Externalities Public Outlays, and the 43 Quality of Life. Prentice-Hall, INC., New Jersey. 44
Becken , S., “Harmonising climate change adaptation and mitigation: The case of tourist resorts in Fiji” Global 45 Environmental Change 15 (2005) 381–393. 46
Beckman, M., 2011: Converging and conflicting interests in adaptation to environmental change in Central Vietnam, 47 Climate and Development, 3(1), 32-41. 48
Belton, V., and T. J Stewart. 2002. Multiple criteria decision analysis: an integrated approach. Springer. 49 Berkhout, F., J. Hertin, and D.M. Gann, 2006: Learning to adapt: organisational adaptation to climate change 50
impacts. Climatic Change, 78(1), 135-156. 51 Bizikova, L., Burch, S., Cohen, S. and J. Robinson, 2010: Linking sustainable development with climate change 52
adaptation and mitigation. In: Climate Change, Ethics and Human Security. In O’Brien, K., A. StClair, and B. 53 Kristoffersen (eds.), Cambridge, Cambridge University Press, pp. 157-179. 54
ZERO-ORDER DRAFT IPCC WGII AR5 Chapter 17
Do Not Cite, Quote, or Distribute 33 25 July 2011
Bjarnadottir, Sigridur; Li, Yue; Stewart, Mark G. A probabilistic-based framework for impact and adaptation 1 assessment of climate change on hurricane damage risks and costs. Structual Safety xxx (2011) in press. 2
Blaikie, P., Wisner, B, Cannon, T and I. Davis, 1994: At Risk: Natural Hazards, People’s Vulnerability and Disaster. 3 Routledge, London, 1st. ed. 4
Bosello, F., Roson, R. and Tol, R.S.J. (2007), “Economy wide estimates of the implications of climate change: sea 5 level rise”, Environmental and Resource Economics, 37, 549-571. 6
Bouwer, L.M., 2010: Disasters and climate change: analysis and methods for projecting future losses from extreme 7 weather. PhD thesis, Vrije Universiteit Amsterdam, 141 pp. 8
Bowen, A., and S. Fankhauser (2010), Low-Carbon Development for the Bottom Billion, unpublished manuscript, 9 paper prepared for Oxfam, June. 10
Brauch, H.G., 2009a: Introduction: facing global environmental change and sectorialization of security. In: Facing 11 Global Environ¬mental Change: Environmental, Human, Energy, Food, Health and Water Security Concepts 12 [Brauch, H.G. et al. (eds.)]. Springer, Berlin, pp. 27-44. 13
Brauch, H.G., 2009b: Securitizing global environmental change. In: Facing Global Environmental Change: 14 Environmental, Human, Energy, Food, Health and Water Security Concepts. Hexagon Series on Human and 15 Environmental Security and Peace, vol. 4 [Brauch, H.G. et al. (eds.)]. Springer, Berlin, pp. 65-102. 16
Brooks, M., F. Gagnon-Lebrun, H. Harvey, C. Sauvé, and É. R Consultants. 2009. “Prioritizing Climate Change 17 Risks and Actions on Adaptation.” 18
Brouwer, Roy, and Remco van Ek. 2004. “Integrated ecological, economic and social impact assessment of 19 alternative flood control policies in the Netherlands.” Ecological Economics 50 (1-2) (September 1): 1-21. 20 doi:16/j.ecolecon.2004.01.020. 21
Burton, I. (2004): Climate change and the adaptation deficit; in Climate Change: Building the Adaptive Capacity, 22 (ed.) A. Fenech, D. MacIver, H. Auld, R. Bing Rong and Y. Yin, Environment Canada, Meteorological Service 23 of Canada. 24
Burundi, Republic of, Ministry for Land Management, Tourism and Environment. 2007. National Adaptation Plan 25 of Action (NAPA). 26
Bulir, A. and A.J.Hamann, 2008. Volatility of development aid: from the frying pan into the fire? World 27 Development 36(10), 2048-2066. 28
Burby, J. R., 2006: Hurricane Katrina and the Paradoxes of Government Disaster Policy: Bringing About Wise 29 Governmental Decisions for Hazardous Areas. The ANNALS of the American Academy of Political and Social 30 Science, 604(1), 171-191. 31
Burby, R. J., Beverly A. Cigler, Steven P. French, Edward J. Kaiser, Jack Kartez, Dale Roenigk, Dana Weist, and 32 Dale Whittington, 1991: Sharing Environmental Risks: How to Control Governments’ Losses in Natural 33 Disasters. Boulder, CO: Westview. 34
Burtraw, D., Krupnick, A., Palmer, K., Paul, A., Toma, M., Bloyd, C.,2003. Ancillary benefits of reduced air 35 pollution in the US from moderate greenhouse gas mitigation policies in the electricity sector. Journal of 36 Environmental Economics and Management 45, 650–673 37
Butt, T. A., B. A. McCarl, and A. O. Kergna (2006), ‘Policies for reducing agricultural sector vulnerability to 38 climate change in Mali’ Climate Policy, 5, 583-598. 39
Callaway, J.M. Adaptation benefits and costs: are they important in the global policy picture and how can we 40 estimate them? Global Environmental Change 14 (2004) 273-282. 41
Camerer, C. and H. Kunreuther, 1989: Decision Processes for Low Probability Events: Policy Implications. Journal 42 of Policy Analysis and Management, 8, 565-592. 43
Carter, T.R., M.L.Parry, H.Harasawa, S.Nishioka, 1994, “IPCC Technical Guidelines for Assessing Climate Change 44 Impacts and Adaptations”, IPCC Special Report, 45 http://www.ipcc.ch/publications_and_data/publications_and_data_reports.shtml, pp 59 46
Chichilnisky and Heal, 47 Chichilnisky Starrett and Heal 48 Chopra, K. (2005), Ecosystems and Human Well-being: Volume 3: Policy Responses, Washington, D.C.: Island 49
Press, pp. 621. 50 Dalby, S., 2009: Security and Environmental Change. Polity, Cambridge. 51 De Bruin, K., R. B. Dellink, A. Ruijs, L. Bolwidt, A. Van Buuren, J. Graveland, R. S. De Groot, et al. 2009. 52
“Adapting to climate change in The Netherlands: an inventory of climate adaptation options and ranking of 53 alternatives.” Climatic change 95 (1): 23–45. 54
ZERO-ORDER DRAFT IPCC WGII AR5 Chapter 17
Do Not Cite, Quote, or Distribute 34 25 July 2011
DeCanio, S.J. (October 17, 2007). "Reflections on Climate Change, Economic Development, and Global Equity". 1 The website of Stephen J. DeCanio, Professor of Economics, Emeritus, at the University of California, Santa 2 Barbara. Retrieved 2010-02-20 3
Dessai, S., M. Hulme, R. Lempert, and R. Pielke, Jr., 2009a: Climate prediction: a limit to adaptation? In: Adapting 4 to Climate Change: Thresholds, Values, Governance [Adger, W.N., I. Lorenzoni and K.L. O'Brien(eds.)]. 5 Cambridge University Press, Cambridge, pp. 64-78. 6
Dessai, S., M. Hulme, R. Lempert, and R. Pielke, Jr., 2009b: Do we need better predictions to adapt to a changing 7 climate? Eos, 90(13), 111-112. 8
Dietz, Simon; Hope, Chris; Patmore, Nicola. Some economics of “dangerous” climate change: Reflections on the 9 Stern Review. Global Environmental Change 17(2009) 311-325. 10
Dodgson, J. S., M. Spackman, A. Pearman, and L. D. Phillips. 2009. “Multi-criteria analysis: a manual.” 11 Easterling, W. E., P.R. Crosson, N.J. Rosenberg, M.S. McKenney, L.A. Katz and K.M. Lemon (1993), ‘Paper 2. 12
Agricultural Impacts of and Responses to Climate Change in the Missouri-Iowa-Nebraska-Kansas (MINK) 13 Region’ Climatic Change, 24 (1), 23-61. 14
Ebi, K.L. Adaptation Costs for Climate Change-Related Cases of Diarrhoeal Disease, Malnutrition, and Malaria in 15 2030. Global Health 2008, 4, 9. 16
Ebi, K. L, and I. Burton. 2008. “Identifying practical adaptation options: an approach to address climate change-17 related health risks.” Environmental Science & Policy 11 (4): 359–369. 18
Elbakidze, L., and B.A. McCarl, "Sequestration Offsets versus Direct Emission Reductions: Consideration of 19 Environmental Co-effects", Ecological Economics, Volume 60, 564-571, 2007. 20
Elsasser, H. and R. Bürki, 2002. Climate change as a threat to tourism in the Alps. Climate Research 20:253-257. 21 Eriksen, S., P. Aldunce, C.S. Bahinipati, R. Martins, J.I. Molefe, C. Nhemachena, K. O’Brien, F. Olorunfemi, J. 22
Park, L. Sygna, and K. Ulsrud, 2011: When not every response to climate change is a good one: identifying 23 principles for sustainable adaptation. Climate and Development, 3(1), 7-20. 24
ESMAP (2011). “Climate Impacts on Energy Systems: Key Issues for Energy Sector Adaptation”, World bank, 25 Washington DC. 26
European Environmental Agency, 2007: Climate change: the cost of inaction and the cost of adaptation, EEA 27 Technical 1 report No 13/2007. European Environmental Agency, Copenhagen. 28
Fankhauser S, 1995, "Protection versus retreat: the economic costs of sea-level rise" Environment and Planning A 29 27(2) 299 – 319 30
Fankhauser, S. (2010). ‚”The costs of adaptation”, Wiley Interdisciplinary Review Climate Change, 1(1): 23 - 30. 31 Fankhauser, Samuel and Tol, Richard S.J. (2005) On climate change and economic growth. Resource and Energy 32
Economics, 27 (1). pp. 1-17. 33 Fankhauser, S., Smith, J.B., Tol, R.S.J., 1999. Weathering climate change: some simple rules to guide adaptation 34
decisions. Ecological Economics 30 (1), 67–78. 35 Farber, D., (2007): Basic compensation for victims of climate change. University of Pennsylvania Law Review 36
155(6):1605-1656. 37 Frossard Pereira de Lucena, Andre; Schaeffer, Roberto; Salem Szklo, Alexandre. Least cost-adaptation options for 38
global climate change impacts on the Brazilian electric power system. Global Environmental Change 20 (2010) 39 342-350. 40
Füssel, H. M. 2007. “Adaptation planning for climate change: concepts, assessment approaches, and key lessons.” 41 Sustainability Science 2 (2): 265–275. 42
Goodess, C.M., J.W. Hall, M. Best, R. Betts, L. Cabantous, P.D. Jones, C.G. Kilsby, A. Pearman, C.J. Wallace, 43 2007: Climate scenarios and decision making under uncertainty. Built Environment, 33(1), 10-30. 44
Grafakos, Stelios. 2011. “Participatory integrated assessment of flood protection measures for climate adaptation in 45 Dhaka.” to be published. 46
Groves, D.G., Knopman, D., Lempert, R., Berry, S., Wainfan, L., 2007: In: Presenting Uncertainty About Climate 47 Change to Water Resource Managers—Summary of Workshops with the Inland Empire Utilities Agency, 48 RAND, Santa Monica, CA. 49
Groves, D.G., and R.J. Lempert, 2007: A new analytic method for finding policy-relevant scenarios. Global 50 Environmental Change, 17, 73–85. 51
Hall, J.W., 2007: Probabilistic climate scenarios may misrepresent uncertainty and lead to bad adaptation decisions. 52 Hydrological Processes, 21(8), 1127-1129. 53
ZERO-ORDER DRAFT IPCC WGII AR5 Chapter 17
Do Not Cite, Quote, or Distribute 35 25 July 2011
Hallegatte, S., 2006, A Cost-Benefit Analysis of the New Orleans Flood Protection System. Regulatory Analysis 06-1 02. AEI-Brookings Joint Center, Mar 2006. 2
Hallegatte, S., J.-C. Hourcade, P. Ambrosi, 2007, Using Climate Analogues for Assessing Climate Change 3 Economic Impacts in Urban Areas, Climatic Change 82 (1-2), 47-60 4
Hallegatte, S., F. Lecocq, C. De Perthuis, 2011. Designing Climate Change Adaptation Policies - An Economic 5 Framework, Policy Research Working Paper 5568, The World Bank 6
Hallegatte, S., 2009: Strategies to adapt to an uncertain climate change, Global Environmental Change 19, 240-247 7 Hallegatte, S. P. Dumas, J.-C. Hourcade, 2010. A Note on the Economic Cost of Climate Change and the Rationale 8
to Limit it Below 2°C, World Bank Policy Research Working Paper 5179 9 Hallegatte S., Przyluski, V., 2010, The economics of natural disasters: concepts and methods,World Bank Policy 10
Research Working Paper 5507, The World Bank, Washington D.C. 11 Harberger, A.C., 1978. On the use of distributional weights in social cost–benefit analysis. Journal of Political 12
Economy 86 (2). 13 Harberger, A.C., 1984, Basic needs versus distributional weights in social cost-benefit analysis, Economic 14
Development and Cultural Change, 32(3):455-74. 15 Hof, Andries F., van Vuuren, Detlef p., den Elzen, Michael G.J. A qualitative minimax regret approach to climate 16
change: Does discounting still matter? Ecological Economics 70 (2010) 43-51 17 Hogarth, R., and H. Kunreuther, 1995: Decision Making Under Ignorance: Arguing with Yourself. Journal of Risk 18
and Uncertainty, 10, 15-36. 19 Hourcade, Jean-Charles; Ambrosi, Philippe; Dumas, Patrice.Beyond the Stern Review: Lessons from a risky venture 20
at the limits of the cost-benefit analysis. Ecological Economics 68 (2009) 2479-2484. 21 Hughes. G. Chinowsky, P. Strzepak, K. The costs of adaptation to climate change for water infrastructure in OECD 22
countries. Utility Policy 18 (2010) 142-153. 23 IMF (2008), “The Fiscal Implications of Climate Change”, Fiscal Affairs Department, IMF, Washington DC. 24 IPCC WGII (2007), Climate Change 2007: Impacts, Adaptation and Vulnerability. Contribution of Working Group 25
II to the Third Assessment Report of the Intergovernmental Panel on Climate Change, Cambridge, UK and New 26 York, US: Cambridge University Press. 27
IPCC WGIII (2007), Climate Change 2007: Mitigation of Climate Change. Contribution of Working Group III to 28 the Fourth Assessment Report of the Intergovernmental Panel on Climate Change, Cambridge, UK and New 29 York, US: Cambridge University Press. 30
Janssen, R., and M. Van Herwijnen. 2006. “A toolbox for multicriteria decision-making.” International journal of 31 environmental technology and management 6 (1): 20–39. 32
Julius, S. H, and J. D Scheraga. 2000. “The TEAM model for evaluating alternative adaptation strategies.” 33 LECTURE NOTES IN ECONOMICS AND MATHEMATICAL SYSTEMS: 319–330. 34
Kaiser, H. M., S. J. Riha, D. S. Wilkes, D. G. Rossiter and R. K. Sampath (1993), ‘A Farm-Level Analysis of 35 Economic and Agronomic Impacts of Gradual Climate Warming’, American Journal of Agricultural 36 Economics, 75 (2), 387-398. 37
Keeney, R. L, and H. Raiffa. 1993. Decisions with multiple objectives: Preferences and value tradeoffs. Cambridge 38 Univ Pr. 39
Kemfert, C. (2002), “An Integrated Assessment Model of Economy-Energy-Climate – The Model Wiagem), 40 Integrated Assessment Journal, 3:4. 41
Kiker, G. A, T. S Bridges, A. Varghese, T. P Seager, and I. Linkov. 2005. “Application of multicriteria decision 42 analysis in environmental decision making.” Integrated Environmental Assessment and Management 1 (2): 95–43 108. 44
Kim, M-K., and B.A. McCarl, "Uncertainty Discounting for Land-Based Carbon Sequestration", Journal of 45 Agricultural and Applied Economics, 41, 1(April 2009), 1-11, 2009. 46
King J.R. (2005), ‘Report of the Study Group on Fisheries and Ecosystem Responsesto Recent Regime Shifts’, 47 PICES Scientific Report 28, Sidney, BC, Canada: Institute of Ocean Sciences. 48
Kubal, C., D. Haase, V. Meyer, and S. Scheuer. 2009. “Integrated urban flood risk assessment- adapting a 49 multicriteria approach to a city.” Natural Hazards and Earth System Sciences 9 (6): 1881–1895. 50
Kunreuther, H., R. Ginsberg, L. Miller, P. Sagi, P. Slovic, B. Borkan, and N. Katz, 1978: Disaster Insurance 51 Protection: Public Policy Lessons. John Wiley and Sons, New York. 52
Leary, N., J. Adequwon, V. Barros, I. Burton, J. Kukarni, and R. Lasco (eds.), 2008: Climate Change and 53 Adaptation. Earthscan, London, UK. 54
ZERO-ORDER DRAFT IPCC WGII AR5 Chapter 17
Do Not Cite, Quote, or Distribute 36 25 July 2011
Lemieux, C. J., and D. J. Scott (2005), ‘Climate change, biodiversity conservation and protected area planning in 1 Canada’, Canadian Geographer / Le Géographe canadien, 49 (4), 384-397. 2
Loomis, J., Kent, P., Strange, L., Fausch, K., Covich, A., 2000. Measuring the total economic value of restoring 3 ecosystem services in an impaired river basin: results from a contingent valuation survey. Ecological 4 Economics 33, 103–117. 5
Magat, W., K. W. Viscusi, and J. Huber, 1987: Risk-dollar tradeoffs, risk perceptions, and consumer behaviour. In: 6 Learning About Risk [Viscusi, W. & W. Magat (eds.)]. Harvard University Press, Cambridge, MA, 83-97. 7
Markandya, A. and A. Chiabai (2009) “Valuing Climate Change Impacts on Human Health: Empirical Evidence 8 from the Literature”, Int. J. Environ. Res. Public Health, 6, 759-786. 9
Markandya, A. and A. Mishra (eds.) (2011) “Costing Adaptation: Preparing for Climate Change in India”. TERI 10 Press, New Delhi.258pp. 11
Matthews, S., O'Connor, R., Plantinga, A.J., 2002. Quantifying the impacts on biodiversity of policies for carbon 12 sequestration in forests. Ecological Economics 40 (1), 71–87. 13
McCann, L., Easter, K.W., 2000. Transaction costs of policies to reduce agricultural phosphorous in the Minnesota 14 river. Land Economics 75 (3), 402–414. 15
McCarl, B. A. (2007), ‘Adaptation Options for Agriculture, Forestry and Fisheries. A Report to the UNFCCC 16 Secretariat Financial and Technical Support Division’, 17 http://unfccc.int/files/cooperation_and_support/financial_mechanism/application/pdf/mccarl.pdf, accessed 4 18 January 2010 19
McGray, H., A. Hammill, R. Bradley, E.L. Schipper and J.-E. Parry, 2007: Weathering the Storm: Options for 20 Framing Adaptation and Development. World Resources Institute, Washington, DC, USA, 57 pp. 21
McMichael, A.J.; Campbell-Lendrum, D.; Kovats, S.; Edwards, S.; Wilkinson, P.; Wilson, T.; Nicholls, R.; Hales, 22 S.; Tanser, F.; LeSueur, D.; Schlesinger, M.; Andronova, N. (2004). Global Climate Change. In Comparative 23 Quantification of Health Risks: Global and Regional Burden of Disease due to Selected Major Risk Factors; 24 Ezzati, M., Lopez, A., Rodgers, A., Murray, C., Eds.; World Health Organization: Geneva, Switzerland, 2004; 25 1543-1649. 26
Mendelsohn, R., Balick, M., 1995. The value of undiscovered pharmaceuticals in tropical forests. Economic Botany 27 49 (2), 223–228. 28
Mendelsohn, R., and A. Dinar (2003), ‘Climate, Water, and Agriculture’, Land Economics, 79 (3), 328-341. 29 Mendelsohn, R., W. D. Nordhaus, and D. Shaw (1994), ‘The Impact of Global Warming on Agriculture: A 30
Ricardian Analysis’, The American Economic Review, 84 (4), 753-771. 31 Mercer, J., I. Kelman, K., Lloyd, and S. Suchet-Pearson S., 2008: Reflections on use of participatory research for 32
disaster risk reduction. Area, 40(2), 172-183. 33 Michel-Kerjan, E., 2008: Disasters and public policy: Can market lessons help address government failures. 34
Proceedings of the 99th National Tax Association conference, Boston, MA. 35 Mote, P. W., E.A. Parson, A.F. Hamlet, K.N. Ideker, W.S. Keeton, D.P. Lettenmaier, N.J. Mantua, E.L. Miles, D.W. 36
Peterson, D.L. Peterson, R. Slaughter, and A.K. Snover (2003), ‘Preparing for Climatic Change: The Water, 37 Salmon, and Forests of the Pacific Northwest’, Climatic Change, 61 (1), 45-88. 38
Murray, B.C., B.A. McCarl, and H-C. Lee, "Estimating Leakage From Forest Carbon Sequestration Programs", 39 Land Economics, 80(1), 109-124, 2004. 40
Nordhaus, W., 2006: The Economics of Hurricanes in the United States, National Bureau of Economic Research, 41 Cambridge, Mass.Oxfam (2007) 42
Nordhaus, W.D., 2007: A question of balance. MIT Press, Cambridge MA. OR 43 O’Brien, K.L., R. Leichenko, U. Kelkar, H. Venema, G. Aandahl, H. Tompkins, A. Javed, S. Bhadwal, S. Barg, L. 44
Nygaard, and J. West, 2004: Mapping vulnerability to multiple stressors: climate change and globalization in 45 India. Global Environmental Change, 14, 303–313. 46
O’Brien, K., B. Hayward, and F. Berkes, 2009: Rethinking Social Contracts: Building Resilience in a Changing 47 Climate. Ecology & Society, 14 (2): 12.[online] URL: http://www.ecologyandsociety.org/vol14/iss2/art12/ 48
O’Brien, K., A. St Clair, and B. Kristoffersen, 2010b: The framing of climate change: Why it matters. In: Climate 49 Change, Ethics and Human Security [O’Brien, K., A. St Clair and B. Kristoffersen (eds.)]. Cambridge 50 University Press, Cambridge, 3-22. 51
Owour, B., W. Mauta, and S. Eriksen, 2011: Strengthening sustainable adaptation: examining interactions between 52 pastoral and agropastoral groups in dryland Kenya. Climate and Development, 3(1), 42-58. 53
ZERO-ORDER DRAFT IPCC WGII AR5 Chapter 17
Do Not Cite, Quote, or Distribute 37 25 July 2011
Oxfam (2007), ‘Adapting to Climate Change: What’s needed in poor countries, and who should pay’, 1 http://www.oxfam.org/en/policy/briefingpapers/bp104_climate_change_0705, accessed 12 January 2010 2
Parry, M., N. Arnell, P. Berry, D. Dodman, S. Fankhauser, C. Hope, S. Kovats, R. Nichollas, D. Satterthwaite, R. 3 Tiffin, and R. Wheeler, 2009: Assessing the Costs of Adaptation to Climate Change: A review of the UNFCCC 4 and other recent estimates, International Institute for Environment and Development and Grantham Institute for 5 Climate Change, London. 6
Pattanayak, S.K., McCarl, B., Sommer, A., Murray, B., Bondelid, T., Gillig, D., DeAngelo, D.B., 2005. Water 7 quality co-effects of greenhouse gas mitigation in us agriculture. Climatic Change 71 (3), 341–372. 8
Pelling, M., C. High, J. Dearing and D. Smith, 2007: Shadow spaces for social learning: a relational understanding 9 of adaptive capacity to climate change within organizations. Environment and Planning A, 40 (4), 867-884. 10
Pelling, M., and K. Dill, 2009: Disaster politics: tipping points for change in the adaptation of socio-political 11 regimes. Progress in Human Geography, 34, 21-37. doi:10.1177/0309132509105004 12
Pielke, Roger Jr. 2007. “Mistreatment of the economic impacts of extreme events in the Stern Review Report on the 13 Economics of Climate Change. Global Environmental Change 17 (2007) 302-310. 14
Plantinga, A.J., Wu, J., 2003. Co-benefits from carbon sequestration in forests: evaluating reductions in agricultural 15 externalities from and afforestation policy in Wisconsin. Land Economics 79 (1), 74–85. 16
Platt, R.H., 1999: Disasters and Democracy: the politics of extreme natural events. Washington DC, Island Press. 17 Portney, P.R., Mullahy, J., 1986. Urban air quality and acute respiratory illness. Journal of Urban Economics 20, 18
21–38. 19 Qin, X. S., G. H. Huang, A. Chakma, X. H. Nie, and Q. G. Lin. 2008. “A MCDM-based expert system for climate-20
change impact assessment and adaptation planning-A case study for the Georgia Basin, Canada.” Expert 21 Systems with Applications 34 (3): 2164–2179. 22
Reeder, T., J. Wicks, L. Lovell and O. Tarrant. 2009: Protecting London from tidal flooding: limits to engineering 23 adaptation. In: Adapting to Climate Change: Thresholds, Values, Governance [Adger, W.N., I. Lorenzoni and 24 K. O'Brien (eds.)]. Cambridge University Press, Cambridge, 54-78. 25
Repetto, R., 2008: The Climate Crisis and the Adaptation Myth. Working Paper 13, New Haven, Yale School of 26 Forestry and Environmental Studies. 27
Reilly, J., F. Tubiello, B.A. McCarl, D.G. Abler, R. Darwin, K. Fuglie, S.E. Hollinger, R.C. Izaurralde, S. Jagtap, 28 J.W. Jones, L.O. Mearns, D.S. Ojima, E.A. Paul, K. Paustian, S.J. Riha, N.J. Rosenberg, and C. Rosenzweig 29 (2003), ‘U.S. Agriculture and Climate Change: New Results’, Climatic Change, 57 (1), 43-67. 30
Reilly, J. M., J. Hrubovcak, J. Graham, D.G. Abler, R. Darwin, S.E. Hollinger, R.C. Izaurralde, S. Jagtap, J.W. 31 Jones, J. Kimble, B.A. McCarl, L.O. Mearns, D.S. Ojima, E.A. Paul, K. Paustian, S.J. Riha, N.J. Rosenberg, C. 32 Rosenzweig, and F. Tubiello (2002), Changing Climate and Changing Agriculture, Cambridge, UK and New 33 York, US: Cambridge University Press. 34
Ribaudo, M.O., 1989. Water Quality Benefits from the Conservation Reserve Program. Agricultural Economic 35 Report, vol. 606. U.S. Department of Agriculture, Economic Research Service, Washington, DC. 36
Rose, S. K., and B. A. McCarl (2008), ‘Greenhouse Gas Emissions, Stabilization and the Inevitability of Adaptation: 37 Challenges for U.S. Agriculture’, Choices, 23 (1), 15-18. 38
Rosenzweig, C., K.M. Strzepek, D.C. Major, A. Iglesias, D.N. Yates, A. McCluskey and D. Hillel, 2004: Water 39 resources for agriculture in a changing climate: international case studies. Global Environmental Change, 14, 40 345-360. 41
Schelling, T. (1992), “Some Economics of Global Warming” American Economic Review 82(1), pp 1-14. 42 Schelling, T. (1997). The Cost of Combating Global Warming: Facing the Tradeoffs, Foreign Affairs, Foreign 43
Affairs, Vol. 76, No. 6, pp 8-14. 44 Schlenker, W., W. M. Hanemann, and A. C. Fisher (2006), ‘The Impact of Global Warming on U.S. Agriculture: An 45
Econometric Analysis of Optimal Growing Conditions’, Review of Economics and Statistics, 88 (1), 113-125. 46 Seo, S. N., R. Mendelsohn, A. Dinar, and P. Kurukulasuriya (2009b), ‘Adapting to Climate Change Mosaically: An 47
Analysis of African Livestock Management by Agro-Ecological Zones’, The B.E. Journal of Economic 48 Analysis & Policy, 9 (2). 49
Seo, S. N., and R. Mendelsohn (2008a), ‘An analysis of crop choice: Adapting to climate change in South American 50 farms’, Ecological Economics, 67 (1), 109-116. 51
Seo, S. N., and R. Mendelsohn (2008b), ‘Animal husbandry in Africa: Climate change impacts and adaptations’, 52 African Journal of Agricultural and Resource Economics, 2 (1). 53
ZERO-ORDER DRAFT IPCC WGII AR5 Chapter 17
Do Not Cite, Quote, or Distribute 38 25 July 2011
Seo, S. N., and R. Mendelsohn (2008c), ‘Measuring impacts and adaptations to climate change: a structural 1 Ricardian model of African livestock management’, Agricultural Economics, 38 (2), 151-165. 2
Seo, S., R. Mendelsohn, A. Dinar, R. Hassan and P. Kurukulasuriya (2009a), ‘A Ricardian Analysis of the 3 Distribution of Climate Change Impacts on Agriculture across Agro-Ecological Zones in Africa’, 4 Environmental and Resource Economics, 43 (3), 313-332. 5
Smit, B., Burton, I., Klein, R., Wandel, J., 2000. An anatomy of adaptationto climate change and variability. 6 Climatic Change 45, 223–251. 7
Smith, G.A., B.A. McCarl, C.S. Li, J.H. Reynolds, R. Hammerschlag, R.L. Sass, W.J. Parton, S.M. Ogle, K. 8 Paustian, J.A. Holtkamp, and W. Barbour, Harnessing farms and forests in the low-carbon economy: how to 9 create, measure, and verify greenhouse gas offsets, Edited by Zach Willey and Bill Chameides, Durham, NC: 10 Duke University Press, 229 p, 2007. 11
Smith, J. B, and S. S Lenhart. 1996. “Climate change adaptation policy options.” Climate Research 6: 193–201. 12 Sperling, F., C. Valdivia, R. Quiroz, R. Valdivia, L. Angulo, A. Seimon and I. Noble, 2008: Transitioning to 13
Climate Resilient Development: Perspectives from Communities in Peru. World Bank Environment Department 14 Papers, Paper Number 115. Climate Change Series. World Bank. Washington D.C. 103 pp. 15
Spittlehouse, D. L., and R. B. Stewart (2003), ‘Adaptation to climate change in forest management’, BC Journal of 16 Ecosystems and Management, 4 (1), 1-11. 17
Stavins Robert N., 1995. "Transaction Costs and Tradeable Permits," Journal of Environmental Economics and 18 Management, Elsevier, vol. 29(2), pages 133-148, September. 19
Stern, N., 2006: Stern Review: Economics of Climate Change, Cambridge University Press, Cambridge.UNDP 20 (2007) 21
Tebaldi C, R. Smith, D. Nychka, L. Mearns, 2005. Quantifying uncertainty in projections of regional climate 22 change: a Bayesian approach to the analysis of multi-model ensembles. J. Clim. 18, 1524–1540. 23
Thaler, R., 1999: Mental accounting matters. Journal of Behavioral Decision Making, 12, 183-206. 24 Tol, R. , The damage costs of climate change towards a dynamic representation, Ecol. Econ. 19 (1996) 67690. 25 Tol, Richard S. J. 2005. “Emission Abatement versus Development as Strategies to Reduce Vulnerability to Climate 26
Change: An Application of FUND.” Environment and Development Economics, 10(5): 615–29. 27 Tol, R.S.J. and G.W. Yohe (2007), 'The Weakest Link Hypothesis for Adaptive Capacity: An Empirical Test‟, 28
Global Environmental Change, 17: 218-227. 29 Tol, R. S. J., T. E. Downing, O. J. Kuik, and J. B. Smith: 2004. Distributional aspects of climate change impacts. 30
Global Environmental Change, 14, 259-72. 31 Tol, R.S.J., Fankhauser, S., Smith, J.B. 1998. The Scope for Adaptation to Climate Change: What Can We Learn 32
from the Impact Literature? Global Environmental Change 8(2) 109–123. 33 Train, K., 1985, “Discount rates in consumer’s energy-related decisions: a review of the literature”, Energy, 34
10(12):1243-1253 35 Trope, Y. and N. Liberman, 2003: Temporal construal. Psychological Review. 110 (3), 403-421. 36 Tversky A., D. Kahneman, 1974, Judgment under Uncertainty: Heuristics and Biases, Science, New Series, 37
185(4157), 1124–1131. 38 Tversky, A. and E. Shafir, 1992: Choice under conflict: the dynamics of deferred decision. Psychological Science, 39
3(6), 358-361. 40 UNFCCC, 2007: Investment and Financial Flows to Address Climate Change. Climate Change Secretariat, Bonn, 41
Germany. 42 UNFCCC, (United Nations Framework Convention on Climate Change), Least Developed Countries Expert Group. 43
2002. Annotated Guidelines for the Preparation of National Adaptation Programmes of Action. 44 http://unfccc.int/files/cooperation_and_support/ldc/application/pdf/annguide.pdf. 45
U.S. Global Climate Research Program, Synthesis and Assessment Product 4.1, 46 U.S. National Academy of Sciences, 2010, Adapting to the Impacts of Climate Change, America’s Climate Choices: 47
Panel on Adapting to the Impacts of Climate Change. Board on Atmospheric Sciences and Climate Division on 48 Earth and Life Studies. National Academies Press, Washington, DC. 49
Verlade, Sandra et al. Valuing the impacts of climate change on protected areas in Africa. Ecological Economics 53 50 (2005) 21-33. 51
Viscusi, W Kip & Aldy, Joseph E, 2003. " The Value of a Statistical Life: A Critical Review of Market Estimates 52 throughout the World," Journal of Risk and Uncertainty, Springer, vol. 27(1), pages 5-76, August. 53
Vivid Economics 2010. “Promoting Economic Growth when the Climate is Changing”, grey literature. 54
ZERO-ORDER DRAFT IPCC WGII AR5 Chapter 17
Do Not Cite, Quote, or Distribute 39 25 July 2011
Watkiss, P. and Hunt, A., 2010. Review of Adaptation Costs and Benefits Estimates in Europe for SOER 2010. 1 Contribution to the EEA SOER 2010. Report to the European Environment Agency. 2
West, J. J., Small, M. J., & Dowlatabadi, H. (2001). Storms, investor decisions, and the economic impacts of sea 3 level rise. ClimaticChange, 48, 317–342. 4
Wilbanks, T., 2007: Scale and sustainability. Climate Policy, special issue on Integrating Climate Change Actions 5 into Local Development, 7/4 (2007), pp. 278-287. 6
Wilbanks, T. and J. Sathaye, 2007: Integrating mitigation and adaptation as responses to climate change: a synthesis. 7 Mitigation and Adaptation Strategies for Global Change, 12(5), 957-962. 8
Wilbanks, T., 2010: Research and development priorities for climate change mitigation and adaptation. In: Dealing 9 with Climate Change: Setting a Global Agenda for Mitigation and Adaptation [Pachauri, R. (ed.)]. New Delhi, 10 TERI, 2010, 77-99. 11
Willows, R., and R. Connell. 2003. “Climate adaptation Risk, uncertainty and decision-making.” 12 World Bank (2009), World Development Report 2010. Development and Climate Change. World Bank, Washington 13
DC. 14 World Bank (2010), The Costs to Developing Countries of Adapting to Climate Change: New Methods and 15
Estimates. 2010. The World Bank, Washington DC. 16 World Bank, 2010: Economics of Adaptation to Climate Change. World Bank, Washington, D.C. 17 Yohe, G. , Neumann, J. and Ameden, H., 1995, “Assessing the Economic Cost of Greenhouse Induced Sea Level 18
Rise: Methods and Applications in Support of a National Survey”, Journal of Environmental Economics and 19 Management 29: S-78-S-97. 20
Yohe, G., Neumann, J., Marshall, P., and Ameden, H., 1996, “The Economic Cost of Greenhouse Induced Sea Level 21 Rise in the United States”, Climatic Change 32: 387-410. 22
Yohe, G. and R. Leichenko, 2010. Adopting a risk-based approach. Annals of the New York Academy of Sciences 23 1196: 29-40. 24
Yohe, G., K. Knee, and P. Kirshen, 2011. On the Economics of Coastal Adaptation Solutions in an Uncertain World, 25 Climatic Change 26
27
ZERO-ORDER DRAFT IPCC WGII AR5 Chapter 17
Do Not Cite, Quote, or Distribute 40 25 July 2011
Table 17-1: Methodologies for the economic assessment of climate change and adaptation. Approach Description Examples Advantages Issues Economic Integrated Assessment Models (IAM)
Aggregated economic models. Values in future periods, expressed £ and %GDP and values over time (PVs)
Global studies (e.g. de Bruin et al) that provide outputs for Europe.
Provide headline values for raising awareness. Very flexible – wide range of potential outputs (future years, PV, CBA).
Aggregated and low representation of impacts, generally exclude extreme events and do not capture adaptation in any realistic form. Not suitable for detailed national planning.
Investment and Financial Flows (I&FF)
Financial analysis. Costs of adaptation (increase against future baseline)
Global studies (e.g. UNFCCC, 2007). National studies, e.g. Swedish Commission (2007) has analysis with I&FF type approach.
Costs of adaptation in short-term policy time-scale. Easier to apply even without detailed analysis of climate change.
No specific linkage with climate change or adaptation (though can be included). No analysis of adaptation benefits or residual impacts.
Computable General Equilibrium models (GCE)
Multi-sectoral economic analysis.
National level – Germany (Kemfert, 2006)
Capture cross-sectoral linkages in economy wide models (not in other approaches). Can represent global and trade effects.
Aggregated representation of impacts and can only capture adaptation in market form. Issues with projections of sectoral linkages. Omits non-market effects. Not suitable for detailed national planning.
Impact assessment (scenario based assessment)
Physical effects and economic costs of CC with sectoral models in future periods, and costs and benefits of adaptation or in cost-effectiveness analysis
PESETA study (2007) and coastal analysis. National scale: UK Flooding (Thorne et. al. 2007)
More sector specific analysis. Provides physical impacts as well as economic values – therefore can capture gaps and non-market sectors.
Not able to represent cross-sectoral, economy-wide effects. Tends to treat adaptation as a menu of hard (technical) adaptation options. Less relevant for short-term policy.
Impact assessment – shocks
Use of historic damage loss relationships (statistics and econometrics) applied to future projections of shocks combined with adaptation costs (and sometimes benefits)
Sector level, e.g. EAC study (2009) in the UK.
Allow consideration of future climate variability (in addition to future trends)
Issues of applying historical relationships to the future. Issues with high uncertainty in predicting future extremes.
Impact assessment - econometric based
Relationships between economic production and climate parameters derived with econometric analysis and applied to future scenarios – and to consider adaptation
National level Household level or sector
Can provide information on overall economic growth and allow analysis of longer-term effects. Provide greater sophistication with level of detail.
Mostly focused on autonomous or non-specified adaptation. Very simplistic relationships to represent complex parameters. No information on specific attributes. Issues on whether relationships are applicable to future time periods.
Risk management Current and future risks to climate variability. Probabilistic approach.
Flood risk studies (coastal and river).
Well suited for current and future risks and uncertainty, Often used with Cost-effectiveness. Has been applied in adaptive management and iterative analysis.
Extra dimension of complexity associated with probabilistic approach. Limited applicability: focused on thresholds (e.g. risk of flooding).
Adaptation assessments
Risks over a range of policy / planning horizons. Often linked risk management and adaptive capacity.
No real economic examples. Emerging number of adaptation assessments.
Stronger focus on immediate adaptation policy needs and decision making under uncertainty and greater consideration of diversity of adaptation (including soft options) and adaptive capacity.
Less explored in relation to economic assessment
Source: Watkiss and Hunt, 2010
ZERO-ORDER DRAFT IPCC WGII AR5 Chapter 17
Do Not Cite, Quote, or Distribute 41 25 July 2011
Table 17-2 [IN PROCESS] Citation Setting Nature of ancillary benefits Becken , S., “Harmonising climate change adaptation and mitigation: The case of tourist resorts in Fiji” Global Environmental Change 15 (2005) 381–393.
Adaptation measures for tourism on tropical islands and their positive or negative ancillary effects
Water quality, ecosystems, pollution, amenities,
Butt and McCarl Adaptation actions for the Malian agricultural sector
Reduction in the risk of Hunger for the population
Markandya, A. and Chiabai, A. “Valuing Climate Change Impacts on Human Health: Empirical Evidence from the Literature” Int. J. Environ. Res. Public Health 2009, 6, 759-786
Adaptation action to address increased risk of water borne diseases through improvements in water supply and sanitation
Improved quality of life and less burden of disease from current climate factors
Table 17-3: Estimates of global costs of adaptation. Study Results
(billion USD/a)
Time frame Sectors Methodology and comment
World Bank, 2006
9-41 Present Unspecified Cost of climate proofing foreign direct investments (FDI), gross domestic investments (GDI) and Official Development Assistance (ODA)
Stern, 2006 4-37 Present Unspecified Update of World Bank (2006) Oxfam, 2007
>50 Present Unspecified WB (2006) plus extrapolation of cost estimates from national adaptation plans (NAPAs) and NGO projects.
UNDP, 2007
86-109 2015 Unspecified WB (2006) plus costing of targets for adapting poverty reduction programmes and strengthening disaster response systems
UNFCCC, 2007
28-67 2030 Agriculture, forestry and fisheries; water supply; human health; coastal zones; infrastructure
Planned investment and Financial Flows required for the international community
World Bank, 2010
70-100 2050 Agriculture, forestry and fisheries; water supply; human health; coastal zones; infrastructure
Improvement upon UNFCCC (2007): more precise unit cost, inclusion of cost of maintenance and port upgrading, risks from sea-level rise and storm surges.
Source:
ZERO-ORDER DRAFT IPCC WGII AR5 Chapter 17
Do Not Cite, Quote, or Distribute 42 25 July 2011
Table 17-4: Regionalized annual costs of adaptation for wet and dry scenarios (billion USD 2010). Scenario/Region East
Asia&Pacific
Europe&Central Asia
Latin America&Caribbean
Middle Easte&North America
South Asia
Subsaharan Africa
Total
Wet 25.7 12.6 21.3 3.6 17.1 17.1 97.5 Dry 17.9 6.9 14.8 2.5 15 14.1 71.2 Source: World Bank, 2010 Table 17-5: Coverage of adaptation costs and benefits.
Source: Agrawala and Fankhauser (2008)
ZERO-ORDER DRAFT IPCC WGII AR5 Chapter 17
Do Not Cite, Quote, or Distribute 43 25 July 2011
Figure 7-1
Figure 7-2
Ideal worldCaptures all
climate change opportunities; cancels all
possible adverse impacts
What is possible today?
Technical limitswith current
knowledge (whatcan be done with
unlimitedresources)
What isdesirable?Adaptation
objective takinginto account
adaptation costand benefits(multi‐metrics)
What will bedone?
What will be doneconsidering the socio‐economiccontext (e.g., financial
constraints)
Physical limits(some thingsare simplyimpossible)
(e.g., protectinga coastal city
whilepreserving
amenities and ecosystems)
Economic limits OR « which adaptation one wants to do. »
(trade‐offs)
(e.g., you do not want to preserve all coastline because itis expensive and you
have otheropportunities withlimited resources)
Barriers or constaints
(e.g., you have no access to a loan to finance a projectthat is desirable)
Do nothing
Real‐world adaptation
Whatadaptation istheoreticallypossible?« Law of physics » limits
Technical limits(some thingsare impossible with current
knowledge but are
theoreticallypossible)
Cannot bereduced
Can be reducedwith R&D
Can be reducedwith lower costs or higher benefits
Can be reducedwith betterinstitutions
Adaptationspace
ZERO-ORDER DRAFT IPCC WGII AR5 Chapter 17
Do Not Cite, Quote, or Distribute 44 25 July 2011
Figure 7-3a $ Adaptation costs
Residual damages
Avoided damages Total Damages Figure 7-3b Figure 17-3: Schematic of adaptation costs, avoided damages, and residual damage compared (a) at a point in time and (b) over time.
Amount of Adaptaton
MC
MDA
ZERO-ORDER DRAFT IPCC WGII AR5 Chapter 17
Do Not Cite, Quote, or Distribute 45 25 July 2011
Figure 17-4. Illustrative example assuming a homogenous protection at 180 cm above current mean sea level (in the ‘No SLR’ and ‘50 cm SLR’ cases). The vertical arrow shows the cost of SLR in absence of adaptation. The horizontal arrow shows the need for adaptation to maintain mean annual losses unchanged.
Figure 17-5: Implications of externality consideration. NEED TO REDRAW THE GRAPH.
100 150 200 250 300
1
100
10,000
Protection level (cm)
Mea
n an
nual
loss
es (d
irect
+ind
irect
) (m
illio
ns o
f Eur
os, l
ogar
ithm
ic s
cale
)No SLR50 cm SLR
Cost of SLR(in absence of
adaptation)
Adaptationneeds to
cancel theSLR cost
Graph 1. Implications of Externality Consideration
AF Agriculture and forestry sector N Energy Sector a Proportion of total emission reductions achieved through AF sector n Proportion of total emission reductions achieved through N sector CAF(a) Marginal private costs of sequestration in AF sector CN(n) Marginal private costs of sequestration in N sector CS
AF(a) Marginal social costs of sequestration in AF sector CS
N(n) Marginal social costs of sequestration in N sector

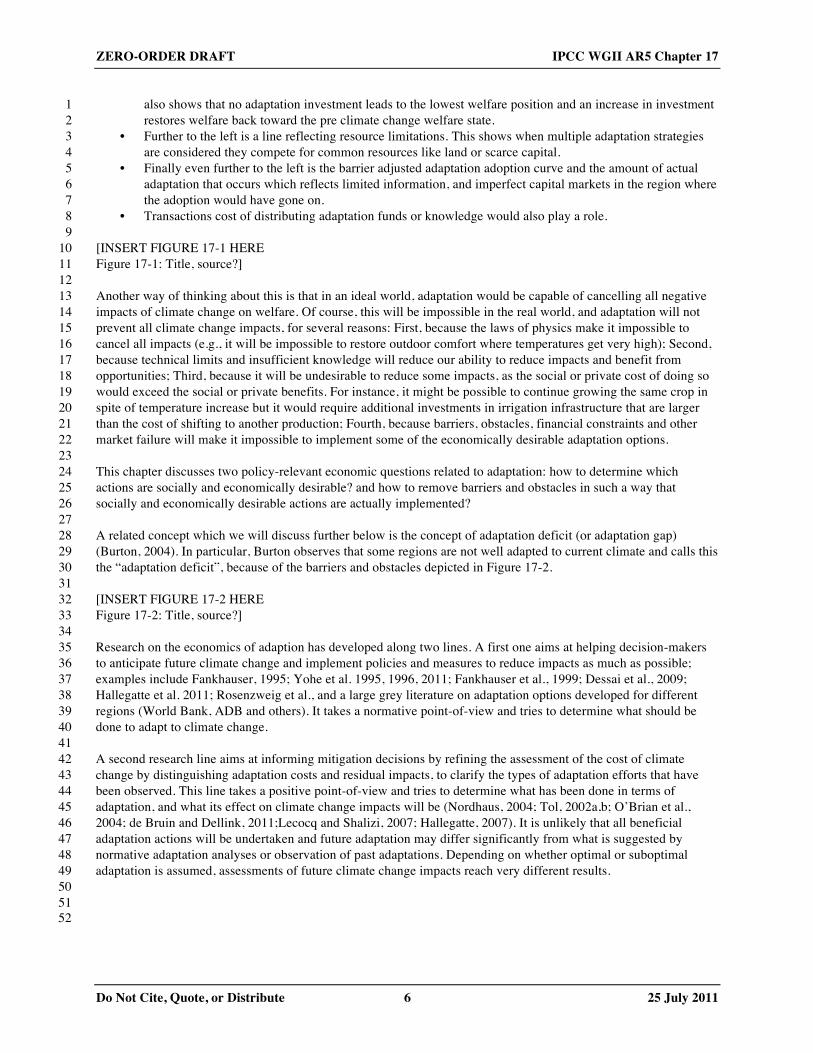


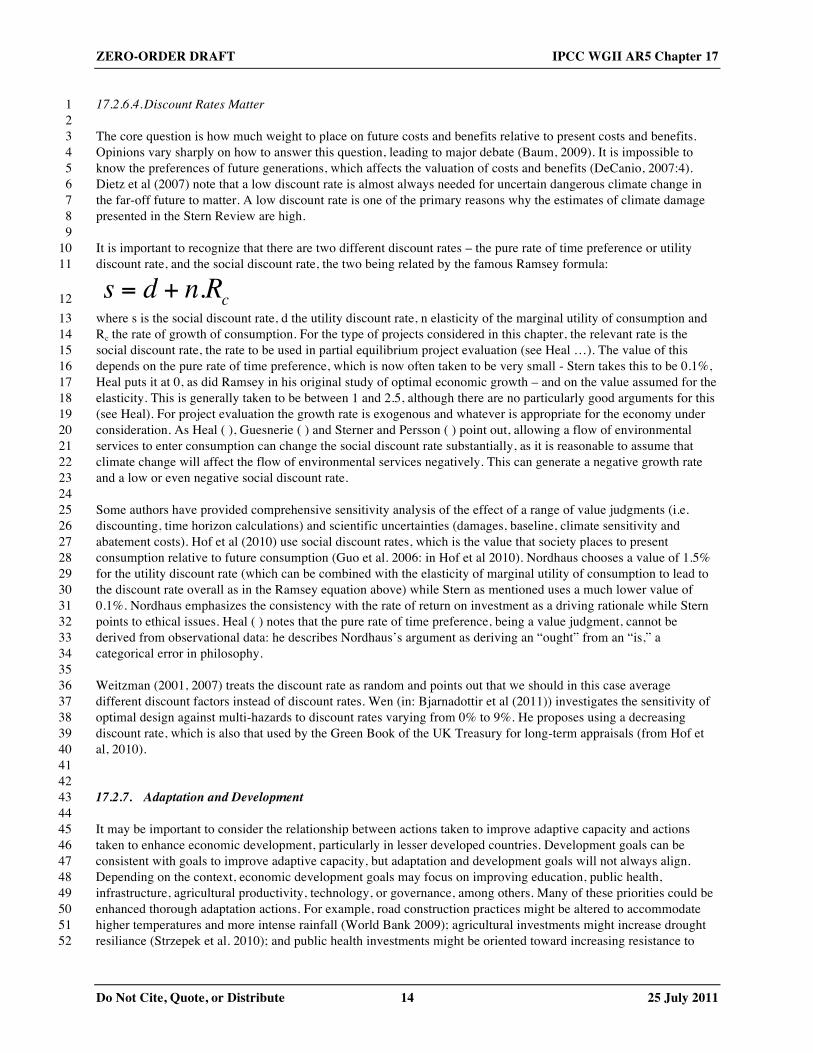


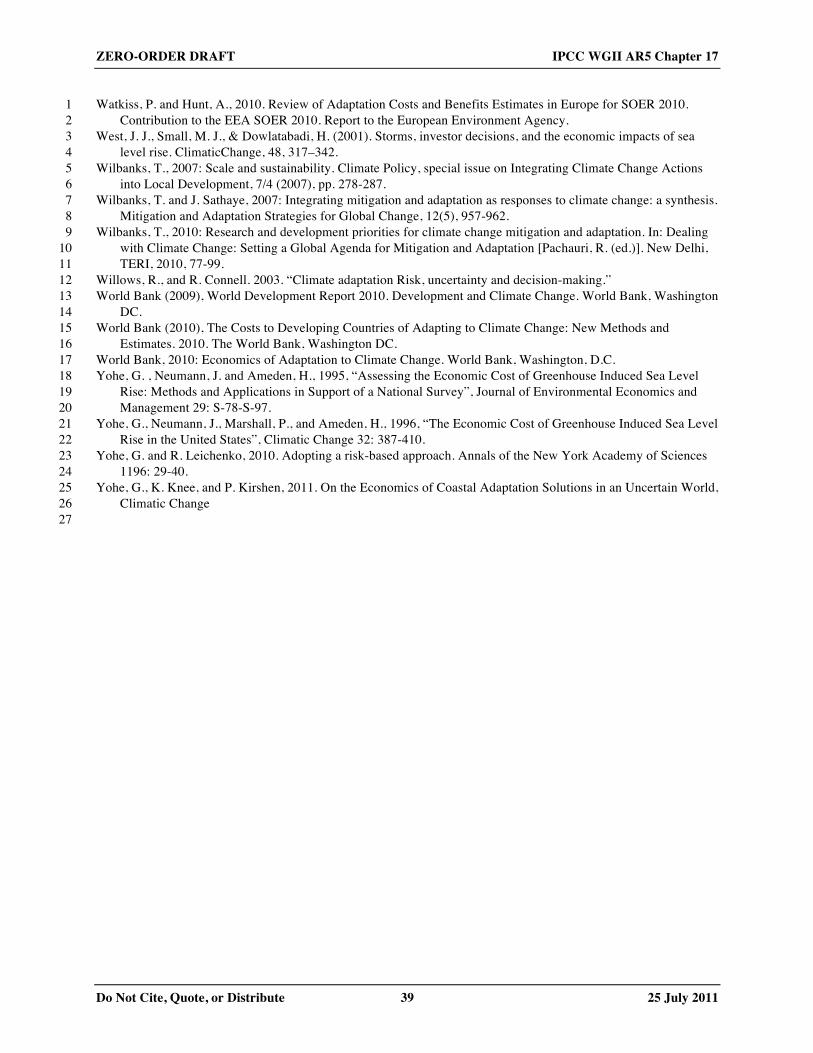


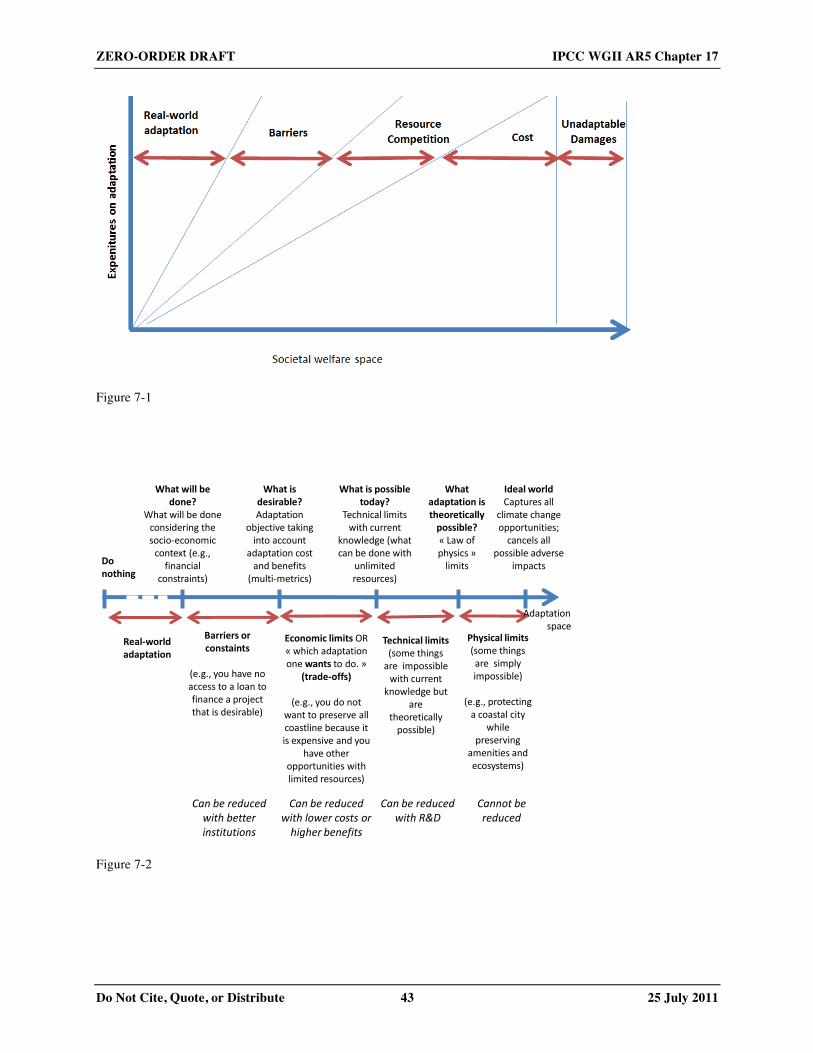


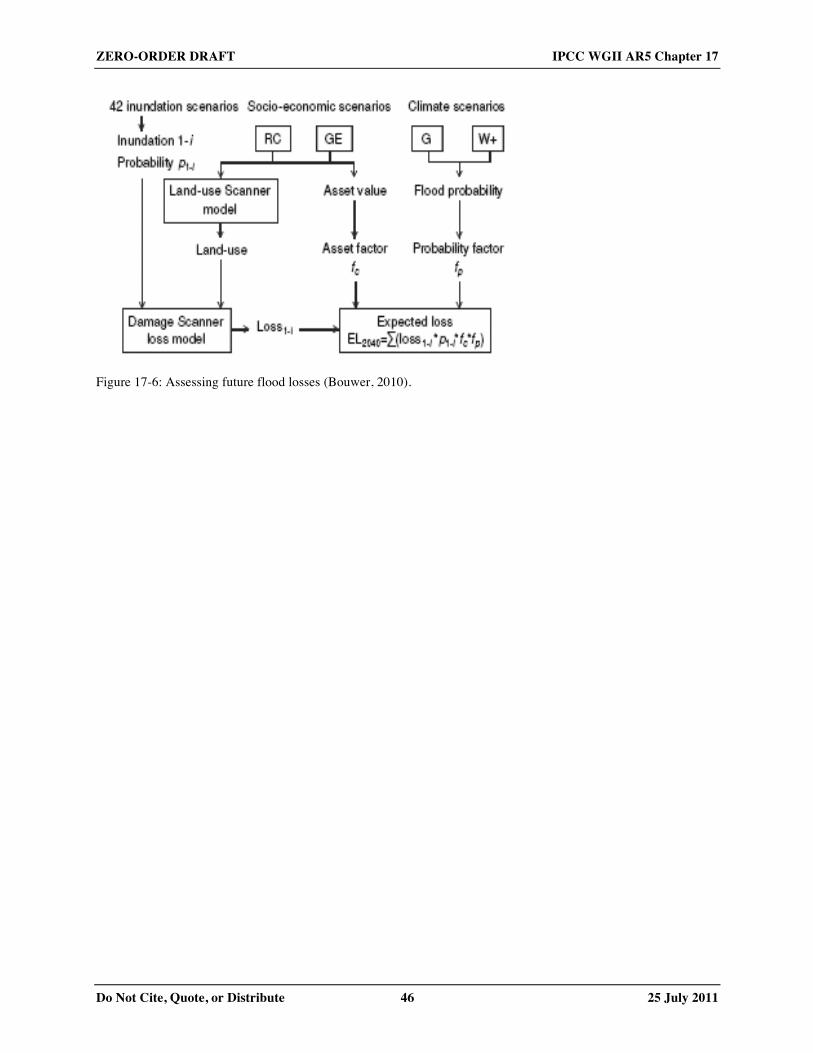


![WGIIAR5-Chap27 SOD[DJD] · Title: WGIIAR5-Chap27_SOD[DJD] Author: David Dokken Subject: WGII AR5 Second-Order Draft Keywords "climate change, impacts, adaptation, vulnerability"](https://static.documents.pub/doc/80x56/5f90b3b00d01d61bb605ecaf/wgiiar5-chap27-soddjd-title-wgiiar5-chap27soddjd-author-david-dokken-subject.jpg)


