Basinal restriction, black shales, Re-Os dating, and the Early Toarcian (Jurassic) oceanic anoxic event J. M. McArthur, 1 T. J. Algeo, 2 B. van de Schootbrugge, 3 Q. Li, 1 and R. J. Howarth 1 Received 8 February 2008; revised 20 July 2008; accepted 17 September 2008; published 24 December 2008. [1] Profiles of Mo/total organic carbon (TOC) through the Lower Toarcian black shales of the Cleveland Basin, Yorkshire, United Kingdom, and the Posidonia shale of Germany and Switzerland reveal water mass restriction during the interval from late tenuicostatum Zone times to early bifrons Zone times, times which include that of the putative Early Toarcian oceanic anoxic event. The degree of restriction is revealed by crossplots of Mo and TOC concentrations for the Cleveland Basin, which define two linear arrays with regression slopes (ppm/%) of 0.5 and 17. The slope of 0.5 applies to sediment from the upper semicelatum and exaratum Subzones. This value, which is one tenth of that for modern sediments from the Black Sea (Mo/TOC regression slope 4.5), reveals that water mass restriction during this interval was around 10 times more severe than in the modern Black Sea; the renewal frequency of the water mass was between 4 and 40 ka. The Mo/TOC regression slope of 17 applies to the overlying falciferum and commune subzones: the value shows that restriction in this interval was less severe and that the renewal frequency of the water mass was between 10 and 130 years. The more restricted of the two intervals has been termed the Early Toarcian oceanic anoxic event but is shown to be an event caused by basin restriction local to NW Europe. Crossplots of Re, Os, and Mo against TOC show similar trends of increasing element concentration with increase in TOC but with differing slopes. Together with modeling of 187 Os/ 188 Os and d 98 Mo, the element/TOC trends show that drawdown of Re, Os, and Mo was essentially complete during upper semicelatum and exaratum Subzone times (Mo/TOC regression slope of 0.5). Drawdown sensitized the restricted water mass to isotopic change forced by freshwater mixing so that continental inputs of Re, Os, and Mo, via a low-salinity surface layer, created isotopic excursions of up to 1.3% in d 98 Mo and up to 0.6% for 187 Os/ 188 Os. Restriction thereby compromises attempts to date Toarcian black shales, and possibly all black shales, using Re-Os chronology and introduces a confounding influence in the attempts to use d 98 Mo and initial 187 Os/ 188 Os for palaeo-oceanographic interpretation. Citation: McArthur, J. M., T. J. Algeo, B. van de Schootbrugge, Q. Li, and R. J. Howarth (2008), Basinal restriction, black shales, Re-Os dating, and the Early Toarcian (Jurassic) oceanic anoxic event, Paleoceanography , 23, PA4217, doi:10.1029/2008PA001607. 1. Introduction [2] It is commonly held that Early Toarcian time was one of climatic upheaval and the deposition of organic-rich sediment worldwide [e.g., Pearce et al., 2008, and refer- ences therein]. The period of organic-rich deposition is often termed the Early Toarcian oceanic anoxic event (OAE) [Jenkyns, 1988]. A negative excursion in d 13 C (org) through the organic-rich interval in Europe (mostly the exaratum Subzone) is taken to reflect the effects of global, synchronous, black shale deposition, without synchroneity being demonstrated. Indeed, the epitome of correlative methods, ammonite biostratigraphy, may be rejected in pursuit of chemostratigraphic synchroneity, despite evi- dence that the onset of Toarcian black shale deposition in NW Europe was diachronous biostratigraphically [Wignall et al., 2005]. [3] Interpretations that invoke whole-Earth catastrophes as the driving force for black shale deposition in the Early Toarcian (and, by implication, at other times) necessarily require a whole-ocean response to the driving force. Most of the data used to underpin these interpretations for the Early Toarcian derive from black shales (in a broad sense hereinafter; the term is seldom defined) of NW Europe (Figure 1). The data are often force fitted to hypotheses invoking catastrophe, rather than being used to critically test them, and contrary data and interpretations, such as those of Wignall et al. [2005] and van de Schootbrugge et al. [2005], are sometimes ignored. [4] Other palaeoenvironmental interpretations of European black shales hold that they formed in response to water mass restriction in, for example, silled basins, in which anoxic or euxinic bottom water was separated by a pycnocline from a surface water mass of low salinity that isolated the underlying water from atmospheric oxygen PALEOCEANOGRAPHY, VOL. 23, PA4217, doi:10.1029/2008PA001607, 2008 Click Here for Full Articl e 1 Department of Earth and Planetary Sciences, University College London, London, UK. 2 Department of Geology, University of Cincinnati, Cincinnati, Ohio, USA. 3 Institute of Geosciences, Goethe University Frankfurt, Frankfurt am Main, Germany. Copyright 2008 by the American Geophysical Union. 0883-8305/08/2008PA001607$12.00 PA4217 1 of 22
Transcript
Basinal restriction, black shales, Re-Os dating,
and the Early Toarcian (Jurassic)
oceanic anoxic event
J. M. McArthur,1 T. J. Algeo,2 B. van de Schootbrugge,3 Q. Li,1 and R. J. Howarth1
Received 8 February 2008; revised 20 July 2008; accepted 17 September 2008; published 24 December 2008.
[1] Profiles of Mo/total organic carbon (TOC) through the Lower Toarcian black shales of the Cleveland Basin,Yorkshire, United Kingdom, and the Posidonia shale of Germany and Switzerland reveal water mass restrictionduring the interval from late tenuicostatum Zone times to early bifrons Zone times, times which include that ofthe putative Early Toarcian oceanic anoxic event. The degree of restriction is revealed by crossplots of Mo andTOC concentrations for the Cleveland Basin, which define two linear arrays with regression slopes (ppm/%) of0.5 and 17. The slope of 0.5 applies to sediment from the upper semicelatum and exaratum Subzones. Thisvalue, which is one tenth of that for modern sediments from the Black Sea (Mo/TOC regression slope 4.5),reveals that water mass restriction during this interval was around 10 times more severe than in the modernBlack Sea; the renewal frequency of the water mass was between 4 and 40 ka. The Mo/TOC regression slope of17 applies to the overlying falciferum and commune subzones: the value shows that restriction in this intervalwas less severe and that the renewal frequency of the water mass was between 10 and 130 years. The morerestricted of the two intervals has been termed the Early Toarcian oceanic anoxic event but is shown to be anevent caused by basin restriction local to NW Europe. Crossplots of Re, Os, and Mo against TOC show similartrends of increasing element concentration with increase in TOC but with differing slopes. Together withmodeling of 187Os/188Os and d98Mo, the element/TOC trends show that drawdown of Re, Os, and Mo wasessentially complete during upper semicelatum and exaratum Subzone times (Mo/TOC regression slope of 0.5).Drawdown sensitized the restricted water mass to isotopic change forced by freshwater mixing so thatcontinental inputs of Re, Os, and Mo, via a low-salinity surface layer, created isotopic excursions of up to 1.3%in d98Mo and up to 0.6% for 187Os/188Os. Restriction thereby compromises attempts to date Toarcian blackshales, and possibly all black shales, using Re-Os chronology and introduces a confounding influence in theattempts to use d98Mo and initial 187Os/188Os for palaeo-oceanographic interpretation.
Citation: McArthur, J. M., T. J. Algeo, B. van de Schootbrugge, Q. Li, and R. J. Howarth (2008), Basinal restriction, black shales,
Re-Os dating, and the Early Toarcian (Jurassic) oceanic anoxic event, Paleoceanography, 23, PA4217, doi:10.1029/2008PA001607.
1. Introduction
[2] It is commonly held that Early Toarcian time was oneof climatic upheaval and the deposition of organic-richsediment worldwide [e.g., Pearce et al., 2008, and refer-ences therein]. The period of organic-rich deposition isoften termed the Early Toarcian oceanic anoxic event(OAE) [Jenkyns, 1988]. A negative excursion in d13C(org)
through the organic-rich interval in Europe (mostly theexaratum Subzone) is taken to reflect the effects of global,synchronous, black shale deposition, without synchroneitybeing demonstrated. Indeed, the epitome of correlativemethods, ammonite biostratigraphy, may be rejected in
pursuit of chemostratigraphic synchroneity, despite evi-dence that the onset of Toarcian black shale deposition inNW Europe was diachronous biostratigraphically [Wignallet al., 2005].[3] Interpretations that invoke whole-Earth catastrophes
as the driving force for black shale deposition in the EarlyToarcian (and, by implication, at other times) necessarilyrequire a whole-ocean response to the driving force. Mostof the data used to underpin these interpretations for theEarly Toarcian derive from black shales (in a broad sensehereinafter; the term is seldom defined) of NW Europe(Figure 1). The data are often force fitted to hypothesesinvoking catastrophe, rather than being used to critically testthem, and contrary data and interpretations, such as those ofWignall et al. [2005] and van de Schootbrugge et al. [2005],are sometimes ignored.[4] Other palaeoenvironmental interpretations of European
black shales hold that they formed in response to watermass restriction in, for example, silled basins, in whichanoxic or euxinic bottom water was separated by apycnocline from a surface water mass of low salinity thatisolated the underlying water from atmospheric oxygen
[Kuspert, 1982; Sælen et al., 1996, 1998, 2000; Rohl et al.,2001; Schmid-Rohl et al., 2002; Schmid-Rohl and Rohl,2003; Schwark and Frimmel, 2004; Frimmel et al., 2004;van de Schootbrugge et al., 2005]. These models invokelocal processes, such as basin restriction via salinitystratification, as the driving force for deposition of theseshales: their formation is thus detached from global events.The models account for all phenomena associated with thedeposition of Toarcian black shales, and do so withoutinvoking global drivers.[5] It is possible to envisage mixed scenarios, in which a
combination of local and global events operated together tocause widespread, global deposition of black shales inToarcian times; for example, reduced levels of atmosphericO2 might have reinforced local factors to precipitate theonset of diachronous anoxia in semienclosed basins that hada spectrum of sensitivities to an anoxic-inducing tippingpoint. But any scenario involving global events assumesthat the deposition of organic-rich sediments was indeedwidespread (and synchronous) in Early Toarcian times and,implicitly, that they constituted an unusual proportion ofToarcian sediments. Such assumptions are often preferredover objective data. Organic-rich (i.e., black) shales certainlyappear from literature sources to be common in theToarcian, but it is not clear whether this is because theyhave been reported on assiduously because of their intrinsicinterest, or because they really do represent a high propor-tion of all Toarcian strata, or because the definition of blackshale is stretch beyond breaking point. There is certainlysome of the latter: documenting shales as black shales whenmore than half of those reported have less than 2% totalorganic carbon (TOC) [Jenkyns, 1988, Table 1] does notclarify discussion. Correlating organic-rich units to theputative OAE (exaratum Subzone) of Yorkshire becausethey have a d13C(org) of �31% (Alaskan samples ofJenkyns [1988]) may have been acceptable when formulat-ing an interesting hypothesis, but requires revision in thelight of negative excursions in d13C now found at manystratigraphic boundaries.[6] Nevertheless, some of the organic-rich shales depos-
ited across NW Europe in Toarcian times contain more than5% of TOC (i.e., are true black shales) [Neuendorf et al.,2005, p. 72]:
A black shale is a dark, thinly laminated carbonaceous shale, excep-tionally rich in organic matter (5% or more carbon content) and sulfide(esp. iron sulfide, usually pyrite), and more commonly containingunusual concentrations of certain trace elements (U, V, Cu, Ni).
According to Kearey [2001, p. 30], ‘‘A black shale is ablack/dark grey mudstone rich in organic carbon (>5% byweight) generally formed in anoxic marine bottom waters.’’They occur widely across NW Europe, and are dated toEarly Toarcian time, although their onset and decline arediachronous [Wignall et al., 2005]. Understanding how theyformed is important to interpreting depositional environ-ments of other black shales (do they all form as a result ofbasin restriction?) for which data may be less abundant andgeological interpretation more difficult. We thereforeaddress the question as to whether environmental signalsin European organic-rich sediments reflect regional or
global drivers. We do so using profiles of environmentalproxies through Lower Toarcian sediments of NW Europe,especially the relation of Mo to TOC, and by isotopicmodeling of d98Mo and initial 187Os/188Os.
2. Working Model
[7] Molybdenum is removed from euxinic waters byreduction to the thiomolybdate complexes (MoOxS4-x
2�) inthe presence of free H2S and subsequent sequestration ineither sedimenting organic matter, sedimenting pyriteformed in the water column, or both [Helz et al., 1996;Erickson and Helz, 2000; Vorlicek and Helz, 2002;Tribovillard et al., 2004a, 2006, 2008]. Because of thisremoval, the renewal time i.e., degree of restriction, of thesubpycnoclinal water mass in modern, euxinic, marinebasins, can be estimated from the slope of the regressionline between Mo and TOC (rsMo/TOC hereinafter, todistinguish it from raw Mo/TOC ratios) in a crossplot ofTOC against Mo in sediments [Algeo and Lyons, 2006].The method works only where euxinic conditions exist(ed)both in the sediment and the overlying water column. Suchwater column euxinia is well documented for the EarlyToarcian seas of northwestern Europe beneath which blackshales (in a strict sense) are deposited (see section 6.1).[8] The rsMo/TOC value of a sediment reflects the
balance of fluxes into and out of a restricted parcel ofoverlying seawater from which the nonclastic componentof the sedimentary Mo is derived; i.e., the frequency ofdeepwater renewal [Algeo and Lyons, 2006]. Molybdenumconcentrations in euxinic bodies of seawater decline if theremoval rate of Mo into underlying sediments exceeds therate of replenishment of Mo to the water column; undersuch conditions, the Mo/TOC of depositing sedimentdeclines as the Mo reservoir in solution is drawn down.Complete isolation of a water body leads to total drawdownof Mo and, thereafter, the accumulation of organic-richsediments with very low rsMo/TOC (<4). Conversely,under conditions of seasonal euxinia that is yearly destroyedby seasonal overturn of the water mass, Mo is removed tothe sediment from an annually replenished store in the watercolumn, so rsMo/TOC is high in sediments depositedunder such a regime e.g., sediments of Saanich Inlet, wherersMo/TOC is around 45. Thus, in modern settings, values ofrsMo/TOC are low in very restricted basins and increase toa maximum of around 45 as restriction decreases to beseasonal i.e., the frequency of deepwater renewal increases.This maximum value of �45 presumably reflects theconcentration of Mo in modern seawater (105 nM) [Collier,1985; Morford and Emerson, 1999]; a different maximumrsMo/TOC would apply had seawater a different Moconcentration, as it may have had in past times. If renewalbecomes too frequent, i.e., the environment too open,rsMo/TOC decreases to low values as open marine condi-tions are reestablished and euxinia retreats into the sedimentsor disappears [Algeo and Lyons, 2006], thereby removing theprimary source of Mo, which is euxinic seawater.[9] The range of rsMo/TOC found today is from 4.5 ± 1
in the Black Sea (severe restriction and a body of euxinicwater 2000 m thick), through 9 ± 2 for Framvaren Fjord,
PA4217 MCARTHUR ET AL.: TOARCIAN BLACK SHALES AND BASIN RESTRICTION
2 of 22
PA4217
25 ± 2 for the Cariaco Basin, to 45 ± 5 for Saanich Inlet(seasonal euxinia in a water body � 100 m thick). A specialcase occurs on the Namibian Shelf, where rsMo/TOC isaround 6 ± 3. The Namibian Shelf is not hydrographicallyrestricted. Accumulation of Mo above clastic backgroundconcentrations (<5 ppm Mo) occurs there, presumably bydiffusion of Mo into sediments, but the degree of enrichmentis limited by the fact that euxinic conditions rarely occurabove the sediment-water interface because of the hydro-graphically unrestricted nature of the environment: deep andbottom water typically contain up to 22 mM of dissolvedoxygen. As a consequence, the opportunity for sequestrationof Mo from large volumes of euxinic seawater is rarelypresent and rsMo/TOC is low [Algeo and Lyons, 2006].[10] The Namibian example demonstrates a subtlety of
the model: for different reasons, the accumulation of Mo ismodest, and rsMo/TOC is low, both in severely restrictedeuxinic basins, and in open-ocean environments where
redox conditions in the water column are oxic to suboxicand euxinic conditions exist in the underlying sediments[Algeo and Lyons, 2006]. When examining premodernblack shales, it is necessary to use criteria other thanMo/TOC or rsMo/TOC to establish which end-member isdealt with. For the Toarcian sediments considered here, awide range of reasons that we document hereinafter showthat the environment was not open ocean but was restricted,and was euxinic because of that water mass restriction.[11] Our work here on Toarcian events also reinterprets
the d98Mo from Pearce et al. [2008]. Mo in seawater has ad98Mo of zero; that incorporated into oxic sediments,particularly Mn oxides, has a d98Mo around �3%; thatincorporated into euxinic sediments is unfractionated be-cause removal from seawater is quantitative. The d98Mo ofseawater sequestered into euxinic shales is therefore hy-pothesized to reflect the d98Mo of seawater, and variationsin that d98Mo with stratigraphic level through a black shalesection is assumed to reflect a changing balance of seques-tration globally into oxic and euxinic sediments. In reality,the controls on d98Mo are poorly known, and caution isneeded in applying this palaeoproxy, as we shall show later,a need for caution emphasized by Nagler et al. [2005],Poulson et al. [2006] and Reitz et al. [2007].
3. Geological Setting
[12] Upper Pliensbachian and Lower Toarcian sedimen-tary rocks of the Cleveland Basin, Yorkshire coast, UnitedKingdom, are well exposed in coastal sections (Figure 1),have been zoned with ammonites, and been subdividedbiostratigraphically and lithologically (Figure 2) [Howarth,1955, 1962, 1973; Powell, 1984; Howard, 1985]. TheHarpoceras falciferum zone is now the H. serpentinumZone, and the commune Subzone of the bifrons Zone isnow the H. laticosta Subzone [Page, 2004], but older namesare retained here to provide a link to the primary literatureof most relevance (Howarth [1955] and subsequentauthors). As zero datum, we take the base of the Toarcianas the base of the tenuicostatum Zone [Howarth, 1973](Figure 2).[13] The sediments analyzed are part of the Whitby
Mudstone Formation. The lithostratigraphic units are, inascending order, the Grey Shale Member (beds 1 to 32inclusive, Figure 2) between 0.66 and 14.22 m above datum(mad); the Mulgrave Shale Member (beds 33 to 48) between14.22 to 31.0 mad, and the Alum Shale Member above that(beds 49 to 72). The top of the Grey Shale Member, and thebase of the falciferum Zone (exaratum Subzone) was placedat the base of bed 33 by Howarth [1973]. Correlationbetween sections of Lower Toarcian strata on the Yorkshirecoast is possible to decimeter level over kilometers becauseof the numerous distinctive marker beds of (mostly) car-bonate and (rare) sideritic concretions (e.g., beds 46, 50[Howarth, 1955, 1962, 1973]).[14] Much of the Lower Toarcian sediment contains
calcite, either cryptically as nannofossil debris and dis-persed diagenetic cement, or as discrete carbonate concre-tions. The concretions typically occur in discrete horizons.Upsection from the exaratum Subzone, concretion horizons
Figure 1. Extent of organic-rich sediment defined looselyin the Lower Toarcian of northwestern Europe, 51�500N,6�150E. The top map shows location of sampling sites inYorkshire, United Kingdom: Witby (54�290N, 0�370W).
PA4217 MCARTHUR ET AL.: TOARCIAN BLACK SHALES AND BASIN RESTRICTION
3 of 22
PA4217
Figure 2. Biostratigraphy, outline lithostratigraphy, and profile of concentrations TOC, Mo, Mo/TOC, TS, and DOP-T(this work); d13C and 87Sr/86Sr of belemnite calcite (data of McArthur et al. [2000]); and d13C of the organic matter(d13C(org)) (data from Cohen et al. [2004]), through the Upper Pliensbachian and Lower Toarcian strata of Yorkshire,United Kingdom. In the lithological crossplot, bed numbers are from Howarth [1955, 1962, 1973], and the thick horizontallines represent the more prominent carbonate concretions and cemented horizons. The four Sulfur Bands are numbered onthe TS profile (see text). The negative d13C(org) excursion in the upper semicelatum Subzone and the exaratum Subzonewas around 900 ka in duration [Suan et al., 2008].
PA4217
MCARTHUR
ETAL.:TOARCIA
NBLACK
SHALESAND
BASIN
RESTRICTIO
N
4of22
PA4217
are less common and the sediments comprise monotonous,dark gray, mudstones. Downsection from the exaratumSubzone, toward the Pliensbachian/Toarcian boundary, inthe interval commonly interpreted as a sea level lowstand[Hallam, 1997;Wignall et al., 2005], concretionary horizonsare more common and more sideritic, while the interveningshales become less rich in organic matter and greyer in color.The base of a pyritic shale that is 15 cm thick, coincides withthe base of the Toarcian and three other decimeter-thick,pyritic units occur at 1.2, 5.1, and 8.2 m above the base ofthe grey shales (Figure 2 and Table 1) (R. J. Newton,personal communication, 2006). The four pyritic units aretermed here collectively the Sulfur Band and the second,third, and fourth Sulfur Bands, from the base upward.
4. Methods
4.1. Sampling
[15] Samples were from exposures at Hawsker Bottoms,Staithes, Port Mulgrave, Saltwick Bay, and Kettleness, onthe coast of Yorkshire within a few kilometers of Whitby(Figure 1) [Howarth, 1962]. The stratigraphic levels ofsamples collected from Pliensbachian strata (below 0 mad)are referred to Hawsker Bottom [Howarth, 1955]; levelsfrom 0 to +24 mad are referred to the section at PortMulgrave [Howarth, 1973]. Levels above 24 mad (upperpart of bed 41) relate to the section at Saltwick Bay[Howarth, 1962].[16] Samples were collected from beneath a surface layer
of weathered paper shale some 5 cm deep, at a depth wherethe rocks were homogenous, compact, and without struc-ture. That the samples are well preserved is attested to bytheir content of percentage amounts of pyrite, both asmicroscopic disseminated framboids and as uncommonmillimeter size cubic pyrite.
4.2. Chemical Analysis
[17] Analysis for Mo, and Fe was done by X-ray fluores-cence (XRF) on pressed-powder pellets at the University ofCincinnati, and by inductively coupled plasma emissionspectroscopy (ICP-AES) (Mo, Fe) and inductively coupledplasma mass spectrometry (ICP-MS) (Mo) at UniversityCollege London (UCL) after dissolution of the samples inmixed strong acids. Analysis for total sulfur (TS), totalcarbon (TC), and total organic carbon (TOC) was done usingan Eltra C/S Analyzer (at the University of Cincinnati) or aLeco C/S Analyzer (at University College London). ForTOC analysis, samples were decarbonated with dilute (10%vol/vol) hydrochloric acid. The results of the chemical andisotopic analyses are given in Table 1. The uncertainty ofthe analyses lie within the size of the symbols used to plotconcentrations on our figures. We calculated degree ofpyritization based on total Fe (DOP-T) as 0.95TS/(Total Fe)to allow for organic S. For the exaratum Subzone, wesupplemented our data with the Mo, TOC, d98Mo, Re,and TOC data of Pearce et al. [2008] who sampled at ahigher density than we did in that interval. The methods ofanalysis used by Pearce et al. [2008] are documented intheir paper and its Supplementary Information.[18] Data for northernGermany derive from theWickensen
and Hildesheim cores [Jochum, 1993; Brumsack, 1988]: the
biostratigraphy of theWickensen core is given by Littke et al.[1991] and that for the Hildesheim core by Loh et al. [1986].Data for the Mogglingen core in southern Germany are fromBrumsack [1988], whose biostratigraphic assignments werefrom Riegraf et al. [1984]. The TOC data from the Weiachcore from Switzerland were reported by Feist-Burkhardt[1992] and the Mo data are unpublished (A. Quigg, RutgersUniversity, personal communication, 2008).[19] Diagenetic carbonate is present through much of the
section in the Cleveland Basin (Table 1) as calcite or, at rarelevels, subordinate siderite (beds 46, 50; Table 1). Our dataprofiles with stratigraphic level (Figures 2 and 3) are notshown on a carbonate-free basis because doing so has anegligible effect on their interpretation. Recalculation to acarbonate-free basis did clarify the Mo-TOC crossplot(Figure 5 only; see section 5.2), which is therefore shownon a carbonate-free basis.
4.3. Timescale
[20] In order to estimate the duration of units discussedhere, we use the timescale of Suan et al. [2008], coupledwith the Sr isotope stratigraphy of McArthur et al. [2000](Figure 2). The cyclostratigraphic analysis by Suan et al.[2008] assigned a duration of �900 ka (from their detaileddiscussion, it is 930 ± 40 ka) to the well-defined negativeisotopic excursion in d13C(org) seen in the exaratum Subzoneand the uppermost few meters of the underlying semicelatumSubzone (Figure 2). This excursion is often termed the EarlyToarcian CIE. These authors also estimated that the depo-sition of the tenuicostatum and falciferum Zones (theLower Toarcian) occupied 2.05 ± 0.15 Ma, a duration closeto that of 2.3 Ma estimated independently by Ogg [2004,Figure 18.1 and Table 18.2], taking the base of the H.variabilis Zone as the base of the Upper Toarcian. Theduration of the Early Toarcian derived by McArthur et al.[2000] from an earlier timescale was 2.17 Ma.[21] That three linear regressions describe the 87Sr/86Sr
profile of belemnite calcite through all the Toarcian strata ofYorkshire [McArthur et al., 2000, Figure 2] is good evi-dence that sedimentation rates were different within eachregression interval. The linearity and slope of each regres-sion shows that exaratum Subzone and overlying 30 cm ofthe falciferum Subzone of the Toarcian are stratigraphicallycondensed by a factor of 7 relative to underlying strata andby a factor of 12 relative to overlying strata (Figure 2)[McArthur et al., 2000; McArthur and Wignall, 2007). Therates of change of 87Sr/86Sr with stratigraphic level (seeMcArthur et al. [2007] for a graphic explanation), and anEarly Toarcian duration of 2.17 Ma, were used to determinezonal and subzonal durations [McArthur et al., 2000] andthese durations, and the zonal and subzonal thicknesses,have been used to derive sediment accumulation rates andso approximate durations for discrete packages of sediment,such as the decimeter-thick Sulfur Bands. Such durationsare tentative, and systematic uncertainty of around ±10% inthe durations of the events we calculate arises simply fromthe range of the Lower Toarcian durations noted above (1.9to 2.3 Ma). Sedimentation rate changes that occurred at ascale irresolvable with 87Sr/86Sr must also introduce un-quantifiable uncertainty. Nevertheless, we speculate that the
PA4217 MCARTHUR ET AL.: TOARCIAN BLACK SHALES AND BASIN RESTRICTION
5 of 22
PA4217
Table 1. Elemental Compositions, Pyrite-Fe, and DOP-T in Upper Pliensbachian and Lower Toarcian Sediments From the Coastal
Sections of Yorkshire, United Kingdoma
StageBed
NumberSampleLocality
StratigraphicLevel (m) TC (%) TOC (%) TS (%) Mo (ppm) Fe (%) Pyrite Fe (%) DOP-T
PA4217 MCARTHUR ET AL.: TOARCIAN BLACK SHALES AND BASIN RESTRICTION
6 of 22
PA4217
event durations we calculate are unlikely to be in error bymore than a factor of three, an error that has no impact onour conclusions.
5. Results
5.1. Stratigraphic Profiles of Environmental Proxies
[22] In Figure 2 we profile through the composite sectiondata for TOC, Mo, Mo/TOC (ppm/%; note, not rsMo/TOC),
TS, DOP-T, a proxy for degree of pyritization, the d13C oforganic matter (d13C(org); data of Cohen et al. [2004]), andthe 87Sr/86Sr and d13C of belemnite calcite (d13C(bel)) fromMcArthur et al. [2000]. In Figure 3 we profile through theexaratum Subzone and upper part of the semicelatumSubzone our data for d13C of belemnite calcite, and thedata of Pearce et al. [2008] for Re/Mo, d98Mo, Mo/TOC,d13C(org), Re/TOC, TOC, and initial
187Os/188Os. In Figure 4,
Table 1. (continued)
StageBed
NumberSampleLocality
StratigraphicLevel (m) TC (%) TOC (%) TS (%) Mo (ppm) Fe (%) Pyrite Fe (%) DOP-T
aStratigraphic levels are in meters from the base of the base of the Toarcian (base of the Tenuicostatum Zone) [Howarth, 1973]. Sample numbers: S,Saltwick Bay; St, Staithes; HB, Hawsker Bottom; K, Kettleness; PM, Port Mulgrave. Bed numbers from Howarth [1955, 1962, 1973] are location specificand may repeat.
PA4217 MCARTHUR ET AL.: TOARCIAN BLACK SHALES AND BASIN RESTRICTION
7 of 22
PA4217
we showMo/TOC profiles for the Lower Toarcian Posidoniashale of Germany and Switzerland.[23] Pliensbachian and Toarcian sediments below the
middle of the semicelatum Subzone of the Cleveland Basinhave TOC concentrations less than 2%, excepting for theSulfur Bands (Figure 2) which range from 2.1 to 3.7% TOC.Upward from the mid-semicelatum Subzone of the Toar-cian, concentrations of TOC exceed 3% and increase topeak at 18% in bed 35 of the exaratum Subzone (the whalestones of Howarth [1962]). Above that level, TOC concen-trations decrease abruptly to around 4% and then declineupsection until stabilizing around 2% in the upper falcife-rum subzone. DOP-T values, and TS concentrations, arehigh between the mid-semicelatum Subzone and the mid-falciferum Subzone. For the exaratum Subzone, degree-of-pyritization (DOP) values of 0.84 were reported by Raiswelland Berner [1985] and values between 0.8 and 0.9 reportedby Pearce et al. [2008]. Our values for DOP-T are similar,even though our calculation of DOP-T includes iron thatmay not be diagenetically available.[24] In the Pliensbachian, Mo/TOC is high because TOC is
low; the profile is dominated by detrital Mo and is notdiscussed further. In the Toarcian below the mid-semicelatumSubzone, Mo concentrations are <3 ppm except in theSulfur Bands where concentrations reach between 4 and
21 ppm (Figure 2). Concentrations are � 10 ppm whereTOC is highest in the interval between the mid-semicelatumSubzone and the top of the exaratum Subzone, and are�20 ppm in the lower half of the falciferum Subzone whereTOC is lower. Concentrations decline to be around 3 ppmabove that level, although the lower commune Subzone ismarked by two higher spikes to around 15 ppm which areaccompanied by only small changes in TOC. In the uppersemicelatum Subzone and the exaratum Subzone (the puta-tive OAE in a wider sense), Mo/TOC is exceptionally lowwhile TOC is high (>5%). In the falciferum and communeSubzone, Mo/TOC is high but TOC is only 3–4%. All thepatterns noted here have significance for interpretation ofpalaeoenvironmental conditions and are discussed later.[25] Values of Mo/TOC show sharp changes in several
parts of the profile. The rapidity of the changes can becalculated from sediment thickness, the duration of ammo-nite subzones as deduced from a Sr isotope profile (Figure 2)McArthur et al. [2000] and the cyclostratigraphic timescaleof Suan et al. [2008]. Working up from the base of theToarcian, four examples illustrate this. First, the spikes ofMo/TOC in the Sulfur Bands occur over stratigraphicintervals of 12–22 cm, which equate to durations of 5–10 ka. Second, four excursions in Mo/TOC within theupper semicelatum and exaratum Szs. (A–D in Figure 3)
Figure 3. Lithology, biostratigraphy, and profile of concentrations Re/Mo, Mo/TOC, d98Mo, d13C(org),Re/TOC, TOC, and d13C of belemnite calcite through the upper semicelatum Subzone and exaratumSubzone of Yorkshire. Data are from Pearce et al. [2008] except d13C of belemnite calcite, which is fromsources listed on the plot.
PA4217 MCARTHUR ET AL.: TOARCIAN BLACK SHALES AND BASIN RESTRICTION
8 of 22
PA4217
have durations of around <9 ka. Third, in the base of thefalciferum Subzone, Mo/TOC values increases sharply(Figure 2) over 57 cm of sediment that represents around10 ka; sampling at this level was not dense, so the signal ofchange may be aliased and, in reality, be sharper. Finally,across 3.7 m of strata bracketing, and including, bed 48 (theOvatum Band of Howarth [1962]), values of Mo/TOC risefrom <2, peak at 4.7, and then decline to 1.7; the thicknessrepresents a time of around 65 ka (Figure 2). The keyelement of these durations is that they are all small fractionsof the residence time of Mo in the modern ocean (800 ka[Emerson and Huested, 1991; Colodner et al., 1995]) and,in the absence of contrary evidence, presumably also in theToarcian ocean.[26] A subdued positive excursion in both d13C(org) and
d13C(bel) occupies the Toarcian tenuicostatum Zone(Figure 2). From the mid-semicelatum Subzone, values ofd13C(org) decline steeply to around �32% before recoveringto a stable baseline of around �27% in the upper exaratumSubzone. The carbon isotopic composition of belemnitecalcite does not show this negative excursion, but doesshow a positive isotopic excursion (max +6.5%) in theupper exaratum Subzone and the lower falciferum Subzone(Figure 2). Thus, profiles of d13C(org) and d13C(bel) aredecoupled.[27] Trends in environmental proxies through the exar-
atum Subzone are shown in more detail in Figure 3, wheredata derive from four literature sources for d13C of belem-nite calcite, and the data of Pearce et al. [2008] for mostother parameters. The four excursions in Mo/TOC, Re/TOCand TOC are accompanied by the larger of many sharp
changes in d13C(org). The d13C data is denser than data forother palaeoproxies, which may therefore be aliased. Com-parison of the trends in d13C(org) and d13C of belemnitecalcite in Figure 3 shows more clearly than in Figure 2 thedifferent trends in the isotopic profiles of calcite and organicmatter. There is a broad negative excursion in d13C oforganic matter through the exaratum Subzone but belemnitecalcite shows no such excursion.[28] Our Mo/TOC profiles for Germany and Switzerland
differ between localities (Figure 4). At Wickensen, TOCremains above 10% over most of the Toarcian; at Dottern-hausen [Schouten et al., 2000; Rohl et al., 2001] it is above6% through most of the Toarcian. At Mogglingen andWeiach, TOC frequently dips below 5%. Profiles of Mo/TOC also differ between localities. The profile at Hildesheimbears some resemblance to the profile in Yorkshire while atWeiach Mo/TOC remains <5 through the entire interval inwhich black shale (loosely defined) was deposited.
5.2. Crossplots of Environmental Proxies
[29] Samples from levels below the mid-semicelatumSubzone have low concentrations of TOC. Their Moconcentration represents clastic contributions and they aretherefore not considered further. For the remaining samplesfrom Yorkshire, crossplots of Mo-TOC define two dataarrays (Figure 5). Samples from the mid-semicelatum toupper exaratum Szs. (beds 31 to 38) define a regression lineof slope 0.5 (regression A, Figure 5) that intercepts the Moaxis at a concentration of around 2 ppm. Samples fromlevels above bed 38 define a regression line of slope 17(regression B, Figure 5) that intercepts the TOC axis around
Figure 4. Profiles of Mo/TOC through sections of the Posidonia shale in Germany. Data for WickensenMo and TOC are from Jochum [1993], data for Mogglingen and Hildesheim Mo and TOC are fromBrumsack [1988]; data for Weiach Mo are from A. Quigg (personal communication, 2008), and data forWeiach TOC are from Feist-Burkhardt [1992]. Assignment of ammonite biostratigraphy relies on therespective authors. Heights are indicated as meters below drill floor except for Mogglingen.
PA4217 MCARTHUR ET AL.: TOARCIAN BLACK SHALES AND BASIN RESTRICTION
9 of 22
PA4217
a value of 2.0 to 2.5%. Samples from beds 39, 40, and thebasal part of bed 41, fall between these regressions. Asstratigraphic level increases above bed 45, concentrations ofMo and TOC decrease and are mostly <8 ppm Mo and <3%TOC. Nevertheless, the samples still define a remarkablytight regression around the slope of 17 defined by moreMo-rich samples; we comment of this below.
6. Interpretation of the Palaeoproxies
6.1. Euxinia and Aliasing
[30] The model of Algeo and Lyons [2006] works onlywhere euxinic conditions exist(ed) in the water column:such euxinia is well documented for the Lower Toarcianblack shales of NW Europe. The ‘‘degree of pyritization’’(DOP) [Raiswell and Berner, 1985] through both theexaratum Subzone in Yorkshire and the Posidonia shaleof Germany was shown by those authors to be around 0.85,a value attesting to long-term euxinic conditions in bothbasins. Similar values (0.8 to 0.9) for DOP were reportedfor the exaratum Subzone of Yorkshire by Pearce et al.[2008]. Wignall et al. [2005] document anoxia and euxinia
through the upper semicelatum Subzone and lower exara-tum Subzone in Yorkshire on the basis of the size of pyriteframboids, and DOP. Our values of TS exceed 2%, andvalues of DOP-T (Figure 2) exceed 0.5, in the intervalfrom the mid-semicelatum Subzone to the mid-falciferumSubzone. Such values confirm the general euxinic natureof the interval. In the upper falciferum Subzone valuesare less than 0.4, suggesting euxinic conditions no longeraffected the water column, but they recover to between0.4 and 0.5 above that level. Exceptionally low DOP-T isseen at the levels of two thin sideritic mudstones, beds 46and 50.[31] In Germany, Rohl et al. [2001] showed that euxinia
was prevalent throughout deposition of the Posidonia shalefrom the mid-semicelatum Subzone into the upper bifronsZone. Photic zone euxinia was also documented bySchouten et al. [2000] to be present at each of the sevenlevels that were examined through the same stratigraphicinterval, but was shown to be absent at three lower strati-graphic levels. Schwark and Frimmel [2004] broadly con-firmed those findings using a higher sample density.[32] Despite the prevalence of long-term euxinia over a
substantial part of the time represented by the section in theCleveland Basin, the presence of fossil ‘‘event communi-ties’’ at uncommon, discrete, horizons within the sections inYorkshire and the Posidonia shale of Germany [Howarth,1962; Rohl et al., 2001] show that conditions were occa-sionally oxygenic, if only for periods of a few weeks to afew years at a time. The geochemical signal of oxygenationis aliased because sampling has not been undertaken (evenby Pearce et al. [2008] or Rohl et al. [2001]) at a resolutionhigh enough to capture the short periods when euxinia wasinterrupted and life flourished, briefly, in the Toarcian seasof NW Europe. We discuss this below.
6.2. Faunas
[33] The palaeobiology of the Yorkshire sections has beenpresented by Little and Benton [1995], Little [1996], andHarries and Little [1999]. These authors note that organ-isms that inhabited the upper water column suffered littlefrom these extinction events, and that epifaunal bivalveswere also largely unaffected. The last work recognized thelatest Pliensbachian and the earliest Toarcian (tenuicostatumZone) as an interval in which extinction was most pro-nounced at four levels, the last occurring at the end of theinterval (top of bed 32, i.e., top of the Grey Shale Member,Figure 6). During the time of deposition of the upper part ofthe semicelatum Subzone, species diversity and richnessdeclined to low levels and remained low until the lower partof the commune Subzone (bifrons Zone). Above bed 50, inthe commune Subzone, species diversity increased as pop-ulations recovered.[34] While presenting a good synopsis of Early Toarcian
biotas in Yorkshire, the work of Harries and Little [1999,Figure 6] nevertheless aliases the faunal data by joiningadjacent sample points with a line. This disguises the factthat significant parts of the stratigraphic interval betweenthe upper semicelatum Subzone to mid-commune Subzone;that is, the intervals between those levels where faunas wererecorded, are devoid of macrofossils of any type. For the
Figure 5. Crossplot of Mo and TOC concentrations inLower Toarcian sediments of Yorkshire, United Kingdom.Samples from most of the exaratum Subzone and the uppersemicelatum Subzone define regression line A, with a slopeof 0.5 (rsMo/TOC in ppm/%) that represents severe watermass restriction. Samples from the overlying falciferumSubzone and above define regression line B, with a slope of17, that represents moderate water mass restriction. Samplesfrom strata above the falciferum Subzone plot toward thelower end of regression line B and approach background(silicate) values of Mo (around 1–2 ppm) and TOC. A fewsamples with intermediate Mo/TOC represent intermediatestates of restriction (e.g., beds 39 and 40 and the basal partof bed 41). The Sulfur Bands represent four brief periods ofrestriction and pyrite formation in the earliest Toarcian.Note that rsMo/TOC (the slope of the regression linebetween Mo and TOC) is not Mo/TOC, which is the directratio of Mo to TOC in ppm/% and which takes no account ofnonzero axial intercepts of the Mo versus TOC regressions.
PA4217 MCARTHUR ET AL.: TOARCIAN BLACK SHALES AND BASIN RESTRICTION
10 of 22
PA4217
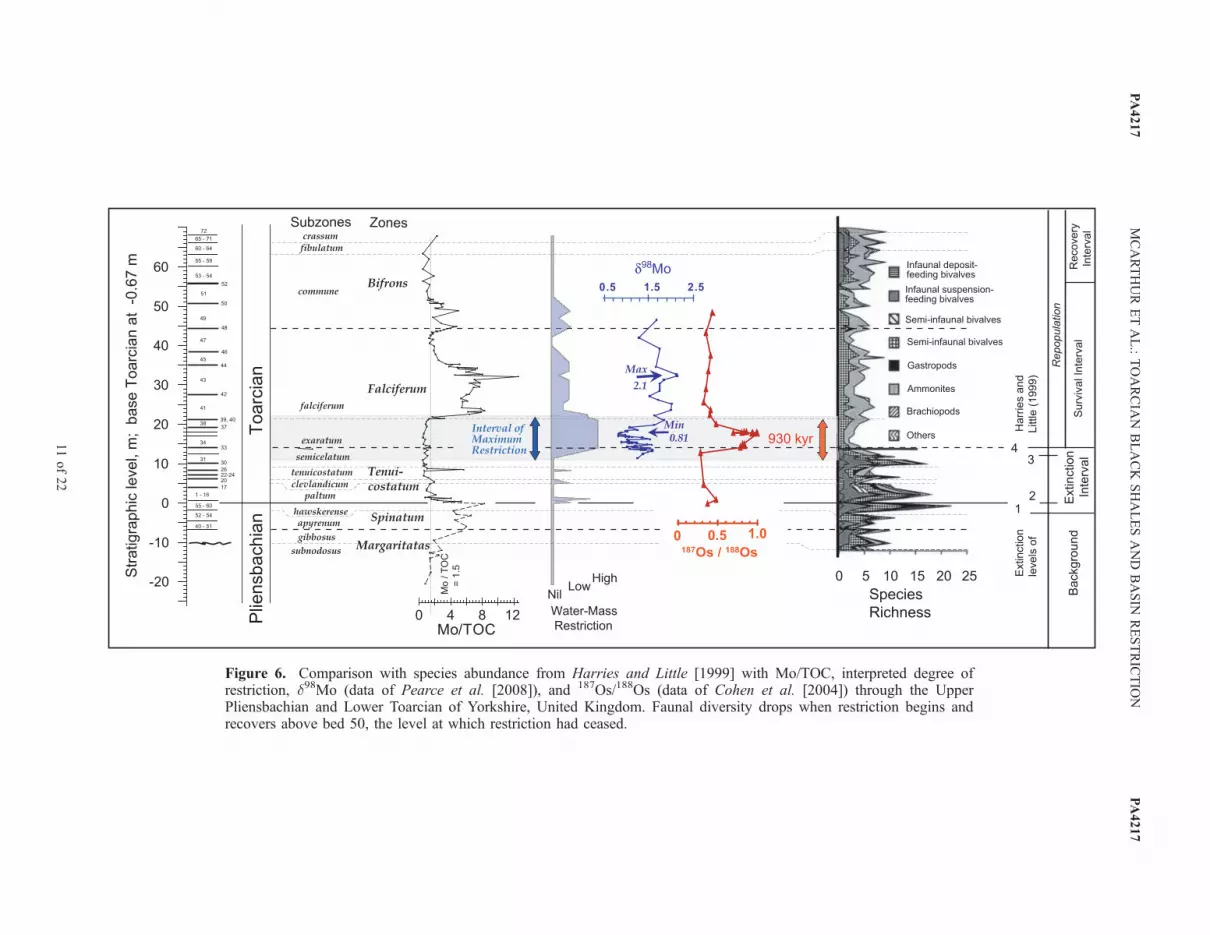
Figure 6. Comparison with species abundance from Harries and Little [1999] with Mo/TOC, interpreted degree ofrestriction, d98Mo (data of Pearce et al. [2008]), and 187Os/188Os (data of Cohen et al. [2004]) through the UpperPliensbachian and Lower Toarcian of Yorkshire, United Kingdom. Faunal diversity drops when restriction begins andrecovers above bed 50, the level at which restriction had ceased.
PA4217
MCARTHUR
ETAL.:TOARCIA
NBLACK
SHALESAND
BASIN
RESTRICTIO
N
11of22
PA4217
Posidonia shale of Germany this point of aliasing was notedby Rohl et al. [2001] and Schmid-Rohl and Rohl [2003].Documenting faunal and geochemical parameters at nearcentimeter-scale resolution through some 12 m of section atDotternhausen in S Germany, they showed that the macro-fossils are present at discrete horizons and represent ‘‘eventcommunities,’’ i.e., opportunistic recolonizations of theseafloor that lasted only a few weeks to a few years [Rohlet al., 2001]. Such periods were rarely captured in geo-chemical parameters, such as C/S crossplots, probablybecause the sampling resolution, although exceptionallyhigh, was still not high enough to do so. From faunalevidence, they noted around 30 such oxygenation events[Rohl et al., 2001, Figure 10] during the German equivalentof the United Kingdom’s exaratum Subzone, with a higherdensity being recorded above that level.[35] The pertinent point about such ‘‘event communities,’’
in which we include the uncommon belemnite horizonswithin the exaratum Subzone of Yorkshire (Figure 2), is thatthey record conditions only during the geologically briefmoments when the fossils were alive [van de Schootbruggeet al., 2005; Wignall et al., 2005]. Their presence inYorkshire and Germany attests to occasional brief periodswhen the general euxinic conditions were briefly interruptedand these periods have an importance far beyond theirduration: into a long-term euxinic geochemical signal theyinterleave a short-term oxic geochemical signal (e.g., d13Cin belemnite calcite). The oxic signals were captured eitherduring the brief periods of normal (open-ocean) conditionsin the Cleveland Basin or, because belemnites were mobile,in the open (oxic) ocean outside the euxinic ClevelandBasin, into which the belemnites occasionally strayed todie [van de Schootbrugge et al., 2005; Wignall et al., 2005].The chemical signatures of belemnites in the ClevelandBasin (or Posidonia shale) do not record the chemicalsignature of the euxinia generally prevalent within it, whichis why they do not show the negative isotopic excursionshown by organic matter and (presumably?) nonmobilephytoplankton trapped in the basin and able to survivewithin the upper oxic interval of the water column.
6.3. Crossplot of Mo Versus TOC for the ClevelandBasin
[36] The Mo versus TOC crossplot (Figure 5) defines twodata trends to which regression lines A and B have beenfitted. Regression A has a slope of 0.5 and applies tosamples collected from the upper half of the semicelatumSubzone and most of the exaratum Subzone (beds 31 to 38).This interval encompasses the putative Early Toarcian OAE,and the local negative excursion in d13C of organic matter(Figure 2). The value of 0.5 is around 10 times less than thatfor Holocene sediments from the Black Sea (rsMo/TOC of4.5 ± 1 [Algeo and Lyons, 2006]). It implies that almostcomplete restriction occurred during this interval, so weterm it the interval of maximum restriction (IMR). Thefrequency of deepwater renewal in a restricted basin scaleslinearly with rsMo/TOC [Algeo and Lyons, 2006], so anrsMo/TOC of 0.5 implies a renewal frequency of deep waterof 5 to 40 ka. Over a period of around 930 ka (Figure 2),renewal therefore occurred between 23 and 186 times. It is
interesting that Rohl et al. [2001] identified around 30 briefevents of oxygenation during the equivalent time period inGermany, and ascribed them to the occurrence of tropicalstorms. The renewal frequency estimated by Rohl et al.[2001] and here is much lower than is implied by the annualflushing model of Schwark and Frimmel [2004] and Frimmelet al. [2004], which, with today’s concentration of marineMo, would give rsMo/TOC around the 45 (cf. Saanich Inlet[Algeo and Lyons, 2006]).[37] The infrequency of renewal implies that the concen-
tration of Mo in the seawater of the basin was drawndown to concentrations well below those currently seenbelow 200 m in the Black Sea, where they are only 2–3%of that in open ocean water [Algeo and Lyons, 2006], so amass balance of Mo is of interest here. For the 10 m ofsediment in the IMR, the mean Mo concentration is5.1 mg/kg (Table 1), a value that equates to 10 mg/cm2,using a sediment density of 2 g/cm2. This amount of Mo iscontained within column of modern seawater (Mo 105 nM)that is 1000 m thick. This figure leaves little room formuch replenishment of Mo during the IMR, were theToarcian sea indeed 1000 m deep, so it implies that theToarcian sea was very much less than 1000 m in depth, orthat scavenging efficiency for Mo was nonlinear anddeclined at low concentrations of Mo in seawater.[38] Within the IRM, sharp, albeit small, excursions in
Re/Mo, Re/TOC, Mo/TOC, d98Mo, and TOC coincide withthe abrupt decreases in d13C(org) (A–D in Figure 3). TheMo/TOC excursions are defined by either one datum (A andD) or two (B and C), where the sampling interval was 3 cm.As the major negative excursion in d13C(org) occupies 10 mof strata from the mid-semicelatum Subzone to the basalfalciferum Subzone (Figure 2), and endured over a period of930 ± 40 ka [Suan et al., 2008], excursions A and D occupied<3 ka, while B and C occupied >3 ka but less than 9 ka. Thesedurations are around one hundredth of the residence timeof Mo in seawater today. Another subtlety of the excursionsis that the middle pair (B, C) move to higher Mo/TOC,Re/TOC, and lower TOC, while the outer pair (A, D) moveto lower Mo/TOC, Re/TOC, and higher TOC. At A and B,the decline in d98Mo is briefly interrupted, while at C andD, the decline in d98Mo is briefly strengthened, althoughthese effects are small.[39] These subtle changes must relate to changes in the
rate of deepwater renewal. The importance of these excur-sions lies in their short duration, which provides goodevidence that they are driven by changes in a reservoir ofsmall size: they are consistent with control by a varyingdegree of restriction and inconsistent with any interpretationof the signals in terms of whole-ocean events, owing to thelarge mass of the ocean. The data defining the excursionsplot on regressions of Mo versus TOC that have slopes of0.4 to around 3.4, confirming that the variations in restric-tion they imply was small. It is not known whether theseexcursions coincide with oxygenic events identifiable by thepresence of event faunas. The low frequency of water massrenewal accords with the faunal observations of only briefintervals of reoxygenation in this interval in Germany (thedensity of faunal event horizons has not been measured inthe Cleveland Basin). Such intervals of oxygenation may
PA4217 MCARTHUR ET AL.: TOARCIAN BLACK SHALES AND BASIN RESTRICTION
12 of 22
PA4217
represent the effects of 10 or 50 ka events, i.e., events ofsuch severity that they occur only at those frequencies, thatbriefly overturned the water column. They are, perhaps, thetropical storms of Rohl et al. [2001].[40] Samples from above the IMR (beds 41 and above)
fall along regression B (Figure 5), which has a slope ofaround 17. For modern sediments, this slope would imply adegree of restriction that is intermediate between that seennow for Framvaren Fjord (rsMo/TOC of 9 ± 2), wherewater mass renewal is around 50 to 130 years, and that seenin the Cariaco Basin (rsMo/TOC of 25 ± 2) where renewaltimes are around 50 to 100 years [Algeo and Lyons, 2006].Restriction above the IMR was therefore less than it was init. Excepting bed 49, both Mo concentrations (<8 ppm) andTOC concentrations (<3 %) are low in most strata abovebed 45, where DOP-T is around 0.4 to 0.5, and TS around2%. The Mo and TOC data nevertheless define a tightcurvilinear regression (Figure 5) that suggests sulfidicsequestration of Mo was still happening. The data suggestthat sediments above bed 45 were sulfidic, but that euxinicconditions had retreated to be close to the sediment-waterinterface in the Cleveland Basin, expanding briefly throughbed 49.[41] We speculate that a small part of the water column
remained euxinic in much of this interval because of twofactors: first, the recovery of faunal diversity did not beginuntil bed 50, in the lower part of the bifrons Zone, a matterwhich attests to the continued inhospitable nature of theenvironment until bifrons zone times. Second, the distribu-tion of data along regression line B in Figure 5 may beinterpreted roughly as reflecting the proportion of the over-lying water column that was euxinic during times of moder-ate restriction. The position of a sample on the regressionmaytherefore indicate the size of the reservoir available to supplyMo, and be a proxy for the depth of the chemocline. Thefaunal trends shown in Figure 6 therefore broadly reflect thegeochemical trends through the entire composite section andconfirm our interpretation of the profile of Mo/TOC as aproxy for degree of deepwater restriction.
6.4. Mo/TOC Profiles for Continental Europe
[42] Our Mo/TOC profiles for Germany and Switzerlanddiffer between localities, the differences likely arise fromdiffering degrees of restriction at differing times and placeswithin the NW European Basin (loosely defined). In all fourcontinental localities, values of Mo/TOC rise in, or below,the lower part of the tenuicostatum zone as restrictionbegins and intensifies, this is at a lower stratigraphic levelthan is found in The Cleveland Basin. At Dotternhausen,four thin units of organic-rich shale occur in the paltum anduppermost clevelandicum Szs. [Rohl et al., 2001] and it istempting to equate those units with the four Sulfur Bands ofYorkshire. Across Germany and Switzerland, the onset ofpermanent restriction was therefore both earlier and lesssudden than it was in the Cleveland Basin. This is nosurprise; Wignall et al. [2005] clearly documented diachro-neity in the onset of black shale deposition across Europe.Although the application of the Mo/TOC proxy for Toarcianpalaeoceanography in Germany and Switzerland wouldcertainly benefit from more detailed sampling, and improved
biostratigraphic calibration of existing Mo/TOC profiles, theexisting data are significant in the sense that they corrob-orate the overall conclusions drawn from the detailed recordof the Cleveland Basin in Yorkshire, and confirm thediachroneity of the onset of deepwater restriction acrossNW Europe in Early Toarcian time.
7. Local or Global Cause for Variations inMo/TOC and rsMo/TOC?
[43] The interpretation presented above appears to offergood evidence that the basin restriction model applies to theformation of the Lower Toarcian black shales of NWEurope. For several reasons, we discount explanations ofthe data that invoke global events, or variations in the Moconcentration of open-ocean seawater (the global drawdownscenario), or variations in the area of anoxic sedimentationon the seafloor [Barling et al., 2001; Pearce et al., 2008].[44] First, the diachroneity of the onset of extinction
patterns associated with anoxia in the Early Toarcian ofEurope [Wignall et al., 2005] (Figures 3 and 4) and beyond[Wignall et al., 2006] is not consistent with the operation of aglobal process, which must act at the same time worldwide.[45] Second, environmental proxies as diverse as TOC,
d13C, Mo/TOC and rsMo/TOC, and Re/TOC, have a rangeof response times to whole-ocean perturbations, yet theyshow simultaneous perturbations in the Lower Toarcianrecords of Yorkshire. Such fast and simultaneous responsetimes for both initiation and, crucially, relaxation, of suchexcursions can occur only when the reservoir size is smalland so decoupled from the whole ocean. It is important toemphasize that the most diagnostic point about such excur-sions is their rate of relaxation. Having been drawn down tolow Mo concentrations, any observable recovery of oceanicMo concentrations via normal weathering processes (and sothe development of high Mo/TOC in sediments) wouldoccupy a period equal to at least several residence timesof Mo (800 ka). The fast excursions and relaxations, overtimescales of a few thousand years we document in York-shire in Mo/TOC (and Re/TOC) were too rapid to reflectwhole-ocean events. They prove that, throughout the timeinterval examined, drawdown and replenishment of Momust have occurred within a small (local) reservoir. Similar,short, excursions (that, by definition, incorporate relaxa-tions) are also found in the Sulfur Bands, where elevatedMo/TOC indicates brief periods of euxinia (Figure 2): theseexcursions and their relaxation are consistent with theoperation of a local, not a global, process.[46] Third, drawdown of oceanic Mo requires it be
sequestered in organic-rich sediments. But the amount ofMo in European black shales is extremely low, so the fate ofoceanic Mo is obscure if a whole-ocean explanation isinvoked for low Mo/TOC and rsMo/TOC in the interval.Only 0.3% of the total flux of Mo to the Early Toarcianocean was captured in NW Europe during the IMR: thiscalculation assumes a duration for the IMR of 930,000 years[Suan et al., 2008], a riverine flux of Mo to the ocean duringthe IMR equal to that of today (18.2 � 106 kg/a [Algeo,2004, Table 1], an area of European black shale of500,000 km2 (from Figure 1); and a mean concentration
PA4217 MCARTHUR ET AL.: TOARCIAN BLACK SHALES AND BASIN RESTRICTION
13 of 22
PA4217
of Mo in the IMR of 5.1 mg/Kg (from Table 1). The figureof 0.3% is too small to be much affected by uncertainties inthe estimates of input parameters; it therefore mitigatesagainst global drawdown of seawater as a cause of thelow Mo/TOC in that interval.[47] Finally, a restricted basin scenario is consistent with
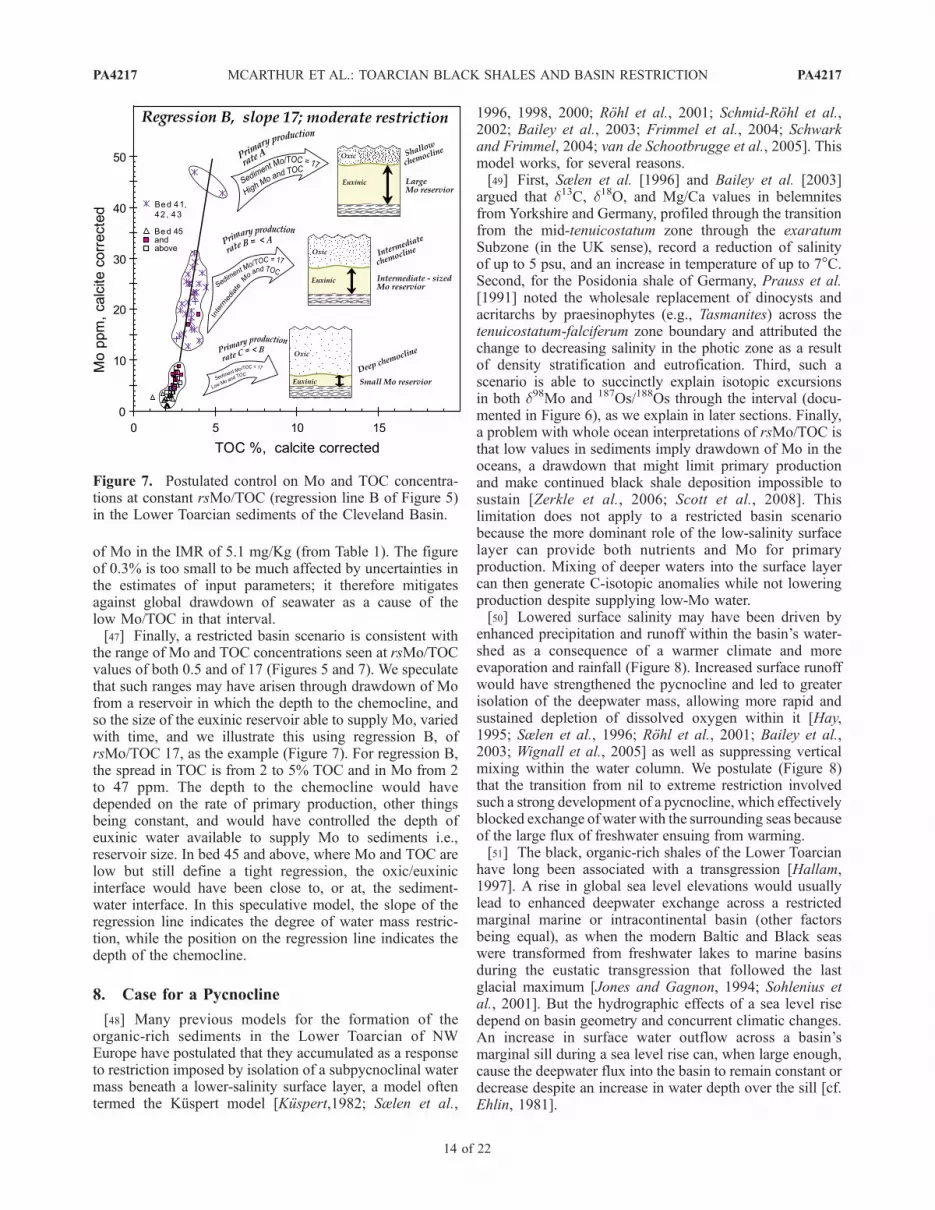
the range of Mo and TOC concentrations seen at rsMo/TOCvalues of both 0.5 and of 17 (Figures 5 and 7). We speculatethat such ranges may have arisen through drawdown of Mofrom a reservoir in which the depth to the chemocline, andso the size of the euxinic reservoir able to supply Mo, variedwith time, and we illustrate this using regression B, ofrsMo/TOC 17, as the example (Figure 7). For regression B,the spread in TOC is from 2 to 5% TOC and in Mo from 2to 47 ppm. The depth to the chemocline would havedepended on the rate of primary production, other thingsbeing constant, and would have controlled the depth ofeuxinic water available to supply Mo to sediments i.e.,reservoir size. In bed 45 and above, where Mo and TOC arelow but still define a tight regression, the oxic/euxinicinterface would have been close to, or at, the sediment-water interface. In this speculative model, the slope of theregression line indicates the degree of water mass restric-tion, while the position on the regression line indicates thedepth of the chemocline.
8. Case for a Pycnocline
[48] Many previous models for the formation of theorganic-rich sediments in the Lower Toarcian of NWEurope have postulated that they accumulated as a responseto restriction imposed by isolation of a subpycnoclinal watermass beneath a lower-salinity surface layer, a model oftentermed the Kuspert model [Kuspert,1982; Sælen et al.,
1996, 1998, 2000; Rohl et al., 2001; Schmid-Rohl et al.,2002; Bailey et al., 2003; Frimmel et al., 2004; Schwarkand Frimmel, 2004; van de Schootbrugge et al., 2005]. Thismodel works, for several reasons.[49] First, Sælen et al. [1996] and Bailey et al. [2003]
argued that d13C, d18O, and Mg/Ca values in belemnitesfrom Yorkshire and Germany, profiled through the transitionfrom the mid-tenuicostatum zone through the exaratumSubzone (in the UK sense), record a reduction of salinityof up to 5 psu, and an increase in temperature of up to 7�C.Second, for the Posidonia shale of Germany, Prauss et al.[1991] noted the wholesale replacement of dinocysts andacritarchs by praesinophytes (e.g., Tasmanites) across thetenuicostatum-falciferum zone boundary and attributed thechange to decreasing salinity in the photic zone as a resultof density stratification and eutrofication. Third, such ascenario is able to succinctly explain isotopic excursionsin both d98Mo and 187Os/188Os through the interval (docu-mented in Figure 6), as we explain in later sections. Finally,a problem with whole ocean interpretations of rsMo/TOC isthat low values in sediments imply drawdown of Mo in theoceans, a drawdown that might limit primary productionand make continued black shale deposition impossible tosustain [Zerkle et al., 2006; Scott et al., 2008]. Thislimitation does not apply to a restricted basin scenariobecause the more dominant role of the low-salinity surfacelayer can provide both nutrients and Mo for primaryproduction. Mixing of deeper waters into the surface layercan then generate C-isotopic anomalies while not loweringproduction despite supplying low-Mo water.[50] Lowered surface salinity may have been driven by
enhanced precipitation and runoff within the basin’s water-shed as a consequence of a warmer climate and moreevaporation and rainfall (Figure 8). Increased surface runoffwould have strengthened the pycnocline and led to greaterisolation of the deepwater mass, allowing more rapid andsustained depletion of dissolved oxygen within it [Hay,1995; Sælen et al., 1996; Rohl et al., 2001; Bailey et al.,2003; Wignall et al., 2005] as well as suppressing verticalmixing within the water column. We postulate (Figure 8)that the transition from nil to extreme restriction involvedsuch a strong development of a pycnocline, which effectivelyblocked exchange of water with the surrounding seas becauseof the large flux of freshwater ensuing from warming.[51] The black, organic-rich shales of the Lower Toarcian
have long been associated with a transgression [Hallam,1997]. A rise in global sea level elevations would usuallylead to enhanced deepwater exchange across a restrictedmarginal marine or intracontinental basin (other factorsbeing equal), as when the modern Baltic and Black seaswere transformed from freshwater lakes to marine basinsduring the eustatic transgression that followed the lastglacial maximum [Jones and Gagnon, 1994; Sohlenius etal., 2001]. But the hydrographic effects of a sea level risedepend on basin geometry and concurrent climatic changes.An increase in surface water outflow across a basin’smarginal sill during a sea level rise can, when large enough,cause the deepwater flux into the basin to remain constant ordecrease despite an increase in water depth over the sill [cf.Ehlin, 1981].
Figure 7. Postulated control on Mo and TOC concentra-tions at constant rsMo/TOC (regression line B of Figure 5)in the Lower Toarcian sediments of the Cleveland Basin.
PA4217 MCARTHUR ET AL.: TOARCIAN BLACK SHALES AND BASIN RESTRICTION
14 of 22
PA4217
[52] In discussing Early Toarcian events recorded in theCleveland Basin, the focus of others has been largely on the3 m interval in the lower exaratum Subzone where TOCconcentrations are highest (the putative OAE in the strictsense), or the 7 m of the exaratum Subzone itself (theputative OAE in the wider sense). Here, we revisit olderliterature [e.g., Hallam and Bradshaw, 1979], and empha-sizes more recent literature [e.g., Harries and Little, 1999;Wignall et al., 2005] and German literature that places theblack shales deposition and restriction into a longer tempo-ral context. In conjunction with the timescale of Suan et al.[2008], our data confirm that restriction in the shallow shelf
seas of NW Europe was presaged by organic-rich intervalsin the tenuicostatum Zone of Germany and the UnitedKingdom (the Sulfur Bands in the latter), then developedin around 150 ka through the upper semicelatum Subzone,was extreme for around 750 ka, and persisted in intermit-tent, or lesser form over the ensuing 500 ka into mid bifronstime. This interval of euxinia in Yorkshire is therefore nowdemonstrated to occupy approximately the same stratigraphicinterval as does the Posidonia shale of Germany.[53] Our Mo versus TOC crossplots show that samples
fall on one of two regression lines with very differentslopes. The real conundrum, at least for the Cleveland
Figure 8. Development of salinity stratification and its effect on exchange with open-ocean seawater.(a). The earliest Toarcian; low-to-mid Tenuicostatum Zone. Complete exchange with open-oceanseawater, little or no salinity stratification; sediment deposited with low concentrations of Mo and TOC.(b). The exaratum Subzone, upper semicelatum Subzone, and IMR. Mo/TOC regression slope of 0.5.Deposition of organic-rich sediments. Warm, wet, climate. High runoff of freshwater created a deeppycnocline, which interested local sills and prevented exchange with the open ocean, despite higher sealevel. Rare oxygenation events destroyed stratification and brought macrofauna into the seaway for shortperiods. (c). The lower falciferum Subzone; Mo/TOC regression slope of 17. Runoff lessened, pycnoclineshallowed; weak exchange occured with the open ocean allowing more frequent invasions of faunaduring more frequent oxygenation events. (D). The upper Toarcian Basin fill brought sediment near towave base; return of fully marine conditions. Coarser clastics encroached into the basin (Fox CliffSiltstone Member, Blea Wyke Sandstone Formation).
PA4217 MCARTHUR ET AL.: TOARCIAN BLACK SHALES AND BASIN RESTRICTION
15 of 22
PA4217
Basin, may lie in why samples define only two regressionlines, i.e., reveal a two-state system of restriction, ratherthan variable restriction. Do other black shales do the same?Our data preclude open-ocean models, e.g., those based onenhanced upwelling (e.g., a Namibian shelf model), asviable explanations of Toarcian events because of the lowfaunal diversity demonstrated by Harries and Little [1999]for the Cleveland Basin and by Rohl et al. [2001] forGermany, and the event communities documented by thelatter. Explanations for Toarcian condition must reckon withthe longer time frame we demonstrate, which requiresdriving forces operating over the entire Early Toarcian,but not in such overwhelming strength that they could notbe briefly interrupted. Given these considerations, it seemsinappropriate to designated the interval of separation of theEarly Toarcian sea of NW Europe from the ocean as anoceanic anoxic event, and more appropriate, especiallytoday, to term it a regional anoxic event (RAE).
9. Local or Global Expression for d98MoVariations?
[54] The data of Pearce et al. [2008] show that d98Moranges between 0.8 and 1.6 (Figures 3 and 6) within theIMR (Figures 2 and 6). In the overlying falciferum Subzone,where restriction was less, values are higher and reach 2.1%where the Mo/TOC profile peaks at 31.3 m in the section.These data are consistent with restriction and euxinia being
imposed by a low-salinity surface layer. During the IMR,the d98Mo of the restricted water mass within the ClevelandBasin would have been sensitized to such freshwater inputsfor two reasons. First, because drawdown of Mo was nearlytotal during that time; second, because the concentration ofMo in seawater (105 nM) is only about twenty times that incontinental runoff (5 nM) [Hem, 1978; Nagler et al., 2005,and references therein].[55] Development of a low-salinity cap as a driver for
restriction would have allowed Mo in continental-derivedfreshwater to override the marine isotopic composition ofdrawn-down Mo in the Cleveland Basin. We model suchchanges in Figure 9. We assume that the Mo concentrationin Toarcian seawater was 105 nM (as it is today) and had anisotopic composition of 2.1%, the maximum recorded inthe section [Pearce et al., 2008] (Figure 6). The modelresults show that lowering d98Mo to a value of 0.8 from2.1% requires salinity to decline by around 7% (2.3 psu) ifMo is drawn down to be 0.3% of its original concentration.This drawdown is around ten times more than seen today inthe Black Sea below 200 m depth. The rsMo/TOC ofregression A of Figure 5 is around one tenth of that forBlack Sea sediments. The comparison suggest that draw-down of Mo to 0.3% of the oceanic value was possible; therequired percentage drawdown would have been less if theMo concentration in the Toarcian ocean was lower than it isin the modern ocean. To drive marine d98Mo down from 2.1to around 1.6% would have required a lowering of salinityof only 2% (around 0.7 psu) on a drawdown of Mo to 0.3%original. Nagler et al. [2005], Poulson et al. [2006] andReitz et al. [2007] emphasized the present uncertainty thatattends interpretation of Mo isotopic composition as apalaeoproxy; we confirm that caution is required in theinterpretation of d98Mo in all black shales sequences.
10. Impact of Restriction on Re-Os Dating
[56] Our Mo and TOC data demonstrate that the model ofa restricted basin, lidded by a low-salinity surface layer (theKuspert model), applies to much of Early Toarcian time ofNW Europe. As Mo was drawn down in the waters beneaththe pycnocline in the Cleveland Basin, organophile ele-ments such as Re, and Os would also have been drawndown into organic matter accumulating on the seafloor. Theresulting low concentrations of dissolved Re and Os wouldhave sensitized the water column to isotopic change causedby small inputs of elements from the mixed, low-salinitysurface layer. We examine below the implications of thissensitization on the attempts to date black shales using theRe-Os geochronology, because such attempts have notalways been successful.[57] A minority of Re/Os isochrons yield large uncertain-
ties on the date derived. Drawdown of Os followingrestriction explains why. The assumption of the method isthat radiogenic 187Os accumulated in a suite of samples inwhich the initial 187Os/188Os was uniform. This assumptionis violated if drawdown of Os, following restriction, sensi-tized the isolated water mass, and so the sediments, tofluctuating inputs of continental Os. The sensitizationoccurs because, assuming modern values applied, the con-
Figure 9. Modeled d95Mo in the Early Toarcian sea of theCleveland Basin as a function of salinity and drawdown ofmarine Mo. End-member values for isotopic compositionand concentration are from Table 2. Plot shows thepercentage of typical continental runoff required in a mixof freshwater and seawater to generate an isotopiccomposition of the mix, given on the ordinate. In thecurrent Black Sea, Mo drawdown is below 200 m to 2–3%of its open-ocean value.
PA4217 MCARTHUR ET AL.: TOARCIAN BLACK SHALES AND BASIN RESTRICTION
16 of 22
PA4217
centration of Os in seawater (53 aM) was about the same asthat in continental runoff (48 aM) but their isotopic compo-sitions were very different; values of 187Os/188Os are around1.1 to 1.2 for continental inputs to seawater, and around 0.12for extraterrestrial and MOR inputs [Peucker-Ehrenbrinkand Ravizza, 2000] (Table 2). This problem appears to havecompromised attempts to date the exaratum Subzone inYorkshire using the Re-Os isochron method [Cohen et al.,1999]. The date obtained was imprecise because the initial187Os/188Os for their suite of samples was not constant. Inthe exaratum Subzone initial 187Os/188Os values are highand variable (0.8 to 1.0, Figure 6) [Cohen et al., 1999,2004], values well above the 0.4 derived for higher strati-graphic levels (Figure 6).[58] We model the effect on the isotopic composition of
drawdown of Os and resupply by dilution with a freshwaterend-member (Figure 10) using model parameters given inTable 2 that are appropriate to the Toarcian. The value of 0.4for initial 187Os/188Os is that for organic-rich sedimentsabove the exaratum Subzone (Figure 6) [Cohen et al.,2004]; even that value may have been affected by therestriction. From Figure 10, it can be seen that to drive187Os/188Os to the value of 0.8 seen in the exaratumSubzone from 0.4 required only 4% dilution of seawaterby freshwater, i.e., a lowering of salinity by 1.3 psu, if theseawater Os had been drawn down to 5% of its originalvalue by restriction and rainout to sediments. Given thesalinity reduction in the surface layer calculated by Sælen etal. [1996] of 5 psu, and that of 2.5 psu calculated by Baileyet al. [2003] using Mg/Ca and d18O, the Os isotopicanomaly in the exaratum Sz is thus explained.[59] The anomaly was interpreted by Cohen et al. [2004]
as reflecting a 400–800% increase in continental weather-ing, communicated to the whole ocean. This explanation isunlikely to be correct and not only for the reason given here:the isotopic anomalies are recorded in a section that iscondensed [McArthur et al., 2000; McArthur and Wignall,2007], rather than expanded, and the increased sedimentflux that increased weathering would entail have not beenidentified. Our interpretation, that the elevated initial187Os/188Os reflect a signal of riverine input that wasmagnified by marine isolation and consequent drawdownof Os into sediments, is compatible with both condensationand with restriction.[60] Cohen et al. [1999] also found that the isochrons for
other organic-rich sediments from the United Kingdom(Table 3) including the Kimmeridge Clay, had unexpectedlylarge uncertainties in calculated age. We postulate that thiswas for the same reason as given above; drawdown and
sensitization of Os isotopic composition in the respectiveoverlying water masses to modification by small freshwaterinputs, leading to variable initial 187Os/188Os. Such draw-down is evident from crossplots of Mo, Re, and Os, againstTOC (Figure 11). The regression slopes have a range ofslopes, but many are low. The rsRe/TOC and rsOs/TOC forthe Kimmeridge Clay (wheatleyensis Zone of Dorset) areparticularly low and seem extreme, while the rsMo/TOC forthe Kimmeridge Clay (hudlestoni and wheatleyensis Zonesof the Cleveland Basin [see Tribovillard et al., 1994, 2004b]is around 3, which is low but not as extreme as the 0.5 forthe Toarcian sediments of the Cleveland Basin. We interpretall of these the low slopes to be diagnostic of water massrestriction. Drawdown and sensitization consequent onrestriction explains why the initial 187Os/188Os ratios arevariable (Table 3) and Re-Os dating compromised.[61] Similar problems of imprecision were encountered
by Turgeon et al. [2007] when applying Re-Os to dateblack shales across the Frasnian-Femennian boundary.Four isochrons obtained for four levels close to theboundary showed a range of mean square weighted devi-ation (MSWD) from 0.51 to 11.7. The level with thepoorest precision on age (WVC777, 476 ± 140 Ma forthe boundary age that is around 370 Ma) is aberrant in
Table 2. Isotopic and Elemental Data for Seawater and Con-
tinental Runoff Pertinent to Early Toarcian Timesa
Element
River Seawater
Concentration IR Concentration IR
Os, aM 48 1.4 53 0.4Mo, nM 5 0.0 105 2.1
aIR is isotope ratio, 188Os/187Os and d98/95Mo. Data are from Hem[1978], Peucker-Ehrenbrink and Ravizza [2000], and Cohen et al. [2004].
Figure 10. Modeled 187Os/188Os (initial) in the EarlyToarcian sea of the Cleveland Basin as a function of salinityand drawdown of marine Os. End-member values forisotopic composition and concentration are from Table 2.Value of 187Os/188Os (initial) of 0.81 for the jet rock wastaken from Cohen et al. [1999]. Plot shows the percentageof typical continental runoff required in a mix of freshwaterand seawater to generate an isotopic composition of themix, given on the ordinate. In the current Black Sea, Modrawdown is below 200 m to 2–3% of its open-oceanvalue.
PA4217 MCARTHUR ET AL.: TOARCIAN BLACK SHALES AND BASIN RESTRICTION
17 of 22
PA4217
several respects compared to the other levels. It has themost restricted range of 187Re/188Os, the lowest rsOs/TOCand rsRe/TOC, and the highest concentration of TOC(Figure 12). We suggest that the imprecise isochron forWVC777 arises from drawdown locally of Os consequenton ephemeral basin restriction and enhanced primaryproduction that sensitized the basin to freshwater inputs.Given these considerations, future attempts to date blackshales using the Re-Os geochronometer should be madebearing in mind that sediments showing well-defined,
Table 3. Organic-Rich Sediments From the UK Used for Dating
Figure 11. Crossplots of Mo versus TOC for this study and Re and 192Os versus TOC for the data ofCohen et al. [1999] for organic-rich sediments of Toarcian, Hettangian, and Sinemurian age from coastalsections in Yorkshire and organic-rich sediments of Kimmeridgian age (wheatleyensis zone) from Dorset,United Kingdom. Data for the Kimmeridge Clay Formation for Mo and TOC are from Tribovillard et al.[1994, 2004b] and are for samples from the hudlestoni and wheatleyensis Zones of the Cleveland Basin,as no Mo data is given by Cohen et al. [1999]; a strict comparison of Mo with either Re or Os is thereforenot possible. Drawdown of elements from a restricted water mass had exhausted the local elementreservoir in the Toarcian and Sinemurian. The sedimentary content of Mo, Re, and Os was low comparedto Hettangian organic-rich sediments from the same sequence and localities nearby, where restriction wasless. Depletion of Re and Os in the Kimmeridge Clay seems extreme, and rsMo/TOC is around 3, slightlylower than that in modern sediments of the Black Sea.
PA4217 MCARTHUR ET AL.: TOARCIAN BLACK SHALES AND BASIN RESTRICTION
18 of 22
PA4217
linear, relationships between TOC and Re, Os, and Mo,might have been affected by water mass restriction, andthat the best sediments to sample are those that are not themost organic rich.
11. An Eocene Equivalent of the Toarcian Sea?
[62] Previous workers have proposed that the EarlyToarcian seas of northwestern Europe had a low-salinitysurface layer [Sælen et al., 1996, 1998, 2000; Rohl et al.,
2001; Schmid-Rohl et al., 2002; Frimmel et al., 2004;Schwark and Frimmel, 2004, and references therein].Younger analogs of the restricted Early Toarcian sea mightbe the eastern Mediterranean, where sapropels formed inresponse to surface freshening and nutrient supply [Roh-ling, 1994], or the Arctic, high-latitude, Azolla Ocean ofmiddle Eocene time. Examining the latter, the freshwater/brackish water fern Azolla flourished in the Arctic Oceanin a low-salinity surface layer that extended over an800,000 year period, depositing sediments that reach up to5% TOC [Brinkhuis et al., 2006]. According to Brinkhuis etal. [2006, p. 607], the Arctic sediments show cyclicoscillations that ‘‘may reflect orbital forcing of the 100-kaeccentricity cycle, suggesting that the periodical fresheningof the Arctic Ocean was astronomically modulated.’’ Theabundance of Azolla, and its occurrence together with theremains of other brackish/marine organisms, suggested thatthe salinity of surface seawater in the Azolla Ocean was lowas a result of high precipitation and restricted exchange withsurrounding seas [Brinkhuis et al., 2006]. The demonstra-tion of freshening has relevance for similar suggestionsapplied to the Toarcian.[63] The Azolla sediments show alternating laminations
composed of dark, organic-rich, and lighter, siliceous,microlayers that are interpreted to reflect annual, seasonal,influences [Brinkhuis et al., 2006]. Similar laminationsoccur in the Toarcian black shales of Yorkshire, UnitedKingdom, and were taken to be annual varves [Hallam,1997]. They are reinterpreted by Wignall et al. [2005] assilt laminae event beds recording a much more aperiodicstyle of deposition than varves. Indeed he states thatvarves are not present. Laminations that are superficiallysimilar to varves also occur in the time-equivalent Posidoniashale of Germany. They were interpreted by Rohl et al.[2001] specifically not to be varves but to representevents happening at intervals of several tens to hundredsof years.
12. Conclusions
[64] 1. The slopes of two Mo versus TOC regression linesfor the Lower Toarcian sediments of the Cleveland Basin inYorkshire, United Kingdom, define two periods of watermass restriction. In the upper half of the semicelatumSubzone (tenuicostatum Zone) and most of the exaratumSubzone (falciferum Zone), data define a regression linebetween Mo and TOC that has a slope (rsMo/TOC) of 0.5, avalue around ten times lower than in modern sedimentsfrom the Black Sea, where rsMo/TOC is 4.5. The value of0.5 shows that restriction was extreme. The frequency ofdeepwater renewal was around 10 times less than in themodern Black Sea and occurred at intervals of 5–40 ka. Inthe overlying strata of the falciferum Subzone the deepwaterrenewal frequency was 10–130 years on the basis of anrsMo/TOC of 17, a value comparable to that for the CariacoTrench and Framvaren Fjord of today. In the ClevelandBasin, open marine conditions were reestablished by mid-Toarcian times (lower bifrons Zone times).[65] 2. The comparison of Mo/TOC profiles through
Lower Toarcian sections in the Cleveland Basin, United
Figure 12. Relation of Re, Os, and TOC in samplesacross the Frasnian-Famennian boundary (Late Devonian),and Re-Os isochron for aberrant level WVC777, for thedata from Turgeon et al. [2007]. Level WVC777 is the leastenriched in Re or Os because of restriction and drawdownof these elements from an anoxic water mass in a restrictedbasin, which was therefore sensitized to changes in Osisotope composition through freshwater inputs. This leveltherefore provided the worst isochron. See text for fulleraccount.
PA4217 MCARTHUR ET AL.: TOARCIAN BLACK SHALES AND BASIN RESTRICTION
19 of 22
PA4217
Kingdom, and in Germany and Switzerland, shows thatsome geographical variability existed in the degree ofrestriction of the Toarcian sea. Across Europe, the onsetof restriction was diachronous.[66] 3. The time of the most extreme restriction of the
local water mass in Yorkshire coincided with the intervalover which a negative excursion in d13C(org) is recorded inthe sediments. The isotopic anomaly, and deposition ofLower Toarcian black shales, reflect a local, or regional,response of a coastal seaway to restriction, rather than aresponse to a global catastrophe. The period of black shaledeposition is therefore defined as a regional anoxic event(RAE). Our recognition of restriction provides support forthe silled-basin (Kuspert) model of black shale deposition inEarly Toarcian times in northwestern Europe.[67] 4. Drawdown of marine Mo, Os, and Re into sedi-
ments during the upper-semicelatum and exaratum Subzonetimes was almost complete. Drawdown sensitized the re-stricted water mass to isotopic changes driven by smallinputs from riverine sources and drove large excursions in
187Os/188Os and d98Mo that were recorded in sediments.The use of d98Mo and initial 187Os/188Os as palaeoredoxindicators is thus made more complex.[68] 5. Drawdown of Os, in restricted anoxic basins may
pose a problem for the application of the Re-Os geochron-ometer to black shales. Such dating should consider whethersamples showing strong covariance between Re and TOC,and between Os and TOC, might have been affected byrestriction, and so sensitized to natural change in back-ground marine 187Os/188Os to a degree that might compro-mise the methods usefulness.
[69] Acknowledgments. We thank Ryan Wilson, Nick Bose, andTony Osborn for assistance with the analysis for Mo and TS/TC/TOCand Robert Newton, Leeds University, for providing additional samplesfrom the Yorkshire sections. Assistance with Mo analysis from BenoitDisch and Kim Jarvis, of the late NERC ICP-MS Facility, is gratefullyacknowledged. We thank Antonietta Quigg (Texas A&M) for providing uswith her unpublished Weiach trace element data; Hans-Jurgen Brumsack forMo and TOC data for the Mogglingen and Hildesheim, Germany; NicholasTribovillard for Mo and TOC data for the Kimmeridge Clay; and TimLyons and an anonymous reviewer for making many constructive sugges-tions in review that led to improvements in the script.
ReferencesAlgeo, T. J. (2004), Can marine anoxic eventsdraw down the trace element inventory of sea-w a t e r ? , Geo l o g y , 32 , 1 0 5 7 – 1060 ,doi:10.1130/G20896.1.
Algeo, T. J., and T. W. Lyons (2006), Mo–totalorganic carbon covariation in modern anoxicmarine environments: Implications for analy-sis of paleoredox and paleohydrographic con-ditions, Paleoceanography, 21, PA1016,doi:10.1029/2004PA001112.
Bailey, T. R., Y. Rosenthal, J. M. McArthur,B. van de Schootbrugge, and M. F. Thirlwall(2003), Paleoceanographic changes of the latePliensbachian–Early Toarcian interval: A pos-sible link to the genesis of an oceanic anoxicevent, Earth Planet. Sci. Lett., 212, 307–320,doi:10.1016/S0012-821X(03)00278-4.
Barling, J., G. L. Arnold, and A. D. Anbar(2001), Natural mass-dependent variations inthe isotopic composition of molybdenum,Earth Planet. Sci. Lett., 193, 447 – 457,doi:10.1016/S0012-821X(01)00514-3.
Brinkhuis, H., et al. (2006), Episodic fresh sur-face waters in the Eocene Arctic Ocean, Nat-ure, 441, 606–609, doi:10.1038/nature04692.
Brumsack, H.-J. (1988), Rezente, Corg-ReicheSedimente als Schlussel zum Verstandnis fos-siler Schwarzschiefer, 126 pp., Ph.D. thesis,Univ. Gottingen, Gottingen, Germany.
Cohen, A. S., A. L. Coe, J. M. Bartlett, and C. J.Hawkesworth (1999), Precise Re-Os ages oforganic-rich mudrocks and the Os isotopecomposition of Jurassic seawater, Earth Pla-net. Sci. Lett., 167, 159–173, doi:10.1016/S0012-821X(99)00026-6.
Cohen, A. S., A. L. Coe, S. M. Harding, andL. Schwark (2004), Osmium isotope evidencefor the regulation of atmospheric CO2 by con-tinental weathering, Geology, 32, 157–160,doi:10.1130/G20158.1.
Collier, R. W. (1985), Molybdenum in the north-east Pacific Ocean, Limnol. Oceanogr., 30,1351–1353.
Colodner, D., J. Edmond, and E. Boyle (1995),Rhenium in the Black Sea: Comparison
with molybdenum and uranium, Earth Pla-net. Sci. Lett., 131, 1 – 15, doi:10.1016/0012-821X(95)00010-A.
Ehlin, U. (1981), Hydrology of the Baltic Sea, inThe Baltic Sea, Elsevier Oceanogr. Ser., vol. 30,pp. 123–134, edited by A. V. Voipio, Elsevier,Amsterdam.
Emerson, S. R., and S. S. Huested (1991),Ocean anoxia and the concentrations ofmolybdenum and vanadium in seawater,Mar. Chem., 34, 177 – 196, doi:10.1016/0304-4203(91)90002-E.
Erickson, B. E., and G. R. Helz (2000), Molybde-num (VI) speciation in sulfidic waters: Stabilityand lability of thiomolybdates, Geochim. Cos-mochim. Acta, 64, 1149–1158, doi:10.1016/S0016-7037(99)00423-8.
Feist-Burkhardt, S. (1992), Palynological inves-tigations in the Lower and Middle Jurassic ofSwitzerland, France and Germany: Palynofa-cies and type of organic matter, dinoflagellatecyst morphology and stratigraphy, Ph.D. the-sis, Univ. of Geneva, Geneva, Switzerland.
Frimmel, A., W. Oschmann, and L. Schwark(2004), Chemostratigraphy of the Posidoniablack shale, SW Germany I. Influence of sea-level variation on organic facies evolution,Chem. Geol., 206, 199 – 230, doi:10.1016/j.chemgeo.2003.12.007.
Neuendorf, K. K. E., J. P. Mehl Jr., and J. A.Jackson (Eds.) (2005), Glossary of Geology,5th ed., Am. Geol. Inst., Alexandria, Va.
Hallam, A. (1997), Estimates of the amount andrate of sea-level change across the Rhaetian-Hettangian and Pliensbachian-Toarcianboundaries (latest Triassic to Early Jurassic),J. Geol. Soc., 154, 773–779, doi:10.1144/gsjgs.154.5.0773.
Hallam, A., and M. J. Bradshaw (1979), Bitumi-nous shales and oolitic ironstones as indicatorsof transgressions and regressions, J. Geol. Soc.,136, 157–164, doi:10.1144/gsjgs.136.2.0157.
Harries, P. J., and C. T. S. Little (1999), The EarlyToarcian (Early Jurassic) and the Cenomanian-Turonian (Late Cretaceous) mass extinctions:
Similarities and contrasts, Palaeogeogr.Palaeoclimatol. Palaeoecol., 154, 39 – 66,doi:10.1016/S0031-0182(99)00086-3.
Hay, W. W. (1995), Paleoceanography of marineorganic-carbon-rich sediments, in Paleogeo-graphy, Paleoclimate, and Source Rocks, editedby A.-Y. Huc, AAPG Stud. Geol., 40, 21–59.
Helz, G. R., C. V. Miller, J. M. Charnock, J. F. M.Mosselmans, R. A. D. Pattrick, C. D. Gardner,and D. J. Vaughan (1996), Mechanism ofmolybdenum removal from the sea and its con-centration in black shales: EXAFS evidence,Geochim. Cosmochim. Acta, 60, 3631–3642,doi:10.1016/0016-7037(96)00195-0.
Hem, J. D. (1978), Study and interpretation ofthe chemical characteristics of natural water,U. S. Geol. Surv. Water Supply Pap., 2254,140 pp.
Howard, A. S. (1985), Lithostratigraphy of theStaithes sandstone and Cleveland ironstoneformations (Lower Jurassic) of north-eastYorkshire, Proc. Yorkshire Geol. Soc., 45,261–275.
Howarth, M. K. (1955), Domerian of the York-shire coast, Proc. Yorkshire Geol. Soc., 30,147–175.
Howarth, M. K. (1962), The jet rock series andthe alum shale series of the Yorkshire coast,Proc. Yorkshire Geol. Soc., 33, 381–422.
Howarth, M. K. (1973), The stratigraphy andammonite fauna of the upper Liassic greyshales of the Yorkshire coast, Bull. Br. Mus.Nat. Hist. Geol., 24, 235–277.
Jenkyns, H. C. (1988), The Early Toarcian(Jurassic) anoxic event: Stratigraphic, sedi-mentary and geochemical evidence, Am. J.Sci., 288, 101–151.
Jochum, J. (1993), Karbonatumverteilung,Mobilisation von Elementen und Migrationvon Erdol-Kohlenwasserstoffen im Posido-nienschiefer (Hildmulde, NW-Deutschland)in Abhangigkeit von der Palaotemperatur-beanspruchung durch das Massiv vonVlotho, Ber. Forsch. Juelich D82, 236 pp.,Forsch. Juelich, Juelich, Germany.
PA4217 MCARTHUR ET AL.: TOARCIAN BLACK SHALES AND BASIN RESTRICTION
20 of 22
PA4217
Jones, G. A., and A. R. Gagnon (1994), Radio-carbon chronology of Black Sea sediments,Deep Sea Res., Part A, 41, 531–557.
Kearey, P. (2001), The New Penguin Dictionaryof Geology, Penguin, London.
Kuspert, W. (1982), Environmental changes dur-ing oil shale deposition as deduced from stableisotope ratios, in Cyclic and Event Stratifica-tion, edited by G. Einsele and A. Seilacher,pp. 482–501, Springer, Berlin.
Littke, R., D. R. Baker, D. Leythauser, andJ. Rullkotter (1991), Keys to the depositionalhistory of the Posidonia shale (Toarcian) in theHils syncline, northern Germany, in Modernand Ancient Continental Shelf Anoxia, editedby R. V. Tyson, and T. H. Pearson, Geol. Soc.Spec. Publ., 58, 311–333.
Little,C.T.S. (1996),ThePliensbachian-Toarcian(Lower Jurassic) extinction event, in TheCretaceous-Tertiary Event and Other Cata-strophes in Earth History, edited by G. Ryder,D. Fastovsky, and S. Gartner, Geol. Soc. Am.Spec. Pap., 307, 505–512.
Little, C. T. S., and M. J. Benton (1995), EarlyJurassic mass extinction: A global long-termevent, Geology, 23, 495–498, doi:10.1130/0091-7613(1995)023<0495:EJMEAG>2.3.CO;2.
Loh, H., B. Maul, M. Prauss, and W. Riegel(1986), Primary production, maceral formationand carbonate species in the Posidonia shale ofNW Germany in Biogeochemistry of BlackShales, Mitt. Geol. Palaeontol. Inst. Univ.Hamburg, vol. 60, edited by E. T. Degens,P. A. Meyers, and S. C. Brassell, pp. 397–421,Geol. Palaeontol. Inst., Univ. Hamburg,Hamburg, Germany.
McArthur, J. M., and P. Wignall (2007), Com-ment on ‘‘Non-uniqueness and interpretationof the seawater 87Sr/86Sr curve’’ by Dave Wal-tham and Darren R. Grocke (GCA, 70, 2006,384–394), Geochim. Cosmochim. Acta, 71,3382–3386, doi:10.1016/j.gca.2006.10.026.
McArthur, J. M., D. T. Donovan, M. F. Thirlwall,B. W. Fouke, and D. Mattey (2000), Strontiumisotope profile of the Early Toarcian (Jurassic)oceanic anoxic event, the duration of ammo-nite biozones, and belemnite palaeotempera-tures, Earth Planet. Sci. Lett., 179, 269–285,doi:10.1016/S0012-821X(00)00111-4.
McArthur, J. M., N. M. M. Janssen, S. Reboulet,M. J. Leng, M. F. Thirlwall, and B. van deSchootbrugge (2007), Early Cretaceous ice-cap volume, palaeo-temperatures (Mg, d18O),and isotope stratigraphy (d13C, 87Sr/86Sr) fromTethyan belemnites, Palaeogeogr. Palaeocli-ma to l . Pa laeoeco l . , 248 , 391 – 430 ,doi:10.1016/j.palaeo.2006.12.015.
Morford, J. L., and S. Emerson (1999), Thegeochemistry of redox sensitive trace metalsin sediments, Geochim. Cosmochim. Acta,63 , 1735 – 1750, doi :10.1016/S0016-7037(99)00126-X.
Nagler, T. F., C. Siebert, H. Luschen, and M. E.Bottcher (2005), Sedimentary Mo isotoperecord across the Holocene fresh-brackishwater transition of the Black Sea, Chem.Geol., 219, 283–295, doi:10.1016/j.chem-geo.2005.03.006.
Ogg, J. G. (2004), The Jurassic period, in AGeological Time Scale 2004, edited by F.Gradstein, J. G. Ogg, and A. G. Smith,pp. 307–343, Cambridge Univ. Press., Cam-bridge, U. K.
Page, K. N. (2004), A sequence of biohorizonsfor the Subboreal Province lower Toarcian innorthern Britain and their correlation with a
submediterranean standard, Riv. It. Paleontol.Stratigr., 110, 109–114.
Pearce, C. R., A. S. Cohen, A. L. Coe, and K. W.Burton (2008), Molybdenum isotope evidencefor global ocean anoxia coupled with pertur-bations to the carbon cycle during the EarlyJurassic, Geology, 36, 231–234, doi:10.1130/G24446A.1.
Peucker-Ehrenbrink, B., and G. Ravizza (2000),The marine osmium record, Terra Nova, 12,2 0 5 – 2 1 9 , d o i : 1 0 . 1 0 4 6 / j . 1 3 6 5 -3121.2000.00295.x.
Poulson, R. L., C. Siebert, J. McManus, andW. M. Berelson (2006), Authigenic molyb-denum isotope signatures in marine sedi-ments, Geology, 34, 617–620, doi:10.1130/G22485.1.
Powell, J. H. (1984), Lithostratigraphical nomen-clature of the Liass Group in the YorkshireBasin, Proc. Yorkshire Geol. Soc., 45, 51–57.
Prauss, M., B. Ligouis, and H. Luterbacher(1991), Organic matter and palynomorphs inthe ‘Posidonienschiefer’ (Toarcian, Lower Jur-assic) of southern Germany, in Modern andAncient Continental Shelf Anoxia, edited byR. V. Tyson and T. H. Pearson, Geol Soc.Special Publ. London, 58, 335–352.
Raiswell, R., and R. A. Berner (1985), Pyriteformation in euxinic and semi-euxinic sedi-ments, Am. J. Sci., 285, 710–724.
Reitz, A., M. Wille, T. F. Nagler, and G. T. deLange (2007), Atypical Mo isotope signaturesin eastern Mediterranean sediments, Chem.Geol. , 245 , 1 – 8, doi:10.1016/j.chem-geo.2007.06.018.
Riegraf, W., G. Werner, and F. Lorcher (1984),Die Posidonienschiefer. Biostratigraphie,Fauna und Fazies des sudwestdeutschen Un-tertoarciums (Lias e), 195 pp., FerdinandEnke, Stuttgart, Germany.
Rohl, H.-J., A. Schmid-Rohl, W. Oschmann,A. Frimmel, and L. Schwark (2001), ThePosidonia shale (lower Toarcian) of SW-Germany: An oxygen depleted ecosystem con-trolled by sealevel and palaeoclimate, Palaeo-geogr. Palaeoclimatol. Palaeoecol., 169, 273–299, doi:10.1016/S0031-0182(01)00201-2.
Rohling, E. J. (1994), Review and new aspectsconcerning the formation of eastern Mediter-ranean sapropels, Mar. Geol., 122, 1 – 28,doi:10.1016/0025-3227(94)90202-X.
Sælen, G., P. Doyle, and M. R. Talbot (1996),Stable isotope analyses of belemnite rostrafrom the Whitby Mudstone Fm., England: Sur-face water conditions during deposition of amarine black shale, Palaios, 11, 97 – 117,doi:10.2307/3515065.
Sælen, G., R. V. Tyson, M. R. Talbot, andN. Telnæs (1998), Evidence of recycling ofisotopically light CO2(aq) in stratified blackshale basins; contrasts between the WhitbyMudstone and Kimmeridge Clay formations,United Kingdom, Geology, 26, 747 – 750,doi:10.1130/0091-7613(1998)026<0747:EOROIL>2.3.CO;2.
Sælen, G., R. V. Tyson, N. Telnæs, and M. R.Talbot (2000), Contrasting watermass condi-tions during deposition of the Whitby Mudstone(Lower Jurassic) and Kimmeridge Clay (UpperJurassic) formations, UK, Palaeogeogr. Pa-laeoclimatol. Palaeoecol., 163, 163 – 196,doi:10.1016/S0031-0182(00)00150-4.
Schmid-Rohl, A., and H. J. Rohl (2003), Over-growth on ammonite conchs: Environmentalimplications for the Lower Toarcian Posidoniasha le , Palaeontology, 46 , 339 – 352,doi:10.1111/1475-4983.00302.
Schmid-Rohl, A., H. J. Rohl, W. Oschmann,A. Frimmel, and L. Schwark (2002), Palaeoen-vironmental reconstruction of Lower Toarcianepicontinental black shales (Posidonia shale,SW Germany): Global versus regional control,Geobios, 35, 13 – 20, doi:10.1016/S0016-6995(02)00005-0.
Schouten, S., H. Van Kaam-Peters, W. I. C.Rijpstra, M. Schoell, and J. S. SinningheDamste (2000), Effects of an oceanic anoxicevent on the stable carbon isotopic composi-tion of Early Toarcian carbon, Am. J. Sci.,300, 1–22, doi:10.2475/ajs.300.1.1.
Schwark, L., and A. Frimmel (2004), Chemos-tratigraphy of the Posidonia black shale,SW-Germany II. Assessment of extent andpersistence of photic-zone anoxia using arylisoprenoid distributions, Chem. Geol., 206,2 3 1 – 248 , do i : 1 0 . 1 0 16 / j . c h emgeo .2003.12.008.
Scott, C., T. W. Lyons, A. Bekker, Y. Shen, S. W.Poulton, X. Chu, and A. D. Anbar (2008),Tracing the stepwise oxygenation of the Proter-ozoic ocean, Nature, 452, 2008, doi:10.1038/nature06811.
Sohlenius, G., K.-C. Emeis, E. Andren,T. Andren, and A. Kohly (2001), Developmentof anoxia during the Holocene fresh brackishwater transition in the Baltic Sea, Mar.Geol., 177, 221 –242, doi:10.1016/S0025-3227(01)00174-8.
Suan, G., B. Pittet, I. Bour, E. Mattioli, and L. V.Duarte (2008), Duration of the Early Toarciancarbon isotope excursion deduced from spec-tral analysis: Consequence for its possiblecauses, Earth Planet. Sci. Lett., 267, 666–679, doi:10.1016/j.epsl.2007.12.017.
Tribovillard, N.-P., A. Desprairies, E. Lallier-Verges, P. Bertrand, N. Moureau, A. Ramdani,and L. Ramanampiso (1994), Geochemicalstudy of organic-matter rich cycles from theKimmeridge Clay Formation of Yorkshire(UK): Productivity versus anoxia, Palaeogeogr.Palaeoclimatol. Palaeoecol., 108, 165–181,doi:10.1016/0031-0182(94)90028-0.
Tribovillard, N., A. Riboulleau, T. Lyons, andF. Baudin (2004a), Enhanced trapping ofmolybdenum by sulfurized organic matterof marine origin as recorded by various Meso-zoic formations, Chem. Geol., 213, 385–401,doi:10.1016/j.chemgeo.2004.08.011.
Tribovillard, N., A. Trentesaux, A. Ramdani,F. Baudin, andA. Riboulleau (2004b), Controlesde l’accumulation de matiere organique dans laKimmeridge Clay Formation (Jurassiquesuperieur, Yorkshire, G. B.) et son equivalentlateral du Boulonnais: L’apport des elementstraces metalliques, Bull. Soc. Geol. Fr.,175(5), 491–506, doi:10.2113/175.5.491.
Tribovillard, N., T. J. Algeo, T. Lyons, andA. Riboulleau (2006), Trace metals as paleor-edox and paleoproductivity proxies: An up-date, Chem. Geol., 232, 12–32, doi:10.1016/j.chemgeo.2006.02.012.
Tribovillard, N., T. W. Lyons, A. Riboulleau, andV. Bout-Roumazeilles (2008), A possible cap-ture of molybdenum during early diagenesis ofdysoxic sediments, Bull. Soc. Geol. Fr., 179,3–12, doi:10.2113/gssgfbull.179.1.3.
Turgeon, S. C., R. A. Creaser, and T. J. Algeo(2007), Re-Os depositional ages and seawaterOs estimates for the Frasnian-Famennianboundary: Implications for weathering rates,land plant evolution, and extinction mechan-isms, Earth Planet. Sci. Lett., 261, 649–661,doi:10.1016/j.epsl.2007.07.031.
PA4217 MCARTHUR ET AL.: TOARCIAN BLACK SHALES AND BASIN RESTRICTION
21 of 22
PA4217
van de Schootbrugge, B., J. M. McArthur, T. R.Bailey, Y. Rosenthal, J. D. Wright, and K. G.Miller (2005), Toarcian oceanic anoxic event:An assessment of global causes using belem-nite C isotope records, Paleoceanography, 20,PA3008, doi:10.1029/2004PA001102.
Vorlicek, T. P., and G. R. Helz (2002), Catalysisby mineral surfaces: Implications for Mo geo-chemistry in anoxic environments, Geochim.Cosmochim. Acta, 66, 3679 – 3692, doi:10.1016/S0016-7037(01)00837-7.
Wignall, P. B., R. J. Newton, and C. T. S. Little(2005), The timing of paleoenvironmentalchange and cause-and-effect relationships dur-
ing the Early Jurassic mass extinction in Eur-ope,Am. J. Sci., 305, 1014–1032, doi:10.2475/ajs.305.10.1014.
Wignall, P. B., A. Hallam, R. J. Newton, J. G.Sha, E. Reeves, E. Mattioli, and S. Crowley(2006), Jurassic extinction in Tibet. An east-ern Tethyan (Tibetan) record of the EarlyJurassic (Toarcian) mass extinction event,Geobiology, 4, 179 – 190, doi:10.1111/j.1472-4669.2006.00081.x.
Zerkle, A. L., C. H. House, R. P. Cox, and D. E.Canfield (2006), Metal limitation of cyano-bacterial N2 fixation and implications for thePrecambrian nitrogen cycle, Geobiology, 4,
285 – 297, doi:10.1111/j.1472-4669.2006.00082.x.
�������������������������T. J. Algeo, Department of Geology, Univer-
sity of Cincinnati, 500 Geology/Physics Build-ing, Cincinnati, OH 45221-0013, USA.R. J. Howarth, Q. Li, and J. M. McArthur,
Department of Earth and Planetary Sciences,University College London, Gower Street, Lon-don WC1E 6BT, UK. ([email protected])B. van de Schootbrugge, Institute of Geos-
ciences, Goethe University Frankfurt, Altenho-ferallee 1, D-60438 Frankfurt amMain, Germany.
PA4217 MCARTHUR ET AL.: TOARCIAN BLACK SHALES AND BASIN RESTRICTION