RESEARCH ARTICLE Characteristics and turnover of exopolymeric substances in a hypersaline microbial mat Olivier Braissant 1 , Alan W. Decho 2 , Kristen M. Przekop 1 , Kimberley L. Gallagher 1 , Christina Glunk 3 , Christophe Dupraz 1 & Pieter T. Visscher 1 1 Center for Integrative Geosciences, University of Connecticut, Storrs, CT, USA; 2 Arnold School of Public Health, University of South Carolina, Columbia, SC, USA; and 3 Institut de G ´ eologie et d’Hydrog ´ eologie, University of Neucha ˆ tel, Neucha ˆ tel, Switzerland Correspondence: Pieter T. Visscher, Center for Integrative Geosciences, University of Connecticut, U-2045, Storrs, CT 06269- 2045, USA. Tel.: 11 860 405 9159; fax: 11 860 405 9153; e-mail: [email protected]Received 5 June 2008; revised 28 August 2008; accepted 17 September 2008. First published online 27 November 2008. DOI:10.1111/j.1574-6941.2008.00614.x Editor: Patricia Sobecky Keywords exopolymeric substances (EPS); microbial mat; calcium carbonate precipitation; glucosidase activity. Abstract The properties and microbial turnover of exopolymeric substances (EPS) were measured in a hypersaline nonlithifying microbial mat (Eleuthera, Bahamas) to investigate their potential role in calcium carbonate (CaCO 3 ) precipitation. Depth profiles of EPS abundance and enzyme activities indicated that c. 80% of the EPS were turned over in the upper 15–20 mm. Oxic and anoxic mat homogenates amended with low-molecular-weight (LMW) organic carbon, sugar monomers, and different types of EPS revealed rapid consumption of all substrates. When comparing the consumption of EPS with that of other substrates, only marginally longer lag times and lower rates were observed. EPS (5–8%) were readily consumed during the conversion of labile to refractory EPS. This coincided with a decrease in glucosidase activity and a decrease in the number of acidic functional groups on the EPS. Approximately half of the calcium bound to the EPS remained after 10 dialyses steps. This tightly bound calcium was readily available to precipitate as CaCO 3 . We present a conceptual model in which LMW organic carbon complexed with the tightly bound calcium is released upon enzyme activity. This increases alkalinity and creates binding sites for carbonate and allows CaCO 3 to precipitate. Therefore, this model explains interactions between EPS and CaCO 3 precipitation, and underscores the critical role of aerobic and anaerobic microorganisms in early diagenesis and lithification processes. Introduction In many environments, microorganisms are associated with biofilms, which are comprised of exopolymeric sub- stances (EPS) (Sutherland, 2001a). By producing these EPS, microorganisms engineer their immediate environ- ment with respect to many physicochemical characteristics (Costerton et al., 1987, 1995). The EPS are mainly com- prised of polysaccharides, but also include noncarbohy- drate moieties such as pyruvate and succinate, as well as inorganic functional groups such as sulfate or phosphate (Sutherland, 2001a–d). In microbial mats, which are orga- nosedimentary biofilm communities and analogs of the earliest life on Earth (Riding & Awramik, 2000), the EPS provide an important cohesive matrix where many biogeo- chemical reactions take place (Stal et al., 1985; Stolz, 2000). In siliciclastic environments, the physical properties of the gel-like cohesive matrix of the EPS may produce microbially induced sedimentary structures, or MISS (Noffke et al., 2003), which are preserved in the rock record (Tice, 2008). However, in carbonate sediments forming modern stromatolites, the focus has been on the chemical properties of the EPS (Kawaguchi & Decho, 2002a, b). Notably, the functional groups within the EPS produced by microbial isolates from microbial mats and biofilms have a high affinity for calcium and other metals (Perry et al., 2005; Braissant et al., 2007; Ortega-Morales et al., 2007). As a consequence, even under slightly supersatu- rated conditions with respect to calcium carbonate (CaCO 3 ), this cation-binding capacity may initially inhibit CaCO 3 precipitation (Braissant et al., 2007). It has been hypothesized that CaCO 3 precipitation requires sequential FEMS Microbiol Ecol 67 (2009) 293–307 c 2008 Federation of European Microbiological Societies Published by Blackwell Publishing Ltd. All rights reserved
Transcript
R E S E A R C H A R T I C L E
Characteristics and turnoverof exopolymeric substances inahypersalinemicrobialmatOlivier Braissant1, Alan W. Decho2, Kristen M. Przekop1, Kimberley L. Gallagher1, Christina Glunk3,Christophe Dupraz1 & Pieter T. Visscher1
1Center for Integrative Geosciences, University of Connecticut, Storrs, CT, USA; 2Arnold School of Public Health, University of South Carolina, Columbia,
SC, USA; and 3Institut de Geologie et d’Hydrogeologie, University of Neuchatel, Neuchatel, Switzerland
The properties and microbial turnover of exopolymeric substances (EPS) were
measured in a hypersaline nonlithifying microbial mat (Eleuthera, Bahamas) to
investigate their potential role in calcium carbonate (CaCO3) precipitation. Depth
profiles of EPS abundance and enzyme activities indicated that c. 80% of the EPS
were turned over in the upper 15–20 mm. Oxic and anoxic mat homogenates
amended with low-molecular-weight (LMW) organic carbon, sugar monomers,
and different types of EPS revealed rapid consumption of all substrates. When
comparing the consumption of EPS with that of other substrates, only marginally
longer lag times and lower rates were observed. EPS (5–8%) were readily
consumed during the conversion of labile to refractory EPS. This coincided with
a decrease in glucosidase activity and a decrease in the number of acidic
functional groups on the EPS. Approximately half of the calcium bound to the
EPS remained after 10 dialyses steps. This tightly bound calcium was readily
available to precipitate as CaCO3. We present a conceptual model in which LMW
organic carbon complexed with the tightly bound calcium is released upon
enzyme activity. This increases alkalinity and creates binding sites for carbonate
and allows CaCO3 to precipitate. Therefore, this model explains interactions
between EPS and CaCO3 precipitation, and underscores the critical role of
aerobic and anaerobic microorganisms in early diagenesis and lithification
processes.
Introduction
In many environments, microorganisms are associated
with biofilms, which are comprised of exopolymeric sub-
stances (EPS) (Sutherland, 2001a). By producing these
EPS, microorganisms engineer their immediate environ-
ment with respect to many physicochemical characteristics
(Costerton et al., 1987, 1995). The EPS are mainly com-
prised of polysaccharides, but also include noncarbohy-
drate moieties such as pyruvate and succinate, as well as
inorganic functional groups such as sulfate or phosphate
(Sutherland, 2001a–d). In microbial mats, which are orga-
nosedimentary biofilm communities and analogs of the
earliest life on Earth (Riding & Awramik, 2000), the EPS
provide an important cohesive matrix where many biogeo-
chemical reactions take place (Stal et al., 1985; Stolz, 2000).
In siliciclastic environments, the physical properties of
the gel-like cohesive matrix of the EPS may produce
microbially induced sedimentary structures, or MISS
(Noffke et al., 2003), which are preserved in the rock record
(Tice, 2008). However, in carbonate sediments forming
modern stromatolites, the focus has been on the chemical
properties of the EPS (Kawaguchi & Decho, 2002a, b).
Notably, the functional groups within the EPS produced
by microbial isolates from microbial mats and biofilms
have a high affinity for calcium and other metals (Perry
et al., 2005; Braissant et al., 2007; Ortega-Morales et al.,
2007). As a consequence, even under slightly supersatu-
rated conditions with respect to calcium carbonate
(CaCO3), this cation-binding capacity may initially inhibit
CaCO3 precipitation (Braissant et al., 2007). It has been
hypothesized that CaCO3 precipitation requires sequential
FEMS Microbiol Ecol 67 (2009) 293–307 c� 2008 Federation of European Microbiological SocietiesPublished by Blackwell Publishing Ltd. All rights reserved
heterotrophic bacterial degradation of EPS to release
calcium and increase carbonate alkalinity (Dupraz &
Visscher, 2005).
Several studies have focused on degradation of EPS
(Sutherland, 1995, 1999; Hashimoto et al., 1998; Nankai
et al., 1999), but few have been carried out in natural
systems. Experiments using H14CO3� to label cyanobacterial
EPS in intact stromatolites suggest that the labile part of this
freshly produced polymer is rapidly modified by hetero-
trophic bacteria to leave a more refractory polymer (Decho
et al., 2005). This refractory material accumulates in the
environment, where it is subject to very slow chemical
modification and microbial breakdown. When added to
marine sediment and lacustrine water samples, 14C-labeled
EPS was also degraded rapidly (Henrichs & Doyle, 1986;
Weaver & Hicks, 1995). Moreover, all of these studies
recovered only a fraction of the labeled polymers as 14CO2
(10–40%; i.e. representing the labile fraction), suggesting
that the remaining polymer is more resistant to degradation.
The amendment of xanthan, a commercially produced EPS,
to marine sediment slurries enhanced the activity of sulfate-
reducing bacteria [SRB; Battersby et al. (1984)]. This
stimulation was attributed to a combination of initial
xanthan degradation by fermenters releasing low-molecu-
lar-weight (LMW) organic acids and alcohol (Anderson
et al., 1987).
The degradation of EPS will alter its physicochemical
properties such as pH buffering and calcium binding,
thereby influencing CaCO3 precipitation processes in mats.
This study focuses on the amount, the characteristics,
and distribution of the natural EPS in a hypersaline micro-
bial mat that supports CaCO3 precipitation. In order to
investigate the role of EPS in precipitation, in this study,
we chemically characterized EPS properties by acid–base
titrations, X-ray photoelectron spectroscopy (XPS), and
Fourier-transform infrared (FT-IR) spectroscopy. The de-
gradation of EPS was studied using hydrolytic enzyme
activities and slurries, and the potential of EPS as a calcium
source to support carbonate mineral precipitation was
investigated in biomineralization experiments (Braissant
et al., 2003; Ercole et al., 2007).
Materials and methods
Site description
Salt Pan (761330W, 251240N) is a hypersaline lake, located
3 km north of Gregory Town, Eleuthera, Bahamas (Fig. 1),
which supports a gradient of lithifying, EPS-poor to non-
lithifying, EPS-rich microbial mats (Dupraz et al., 2004).
Both mat types are always submerged, but the lithifying
mats are found close to the shoreline (maximum water
depth 30 cm), whereas the nonlithifying mats are found in
the center of the lake, where the water is deeper (30–75 cm
depth). There is an abrupt transition from the zone of
lithifying to the zone of nonlithifying mats, possibly deter-
mined by the light regime (Dupraz et al., 2004). The
microbial communities in the mats were described pre-
viously (Baumgartner, 2006; Baumgartner et al., 2006). The
salinity varies between 40 and 150 p.p.t., and the pH ranges
from 8 to 9. The water temperature averages are 22 and
30 1C, in winter and in summer, respectively (Baumgartner,
2006). The water column in this lake is well mixed due to
wind-driven circulation and diel thermal turnover of the
water column. The maximum light intensity ranges from
38–88 mE m�2 s�1 at the surface of the nonlithifying mats to
112–193 mE m�2 s�1 at the surface of the lithifying mats. The
lithifying mats contain only a thin film (i.e. less than a
millimeter) of EPS on top of the crust. The EPS extraction
and purification procedures used in this investigation did
not yield sufficient amounts of EPS for the analyses. There-
fore, in this study, we focused on the EPS-rich nonlithifying
systems.
Geochemical properties of nonlithifying mats
Nonlithifying mat samples were taken about 25 m from the
shore, where the water depth was about 40 cm. The intensity
of photosynthetically active radiation was measured with a
Licor LI-250 meter equipped with an underwater quantum
sensor (LI-192). The salinity was determined using a hand-
held refractometer (Fisher Scientific) and the water tem-
perature and pH were determined using a hand-held meter
(Hannah HI 9024). The mat samples were incubated at
Fig. 1. Sampling site location of Salt Pan,
Eleuthera, Bahamas.
FEMS Microbiol Ecol 67 (2009) 293–307c� 2008 Federation of European Microbiological SocietiesPublished by Blackwell Publishing Ltd. All rights reserved
were placed in a Thunderdome Tilt-back Pressure Tower
(Spectro-Tech Foundation Series, Thermo-Nicolet Inc.),
which is designed to achieve optimal contact between the
sample and the crystal. This provides an active sampling
area of c. 0.75 mm, with an effective path length of 2.03 mm
at 1000 cm�1 [assuming an average index of refraction (for a
sample) of 1.5 and an angle of incidence of 451]. Absorbance
FEMS Microbiol Ecol 67 (2009) 293–307 c� 2008 Federation of European Microbiological SocietiesPublished by Blackwell Publishing Ltd. All rights reserved
spectra were collected between 4000 and 600 cm�1 at a spectral
resolution of 4 or 8 cm�1, with 64 scans coadded and
averaged. If necessary, baseline corrections were carried out.
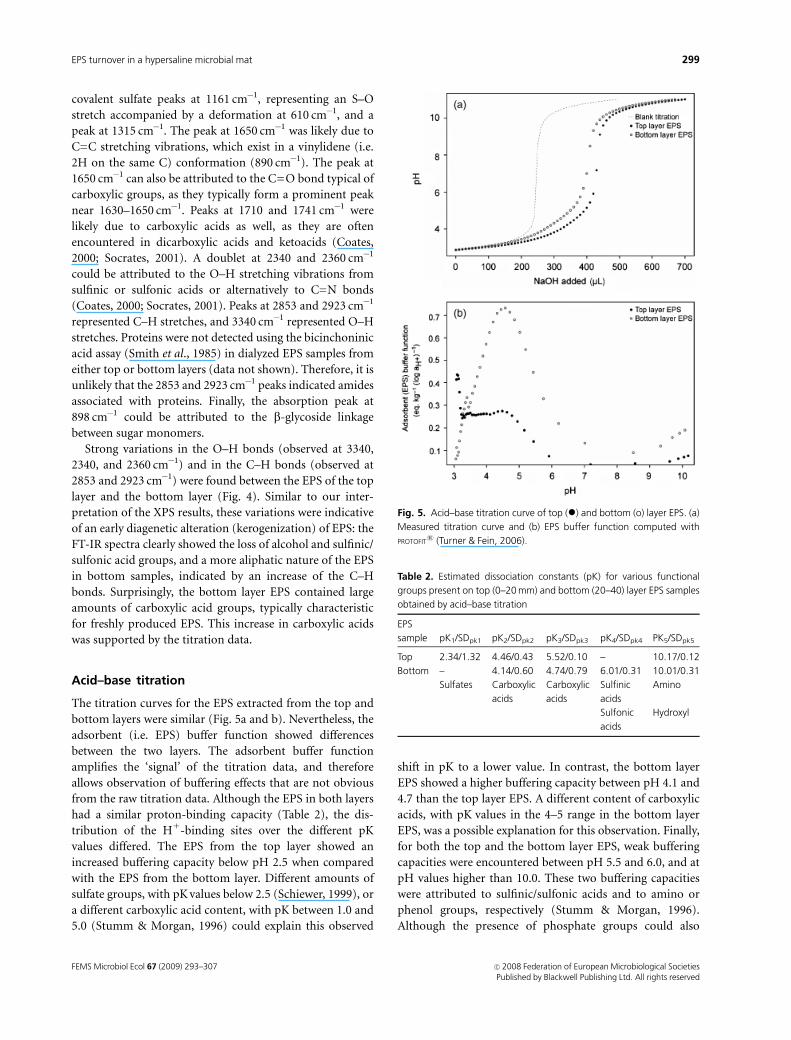
Acid–base titration
The acid–base titration was used to determine the proton-
binding sites and the potential types and densities of the
functional groups present in the EPS. For the acid–base
titration, 2–3 mL of the dialyzed EPS (c. 6.5 mg of dry EPS)
were diluted in 1 mM KCl to obtain a final volume of 40 mL.
KCl was used to adjust ionic strength. The solution was
transferred to an anaerobic chamber (COY Laboratory
Product, Grass Lake, MI) under a nitrogen (98%)–hydrogen
(2%) atmosphere to avoid the dissolution of atmospheric
CO2. The initial pH of the solution was adjusted to 3.0,
which typically required between 30 and 100mL of 1 N HCl.
The solution was titrated with 0.1 N NaOH using 10mL
increments. The pH was recorded with an Orion 720A pH
meter (Orion, Boston, MA) until a pH of 11 was reached. All
reagents were prepared with autoclaved deionized water that
was cooled to room temperature under vacuum to remove all
dissolved CO2. The titration curves obtained were analyzed
using PROTOFIT 2.1 software (Turner & Fein, 2006). For the
analysis, we assumed a four-site, nonelectrostatic model as
recommended for biological surfaces (Turner & Fein, 2006).
Calcium assay
The calcium chloride (CaCl2) assay was carried out to
establish the maximum calcium-binding capacity of the
EPS. This titration was performed according to Shimomura
& Inouye (1996) under a nitrogen (98%)–hydrogen (2%)
atmosphere to avoid ion pairing of calcium with carbonate
resulting from atmospheric CO2 dissolution. Dialyzed EPS
samples were dissolved in a solution containing 40 mM KCl
and 20 mM Tris-OH, which was adjusted to pH 9.0. The
titration was carried out by stepwise addition of a CaCl2solution (0.1 or 1 M) using increments of either 10 or 40mL.
The concentration of free calcium ions was determined with
a calcium ion-selective electrode (Cole-Palmer Instruments,
Vernon Hills, IL) and a calomel reference electrode (Fisher
Scientific) coupled to a high-impedance millivolt meter
(Microscale Measurement, the Netherlands). All reagents
were prepared using autoclaved deionized water that was
allowed to cool to room temperature under vacuum.
Microbial potential of EPS degradation
Reductase activity assay
The reduction of triphenyltetrazolium chloride (TTC) to
triphenylformazan is used as a measure of the total reductase
activity in microbial populations (Relexans, 1996) and has
been applied to microbial mats (Paerl et al., 2001). Mat
samples (2 g) were homogenized and mixed with 2 mL of
0.8% TTC, prepared in 0.1 M Tris buffer containing 600 mM
NaCl at pH 7.6. The samples were incubated for 1–3 h at
30 1C with periodic shaking. Following the incubation, the
samples were centrifuged (3000 g, 10 min) and the pellet was
resuspended in 10 mL of acetone to extract the triphenylfor-
mazan. After 15 min, the concentration of formazan that
was produced was measured spectrophotometrically at
490 nm. The Beer–Lambert law was used to calculate the
concentration of formazan [molar absorption coefficient,
e490 = 15 900 L mol�1 cm�1, Relexans (1996)] released. The
assay was performed using 12 replicates, and blanks were
prepared using samples fixed in glutaraldehyde 1.5% (final
concentration), which were subjected to the same treatment.
Hydrolytic enzymes assay
Microbial degradation of EPS may be facilitated through
hydrolytic enzyme activity (Hashimoto et al., 1998; Nankai
et al., 1999). To measure the hydrolytic activity of a-
glucosidase, b-glucosidase, and b-galactosidase, 2 g of
homogenized mat samples were placed to 3 mL of Z-buffer
(600 mM NaCl, 60 mM Na2HPO4, 40 mM NaH2PO4 �H2O,
10 mM KCl, 1 mM MgSO4 � 7H2O, and 2 mM b-mercap-
toethanol, pH 7.0) to which 50 mL of sodium dodecyl sulfate
0.1% and 100mL of chloroform were added. The tubes were
shaken vigorously and allowed to react for 5 min. Subse-
quently, 200 mL of substrate (13 mM o-nitrophenyl-b-D-
galactoside, 13 mM o-nitrophenyl-b-D-glucoside, and 13 mM
o-nitrophenyl-a-D-glucoside) was added and the samples
were incubated at 30 1C, while being shaken periodically.
After 5–8 h, samples were centrifuged (3000 g, 10 min) and
the absorbance of the supernatant was measured at 420 nm.
The Beer–Lambert law was used to calculate the concentra-
tion of o-nitrophenol [molar absorption coefficient,
e420 = 4580 L mol�1 cm�1, Stolle-Smits et al. (1999)] released
and consequently the activity. Three, three, and nine repli-
cates were used for the a-glucosidase assay, b-glucosidase,
and b-galactosidase, respectively. Blanks were prepared using
samples fixed in glutaraldehyde 1.5% (final concentration),
which were subjected to the same treatment.
Slurry experiments
Microbial mats were homogenized to determine the poten-
tial respiration rates supported by a range of electron donors
(Visscher et al., 1998, 1999, 2002; Decho et al., 2005). We
compared slurries prepared from lithifying and nonlithify-
ing mats and measured the potential EPS turnover under
oxic and anoxic conditions in relation to other electron
donors. Nonlithifying mat slurries were prepared from
FEMS Microbiol Ecol 67 (2009) 293–307c� 2008 Federation of European Microbiological SocietiesPublished by Blackwell Publishing Ltd. All rights reserved
slurries, respectively. Lithifying mat slurries were prepared
from the entire (c. 10 mm) mat sample. Sediments were
mixed (1 : 1 v/v) with filtered seawater amended with NaCl
to 90 p.p.t. The slurries were preincubated for 24–36 h to
remove labile carbon, after which the endogenous respira-
tion rates were determined. Aerobic respiration rates were
measured as the oxygen consumption over time using an
oxygen microelectrode and anaerobic respiration as the
sulfide production over time using a sulfide microelectrode
(Visscher et al., 1998, 2002). Sulfide production results from
sulfate reduction, which is considered the dominant anae-
robic pathway in mats (Troelsen & Jørgensen, 1982; Canfield
& DesMarais, 1991; Baumgartner et al., 2006). Slurry
aliquots completely filled a 36-mL gas-tight incubation
vessel under stirred conditions. Electron donors (acetate,
lactate, ethanol, glucose, mannose, and xylose) were sup-
plied at final concentrations of 69 mM, and the exopolymers
used included xanthan, EPS isolated from Desulfobacterium
autotrophicum, EPS isolated from a Desulfovibrio strain
LM-1 isolated from the lithifying mat of Salt Pan (Braissant
et al., 2007), and nonlithifying mat EPS from the surface
20 mm. The EPS amendments equaled c. 20 mg of EPS. All
of the rate measurements were corrected for the endogen-
ous respiration rates. The amount of carbon oxidized was
estimated from the oxygen consumed (or S2� produced)
using an average oxidation state of zero for carbon, accord-
ing to
CH2OþO2 ! CO2 þH2O ð1Þand
2CH2Oþ SO42� ! 2CO2 þ S2� þ 2H2O; ð2Þ
respectively. All slurry amendments were replicated three to
five times.
Carbonate mineral precipitation potentialof EPS
Biomineralization experiments were conducted to deter-
mine whether calcium bound to the EPS could support
CaCO3 precipitation. Previous studies indicated that a large
amount of cations (especially calcium and magnesium)
remain associated with natural EPS even after several
dialysis steps (Somers & Brown, 1978). Therefore, no
cations were added in the solution for this experiment.
Dialyzed EPS was placed in six-well plates (3 mg in each
well), and deionized water was added to a final volume of
4 mL. The plate was placed in a closed desiccator containing
5 g of (NH4)2CO3. Slow decomposition of the (NH4)2CO3
into CO2 and NH3 and further dissolution of these gases
into the EPS solution led to an increase in pH and to
formation of carbonate ions and subsequent precipitation
of minerals. The precipitation reaction was allowed to
proceed for 5 days. The crystals formed were recovered by
filtration. To prevent the recrystallization of ammonium
carbonate, filters were rapidly washed with 0.2 mL of DI
water (pH adjusted to 9.5 to prevent CaCO3 crystal dissolu-
tion). A part of the filter was cut and mounted on a
specimen holder, sputtered with gold, and observed in a
LEO/Zeiss DSM 982 Gemini field emission scanning elec-
tron microscope (SEM). Xanthan, used as a calcium-free
control, did not support precipitation after 5 days of
incubation.
Results
Geochemical depth profiles in nonlithifyingmats
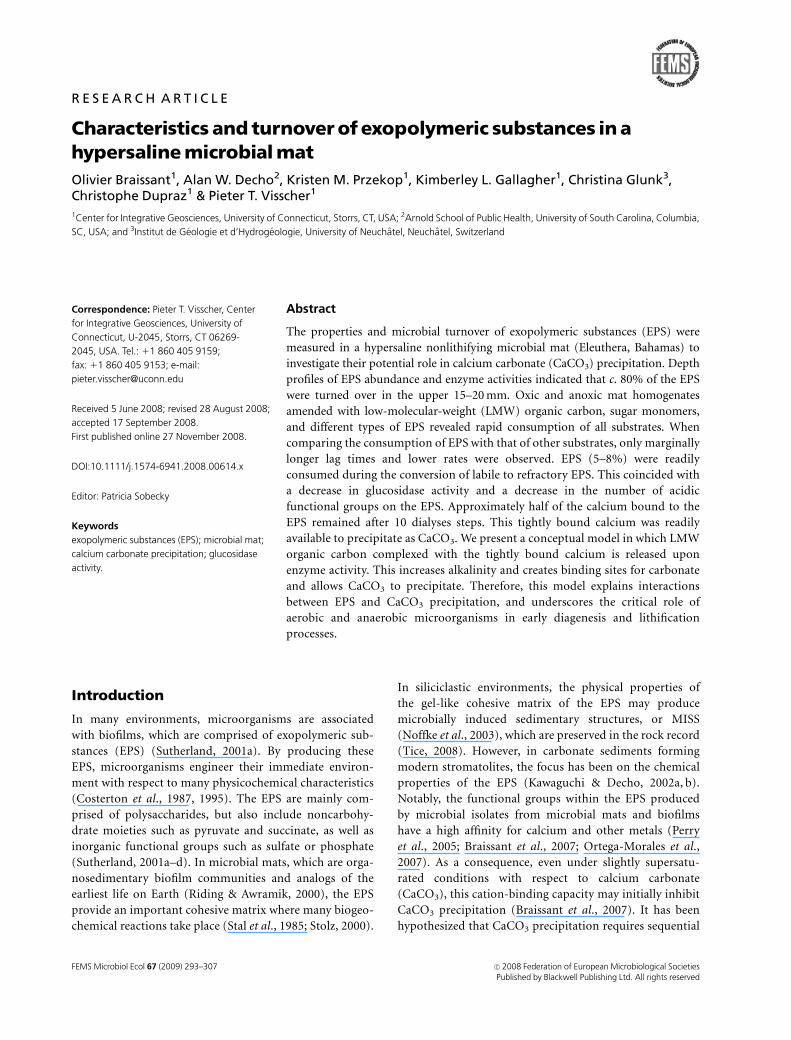
The oxygen concentration increased with depth and peaked
at 4–6 mm below the mat surface. The observed maximum
values corresponded with c. 160–170% saturation, which
confirmed earlier observations made at the opposite side of
the lake (Dupraz et al., 2004). A typical oxygen depth profile
is given in Fig. 2c. The depth of oxygen penetration was
16–19 mm, which suggested that aerobic respiration could
take place until this depth. The majority of the enzyme
activities were also associated with this layer.
Physicochemical properties and abundance ofEPS
The amount of EPS in the mat measured by the phenol–-
sulfuric acid assay showed a relatively constant distribution
in the top 15 mm [c. 104 mg EPS g�1 dry weight (DW)
sediment], after which it decreased fivefold (Fig. 2a). The
values determined by the Alcian Blue method increased
from 7.7� 103mg EPS g�1 DW at the surface to a peak at the
10–15 mm horizon (2.25� 104 mg EPS g�1 DW), and de-
creased to a third at deeper layers (Fig. 2b).
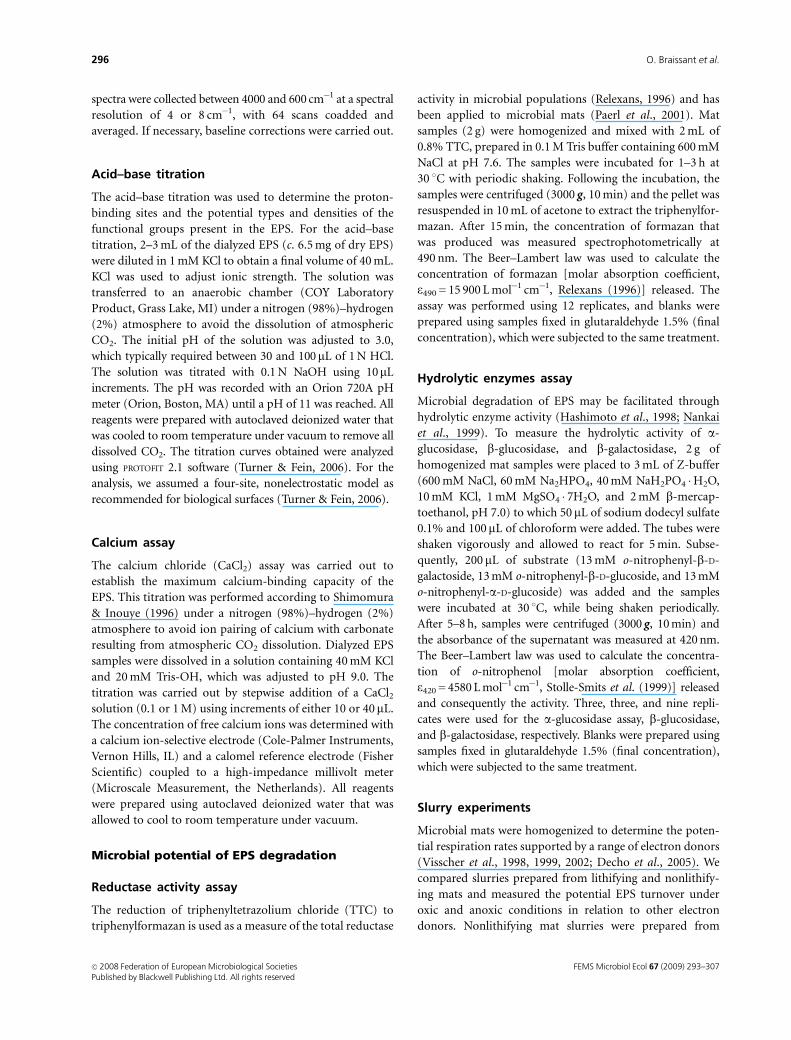
XPS
XPS analyses of the top and bottom EPS layers showed a
very similar elemental composition of the two depth hor-
izons (Fig. 3 and Table 1): C, O, N, and S were present in
similar atomic percentages. In addition, both XPS spectra
showed a calcium peak, which indicated that calcium
represents c. 1% of the total atoms in the EPS. The C : O
ratio increased from 2.19 in the top layer to 2.33 in the
bottom layer of the EPS. This increase with depth, although
minor, may be indicative of an early stage in the degradation
(i.e. kerogenization) process.
FEMS Microbiol Ecol 67 (2009) 293–307 c� 2008 Federation of European Microbiological SocietiesPublished by Blackwell Publishing Ltd. All rights reserved
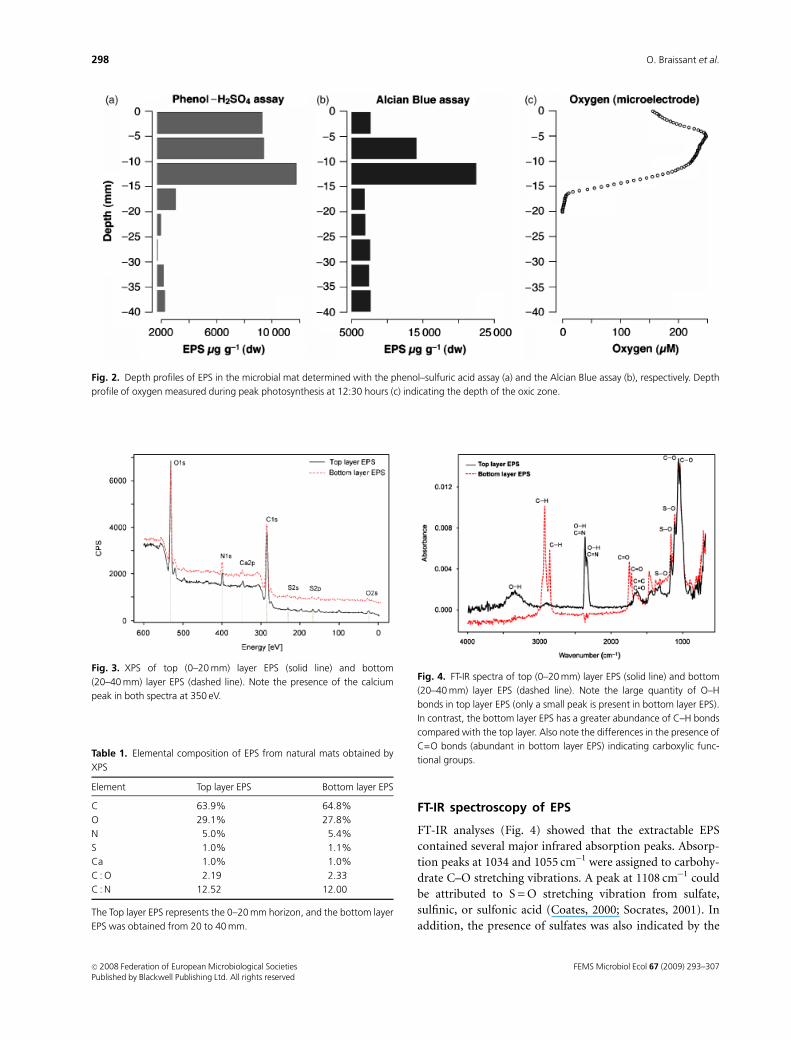
FT-IR analyses (Fig. 4) showed that the extractable EPS
contained several major infrared absorption peaks. Absorp-
tion peaks at 1034 and 1055 cm�1 were assigned to carbohy-
drate C–O stretching vibrations. A peak at 1108 cm�1 could
be attributed to S = O stretching vibration from sulfate,
sulfinic, or sulfonic acid (Coates, 2000; Socrates, 2001). In
addition, the presence of sulfates was also indicated by the
Fig. 2. Depth profiles of EPS in the microbial mat determined with the phenol–sulfuric acid assay (a) and the Alcian Blue assay (b), respectively. Depth
profile of oxygen measured during peak photosynthesis at 12:30 hours (c) indicating the depth of the oxic zone.
Fig. 3. XPS of top (0–20 mm) layer EPS (solid line) and bottom
(20–40 mm) layer EPS (dashed line). Note the presence of the calcium
peak in both spectra at 350 eV.
Table 1. Elemental composition of EPS from natural mats obtained by
XPS
Element Top layer EPS Bottom layer EPS
C 63.9% 64.8%
O 29.1% 27.8%
N 5.0% 5.4%
S 1.0% 1.1%
Ca 1.0% 1.0%
C : O 2.19 2.33
C : N 12.52 12.00
The Top layer EPS represents the 0–20 mm horizon, and the bottom layer
EPS was obtained from 20 to 40 mm.
Fig. 4. FT-IR spectra of top (0–20 mm) layer EPS (solid line) and bottom
(20–40 mm) layer EPS (dashed line). Note the large quantity of O–H
bonds in top layer EPS (only a small peak is present in bottom layer EPS).
In contrast, the bottom layer EPS has a greater abundance of C–H bonds
compared with the top layer. Also note the differences in the presence of
C=O bonds (abundant in bottom layer EPS) indicating carboxylic func-
tional groups.
FEMS Microbiol Ecol 67 (2009) 293–307c� 2008 Federation of European Microbiological SocietiesPublished by Blackwell Publishing Ltd. All rights reserved
FEMS Microbiol Ecol 67 (2009) 293–307 c� 2008 Federation of European Microbiological SocietiesPublished by Blackwell Publishing Ltd. All rights reserved
activity (n = 3); and (d) b-galactosidate activity
(n = 9).
Table 3. Oxygen consumption and sulfide production in microbial mat
homogenates determined upon amendment of various electron donors
dO2/dt� SD
(mM min�1) n
Cox
(mmol)
Lag time
(min)
TOP layer aerobic respiration
Endogenous 7.3� 0.9 5 0.83 0.00
Acetate 23.6� 2.7 4 2.48 0.25
Lactate 20.5� 3.4 4 3.72 0.50
Ethanol 24.1� 4.6 3 2.48 0.25
Glucose 34.4� 3.6 3 7.44 0.75
Xylose 31.6� 3.8 3 6.82 1.00
Mannose 34.5� 4.0 3 6.23 0.75
Site EPS 13.1� 2.1 4 1.13 1.75
D. autotrophicum EPS 4.4� 0.8 3 0.43 3.75
Xanthan 3.4� 0.6 3 0.34 3.00
Desulfovibrio EPS 8.3� 1.3 4 0.94 3.00
Bottom layer aerobic respiration
Endogenous 6.4� 0.8 5 0.66 0.00
Acetate 25.7� 2.5 4 2.48 0.00
Lactate 20.5� 1.1 4 3.72 0.00
Ethanol 24.1� 4.6 3 2.48 0.00
Glucose 30.8� 1.7 3 6.82 0.75
Xylose 28.7� 1.3 3 6.82 1.00
Mannose 27.1� 1.3 3 6.23 1.00
Site EPS 11.8� 1.2 4 1.08 2.00
D. autotrophicum EPS 4.7� 1.7 3 0.67 4.00
Xanthan 3.0� 1.2 3 0.26 3.50
Desulfovibrio EPS 11.9� 1.7 4 1.42 3.25
dH2S/dt� SD
(mM min�1) n
Cox
(mmol)
Lag time
(min)
TOP layer anaerobic respiration
Endogenous 0.8� 0.4 4 0.42 0.00
Acetate 7.3� 1.0 4 2.48 0.25
Lactate 6.8� 0.7 4 3.72 0.25
Ethanol 5.5� 0.8 3 2.48 0.25
Glucose 3.9� 0.8 3 3.69 1.50
Xylose 3.7� 1.0 3 3.14 3.75
Mannose 3.7� 0.9 3 2.48 3.25
Site EPS 2.1� 0.5 4 0.72 3.25
D. autotrophicum EPS 0.3� 0.3 4 0.29 4.75
Xanthan 0.6� 0.3 4 0.29 4.75
Desulfovibrio EPS 1.5� 0.3 4 0.72 2.50
FEMS Microbiol Ecol 67 (2009) 293–307c� 2008 Federation of European Microbiological SocietiesPublished by Blackwell Publishing Ltd. All rights reserved
300 O. Braissant et al.
approximately five times lower than those of b-glucosidase,
but showed a similar decrease at 2 cm depth (Fig. 6c). The
depth profile of the b-galactosidase activity was very similar
to that for a-glucosidase, with values between 10 and
4mmol g�1 h�1, but a steep decline in activity occurred at
3 cm depth (Fig. 6d).
Slurry experiments
After 24–36 h of incubation, endogenous rates were reduced
to o 10% of the original values, and stimulation of meta-
bolic rates upon addition of various carbon sources could be
measured and corrected for the endogenous respiration
rates. The potential aerobic respiration rates were similar in
slurries prepared from the top and the bottom layers of the
mat (Table 3). Sugar monomers (e.g. glucose, xylose, and
mannose) stimulated aerobic respiration slightly more than
LMW organic carbon (e.g. acetate, lactate, and ethanol), but
the lag time before consumption commenced was shorter
for the LMW organic compounds. The potential rates
observed upon amendment of slurries with various types of
EPS were much lower than for the other electron donors,
but the values remained well above the endogenous rates.
Likewise, the lag phase before consumption started was also
the longest for the various types of EPS. The EPS obtained
from nonlithifying mats in Salt Pan and an SRB isolate from
this lake stimulated the aerobic respiration twice as much as
did nonendogenous types of EPS (xanthan, D. autotrophi-
cum EPS).
The combined action of fermenters and sulfate reducers
was represented by the sulfide production (i.e. anaerobic
respiration) rates. As observed in the aerobic rate measure-
ments, the anaerobic respiration rates were also similar in
the top and the bottom layer slurries. Potential anaerobic
respiration rates were lower than potential aerobic
rates (Table 3), even when considering that twice the
amount of electron donor is used in sulfide production
[Eqn. (2)] compared with oxygen consumption
[Eqn. (1)]. In contrast to aerobic respiration, anaerobic
slurries were stimulated more by LMW organic compounds
(i.e. fermentation products) than by sugar monomers. The
lag phase, before sugar and EPS consumption started, was
longer in the anoxic slurry experiments than in the oxic
incubations.
The amount of oxygen consumed and sulfide produced
were used [Eqns (1) and (2), respectively] to determine the
amount of carbon consumed upon addition of various
electron donors (Table 3). We assumed an average carbon
oxidation state of zero for acetate, lactate, sugar monomers,
and EPS and an average carbon oxidation state of � 2
for ethanol. LMW organic compounds were oxidized
completely under both oxic and anoxic conditions.
However, monomeric sugars were consumed completely
only during aerobic respiration: in anaerobic respiration
experiments, c. 40–50% remained when the rates returned
to endogenous values. Interestingly, the amount of
EPS-carbon oxidized under anoxic conditions was close to
two-thirds of the amount used under oxic conditions.
Estimates of the fraction of EPS readily supporting respira-
tion were c. 8% and 5%, for aerobic and anaerobic con-
sumption, respectively.
Carbonate mineral precipitation potentialof EPS
CaCO3 precipitated in all of the EPS solutions within 5 days,
without the addition of calcium. Formation of bubbles was
observed using light microscopy when HCl 0.1 N was added
to the crystals, indicating their carbonate nature. Crystals
formed in the top and the bottom layer EPS solutions had
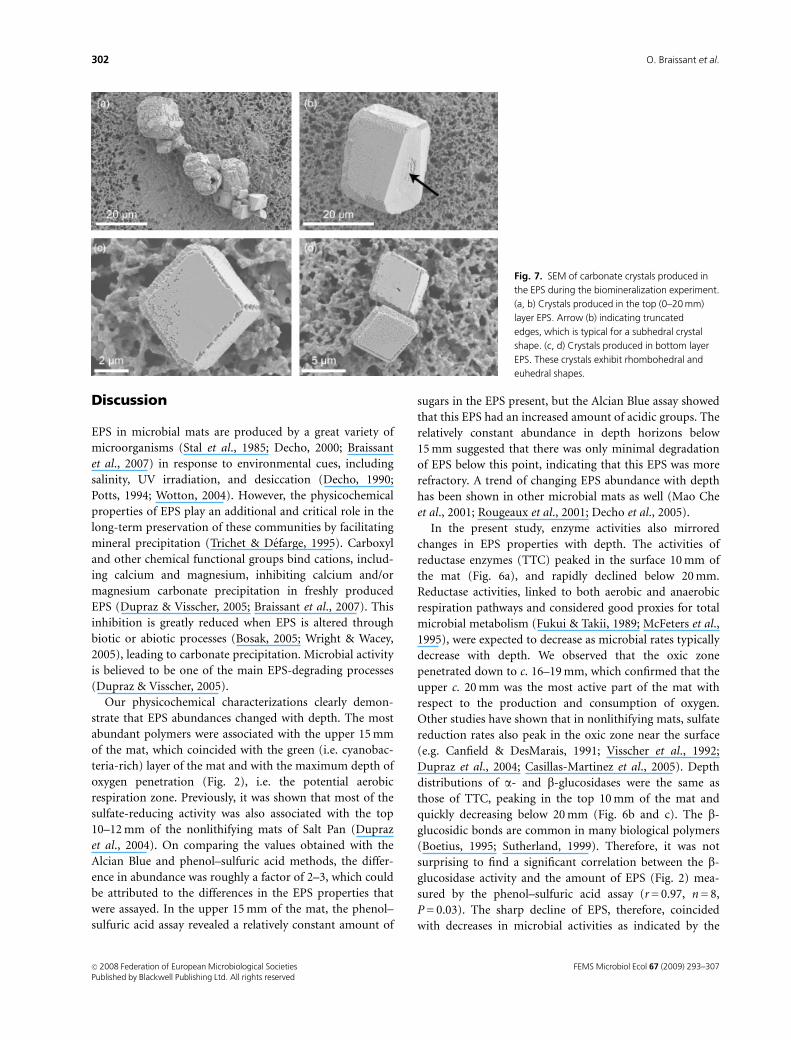
different morphologies (Fig. 7). Crystals produced in the
top layer EPS consisted of mostly rounded, smoothed, and
truncated rhombs measuring between 10 and 20 mm. Some
spherulites were also found. In contrast, the bottom layer
EPS produced only rhombohedra measuring between 5 and
10 mm.
Table 3. Continued.
dH2S/dt� SD
(mM min�1) n
Cox
(mmol)
Lag time
(min)
Bottom layer aerobic respiration
Endogenous 0.5� 0.2 4 0.34 0.00
Acetate 5.9� 1.7 4 2.48 0.00
Lactate 6.0� 2.8 4 3.72 0.25
Ethanol 6.0� 1.7 3 2.48 0.25
Glucose 3.5� 0.7 3 3.14 1.50
Xylose 3.7� 1.0 3 3.14 4.00
Mannose 3.6� 0.5 3 1.88 4.25
Site EPS 2.3� 1.1 4 0.68 3.00
D. autotrophicum EPS 0.3� 0.1 4 0.25 5.50
Xanthan 0.4� 0.3 4 0.25 5.00
Desulfovibrio EPS 1.4� 0.5 4 0.44 2.25
O2 consumption represents aerobic respiration, and sulfide production is
a measure of anaerobic respiration (Visscher et al., 1998). The rate
measurements upon substrate additions were corrected for the endo-
genous rates. Average rates �1 SD are given for the top (0–20 mm) and
bottom (20–40 mm) layers of the mat. Cox represents the amount of
carbon oxidized before the rates returned to endogenous values. Lag
time represents the elapsed time between electron donor addition and
start of oxygen uptake/sulfide production.
Site EPS was purified from the upper layer of the nonlithifying mat;
Desulfobacterium autotrophicum and Desulfovibrio EPS (previously
strain LM-1; Braissant et al., 2007) were obtained from pure cultures of
sulfate-reducing bacteria.
FEMS Microbiol Ecol 67 (2009) 293–307 c� 2008 Federation of European Microbiological SocietiesPublished by Blackwell Publishing Ltd. All rights reserved
301EPS turnover in a hypersaline microbial mat
Discussion
EPS in microbial mats are produced by a great variety of
microorganisms (Stal et al., 1985; Decho, 2000; Braissant
et al., 2007) in response to environmental cues, including
salinity, UV irradiation, and desiccation (Decho, 1990;
Potts, 1994; Wotton, 2004). However, the physicochemical
properties of EPS play an additional and critical role in the
long-term preservation of these communities by facilitating
mineral precipitation (Trichet & Defarge, 1995). Carboxyl
and other chemical functional groups bind cations, includ-
ing calcium and magnesium, inhibiting calcium and/or
magnesium carbonate precipitation in freshly produced
EPS (Dupraz & Visscher, 2005; Braissant et al., 2007). This
inhibition is greatly reduced when EPS is altered through
biotic or abiotic processes (Bosak, 2005; Wright & Wacey,
2005), leading to carbonate precipitation. Microbial activity
is believed to be one of the main EPS-degrading processes
strate that EPS abundances changed with depth. The most
abundant polymers were associated with the upper 15 mm
of the mat, which coincided with the green (i.e. cyanobac-
teria-rich) layer of the mat and with the maximum depth of
oxygen penetration (Fig. 2), i.e. the potential aerobic
respiration zone. Previously, it was shown that most of the
sulfate-reducing activity was also associated with the top
10–12 mm of the nonlithifying mats of Salt Pan (Dupraz
et al., 2004). On comparing the values obtained with the
Alcian Blue and phenol–sulfuric acid methods, the differ-
ence in abundance was roughly a factor of 2–3, which could
be attributed to the differences in the EPS properties that
were assayed. In the upper 15 mm of the mat, the phenol–
sulfuric acid assay revealed a relatively constant amount of
sugars in the EPS present, but the Alcian Blue assay showed
that this EPS had an increased amount of acidic groups. The
relatively constant abundance in depth horizons below
15 mm suggested that there was only minimal degradation
of EPS below this point, indicating that this EPS was more
refractory. A trend of changing EPS abundance with depth
has been shown in other microbial mats as well (Mao Che
et al., 2001; Rougeaux et al., 2001; Decho et al., 2005).
In the present study, enzyme activities also mirrored
changes in EPS properties with depth. The activities of
reductase enzymes (TTC) peaked in the surface 10 mm of
the mat (Fig. 6a), and rapidly declined below 20 mm.
Reductase activities, linked to both aerobic and anaerobic
respiration pathways and considered good proxies for total
microbial metabolism (Fukui & Takii, 1989; McFeters et al.,
1995), were expected to decrease as microbial rates typically
decrease with depth. We observed that the oxic zone
penetrated down to c. 16–19 mm, which confirmed that the
upper c. 20 mm was the most active part of the mat with
respect to the production and consumption of oxygen.
Other studies have shown that in nonlithifying mats, sulfate
reduction rates also peak in the oxic zone near the surface
(e.g. Canfield & DesMarais, 1991; Visscher et al., 1992;
Dupraz et al., 2004; Casillas-Martinez et al., 2005). Depth
distributions of a- and b-glucosidases were the same as
those of TTC, peaking in the top 10 mm of the mat and
quickly decreasing below 20 mm (Fig. 6b and c). The b-
glucosidic bonds are common in many biological polymers
(Boetius, 1995; Sutherland, 1999). Therefore, it was not
surprising to find a significant correlation between the b-
glucosidase activity and the amount of EPS (Fig. 2) mea-
sured by the phenol–sulfuric acid assay (r = 0.97, n = 8,
P = 0.03). The sharp decline of EPS, therefore, coincided
with decreases in microbial activities as indicated by the
Fig. 7. SEM of carbonate crystals produced in
the EPS during the biomineralization experiment.
(a, b) Crystals produced in the top (0–20 mm)
layer EPS. Arrow (b) indicating truncated
edges, which is typical for a subhedral crystal
shape. (c, d) Crystals produced in bottom layer
EPS. These crystals exhibit rhombohedral and
euhedral shapes.
FEMS Microbiol Ecol 67 (2009) 293–307c� 2008 Federation of European Microbiological SocietiesPublished by Blackwell Publishing Ltd. All rights reserved
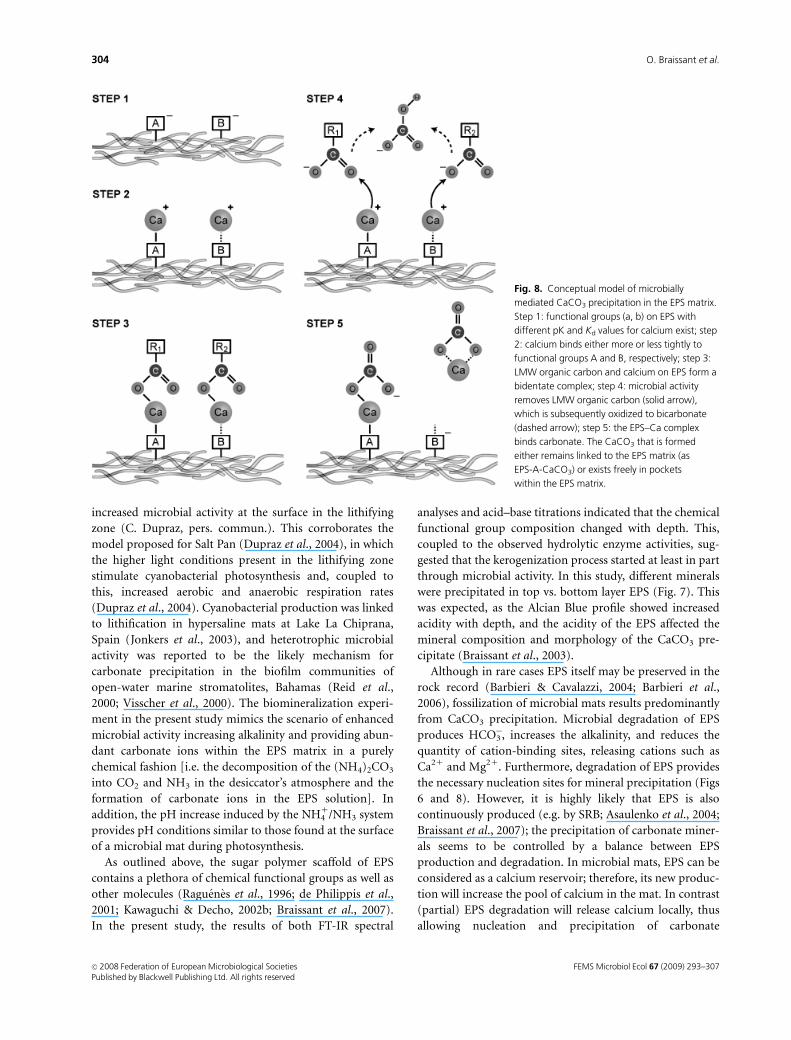
4, dotted arrow), increasing the saturation index and
enabling CaCO3 to precipitate (Fig. 8, step 5), assuming
that the pH conditions allow for carbonate minerals’
stability. Furthermore, if this LMW organic carbon was
indeed the labile EPS fraction, then microbial removal
would result in the formation of nucleation sites or ‘pockets,’
where early precipitation could occur. Finally, depending on
the Kd of a specific functional group (i.e. ‘A,’ ‘B’ in Fig. 8) for
the Ca-EPS, the CaCO3 precipitate appears either associated
with the EPS (Fig. 8, step 5: EPS-A-CaCO3) or free in
pockets within that matrix (Fig. 8, step 5: CaCO3).
When nonlithifying mats were transplanted to the lithify-
ing zone in Salt Pan, the calcium readily (i.e. within months)
precipitated as a thin carbonate crust, most likely because of
FEMS Microbiol Ecol 67 (2009) 293–307 c� 2008 Federation of European Microbiological SocietiesPublished by Blackwell Publishing Ltd. All rights reserved
increased microbial activity at the surface in the lithifying
zone (C. Dupraz, pers. commun.). This corroborates the
model proposed for Salt Pan (Dupraz et al., 2004), in which
the higher light conditions present in the lithifying zone
stimulate cyanobacterial photosynthesis and, coupled to
this, increased aerobic and anaerobic respiration rates
(Dupraz et al., 2004). Cyanobacterial production was linked
to lithification in hypersaline mats at Lake La Chiprana,
Spain (Jonkers et al., 2003), and heterotrophic microbial
activity was reported to be the likely mechanism for
carbonate precipitation in the biofilm communities of
open-water marine stromatolites, Bahamas (Reid et al.,
2000; Visscher et al., 2000). The biomineralization experi-
ment in the present study mimics the scenario of enhanced
microbial activity increasing alkalinity and providing abun-
dant carbonate ions within the EPS matrix in a purely
chemical fashion [i.e. the decomposition of the (NH4)2CO3
into CO2 and NH3 in the desiccator’s atmosphere and the
formation of carbonate ions in the EPS solution]. In
addition, the pH increase induced by the NH41/NH3 system
provides pH conditions similar to those found at the surface
of a microbial mat during photosynthesis.
As outlined above, the sugar polymer scaffold of EPS
contains a plethora of chemical functional groups as well as
other molecules (Raguenes et al., 1996; de Philippis et al.,
2001; Kawaguchi & Decho, 2002b; Braissant et al., 2007).
In the present study, the results of both FT-IR spectral
analyses and acid–base titrations indicated that the chemical
functional group composition changed with depth. This,
coupled to the observed hydrolytic enzyme activities, sug-
gested that the kerogenization process started at least in part
through microbial activity. In this study, different minerals
were precipitated in top vs. bottom layer EPS (Fig. 7). This
was expected, as the Alcian Blue profile showed increased
acidity with depth, and the acidity of the EPS affected the
mineral composition and morphology of the CaCO3 pre-
cipitate (Braissant et al., 2003).
Although in rare cases EPS itself may be preserved in the
rock record (Barbieri & Cavalazzi, 2004; Barbieri et al.,
2006), fossilization of microbial mats results predominantly
from CaCO3 precipitation. Microbial degradation of EPS
produces HCO3�, increases the alkalinity, and reduces the
quantity of cation-binding sites, releasing cations such as
Ca21 and Mg21. Furthermore, degradation of EPS provides
the necessary nucleation sites for mineral precipitation (Figs
6 and 8). However, it is highly likely that EPS is also
continuously produced (e.g. by SRB; Asaulenko et al., 2004;
Braissant et al., 2007); the precipitation of carbonate miner-
als seems to be controlled by a balance between EPS
production and degradation. In microbial mats, EPS can be
considered as a calcium reservoir; therefore, its new produc-
tion will increase the pool of calcium in the mat. In contrast
(partial) EPS degradation will release calcium locally, thus
allowing nucleation and precipitation of carbonate
Fig. 8. Conceptual model of microbially
mediated CaCO3 precipitation in the EPS matrix.
Step 1: functional groups (a, b) on EPS with
different pK and Kd values for calcium exist; step
2: calcium binds either more or less tightly to
functional groups A and B, respectively; step 3:
LMW organic carbon and calcium on EPS form a
bidentate complex; step 4: microbial activity
removes LMW organic carbon (solid arrow),
which is subsequently oxidized to bicarbonate
(dashed arrow); step 5: the EPS–Ca complex
binds carbonate. The CaCO3 that is formed
either remains linked to the EPS matrix (as
EPS-A-CaCO3) or exists freely in pockets
within the EPS matrix.
FEMS Microbiol Ecol 67 (2009) 293–307c� 2008 Federation of European Microbiological SocietiesPublished by Blackwell Publishing Ltd. All rights reserved
signatures: the ‘Biofilm gel effect’. Limnol Oceanogr 48:
431–443.
FEMS Microbiol Ecol 67 (2009) 293–307 c� 2008 Federation of European Microbiological SocietiesPublished by Blackwell Publishing Ltd. All rights reserved
isolated from a ‘‘Kopara’’ mat located in Rangiroa, an atoll of
French Polynesia. Curr Microbiol 49: 145–151.
Reid RP, Visscher PT, Decho AW et al. (2000) The role of
microbes in accretion, lamination and early lithification of
modern marine stromatolites. Nature 406: 991–992.
Relexans JC (1996) Measurements of the respiratory electron
transport system (ETS) activity in marine sediments: state-of-
the-art and interpretation. I. Methodology and review of the
literature data. Mar Ecol Prog Ser 136: 277–287.
FEMS Microbiol Ecol 67 (2009) 293–307c� 2008 Federation of European Microbiological SocietiesPublished by Blackwell Publishing Ltd. All rights reserved
Thompson JA (1998) Formation of lithified micritic laminae
in modern marine stromatolites (Bahamas): the role of sulfur
cycling. Am Mineral 83: 1482–1493.
Visscher PT, Gritzer RF & Leadbetter ER (1999) Low-molecular-
weight sulfonates, a major substrate for sulfate reducers in
marine microbial mats. Appl Environ Microb 65: 3272–3278.
Visscher PT, Surgeon TM, Hoeft SE, Bebout BM, Thompson J Jr
& Reid RP (2002) Microelectrode studies in modern marine
stromatolites: unraveling the earth’s past? Environmental
Electrochemistry: Analyses of Trace Element Biogeochemistry.
American Chemical Society Symposium Series 811 (Taillefert M
& Rozan T, eds), pp. 265–282. Oxford University Press, New
York.
Weaver DT & Hicks RE (1995) Biodegradation of Azotobacter
vinelandii exopolymer by lake Superior microbes. Limnol
Oceanogr 40: 1035–1041.
Wotton RS (2004) The ubiquity and many roles of exopolymers
(EPS) in aquatic systems. Sci Mar 68: 13–21.
Wright DT & Wacey D (2005) Precipitation of dolomite using
sulphate-reducing bacteria from the Coorong Region, South
Australia: significance and implications. Sedimentology 52:
987–1008.
FEMS Microbiol Ecol 67 (2009) 293–307 c� 2008 Federation of European Microbiological SocietiesPublished by Blackwell Publishing Ltd. All rights reserved