Journal of Financial Markets 8 (2005) 400–420 Did decimalization hurt institutional investors? $ Sugato Chakravarty a, , Venkatesh Panchapagesan b , Robert A. Wood c a Purdue University, West Lafayette, IN 47906-1262, USA b Washington University, St. Louis, MO 63130, USA c University of Memphis, Memphis, TN 38152, USA Available online 6 July 2005 Abstract We examine institutional trading costs around the move to penny size ticks in 2001 (i.e., decimalization). We find that overall trading costs declined, with improvements in most partitions across order size, firm size, and manager style. Improvements were most pronounced for orders that were executed over multiple days and for stocks where the minimum tick sizes were likely to have been binding. However, costs did increase for orders executed within a single day. The improvements we document contrast with changes accompanying the reduction of minimum ticks to sixteenths in 1997 though, in both cases, results suggest that more patient traders fare relatively better than those that demand immediacy. r 2005 Elsevier B.V. All rights reserved. JEL classification: G1 Keywords: Decimalization; Institutions; Trading costs; Adverse selection; Sixteenths ARTICLE IN PRESS www.elsevier.com/locate/finmar 1386-4181/$ - see front matter r 2005 Elsevier B.V. All rights reserved. doi:10.1016/j.finmar.2005.05.002 $ We thank an anonymous referee and the editor (Bruce Lehmann) for their detailed comments that led to a significant improvement in the exposition of the paper. We also thank Amber Anand, Mark Carhart, Tarun Chordia, Amy Edwards, Rick Green, Christine Jiang, Tim McCormick, George Sofianos and the seminar participants at NASDAQ, Goldman Sachs, Washington area Finance Conference, and NBER Market Microstructure meetings, for valuable comments. Finally, we thank the Plexus Group, especially Vinod Pakianathan and Wayne Wagner, for providing us with the data and for related conversations. All errors remain our own. Corresponding author. Tel.: +1 765 4946427. E-mail addresses: [email protected] (S. Chakravarty), [email protected](V. Panchapagesan), [email protected] (R.A. Wood).
Transcript
ARTICLE IN PRESS
Journal of Financial Markets 8 (2005) 400–420
1386-4181/$ -
doi:10.1016/j
$We than
to a significan
Tarun Chord
seminar part
Market Micr
Vinod Pakia
All errors rem�CorrespoE-mail ad
(V. Panchapa
www.elsevier.com/locate/finmar
Did decimalization hurt institutional investors?$
Sugato Chakravartya,�, Venkatesh Panchapagesanb,Robert A. Woodc
aPurdue University, West Lafayette, IN 47906-1262, USAbWashington University, St. Louis, MO 63130, USAcUniversity of Memphis, Memphis, TN 38152, USA
Available online 6 July 2005
Abstract
We examine institutional trading costs around the move to penny size ticks in 2001 (i.e.,
decimalization). We find that overall trading costs declined, with improvements in most
partitions across order size, firm size, and manager style. Improvements were most pronounced
for orders that were executed over multiple days and for stocks where the minimum tick sizes
were likely to have been binding. However, costs did increase for orders executed within a
single day. The improvements we document contrast with changes accompanying the reduction
of minimum ticks to sixteenths in 1997 though, in both cases, results suggest that more patient
traders fare relatively better than those that demand immediacy.
S. Chakravarty et al. / Journal of Financial Markets 8 (2005) 400–420 401
1. Introduction
Beginning January 29, 2001, the New York Stock Exchange started quoting andtrading all its listed issues in increments of a penny rather than in increments of asixteenth of a dollar (a move commonly referred to as ‘decimalization’). The effect ofa reduction in tick size on liquidity and trading costs for investors has been a matterof much debate among academics, practitioners and regulators. While several studiesshow that quoted and effective spreads are significantly lowered following areduction in tick size, there is only one study that examines directly the effect of atick size reduction on institutional trading costs.1 Jones and Lipson (2001) find that,while average execution costs increased (by about 22.5 basis points) when the ticksize was reduced from $1/8 to $1/16 in 1997, they increased more for orders thatdemanded liquidity, including large orders, and orders that were not worked by thetrading desk. We provide fresh evidence to this debate by examining changesin institutional trading costs following the reduction of the minimum tick sizeto a penny.Using proprietary data from the Plexus Group, we examine the trading costs of 34
large buy-side institutions trading NYSE stocks over a period of 41 days before and44 days after decimalization.2 The Plexus group was an independent transaction costconsulting firm in this period handling over $4.5 trillion in institutional equity trades,or roughly a fifth of dollar trading volume in US equity markets.3
We find mixed evidence for the effect of decimalization on institutional tradingcosts. Costs increased for orders that aggressively sought liquidity. For instance,costs increased by almost 10 basis points for not-worked orders (orders filled withina day) but declined by about 32 basis points for worked orders (orders filled overmultiple days). This disparity between worked and not-worked orders is especiallypronounced when we consider large orders. Upon partitioning the sample on bid-askspread quartiles, we find that the greatest decline in trading costs (of about 61 basispoints) occurred in the smallest spread quartile—a group where the pre-decimalminimum tick size of $1/16 was more likely a binding constraint. However, we findan increase in trading costs for the largest spread quartile, suggesting that liquiditymay have become harder to find in the post-decimal world for stocks not constrainedby the minimum tick size. Overall, however, institutional trading costs declined byabout 22 basis points following decimalization. While our findings, especially thoserelated to increased costs, are consistent with the findings of Jones and Lipson(2001), our overall result differs from them mainly because of the difference in theproportion of worked orders in our respective samples (81.6 percent of the shares
1See, for example, Ahn et al. (1998), Bacidore (1997), Bollen and Whaley (1998), Ricker (1998), and
Ronen and Weaver (2001). Bacidore et al. (2003), Bessembinder (2003), Chakravarty et al. (2004), and
Chung et al. (2004) study the impact of decimal pricing in the US markets.2Though we are the first to use Plexus data to examine institutional trading following decimalization,
many researchers have used it to examine a wide variety of topics related to institutional trading behavior
(see Keim and Madhavan, 1996, 1997; Conrad et al., 2001, 2003; and Jones and Lipson, 1999, 2001).3See www.plexusgroup.com, www.marketdata.nasdaq.com, and the 2001 NYSE Fact Book. The Plexus
Group has subsequently been acquired by J.P. Morgan Chase Bank.
S. Chakravarty et al. / Journal of Financial Markets 8 (2005) 400–420402
traded in our sample as compared to 49.6 percent in theirs). Our conclusions arerobust to the sample selection method, to the benchmark price for computing priceimpact, and to changes in order characteristics and market conditions, as well as topossible time trends in trading costs. In sum, our findings suggest that decimalizationappears to have benefited those institutions that were working their orders on theexchange floor.We also find that the average size of an institutional order declined from 41,205
shares before decimalization to 34,017 shares after decimalization.4 The decline inaverage order size was the highest in stocks with the greatest liquidity, namely largecap stocks, stocks with the lowest spreads, stocks with the highest volume, andstocks with the lowest volatility. These also happen to be the stocks that institutionstraded the most as seen in our data. It is, therefore, possible that institutions hadaggressively altered their strategies following decimalization to avoid costs theyincurred following the move to sixteenths. In contrast, the average order size, asreported by Jones and Lipson (2001) during the move to sixteenths, declined onlymarginally, from 25,129 shares to 24,368 shares. Our results, and those in Jonesand Lipson, collectively suggest that institutional trading strategies are dynamic,adapting to the changes in market environment, thereby making it difficult toextrapolate results of one time period to another.Recently, in a well-publicized interview, the SEC Chairman William Donaldson
suggested that decimalization might have increased trading costs for largeinstitutional investors.5 We provide direct evidence on this issue and show exactlywhere such costs may have increased and where they declined followingdecimalization. It should be underscored, however, that even though we documentoverall unchanged, or declining, costs after decimals, it is not at all clear if anyfurther reductions in the minimum tick size will necessarily be beneficial.The remainder of the paper is as follows. Section 2 discusses the related literature
and Section 3 discusses the data and provides some descriptive statistics. Section 4provides multiple ways to measure transactions costs and provides univariateanalyses of transactions costs on various partitions of the data. Section 5 extends theanalyses to a multivariate examination and performs robustness checks of ourresults. Section 6 concludes with a discussion.
2. Related literature
As discussed earlier, our paper is most closely related to the work of Jones andLipson (2001) who investigate institutional trading costs around the change inminimum tick size from eighths to sixteenths in the NYSE in June 1997. Using
4However, while the average size of an order fell 17%, the average time taken to fill an order remained
the same, suggesting that it took longer to execute a given number of shares after decimalization than
before. While changes in institutional strategies could be a result of a trend that has nothing to do with
decimalization, we find that not to be the case when we specifically control for time trends using data from
the year before decimalization.5SEC Chairman Donaldson in CNBC Business Center (May 13, 2003).
S. Chakravarty et al. / Journal of Financial Markets 8 (2005) 400–420 403
Plexus data within 100 trading days of the June 1997 switchover to sixteenths,Jones and Lipson find that realized execution costs in their sample of firms in-creased after the changeover and conclude that smaller minimum tick sizes reducedmarket liquidity. While it is true that we both use institutional order data fromPlexus, there are two important differences in both the content and the scope of thedata that we examine.First, the environment in which institutions operate has changed since 1997,
and that might have a direct bearing on the trading costs reported by them. Forexample, the NYSE repealed Rule 390 in May 2000, allowing its members to tradeoutside an exchange. Kam et al. (2003) show that the NYSE specialists set tighterquotes following the repeal to prevent order flow from leaving the exchange. Moreimportantly, the repeal, along with an explosive growth of alternate tradingsystems and deep discount and online brokerages, gave investors, includinglarge institutional investors, a greater choice of how, and where, to send theirorders for execution.Second, there has been a growing usage of worked or ‘not-held’ orders. Large
institutions place these orders to be executed at the broker’s discretion. Thoughdifficult to identify, Jones and Lipson (2001) characterize orders that take longerthan a day to fill, and orders that are filled using more than one broker, as workedorders. But as discussed earlier, the proportion of worked orders in our sample isalmost sixty percent higher than the proportion in their sample, suggesting thatinstitutional control over executions may have changed significantly since the moveto sixteenths.Two other studies have tried to examine the effect of decimalization on
institutional trading costs. Werner (2003), for example, finds a similar reductionin the average dollar trading costs following decimalization within Nasdaqstocks. She, however, uses data on orders placed by institutional brokers withNasdaq dealers. Given their large size, institutional decisions often reach themarket as multiple trades, and through different brokers. Hence, the true effectof decimalization on trading costs can only be determined at the order level, ratherthan at the trade level, something that our proprietary data allow us to view.And, contrary to our results (as well as to Werner’s), Bollen and Busse (2003) findan increase in mutual fund trading costs by comparing actual mutual fundreturns with the returns of a synthetic benchmark portfolio that matches the mutualfund’s holdings but has zero cost by construction. While our data can allow us todirectly measure commissions and price impact of actual institutional trades, theycan only impute these costs from fund holdings, which are recorded at quarterlyintervals at best.Our paper also fits in with other studies that measure institutional price impact.
Chan and Lakonishok (1995) report that institutional trading impact and tradingcost are related to firm capitalization, relative order size, identity of the managementfirm behind the trade and the degree of demand for immediacy. Keim andMadhavan (1997) focus on institutional investment styles and their impact ontrading costs. They report that trading costs increase with trading difficulty and thatthese costs vary with factors like investment styles, order submission strategies and
S. Chakravarty et al. / Journal of Financial Markets 8 (2005) 400–420404
exchange listing. We partition our results using factors cited in these two papers andalso use them as controls in our regression analysis.Keim and Madhavan (1996) point out the importance of the choice of pre-trade
benchmark prices in estimating institutional price impact. Though we use Perold’simplementation shortfall metric to measure price impact, we also replicate ourresults using value-weighted average trade price for the day as the relevantbenchmark, as suggested by Berkowitz et al. (1988). Our results remain qualitativelysimilar though the magnitude of the decrease in trading costs is much smaller.6
We describe our data in the next section.
3. Data
Before formally describing our data, it is important to understand how buy-sideinstitutions trade. Each institutional client employs many portfolio managers whocollectively manage its assets. The trading process begins with the stock selection bythe portfolio manager. Thereafter, a decision (or an order) is made to establish aposition in a given stock, keeping in mind that it could take a few days (andnumerous trades) to establish that position. The portfolio manager then makes oneor more releases to the trader who works for the manager. The trader, in turn,releases it to either one or many brokers for execution (called broker releases). Thebroker may then execute each release with one or more trades. This entire process iswell recorded in Plexus data except at the final stage when brokers may elect toaggregate their trades before reporting them back to Plexus. This aggregation limitsour ability to infer whether the number of trades has exploded since decimalization,a common complaint among institutional traders.
3.1. Plexus data
Our data contain information on all orders and trades in NYSE-listed stocks of 34large institutional clients of Plexus over the period November 28, 2000, to January26, 2001 (period before decimalization, or simply ‘‘Before’’), and over the periodJanuary 30–March 31, 2001 (period after decimalization, or simply ‘‘After’’). Wechoose this period, which straddles the date when all stocks went to decimal pricing(January 29, 2001), so that we have roughly an equal number of days before andafter decimalization.Though Plexus has more than 34 clients, we retain only institutions that traded
both before and after decimalization to mitigate the effect of changes in thecomposition of Plexus clientele on our results. However, our results do notqualitatively change if we relax this restriction and include all Plexus clients for ouranalyses.All stocks, except those that were part of the pilot programs, traded in sixteenths
before January 29, 2001. The NYSE introduced decimal trading in a small group
6We do not present these results here but have them available on request.
S. Chakravarty et al. / Journal of Financial Markets 8 (2005) 400–420 405
of stocks, including active stocks such as Fedex, through its pilot programsstarting in August 2000.7 The pilot programs were designed to provide investors,including institutional investors, the opportunity to learn and operate in thenew environment. We ignore the pilot stocks and concentrate on the over-whelming majority of the NYSE-listed stocks that started trading in decimals onlyfrom January 29, 2001.8 We also exclude orders taken before January 29 butcompleted after to keep our analysis clean and simple. To ensure that our results arenot driven by time-trends unrelated to decimalization, we also use additionalinstitutional trading data over the period January 30 to March 31, 2000—a yearbefore the advent of decimalization. We discuss our time-trend analysis in greaterdetail later.For each order, the data include (a) the stock to be traded and the date the order
was made; (b) the desired number of shares to be bought or sold; (c) whether theorder was to buy or sell; (d) the dates when the individual components of the orderwere released to the executing broker; (e) the dates and prices at which the variouscomponents of the order were filled; (f) the commissions in dollars per share; (g) thevolume weighted average trade price for the stock on each of the days a componentof the order was filled; (h) the style of the manager submitting the order (value,diversified or growth); and (i) the different brokers an order is released to.The identification of the underlying manager’s style behind each order is
significant because it enables us to get a glimpse of transactions costs as a functionof the aggressiveness of an order. For example, value managers are investors whosetrading strategy is based on identification of undervalued stocks with a decidedlylonger-term perspective and could be termed ‘‘patient’’ investors. Growth managers,on the other hand, are expected to have a shorter investment horizon and to buy andsell stocks based less on company fundamentals and more on short-term priceappreciation. Diversified managers are expected to lie between growth and valuemanagers and to have elements of both in their investment strategy. Also included inthis category are institutions that follow quantitative styles, including indexing, thatare neither momentum nor value-based. In terms of their willingness to bear priceimpact as well as their desire for immediacy, it is reasonable to expect growth (value)managers to be most (least) aggressive, with diversified managers falling in between.It should be emphasized here that this style classification is made by Plexus and notby the institutions themselves. We have little reason to doubt the integrity of theirclassification given their experience and standing in the business of institutionaltrading cost measurement.
3.2. Overall summary
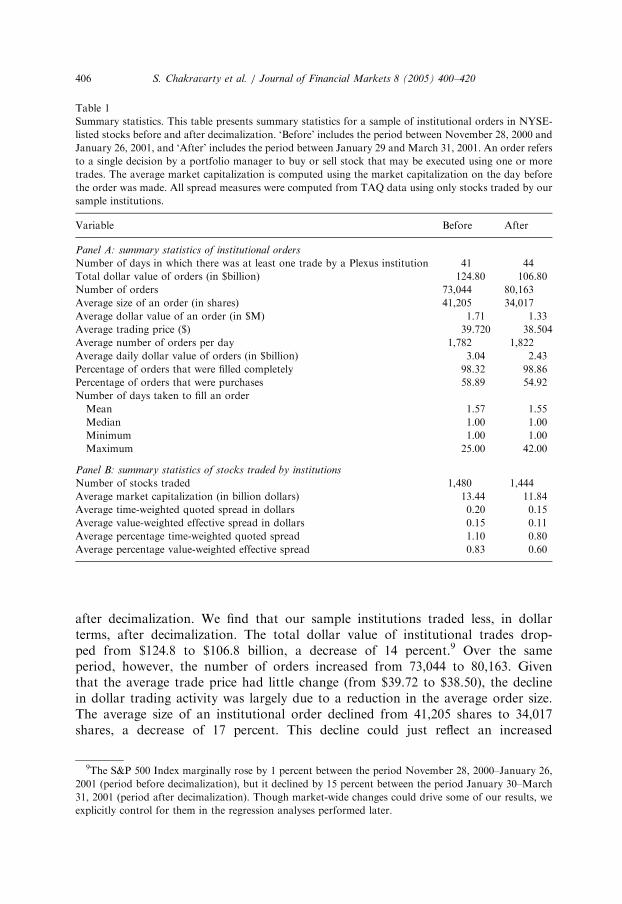
Table 1 presents summary statistics of our data. It is designed to provide thebackdrop with which to examine the research questions addressed in thepaper. Panel A presents summary statistics of institutional orders before and
7See Chakravarty et al. (2004) for the list of stocks that were included in these pilot rounds.8To test the robustness of our results, we replicate our analysis on the pilot stocks later in the paper.
ARTICLE IN PRESS
Table 1
Summary statistics. This table presents summary statistics for a sample of institutional orders in NYSE-
listed stocks before and after decimalization. ‘Before’ includes the period between November 28, 2000 and
January 26, 2001, and ‘After’ includes the period between January 29 and March 31, 2001. An order refers
to a single decision by a portfolio manager to buy or sell stock that may be executed using one or more
trades. The average market capitalization is computed using the market capitalization on the day before
the order was made. All spread measures were computed from TAQ data using only stocks traded by our
sample institutions.
Variable Before After
Panel A: summary statistics of institutional orders
Number of days in which there was at least one trade by a Plexus institution 41 44
Total dollar value of orders (in $billion) 124.80 106.80
Number of orders 73,044 80,163
Average size of an order (in shares) 41,205 34,017
Average dollar value of an order (in $M) 1.71 1.33
Average trading price ($) 39.720 38.504
Average number of orders per day 1,782 1,822
Average daily dollar value of orders (in $billion) 3.04 2.43
Percentage of orders that were filled completely 98.32 98.86
Percentage of orders that were purchases 58.89 54.92
Number of days taken to fill an order
Mean 1.57 1.55
Median 1.00 1.00
Minimum 1.00 1.00
Maximum 25.00 42.00
Panel B: summary statistics of stocks traded by institutions
Number of stocks traded 1,480 1,444
Average market capitalization (in billion dollars) 13.44 11.84
Average time-weighted quoted spread in dollars 0.20 0.15
Average value-weighted effective spread in dollars 0.15 0.11
Average percentage time-weighted quoted spread 1.10 0.80
Average percentage value-weighted effective spread 0.83 0.60
S. Chakravarty et al. / Journal of Financial Markets 8 (2005) 400–420406
after decimalization. We find that our sample institutions traded less, in dollarterms, after decimalization. The total dollar value of institutional trades drop-ped from $124.8 to $106.8 billion, a decrease of 14 percent.9 Over the sameperiod, however, the number of orders increased from 73,044 to 80,163. Giventhat the average trade price had little change (from $39.72 to $38.50), the declinein dollar trading activity was largely due to a reduction in the average order size.The average size of an institutional order declined from 41,205 shares to 34,017shares, a decrease of 17 percent. This decline could just reflect an increased
9The S&P 500 Index marginally rose by 1 percent between the period November 28, 2000–January 26,
2001 (period before decimalization), but it declined by 15 percent between the period January 30–March
31, 2001 (period after decimalization). Though market-wide changes could drive some of our results, we
explicitly control for them in the regression analyses performed later.
ARTICLE IN PRESS
S. Chakravarty et al. / Journal of Financial Markets 8 (2005) 400–420 407
need by institutions to protect themselves from front running in a decimalenvironment.There was little difference in the percentage of orders that were filled completely
(over 98%) between the two periods. Plexus clients also remained marginally netbuyers both before and after decimalization. There was little change in the averagenumber of days it took to fill an order. An average order took about a day and halfto be filled. Given that the average order size was lower by 17 percent afterdecimalization, it appears that it took longer to fill an order of a given number ofshares in a decimal environment.Panel B provides summary statistics of stocks that were traded by the institutions.
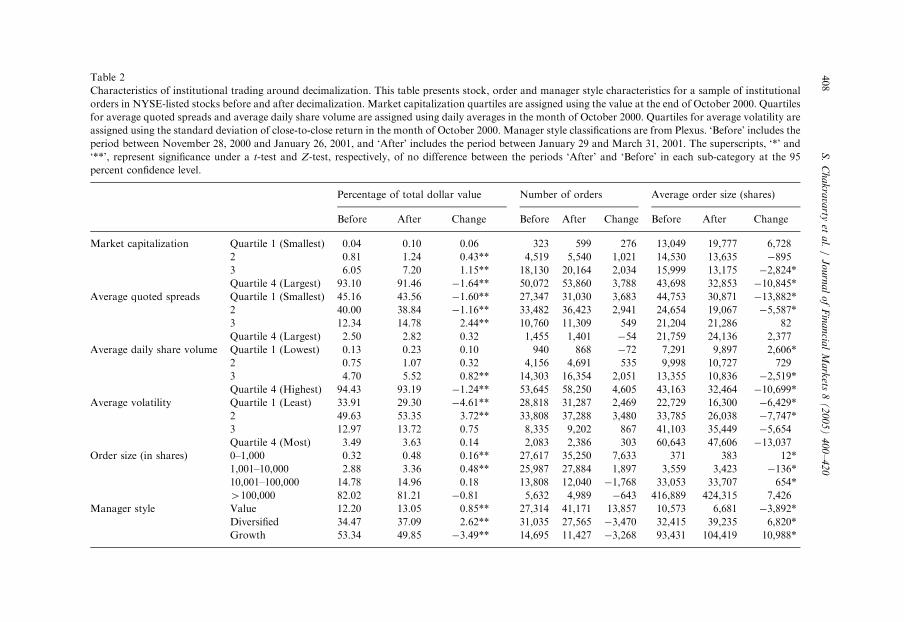
Our sample institutions traded marginally fewer stocks after decimalization (from1,480 to 1,444). The average market capitalization of stocks traded beforedecimalization was $13.44 billion while it was only $11.84 billion after decimaliza-tion. Consistent with results from other studies (see, for example, Bessembinder,2003), we find significant decreases in quoted and effective spreads followingdecimalization. The average time-weighted quoted spread declined by 25 percentfrom $0.20 to $0.15, while the value-weighted effective spread decreased by 26.7percent from $0.15 to $0.11. The declines in percentage quoted spreads andpercentage effective spreads were similar, from 1.10% to 0.80% and from 0.83% to0.60%, respectively.In Table 2, we present changes in percent dollar value traded, in the number of
orders and in the average order size by different partitions based on stock, order andmanager style characteristics. These partitions help us understand whetherinstitutions changed the type of stocks they traded in, the way they traded them,and/or their investment styles, following decimalization. Such changes, if any, wouldhave a direct bearing on the changes in institutional trading costs. We use partitionsbased on quartiles of market capitalization, average quoted spreads, average dailyshare volume, and average volatility, as well as partitions based on order size andmanager style.Market capitalization quartiles are formed using the value at the end of October
2000, which is before our sample period. Quartiles for average quoted spread andaverage daily share volume are formed using the daily averages in the month ofOctober 2000, while quartiles for average volatility are based on the standarddeviation of close-to-close return in the month of October 2000. Most of theinstitutional orders were in the more liquid stocks, i.e., large cap stocks, stocks withtighter spreads, stocks with high volume, and stocks with low volatility. Therefore,the decline in trading activity following decimalization was also in these same stocks.Interestingly, institutions were trading in much smaller sizes in these liquid stocksafter decimalization, suggesting that they were concerned about front running in thenew environment. The average order size declined by 25 percent in large cap stocksand high volume stocks, by a little less than 33 percent in narrow spread stocks, andby around 30 percent in less volatile stocks.Though orders greater than 100,000 shares accounted for only around six percent
of all orders, they accounted for more than 80 percent of the value traded.Interestingly, there was little change in the average size of these orders, suggesting
Characteristics of institutional trading around decimalization. This table presents stock, order and manager style characteristics for a sample of institutional
orders in NYSE-listed stocks before and after decimalization. Market capitalization quartiles are assigned using the value at the end of October 2000. Quartiles
for average quoted spreads and average daily share volume are assigned using daily averages in the month of October 2000. Quartiles for average volatility are
assigned using the standard deviation of close-to-close return in the month of October 2000. Manager style classifications are from Plexus. ‘Before’ includes the
period between November 28, 2000 and January 26, 2001, and ‘After’ includes the period between January 29 and March 31, 2001. The superscripts, ‘*’ and
‘**’, represent significance under a t-test and Z-test, respectively, of no difference between the periods ‘After’ and ‘Before’ in each sub-category at the 95
percent confidence level.
Percentage of total dollar value Number of orders Average order size (shares)
Before After Change Before After Change Before After Change
S. Chakravarty et al. / Journal of Financial Markets 8 (2005) 400–420 409
that decimalization had not changed how institutions traded large orders. We finda slight increase in the usage of relatively smaller sized orders (orders less than100,000 shares), while orders of over 100,000 shares showed a slight decline afterdecimalization.10 In terms of managers’ trading styles, the percentage of dollar valuetraded by value managers and diversified managers increased while that of growthmanagers declined following decimalization. Value managers placed more ordersthough the average size of each order declined from 10,573 shares to 6,681 shares. Itwas just the opposite for both diversified and growth managers. They placed fewerorders but for a larger number of shares per order.In sum, our results indicate that institutions did trade differently following
decimalization. Whether or not these changes in trading behavior impacted tradingcosts is what we examine in the next section.
4. Institutional trading costs
There are several factors that make capturing trading costs for institutionalinvestors harder than for retail investors. Traditional measures like bid-ask spreadsare highly inappropriate as institutional trades are often large and take days to fill.Moreover, the ‘‘true’’ costs to an institutional trader include administrative costs ofworking an order as well as the opportunity costs of missed trades. Following otherresearchers who have studied institutional trading costs, including Keim andMadhavan (1996), and Jones and Lipson (2001), we examine costs that can be moreexplicitly measured, namely commissions and price impact.
4.1. Changes in total trading costs
Unlike commissions, the price impact of a trade—the deviation of the transactionprice from the ‘unperturbed’ price that would prevail had the trade not occurred—isarguably more difficult to measure. Much depends on the proper identification of theunperturbed price. In particular, the measure should be such that it is leastinfluenced by the trade itself. Keim and Madhavan (1996) discuss the importance ofthis issue in great detail.We use implementation shortfall to measure price impact (see Perold, 1988). We
measure implementation shortfall as the percentage deviation of the value weightedaverage execution price for each order from the price at close on the day prior to thedecision.11 We multiply this deviation by �1 if the order is a sale to ensure that it
10We also find (not formally reported) that our sample institutions were buying less when markets were
going down and selling less when markets were going up. Therefore, they may not have been acting as
liquidity providers, at least during extreme market conditions, which could impact their trading costs after
decimalization. Orders placed during neutral market conditions had the greatest reduction in their average
size, with purchases lower by 3,407 shares (or, around 16 percent) and sales by 11,100 shares (or, a little
less than 30 percent).11To ensure the robustness of our findings, we replicated our estimations with at least two other
benchmark prices. The first, and one that is popular among practitioners, is the value-weighted average
S. Chakravarty et al. / Journal of Financial Markets 8 (2005) 400–420410
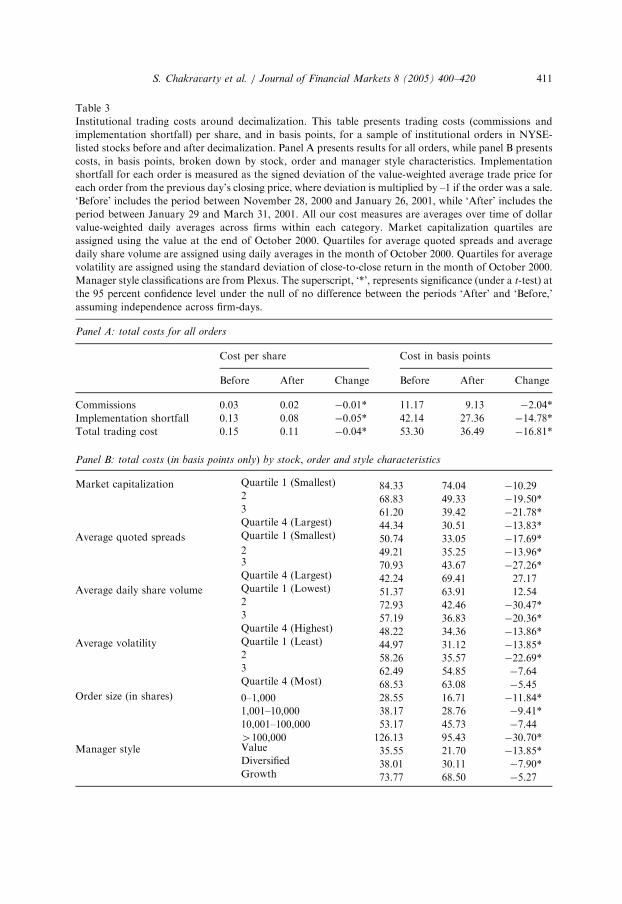
measures trading costs appropriately for buy and sell orders. Table 3 presentsdollar value-weighted average commission and implementation shortfall of insti-tutional trades before and after decimalization. We present costs, both in dollarsper share and in basis points, for the full sample first (Panel A), and then only inbasis points for different partitions of stock, order and manager style characteristics(Panel B).For the overall sample, we find a decrease in trading costs after decimalization
both in terms of costs per share and in basis points. Total costs (includingcommissions) declined from $0.15 per share to $0.11 per share after decimalization.In basis points, the decrease was from 53.3 to 36.5, a decrease of 16.8 basis points orroughly 32 percent. Compared to the reduction in value-weighted effective spreads,this decrease is smaller than the overall average for stocks (23 basis points) that oursample institutions traded and smaller than the average for all NYSE stocks (36basis points).12
Given that the change in the number of orders, and of the average ordersize, following decimalization varied across different partitions of the stock, theorder and the manager style characteristics (see Table 2), we present changes intotal trading costs for the same partitions. We find a reduction in trading costsacross all partitions of market capitalization, volatility, order size, and managerstyle. There seems to be no consistent emergent pattern within each of thesepartitions. Furthermore, we find mixed results for partitions of quoted spreadsand volume suggesting that decimalization may not have had the same effectfor all stocks. For example, for less liquid stocks such as stocks with highpre-decimalization spreads and low volume, we find decimalization to haveincreased trading cost though the increase cannot be statistically distinguishedfrom zero.Our results (not formally presented) also indicate that costs went up for
institutional sells (relative to institutional buys) after decimalization. However,given a significant decline in the market overall after decimalization versus a slightincrease before (see footnote 9), it is not surprising to see higher costs incurred byinstitutional sellers after decimalization. We separate out the market effects, as wellas the effects of selling in a falling market, later in our regression analysis.Overall, our univariate results suggest a decrease in trading costs following
decimalization though some indications exist that this effect may not be universal.We examine changes in costs using a more robust multivariate analysis in thefollowing section.
(footnote continued)
price (VWAP) across all trades over the time period when the institution was trading [see Berkowitz et al.,
1988]. We also used the opening price of the first day in which the order started executing as our
benchmark price. Using the price at the time the order was released to the broker was problematic because
the intra-day time variable in Plexus was not reliable. For example, in our sample, more than half of all
orders had timestamps that were after 4:30 pm or before 9:30 am. Using alternative benchmark prices,
however, does not alter our results or our conclusions.12See Bessembinder (2003).
ARTICLE IN PRESS
Table 3
Institutional trading costs around decimalization. This table presents trading costs (commissions and
implementation shortfall) per share, and in basis points, for a sample of institutional orders in NYSE-
listed stocks before and after decimalization. Panel A presents results for all orders, while panel B presents
costs, in basis points, broken down by stock, order and manager style characteristics. Implementation
shortfall for each order is measured as the signed deviation of the value-weighted average trade price for
each order from the previous day’s closing price, where deviation is multiplied by –1 if the order was a sale.
‘Before’ includes the period between November 28, 2000 and January 26, 2001, while ‘After’ includes the
period between January 29 and March 31, 2001. All our cost measures are averages over time of dollar
value-weighted daily averages across firms within each category. Market capitalization quartiles are
assigned using the value at the end of October 2000. Quartiles for average quoted spreads and average
daily share volume are assigned using daily averages in the month of October 2000. Quartiles for average
volatility are assigned using the standard deviation of close-to-close return in the month of October 2000.
Manager style classifications are from Plexus. The superscript, ‘*’, represents significance (under a t-test) at
the 95 percent confidence level under the null of no difference between the periods ‘After’ and ‘Before,’
S. Chakravarty et al. / Journal of Financial Markets 8 (2005) 400–420 411
ARTICLE IN PRESS
S. Chakravarty et al. / Journal of Financial Markets 8 (2005) 400–420412
5. Multivariate analysis
5.1. Controls for order characteristics, manager style and market conditions
It is, of course, possible that the liquidity environment after decimalization changedin a fundamentally complex manner that our simple univariate analysis cannot detect.For one, we know that the market conditions were quite different during the periodafter decimalization than before. It is also possible that our discrete size partitionsmay be inadequate in capturing the tradeoff between size and cost. To better controlfor a broad set of variables that are known to impact trading costs, we use theapproach followed by Jones and Lipson (2001) and examine the difference betweenactual and expected trading costs pre- and post-decimalization. This approach is akinto creating a matched sample of orders (based on some exogenously defined criteria)over the pre-decimal and post-decimal periods and then examining the dollar-weighted change in net execution costs of any possible time-trend.To make the above intuition operational, we use the pre-decimal data to estimate
where Costi represents the total trading cost in basis points (commissions plusimplementation shortfall) for executing order i; Buy is the indicator variable that is 1if the order is a buy and 0 otherwise; NYSEVol is the total dollar volume at the NYSEon the day prior to the order; LogOrderSize is the logarithm of order size in shares;Growth is 1 if the manager was a growth manager and 0 otherwise; Value is 1 if themanager was a value manager and 0 otherwise; Momentum is the stock’s return on theday before the order multiplied by �1 if the order was a sell; InversePrice is theinverse of the stock’s price at the time of the order; and HiLo is the ratio of thedifference between the highest ask and the lowest bid on the day prior to the orderover the stock’s price. These variables are the same as those used by Jones and Lipson(2001). To obtain stable estimates, we restrict our analysis to stocks with at least 20orders. We present the change in total trading cost and the number of firm-days fordifferent spread quartile partitions (based on daily averages of time-weighted quotedspreads in October 2000) as well as for partitions based on order size.We use the coefficient estimates of this model to compute the expected trading
costs in the post-decimal period. The difference between the actual and the expectedtrading costs (or residuals) for orders placed after decimalization represents thetrading costs unexplained by order characteristics, manager style and marketconditions that could only be attributable to the event of decimalization. We averagethese residuals using dollar-volume weights for each day in the period. If there wasno change in the trading environment before and after decimalization, the residualswould be distributed identically in the two periods under examination andthe weighted average change in these residuals over the two periods would be zero.This is exactly what we test in our data. The interested reader is referred to Jones
ARTICLE IN PRESS
S. Chakravarty et al. / Journal of Financial Markets 8 (2005) 400–420 413
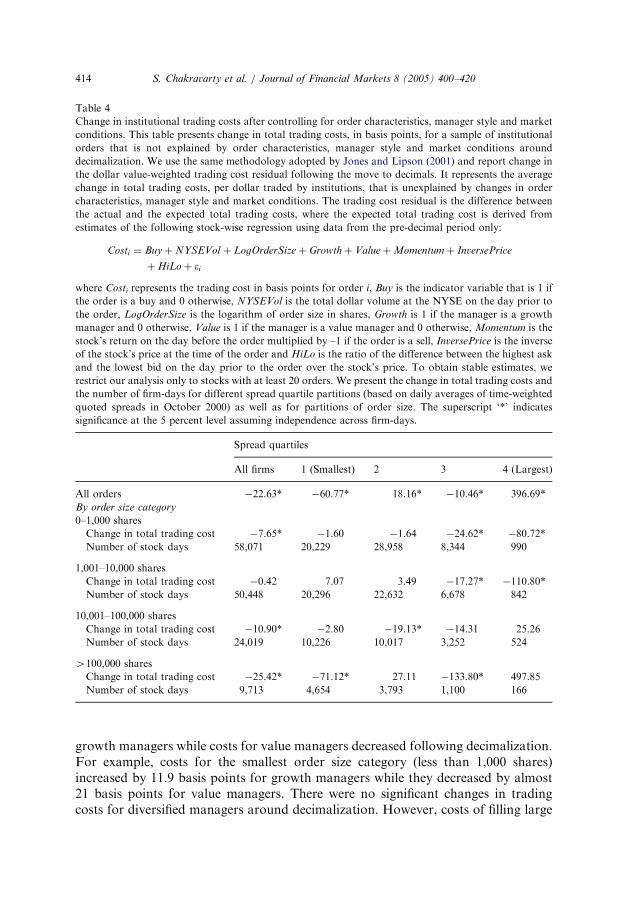
and Lipson (2001, pp. 267–268) for other relevant details and justification ofassumptions.Table 4 presents these estimation results. Controlling for order characteristics,
market conditions and manager style, we find a statistically significant decline intotal trading costs of 22.6 basis points following decimalization. In contrast, Jonesand Lipson (2001) find an increase of 22.5 basis points following the move tosixteenths. Interestingly, the decline in our case was the greatest at 25.4 basis pointsfor orders greater than 100,000 shares. We find a decrease in trading costs in othersize categories as well (of around 11 basis points for orders between 10,000and 100,000 shares, 0.4 basis points for orders between 1,001 and 10,000 shares and7.7 basis points for orders less than 1,000 shares).However, we find mixed results when we partition our results by different spread
quartiles. For example, we find a decrease in trading costs (of about 60.8 basispoints) for stocks in the smallest spread quartile, stocks where the pre-decimal ticksize of $1/16 was more likely to have been binding. In contrast, for stocks in thelargest spread quartile, where the tick size was not binding, trading costs actuallyincreased by 396.7 basis points. Costs did not change much for all order sizes in thesmallest quartile except when the order size exceeded 100,000 shares. Arguably, theselarge orders in liquid securities are more often worked than not, something that wetest directly later. However, for the largest spread stocks, most of the increase intrading costs is driven by smaller orders (orders less than 10,000 shares). It should benoted though, as the number of stock-days suggests, institutions did not often tradethese stocks. Similar to the extreme quartiles, we find mixed results in the middlequartiles. Trading costs increased by 18.2 basis points for stocks in quartile 2 butdeclined by 10.5 basis points for stocks in quartile 3 following decimalization.We estimate the same model as above, but partitioned along those orders that
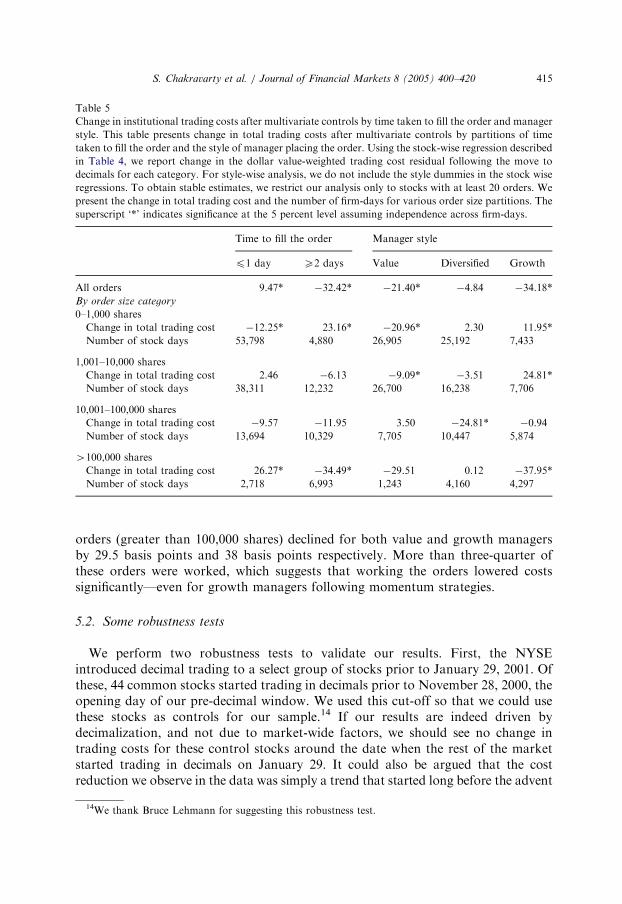
were executed within a day (not-worked orders), and those that were filled over atleast two days (worked orders). Jones and Lipson (2001) show that the increasein trading costs for the worked orders was much smaller than the increase in costsfor the not-worked orders during the move to sixteenths, controlling for ordercharacteristics, manager style and market conditions. We see the same trend, exceptthat the worked orders experienced a decrease in trading costs of 32.4 basis pointswhile the not-worked orders experienced an increase in trading costs of 9.5 basispoints (See Table 5). This result seems to be mainly driven by changes in tradingcosts of the largest orders—orders involving more than 100,000 shares. Trading costsfor such orders increased by 26.3 basis points when filled within a day while theydecreased by 34.5 basis points when they were filled over multiple days. Clearly,decimalization made liquidity more expensive for orders demanding quickexecutions. On the other hand, it did not worsen liquidity for those who werewilling to wait and work their orders—a fact that needs to be incorporated in thecurrent regulatory debate.Our tests based on manager style yield mixed results as well.13 For small orders
that were less likely to have been worked, we find an increase in trading costs for
13For style-wise analysis, we do not include style dummies in the stock-wise regression [see Eq. (1)].
where Costi represents the trading cost in basis points for order i, Buy is the indicator variable that is 1 if
the order is a buy and 0 otherwise, NYSEVol is the total dollar volume at the NYSE on the day prior to
the order, LogOrderSize is the logarithm of order size in shares, Growth is 1 if the manager is a growth
manager and 0 otherwise, Value is 1 if the manager is a value manager and 0 otherwise, Momentum is the
stock’s return on the day before the order multiplied by –1 if the order is a sell, InversePrice is the inverse
of the stock’s price at the time of the order and HiLo is the ratio of the difference between the highest ask
and the lowest bid on the day prior to the order over the stock’s price. To obtain stable estimates, we
restrict our analysis only to stocks with at least 20 orders. We present the change in total trading costs and
the number of firm-days for different spread quartile partitions (based on daily averages of time-weighted
quoted spreads in October 2000) as well as for partitions of order size. The superscript ‘*’ indicates
significance at the 5 percent level assuming independence across firm-days.
Spread quartiles
All firms 1 (Smallest) 2 3 4 (Largest)
All orders �22.63* �60.77* 18.16* �10.46* 396.69*
By order size category
0–1,000 shares
Change in total trading cost �7.65* �1.60 �1.64 �24.62* �80.72*
Number of stock days 58,071 20,229 28,958 8,344 990
1,001–10,000 shares
Change in total trading cost �0.42 7.07 3.49 �17.27* �110.80*
Number of stock days 50,448 20,296 22,632 6,678 842
10,001–100,000 shares
Change in total trading cost �10.90* �2.80 �19.13* �14.31 25.26
Number of stock days 24,019 10,226 10,017 3,252 524
4100,000 shares
Change in total trading cost �25.42* �71.12* 27.11 �133.80* 497.85
Number of stock days 9,713 4,654 3,793 1,100 166
S. Chakravarty et al. / Journal of Financial Markets 8 (2005) 400–420414
growth managers while costs for value managers decreased following decimalization.For example, costs for the smallest order size category (less than 1,000 shares)increased by 11.9 basis points for growth managers while they decreased by almost21 basis points for value managers. There were no significant changes in tradingcosts for diversified managers around decimalization. However, costs of filling large
ARTICLE IN PRESS
Table 5
Change in institutional trading costs after multivariate controls by time taken to fill the order and manager
style. This table presents change in total trading costs after multivariate controls by partitions of time
taken to fill the order and the style of manager placing the order. Using the stock-wise regression described
in Table 4, we report change in the dollar value-weighted trading cost residual following the move to
decimals for each category. For style-wise analysis, we do not include the style dummies in the stock wise
regressions. To obtain stable estimates, we restrict our analysis only to stocks with at least 20 orders. We
present the change in total trading cost and the number of firm-days for various order size partitions. The
superscript ‘*’ indicates significance at the 5 percent level assuming independence across firm-days.
Time to fill the order Manager style
p1 day X2 days Value Diversified Growth
All orders 9.47* �32.42* �21.40* �4.84 �34.18*
By order size category
0–1,000 shares
Change in total trading cost �12.25* 23.16* �20.96* 2.30 11.95*
Number of stock days 53,798 4,880 26,905 25,192 7,433
1,001–10,000 shares
Change in total trading cost 2.46 �6.13 �9.09* �3.51 24.81*
Number of stock days 38,311 12,232 26,700 16,238 7,706
10,001–100,000 shares
Change in total trading cost �9.57 �11.95 3.50 �24.81* �0.94
Number of stock days 13,694 10,329 7,705 10,447 5,874
4100,000 shares
Change in total trading cost 26.27* �34.49* �29.51 0.12 �37.95*
Number of stock days 2,718 6,993 1,243 4,160 4,297
S. Chakravarty et al. / Journal of Financial Markets 8 (2005) 400–420 415
orders (greater than 100,000 shares) declined for both value and growth managersby 29.5 basis points and 38 basis points respectively. More than three-quarter ofthese orders were worked, which suggests that working the orders lowered costssignificantly—even for growth managers following momentum strategies.
5.2. Some robustness tests
We perform two robustness tests to validate our results. First, the NYSEintroduced decimal trading to a select group of stocks prior to January 29, 2001. Ofthese, 44 common stocks started trading in decimals prior to November 28, 2000, theopening day of our pre-decimal window. We used this cut-off so that we could usethese stocks as controls for our sample.14 If our results are indeed driven bydecimalization, and not due to market-wide factors, we should see no change intrading costs for these control stocks around the date when the rest of the marketstarted trading in decimals on January 29. It could also be argued that the costreduction we observe in the data was simply a trend that started long before the advent
14We thank Bruce Lehmann for suggesting this robustness test.
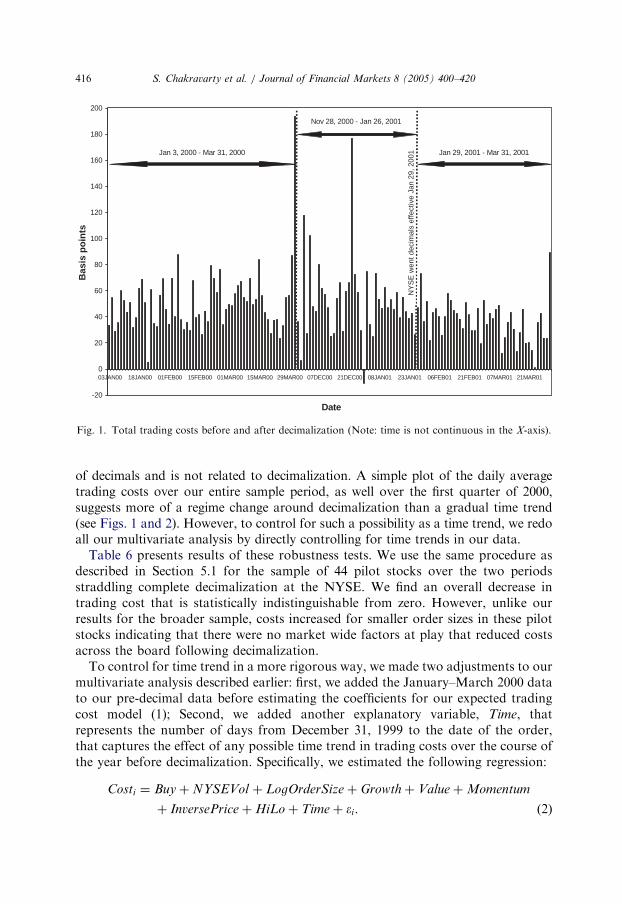
Fig. 1. Total trading costs before and after decimalization (Note: time is not continuous in the X-axis).
S. Chakravarty et al. / Journal of Financial Markets 8 (2005) 400–420416
of decimals and is not related to decimalization. A simple plot of the daily averagetrading costs over our entire sample period, as well over the first quarter of 2000,suggests more of a regime change around decimalization than a gradual time trend(see Figs. 1 and 2). However, to control for such a possibility as a time trend, we redoall our multivariate analysis by directly controlling for time trends in our data.Table 6 presents results of these robustness tests. We use the same procedure as
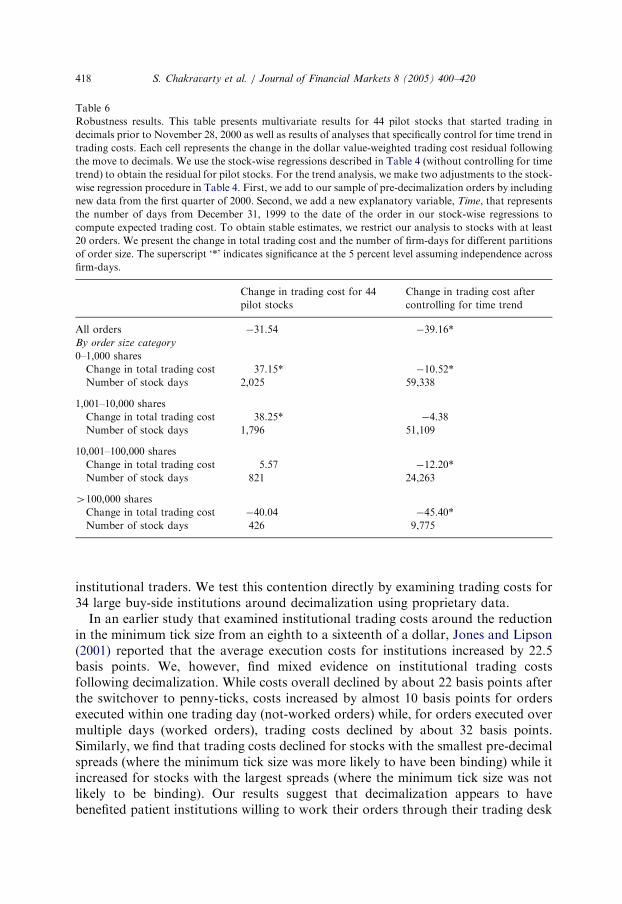
described in Section 5.1 for the sample of 44 pilot stocks over the two periodsstraddling complete decimalization at the NYSE. We find an overall decrease intrading cost that is statistically indistinguishable from zero. However, unlike ourresults for the broader sample, costs increased for smaller order sizes in these pilotstocks indicating that there were no market wide factors at play that reduced costsacross the board following decimalization.To control for time trend in a more rigorous way, we made two adjustments to our
multivariate analysis described earlier: first, we added the January–March 2000 datato our pre-decimal data before estimating the coefficients for our expected tradingcost model (1); Second, we added another explanatory variable, Time, thatrepresents the number of days from December 31, 1999 to the date of the order,that captures the effect of any possible time trend in trading costs over the course ofthe year before decimalization. Specifically, we estimated the following regression:
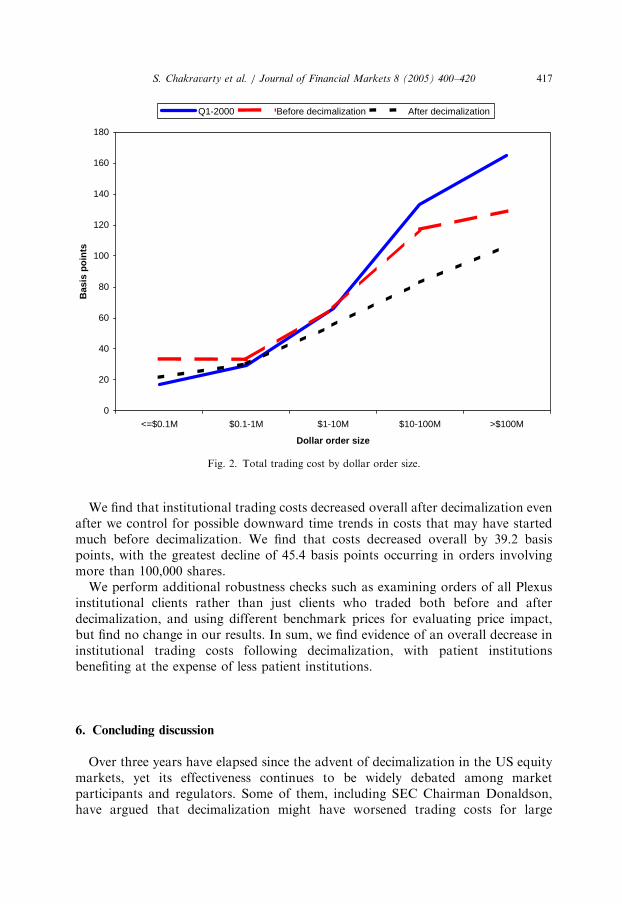
Q1-2000 Before decimalization After decimalization
Fig. 2. Total trading cost by dollar order size.
S. Chakravarty et al. / Journal of Financial Markets 8 (2005) 400–420 417
We find that institutional trading costs decreased overall after decimalization evenafter we control for possible downward time trends in costs that may have startedmuch before decimalization. We find that costs decreased overall by 39.2 basispoints, with the greatest decline of 45.4 basis points occurring in orders involvingmore than 100,000 shares.We perform additional robustness checks such as examining orders of all Plexus
institutional clients rather than just clients who traded both before and afterdecimalization, and using different benchmark prices for evaluating price impact,but find no change in our results. In sum, we find evidence of an overall decrease ininstitutional trading costs following decimalization, with patient institutionsbenefiting at the expense of less patient institutions.
6. Concluding discussion
Over three years have elapsed since the advent of decimalization in the US equitymarkets, yet its effectiveness continues to be widely debated among marketparticipants and regulators. Some of them, including SEC Chairman Donaldson,have argued that decimalization might have worsened trading costs for large
ARTICLE IN PRESS
Table 6
Robustness results. This table presents multivariate results for 44 pilot stocks that started trading in
decimals prior to November 28, 2000 as well as results of analyses that specifically control for time trend in
trading costs. Each cell represents the change in the dollar value-weighted trading cost residual following
the move to decimals. We use the stock-wise regressions described in Table 4 (without controlling for time
trend) to obtain the residual for pilot stocks. For the trend analysis, we make two adjustments to the stock-
wise regression procedure in Table 4. First, we add to our sample of pre-decimalization orders by including
new data from the first quarter of 2000. Second, we add a new explanatory variable, Time, that represents
the number of days from December 31, 1999 to the date of the order in our stock-wise regressions to
compute expected trading cost. To obtain stable estimates, we restrict our analysis to stocks with at least
20 orders. We present the change in total trading cost and the number of firm-days for different partitions
of order size. The superscript ‘*’ indicates significance at the 5 percent level assuming independence across
firm-days.
Change in trading cost for 44
pilot stocks
Change in trading cost after
controlling for time trend
All orders �31.54 �39.16*
By order size category
0–1,000 shares
Change in total trading cost 37.15* �10.52*
Number of stock days 2,025 59,338
1,001–10,000 shares
Change in total trading cost 38.25* �4.38
Number of stock days 1,796 51,109
10,001–100,000 shares
Change in total trading cost 5.57 �12.20*
Number of stock days 821 24,263
4100,000 shares
Change in total trading cost �40.04 �45.40*
Number of stock days 426 9,775
S. Chakravarty et al. / Journal of Financial Markets 8 (2005) 400–420418
institutional traders. We test this contention directly by examining trading costs for34 large buy-side institutions around decimalization using proprietary data.In an earlier study that examined institutional trading costs around the reduction
in the minimum tick size from an eighth to a sixteenth of a dollar, Jones and Lipson(2001) reported that the average execution costs for institutions increased by 22.5basis points. We, however, find mixed evidence on institutional trading costsfollowing decimalization. While costs overall declined by about 22 basis points afterthe switchover to penny-ticks, costs increased by almost 10 basis points for ordersexecuted within one trading day (not-worked orders) while, for orders executed overmultiple days (worked orders), trading costs declined by about 32 basis points.Similarly, we find that trading costs declined for stocks with the smallest pre-decimalspreads (where the minimum tick size was more likely to have been binding) while itincreased for stocks with the largest spreads (where the minimum tick size was notlikely to be binding). Our results suggest that decimalization appears to havebenefited patient institutions willing to work their orders through their trading desk
ARTICLE IN PRESS
S. Chakravarty et al. / Journal of Financial Markets 8 (2005) 400–420 419
or brokers, and might have hurt those seeking quick executions. Anecdotal evidencesuggests that institutions were exercising a far greater control over their executions in2001 than in 1997 which may explain why costs did not go up as consistently afterdecimalization as documented after the move to sixteenths.15 Moreover, traders areincreasingly being compensated based on how well they minimize trading costs.Fidelity, for example, bases 80% of its traders’ bonuses on systematic reviews oftheir quality of execution. While changes in institutional strategies could be the resultof a trend that has nothing to do with decimalization, we find that not to be the casewhen we specifically control for time trends using data from the year beforedecimalization.While the move to sixteenths in 1997 did increase trading costs for institutional
investors, the effect seems to have been partially reversed following the reduction ofthe minimum tick size to a penny. Our investigations suggest that as tradingenvironments evolve over time, institutions adapt to that evolution in ways thatcontrol for their trading costs. An example of this kind of adaptation is the fact thatinstitutions are breaking their larger orders into smaller-sized orders in response tolower displayed liquidity following decimalization. In that sense, institutions appearto be morphing somewhat into individual investors. But unlike individual investors,institutional investors have a need to trade large quantities and trading them throughrelatively smaller size orders may well expose them to additional risks that mayincrease their trading costs. It is, therefore, not clear if a further reduction in tick sizewould necessarily be beneficial to institutional investors.
References
Ahn, H., Cao, C., Choe, H., 1998. Decimalization and competition among exchanges: evidence from the
Toronto Stock Exchange cross-listed securities. Journal of Financial Markets 1, 51–87.
Bacidore, J.M., 1997. The impact of decimalization on market quality: an empirical investigation of the
Toronto Stock Exchange. Journal of Financial Intermediation 6, 92–120.
Bacidore, J.M., Battalio, R.H., Jennings, R.H., 2003. Order submission strategies, liquidity supply, and
trading in pennies on the New York Stock Exchange. Journal of Financial Markets 6, 337–362.
Berkowitz, S., Logue, D., Noser, E., 1988. The total cost of transactions on the NYSE. Journal of Finance
41, 97–112.
Bessembinder, H., 2003. Trade execution costs and market quality after decimalization. Journal of
Financial and Quantitative Analysis 38, 747–777.
Bollen, N.P.B., Busse, J.A., 2003. Common cents? Tick size, trading costs and mutual fund performance.
Working paper, Emory University.
Bollen, N.P.B., Whaley, R.E., 1998. Are ‘‘teenies’’ better? Journal of Portfolio Management 25, 10–24.
Chakravarty, S., Wood, R.A., Van Ness, R., 2004. Decimals and liquidity: a study of the NYSE. Journal
of Financial Research 27, 75–94.
Chan, L.K.C., Lakonishok, J., 1995. The behavior of stock prices around institutional trades. Journal of
Finance 50, 1147–1174.
15The following quote from a senior trader for State Street Research &Management Co reflects growing
consciousness among buy-side traders of the quality of their executions: ‘‘A few years ago I might have
checked our commission list to see who’s been trafficking the stock among the firms that provide us
research, and most likely I’d send it over to a broker. But now I’ll spend the extra time to get the best
execution.’’ (See ‘‘The Buy side wakes up,’’ The Institutional Investor, April 2002.)