Does Wheat Genetically Modified for Disease Resistance Affect Root-Colonizing Pseudomonads and Arbuscular Mycorrhizal Fungi? Joana Beatrice Meyer 1. , Yi Song-Wilson 2. , Andrea Foetzki 3 , Carolin Luginbu ¨ hl 3 , Michael Winzeler 3 , Yvan Kneubu ¨ hler 4 , Caterina Matasci 4 , Fabio Mascher-Frutschi 4 , Olena Kalinina 5 , Thomas Boller 2 , Christoph Keel 6 *, Monika Maurhofer 1 * 1 Plant Pathology, Institute of Integrative Biology, Swiss Federal Institute of Technology, Zurich, Switzerland, 2 Institute of Botany, University of Basel, Basel, Switzerland, 3 Agroscope Reckenholz-Ta ¨nikon Research Station ART, Zu ¨ rich, Switzerland, 4 Agroscope Changins-Wa ¨denswil Research Station ACW, Nyon, Switzerland, 5 Institute of Evolutionary Biology and Environmental Studies, University of Zurich, Zu ¨ rich, Switzerland, 6 Department of Fundamental Microbiology, University of Lausanne, Lausanne, Switzerland Abstract This study aimed to evaluate the impact of genetically modified (GM) wheat with introduced pm3b mildew resistance transgene, on two types of root-colonizing microorganisms, namely pseudomonads and arbuscular mycorrhizal fungi (AMF). Our investigations were carried out in field trials over three field seasons and at two locations. Serial dilution in selective King’s B medium and microscopy were used to assess the abundance of cultivable pseudomonads and AMF, respectively. We developed a denaturing gradient gel electrophoresis (DGGE) method to characterize the diversity of the pqqC gene, which is involved in Pseudomonas phosphate solubilization. A major result was that in the first field season Pseudomonas abundances and diversity on roots of GM pm3b lines, but also on non-GM sister lines were different from those of the parental lines and conventional wheat cultivars. This indicates a strong effect of the procedures by which these plants were created, as GM and sister lines were generated via tissue cultures and propagated in the greenhouse. Moreover, Pseudomonas population sizes and DGGE profiles varied considerably between individual GM lines with different genomic locations of the pm3b transgene. At individual time points, differences in Pseudomonas and AMF accumulation between GM and control lines were detected, but they were not consistent and much less pronounced than differences detected between young and old plants, different conventional wheat cultivars or at different locations and field seasons. Thus, we conclude that impacts of GM wheat on plant-beneficial root-colonizing microorganisms are minor and not of ecological importance. The cultivation-independent pqqC-DGGE approach proved to be a useful tool for monitoring the dynamics of Pseudomonas populations in a wheat field and even sensitive enough for detecting population responses to altered plant physiology. Citation: Meyer JB, Song-Wilson Y, Foetzki A, Luginbu ¨ hl C, Winzeler M, et al. (2013) Does Wheat Genetically Modified for Disease Resistance Affect Root- Colonizing Pseudomonads and Arbuscular Mycorrhizal Fungi? PLoS ONE 8(1): e53825. doi:10.1371/journal.pone.0053825 Editor: Zhengguang Zhang, Nanjing Agricultural University, China Received December 19, 2011; Accepted December 6, 2012; Published January 23, 2013 Copyright: ß 2013 Meyer et al. This is an open-access article distributed under the terms of the Creative Commons Attribution License, which permits unrestricted use, distribution, and reproduction in any medium, provided the original author and source are credited. Funding: This study was supported by the Swiss National Science Foundation (National Research Program NRP59, project 405940-115596). The funders had no role in study design, data collection and analysis, decision to publish, or preparation of the manuscript. Competing Interests: The authors have declared that no competing interests exist. * E-mail: [email protected] (MM); [email protected] (CK) . These authors contributed equally to this work. Introduction Plant-beneficial microorganisms are widely recognized as a crucial natural component of fertility in agricultural soils. Besides rhizobia and other N-fixing bacteria, there are two main groups of microorganisms known to be involved in plant growth promotion and plant health. The first group is the root-colonizing pseudo- monads. These bacteria increase plant growth either directly by the production of phytohormones and other stimulants and by increasing the bioavailability of nutrients in the soil or indirectly by the suppression of plant diseases and the induction of systemic resistance in the plant [1–3]. One major problem in crop production is the limited bioavailability of the essential macroele- ment phosphorus (P), because it forms highly insoluble iron/ aluminum oxide complexes in the soil [4]. Plant-beneficial pseudomonads are known to solubilize phosphate from these soil complexes, by the production of organic acids, mainly gluconic acid, for which they need the enzyme glucose dehydrogenase (GDH) and its cofactor pyrroloquinoline quinone (PQQ) [5,6]. The second group of plant-beneficial microorganisms is arbuscular mycorrhizal fungi (AMF). These fungi of the phylum Glomeromycota form mutualistic symbioses with 80% of terrestrial plant families, facilitating the uptake of water and mineral nutrients to their host plants while receiving carbohydrates in exchange [7]. They can also increase the plants’ resistance to biotic and abiotic stress factors while improving soil stability [8]. Because of their unequivocal importance, AMF are considered an excellent indicator of possible ecological impacts of genetically modified (GM) crops containing antifungal transgenes on soil microbial communities [9]. PLOS ONE | www.plosone.org 1 January 2013 | Volume 8 | Issue 1 | e53825
Transcript
Does Wheat Genetically Modified for Disease ResistanceAffect Root-Colonizing Pseudomonads and ArbuscularMycorrhizal Fungi?Joana Beatrice Meyer1., Yi Song-Wilson2., Andrea Foetzki3, Carolin Luginbuhl3, Michael Winzeler3,
Yvan Kneubuhler4, Caterina Matasci4, Fabio Mascher-Frutschi4, Olena Kalinina5, Thomas Boller2,
Christoph Keel6*, Monika Maurhofer1*
1 Plant Pathology, Institute of Integrative Biology, Swiss Federal Institute of Technology, Zurich, Switzerland, 2 Institute of Botany, University of Basel, Basel, Switzerland,
3 Agroscope Reckenholz-Tanikon Research Station ART, Zurich, Switzerland, 4 Agroscope Changins-Wadenswil Research Station ACW, Nyon, Switzerland, 5 Institute of
Evolutionary Biology and Environmental Studies, University of Zurich, Zurich, Switzerland, 6 Department of Fundamental Microbiology, University of Lausanne, Lausanne,
Switzerland
Abstract
This study aimed to evaluate the impact of genetically modified (GM) wheat with introduced pm3b mildew resistancetransgene, on two types of root-colonizing microorganisms, namely pseudomonads and arbuscular mycorrhizal fungi(AMF). Our investigations were carried out in field trials over three field seasons and at two locations. Serial dilution inselective King’s B medium and microscopy were used to assess the abundance of cultivable pseudomonads and AMF,respectively. We developed a denaturing gradient gel electrophoresis (DGGE) method to characterize the diversity of thepqqC gene, which is involved in Pseudomonas phosphate solubilization. A major result was that in the first field seasonPseudomonas abundances and diversity on roots of GM pm3b lines, but also on non-GM sister lines were different fromthose of the parental lines and conventional wheat cultivars. This indicates a strong effect of the procedures by which theseplants were created, as GM and sister lines were generated via tissue cultures and propagated in the greenhouse. Moreover,Pseudomonas population sizes and DGGE profiles varied considerably between individual GM lines with different genomiclocations of the pm3b transgene. At individual time points, differences in Pseudomonas and AMF accumulation between GMand control lines were detected, but they were not consistent and much less pronounced than differences detectedbetween young and old plants, different conventional wheat cultivars or at different locations and field seasons. Thus, weconclude that impacts of GM wheat on plant-beneficial root-colonizing microorganisms are minor and not of ecologicalimportance. The cultivation-independent pqqC-DGGE approach proved to be a useful tool for monitoring the dynamics ofPseudomonas populations in a wheat field and even sensitive enough for detecting population responses to altered plantphysiology.
Citation: Meyer JB, Song-Wilson Y, Foetzki A, Luginbuhl C, Winzeler M, et al. (2013) Does Wheat Genetically Modified for Disease Resistance Affect Root-Colonizing Pseudomonads and Arbuscular Mycorrhizal Fungi? PLoS ONE 8(1): e53825. doi:10.1371/journal.pone.0053825
Editor: Zhengguang Zhang, Nanjing Agricultural University, China
Received December 19, 2011; Accepted December 6, 2012; Published January 23, 2013
Copyright: � 2013 Meyer et al. This is an open-access article distributed under the terms of the Creative Commons Attribution License, which permitsunrestricted use, distribution, and reproduction in any medium, provided the original author and source are credited.
Funding: This study was supported by the Swiss National Science Foundation (National Research Program NRP59, project 405940-115596). The funders had norole in study design, data collection and analysis, decision to publish, or preparation of the manuscript.
Competing Interests: The authors have declared that no competing interests exist.
PLOS ONE | www.plosone.org 3 January 2013 | Volume 8 | Issue 1 | e53825
less abundant on the control cultivars (Fig. 2A and Fig. 3). In 2009
at the tillering stage, the differences between lines were smaller and
conventional cultivars did no significantly differ from the GM/
sister lines as found with MRPP (MRPP for binary data:
A = 0.020, P = 0.058 and frequency data: A = 0.030, P = 0.14).
Regarding population sizes, the differences also disappeared in
2009 and 2010 (Fig. 1D and 1F, Fig. 4).
Impact of introduced disease resistance genes/transgene
position effects. For the two Bobwhite lines transformed with
the powdery-mildew resistance gene pm3b, significant differences
to the corresponding control sister lines were found at certain time
points, but varied depending on the GM line. At the Reckenholz
site in 2008, line Pm3b#1 accumulated at both development
stages significantly less pseudomonads than its corresponding sister
line Sb#1 (Fig. 1B). In contrast, Pm3b#2 accumulated signifi-
cantly more pseudomonads than Sb#2 in the Reckenholz trials
2008 and 2010 (Fig. 1B and 1F). In the Reckenholz trial 2009 and
the Pully trial 2010 no pm3b transgene effect was found (Fig. 1D
and 1F). Interestingly pm3b lines behaved differently compared to
their sister lines in the Reckenholz mildew treatment in 2008 and
accumulated less pseudomonads in plots infected with the
pathogen in comparison to fungicide-treated plots. In contrast,
their sister lines and the conventional cultivars accumulated more
pseudomonads in mildew-infected plots (Table 1, Fig. 4). The
same difference between GM and sister lines was observed again
in the Reckenholz trial 2009 (Fig. 4). Throughout the experiments
we observed a transgene position effect; Pm3b#2 accumulated in
most comparisons more pseudomonads than Pm3b#1. This
difference was highly significant in 2008 (Table 1, Fig. 1B).
Major impacts: plant age, cultivar, cropping season and
field site. The factors which had clearly the strongest impact on
size and diversity of Pseudomonas populations on wheat roots were
the plant age, the cropping season, and regarding population sizes
also the cultivar (Table 1, Fig. 1, Fig. 2 and Fig. S2). In the
majority of the field trials we observed a consistent cultivar impact
with Bobwhite and Toronit accumulating less pseudomonads than
Frisal and Rubli (Table 1, Fig. 1 and Fig. 4). The most pronounced
impact on Pseudomonas populations, however, was the plant age. In
the years 2008 and 2009 at the Reckenholz location, Pseudomonas
populations decreased drastically (3–15 times in 2008, 10–45 times
in 2009), from roots of young plants to roots of older plants (Fig. 1B
and 1D). The average root colonization at the tillering stage
calculated for all wheat cultivars/lines was log 8.1 (2008) and log
8.3 (2009), and at the milky ripe stage log 7.0 (2008) and log 6.8
(2009). The plant age also significantly impacted on Pseudomonas
diversity in 2008 and 2009 as higher numbers of pqqC genotypes
were detected at the milky ripe stage (Table S2).
Fig. 2 shows correspondence analyses (CAs) of band frequency
matrices summarizing the factors impacting most on pqqC-DGGE
patterns in the field. Fig. 2A shows data from 2008 only. The first
three axes of the CA, which account for most of the variability,
explained 65.5% of the total variance. Plant age significantly
separates data into two groups (MRPP analysis: A = 0.090,
P = 0.003), with a clear distinction on the first axis (30% of the
total variance). In Fig. 2B including data from 2009, the first three
axes of the CA explained 76.6% of the total variance. This figure
shows that the field season even had the stronger effect (MRPP
analysis: A = 0.25, P,0.01) than the plant age with a clear
separation of the DGGE patterns on the first axis explaining 49%
of the total variance. Mostly responsible for differences between
seasons were genotypes H and I (H: P. fluorescens subgroup 1e; I: P.
fluorescens subgroup 1b) which were present on all roots in 2009 but
much less frequent in 2008. MDS analyses based on band
presence/absence data of individual replicates revealed similar
results also identifying the field season (MRPP analysis: A = 0.20,
P,0.01) and the plant age (MRPP analysis: A = 0.10, P,0.01) as
the factors impacting significantly on pqqC DGGE patterns (Fig.
S2).
Also the glm analysis identified the field season as a factor
impacting on pqqC diversity, as more pqqC genotypes were found in
2009 (Table S2) compared to 2008. Differences among field sites
were analyzed in 2010 only for population sizes and not for pqqC
diversity. Pseudomonas populations were lower at the Pully site than
at the Reckenholz site (Table 1, Fig. 1F).
Impacts on AMF abundanceOnly few of the investigated factors had a significant impact on
AMF root populations. The plant age clearly had the strongest
effect on populations of wheat root-colonizing AMF (Table 1). In
contrast to the pseudomonads, AMF populations markedly
increased (1.5–3 times) from young to older plants and reached
23–26% root surface coverage at the milky ripe stage.
In 2008 a significant transgene impact was found in both
experiments (Table 1). In experiment 1 root colonization of
Pm3b#1, was colonized to a 65% higher extent than the
Table 1. Cont.
Analyzed samples Significant effects
Total pseudomonads per g rootsb Total AMF per g roots
Reckenholz and Pully 2010
Both field sites together Field site (Pully,Reckenholz) -
Reckenholz, milky ripe stage pm3b transgene -
(Sb#2,Pm3b#2)
Pully, milky ripe stage Wheat cultivar -
(Bobwhite,Rubli)
aIn 2008 two experiments were performed: experiment 1 with comparisons of different plant lines at two development stages and experiment 2 with comparisons ofdifferent plant lines grown in mildew-infected and in fungicide-treated plots at the milky ripe stage. Plants were artificially infected by planting heavily mildew-infectedplants in spreader rows [10].bCultivable pseudomonads were quantified by serial dilution in KB+++ medium.cSignificant differences resulting from pairwise comparisons of individual wheat lines/cultivars are indicated in italics. eg. Toronit,Frisal = Toronit had significantlysmaller Pseudomonas population sizes on its roots (or root surface colonized by AMF) compared to Frisal.doi:10.1371/journal.pone.0053825.t001
Impact of GM Wheat on Microorganisms on Roots
PLOS ONE | www.plosone.org 4 January 2013 | Volume 8 | Issue 1 | e53825
Figure 1. Colonization of roots of transgenic and non-transgenic wheat by arbuscular mycorrhizal fungi (AMF) (A, C, E) andcultivable pseudomonads (B, D, F) in field trials performed in 2008, 2009 and 2010. Roots were sampled at the tillering (B, D) and themilky ripe stage (A–F) at Reckenholz (A–F) and Pully (E, F). Relative colonization: root colonization by AMF was expressed for each wheat line/cultivarrelative to the average colonization calculated for all wheat lines. Significant differences (P,0.05) are listed in Table 1. Pm3b = GM lines, Sb = non-GMsister lines. Bars indicate the standard error of the estimate. Significant differences (P,0.05) detected by pairwise comparisons A) Pm3b#1 vs Sb#1;B) tillering stage: Pm3b#1 vs Sb#1 and Pm3b#2; B) milky ripe stage: Pm3b#1 vs Sb#1 and Pm3b#2, Sb#1 vs Pm3b#2, Bobwhite vs Frisal andToronit; D) milky ripe stage: Toronit vs Frisal; F) Reckenholz: Sb#2 vs Pm3b#2; F) Pully: Bobwhite vs Rubli.doi:10.1371/journal.pone.0053825.g001
Impact of GM Wheat on Microorganisms on Roots
PLOS ONE | www.plosone.org 5 January 2013 | Volume 8 | Issue 1 | e53825
corresponding sister line (Fig. 1A). For Pm3b#2, however,
opposite effects were found with the GM line displaying lower
AMF colonization rates than the sister line. This effect was only
significant in the mildew infection experiment (exp. 2). In both
treatments (fungicide and mildew) the colonization of Pm3b#2
roots was 2.5 times lower compared to the non-transgenic sister
line Sb#2 and AMF covered only 12% of the root surface.
In contrast to the pseudomonads, for AMF only in 2009 in the
mildew treatment a significant cultivar effect was observed
(Table 1). The AMF-covered root surface of Toronit and Rubli
(35%) was 50% larger than that of Bobwhite, which only reached
23%.
Discussion
We report here on a large-scale field study which aimed at
comparing the impact of GM wheat modified for disease
resistance on plant-beneficial pseudomonads and AMF with the
impact of other factors root-colonizing microorganisms encoun-
tered in agricultural systems. One of the major outcomes was that
not the transgene insertion did alter microbial diversity and
population sizes, but that the procedure of producing GM wheat
itself showed a strong influence. Both sister lines and pm3b
Bobwhite lines supported communities of pseudomonads that
differed in their composition from those of the parental lines, but
also from the other tested conventional cultivars (Table S2,
Fig. 2A). Furthermore, in the first field season the parental
Bobwhite cultivar accumulated less pseudomonads than the GM
and sister lines (Table 1, Fig. 1B). This demonstrates the
importance of using the correct control lines. If the Bobwhite
sister lines (null segregants) had been omitted in the field
experiments and only the parental line had been used as control
as in many earlier studies on GM plants, differences found
between GM and non-GM parental lines most probably would
have been attributed to effects of the introduced disease resistance
genes. Most transgene impact studies, so far, included as control
mainly the non-transgenic parental line and only few studies also
included other controls such as lines carrying only the selectable
marker, lines carrying the empty vector or non-transgenic isolines
[22–27]. Lines carrying only the selectable marker or the empty
vector, however, are produced independently from the GM lines,
whereas each sister line we used here derives from the same F1
generation as the corresponding GM line. The differentiation
GM/sister Bobwhite lines and conventional wheat disappeared in
the subsequent years where field propagated seeds had been used
for all entries in the field trials (Table 1 and S2, Fig. 1). We suggest
that these lines had quickly adapted to field conditions.
The major differences between conventional cultivars (including
Bobwhite) and the Bobwhite GM and sister lines were the
preference of the manipulated lines for genotypes M and N
identified as belonging to P. fluorescens subgroup 1 g containing also
reference strain SBW25 (Fig. S1) [6] and of the conventional
wheat for genotype J showing most similarity to P. fluorescens
subgroup 1e. Interestingly genotype M was also strongly induced
by powdery mildew infection and mechanical injury by vandals
(data not shown). Plants, which accumulated genotype M, in
general also supported higher Pseudomonas populations. It would be
interesting to assess in further experiments whether certain
Pseudomonas genotypes are particularly adapted to root exudates
released by stressed plants and are able to outcompete others
under such conditions.
What exactly had caused these differences in Pseudomonas
abundance and diversity between Bobwhite sister/GM lines and
the parental line remains unclear. Since Bobwhite GM and sister
lines did not differ in development [10], we can exclude that the
Figure 2. Ordination biplots generated by correspondence analysis (CA) of pqqC-DGGE profiles from wheat root samples. DGGEbands (letters a–n) incorporated in the CA are shown. The size and position of the blue bullets reflect the contribution of each band to thedistribution pattern. Graph A shows plants grown in the Reckenholz field trial in 2008 (experiment 1) and sampled at the tillering (H1) and at themilky ripe stage (H2). Graph B additionally includes data from Reckenholz field trial 2009 obtained from plants harvested at the tillering stage (H1).GM and SIST = GM Bobwhite (pm3b) and non-GM Bobwhite sister lines; WT = conventional non-GM wheat cultivars Frisal (or Fris), Toronit (or Tor),Rubli (or Rub) and Bobwhite (or Bob).doi:10.1371/journal.pone.0053825.g002
Impact of GM Wheat on Microorganisms on Roots
PLOS ONE | www.plosone.org 6 January 2013 | Volume 8 | Issue 1 | e53825
detected differences in Pseudomonas communities were due to
differences in plant development stages at the time of sampling.
Obviously the manner the seeds of these plants used for the
Reckenholz trial 2008 were produced had altered plant physiol-
ogy. GM and sister lines underwent the transformation process,
were generated via tissue cultures and then propagated in the
greenhouse. Any of these procedures, alone or in combination,
might have had somaclonal effects resulting in physiological
changes as shown previously [28,29]. Altered plant physiology due
to stress, pathogen attack, genotype or environment effects can
alter the amount and/or the composition of root exudates, which
can have a strong impact on root-colonizing pseudomonads and
their expression of plant-beneficial traits [5,30–33]. Another
interesting outcome was that changed plant physiologies caused
by different genomic locations of the pm3b transgene caused
similar differences as found between transgenic/sister lines and
conventional wheat. In 2008 where most pronounced differences
between GM and sister lines were found, Pm3b#1 accumulated
less pseudomonads but more AMF, Pm3b#2 in contrast, more
pseudomonads but less AMF than the corresponding sister line
(Fig. 1A and 1B). In addition more pqqC genotypes were found on
Pm3b#1 compared to Pm3b#2. So what is the difference
between these lines? Pm3b#1 expresses the transgene at much
lower levels than Pm3b#2 [10] and does not display strong
pleiotropic effects. In contrast, Pm3b#2 had the highest pm3b
expression levels, which resulted in several pleiotropic effects such
as chlorotic leaves, reduced stomatal conductance, smaller plant
height and altered flower morphology [10] what caused the side-
effect of infection by the ergot pathogen Claviceps purpurea [13].
These physiological differences might have resulted in altered root
exudations, which in the end had an impact on microbial
abundances. A study illustrating such an effect is that of Li et al.
[34] which shows that GM cotton lines transformed with Cry1Ac/
CpTI- and Cry1Ac, release root exudates with increased sugar
content what causes them to be more susceptible to Fusarium
oxysporum infection than the parental line.
In contrast to the GM impact, the cultivar impact on
Pseudomonas accumulation was very consistent throughout the
experiments as for example the Mexican cultivar Bobwhite
supported generally lower populations than the Swiss cultivars
Frisal and Rubli over three field seasons, two field locations and
two treatments. The wheat genotype is indeed known to modulate
root-associated pseudomonads and their activity through the
release of specific compounds in the root exudate [31,32,35,36].
AMF populations, however, were much less affected by the wheat
cultivar.
Finally, the major factors that affected AMF and Pseudomonas
accumulation and also Pseudomonas diversity were the plant age, the
field site and the field season. Considering plant age, Pseudomonas
population sizes on the roots of older plants were considerably
lower than at the tillering stage (Fig. 1B and 1D). In contrast, the
area of roots colonized by AMF increased from young to older
plants, as is typical for this symbiosis. Pseudomonads are
considered to be aggressive colonizers, adapted to rapidly
colonizing free niches, such as the roots of young plants rich in
carbon sources and amino acids and outcompeting other
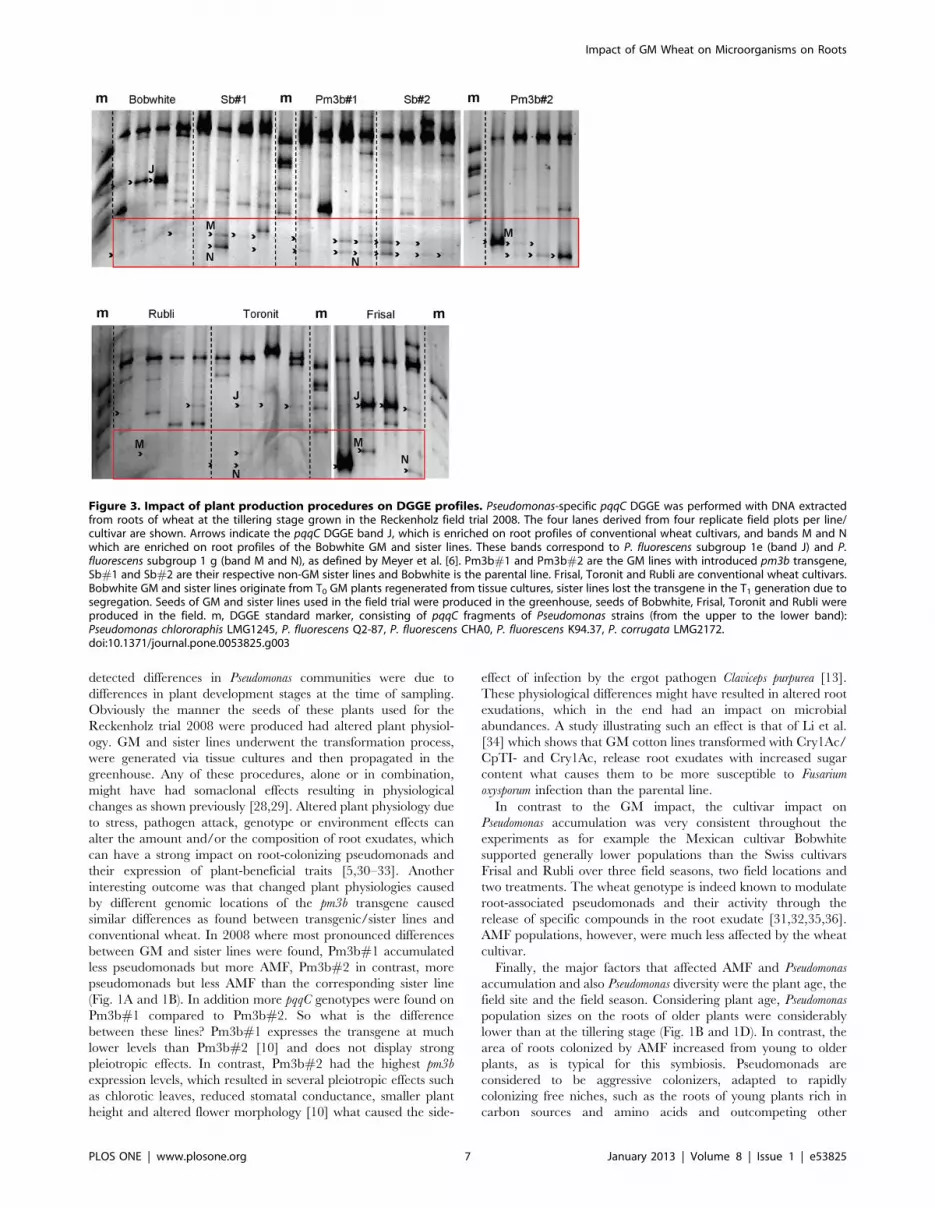
Figure 3. Impact of plant production procedures on DGGE profiles. Pseudomonas-specific pqqC DGGE was performed with DNA extractedfrom roots of wheat at the tillering stage grown in the Reckenholz field trial 2008. The four lanes derived from four replicate field plots per line/cultivar are shown. Arrows indicate the pqqC DGGE band J, which is enriched on root profiles of conventional wheat cultivars, and bands M and Nwhich are enriched on root profiles of the Bobwhite GM and sister lines. These bands correspond to P. fluorescens subgroup 1e (band J) and P.fluorescens subgroup 1 g (band M and N), as defined by Meyer et al. [6]. Pm3b#1 and Pm3b#2 are the GM lines with introduced pm3b transgene,Sb#1 and Sb#2 are their respective non-GM sister lines and Bobwhite is the parental line. Frisal, Toronit and Rubli are conventional wheat cultivars.Bobwhite GM and sister lines originate from T0 GM plants regenerated from tissue cultures, sister lines lost the transgene in the T1 generation due tosegregation. Seeds of GM and sister lines used in the field trial were produced in the greenhouse, seeds of Bobwhite, Frisal, Toronit and Rubli wereproduced in the field. m, DGGE standard marker, consisting of pqqC fragments of Pseudomonas strains (from the upper to the lower band):Pseudomonas chlororaphis LMG1245, P. fluorescens Q2-87, P. fluorescens CHA0, P. fluorescens K94.37, P. corrugata LMG2172.doi:10.1371/journal.pone.0053825.g003
Impact of GM Wheat on Microorganisms on Roots
PLOS ONE | www.plosone.org 7 January 2013 | Volume 8 | Issue 1 | e53825
microorganisms [37]. On older plants, population sizes decrease
since other microorganisms, among them also AMF, establish
themselves in the rhizosphere. The decline from young to mature
plants has been described earlier [38,39]. Opposite dynamics of
AMF and Pseudomonas populations in wheat fields in response to
the plant age have also been observed before [38]. It was shown in
a field experiment that inoculation of spring wheat with different
Pseudomonas spp. can reduce AMF colonization [40]. Pseudomo-
nads have also been found to have a direct inhibitory effect on
AMF spore germination through the release of volatile compounds
[41]. It is therefore difficult to distinguish between physiological
effects of a growing plant on Pseudomonas and AMF population
sizes and possible effects of direct interaction of the two groups of
microorganisms. Beside plant-induced changes, different environ-
occurring at different field sites and in different cropping seasons
considerably shaped microorganism communities in our study, a
common phenomenon, which is especially observed for the very
dynamic pseudomonads since these are sensitive to many
environmental factors [35,42–48].
In summary, comparing all studied factors, introduced trans-
genes had only a minor effect on the microbial populations. Our
study on AMF and pseudomonads revealed similar results as
studies on other non-target organisms performed by different
groups in the frame of the same field experiments. These studies
showed no relevant impact of the pm3b on the abundance of
aphids, the cereal leaf beetle Oulema malanopus or the wheat stem fly
Chlorops pumilionis [49], on the dipterans Drosophila melanogaster and
Megaselia scalaris [50], on the annelid Enchytraeus albidus [51], on
aphid-parasitoid food webs [52,53] and on soil decomposition
activity and soil fauna [54].
Work on the impact of GM crop plants on target and non-target
fungi and on microbial communities has been reviewed by several
authors [14,15,18,20,21]. As summarized in these reviews, most
studies on GM plants had little or no impact on non-target fungi
and bacteria. However, in some exceptional cases, transgenic
plants showed a reduction of colonization by AMF [55]. In the
extensive review by Stefani and Hamelin [18] it is concluded that
transgenic plants should be evaluated on a case-by-case basis. Our
results indicate that the transgenic wheat lines studied are not
affected with regard to their ability to form the arbuscular
mycorrhizal symbiosis and to be colonized by pseudomonads.
Conclusion. Our field study is the first evaluating the impact
of GM wheat on two specific groups of root-colonizing microor-
ganisms over three consecutive field seasons and at two different
field sites. The greatest advantage was the possibility to compare
Figure 4. Impact of powdery mildew infection on population sizes of cultivable pseudomonads on roots of GM and non-GM wheatgrown in field trials at Reckenholz 2008 (experiment 2) (A) and 2009 (B). Roots were sampled at the milky ripe stage. PM infection = plantsinoculated with powdery mildew. Fungicide = plants were treated with the fungicide Prosper. In 2009 data for the powdery mildew infected Toronitare missing. Bars indicate standard errors of the means. Mildew-infected plants differed significantly form fungicide treated plants in 2008, but not in2009 (Table 1). Significant differences (P,0.05) detected by pairwise comparisons: A) PM infected: Pm3b#1 vs Sb#1, B) Fungicide: Toronit vs Frisal.doi:10.1371/journal.pone.0053825.g004
Impact of GM Wheat on Microorganisms on Roots
PLOS ONE | www.plosone.org 8 January 2013 | Volume 8 | Issue 1 | e53825
each GM line with the corresponding T0 segregant sister line,
which allowed distinguishing between true transgene effects and
effects of the methods by which GM lines were produced.
Effectively, we show that such effects can be very relevant and if
not considered might lead to false conclusions about GM impacts.
The detected transgene effects were minor, opposite for individual
GM lines and not consistent; we thus conclude that they are not of
ecological importance. We furthermore demonstrated that pqqC is
a molecular marker sensitive enough to detect differences even
between Pseudomonas community compositions on plants grown
from seeds produced in the field and on plants grown from seeds
derived from laboratory and greenhouse production.
Materials and Methods
Bacteria and plants used in the studyPseudomonas strains. Pseudomonas spp. strains used in this
study are listed in Table S1. Test isolates RW09-C35 to C65 for
DGGE (see below) were isolated from the roots of wheat grown in
the Reckenholz field trial 2008 as described earlier [6]. Bacterial
strains were grown at 27uC in 10 ml liquid King’s medium B [56]
agar containing 40 mg/ml ampicillin, 13 mg/ml chloramphenicol
and 100 mg/ml cycloheximide (KBM +++) for 24 h on a rotary
shaker (Kuhner AG, Birsfelden, Switzerland) at 120 rpm. For
DGGE, genomic DNA from bacterial strains used as template in
PCR was obtained by lysing bacterial suspensions for 10 min at
96uC, subsequent centrifugation and collection of the superna-
tants.
Wheat cultivars. The conventional wheat cultivars used for
investigation of Pseudomonas and AMF populations on roots were
the Swiss cultivars Toronit, Rubli and Frisal and the Mexican
cultivar Bobwhite SH 98 26. Two GM Bobwhite lines Pm3b#1
and Pm3b#2 used in the field trials were created by inserting the
pm3b gene of hexaploid wheat into the genome of the parental line
(Table S1), and (iv) 76 RW09-NC clones obtained from wheat
roots as described in Meyer et al. [6] (Genbank database accession
numbers JN397402 - 477). The alignment of DNA sequences was
performed with ClustalW 1.8 implemented in the MEGA software
version 4.0 package [62]. The phylogenetic tree shown in Fig. S1
was constructed with the MEGA software version 4.0 [62], using
the neighbour-joining (NJ) method [63].
Analysis of DGGE band patterns. DGGE patterns were
converted into binary matrices (presence vs. absence of bands for
each plant replicate) and subsequently the results of four or five
(Reckenholz 2009) replicates were converted to frequency matrices
(frequency of band occurrence). Correspondence analysis (CA) was
performed on frequency matrixes using the Vegan package in R
Project for Statistical Computing, version 2.11.1 [64]. Multidi-
mensional scaling (MDS) was built to analyse relationship among
samples based on the binary matrices. MDS was performed with
R, using the Jaccard coefficient. MRPP (Multiple Response
Permutation Procedure) [65] was used to examine potential
impacts of plant production procedure, plant age and sampling
year on the diversity of the Pseudomonas communities on wheat
roots, based on their DGGE profiles (presence/absence matrices
of individual replicates and frequency matrices of pooled
replicates). MRPP was performed in R, using 999 permutation
runs and the Jaccard distance matrix. In MRPP a significant delta
statistic (P,0.05) indicates that the groups are more different than
expected by chance; however it is dependent on the sample size.
The MRPP calculates also an effect size A (chance-corrected
within-group agreement), which relates the observed intra-group
average distance to the mean of the calculated distribution. When
the effect size A = 1, all items within groups are are identical. The
closer A is to 1, the tighter is the grouping. In ecology A.0.3 is
fairly high and A,0.1 is common.
Additionally, to analyze relationships between diversity based
genotype numberand factors such as plant line, replicate (block)
effect, plant age, field season, plant production procedures and
damage level (vandals damage) a generalized linear model (glm)
[66] was fitted on the number of pqqC genotypes/bands present
per plant sample using R.
Statistical analysis of population sizesPseudomonas spp. and AMF population sizes were analyzed by
analysis of variance (ANOVA) with a significant threshold below
0.05 using the software GenStat 13th Edition (VSN International
Ltd). Pseudomonas population size data were log-transformed prior
to the analysis. Then multiple regression models were fitted to
analyze the effects of different factors which varied between
individual field trials. The normality and homoscedasticity of the
model was examined through residual plots. Models with three
hierarchical steps were used for the analysis of Bobwhite lines: 1)
comparing the Bowhite parental line with all manipulated lines
(GM and sister lines), 2) comparing all GM lines with all sister lines
and 3) comparing individual GM or sister lines (e.g. Pm3b#1 vs
Pm3b#2) or 1) comparing Bobwhite parental line with all
manipulated lines 2) comparing lines derived from individual
transformation events (Pm3b#1 and Sb#1 vs Pm3b#2 and Sb#2
and 3) comparing individual sister lines and GM lines (e.g.
Pm3b#1 vs. Sb#1).
On 13th June 2008 (between the first and the second sampling)
part of the plots were destroyed by an act of vandalism. To
estimate this impact, plant damage was scored in each plot. A
regression analysis showed that total Pseudomonas population sizes
on roots harvested at the milky ripe stage diminished slightly with
increasing plot damage: Y (log CFU/g roots) = 20.256(plot
damage level)+7.80, R2 = 0.12, n = 320 (number of plots of all
plants present on the field) and mycorrhizal population increased
slightly: Y (% colonized roots) = 0.0156(plot damage level)+0.09,
Impact of GM Wheat on Microorganisms on Roots
PLOS ONE | www.plosone.org 10 January 2013 | Volume 8 | Issue 1 | e53825
R2 = 0.06, n = 320. This damage effect could be removed in the
graphical representations by multiplying the data with the slope
from the regression analysis and in the statistical analysis by adding
the factor plot damage as a covariance. Error bars displayed in the
figures represent the root mean square error (also known as the
standard error of the estimate).
Supporting Information
Figure S1 Phylogenetic relationship among pqqC-DGGEbands obtained from wheat root samples in the Reck-enholz field trials 2008 and 2009, Pseudomonas refer-ence strains and Pseudomonas wheat root isolates.(DOC)
Table S1 Bacterial strains and isolates used in thisstudy.(DOC)
Table S2 Significant factors impacting on pqqC diver-sity within pseudomonads colonizing wheat roots in thefield trials performed at Reckenholz in 2008 (experi-ment 1, Table 1) and 2009.
(DOC)
Acknowledgments
We thank all the persons who helped during the field work, Aria Maya
Minder and Tania Torossi from the Genetic Diversity Centre ETH Zurich
as well as Carola Maffioli and Yannik Duport for technical support, Daniel
Croll, Henry Muller and Massimiliano Cardinale for assistance with
statistical and DGGE analysis and Josef Zeyer for supplying technical
material.
Author Contributions
Conceived and designed the experiments: JBM YSW AF CL MW YK
FMF MM. Performed the experiments: JBM YSW AF CL MW YK CM
FMF MM. Analyzed the data: JBM YSW OK. Contributed reagents/
materials/analysis tools: JBM YSW AF CL MW YK CM FMF TB MM
OK CK. Wrote the paper: JBM YSW MM.
References
1. Haas D, Defago G (2005) Biological control of soil-borne pathogens byfluorescent pseudomonads. Nat Rev Microbiol 3: 307–319.
2. Haas D, Keel C (2003) Regulation of antibiotic production in root-colonizing
Pseudomonas spp. and relevance for biological control of plant disease. Annu RevPhytopathol 41: 117–153.
3. Mendes R, Kruijt M, de Bruijn I, Dekkers E, van der Voort M, et al. (2011)
Deciphering the rhizosphere microbiome for disease-suppressive bacteria.
perspective and future prospects. Am J Alternative Agr 1: 51–57.
5. de Werra P, Pechy-Tarr M, Keel C, Maurhofer M (2009) Role of gluconic acid
production in the regulation of biocontrol traits of Pseudomonas fluorescens CHA0.Appl Environ Microbiol 75: 4162–4174.
6. Meyer JB, Frapolli M, Keel C, Maurhofer M (2011) Pyrroloquinoline quinone
biosynthetic gene pqqC: a novel molecular marker for studying phylogeny anddiversity of phosphate-solubilizing pseudomonads. Appl Environ Microbiol 77:
7345–7354.
7. Smith SE, Read DJ (2008) Mycorrhizal symbiosis. Cambridge, UnitedKingdom. Academic Press. 301 p.
pathogen protection by arbuscular mycorrhizas: A role for fungal diversity?Pedobiologia 53: 197–201.
9. Liu WK (2010) Do genetically modified plants impact arbuscular mycorrhizal
fungi? Ecotoxicology 19: 229–238.
10. Brunner S, Hurni S, Herren G, Kalinina O, von Burg S, et al. (2011) Transgenic
Pm3b wheat lines show resistance to powdery mildew in the field. Plant Biotech J9: 897–910.
11. Bull SE, Owiti JA, Niklaus M, Beeching JR, Gruissem W, et al. (2009)
Agrobacterium-mediated transformation of friable embryogenic calli andregeneration of transgenic cassava. Nature Protocols 4: 1845–1854.
12. Kalinina O, Zeller SL, Schmid B (2011) Competitive performance of transgenic
wheat resistant to powdery mildew. PLoS ONE 6: e28091.
13. Zeller SL, Kalinina O, Brunner S, Keller B, Schmid B (2010) Transgene6en-vironment interactions in genetically modified wheat. PLoS ONE 5: e11405.
14. Cerdeira AL, Duke SO (2006) The current status and environmental impacts of
glyphosate-resistant crops: A review. J Environ Qual 35: 1633–1658.
15. Dunfield KE, Germida JJ (2004) Impact of genetically modified crops on soil-and plant-associated microbial communities. J Environ Qual 33: 806–815.
16. Gschwendtner S, Reichmann M, Muller M, Radl V, Munch JC, et al. (2010)
Effects of genetically modified amylopectin-accumulating potato plants on theabundance of beneficial and pathogenic microorganisms in the rhizosphere.
Plant Soil 335: 413–422.
17. Gyamfi S, Pfeifer U, Stierschneider M, Sessitsch A (2002) Effects of transgenic
glufosinate-tolerant oilseed rape (Brassica napus) and the associated herbicideapplication on eubacterial and Pseudomonas communities in the rhizosphere.
FEMS Microbiol Ecol 41: 181–190.
18. Stefani FOP, Hamelin RC (2010) Current state of genetically modified plantimpact on target and non-target fungi. Environ Rev 18: 441–475.
19. Weinert N, Meincke R, Gottwald C, Heuer H, Gomes NC, et al. (2009)
Rhizosphere communities of genetically modified zeaxanthin-accumulatingpotato plants and their parent cultivar differ less than those of different potato
cultivars. Appl Environ Microbiol 75: 3859–3865.
20. Weinert N, Meincke R, Schloter M, Berg G, Smalla K (2010) Effects ofgenetically modified plants on soil microorganisms. In: Mitchell R, Gu JD,
editors. Environ Microbiol, Second Edition. Hoboken: Wiley-Blackwell Press,
10: 235–258.
21. Widmer F (2007) Assessing effects of transgenic crops on soil microbial
communities. Adv Biochem Eng Biotechnol 107: 207–234.
22. Becker R, Behrendt U, Hommel B, Kropf S, Ulrich A (2008) Effects of
transgenic fructan-producing potatoes on the community structure of rhizo-
sphere and phyllosphere bacteria. FEMS Microbiol Ecol 66: 411–425.
23. Heuer H, Kroppenstedt RM, Lottmann J, Berg G, Smalla K (2002) Effects of T4
lysozyme release from transgenic potato roots on bacterial rhizosphere
communities are negligible relative to natural factors. Appl Environ Microbiol
68: 1325–1335.
24. Lemarche J, Hamelin RC (2007) No evidence of an impact on the rhizosphere
diazotroph community by the expression of Bacillus thuringiensis Cry1Ab toxin by
Bt white spruce. Appl Environ Microbiol 73: 6577–6583.
25. Lottmann J, Heuer H, Smalla K, Berg G (1999) Influence of transgenic T4-
lysozyme-producing potato plants on potentially beneficial plant-associated
bacteria. FEMS Microbiol Ecol 29: 365–377.
26. Lottmann J, Heuer H, de Vries J, Mahn A, During K, et al. (2000)
Establishment of introduced antagonistic bacteria in the rhizosphere of
transgenic potatoes and their effect on the bacterial community. FEMS
Microbiol Ecol 33: 41–49.
27. Mulder C, Wouterse M, Raubuch M, Roelofs W, Rutgers M (2006) Can
33. Notz R, Maurhofer M, Dubach H, Haas D, Defago G (2002) Fusaric acid-
producing strains of Fusarium oxysporum alter 2,4-diacetylphloroglucinol biosyn-
thetic gene expression in Pseudomonas fluorescens CHA0 in vitro and in the
rhizosphere of wheat. Appl Environ Microbiol 68: 2229–2235.
34. Li X, Liu B, Heia S, Liu DD, Han ZM, et al. (2009) The effect of root exudates
from two transgenic insect-resistant cotton lines on the growth of Fusarium
oxysporum. Transgenic Res 18: 757–767.
35. Costa R, Gomes NCM, Krogerrecklenfort E, Opelt K, Berg G, et al. (2007)
Pseudomonas community structure and antagonistic potential in the rhizosphere:
insights gained by combining phylogenetic and functional gene-based analysis.
Environ Microbiol 9: 2260–2273.
36. Meyer JB, Lutz MP, Frapolli M, Pechy-Tarr M, Rochat L, et al. (2010) Interplay
between wheat cultivars, biocontrol pseudomonads, and soil. Appl Environ
Microbiol 76: 6196–6204.
Impact of GM Wheat on Microorganisms on Roots
PLOS ONE | www.plosone.org 11 January 2013 | Volume 8 | Issue 1 | e53825
37. Lugtenberg B, Kamilova F (2009) Plant growth-promoting rhizobacteria. Annu
Rev Microbiol 63: 541–556.38. Fliessbach A, Winkler M, Lutz MP, Oberholzer HR, Mader P (2009) Soil
amendment with Pseudomonas fluorescens CHA0: lasting effects on soil biological
properties in soils low in microbial biomass and activity. Microb Ecol 57: 611–623.
39. Miller HJ, Liljeroth E, Henken G, van Veen JA (1990) Fluctuations in thefluorescent pseudomonad and actinomycete populations of rhizosphere and
rhizoplane during the growth of spring wheat. Can J Microbiol 36: 254–258.
40. Walley FL, Germida JJ (1997) Response of spring wheat (Triticum aestivum) tointeractions between Pseudomonas species and Glomus clarum NT4. Biol Fert Soils
24: 365–371.41. Xavier LJC, Germida JJ (2002) Response of lentil to co-inoculation with
arbuscular mycorrhizal fungi and rhizobia varying in efficacy. Soil Biol Biochem34: 181–188.
42. Frapolli M, Moenne-Loccoz Y, Meyer J, Defago G (2008) A new DGGE
protocol targeting 2,4-diacetylphloroglucinol biosynthetic gene phlD fromphylogenetically contrasted biocontrol pseudomonads for assessment of
disease-suppressive soils. FEMS Microbiol Ecol 64: 468–481.43. Frapolli M, Defago G, Moenne-Loccoz Y (2010) Denaturing gradient gel
electrophoretic analysis of dominant 2,4-diacetylphloroglucinol biosynthetic phlD
alleles in fluorescent Pseudomonas from soils suppressive or conducive to black rootrot of tobacco. Soil Biol Biochem 42: 649–656.
44. Mascher F, Schnider-Keel U, Haas D, Defago G, Moenne-Loccoz Y (2003)Persistence and cell culturability of biocontrol strain Pseudomonas fluorescens CHA0
under plough pan conditions in soil and influence of the anaerobic regulatorgene anr. Environ Microbiol 5: 103–115.
45. Ramette A, Moenne-Loccoz Y, Defago G (2006) Genetic diversity and
biocontrol potential of fluorescent pseudomonads producing phloroglucinolsand HCN from Swiss soils naturally suppressive or conducive to Thielaviopsis
basicola-mediated black root rot of tobacco. FEMS Microbiol Ecol 55: 369–381.46. Svercel M, Christen D, Moenne-Loccoz Y, Duffy B, Defago G (2009) Effect of
long-term vineyard monoculture on rhizosphere populations of pseudomonads
47. van Overbeek L, van Elsas JD (2008) Effects of plant genotype and growth stageon the structure of bacterial communities associated with potato (Solanum
tuberosum L.). FEMS Microbiol Ecol 64: 283–296.48. Viebahn M, Doornbos R, Wernars K, Van Loon LC, Smit E, et al. (2005)
Ascomycetes communities in the rhizosphere of field-grown wheat are not
affected by introductions of genetically modified Pseudomonas putida WCS358r.Environ Microbiol 7: 1775–1785.
49. Alvarez-Alfageme F, von Burg S, Romeis J (2011) Infestation of transgenicpowdery mildew-resistant wheat by naturally occurring insect herbivores under
different environmental conditions. PLoS ONE 6: e22690.
50. Peter M, Lindfeld A, Nentwig W (2010) Does GM wheat affect saprophagous
Diptera species (Drosophilidae, Phoridae)? Pedobiologia 53: 271–279.
51. Lindfeld A, Lang C, Knop E, Nentwig W (2011) Hard to digest or a piece of
cake? Does GM wheat affect survival and reproduction of Enchytraeus albidus