Abstract. The German DredgDikes research dike was built in the spring of 2012 to investigate whether different fine-grained organic dredged materials can be used as dike cover materials. In full-scale experiments both seepage and overflowing tests can be performed and the vegetation development can be evaluated. The test dike consists of a three-polder-system with ten different sections with varying slope inclinations, materials and geosynthetic solutions. During the construction work and after completion of the research dike extensive instrumentation was installed to record the seepage line inside the dike. A total of 56 tensiometers measure the suction pressure at different locations in the cover layer and ten moisture sensors provide comparable data to some of the tensiometers at the bottom of the inner slope in a depth of 0.5 m. On the crest of each of the different cross-sections two standpipes were installed to measure the seepage line in the dike core and 30 moisture sensors in the sand cores support this data. At six sections, tipping counters record the seepage water at the dike toe of the inner slope. One year after completion of the test dike eight seepage experiments were performed in 2013 when the grass cover on the embankments was well established. Each of the three polders was filled repeatedly and moisture and water level data were recorded and analysed. A qualitative evaluation method was used to compare the cross-sections with respect to seepage. The results show that the cross-sections with geosynthetic in-plane reinforcement allow less seepage water to enter the dike core compared to the cross-sections without reinforce-ment. In the near future, quantitative evaluation methods will be applied to compare the cross-sections and the results will be compared to numerical model data. Keywords: dredged materials, dike, seepage line, moisture sensors
1. Introduction Floods and storm surges have become more frequent during the past few decades, with increasing peaks and longer duration of flood events. Consequently damaged dikes need reconstruction and many existing protection structures need increased crest levels to provide better protection of the hinterland. On dikes at the Baltic coast of Mecklenburg-West Pomerania usually marl has been used as dike cover material which is a natural resource often mined in environmentally sensitive areas. There-fore, alternative dike construction materials are gaining importance, regarding both the protection of marl as a natural resource and of the environment.
For the navigability of waterways and harbour facilities, dredging works are necessary. The sediments are mostly relocated or taken out of the water. The dredged materials vary in mineralogical and chemical composition and characteristics along the coast. A great percentage of these materials is not contaminated, hence the sediments could be used to replace other construction materials. Dredged materials have already
been used as recultivation layers for landfills, in agriculture, backfilling of new land in harbours, and some attempts in dike constructions have been made (HTG 2006). Still, the application of fine-grained and organic dredged materials in dike construction is a rather new idea. During the past years research activi-ties were started at the University of Hamburg (Gröngröft et al. 2005), the TU HH-Harburg (Beyer et al. 2012), the Hamburg Port Authority, the Federal Waterways Engineering and Research Institute BAW and also through Dike associations and Bremenports (Bremischer Deichverband, 2013).
The project DredgDikes was initiated by the chair of Geotechnics and Coastal Engineering at Rostock University and the chair of Geotechnics, Geology and Maritime Engineering at Gdansk University of Technology to investigate dredged materials to be used in dike construction. In the German subproject the use of dewatered fine-grained organic dredged materials is investigated as a replacement for standard dike cover material. In May 2012, the German research dike was built near Rostock to perform full-scale experiments.
Proceedings of the South Baltic Conference on Dredged Materials in Dike Construction Rostock, 10-12 April 2014 ISBN: 978-3-86009-409-9 www.dredgdikes.eu
54 Proceedings of the South Baltic Conference on Dredged Materials in Dike Construction
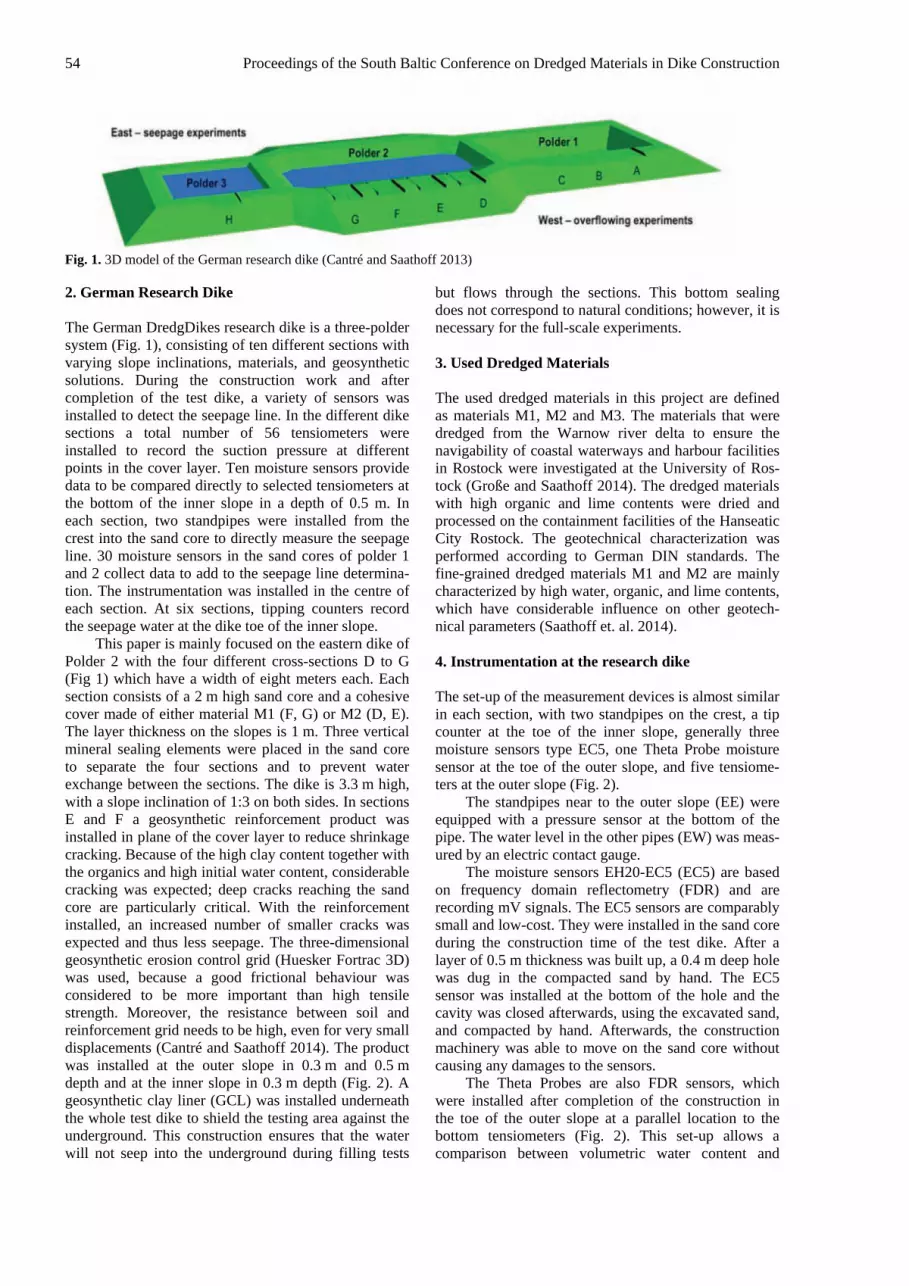
Fig. 1. 3D model of the German research dike (Cantré and Saathoff 2013)
2. German Research Dike The German DredgDikes research dike is a three-polder system (Fig. 1), consisting of ten different sections with varying slope inclinations, materials, and geosynthetic solutions. During the construction work and after completion of the test dike, a variety of sensors was installed to detect the seepage line. In the different dike sections a total number of 56 tensiometers were installed to record the suction pressure at different points in the cover layer. Ten moisture sensors provide data to be compared directly to selected tensiometers at the bottom of the inner slope in a depth of 0.5 m. In each section, two standpipes were installed from the crest into the sand core to directly measure the seepage line. 30 moisture sensors in the sand cores of polder 1 and 2 collect data to add to the seepage line determina-tion. The instrumentation was installed in the centre of each section. At six sections, tipping counters record the seepage water at the dike toe of the inner slope.
This paper is mainly focused on the eastern dike of Polder 2 with the four different cross-sections D to G (Fig 1) which have a width of eight meters each. Each section consists of a 2 m high sand core and a cohesive cover made of either material M1 (F, G) or M2 (D, E). The layer thickness on the slopes is 1 m. Three vertical mineral sealing elements were placed in the sand core to separate the four sections and to prevent water exchange between the sections. The dike is 3.3 m high, with a slope inclination of 1:3 on both sides. In sections E and F a geosynthetic reinforcement product was installed in plane of the cover layer to reduce shrinkage cracking. Because of the high clay content together with the organics and high initial water content, considerable cracking was expected; deep cracks reaching the sand core are particularly critical. With the reinforcement installed, an increased number of smaller cracks was expected and thus less seepage. The three-dimensional geosynthetic erosion control grid (Huesker Fortrac 3D) was used, because a good frictional behaviour was considered to be more important than high tensile strength. Moreover, the resistance between soil and reinforcement grid needs to be high, even for very small displacements (Cantré and Saathoff 2014). The product was installed at the outer slope in 0.3 m and 0.5 m depth and at the inner slope in 0.3 m depth (Fig. 2). A geosynthetic clay liner (GCL) was installed underneath the whole test dike to shield the testing area against the underground. This construction ensures that the water will not seep into the underground during filling tests
but flows through the sections. This bottom sealing does not correspond to natural conditions; however, it is necessary for the full-scale experiments.
3. Used Dredged Materials The used dredged materials in this project are defined as materials M1, M2 and M3. The materials that were dredged from the Warnow river delta to ensure the navigability of coastal waterways and harbour facilities in Rostock were investigated at the University of Ros-tock (Große and Saathoff 2014). The dredged materials with high organic and lime contents were dried and processed on the containment facilities of the Hanseatic City Rostock. The geotechnical characterization was performed according to German DIN standards. The fine-grained dredged materials M1 and M2 are mainly characterized by high water, organic, and lime contents, which have considerable influence on other geotech-nical parameters (Saathoff et. al. 2014). 4. Instrumentation at the research dike The set-up of the measurement devices is almost similar in each section, with two standpipes on the crest, a tip counter at the toe of the inner slope, generally three moisture sensors type EC5, one Theta Probe moisture sensor at the toe of the outer slope, and five tensiome-ters at the outer slope (Fig. 2).
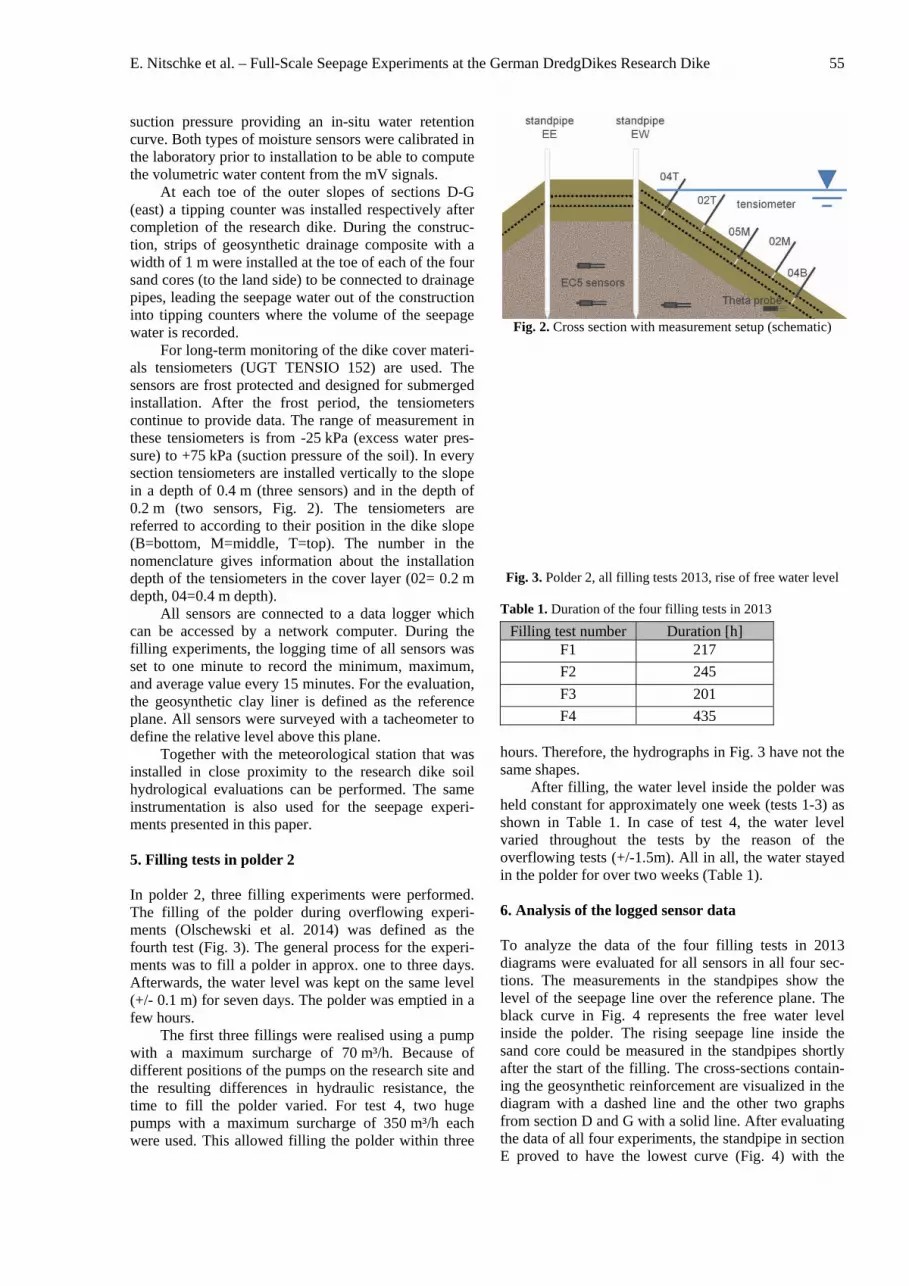
The standpipes near to the outer slope (EE) were equipped with a pressure sensor at the bottom of the pipe. The water level in the other pipes (EW) was meas-ured by an electric contact gauge.
The moisture sensors EH20-EC5 (EC5) are based on frequency domain reflectometry (FDR) and are recording mV signals. The EC5 sensors are comparably small and low-cost. They were installed in the sand core during the construction time of the test dike. After a layer of 0.5 m thickness was built up, a 0.4 m deep hole was dug in the compacted sand by hand. The EC5 sensor was installed at the bottom of the hole and the cavity was closed afterwards, using the excavated sand, and compacted by hand. Afterwards, the construction machinery was able to move on the sand core without causing any damages to the sensors.
The Theta Probes are also FDR sensors, which were installed after completion of the construction in the toe of the outer slope at a parallel location to the bottom tensiometers (Fig. 2). This set-up allows a comparison between volumetric water content and
E. Nitschke et al. – Full-Scale Seepage Experiments at the German DredgDikes Research Dike 55
suction pressure providing an in-situ water retention curve. Both types of moisture sensors were calibrated in the laboratory prior to installation to be able to compute the volumetric water content from the mV signals.
At each toe of the outer slopes of sections D-G (east) a tipping counter was installed respectively after completion of the research dike. During the construc-tion, strips of geosynthetic drainage composite with a width of 1 m were installed at the toe of each of the four sand cores (to the land side) to be connected to drainage pipes, leading the seepage water out of the construction into tipping counters where the volume of the seepage water is recorded.
For long-term monitoring of the dike cover materi-als tensiometers (UGT TENSIO 152) are used. The sensors are frost protected and designed for submerged installation. After the frost period, the tensiometers continue to provide data. The range of measurement in these tensiometers is from -25 kPa (excess water pres-sure) to +75 kPa (suction pressure of the soil). In every section tensiometers are installed vertically to the slope in a depth of 0.4 m (three sensors) and in the depth of 0.2 m (two sensors, Fig. 2). The tensiometers are referred to according to their position in the dike slope (B=bottom, M=middle, T=top). The number in the nomenclature gives information about the installation depth of the tensiometers in the cover layer (02= 0.2 m depth, 04=0.4 m depth).
All sensors are connected to a data logger which can be accessed by a network computer. During the filling experiments, the logging time of all sensors was set to one minute to record the minimum, maximum, and average value every 15 minutes. For the evaluation, the geosynthetic clay liner is defined as the reference plane. All sensors were surveyed with a tacheometer to define the relative level above this plane.
Together with the meteorological station that was installed in close proximity to the research dike soil hydrological evaluations can be performed. The same instrumentation is also used for the seepage experi-ments presented in this paper. 5. Filling tests in polder 2 In polder 2, three filling experiments were performed. The filling of the polder during overflowing experi-ments (Olschewski et al. 2014) was defined as the fourth test (Fig. 3). The general process for the experi-ments was to fill a polder in approx. one to three days. Afterwards, the water level was kept on the same level (+/- 0.1 m) for seven days. The polder was emptied in a few hours.
The first three fillings were realised using a pump with a maximum surcharge of 70 m³/h. Because of different positions of the pumps on the research site and the resulting differences in hydraulic resistance, the time to fill the polder varied. For test 4, two huge pumps with a maximum surcharge of 350 m³/h each were used. This allowed filling the polder within three
Fig. 2. Cross section with measurement setup (schematic)
Fig. 3. Polder 2, all filling tests 2013, rise of free water level
Table 1. Duration of the four filling tests in 2013
Filling test number Duration [h] F1 217
F2 245
F3 201
F4 435 hours. Therefore, the hydrographs in Fig. 3 have not the same shapes.
After filling, the water level inside the polder was held constant for approximately one week (tests 1-3) as shown in Table 1. In case of test 4, the water level varied throughout the tests by the reason of the overflowing tests (+/-1.5m). All in all, the water stayed in the polder for over two weeks (Table 1).
6. Analysis of the logged sensor data To analyze the data of the four filling tests in 2013 diagrams were evaluated for all sensors in all four sec-tions. The measurements in the standpipes show the level of the seepage line over the reference plane. The black curve in Fig. 4 represents the free water level inside the polder. The rising seepage line inside the sand core could be measured in the standpipes shortly after the start of the filling. The cross-sections contain-ing the geosynthetic reinforcement are visualized in the diagram with a dashed line and the other two graphs from section D and G with a solid line. After evaluating the data of all four experiments, the standpipe in section E proved to have the lowest curve (Fig. 4) with the
56 Proceedings of the South Baltic Conference on Dredged Materials in Dike Construction
smallest gradient among all tests. Section G shows the steepest gradient in the performed experiments. In case of the first two filling tests, sections D and F show nearly identical graphs while there are some deviations in the third test where the curve of section F lies just below that of section D. The trend of the curves in filling test 4 is comparable to that of the first two experiments. Fig. 4 also shows that all four curves rise to a different level at which they show no further change which could be observed in all four filling tests.
The tipping counters measure the collected seep-age water at the toe of the inner slope. The logger records the number of tips every 15 min. The black graph in Fig. 5 shows the free water level in polder 2. The solid light blue curve stands for the measured values from section G. Just as observed in the previous analysis, the most amount of seepage water was caught in section G. A dashed green line was used to visualize the tips from section E. In all tests, this curve was always below the other graphs. The measured water volumes of section D and section E are not equal at the beginning of the first filling test (Fig. 5). The curves adjusted after the refill of the polder. During the second filling test, it occurred that the tipping counter from cross-section G counted very fast. For verifying pur-poses the tipping counter was removed and accidentally not re-installed during this experiment, which is why some data is missing.
The EC5 sensors measure the volumetric water content inside the sand core. The four analysed sensors were installed at 0.12 m above the GLC with small deviations (+/- 0.02 m). At the beginning of all tests, all sensors showed different values (Fig. 6). To evaluate the data, the first value of each sensor was used as sensor reference. The following data values were related to the reference value (Fig. 7).
In the diagrams, the black line represents the free water level inside the polder. The light blue curve from section G shows the steepest gradient. After the refill of test 1, the volumetric water content decreases. Section F visualizes with a dashed purple graph a steep rise at the start of filling test 1. After the peak of the curve, the graph from section F is falling. This behaviour contin-ues during the filling process of the polder. This curve shape reappears in three of the four filling tests. The volumetric water content rises in the sections D and E even after the refill of the polder. In filling test 2, the gradient of section D is much steeper than in section G (Fig. 8). It can be seen that the signal indicating the volumetric water content increases in sections D and section E after the start of the test. Even during the filling process, the signal representing the water content decreases for a while and then increases again, without any comprehensible reasons. In all four filling tests the EC5 sensors showed a reasonable rise at the beginning; hovever, afterwards the curves of some sensors differ.
The Theta Probe sensors of the four different cross-sections have their position between 0.48 m and 0.52 m over the reference plane inside the cover layers
Fig. 4. Polder 2, filling test 2, standpipes EW
Fig. 5. Polder 2, filling test 1, tipping counter
Fig. 6. Polder 2, filling test 1, EC5 Sensor original data
Fig. 7. Polder 2, filling test 1, EC5 Sensor, start value = 0
E. Nitschke et al. – Full-Scale Seepage Experiments at the German DredgDikes Research Dike 57
Fig. 8. Polder 2, filling test 2, EC5; start value = 0
Fig. 9. Polder 2, filling test 2, tensiometer 04M
Fig. 10. Polder 2, filling test 4, tensiometer 02M
of the outer slopes. To evaluate the data, the first value of each test series was used as reference (zero), as it was done for the evaluation of the EC5 sensors. All four tests show different curve shapes and no similarities between the four filling tests could be detected.
To analyse the tensiometers the data from 0 kPa (surface of the water table) to -25 kPa (excess water pressure) was used. Sensor 04B in section G was damaged during the first filling test and thus could not provide any data for any of the four tests. Fig. 9 shows the free water level visualized with a solid black line and the tensiometer data from sensor 04M for the filling test 2. Sections D (solid red curve) and E (dashed green curve) saturate first. After 15 min, the sensor from section G records the seepage line. The water flows slowest through section F. In all four tests section D saturates first, often at the same time with cross-section E. The sensors of section F always register the seepage line latest. In Fig. 10 it can be seen for section D, E, and G that the tensiometers installed in a depth of 0.2 m show hardly any differences. This trend can be observed in all four tests.
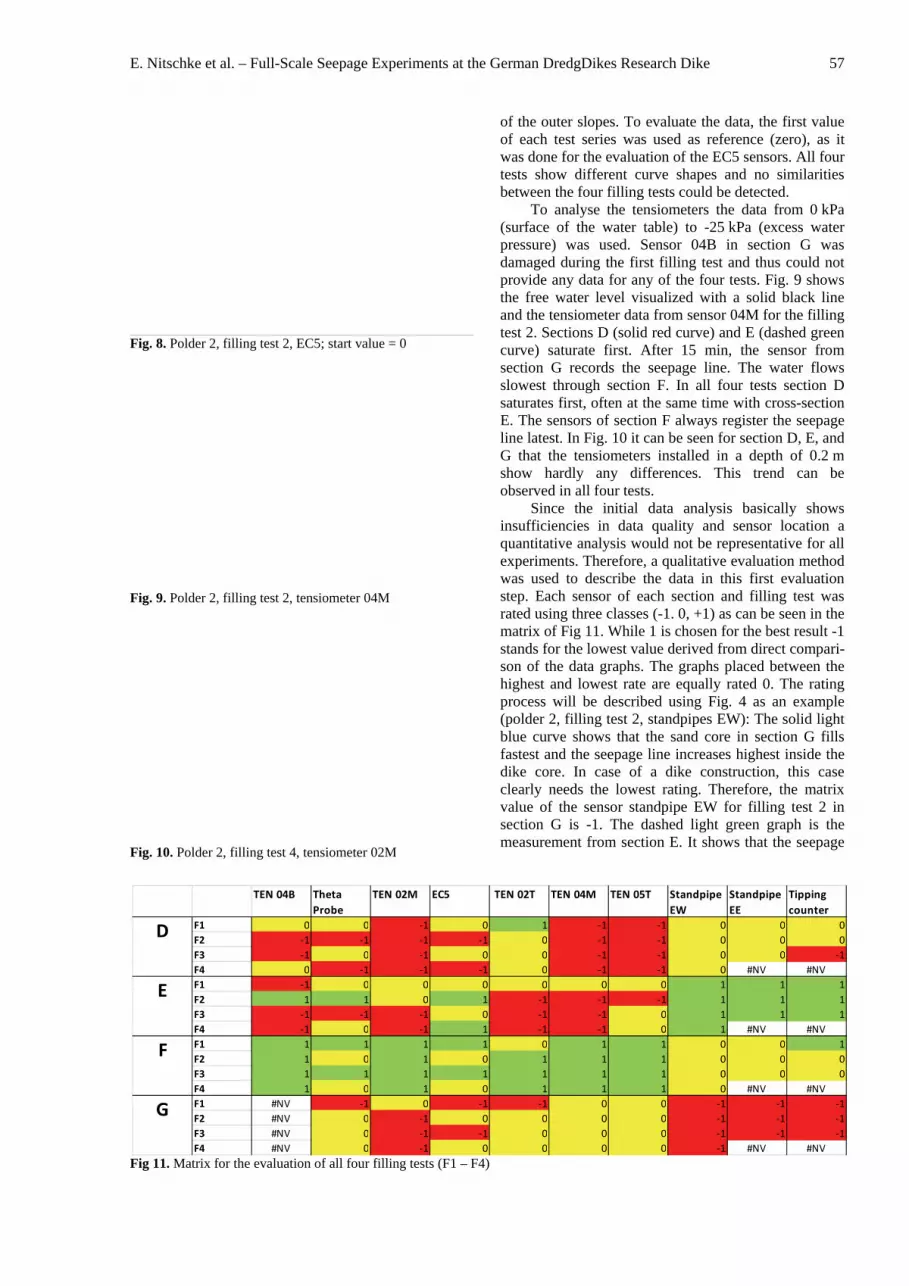
Since the initial data analysis basically shows insufficiencies in data quality and sensor location a quantitative analysis would not be representative for all experiments. Therefore, a qualitative evaluation method was used to describe the data in this first evaluation step. Each sensor of each section and filling test was rated using three classes (-1. 0, +1) as can be seen in the matrix of Fig 11. While 1 is chosen for the best result -1 stands for the lowest value derived from direct compari-son of the data graphs. The graphs placed between the highest and lowest rate are equally rated 0. The rating process will be described using Fig. 4 as an example (polder 2, filling test 2, standpipes EW): The solid light blue curve shows that the sand core in section G fills fastest and the seepage line increases highest inside the dike core. In case of a dike construction, this case clearly needs the lowest rating. Therefore, the matrix value of the sensor standpipe EW for filling test 2 in section G is -1. The dashed light green graph is the measurement from section E. It shows that the seepage
Fig 11. Matrix for the evaluation of all four filling tests (F1 – F4)
TEN 04B Theta
Probe
TEN 02M EC5 TEN 02T TEN 04M TEN 05T Standpipe
EW
Standpipe
EE
Tipping
counterF1 0 0 ‐1 0 1 ‐1 ‐1 0 0 0
F2 ‐1 ‐1 ‐1 ‐1 0 ‐1 ‐1 0 0 0
F3 ‐1 0 ‐1 0 0 ‐1 ‐1 0 0 ‐1
F4 0 ‐1 ‐1 ‐1 0 ‐1 ‐1 0 #NV #NV
F1 ‐1 0 0 0 0 0 0 1 1 1
F2 1 1 0 1 ‐1 ‐1 ‐1 1 1 1
F3 ‐1 ‐1 ‐1 0 ‐1 ‐1 0 1 1 1
F4 ‐1 0 ‐1 1 ‐1 ‐1 0 1 #NV #NV
F1 1 1 1 1 0 1 1 0 0 1
F2 1 0 1 0 1 1 1 0 0 0
F3 1 1 1 1 1 1 1 0 0 0
F4 1 0 1 0 1 1 1 0 #NV #NV
F1 #NV ‐1 0 ‐1 ‐1 0 0 ‐1 ‐1 ‐1
F2 #NV 0 ‐1 0 0 0 0 ‐1 ‐1 ‐1
F3 #NV 0 ‐1 ‐1 0 0 0 ‐1 ‐1 ‐1
F4 #NV 0 ‐1 0 0 0 0 ‐1 #NV #NV
G
D
E
F
58 Proceedings of the South Baltic Conference on Dredged Materials in Dike Construction
Table 2. Tipping counter measurement in relation to each other (filling tests F1, F2, F3)
[%] D E F G F1 80 53 72 100 F2 101 56 66 100 F3 67 100
Table 3. Evaluation summary of the filling tests 2013
D E F G Not weighted -18 1 24 -17 Weighted -19 11 25 -27
Weighted = Tipping counter and standpipe data was weighted double.
line does not rise as high as in the other three sections. This case is the best among the four and thus rated 1. Both other curves are lying between are equally rated 0. This process has been performed for all sensors and filling tests. The evaluation was done based on the height of the curves, the rising time (fastest, slowest), and the gradient of the curves (steepest and flattest). During the first analysis of the whole test series, all sensors were treated equally. In Fig 11, the red box stands for value -1, the green box represents value 1, and yellow represents the middle curves. 8. Discussion The analysis of the standpipe data shows that the sand core of section G always fills fastest compared to the other sections in all four filling tests on the eastern dike. The dike core of the section covered with material M2 and the geosynthetic reinforcement against cracks (section E) saturates considerably slower. The water level inside the sand core of section E does not increase as high as in the other sections. This result is consistent through the whole series of the standpipe data. Also, the standpipe data shows that the water levels always rise inside the core until one specific height. This leads to the assumption that the same amount of water flows into the core, as flows out of the drainage and thus a steady state has been reached. In future experiments this will be issue for investigation during longer experiment durations (e.g. 3 weeks).
The data from the tipping counters shows exactly the same results as the data from the standpipes measurements. The tipping counter from section G always registers more tips in the same time as the one in section E. In case of the first two full-scale tests, it can be seen that half the seepage water flows through section E compared to section G (Fig. 5). These results also support the thesis that cross-section E performs better than the other sections.
Analysis of the EC5 sensors shows that cross-section E saturated slower than the other sections, supporting the results of the standpipes and tipping counters. However, not all data from the EC5 measure-ments can be evaluated since some sensors lost the
signal over time. It is a known fact, that these sensors are not particularly durable.
The tensiometer data show different results. There is no stable trend in the data of the tensiometers and the data of single sensors is not even consistent between different filling tests. These deviations may be the result of small cracks or other damages in the top layer of the outer slopes. Before the first filling test, the cover layer was inspected visually. During this inspection, small damages in the slope were detected at the surface, particularly mouse holes and small cracks. Assumedly there will be more mouse holes and cracks hidden underneath the grass cover. As yet there is no infor-mation about the depth of these irregularities in the dike cover, and the tensiometer data has not been analysed for these effects yet. This will be an issue for future analysis.
All tensiometers have been installed in the top of the cover layer only, in a depth ranging from 0.2 m to 0.4 m. The cover layer seems to saturate much faster than could be expected from the laboratory analysis where the materials showed water permeability values of about 10-8 - 10-9 m/s. The used tensiometers in the research dike were installed one year before implementation of the filling tests. It was suggested that the first 0.2 m of the cover layer were subjected to drying. Also, shrinkage effects of the materials could cause the tensiometer ceramic cup to loose contact with the surrounding soil (Durner, 2005; Heng, 2008). Future investigations will focus on deeper layers of the cover material to distinguish the aggregation layer which is subject to plant roots and to freezing and thawing cycles from the undisturbed compacted cover material. The differences between the single filling tests may be caused by mouse corridors which were newly built between the tests.
The results of the qualitative evaluation matrix show differences between the tensiometer data and the data of standpipes and tipping counters. When the tensiometer data is included in the evaluation, section F shows better results than E when summing up all four tests (Table 3). Data analysis for the tensiometers, EC5 and the Theta Probe sensors are difficult to evaluate qualitatively while the quality and reliability of the standpipe and tipping counter data is much better. Therefore, the latter was weighted using a factor of 2.
Still, section F shows a better performance than E, however, the ratings are closer (Table 3). There is no quantitative information in this rating procedure, thus there remains the possibility that the results of E and F are quite similar and that only very small measurement deviations result in favouring either the one or the other section. This can be suggested from the actual data curves. Still, it can clearly be seen that in this first set of experiments sections E and F which the geosynthetic reinforcement installed, tend to perform better than those without reinforcement.
E. Nitschke et al. – Full-Scale Seepage Experiments at the German DredgDikes Research Dike 59
9. Conclusions The initial analysis of the data collected in four seepage tests at the Rostock DredgDikes research dike shows that some data are more reliable than others and that the performance of the different cross-sections can be rated based on the data derived. Here, only four of eight tested cross-sections are presented. 1. The cross-sections with a geosynthetic re-inforce-
ment product installed generally perform better regarding seepage flow (lower permeability) than those without reinforcement.
2. It could be observed that the tensiometer installa-tion setup was not well drafted. The tensiometers data showed deviations between the tests and regarding other data recorded in the tests which may be lead back to aggregation processes, cracks and mouse holes in the upper 0.4 m of the cover layer where the tensiometers were installed. The data provides information about how to improve the setup in future tests, however. These filling tests will be performed in spring 2014.
3. In spite of the considerable amount of cracks and mouse holes that exist in the dike cover material. The fourth test showed that the dike remained stable while the sand core was saturated for more than two weeks and a considerable amount of people were walking up and down the slopes during the overflowing tests.
References Beyer, K.; Grabe, J.; Kaschel, G.; Timmers, V. 2012.
Development of a large-scale environmental chamber to investigate the dessication behaviour of flood embank-ment profiles, in: Proc. of 12th Baltic Sea Geotechnical Conference, 244-250.
Bremischer Deichverband 2013. Verwendung von Baggergut im Deichbau, available online: http://www.deichver band-bremen-alw.de/baggergut.0.html. (in German).
Cantré, S.; Große, AK.; Neumann, R.; Nitschke, E.; Henneberg, M.; Saathoff, F. 2013. Fine-grained organic dredged materials for dike cover layers - Material characterisation and experimental results, XX World Dredging Congress and Exhibition, 1-14.
Cantré, S.; Saathoff, F. 2013. Installation of fine-grained organic dredged materials in combination with geosynthetics in the German DredgDikes research dike facility, Engineering Structures and Technologies, 5(3): 93-102.
Durner, W.; Or, D. 2005. Soil Water Potential Measurement, Encyclopedia of Hydrological Sciences, edited by M. G. Anderson
Große, A.-K.; Saathoff, F. 2014. Geotechnical Characterisa-tion of Different Fine-Grained, Organic Dredged Mate-rial Batches from the Baltic Sea Area – Peculiarities and Adaptions, Proceedings of the South Baltic Conference on Dredged Materials in Dike Construction,19-30
Heng, L. K.; Eveit, S. 2008. Tensiometers, Field Estimation of Soil Water Content, A Practical Guide to Methods, Instrumentaion and Sensor Technology, IAEA
HTG 2006. Verwertung von feinkörnigem Baggergut im Bereich der deutschen Küste, Fachausschuss Bagger-gut, Hafentechnische Gesellschaft. (In German).
Gröngröft, A.; Gebert, J.; Berger, K.; Maaß, B. 2005. Verwendung von Baggergut als Material für die Dichtung von Deponien, den Deichbau, zur Verfüllung und zur Bodenverbesserung, Hamburger Bodenkundliche Arbeiten 56: 209-223 (in German).
Olschewski, J.; Cantré, S.; Saathoff, F. 2014. Overflowing tests on the Rostock DredgDikes Research Dike, Proceedings of the South Baltic Conference on Dredged Materials in Dike Construction, 67-74
Saathoff, F; Cantré, S.; Große, A.-K. and Nitschke, E. 2014. Deichdeckschichten aus feinkörnigen Baggergut aus dem Ostseeraum, proceedings in HTG Kongress, Berlin, 21.-23. Mai 2014, in production. (in German).
60 Proceedings of the South Baltic Conference on Dredged Materials in Dike Construction


![Regierungstechnologie [in German]](https://static.documents.pub/doc/80x56/631918a165e4a6af370fa5dd/regierungstechnologie-in-german.jpg)


