Hemagglutination detection for blood typing based on waveguide-mode sensors Hiroki Ashiba a,⇑ , Makoto Fujimaki a , Koichi Awazu a , Mengying Fu b , Yoshimichi Ohki b , Torahiko Tanaka c , Makoto Makishima c a Electronics and Photonic Research Institute, National Institute of Advanced Industrial Science and Technology (AIST), 1-1-1 Higashi, Tsukuba, Ibaraki 305-8565, Japan b Department of Electrical Engineering and Bioscience, Waseda University, 3-4-1 Ohkubo, Shinjuku-ku, Tokyo 169-8555, Japan c Division of Biochemistry, Department of Biomedical Sciences, Nihon University School of Medicine, 30-1 Oyaguchi-kamicho, Itabashi, Tokyo 173-8610, Japan article info Keywords: Blood typing Immunoassay Hemagglutination Waveguide-mode sensor abstract ABO and Rh(D) blood typing is one of the most important tests performed prior to blood transfusion. Although on-site blood testing is desirable for expedient blood transfusion procedure, most conventional methods and instruments lack the required usability or portability. Here, we describe a novel method, based on the detection of hemagglutination using an optical waveguide-mode sensor, for on-site use. The reflectance spectrum of blood alone and that of blood mixed with antibody reagents was measured using the waveguide-mode sensor. Differences in reflectance by agglutinated and non-agglutinated blood samples were observed at the bottom of the spectral dips; due to differences in the manner in which red blood cells interacted with the surface of the sensor chip. Following the addition of the antibody, blood types A, B, O, and AB were clearly distinguishable and Rh(D) typing was also possible using the wave- guide-mode sensor. Furthermore, the waveguide-mode-based measurement exhibited the potential to detect weak agglutination, which is difficult for human eyes to distinguish. Thus, this method holds great promise for application in novel on-site test instruments. Ó 2014 The Authors. Published by Elsevier B.V. This is an open access article under the CC BY license (http:// creativecommons.org/licenses/by/4.0/). 1. Introduction Blood type, represented by the ABO and Rh(D) systems, is an immunoreactive feature of red blood cells (RBCs) that is deter- mined by the antigenic moieties of sugar chains on the RBC surface. Determination of the blood type is especially important before blood transfusion, because transfusion of mismatched blood types can lead to hemolysis within patient’s blood vessels, which medi- ated by antibodies to the RBCs in blood plasma. Blood typing tests have traditionally been conducted manually, using techniques such as slide and tube agglutination tests. In the last 20–30 years, fully automated blood testing instruments have been developed and these are operational at blood centers and major hospitals. These instruments have advantages such as high throughput and high sensitivity. However, these advantages are somewhat offset by the large size and high cost of the instruments. These are major drawbacks, especially because on-site blood testing is an important requirement during an emergency or natural calamity. Development of a portable, low-cost, and sufficiently sensitive instrument for blood typing is therefore required to make on-site blood testing feasible. Agglutination of RBCs (hemagglutination) is caused by an immune reaction between the RBCs and antibodies against the cor- responding blood type. In conventional blood typing methods, hemagglutination caused by antibodies is detected by human eyes or by imaging techniques. Alternate methods of blood typing using optical techniques have also been reported. Quinn et al. first reported the use of a surface plasmon resonance (SPR) sensor for blood typing [1]. The SPR sensor is a sensitive biosensing instru- ment based on electrical field enhancement by SPR excitation [2– 4]. SPR-based blood typing has been previously performed using the Biacore system [1,5,6] or an SPR imaging technique [7]. Naraya- nan et al. have reported a technique for absorbance measurement- based blood typing [8]. This group reported the detection of a weak agglutination reaction of A 2 subtype and weak-D. Robb et al. dem- onstrated fluorescence-based blood typing on a planar microarray http://dx.doi.org/10.1016/j.sbsr.2014.12.003 2214-1804/Ó 2014 The Authors. Published by Elsevier B.V. This is an open access article under the CC BY license (http://creativecommons.org/licenses/by/4.0/). Abbreviations: RBCs, red blood cells; SPR, surface plasmon resonance; PBS, phosphate-buffered saline; LED, light-emitting device. ⇑ Corresponding author. Postal address: Central 5, 1-1-1 Higashi, Tsukuba, Ibaraki 305-8565, Japan. Tel.: +81 29 861 4739; fax: +81 29 861 2939. E-mail addresses: [email protected](H. Ashiba), [email protected](M. Fujimaki), [email protected](K. Awazu). Sensing and Bio-Sensing Research 3 (2015) 59–64 Contents lists available at ScienceDirect Sensing and Bio-Sensing Research journal homepage: www.elsevier.com/locate/sbsr brought to you by CORE View metadata, citation and similar papers at core.ac.uk provided by Elsevier - Publisher Connector
Transcript
Sensing and Bio-Sensing Research 3 (2015) 59–64
brought to you by COREView metadata, citation and similar papers at core.ac.uk
provided by Elsevier - Publisher Connector
Contents lists available at ScienceDirect
Sensing and Bio-Sensing Research
journal homepage: www.elsevier .com/locate /sbsr
Hemagglutination detection for blood typing based on waveguide-modesensors
http://dx.doi.org/10.1016/j.sbsr.2014.12.0032214-1804/� 2014 The Authors. Published by Elsevier B.V.This is an open access article under the CC BY license (http://creativecommons.org/licenses/by/4.0/).
Abbreviations: RBCs, red blood cells; SPR, surface plasmon resonance; PBS,phosphate-buffered saline; LED, light-emitting device.⇑ Corresponding author. Postal address: Central 5, 1-1-1 Higashi, Tsukuba, Ibaraki
Hiroki Ashiba a,⇑, Makoto Fujimaki a, Koichi Awazu a, Mengying Fu b, Yoshimichi Ohki b, Torahiko Tanaka c,Makoto Makishima c
a Electronics and Photonic Research Institute, National Institute of Advanced Industrial Science and Technology (AIST), 1-1-1 Higashi, Tsukuba, Ibaraki 305-8565, Japanb Department of Electrical Engineering and Bioscience, Waseda University, 3-4-1 Ohkubo, Shinjuku-ku, Tokyo 169-8555, Japanc Division of Biochemistry, Department of Biomedical Sciences, Nihon University School of Medicine, 30-1 Oyaguchi-kamicho, Itabashi, Tokyo 173-8610, Japan
ABO and Rh(D) blood typing is one of the most important tests performed prior to blood transfusion.Although on-site blood testing is desirable for expedient blood transfusion procedure, most conventionalmethods and instruments lack the required usability or portability. Here, we describe a novel method,based on the detection of hemagglutination using an optical waveguide-mode sensor, for on-site use.The reflectance spectrum of blood alone and that of blood mixed with antibody reagents was measuredusing the waveguide-mode sensor. Differences in reflectance by agglutinated and non-agglutinated bloodsamples were observed at the bottom of the spectral dips; due to differences in the manner in which redblood cells interacted with the surface of the sensor chip. Following the addition of the antibody, bloodtypes A, B, O, and AB were clearly distinguishable and Rh(D) typing was also possible using the wave-guide-mode sensor. Furthermore, the waveguide-mode-based measurement exhibited the potential todetect weak agglutination, which is difficult for human eyes to distinguish. Thus, this method holds greatpromise for application in novel on-site test instruments.� 2014 The Authors. Published by Elsevier B.V. This is an open access article under the CC BY license (http://
creativecommons.org/licenses/by/4.0/).
1. Introduction
Blood type, represented by the ABO and Rh(D) systems, is animmunoreactive feature of red blood cells (RBCs) that is deter-mined by the antigenic moieties of sugar chains on the RBC surface.Determination of the blood type is especially important beforeblood transfusion, because transfusion of mismatched blood typescan lead to hemolysis within patient’s blood vessels, which medi-ated by antibodies to the RBCs in blood plasma. Blood typing testshave traditionally been conducted manually, using techniquessuch as slide and tube agglutination tests. In the last 20–30 years,fully automated blood testing instruments have been developedand these are operational at blood centers and major hospitals.These instruments have advantages such as high throughput andhigh sensitivity. However, these advantages are somewhat offset
by the large size and high cost of the instruments. These are majordrawbacks, especially because on-site blood testing is animportant requirement during an emergency or natural calamity.Development of a portable, low-cost, and sufficiently sensitiveinstrument for blood typing is therefore required to make on-siteblood testing feasible.
Agglutination of RBCs (hemagglutination) is caused by animmune reaction between the RBCs and antibodies against the cor-responding blood type. In conventional blood typing methods,hemagglutination caused by antibodies is detected by human eyesor by imaging techniques. Alternate methods of blood typing usingoptical techniques have also been reported. Quinn et al. firstreported the use of a surface plasmon resonance (SPR) sensor forblood typing [1]. The SPR sensor is a sensitive biosensing instru-ment based on electrical field enhancement by SPR excitation [2–4]. SPR-based blood typing has been previously performed usingthe Biacore system [1,5,6] or an SPR imaging technique [7]. Naraya-nan et al. have reported a technique for absorbance measurement-based blood typing [8]. This group reported the detection of a weakagglutination reaction of A2 subtype and weak-D. Robb et al. dem-onstrated fluorescence-based blood typing on a planar microarray
60 H. Ashiba et al. / Sensing and Bio-Sensing Research 3 (2015) 59–64
platform [6]. In another approaches, blood typing have been per-formed using a microchannel [9–11] or paper [12,13].
In this study, we propose a blood typing method using an opti-cal waveguide-mode sensor that detects changes in absorbanceproperties of the blood sample. The waveguide-mode sensor uti-lizes electric field enhancement in the sensor chip, similar to theSPR sensor, and is, therefore, more sensitive than a reflectanceabsorption spectrometer. The waveguide-mode sensor-basedmethod provides a simple and sensitive blood typing technique,and utilizes a portable, small-sized instrument. Hemagglutinationdetection using the waveguide-mode sensor in this study wasexamined both theoretically and experimentally, using humanblood and blood typing antibody reagents. ABO and Rh(D) bloodtyping was conducted using the waveguide-mode sensor-basedhemagglutination detection method.
RBC + plasma surface RBC surface
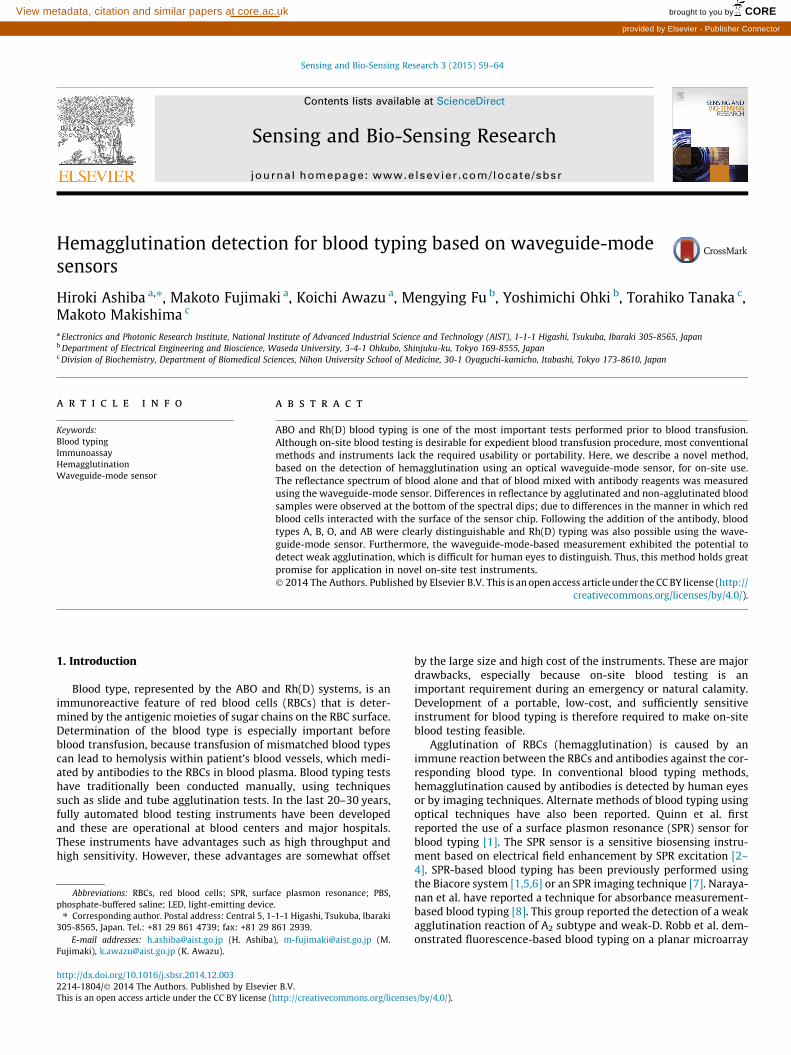
Fig. 1. (a) A schematic diagram of the experimental setup to detect hemaggluti-nation. a represents base angle of the trapezoidal prism. (b) Schematic diagrams ofthe sensor chip surface with blood samples containing (i) non-agglutinated and (ii)agglutinated RBCs. Red circles represent individual RBCs.
2. Materials and methods
2.1. Materials
Reagents were used as received with no further purification.Human whole blood containing the anticoagulant ethylenedi-aminetetraacetic acid dipotassium salt (EDTA 2K) was purchasedfrom Tennessee Blood Service. Tubes containing fresh bloodsamples were shipped by air and used within 2 weeks. Beforeusing the sample, we checked for hemolysis and used only non-hemolyzed samples. Blood types were confirmed by the supplier.Monoclonal anti-A and anti-B reagents (Neo Kokusai) were pur-chased from Sysmex Corporation. Monoclonal anti-D reagent(Monoclonal Anti-D Wako), Rh control reagent, and phosphate-buffered saline (PBS) was purchased from Wako Pure ChemicalIndustries, Ltd. Refractive index matching liquid for fused silica(Fused Silica Matching Liquids 50350) was purchased from CargilleLaboratories. Waveguide-mode sensor chips were supplied fromShin-Etsu Chemical Co., Ltd.
2.2. Experimental details
Hemagglutination was detected using a spectral readout-typewaveguide-mode sensor [14]. Fig. 1(a) shows a schematic drawingof the experimental setup. The waveguide-mode sensor is based onthe Kretschmann configuration containing a white light-emittingdevice (LED), collimator lens, polarizer, trapezoidal prism, sensorchip, and spectrometer. All the components of the waveguide-mode sensor are enclosed within a 30 � 20 � 15 cm3 box, makingthe device portable. The sensor chip consists of a surface SiO2 glasswaveguide layer and an embedded silicon reflectance layer on sil-ica glass [15]. The chips are placed on the prism at base angle 38�,which corresponds to an incident angle of 70.6� and the indexmatching liquid is introduced in between. S-polarized incidentlight from the LED is irradiated onto the chip from the bottom,and the spectrum of the reflected light is measured by the spec-trometer. Dips in reflectance were observed because of excitationof waveguide-mode propagation. By monitoring alteration in thedips, changes in the complex refractive index in the vicinity ofthe sensor chip surface can be detected. The wavelength of thespectral dip is controlled by adjusting the thickness of the SiO2
waveguide layer and the silicon reflectance layer. In this study,the thickness of the waveguide layer and reflectance layer of thechips were approximately 360 and 45 nm, respectively. Thosechips exhibited spectral dip around 540 nm during blood measure-ments, which were calibrated as per the peak wavelength for theRBC absorbance spectrum. For the hemagglutination detectionmeasurements, a drop of the blood sample was directly placedonto the calibrated chip without surface modifications.
Fig. 1(b) shows a schematic diagram of the sensor chip surfaceduring analysis of blood samples. In case of non-agglutinated bloodsamples, RBCs will sediment uniformly and form a dense layer onthe chip surface. By contrast, agglutinated RBCs (e.g., blood Amixed with anti-A) will sediment discretely onto the chip surface.Consequently, according to the ratio of contact area of RBCs to thesurface, the complex refractive indices of the chip surface differbetween the agglutinated and non-agglutinated blood samples.Since RBCs exhibit absorption around 540 nm while plasma doesnot, we focused on the change in extinction coefficient due to hem-agglutination. The spectral response of the waveguide-mode sen-sor to hemagglutination was calculated using the transfer matrixmethod. To represent hemagglutination in the calculation, weassumed uniformly mixed layers that contained RBCs and plasmain various ratios. The extinction coefficient k of both RBCs andplasma, was calculated from the absorbance A as follows:
k ¼ ln 10Ak
4pdð1Þ
where k is the wavelength and d is the optical path length. Theabsorbance was measured using NanoDrop 2000c (Thermo FisherScientific Inc.). The values of k of RBCs and plasma derived usingthe measured absorbance and Eq. (1) are shown in SupplementaryFig. S1. The k value of the mixed layer was derived from theweighted average k of RBCs and plasma according to the composi-tion ratio. For the refractive index, n, a previously reported valuefor RBCs, n = 1.40, was used [16].
For detection of hemagglutination using the waveguide-modesensors, samples of human whole blood were diluted with PBS to5% of the RBC volume. First, the spectral responses for agglutinatedand non-agglutinated blood samples were examined using thediluted blood and blood-antibody mixture in a 1:1 ratio by volume.Second, ABO forward blood typing was conducted using bloodtypes A, B, O, and AB. Diluted blood was placed onto the sensorchip surface, antibody reagents were added and mixed gently bypipetting. The spectra of the blood and blood-antibody mixturewere measured and compared to identify any antibody-dependentchange. Rh(D) blood typing was also performed. All reactions andmeasurements were conducted at room temperature.
H. Ashiba et al. / Sensing and Bio-Sensing Research 3 (2015) 59–64 61
3. Results and discussion
3.1. Hemagglutination detection
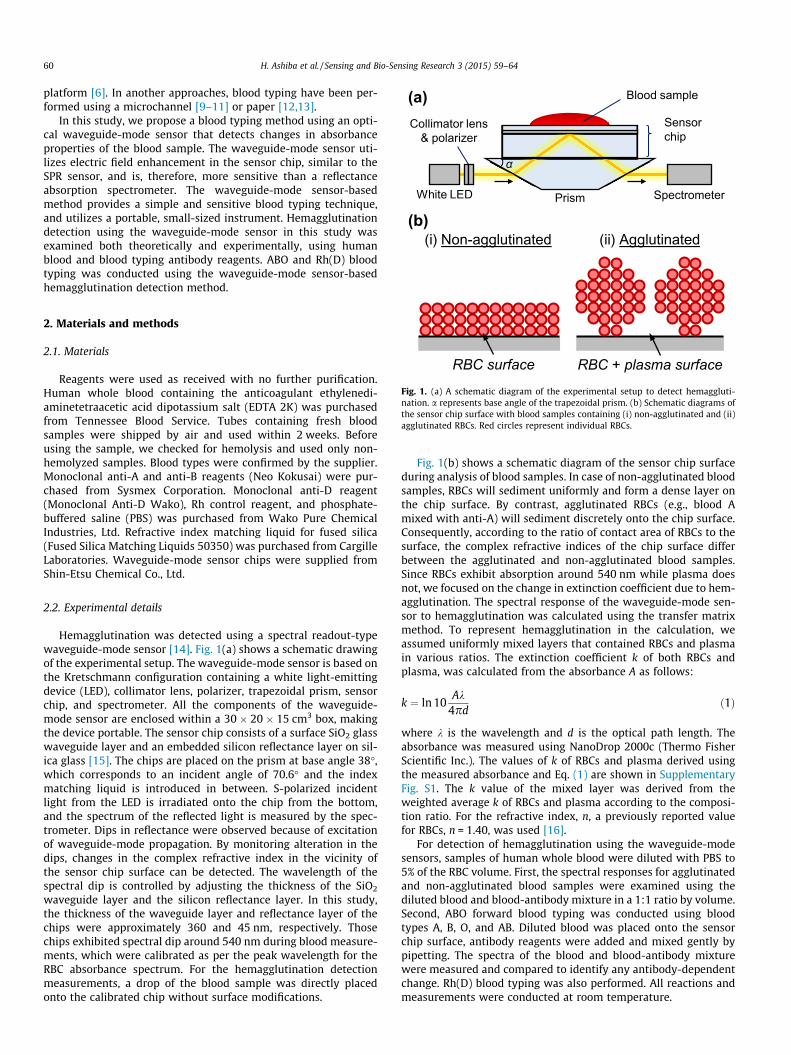
The calculated spectral responses of waveguide-mode sensormeasurements of blood samples are shown in Fig. 2. The reflec-tance spectrum for the composition ratio of RBCs from 0% to100% is presented. In the calculation, S-polarized light was set atan incident angle of 70.6�. Calculation layers were set, from thebottom to the top, as silica glass, 45-nm single crystalline silicon,360-nm SiO2 glass, blood sample, and ambient blood plasma. Theblood sample layer consists of a mixture of RBCs and blood plasmain various ratios. The optical property of the blood sample layerwas set to reflect the composition ratio as described in Subsection2.2. The thickness of the blood sample layer was assumed to be35 nm, derived as a fitting parameter to reproduce a dip in the cal-culated reflectance spectrum at the wavelength of 540 nm. In otherwords, the assumed sample layer thickness was chosen to reflectthe contribution of RBCs to the optical response in this model.Under these conditions, as the proportion of RBCs in the sampledecreased, the reflectance at the bottom of the spectral dip (bottomreflectance) increased. This implies that hemagglutination can bedetected by an increase in the bottom reflectance. Of note, the cal-culation relies on the assumption that blood samples form a phys-ical ‘‘layer’’, although this may not always apply in experimental
Fig. 2. Simulated spectral response of a waveguide-mode sensor analyzing bloodsamples containing RBCs in various proportions.
Wavelength
Ref
lect
ance
(%)
Blood A (Non-agglutinated)
Blood A + an(Agglutinate
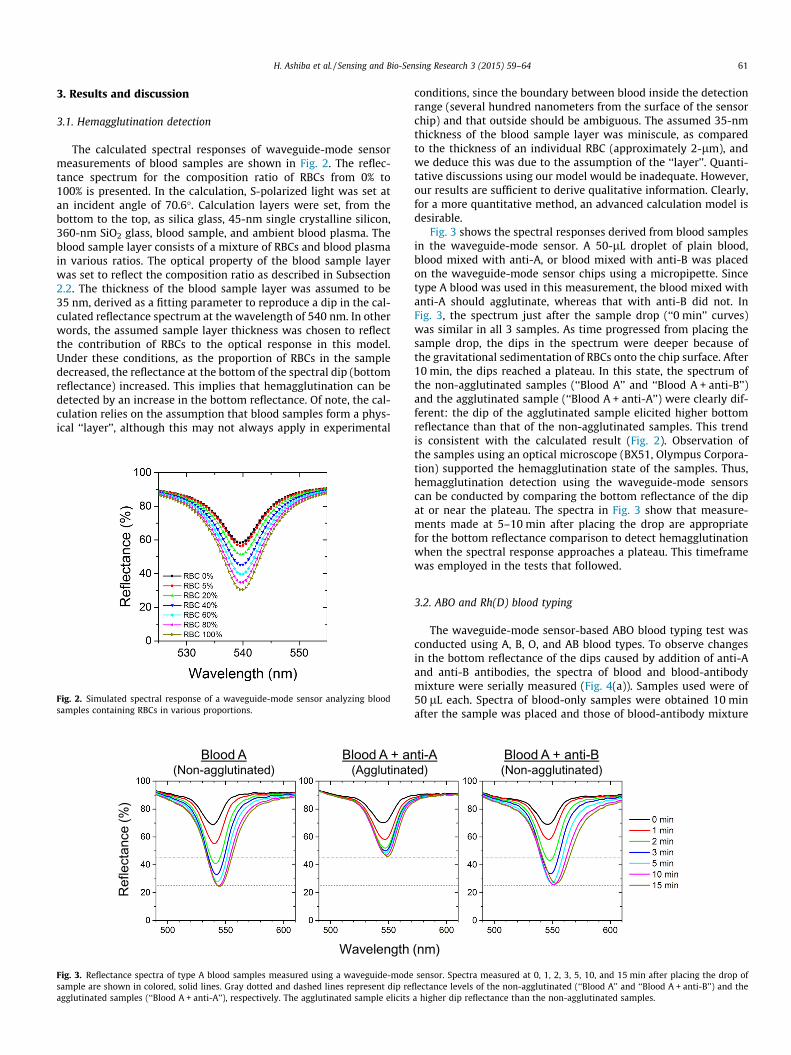
Fig. 3. Reflectance spectra of type A blood samples measured using a waveguide-modesample are shown in colored, solid lines. Gray dotted and dashed lines represent dip reagglutinated samples (‘‘Blood A + anti-A’’), respectively. The agglutinated sample elicits
conditions, since the boundary between blood inside the detectionrange (several hundred nanometers from the surface of the sensorchip) and that outside should be ambiguous. The assumed 35-nmthickness of the blood sample layer was miniscule, as comparedto the thickness of an individual RBC (approximately 2-lm), andwe deduce this was due to the assumption of the ‘‘layer’’. Quanti-tative discussions using our model would be inadequate. However,our results are sufficient to derive qualitative information. Clearly,for a more quantitative method, an advanced calculation model isdesirable.
Fig. 3 shows the spectral responses derived from blood samplesin the waveguide-mode sensor. A 50-lL droplet of plain blood,blood mixed with anti-A, or blood mixed with anti-B was placedon the waveguide-mode sensor chips using a micropipette. Sincetype A blood was used in this measurement, the blood mixed withanti-A should agglutinate, whereas that with anti-B did not. InFig. 3, the spectrum just after the sample drop (‘‘0 min’’ curves)was similar in all 3 samples. As time progressed from placing thesample drop, the dips in the spectrum were deeper because ofthe gravitational sedimentation of RBCs onto the chip surface. After10 min, the dips reached a plateau. In this state, the spectrum ofthe non-agglutinated samples (‘‘Blood A’’ and ‘‘Blood A + anti-B’’)and the agglutinated sample (‘‘Blood A + anti-A’’) were clearly dif-ferent: the dip of the agglutinated sample elicited higher bottomreflectance than that of the non-agglutinated samples. This trendis consistent with the calculated result (Fig. 2). Observation ofthe samples using an optical microscope (BX51, Olympus Corpora-tion) supported the hemagglutination state of the samples. Thus,hemagglutination detection using the waveguide-mode sensorscan be conducted by comparing the bottom reflectance of the dipat or near the plateau. The spectra in Fig. 3 show that measure-ments made at 5–10 min after placing the drop are appropriatefor the bottom reflectance comparison to detect hemagglutinationwhen the spectral response approaches a plateau. This timeframewas employed in the tests that followed.
3.2. ABO and Rh(D) blood typing
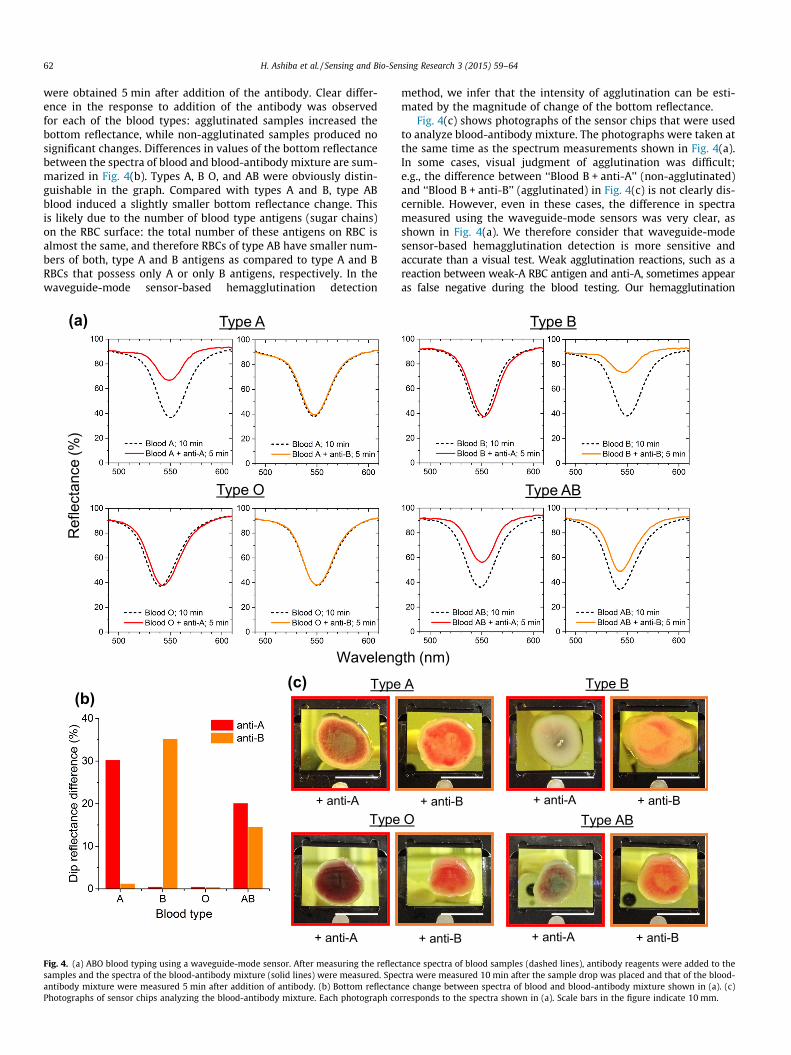
The waveguide-mode sensor-based ABO blood typing test wasconducted using A, B, O, and AB blood types. To observe changesin the bottom reflectance of the dips caused by addition of anti-Aand anti-B antibodies, the spectra of blood and blood-antibodymixture were serially measured (Fig. 4(a)). Samples used were of50 lL each. Spectra of blood-only samples were obtained 10 minafter the sample was placed and those of blood-antibody mixture
(nm)
ti-A d)
Blood A + anti-B (Non-agglutinated)
sensor. Spectra measured at 0, 1, 2, 3, 5, 10, and 15 min after placing the drop offlectance levels of the non-agglutinated (‘‘Blood A’’ and ‘‘Blood A + anti-B’’) and thea higher dip reflectance than the non-agglutinated samples.
62 H. Ashiba et al. / Sensing and Bio-Sensing Research 3 (2015) 59–64
were obtained 5 min after addition of the antibody. Clear differ-ence in the response to addition of the antibody was observedfor each of the blood types: agglutinated samples increased thebottom reflectance, while non-agglutinated samples produced nosignificant changes. Differences in values of the bottom reflectancebetween the spectra of blood and blood-antibody mixture are sum-marized in Fig. 4(b). Types A, B O, and AB were obviously distin-guishable in the graph. Compared with types A and B, type ABblood induced a slightly smaller bottom reflectance change. Thisis likely due to the number of blood type antigens (sugar chains)on the RBC surface: the total number of these antigens on RBC isalmost the same, and therefore RBCs of type AB have smaller num-bers of both, type A and B antigens as compared to type A and BRBCs that possess only A or only B antigens, respectively. In thewaveguide-mode sensor-based hemagglutination detection
Type A
Waveleng
Ref
lect
ance
(%)
(a)
Type O
(b) (c) Type
Type+ anti-A
+ anti-A
Fig. 4. (a) ABO blood typing using a waveguide-mode sensor. After measuring the reflecsamples and the spectra of the blood-antibody mixture (solid lines) were measured. Speantibody mixture were measured 5 min after addition of antibody. (b) Bottom reflectanPhotographs of sensor chips analyzing the blood-antibody mixture. Each photograph co
method, we infer that the intensity of agglutination can be esti-mated by the magnitude of change of the bottom reflectance.
Fig. 4(c) shows photographs of the sensor chips that were usedto analyze blood-antibody mixture. The photographs were taken atthe same time as the spectrum measurements shown in Fig. 4(a).In some cases, visual judgment of agglutination was difficult;e.g., the difference between ‘‘Blood B + anti-A’’ (non-agglutinated)and ‘‘Blood B + anti-B’’ (agglutinated) in Fig. 4(c) is not clearly dis-cernible. However, even in these cases, the difference in spectrameasured using the waveguide-mode sensors was very clear, asshown in Fig. 4(a). We therefore consider that waveguide-modesensor-based hemagglutination detection is more sensitive andaccurate than a visual test. Weak agglutination reactions, such as areaction between weak-A RBC antigen and anti-A, sometimes appearas false negative during the blood testing. Our hemagglutination
Type B
Type AB
th (nm)
A Type B
Type AB O + anti-B + anti-A + anti-B
+ anti-B + anti-A + anti-B
tance spectra of blood samples (dashed lines), antibody reagents were added to thectra were measured 10 min after the sample drop was placed and that of the blood-ce change between spectra of blood and blood-antibody mixture shown in (a). (c)rresponds to the spectra shown in (a). Scale bars in the figure indicate 10 mm.
H. Ashiba et al. / Sensing and Bio-Sensing Research 3 (2015) 59–64 63
detection method demonstrated the potential to deal with suchchallenging cases.
It should be noted that the anti-A and anti-B reagents used inthis study were colored, in the same manner as general diagnosticreagents used for manual ABO blood typing. The anti-A reagentwas blue and the anti-B reagent was yellow in color, and these col-ors could possibly affect the reflectance spectra of the blood sam-ples. We checked the effect of the colors by placing a drop of theantibody reagents alone on the sensor chip. The difference in thevalue of the bottom reflectance between the spectra of the anti-Aand anti-B reagents was approximately 2%. The effect of the colorswas small as compared to the spectral change caused by hemag-glutination as shown in Fig. 4(b). In addition, since the effect ofthe colors should be constant if the experimental conditions suchas the sample volume and mixture ratio were the same, the effectcan be removed during the analysis. Thus, the colors do not affectthe blood typing using the waveguide-mode sensor.
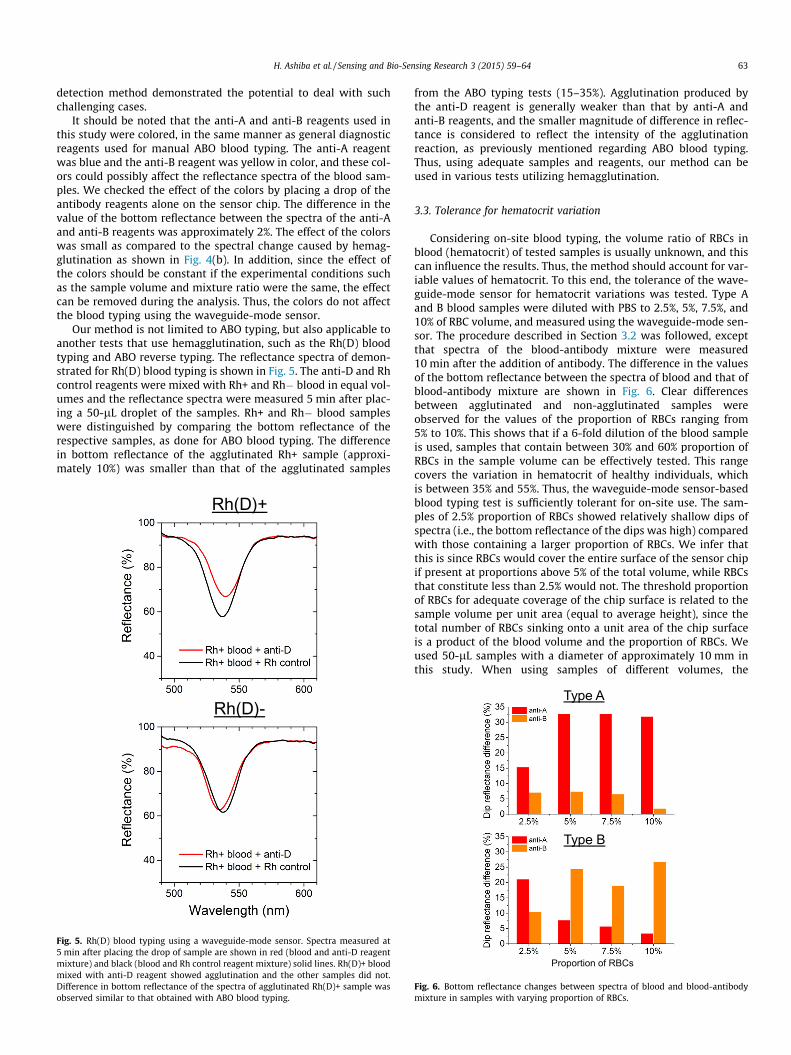
Our method is not limited to ABO typing, but also applicable toanother tests that use hemagglutination, such as the Rh(D) bloodtyping and ABO reverse typing. The reflectance spectra of demon-strated for Rh(D) blood typing is shown in Fig. 5. The anti-D and Rhcontrol reagents were mixed with Rh+ and Rh� blood in equal vol-umes and the reflectance spectra were measured 5 min after plac-ing a 50-lL droplet of the samples. Rh+ and Rh� blood sampleswere distinguished by comparing the bottom reflectance of therespective samples, as done for ABO blood typing. The differencein bottom reflectance of the agglutinated Rh+ sample (approxi-mately 10%) was smaller than that of the agglutinated samples
Rh(D)+
Rh(D)-
Fig. 5. Rh(D) blood typing using a waveguide-mode sensor. Spectra measured at5 min after placing the drop of sample are shown in red (blood and anti-D reagentmixture) and black (blood and Rh control reagent mixture) solid lines. Rh(D)+ bloodmixed with anti-D reagent showed agglutination and the other samples did not.Difference in bottom reflectance of the spectra of agglutinated Rh(D)+ sample wasobserved similar to that obtained with ABO blood typing.
from the ABO typing tests (15–35%). Agglutination produced bythe anti-D reagent is generally weaker than that by anti-A andanti-B reagents, and the smaller magnitude of difference in reflec-tance is considered to reflect the intensity of the agglutinationreaction, as previously mentioned regarding ABO blood typing.Thus, using adequate samples and reagents, our method can beused in various tests utilizing hemagglutination.
3.3. Tolerance for hematocrit variation
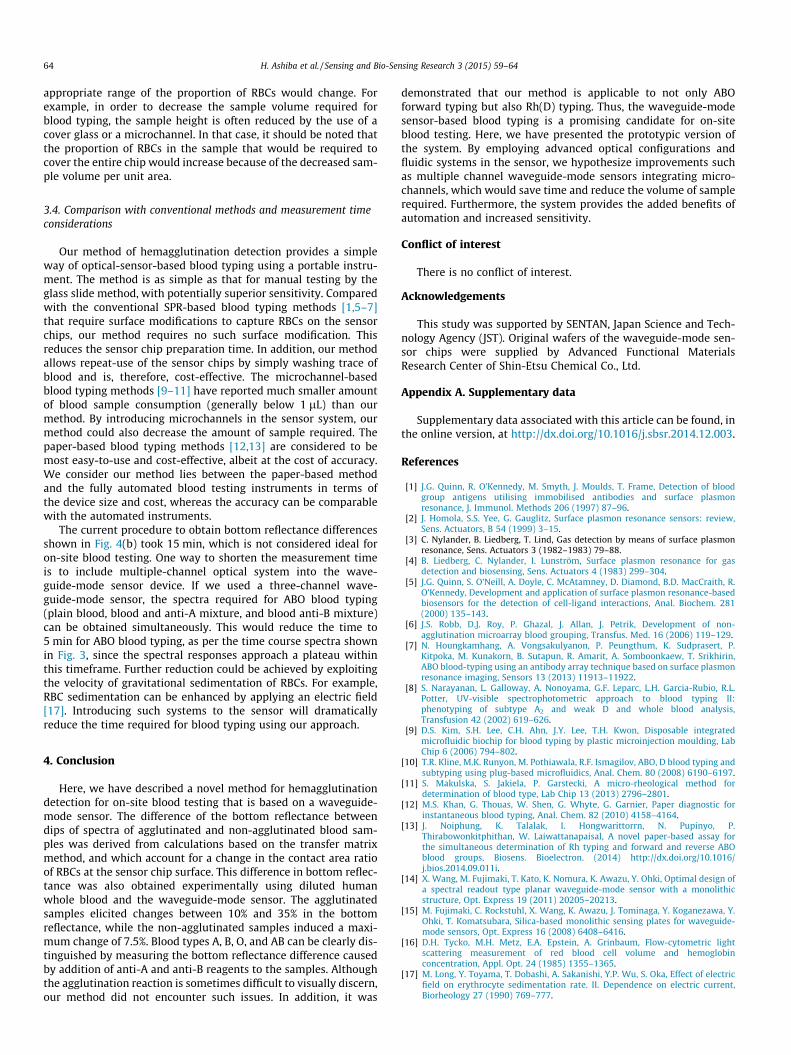
Considering on-site blood typing, the volume ratio of RBCs inblood (hematocrit) of tested samples is usually unknown, and thiscan influence the results. Thus, the method should account for var-iable values of hematocrit. To this end, the tolerance of the wave-guide-mode sensor for hematocrit variations was tested. Type Aand B blood samples were diluted with PBS to 2.5%, 5%, 7.5%, and10% of RBC volume, and measured using the waveguide-mode sen-sor. The procedure described in Section 3.2 was followed, exceptthat spectra of the blood-antibody mixture were measured10 min after the addition of antibody. The difference in the valuesof the bottom reflectance between the spectra of blood and that ofblood-antibody mixture are shown in Fig. 6. Clear differencesbetween agglutinated and non-agglutinated samples wereobserved for the values of the proportion of RBCs ranging from5% to 10%. This shows that if a 6-fold dilution of the blood sampleis used, samples that contain between 30% and 60% proportion ofRBCs in the sample volume can be effectively tested. This rangecovers the variation in hematocrit of healthy individuals, whichis between 35% and 55%. Thus, the waveguide-mode sensor-basedblood typing test is sufficiently tolerant for on-site use. The sam-ples of 2.5% proportion of RBCs showed relatively shallow dips ofspectra (i.e., the bottom reflectance of the dips was high) comparedwith those containing a larger proportion of RBCs. We infer thatthis is since RBCs would cover the entire surface of the sensor chipif present at proportions above 5% of the total volume, while RBCsthat constitute less than 2.5% would not. The threshold proportionof RBCs for adequate coverage of the chip surface is related to thesample volume per unit area (equal to average height), since thetotal number of RBCs sinking onto a unit area of the chip surfaceis a product of the blood volume and the proportion of RBCs. Weused 50-lL samples with a diameter of approximately 10 mm inthis study. When using samples of different volumes, the
Type A
Type B
Proportion of RBCs
Fig. 6. Bottom reflectance changes between spectra of blood and blood-antibodymixture in samples with varying proportion of RBCs.
64 H. Ashiba et al. / Sensing and Bio-Sensing Research 3 (2015) 59–64
appropriate range of the proportion of RBCs would change. Forexample, in order to decrease the sample volume required forblood typing, the sample height is often reduced by the use of acover glass or a microchannel. In that case, it should be noted thatthe proportion of RBCs in the sample that would be required tocover the entire chip would increase because of the decreased sam-ple volume per unit area.
3.4. Comparison with conventional methods and measurement timeconsiderations
Our method of hemagglutination detection provides a simpleway of optical-sensor-based blood typing using a portable instru-ment. The method is as simple as that for manual testing by theglass slide method, with potentially superior sensitivity. Comparedwith the conventional SPR-based blood typing methods [1,5–7]that require surface modifications to capture RBCs on the sensorchips, our method requires no such surface modification. Thisreduces the sensor chip preparation time. In addition, our methodallows repeat-use of the sensor chips by simply washing trace ofblood and is, therefore, cost-effective. The microchannel-basedblood typing methods [9–11] have reported much smaller amountof blood sample consumption (generally below 1 lL) than ourmethod. By introducing microchannels in the sensor system, ourmethod could also decrease the amount of sample required. Thepaper-based blood typing methods [12,13] are considered to bemost easy-to-use and cost-effective, albeit at the cost of accuracy.We consider our method lies between the paper-based methodand the fully automated blood testing instruments in terms ofthe device size and cost, whereas the accuracy can be comparablewith the automated instruments.
The current procedure to obtain bottom reflectance differencesshown in Fig. 4(b) took 15 min, which is not considered ideal foron-site blood testing. One way to shorten the measurement timeis to include multiple-channel optical system into the wave-guide-mode sensor device. If we used a three-channel wave-guide-mode sensor, the spectra required for ABO blood typing(plain blood, blood and anti-A mixture, and blood anti-B mixture)can be obtained simultaneously. This would reduce the time to5 min for ABO blood typing, as per the time course spectra shownin Fig. 3, since the spectral responses approach a plateau withinthis timeframe. Further reduction could be achieved by exploitingthe velocity of gravitational sedimentation of RBCs. For example,RBC sedimentation can be enhanced by applying an electric field[17]. Introducing such systems to the sensor will dramaticallyreduce the time required for blood typing using our approach.
4. Conclusion
Here, we have described a novel method for hemagglutinationdetection for on-site blood testing that is based on a waveguide-mode sensor. The difference of the bottom reflectance betweendips of spectra of agglutinated and non-agglutinated blood sam-ples was derived from calculations based on the transfer matrixmethod, and which account for a change in the contact area ratioof RBCs at the sensor chip surface. This difference in bottom reflec-tance was also obtained experimentally using diluted humanwhole blood and the waveguide-mode sensor. The agglutinatedsamples elicited changes between 10% and 35% in the bottomreflectance, while the non-agglutinated samples induced a maxi-mum change of 7.5%. Blood types A, B, O, and AB can be clearly dis-tinguished by measuring the bottom reflectance difference causedby addition of anti-A and anti-B reagents to the samples. Althoughthe agglutination reaction is sometimes difficult to visually discern,our method did not encounter such issues. In addition, it was
demonstrated that our method is applicable to not only ABOforward typing but also Rh(D) typing. Thus, the waveguide-modesensor-based blood typing is a promising candidate for on-siteblood testing. Here, we have presented the prototypic version ofthe system. By employing advanced optical configurations andfluidic systems in the sensor, we hypothesize improvements suchas multiple channel waveguide-mode sensors integrating micro-channels, which would save time and reduce the volume of samplerequired. Furthermore, the system provides the added benefits ofautomation and increased sensitivity.
Conflict of interest
There is no conflict of interest.
Acknowledgements
This study was supported by SENTAN, Japan Science and Tech-nology Agency (JST). Original wafers of the waveguide-mode sen-sor chips were supplied by Advanced Functional MaterialsResearch Center of Shin-Etsu Chemical Co., Ltd.
Appendix A. Supplementary data
Supplementary data associated with this article can be found, inthe online version, at http://dx.doi.org/10.1016/j.sbsr.2014.12.003.
References
[1] J.G. Quinn, R. O’Kennedy, M. Smyth, J. Moulds, T. Frame, Detection of bloodgroup antigens utilising immobilised antibodies and surface plasmonresonance, J. Immunol. Methods 206 (1997) 87–96.
[2] J. Homola, S.S. Yee, G. Gauglitz, Surface plasmon resonance sensors: review,Sens. Actuators, B 54 (1999) 3–15.
[3] C. Nylander, B. Liedberg, T. Lind, Gas detection by means of surface plasmonresonance, Sens. Actuators 3 (1982–1983) 79–88.
[4] B. Liedberg, C. Nylander, I. Lunström, Surface plasmon resonance for gasdetection and biosensing, Sens. Actuators 4 (1983) 299–304.
[5] J.G. Quinn, S. O’Neill, A. Doyle, C. McAtamney, D. Diamond, B.D. MacCraith, R.O’Kennedy, Development and application of surface plasmon resonance-basedbiosensors for the detection of cell-ligand interactions, Anal. Biochem. 281(2000) 135–143.
[6] J.S. Robb, D.J. Roy, P. Ghazal, J. Allan, J. Petrik, Development of non-agglutination microarray blood grouping, Transfus. Med. 16 (2006) 119–129.
[7] N. Houngkamhang, A. Vongsakulyanon, P. Peungthum, K. Sudprasert, P.Kitpoka, M. Kunakorn, B. Sutapun, R. Amarit, A. Somboonkaew, T. Srikhirin,ABO blood-typing using an antibody array technique based on surface plasmonresonance imaging, Sensors 13 (2013) 11913–11922.
[8] S. Narayanan, L. Galloway, A. Nonoyama, G.F. Leparc, L.H. Garcia-Rubio, R.L.Potter, UV-visible spectrophotometric approach to blood typing II:phenotyping of subtype A2 and weak D and whole blood analysis,Transfusion 42 (2002) 619–626.
[9] D.S. Kim, S.H. Lee, C.H. Ahn, J.Y. Lee, T.H. Kwon, Disposable integratedmicrofluidic biochip for blood typing by plastic microinjection moulding, LabChip 6 (2006) 794–802.
[10] T.R. Kline, M.K. Runyon, M. Pothiawala, R.F. Ismagilov, ABO, D blood typing andsubtyping using plug-based microfluidics, Anal. Chem. 80 (2008) 6190–6197.
[11] S. Makulska, S. Jakiela, P. Garstecki, A micro-rheological method fordetermination of blood type, Lab Chip 13 (2013) 2796–2801.
[12] M.S. Khan, G. Thouas, W. Shen, G. Whyte, G. Garnier, Paper diagnostic forinstantaneous blood typing, Anal. Chem. 82 (2010) 4158–4164.
[13] J. Noiphung, K. Talalak, I. Hongwarittorrn, N. Pupinyo, P.Thirabowonkitphithan, W. Laiwattanapaisal, A novel paper-based assay forthe simultaneous determination of Rh typing and forward and reverse ABOblood groups, Biosens. Bioelectron. (2014) http://dx.doi.org/10.1016/j.bios.2014.09.011i.
[14] X. Wang, M. Fujimaki, T. Kato, K. Nomura, K. Awazu, Y. Ohki, Optimal design ofa spectral readout type planar waveguide-mode sensor with a monolithicstructure, Opt. Express 19 (2011) 20205–20213.
[15] M. Fujimaki, C. Rockstuhl, X. Wang, K. Awazu, J. Tominaga, Y. Koganezawa, Y.Ohki, T. Komatsubara, Silica-based monolithic sensing plates for waveguide-mode sensors, Opt. Express 16 (2008) 6408–6416.
[16] D.H. Tycko, M.H. Metz, E.A. Epstein, A. Grinbaum, Flow-cytometric lightscattering measurement of red blood cell volume and hemoglobinconcentration, Appl. Opt. 24 (1985) 1355–1365.
[17] M. Long, Y. Toyama, T. Dobashi, A. Sakanishi, Y.P. Wu, S. Oka, Effect of electricfield on erythrocyte sedimentation rate. II. Dependence on electric current,Biorheology 27 (1990) 769–777.