IMMERSIVE VIRTUAL ENVIRONMENT (IVE) SYSTEM FOR EARTHQUAKE STUDIES Shen-En Chen 1 , David Vic Baker 2 and Michael Wilde 3 1 Department of Civil and Environmental Engineering College of Engineering, West Virginia University Morgantown, WV 26506-6103 E-mail:[email protected]2 Virtual Reality Laboratory Department of Electrical and Computer Engineering College of Engineering and Mineral Resources, West Virginia University Morgantown, WV 26506-6103 E-mail: [email protected]3 Virtual Reality Laboratory Department of Electrical and Computer Engineering College of Engineering and Mineral Resources, West Virginia University Morgantown, WV 26506-6103 E-mail: [email protected]ABSTRACT The results of a “proof-of-theory” experiment on stereo display of wave propagation through a rod are presented to illustrate the feasibility and potential of applying Virtual Reality (VR) into real-time earthquake studies. Simulating rod vibration under impact loading, 51 lumped mass elements were used to represent the continuous body and an explicit scheme was used to solve the time-dependent equations of motion. A distributed visualization approach including data transmission to a VR machine (Immersadesk) for real-time display is adopted. The results, which are presented in 3-D, showed valuable stereo display of wave propagating through a rod. This test indicates that VR can be a useful tool for studying physical behavior, and a conceptual Immersive Virtual Environment (IVE) system is presented to illustrate the application of VR for real-time Earthquake monitoring/analysis. INTRODUCTION Computer visualization has played an important role in the advancement of Engineering, Architecture and Art. The main contribution has been the revolution of the way the professionals see things, for example, different views that were normally impossible to visualize are now possible with different approaches of presentation. What was not possible before is now seen with clarity. What is seen is interpreted with new understanding. It is because of computer graphics, that we have powerful modeling tools
Transcript
IMMERSIVE VIRTUAL ENVIRONMENT (IVE) SYSTEMFOR
EARTHQUAKE STUDIES
Shen-En Chen1, David Vic Baker2 and Michael Wilde3
1 Department of Civil and Environmental EngineeringCollege of Engineering, West Virginia UniversityMorgantown, WV 26506-6103E-mail:[email protected]
2 Virtual Reality LaboratoryDepartment of Electrical and Computer EngineeringCollege of Engineering and Mineral Resources, West Virginia UniversityMorgantown, WV 26506-6103E-mail: [email protected]
3 Virtual Reality LaboratoryDepartment of Electrical and Computer EngineeringCollege of Engineering and Mineral Resources, West Virginia UniversityMorgantown, WV 26506-6103E-mail: [email protected]
ABSTRACT
The results of a “proof-of-theory” experiment on stereo display of wave propagationthrough a rod are presented to illustrate the feasibility and potential of applying VirtualReality (VR) into real-time earthquake studies. Simulating rod vibration under impactloading, 51 lumped mass elements were used to represent the continuous body and anexplicit scheme was used to solve the time-dependent equations of motion. A distributedvisualization approach including data transmission to a VR machine (Immersadesk) forreal-time display is adopted. The results, which are presented in 3-D, showed valuablestereo display of wave propagating through a rod. This test indicates that VR can be auseful tool for studying physical behavior, and a conceptual Immersive VirtualEnvironment (IVE) system is presented to illustrate the application of VR for real-timeEarthquake monitoring/analysis.
INTRODUCTION
Computer visualization has played an important role in the advancement of Engineering,Architecture and Art. The main contribution has been the revolution of the way theprofessionals see things, for example, different views that were normally impossible tovisualize are now possible with different approaches of presentation. What was notpossible before is now seen with clarity. What is seen is interpreted with newunderstanding. It is because of computer graphics, that we have powerful modeling tools
like CAD (Computer Aided Design) for different kinds of physical modeling. Indirectly,this has also stimulated the advancements in numerical techniques such as the FiniteElement Method (FEM), the Computational Fluid Dynamics (CFD) methods, theDiscrete Element Methods (DEM), and the Boundary Element Methods (BEM).
Computer visualization simulates the physical world and creates a Virtual Environment(VE), from which the professionals can relate to the physical systems that they areinterested in. This Virtual Environment is currently being ushered into a new era with thedevelopment of 3-D immersive representation and complete user interactivity. This newdevelopment, dubbed Virtual Reality (VR) (originally from Jaron Lanier, VPL Research),allows us a new way to visualize abstractions that otherwise have to be imagined.
VR has been applied in visual presentation of physical worlds such as creating visual filemanagement system (Van Scoy, 1998); creating architectural images (Bertol, 1997);performing truss analysis (Feiner et al., 1993); and 3-D representation of geographicaldata (GIS). It has been used in studies for various sight-related medical problems(Baker, 1999), and has been applied to create the “immersion” experiences to assist inergonomic studies. In this study, we are interested in linking VR with our physicalmechanical world, in order to provide meaningful interpretations such that the engineerscan have a better appreciation of physical problems that they may be interested insolving.
A specific goal in this exercise is to create a useful tool to model and to simulate themechanical behavior of vibrating systems. To develop this tool, we intended to combine3-D stereo visualization, physical modeling using discretization such as FEM modeling,user interactivity, computer networking and large data management system. We envisionthat this integrated system can help us to centralize physical data from remote sources,and to create real-time or non-real-time stereo visualization of the wave propagation orvibration behaviors of the physical system, which may be a building experiencingearthquake or an entire city under explosive attack. This system can allow the engineersto replay a disastrous event, better visualize of an otherwise complicated physicalphenomenon, simulate the event with numerical modeling, monitor existing structures,provide real-time warning and finally, upgrade useful information in a database for futurereferences.
This paper presents the results of a proof-of-concept exercise that was done to representthe idea and a conceptual design of the system. The exercise includes simulating wavepropagation on a freely suspended thin rod, numerically generating vibratory informationand use computer networking to transmit the information to a VR machine and presentthe data via 3-D visualization.
DISTRIBUTED VISUALIZATION SYSTEMWith the heavy computational demands of both Finite Element Modeling (FEM) andvisualization using stereo graphics it was decided to create a proof of concept system thatwould allow these two separate entities to work cooperatively.
A Distributed Visualization System (DVS) is used to illustrate the capacity of real-timeremote data display and distributed networking.
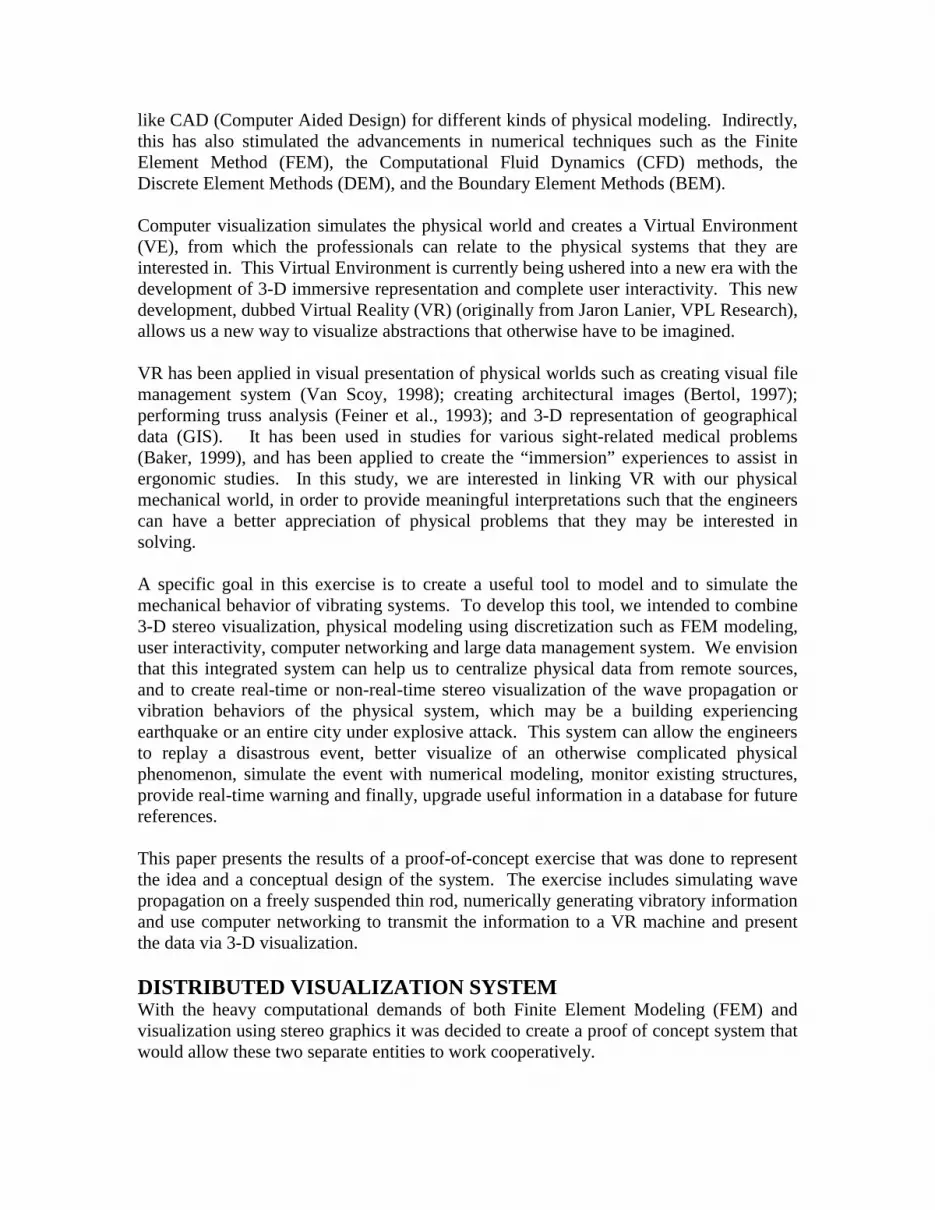
In designing such a system it is necessary to appreciate the capabilities of the variousmachines comprising the network. Perhaps even more important is the need for a fast,efficient connection between the networked machines. For the purpose of this exercise, aSGI Origin 2000 was used for the finite element computation and the data wastransmitted via TCP/IP protocol running on a Fast Ethernet connection. The reasonTCP/IP was chosen as opposed to other protocols is the unique ability of TCP/IP to runon top of most other protocols currently in use, including Ethernet, ATM, and TokenRing. By using TCP/IP the application developed will be able to run on a variety ofdifferent types of networks or via the Internet. The data is then displayed on a VRvisualization system (ImmersaDesk), which is empowered by a SGI Onyx 2.
Figure 1: overview of the distributed system
The connections between the computers were formed via a client/server relation. TheDisplay software running on SGI Onyx 2 acted as a server and waited for the client (SGIOrigin 2000) through an active connection. Once the connection was established, theclient would send an array of data for each computational time step across to the server.Once the entire array of data had reached the destination point, the display programcommenced at updating the image on the ImmersaDesk, thus giving a near real-timedisplay of the data. Once all the arrays had been sent, the client would then disconnectitself from the server, and the server would go back into an “idle” mode waiting foranother client to connect.
FINITE ELEMENT MODELINGWave Propagation in a Thin RodThe thin rod vibration problem is chosen for the exercise, because it represents thesimplest wave propagation phenomenon in One-dimension. This model, known as theHopkinson bar test has been used widely in the study of wave propagation phenomenon(Kolskey, 1963). The test consists of applying an impact loading to one end of asuspended rod. Investigation including vibration measurements are made on the rod.Based on the arrival times of the impact wave at various locations along the rod, thetravel speed may be established. To model the mechanical propagation of the impactthrough the rod, a Multi-Degree-Of-Freedom (MDOF) lumped-mass model is used. Theequation of motion of the MDOF system can be summarized in matrix form (Chen,1996):
Where [M] is the lumped mass matrix, [K] is the stiffness matrix, [C] is the idealizeddamping coefficient matrix, and u is the displacement of each element, which is afunction of time. F is the loading on the rod, assuming a mono-peak, Hanning functionwith a short impact duration, To:
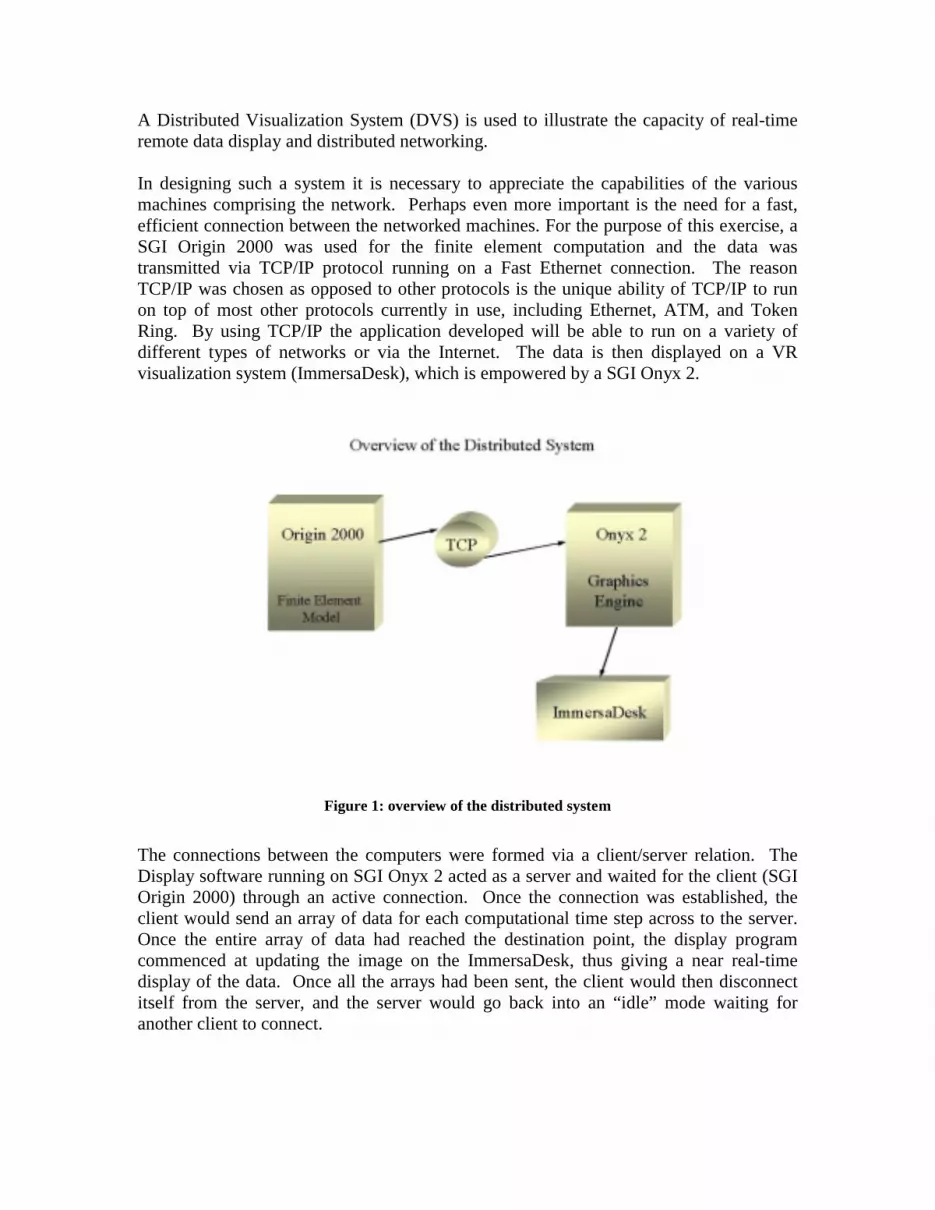
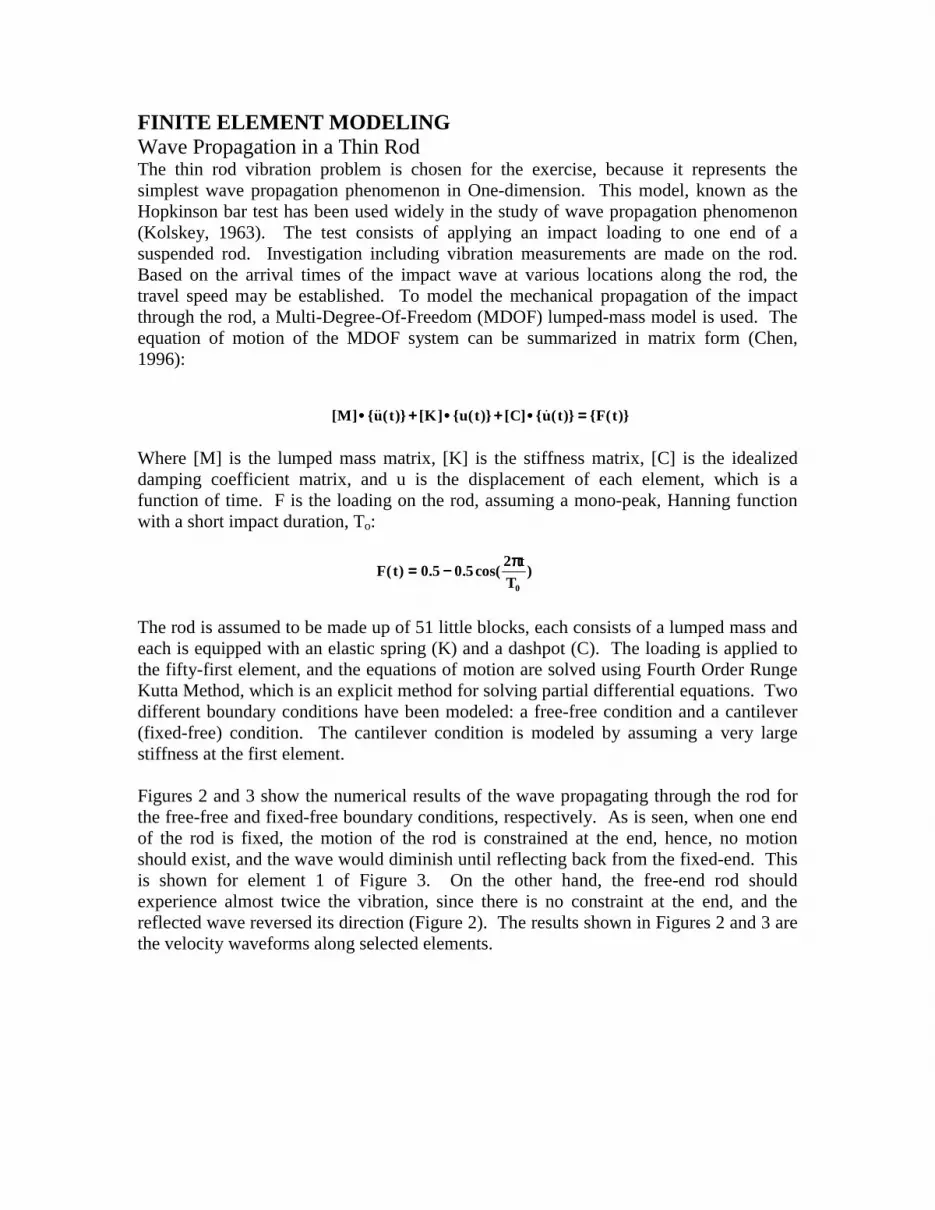
The rod is assumed to be made up of 51 little blocks, each consists of a lumped mass andeach is equipped with an elastic spring (K) and a dashpot (C). The loading is applied tothe fifty-first element, and the equations of motion are solved using Fourth Order RungeKutta Method, which is an explicit method for solving partial differential equations. Twodifferent boundary conditions have been modeled: a free-free condition and a cantilever(fixed-free) condition. The cantilever condition is modeled by assuming a very largestiffness at the first element.
Figures 2 and 3 show the numerical results of the wave propagating through the rod forthe free-free and fixed-free boundary conditions, respectively. As is seen, when one endof the rod is fixed, the motion of the rod is constrained at the end, hence, no motionshould exist, and the wave would diminish until reflecting back from the fixed-end. Thisis shown for element 1 of Figure 3. On the other hand, the free-end rod shouldexperience almost twice the vibration, since there is no constraint at the end, and thereflected wave reversed its direction (Figure 2). The results shown in Figures 2 and 3 arethe velocity waveforms along selected elements.
[ ] {!!( )} [ ] { ( )} [ ] { ! ( )} { ( )}M u t K u t C u t F t•••• ++++ •••• ++++ •••• ====
F tt
T( ) . . cos( )==== −−−−0 5 0 5
2
0
ππππ
Figure 2: free - free rod vibration
Figure 3: fixed - free rod vibration
3-D VISUALIZATION (THE VR MACHINE)
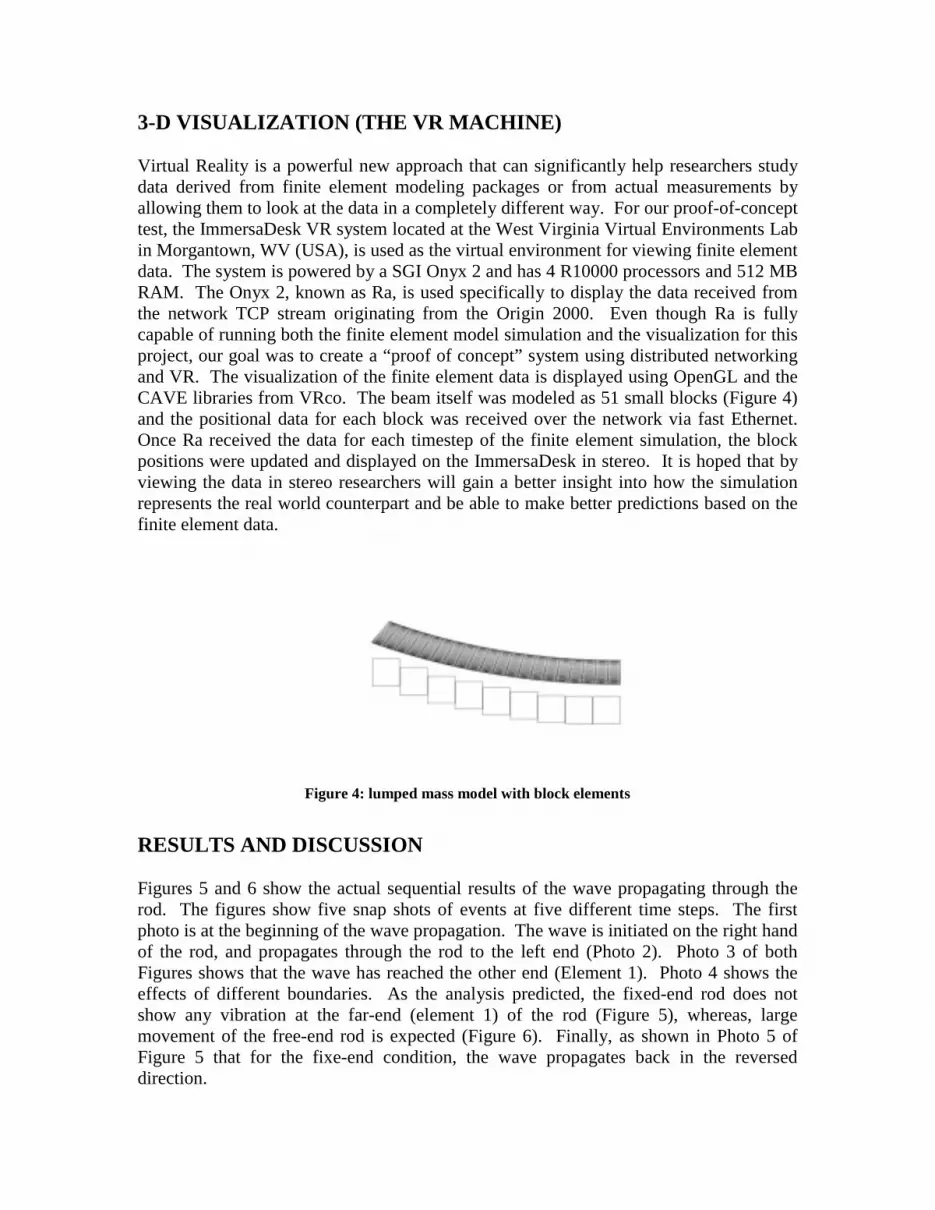
Virtual Reality is a powerful new approach that can significantly help researchers studydata derived from finite element modeling packages or from actual measurements byallowing them to look at the data in a completely different way. For our proof-of-concepttest, the ImmersaDesk VR system located at the West Virginia Virtual Environments Labin Morgantown, WV (USA), is used as the virtual environment for viewing finite elementdata. The system is powered by a SGI Onyx 2 and has 4 R10000 processors and 512 MBRAM. The Onyx 2, known as Ra, is used specifically to display the data received fromthe network TCP stream originating from the Origin 2000. Even though Ra is fullycapable of running both the finite element model simulation and the visualization for thisproject, our goal was to create a “proof of concept” system using distributed networkingand VR. The visualization of the finite element data is displayed using OpenGL and theCAVE libraries from VRco. The beam itself was modeled as 51 small blocks (Figure 4)and the positional data for each block was received over the network via fast Ethernet.Once Ra received the data for each timestep of the finite element simulation, the blockpositions were updated and displayed on the ImmersaDesk in stereo. It is hoped that byviewing the data in stereo researchers will gain a better insight into how the simulationrepresents the real world counterpart and be able to make better predictions based on thefinite element data.
Figure 4: lumped mass model with block elements
RESULTS AND DISCUSSION
Figures 5 and 6 show the actual sequential results of the wave propagating through therod. The figures show five snap shots of events at five different time steps. The firstphoto is at the beginning of the wave propagation. The wave is initiated on the right handof the rod, and propagates through the rod to the left end (Photo 2). Photo 3 of bothFigures shows that the wave has reached the other end (Element 1). Photo 4 shows theeffects of different boundaries. As the analysis predicted, the fixed-end rod does notshow any vibration at the far-end (element 1) of the rod (Figure 5), whereas, largemovement of the free-end rod is expected (Figure 6). Finally, as shown in Photo 5 ofFigure 5 that for the fixe-end condition, the wave propagates back in the reverseddirection.
Figure 5: fixed-free wave propagation
Figure 6: free-free wave propagation
The advantage of using Immersive visualization for finite element modeling data is thatnow the engineer can visualize what is actually happening in the rod. Typically in thephysical experiment the displacement is measured using a limited amount ofaccelerometers, and the data is collected using an oscilloscope that displays the results asa function of time. The results will look like Figures 2 and 3, and the engineers will haveto mentally construct the image of wave propagation through the rod.
To experimentally determine the actual motion it is necessary to use a high-speed cameraand multiple exposures. The advantage of using virtual reality is that now the engineerscan visually see the wave propagating through the rod, which increases their appreciationof the mechanical behavior. Another major benefit of using virtual reality is that theexperience allows engineers to immerse themselves into the vibratory motion throughstereo graphics and differing viewpoints, which is rarely appreciated through regularcomputer monitor displays.
Using this example, we also demonstrated that real-time computer networking can beused for effective data transmission for time-dependent events. This is particularlyimportant for multiple source data acquisition for time related studies, such as real-timemonitoring of the stock market, the changes in a river bed, wind current effects on airpollution, or seismic movements of an earthquake sensitive zone. A few years ago,without the advancements in computer networking, this would not be possible. However,with recent advancements in network communication bandwidth, it is now feasible totransmit signals from remote geographical locations via the Internet to a commonlocation for data analysis.
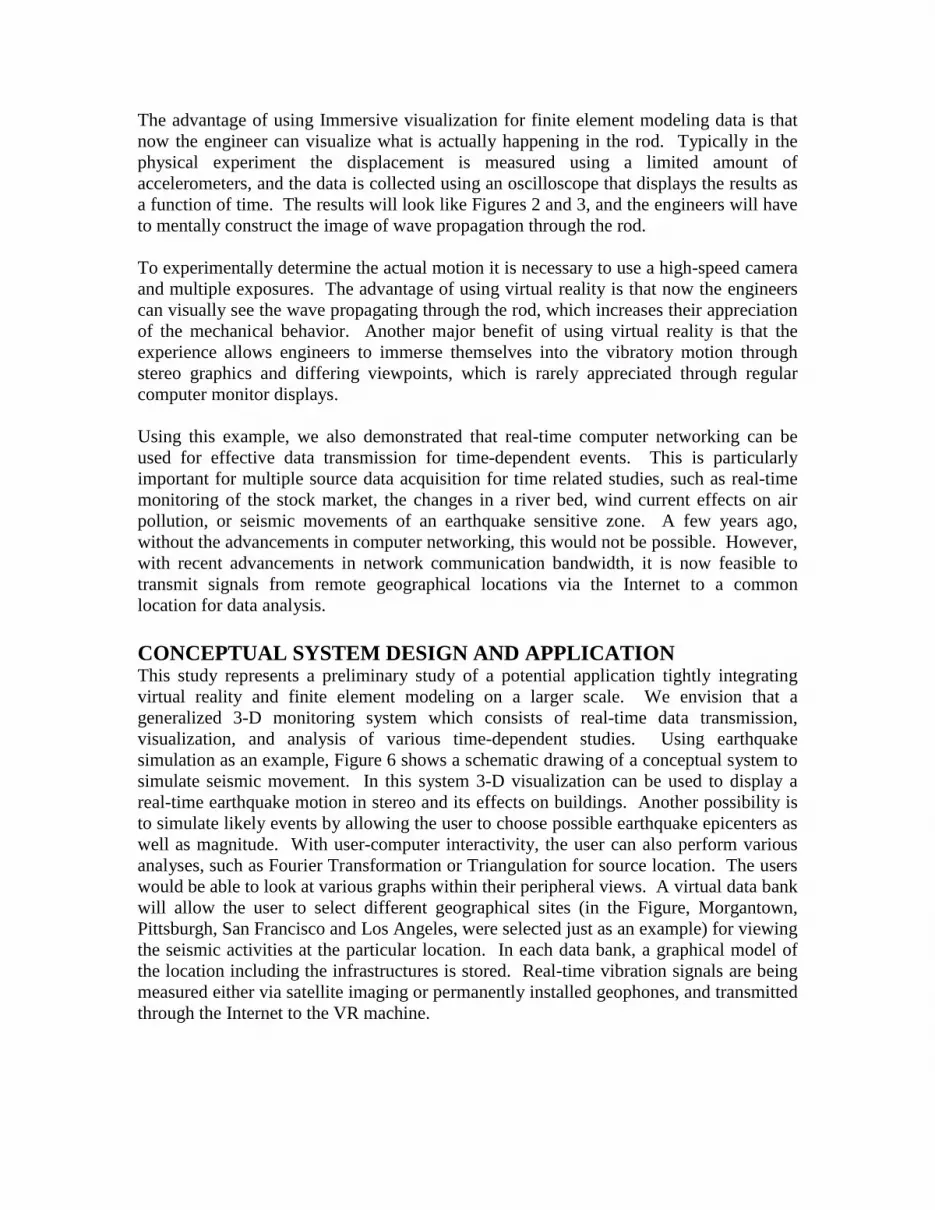
CONCEPTUAL SYSTEM DESIGN AND APPLICATIONThis study represents a preliminary study of a potential application tightly integratingvirtual reality and finite element modeling on a larger scale. We envision that ageneralized 3-D monitoring system which consists of real-time data transmission,visualization, and analysis of various time-dependent studies. Using earthquakesimulation as an example, Figure 6 shows a schematic drawing of a conceptual system tosimulate seismic movement. In this system 3-D visualization can be used to display areal-time earthquake motion in stereo and its effects on buildings. Another possibility isto simulate likely events by allowing the user to choose possible earthquake epicenters aswell as magnitude. With user-computer interactivity, the user can also perform variousanalyses, such as Fourier Transformation or Triangulation for source location. The userswould be able to look at various graphs within their peripheral views. A virtual data bankwill allow the user to select different geographical sites (in the Figure, Morgantown,Pittsburgh, San Francisco and Los Angeles, were selected just as an example) for viewingthe seismic activities at the particular location. In each data bank, a graphical model ofthe location including the infrastructures is stored. Real-time vibration signals are beingmeasured either via satellite imaging or permanently installed geophones, and transmittedthrough the Internet to the VR machine.
Figure 7: interactive earthquake simulation
FUTURE WORKOur proof of concept merely proves that the technology can be combined from variousdisciplines and be used to complement one another. The next phase is to create a user-friendly interface that allows for real-time interaction with the finite element applicationwhile viewing the data in stereo. This will allow an engineer to customize the system fora specific application and make changes and see the results in a potentially meaningfulway. A three dimensional Finite Element Analysis program will be implemented foranalyzing more complex structures in the virtual environment. Multiple-platformnetworking capability of the system will also be established. A data management systemwill also be investigated for establishing the different physical models. Figure 7 showsthe different components that are required to integrate into the VR Presentation System.
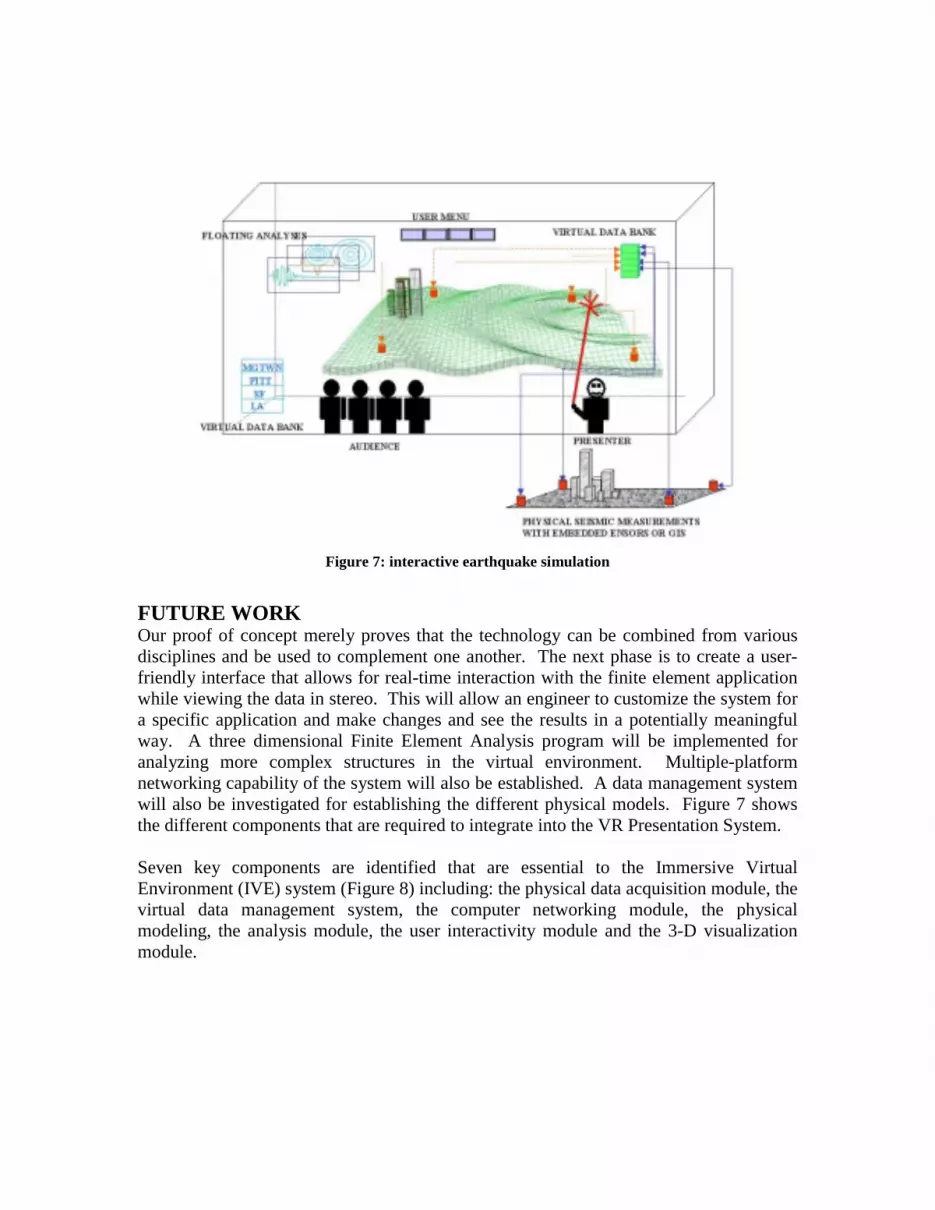
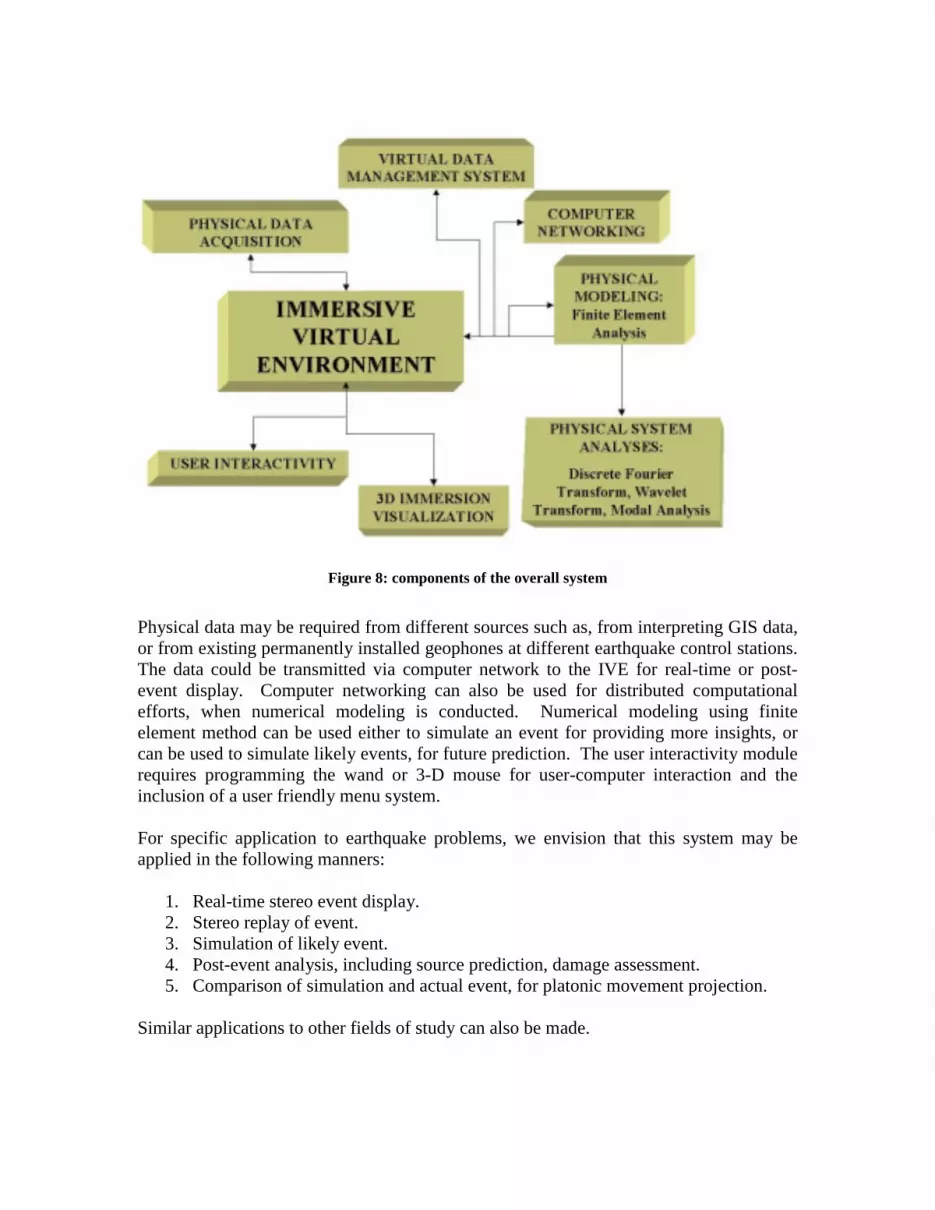
Seven key components are identified that are essential to the Immersive VirtualEnvironment (IVE) system (Figure 8) including: the physical data acquisition module, thevirtual data management system, the computer networking module, the physicalmodeling, the analysis module, the user interactivity module and the 3-D visualizationmodule.
Figure 8: components of the overall system
Physical data may be required from different sources such as, from interpreting GIS data,or from existing permanently installed geophones at different earthquake control stations.The data could be transmitted via computer network to the IVE for real-time or post-event display. Computer networking can also be used for distributed computationalefforts, when numerical modeling is conducted. Numerical modeling using finiteelement method can be used either to simulate an event for providing more insights, orcan be used to simulate likely events, for future prediction. The user interactivity modulerequires programming the wand or 3-D mouse for user-computer interaction and theinclusion of a user friendly menu system.
For specific application to earthquake problems, we envision that this system may beapplied in the following manners:
1. Real-time stereo event display.2. Stereo replay of event.3. Simulation of likely event.4. Post-event analysis, including source prediction, damage assessment.5. Comparison of simulation and actual event, for platonic movement projection.
Similar applications to other fields of study can also be made.
CONCLUSIONThe capacity of VR application in real-time display of vibration behavior is illustratedusing a simple numerical experiment of wave propagation in a rod. By using distributedsystems to account for the extensive computation effort and the stereo visualization, wedemonstrated a possible application of VR in real-time earthquake monitoring. Adescription of such an IVE system is presented, which shows that an integration ofdifferent advanced techniques, including computer networking and virtual datamanagement system, will be needed. It is hoped that with the immersion experience fromthe IVE system, better insights to the physical mechanisms may be provided for theengineers and scientists.
ACKNOWLEDGEMENTSThis paper started out as a class project in Vic Baker’s CS288 “Computer Graphics”class. But the project becomes so interesting that we decided to pursue a full-scaleresearch, hence, the conceptual system began to materialize.
We would like to acknowledge Co-Author Vic Baker for teaching us VR and made theclass very interesting.
REFERENCES
F.L. Van Scoy, “A Virtual Environment Based File Management System: PreliminaryWork,” VSMM 1998.
D. Bertol, Design Digital Space, Wiley, 1997.
V. Baker, “Low Vision and Virtual Reality: Preliminary Work,” 3rd InternationalProjection Technologies Workshop, Stuttgart, Germany May 1999
S.E. Chen, The Dynamic SSI of a Shallow Buried Plates Under Impact Loading, Ph.D.dissertation, WVU, 1996.
H. Kolsky, Stress Waves in Solids, Dover Pub., NY, 1963.
S. Feiner, A. Webster, T. Krueger, B. MacIntyre, and E. Keller, Architectural Anatomy.Presence: Teleoperators and Virtual Environments 4, no.3, p.318-325, 1995.