151
BIOENERGY FROM SUGARCANE ORGANIZERS MARCOS FAVA NEVES AND RAFAEL BORDONAL KALAKI
| Date post: | 04-Mar-2023 |
| Category: |
Documents |
| Upload: | khangminh22 |
| View: | 0 times |
| Download: | 0 times |
BIOENERGY FROM SUGARCANE
ORGANIZERS
MARCOS FAVA NEVES AND RAFAEL BORDONAL KALAKI
BIOENERGY FROM SUGARCANE
INSTITUTIONAL SUPPORT:
20-52698 CDD-338.173610981
Dados Internacionais de Catalogação na Publicação (CIP)(Câmara Brasileira do Livro, SP, Brasil)
Bioenergy from sugarcane [livro eletrônico] /
organização Marcos Fava Neves , Rafael Bordonal
Kalaki. -- 1. ed. -- Guariba, SP : Socicana,
2020.
ISBN 978-65-993349-0-0
1. Agricultura 2. Agroindústria 3. Bioenergia 4.
Cana de açúcar - Indústria 5. Sustentabilidade
ambiental I. Neves, Marcos Fava. II. Kalaki, Rafael
Bordonal.
Índices para catálogo sistemático:
1. Cana-de-açúcar : Agroindústria : Sustentabilidade
: Brasil : Economia 338.173610981
Aline Graziele Benitez - Bibliotecária - CRB-1/3129
BOOKS ORGANIZERS:Marcos Fava Neves
Rafael Bordonal Kalaki
TRANSLATOR:Viviane Riitano
PLANNING AND COORDINATION: André Penteado Ricci
Gabriela Registro Mesquita
GRAPHIC DESIGNERS:Karen Faria de Oliveira
Paulo Eduardo Canedo Nabas
BIOENERGY FROM SUGARCANE
Authors 7
From Brazil to the world! 9 Socioeconomic scenario of the sugar-energysector in Brazil: a view of the past and present 11
A method for strategic planning of food and bioenergy chains(CHAINPLAN) applied to the sugarcane chain 29
Sugarcane Industry Development Analysis from the Perspective of Agro-Industrial System Quantification 55
Sugar Cane as a Promoter of Development: The Cases of Quirinópolis and Uberaba 73
Environmental Scenarios for Mandatory Bio-Fuel Blending Targets: An Application Of Intuitive Logics 93
Sugar Cane Growers Scenario in Brazil 125
Satisfaction of Private Interest Association’s Members: a Study with Sugarcane Producers 143
An overview of sugar farmers in 2017 from the perspective of the relationship 161
Sustainability in sugarcane production: the case of Socicana and the Top Cana program 175
Clean Energy Policies for China: the Case of Ethanol 197
The Benefits of Sugarcane Chain Development in Africa 213
Copersucar:A World Leader in Sugar and Ethanol 223
Socioeconomic scenario of the sugar-energy sector: a view of the future 259
Final Message 273
References 275
TABLE OF CONTENTS
1
5
2
6
3
7
9
4
8
10
11
12
13
BIOENERGY FROM SUGARCANE
MARCOS FAVA NEVES
AUTHORS
is an international expert on global agribusiness issues and a part-time professor of planning and strategy at the School of Business (FEA-RP) of the University of São Paulo (USP) and FGV Business School, both in Brazil. He graduated as an agronomic engineer from ESALQ/USP - Piracicaba in 1991. He earned his master’s degree in 1995 and his doctorate in management in 1999 from the FEA/USP School of Economics and Business – São Paulo. Marcos completed postgraduate studies in European agribusiness at ESSEC-IGIA in France in 1995 and in chains/networks at Wageningen University, in the Netherlands (1998-1999). In 2013 he spent the year as a visiting international professor at Purdue University (Indiana, USA) where he maintains the linkage as a permanent International Adjunct Professor. Since 2006 he is an international professor at the University of Buenos Aires, Argentina.He has specialized in strategic-planning processes for companies and food chains and works as a board member of both public and private organizations, being member of more than 10 international boards since 2004. Also in 2004, he created the Markestrat think tank with other partners, today employing around 60 people and doing international projects, studies and research in strategic planning and management for more than 250 agri-food business organizations. Some of these projects were very important in suggesting public policies for food chains that were implemented in Brazil with economic and social impacts.He is the author and coordinator of 75 books published in Brazil, Argentina, United States, South Africa, Uruguay, England, Singapore, Holland and China, by 10 different publishers. He also wrote two cases for Harvard University (2009/2010) and two for Purdue University (2013/2019).He published more than 200 articles in indexed international and national scientific journals, having received 5,000 citations according to Google Scholar, one of the most cited Brazilian scientists in his field. He was a columnist for the China Daily newspaper in Beijing and Folha de S. Paulo, in addition to writing articles for O Estado de São Paulo and Valor Econômico, among others, having more than 600 joint analysis
BOOK ORGANIZERS
7
BIOENERGY FROM SUGARCANE
Dear readers,
Through this book, we have the opportunity to understand, through
data worked globally, the importance of sugarcane for the planet. This crop, which is one of the pillars of Brazilian agribusiness, stands out for its production variety, as well as being critical to the predictability and environmental, economic and social sustainability.
Brazil, by the way, is a reference in the production of sugarcane, with credentials to share knowledge and thus contribute to its development around the world. In this book, that by being in English aims to reach all continents, we may get to know the work of the Brazilian sugarcane industry deeper, which supported the agricultural production chain, investing in technology and increased productivity.
Ourofino Agrociência, a Brazilian company of which I am a founding partner along with my friend Jardel Massari, operates in the crop protection market and seeks to do its part. Besides having one of the most modern industry plants worldwide, innovation, one of the pillars of its purpose, aims to develop new products and solutions based on the needs and characteristics of tropical agriculture, using as its main foundation knowledge developed by Brazilian research.
I would like to take this opportunity to express my thanks to the book's authors, as well as to all the professionals involved in its preparation. It is through these sort of materials that we shall contribute to the development of Brazilian agribusiness.
Let´s go forward!
FROM BRAZIL TO THE WORLD!
RAFAEL BORDONAL KALAKIGraduated in Agronomic Engineering from São Paulo State University (UNESP) in 2010. Master and PhD in Business Administration from FEA-RP/USP. He was a researcher at Markestrat - Center for Research and Projects in Marketing and Strategy. He has experience in the area of Agronomy, with emphasis on Agribusiness, working mainly with strategic planning, market access, business strategy, mapping and quantification of agro-industrial systems, analysis of attractiveness and socio-environmental certifications. He is currently
superintendent at Socicana (Guariba cane suppliers association) and member of the Bonsucro Members Council.
articles published in magazines and newspapers. He participated in 335 congresses in Brazil and abroad, having also organized more than 30 national and international congresses.In the training of people and human talents, he supervised 36 Thesis, 9 of which were for Doctorates and 27 for Masters and 135 Monographs. Helped, as a teacher, to graduate more than 1,500 business administrators, having offered around 140 undergraduate courses and 22 Masters and Doctorate courses at USP and FGV. He has made 1,350 lectures in 22 countries, being one of the most well- known Brazilians abroad in the area of agribusiness.
[email protected] / www.doutoragro.com
Norival BonamichiFounder and President Ourofino Agrociência
8 9
BIOENERGY FROM SUGARCANE
INITIAL MESSAGEDear reader,
This book brings a selection of some of the main texts about bioenergy from sugarcane published by the authors in the last few years. The texts were published in important journals, case studies, book chapters and conferences.
The book is a collection of the advancements of bioenergy from sugarcane, the panorama of the sector in Brazil and in the world, experiences in other countries and a view of this important bioenergy chain to the world.
Sugarcane and all of its chain is an example of bionergy, both toward supplying houses, industries and moving cities, and as ethanol to fuel our cars being a fuel which polutes around 80% to 90% less than gasoline, and also energy to human beings, through sugar, a pure and cheap energy source. All those benefits come in a suistainable way, with a chain which emits less carbon and environmental impacts when compared to others, a green sea on the field of capturing carbon form atmosphere, a suistainable chain, renewable and with high indexes of circular economy practices. This is a new world, suistainable and accessible bioenergy to all population,
Enjoy your reading!
11
BIOENERGY FROM SUGARCANEBIOENERGY FROM SUGARCANE
SOCIOECONOMIC SCENARIO OF THE SUGAR-ENERGY SECTOR IN BRAZIL: A VIEW OF THE PAST AND PRESENT
BY MARCOS FAVA NEVES AND RAFAEL BORDONAL KALAKI
1
BIOENERGY FROM SUGARCANE
INTRODUCTION
Energy is a key element in our lives from the primary and fundamental activity of food production to the functioning of various technological and economic sectors of a nation. Due to this, energy security is an important factor in the development of countries and the greatest challenge is to supply this development with clean energy, using renewable resources with economic and environmental importance.
In this sense, Brazilian sugar-energy sector shows its strength by producing different forms of sustainable and renewable agroenergy (sugar, ethanol, electricity, and other products), which are able to supply the present demand without compromising the environment and the availability for future generations. According to UNICA (2016b), Brazil is a reference in the use of renewable energies and the sugar-energy sector has a great participation with ethanol and bioelectricity.
CURRENT SCENARIO OF SUGAR-ENERGY SECTOR
Sugar-energy sector has been important for Brazil since the country’s colonization, being the central engine of the economy several times. Brazil is the world’s largest producer of sugarcane with a share of 39%. In sugar production, the country is also the largest producer, with 21% of the total, and the largest exporter with a share of 45% in total exports. Regarding ethanol production, the country is the second largest producer with a total of 27% (UNICA, 2016c; FAO, 2016; USDA, 2016a; RFA, 2015).
According to a survey conducted by Markestrat and FEA-RP/USP in 2014, with the support of UNICA, Orplana, and Ceise (Sertãozinho), the sector has a strong impact as a generator of wealth for the nation. In 2013/14, it generated a GDP of US$ 43.4 billion, which is equivalent to approximately 2% of Brazil’s GDP. If one considers the total sum of sales of the various links that make up the agro-industrial sugarcane system, the value reached was US$ 107.7 billion. The trend is that these values will continue to increase, while other products, which are not the main sources of revenue, will become more important in generating wealth in the sector such as bioelectricity, yeasts, bioplastics, diesel cane, biobutanol, cellulosic ethanol and carbon credits, among others. In 2013, the total wage bill of the sector was US$ 4.13 billion, raising about US$ 8.5 billion in taxes and bringing annually an export of almost US$ 10 billion (Neves and Trombin, 2014).
15

BIOENERGY FROM SUGARCANECHAPTER 1
SUGARCANE
Brazil accounted for 666.8 million tons in the 2015/16 crop, which represents around 39% of the world total production. Thus it is considered the world’s largest producer of sugarcane (UNICA, 2016c). Brazilian production has grown 56% in the last 10 years. Graph 1 below shows the history of sugarcane production and milling in the last 10 years in the two main producing regions: center-south and north-northeast. In relation to the area occupied in Brazil with plantation, sugarcane is in third place when compared with temporary crops, following behind only soy and corn.
According to data from UNICA (2016c), the State of São Paulo is the largest producer, representing 55.24% of the national production and milling in the last crop. In second place comes the State of Goiás, and Minas Gerais comes in third (Graph 2). The State of São Paulo is the largest state with mills in the sector. According to NovaCana, it currently has 172 mills, of which 157 are active (2016b).
GRAPH 1: HISTORY OF SUGARCANE PRODUCTION AND MILLING
Source: prepared by Markestrat from UNICA (2016c).
Center-South Region North-Northeast Region
2006
/200
7
2007
/200
8
2008
/200
9
2009
/201
0
2010
/201
1
2011
/201
2
2012
/201
3
2013
/201
4
2014
/201
5
2015
/201
6
0
100.000
200.000
300.000
Thou
sand
tons
400.000
500.000
600.000
700.000
The productivity of sugarcane plantations (in volume - tons of sugarcane per hectare) has been oscillating. However, in a 10-year period, it presented a growth of 3%. On the other hand, the quality of the raw material (Kg of ATR per ton of sugarcane) decreased 1% in the period (Graph 3).
GRAPH 3: AREA PLANTED, PRODUCTIVITY AND QUALITY OF SUGARCANE
GRAPH 2: PARTICIPATION BY STATE IN SUGARCANE PRODUCTION IN BRAZIL
Source: elaborated Markestrat from Conab, 2016a.
Source: prepared by Markestrat from UNICA (2016c).
Area (million hectares) Production (T/ha) Quality (Kg ATR/t)
2006
/200
7
2005
/200
6
2007
/200
8
2008
/200
9
2009
/201
0
2010
/201
1
2011
/201
2
2012
/201
3
2013
/201
4
2014
/201
5
2015
/201
6
5.00
5.50
6.00
6.50Mill
ion
hect
ares
7.00
7.50
8.00
8.50
9.00
9.50
0.00
20.00
40.00
60.00
Tons
per
hec
tare
/Kg
ATR
per
ton
80.00
100.00
120.00
140.00
160.00
In the 2015/16 crop, the average price of the ton of sugarcane increased 20% in relation to the last two crops (Graph 4). This increase was mainly due to international sugar prices and also to the increase of
São Paulo55.24%Mato Grosso do Sul
7.17%
Minas Gerais9.73%
Goiás11.03%
Others3.78%
Pernambuco1.71%
Alagoas2.46%
Mato Grosso2.57%
Paraná6.31%
16 17
Su
gar
pro
du
ctio
n w
orld
wid
e in
201
5 (m
illi
on to
ns)
: 164
,9G
row
th 2
006-
2015
: + 0
.4%
Sh
are
1º B
razi
l
Pro
du
ctio
n: 3
4.65
mi t
onG
row
th (0
6-15
): +
10%
21%
Sh
are
8.5%
Sh
are
5.1%
Pro
du
ctio
n: 9
4.52
mil
lion
ton
s
42.7
%
57.3
%
Su
gar
pro
du
ctio
n w
orld
wid
e
3º E
uro
pea
n U
nio
n (2
7)
Pro
du
ctio
n: 1
4 m
i ton
Gro
wth
(06-
15):
-22%
Sh
are
5.9%
4º T
hai
lan
d
Pro
du
ctio
n: 9
.7 m
i ton
Gro
wth
(06-
15):
+45
%
Sh
are
16.8
%
2º I
nd
ia
Pro
du
ctio
n: 2
7.7
mi t
onG
row
th (0
6-15
): -1
0%
5º C
hin
a
Pro
du
ctio
n: 8
.43
mi t
onG
row
th (0
6-15
): +
10%
CHAPTER 1 BIOENERGY FROM SUGARCANE
SUGAR
Sugar is produced from two main raw materials: sugarcane and beet. According to the USDA data (2016), 80% of the sugar produced worldwide is derives from sugarcane, while only 20% comes from beet. Figure 1 shows the map with the distribution of sugar production by type.
2013/14 2014/15 2015/16
0
10
20
30
R$/
ton
of su
garc
ane
40
50
60
70
80
90
Averagesugarcane
price
White sugardomesticmarket
Anhydrousethanol
fuel
White sugarforeingmarket
VHPSugar
Hydrousethanol
fuel
GRAPH 4: AVERAGE PRICE OF SUGARCANE AND ITS PRODUCTS
FIGURE 1: SUGAR PRODUCING COUNTRIES AND THEIR RAW MATERIALS
Source: prepared by Markestrat from UNICA (2016b).
Source: Adapted by Markestrat from Bioagência. * The European Union is accounted as only one producing country.
127 Sugar Cane producing countriesBeet - 42Sugar Cane and Beet - 8Sugar Cane - 73
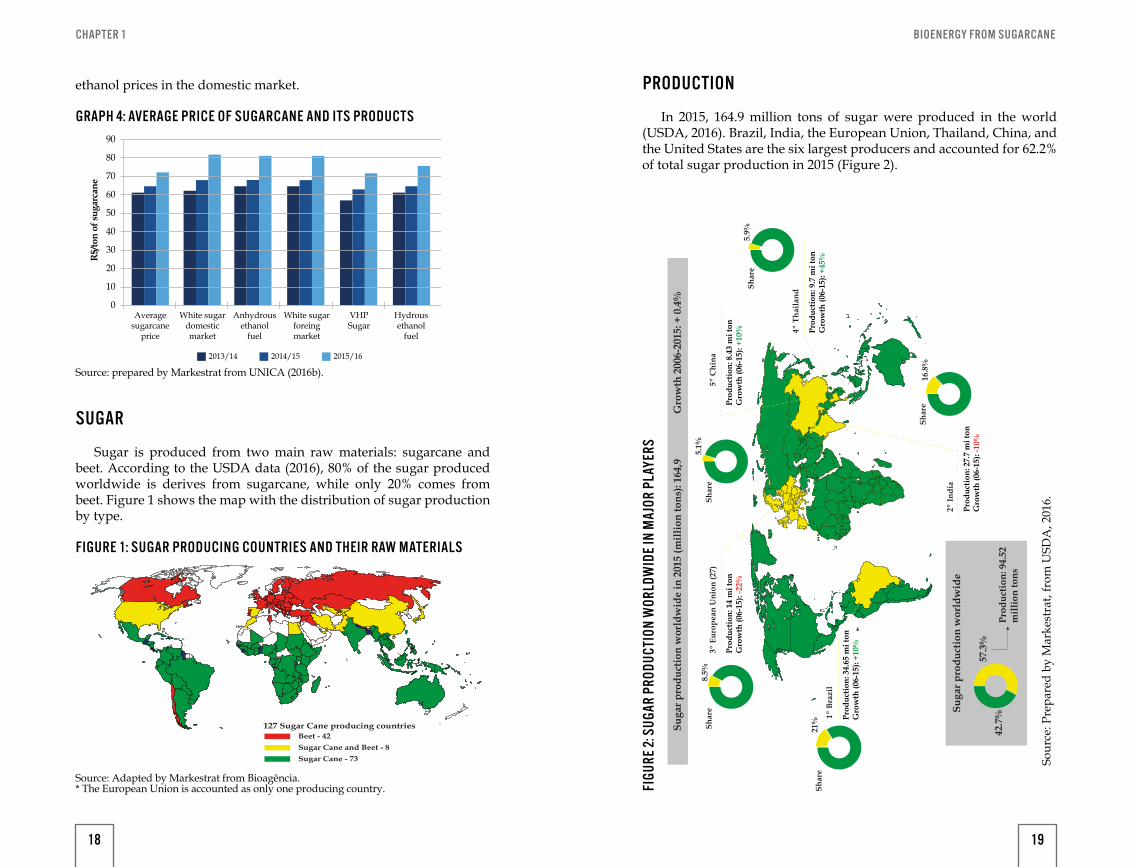
ethanol prices in the domestic market. PRODUCTION
In 2015, 164.9 million tons of sugar were produced in the world (USDA, 2016). Brazil, India, the European Union, Thailand, China, and the United States are the six largest producers and accounted for 62.2% of total sugar production in 2015 (Figure 2).
FIGU
RE 2:
SUG
AR P
RODU
CTIO
N W
ORLD
WID
E IN
MAJ
OR P
LAYE
RS
Sour
ce: P
repa
red
by M
arke
stra
t, fr
om U
SDA
, 201
6.
18 19
Su
gar
con
sum
pti
on w
orld
wid
e in
201
5 (m
illi
on to
ns)
: 171
,8G
row
th 2
006-
2015
: + 1
5%
Sh
are
4º B
razi
l
Con
sum
pti
on: 1
0.9
mi t
onG
row
th (0
6-15
): +
1%
6.4%
Sh
are
6.3%
Sh
are
11%
Pro
du
ctio
n: 8
4.88
7m
illi
on to
ns
50.6
%
49.4
Su
gar
pro
du
ctio
n w
orld
wid
e
5º U
SA
Con
sum
pti
on: 1
0.89
mi t
onG
row
th (0
6-15
): +
21%
Sh
are
10.2
%
3º C
hin
a
Con
sum
pti
on: 1
7.5
mi t
onG
row
th (0
6-15
): +
30%
Sh
are
16%
1º I
nd
ia
Con
sum
pti
on: 2
6.8
mi t
onG
row
th (0
6-15
): +
31%
2º E
uro
pea
n U
nio
n (2
7)
Con
sum
pti
on: 1
8.8
mi t
onG
row
th (0
6-15
): -6
%
CHAPTER 1 BIOENERGY FROM SUGARCANE
Brazil is the world’s largest sugar producer with 34.65 million tons in 2015, accounting for 21% of the total. The country maintained its worldwide share of 22% practically constant in the last decade. However, it had a volume of production 10% greater than in 2005.
India is the world’s second-largest producer with a production of 27.7 million tons and share of 17%. Unlike Brazil, sugarcane production in India is mainly carried out on small farms (OTTO, NEVES and PINTO, 2012), in which sugarcane production is diversified from large to small producers. Together, Brazil and India account for 37.8% of the total volume produced (USDA, 2016).
The European Union is the third most representative, with the equivalent of 8.5% (14 million tons). Its main raw material production is beet. Thailand is fourth position with a production of 9.74 million tons in 2015 and share of 6% in the world production. In 10 years, the country increased its production by 50.3% (moving from 6th to 4th position), being the world’s largest sugar producer.
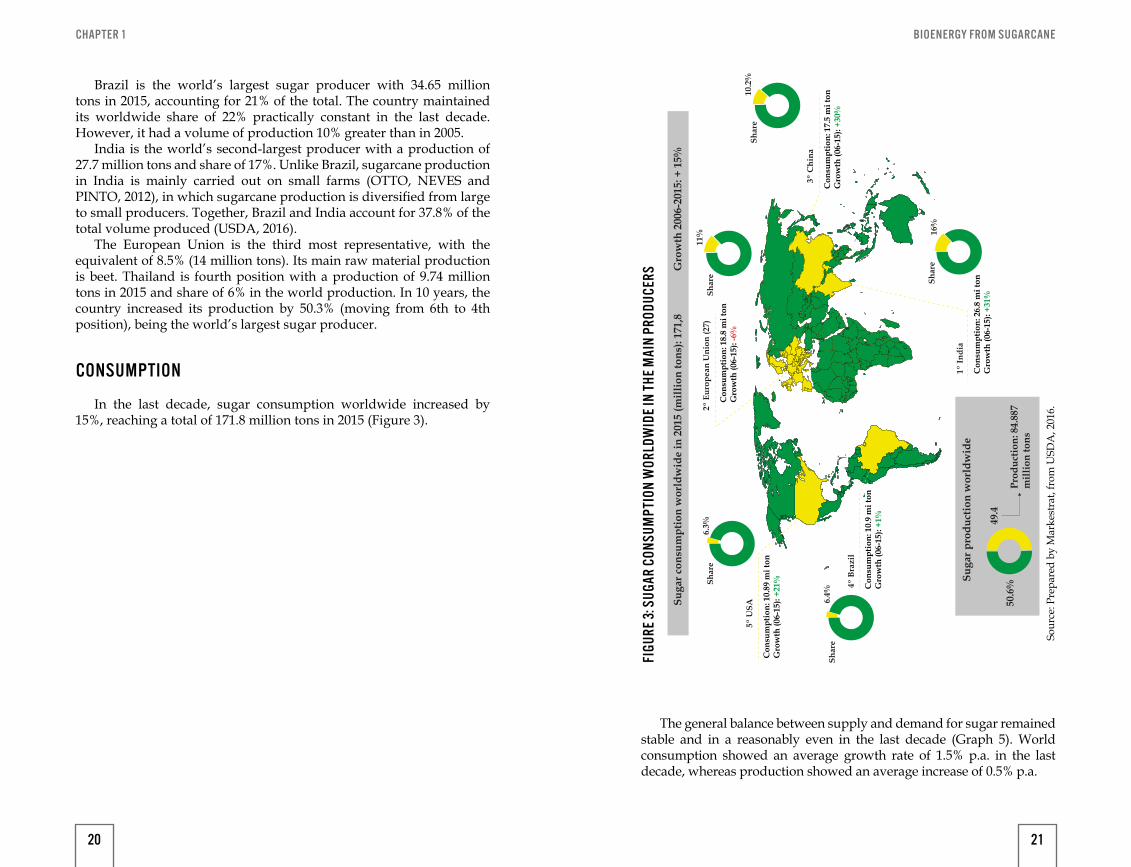
CONSUMPTION
In the last decade, sugar consumption worldwide increased by 15%, reaching a total of 171.8 million tons in 2015 (Figure 3).
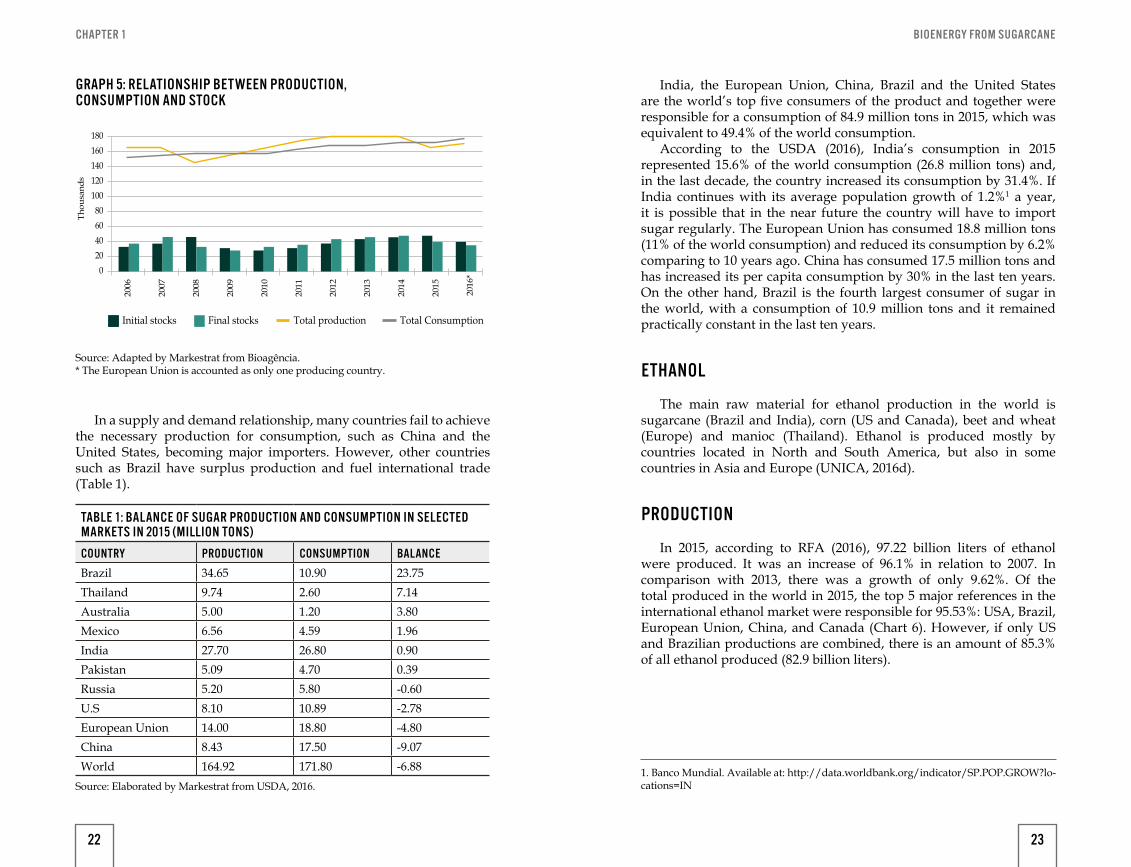
The general balance between supply and demand for sugar remained stable and in a reasonably even in the last decade (Graph 5). World consumption showed an average growth rate of 1.5% p.a. in the last decade, whereas production showed an average increase of 0.5% p.a.
FIGU
RE 3:
SUG
AR C
ONSU
MPT
ION
WOR
LDW
IDE
IN T
HE M
AIN
PROD
UCER
S
Sour
ce: P
repa
red
by M
arke
stra
t, fr
om U
SDA
, 201
6.
20 21
CHAPTER 1 BIOENERGY FROM SUGARCANE
GRAPH 5: RELATIONSHIP BET WEEN PRODUCTION, CONSUMPTION AND STOCK
Source: Adapted by Markestrat from Bioagência. * The European Union is accounted as only one producing country.
Source: Elaborated by Markestrat from USDA, 2016.
2007
2006
2008
2009
2010
2011
2012
2013
2014
2015
2016
*0204060
Thou
sand
s
80100120140160180
Initial stocks Total production Total ConsumptionFinal stocks
In a supply and demand relationship, many countries fail to achieve the necessary production for consumption, such as China and the United States, becoming major importers. However, other countries such as Brazil have surplus production and fuel international trade (Table 1).
TABLE 1: BALANCE OF SUGAR PRODUCTION AND CONSUMPTION IN SELECTED MARKETS IN 2015 (MILLION TONS)
COUNTRY PRODUCTION CONSUMPTION BALANCE
Brazil 34.65 10.90 23.75Thailand 9.74 2.60 7.14Australia 5.00 1.20 3.80Mexico 6.56 4.59 1.96India 27.70 26.80 0.90Pakistan 5.09 4.70 0.39Russia 5.20 5.80 -0.60U.S 8.10 10.89 -2.78European Union 14.00 18.80 -4.80China 8.43 17.50 -9.07World 164.92 171.80 -6.88
India, the European Union, China, Brazil and the United States are the world’s top five consumers of the product and together were responsible for a consumption of 84.9 million tons in 2015, which was equivalent to 49.4% of the world consumption.
According to the USDA (2016), India’s consumption in 2015 represented 15.6% of the world consumption (26.8 million tons) and, in the last decade, the country increased its consumption by 31.4%. If India continues with its average population growth of 1.2%1 a year, it is possible that in the near future the country will have to import sugar regularly. The European Union has consumed 18.8 million tons (11% of the world consumption) and reduced its consumption by 6.2% comparing to 10 years ago. China has consumed 17.5 million tons and has increased its per capita consumption by 30% in the last ten years. On the other hand, Brazil is the fourth largest consumer of sugar in the world, with a consumption of 10.9 million tons and it remained practically constant in the last ten years.
ETHANOL
The main raw material for ethanol production in the world is sugarcane (Brazil and India), corn (US and Canada), beet and wheat (Europe) and manioc (Thailand). Ethanol is produced mostly by countries located in North and South America, but also in some countries in Asia and Europe (UNICA, 2016d).
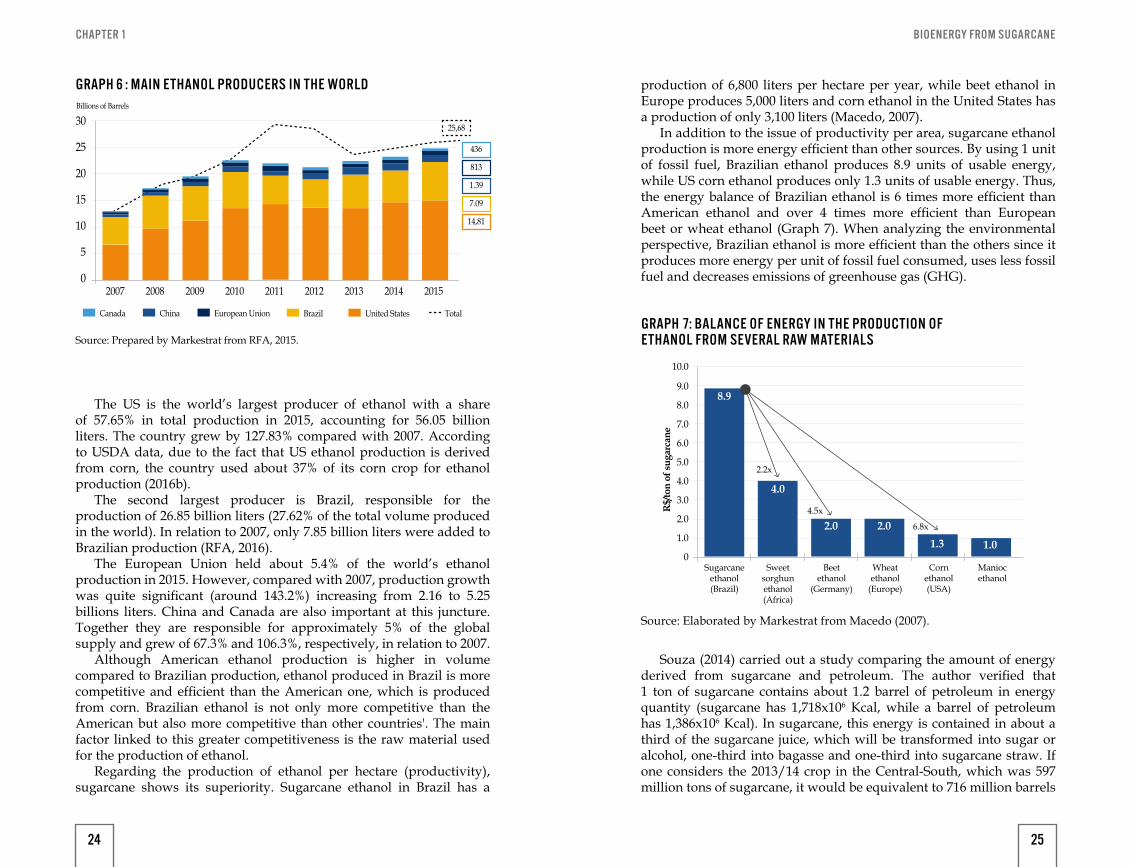
PRODUCTION
In 2015, according to RFA (2016), 97.22 billion liters of ethanol were produced. It was an increase of 96.1% in relation to 2007. In comparison with 2013, there was a growth of only 9.62%. Of the total produced in the world in 2015, the top 5 major references in the international ethanol market were responsible for 95.53%: USA, Brazil, European Union, China, and Canada (Chart 6). However, if only US and Brazilian productions are combined, there is an amount of 85.3% of all ethanol produced (82.9 billion liters).
1. Banco Mundial. Available at: http://data.worldbank.org/indicator/SP.POP.GROW?lo-cations=IN
22 23
CHAPTER 1 BIOENERGY FROM SUGARCANE
GRAPH 6 : MAIN ETHANOL PRODUCERS IN THE WORLD
Source: Prepared by Markestrat from RFA, 2015.
0
5
10
15
Billions of Barrels
20
25
30
2007 2008 2009 2010 2011 2012 2013 2014 2015
Canada China European Union Brazil United States Total
14,81
7.09
1.39
813
436
25,68
The US is the world’s largest producer of ethanol with a share of 57.65% in total production in 2015, accounting for 56.05 billion liters. The country grew by 127.83% compared with 2007. According to USDA data, due to the fact that US ethanol production is derived from corn, the country used about 37% of its corn crop for ethanol production (2016b).
The second largest producer is Brazil, responsible for the production of 26.85 billion liters (27.62% of the total volume produced in the world). In relation to 2007, only 7.85 billion liters were added to Brazilian production (RFA, 2016).
The European Union held about 5.4% of the world’s ethanol production in 2015. However, compared with 2007, production growth was quite significant (around 143.2%) increasing from 2.16 to 5.25 billions liters. China and Canada are also important at this juncture. Together they are responsible for approximately 5% of the global supply and grew of 67.3% and 106.3%, respectively, in relation to 2007.
Although American ethanol production is higher in volume compared to Brazilian production, ethanol produced in Brazil is more competitive and efficient than the American one, which is produced from corn. Brazilian ethanol is not only more competitive than the American but also more competitive than other countries'. The main factor linked to this greater competitiveness is the raw material used for the production of ethanol.
Regarding the production of ethanol per hectare (productivity), sugarcane shows its superiority. Sugarcane ethanol in Brazil has a
GRAPH 7: BALANCE OF ENERGY IN THE PRODUCTION OF ETHANOL FROM SEVERAL RAW MATERIALS
Source: Elaborated by Markestrat from Macedo (2007).
production of 6,800 liters per hectare per year, while beet ethanol in Europe produces 5,000 liters and corn ethanol in the United States has a production of only 3,100 liters (Macedo, 2007).
In addition to the issue of productivity per area, sugarcane ethanol production is more energy efficient than other sources. By using 1 unit of fossil fuel, Brazilian ethanol produces 8.9 units of usable energy, while US corn ethanol produces only 1.3 units of usable energy. Thus, the energy balance of Brazilian ethanol is 6 times more efficient than American ethanol and over 4 times more efficient than European beet or wheat ethanol (Graph 7). When analyzing the environmental perspective, Brazilian ethanol is more efficient than the others since it produces more energy per unit of fossil fuel consumed, uses less fossil fuel and decreases emissions of greenhouse gas (GHG).
Souza (2014) carried out a study comparing the amount of energy derived from sugarcane and petroleum. The author verified that 1 ton of sugarcane contains about 1.2 barrel of petroleum in energy quantity (sugarcane has 1,718x106 Kcal, while a barrel of petroleum has 1,386x106 Kcal). In sugarcane, this energy is contained in about a third of the sugarcane juice, which will be transformed into sugar or alcohol, one-third into bagasse and one-third into sugarcane straw. If one considers the 2013/14 crop in the Central-South, which was 597 million tons of sugarcane, it would be equivalent to 716 million barrels
0
1.0
2.0
3.0
R$/
ton
of su
garc
ane
4.0
5.0
6.0
7.0
8.0
9.0
10.0
Sugarcaneethanol(Brazil)
Sweetsorghunethanol(Africa)
2.2x
4.5x
6.8x
Beetethanol
(Germany)
Wheatethanol
(Europe)
Cornethanol(USA)
Maniocethanol
8.9
4.0
2.0 2.01.3 1.0
24 25
CHAPTER 1 BIOENERGY FROM SUGARCANE
of petroleum per year or 1.96 million barrels of oil per day.Brazil currently produces an average of 80 tons of sugarcane per
hectare thus 7,000 liters of ethanol hectare. According to some studies in the sector, if the country reached the production of 200 tons of sugarcane per hectare, the country would then produce almost 20 thousand liters of ethanol per hectare, increasing its competitiveness and making productive areas available for other crops.
CONSUMPTION
Brazil and the United States are the world’s largest exporters of ethanol (USDA, 2016b). Of all ethanol exported by the United States in 2015, an average of 30% was destined to supply Canadian markets, 24% went to Asia (China, the Philippines, and South Korea), and finally Brazil, which received 15% of the total ethanol exported by the United States (RFA, 2016).
Canada became the largest importer on the list of major importers in 2014. However, in 2014, the main responsible for the global imports was the European Union (USDA, 2016b; OECD/FAO 2016).
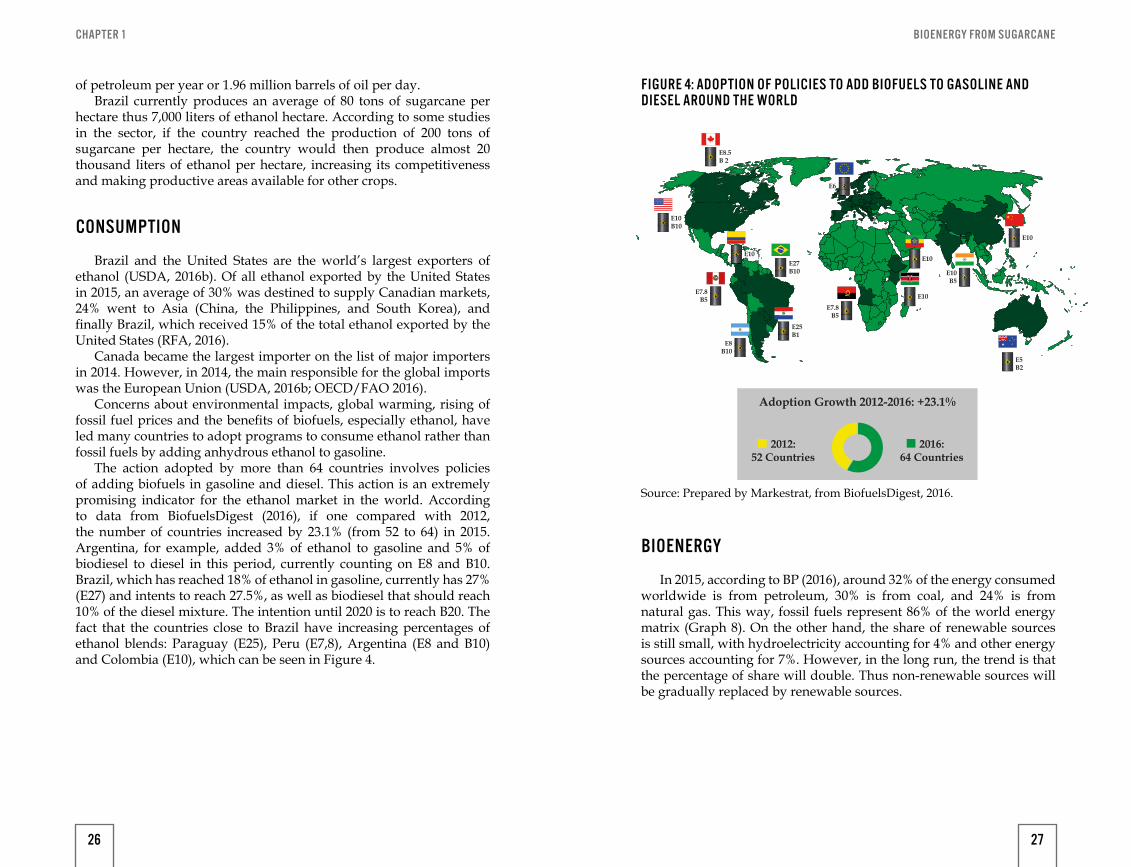
Concerns about environmental impacts, global warming, rising of fossil fuel prices and the benefits of biofuels, especially ethanol, have led many countries to adopt programs to consume ethanol rather than fossil fuels by adding anhydrous ethanol to gasoline.
The action adopted by more than 64 countries involves policies of adding biofuels in gasoline and diesel. This action is an extremely promising indicator for the ethanol market in the world. According to data from BiofuelsDigest (2016), if one compared with 2012, the number of countries increased by 23.1% (from 52 to 64) in 2015. Argentina, for example, added 3% of ethanol to gasoline and 5% of biodiesel to diesel in this period, currently counting on E8 and B10. Brazil, which has reached 18% of ethanol in gasoline, currently has 27% (E27) and intents to reach 27.5%, as well as biodiesel that should reach 10% of the diesel mixture. The intention until 2020 is to reach B20. The fact that the countries close to Brazil have increasing percentages of ethanol blends: Paraguay (E25), Peru (E7,8), Argentina (E8 and B10) and Colombia (E10), which can be seen in Figure 4.
Adoption of Policies to Add Biofuels to Gasoline and Diesel in the world
E8.5B 2
E10B10
E7.8B5
E7.8B5
E10B5
E10
E10
E8B10
E27B10
E10
E5B2
E25B1
E10
E6
2012:52 Countries
2016:64 Countries
Adoption Growth 2012-2016: +23.1%
FIGURE 4: ADOPTION OF POLICIES TO ADD BIOFUELS TO GASOLINE AND DIESEL AROUND THE WORLD
Source: Prepared by Markestrat, from BiofuelsDigest, 2016.
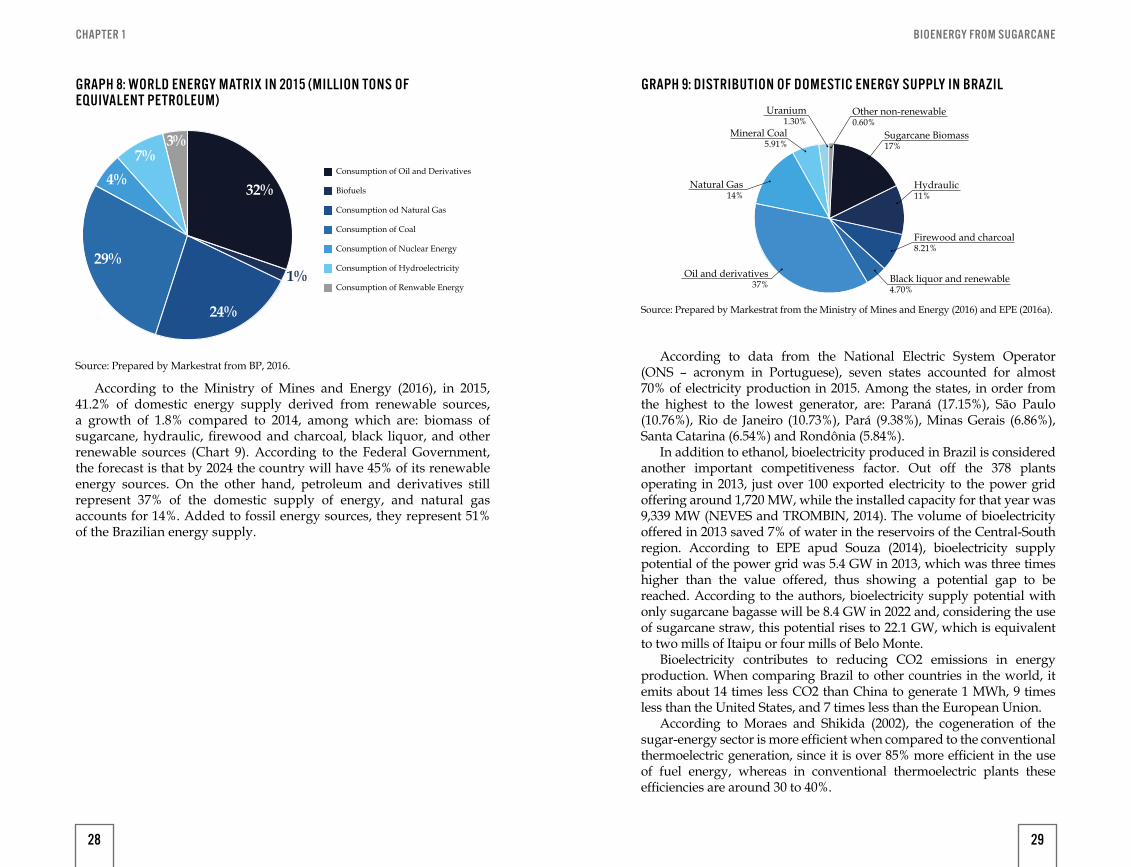
BIOENERGY
In 2015, according to BP (2016), around 32% of the energy consumed worldwide is from petroleum, 30% is from coal, and 24% is from natural gas. This way, fossil fuels represent 86% of the world energy matrix (Graph 8). On the other hand, the share of renewable sources is still small, with hydroelectricity accounting for 4% and other energy sources accounting for 7%. However, in the long run, the trend is that the percentage of share will double. Thus non-renewable sources will be gradually replaced by renewable sources.
26 27
CHAPTER 1 BIOENERGY FROM SUGARCANE
According to the Ministry of Mines and Energy (2016), in 2015, 41.2% of domestic energy supply derived from renewable sources, a growth of 1.8% compared to 2014, among which are: biomass of sugarcane, hydraulic, firewood and charcoal, black liquor, and other renewable sources (Chart 9). According to the Federal Government, the forecast is that by 2024 the country will have 45% of its renewable energy sources. On the other hand, petroleum and derivatives still represent 37% of the domestic supply of energy, and natural gas accounts for 14%. Added to fossil energy sources, they represent 51% of the Brazilian energy supply.
Consumption of Oil and Derivatives
Biofuels
Consumption od Natural Gas
Consumption of Coal
Consumption of Nuclear Energy
Consumption of Hydroelectricity
Consumption of Renwable Energy
32%
24%
29%1%
4%7%
3%
GRAPH 8: WORLD ENERGY MATRIX IN 2015 (MILLION TONS OF EQUIVALENT PETROLEUM)
Source: Prepared by Markestrat from BP, 2016.According to data from the National Electric System Operator
(ONS – acronym in Portuguese), seven states accounted for almost 70% of electricity production in 2015. Among the states, in order from the highest to the lowest generator, are: Paraná (17.15%), São Paulo (10.76%), Rio de Janeiro (10.73%), Pará (9.38%), Minas Gerais (6.86%), Santa Catarina (6.54%) and Rondônia (5.84%).
In addition to ethanol, bioelectricity produced in Brazil is considered another important competitiveness factor. Out off the 378 plants operating in 2013, just over 100 exported electricity to the power grid offering around 1,720 MW, while the installed capacity for that year was 9,339 MW (NEVES and TROMBIN, 2014). The volume of bioelectricity offered in 2013 saved 7% of water in the reservoirs of the Central-South region. According to EPE apud Souza (2014), bioelectricity supply potential of the power grid was 5.4 GW in 2013, which was three times higher than the value offered, thus showing a potential gap to be reached. According to the authors, bioelectricity supply potential with only sugarcane bagasse will be 8.4 GW in 2022 and, considering the use of sugarcane straw, this potential rises to 22.1 GW, which is equivalent to two mills of Itaipu or four mills of Belo Monte.
Bioelectricity contributes to reducing CO2 emissions in energy production. When comparing Brazil to other countries in the world, it emits about 14 times less CO2 than China to generate 1 MWh, 9 times less than the United States, and 7 times less than the European Union.
According to Moraes and Shikida (2002), the cogeneration of the sugar-energy sector is more efficient when compared to the conventional thermoelectric generation, since it is over 85% more efficient in the use of fuel energy, whereas in conventional thermoelectric plants these efficiencies are around 30 to 40%.
GRAPH 9: DISTRIBUTION OF DOMESTIC ENERGY SUPPLY IN BRAZIL
Source: Prepared by Markestrat from the Ministry of Mines and Energy (2016) and EPE (2016a).
Oil and derivatives37%
Natural Gas14%
Mineral Coal5.91%
Uranium1.30%
Other non-renewable0.60%
Sugarcane Biomass17%
Hydraulic11%
Firewood and charcoal8.21%
Black liquor and renewable4.70%
28 29
BIOENERGY FROM SUGARCANE
BY MARCOS FAVA NEVES, VINICIUS GUSTAVO TROMBIN AND MARCO ANTONIO CONEJERO
A METHOD FOR STRATEGIC PLANNING OF FOOD AND BIOENERGY CHAINS (CHAINPLAN) APPLIED TO THE SUGARCANE CHAIN
2
Originally published in Journal on Chain and Network Science 2010; 10(3): 193-206
BIOENERGY FROM SUGARCANE
INTRODUCTION AND RESEARCH PROBLEM
The sugarcane sector is one of the oldest chains of the Brazilian economy. Since the introduction of the first plants (seeds) in 1532, sugar has been one of the most important Brazilian products. Although sugar is still important, the sector has undergone a deep transformation in the last 50 years. Besides sugar, sugarcane mills and ethanol plants now also focus on ethanol production, and most recently attention has been draw to bioelectricity, bioplastics, alcohol chemistry, diesel and carbon credits marketing. All of that is in addition to the possibility of using advanced technologies that increase productivity and reduce costs. This is a new level of business, in which competitiveness is keen.
Progress in the sugarcane chain is not only related to technology. There is a growing commitment to social and environmental issues, like improving the workers’ quality of life, promoting rational use of land and water, mitigating the effects of mechanized harvesting, and preserving ecosystems. Although advances in these areas have also been substantial, there is still much work ahead for this industry. Externally, Brazil must convince critics that the increase in Brazilian sugarcane production does not negatively impact forest and food production areas, and it must also demonstrate the regularity of ethanol supply and the sustainability of production (social, environmental, and economic).
Internally, Brazil must show that using ethanol in vehicles has a number of benefits in addition to financial savings. This would justify further support from the federal government; for example, the level of ethanol in gasoline could be increased from the current 25% to 30%, and the Brazilian Development Bank (BNDES) could provide long-term financing to improve the competitiveness of the sector and increase investments in co-generation of electricity.
To create a global market for sugar and bio-ethanol, the players need to be more demand-driven and they need to develop a strategic plan for the sugarcane chain that will make it more transnational and sustainable. The construction and elaboration of a process for strategic planning and management of food and bioenergy chains could make this task easier.
For this purpose, Neves (2007) developed the CHAINPLAN method for strategic planning and management of food and bioenergy chains, which has been applied to agribusiness systems in Brazil, Uruguay, South Africa and Argentina, among other countries. It consists of five stages: a review of initiatives introduced by the chains’ leaders, mapping and quantification of the chain, formation of a vertical organization for contractual coordination, development of a plan of strategic projects, and implementation of the plan. A recent new application of this method is shown below.
33
BIOENERGY FROM SUGARCANECHAPTER 2
OBJECTIVES AND METHODOLOGICAL PROCEDURES
This paper aims to contribute to academic (and corporate) efforts to design a planning process for food and bioenergy chains, considering various future possibilities in the formulation of objectives, guidelines and strategies to ensure the sustainable growth of the chains.
■ The paper’s specific objectives are to: ■ Present a method for strategic planning and management of food
and bioenergy chains (CHAINPLAN); ■ Present the results of applying step 2 of this method, i.e. mapping
and quantifying the sugarcane chain in Brazil, showing the financial transactions generated in every link of the productive chain, the jobs generated, the taxes paid, and the GDP;
■ Present the results of a macro-environment analysis (STEP analysis) and an internal-environment analysis conducted in order to propose a strategic plan for the sugarcane chain in Brazil.
The methodological procedures involved (1) a review of the CHAINPLAN method (Neves, 2007), (2) a literature review related to the sugarcane agribusiness system, and (3) in-depth interviews with experts from the industry, government, and trade associations.
Following the first step of the CHAINPLAN method, we have reviewed the contributions of many Brazilian agribusiness organizations for the sugarcane chain planning in Brazil and they were helpful to the elaboration of session 4.2. For concision purposes, the reproduction of many different strategic agendas was not done.
At the same time, it was not necessary to carry out the third step of the CHAINPLAN method, which is to create a vertical organization for coordination of collective actions. This role is part of broader efforts by the Brazilian Sugarcane Industry Association (UNICA), the largest association in Brazil representing sugar, ethanol, and bioelectricity producers, to increase public knowledge about the sugar and ethanol industry in Brazil. In particular, the association wants to effectively convey to the public the benefits of producing and using clean energy from renewable and sustainable agricultural systems.
Finally, the fifth step was considered dispensable because the implementation of the suggested strategic plan for the Brazilian sugarcane chain has not been done in a centralized way. Some strategic projects have been put in practice by different Brazilian agribusiness organizations, while others have not begun yet.
THEORETICAL BACKGROUND
This article does not use a network approach, since the unit of analysis is not a network, but rather a food chain. A food chain
is considered here to be limited by the boundaries of a particular country. Its actors are input suppliers, farmers, industry, distributors, and service providers. Examples of such country chains are the Dutch flower chain and the Danish pork chain.
Two traditional approaches to studying chains can be found in the literature. The commodity system approach (CSA) was developed by Goldberg (1968) in the USA in studies of citrus, wheat, and soybean production systems. The CSA methodology emphasizes the sequence of product transformations in the system. Goldberg’s research had its merit in changing the focus of analysis from the farm to the whole system, which prevented researchers from considering the agricultural sector in isolation from the overall economy.
The second approach, proposed by Morvan (1985), considers a chain (“filière”) as linked operations for the transformation of a good. The chains are influenced by technology and have complementary interdependences, according to Batalha (2001). According to Morvan (1985), the filière analysis is an important instrument to describe systems, to define technology role in the framing of productive systems, to organize integration studies, and to analyze industrial polices, firms, and collective strategies.
Although not used here, there are important additional contributive theories. The supply chain is viewed as a system that integrates raw material suppliers, factories, distribution services, and consumers (Stevens apud Omta et al., 2001). Furthermore, there is the network concept in which organizations are directly involved in different processes that add value to the elaboration of goods and services up to the final consumer (Christopher apud Omta et al., 2001). Lazzarini et al. (2001) integrate chain and network concepts in a study on net chains. According to these authors, the integration of these approaches allows the consideration of existing organizational interdependences in a network, as well as the different mechanisms of coordination (managerial plans, process standardization, and adjustments), and sources of value (production and operations optimization, transaction cost reduction, diversity, and "co-specialization" of knowledge).
Hardman et al. (2002) demonstrated the possibility of increasing the competitiveness of South African apple chain exportations through cooperation among producers, packers, and exporters. From the ideas of CSA and the filière, it is possible to develop tools and managerial activities to improve the chains’ efficiency. Thus, the concepts of Supply Chain Management (SCM) and the set of networks and net chain ideas are important theoretical concepts and empirical notions for the development of food and bioenergy chains (Batalha and Silva, 2001).
Based on a chain literature review and empirical research, Neves (2007) proposed, as a methodological contribution, a five-step process for implementation of strategic planning and management in food
34 35
BIOENERGY FROM SUGARCANECHAPTER 2
and bioenergy production chains (the CHAINPLAN method). This method can be used by an industry association, an institute, or even government, to produce a strategic plan for a particular country chain. The Dutch Tomato Association, for example, could use it to produce a strategic plan for the whole chain. The method is summarized in Fig. 1. credits, among others. In 2013, the total wage bill of the sector was US$ 4.13 billion, raising about US$ 8.5 billion in taxes and bringing annually an export of almost US$ 10 billion (Neves and Trombin, 2014).
The focus of this paper is on two specific steps: the mapping and quantification of the chain; and the elaboration of the strategic plan.
The mapping and quantification process, step 2 of the CHAINPLAN method, was developed by Neves and applied by Rossi and Neves (2004), Neves and Lopes (2005), and Consoli and Neves (2006) under research on the Brazilian wheat, orange, and milk chains, respectively. It was also applied by researchers of the University of Buenos Aires in the soybean chain. This process can be summarized in six stages (see Fig. 2).
Initiatives of Leaders, Government, and Research Institutes/ Universities in planning the future of the Chain.
Description, Mapping and Quantification of the Chain.
Creation of a Vertical Chain Organization.
Elaboration of the Strategic Plan for the Chain.
Management of Strategic Projects and Contracts’ Design.
STEP 1 STEP 2 STEP 3 STEP 4 STEP 5
FIGURE 1: THE CHAINPLAN METHOD FOR STRATEGIC PLANNING AND MANAGEMENT OF FOOD AND BIOENERGY CHAIN
FIGURE 2: PROCESS FOR MAPPING AND QUANTIFICATION OF THE CHAIN
Source: Neves (2007)
Source: Neves et al. (2004)
Descriptionof the chain
(design)
Initial interviews for adjustments
and validation of
the chain design
Secondary data research
Primary data research:
interviews with representatives
of the organizations
involved Qua
lific
atio
n
Wor
ksho
p
Source: Neves et al. (2004)
TABLE 1: GUIDELINES FOR MAPPING AND QUANTIFICATION OF THE CHAIN
STAGES WHAT HAS TO BE DONE
1. Agribusiness Chain Description (in focus)
The first stage consists of making a preliminary description of the chain participants, repre-sented in small boxes, based on theory and the researchers’ experience. It is also necessary to scope which segments will be studied, keeping the focus on the central axle of the chain.
2. Presentation for private-sector professionals and other experts to make adjustments to the structure
The second stage involves submitting the anal-ysis to chain and industry specialists and in-terviewing them with the purpose of making possible adjustments in order to arrive at a de-scription that reflects the current reality of the chain. It is very common to forget participants and agents, and this second stage helps to map all possibilities.
3. Research in associations, institutions, and publications for secondary data
The third stage consists of searching for second-ary data from sources that have academic and statistical credibility, a good reputation, and demonstrated integrity.
4. Interview with professionals for primary data
After collection of the available secondary data, which in some countries and environments may be very limited, primary data are collected. In this empirical research stage, in-depth inter-views are conducted with representatives of several organizations in the chain to obtain in-formation about the sales of a particular segment of the chain, employment statistics, and amount of taxes paid.
5. Quantification and strategic proposals
Quantification involves determining the turnover of each sector in the chain, through the compa-nies’ revenues, and estimating several sub-sectors of the chain. To guarantee reliability of the data , some secondary and primary data are compared to find any incongruities In this process, at least two different data sources are used to check the results, and additional interviews are conducted with similar agents as needed.
6. Workshop to verify data
Finally, the data are validated in a workshop. Information is sent to participants prior to the event, and then the numbers are discussed at the workshop. Alternatively, materials are sent to relevant agents of all links in the chain for ver-ification. The research is then presented to the press and other institutional organizations.
36 37
BIOENERGY FROM SUGARCANECHAPTER 2
This process was applied in the sugarcane chain in Brazil by 10 researchers, who collected secondary and mostly primary data over a 5–month period. This information was consolidated in a one-page description of the food chain, showing all of the participants and the revenues of the different links of the productive chain in a year of analysis. This method can be used not only to produce this type of financial overview, but also a quantification of jobs and taxes generated by the chain on a yearly basis. It is important to note that the values presented here were converted to US dollars using the 2008 average exchange rate of R$ 1.84 per US$.
Elaboration of the chain´s strategic plan, step 4 of the CHAINPLAN method, was applied in the sugarcane chain in Brazil with a view to the following 5 to 10 years of development. This process can be summarized in twelve stages (see Fig. 3).
Table 2 shows the guidelines and procedures for carrying out the various stages of the strategic plan elaboration process.
Descriptionof the chain
(design)
Intr
oduc
tion
and
unde
rsta
ndin
g
1 2
Descriptionof the chain
(design) Obj
ectiv
es fo
r the
cha
in
4
Stra
tegy
for t
he c
hain
5
Cha
inpl
ain
Budg
et
11
Con
trol
and
Exe
cutio
n3
Production, products, R&D and Innovations
decisions
6
Communicationsdecisions
7
Distribution and Logistic decisions
(including exports)
8
Human Resourcesand Qualification
decisions
9
Institucional Environment and
Coordination decisions
10
FIGURE 3: PROCESS FOR ELABORATION OF THE CHAIN'S STRATEGIC PLAN
Source: Neves (2007)
TABLE 2: GUIDELINES FOR ELABORATION OF THE STRATEGIC PLAN OF THE CHAIN
STAGES WHAT HAS TO BE DONE
PHASE 1 – INTRODUCTORY STEPS
1. Introduction and understanding
■ Verify whether the chain has plans in place and study them.
■ Verify which teams will take part in the process. ■ Study plans made for production chains in other countries, for benchmarking.
2. International market and consumer analysis with chain approach
■ Address threats and identify opportunities cre-ated by the so-called uncontrollable variables (possible changes in the legal/political, eco-nomic and natural, socio-cultural, and techno-logical environments) in the domestic as well as the international market.
■ Understand existing barriers (tariff and non-tar-iff) on the international market and identify col-lective actions to reduce them
■ Analyze the final and intermediate (dealers’) consumer behavior and purchase decision processes.
■ Describe the main national and international competitors.
3. Internal situation analysis and global benchmarks
■ Identify all the strong and weak points of the chain.
■ Describe the existing governance structures and the transactions' characteristics.
■ Analyze the value creation, resources, and abilities of the chain.
■ Analyze the critical success factors of the chain. ■ Select, among the chains (which may or may not be competitors), the benchmarks (sources of good ideas).
4. Objectives for the chain
■ Define and quantify the major chain objectives in terms of production, exports, sales to achieve sustainable growth and to develop solutions for the weak points.
5. Strategies to reach proposed objectives
■ List the major strategies (actions) that will be used to reach the considered objectives in item 4 in terms of positioning and value capture.
PHASE 2 – PLANS FOR PRODUCTION, COMMUNICATION, DISTRIBUTION, HUMAN RESOURCES, AND COORDINATION
6. Production, products, R&D, and innovation projects
■ Analyze productive potentials and production capacities.
■ Analyze products and product lines, as well as complementary product lines for expansion decisions.
38 39
BIOENERGY FROM SUGARCANECHAPTER 2
6. Production, products, R&D, and innovation projects
■ Develop innovation opportunities in the chain, and in the launch of new products.
■ Foster partnerships with universities and re-search centers.
■ Make decisions related to the joint construction of brands, and labels for the system use.
■ Analyze and implement the certification pro-cess for the chain´s sustainability.
7. Communication projects
■ Identify the target public for communication (messages from the production chain).
■ Develop goals for this communication (product knowledge, product reminders, persuasion, etc.) and try to define the unique positioning and message that will be generated by the chain.
■ Define the communication tools to be used; i.e. advertising or public relations strategies to boost sales, among other things.
■ Review communication actions and results.
8. Logistics and distribution projects
■ Analyze the product distribution channels and search for new ones.
■ Analyze the possibilities of value capture in the distribution channels.
■ Define new ways to penetrate the markets (through franchising, joint ventures, and other contractual forms, or through vertical integration).
9. Human resources and training projects
■ Conduct management training for chain par-ticipants.
■ Conduct technical training in food and bioen-ergy production.
■ Transmit information from technological and research centers.
10. Coordination and institutional environment projects
■ Develop projects to finance the chain. ■ Develop basic infrastructure-improvement projects.
■ Develop projects to increase consumption in government programs.
■ Push for tax incentives in the production chain. ■ Strengthen export activity through export pro-motion agencies.
■ Promote a product standardization project. ■ Develop proposals for chain conflict solutions. ■ Ensure coordination in the development of contracts and proposals.
11. Strategic projects consolidation
■ Consolidate all projects generated in steps 6 to 10 and establish priorities.
12. CHAINPLAN budget ■ Calculate the budget of every project accord-ing to the total budget available.
Source: Neves (2007)
The application of this process in the Brazilian sugarcane chain demanded a review of literature related to the chain, in-depth interviews with experts from the industry, government, and trade associations, as well as workshops for the chain agents on collective actions that could be taken.
Both processes described above are part of the CHAINPLAN method, but they can be carried out separately if so desired by research leaders and sponsors.
RESULTS
BRAZILIAN SUGARCANE CHAIN MAPPED AND QUANTIFIED
Brazil is the world’s largest sugarcane producer, accounting for over 30% of total production (FAO, 2009). Sugarcane is also one of the leading crops in terms of income generation in the Brazilian agribusiness industry. The sugarcane chain’s GDP was US$ 28.1 billion in 2008, representing 2% of the national GDP; an amount that is almost equivalent to the overall economic output produced in a country like Uruguay (US$ 32 billion). The chain GDP calculation was estimated by adding the sales of all final goods and services offered in the economy. Subtracting sales taxes, the amount is US$ 24.3 billion.
a. Sales by gas stations, considering the formal and informal markets.b. Sales by ethanol plants to ethanol wholesale distributors, considering the formal and informal markets.c. Sales by ethanol plants to the beverage and cosmetics industries.d. Sales by sugar mills to the food industry added to sales by retailers to final consumers.e. Sales by the sugarcane mills and ethanol plants at energy auctions.
TABLE 3: ESTIMATES OF THE SECTOR’S GROSS DOMESTIC PRODUCT BASED ON THE END PRODUCTS
PRODUCTDOMESTIC MARKET CONSUMPTION BALANCE
WITH TAX EXCLUDING TAX TAX EXEMPT WITH TAX EXCLUDING
TAX
Ethanol
Hydrated 11,114.50a 9,105.10 23,78 11,138.28 9128.88
Anhydrous 2,972.89b 2,250.88 2,366.33 5,339.22 4617.21
Non- energetic uses
438.78c 351.57 n.d. 438.78 351.57
Sugar 5,297.14d 4,455.83 5,482.96 10,780.10 9938.79
Bioelectricity 389.63e 242.87 n.d. 389.63 242.87
Yeast 21.41 19.43 42.20 63.61 61.63
Carbon Credits n.d n.d 3.48 3.48 3.48
Total 20,234.35 16,425.68 7,918.75 28,153.10 24,344.43
Source: Neves et al. (2010).
40 41
BIOENERGY FROM SUGARCANECHAPTER 2
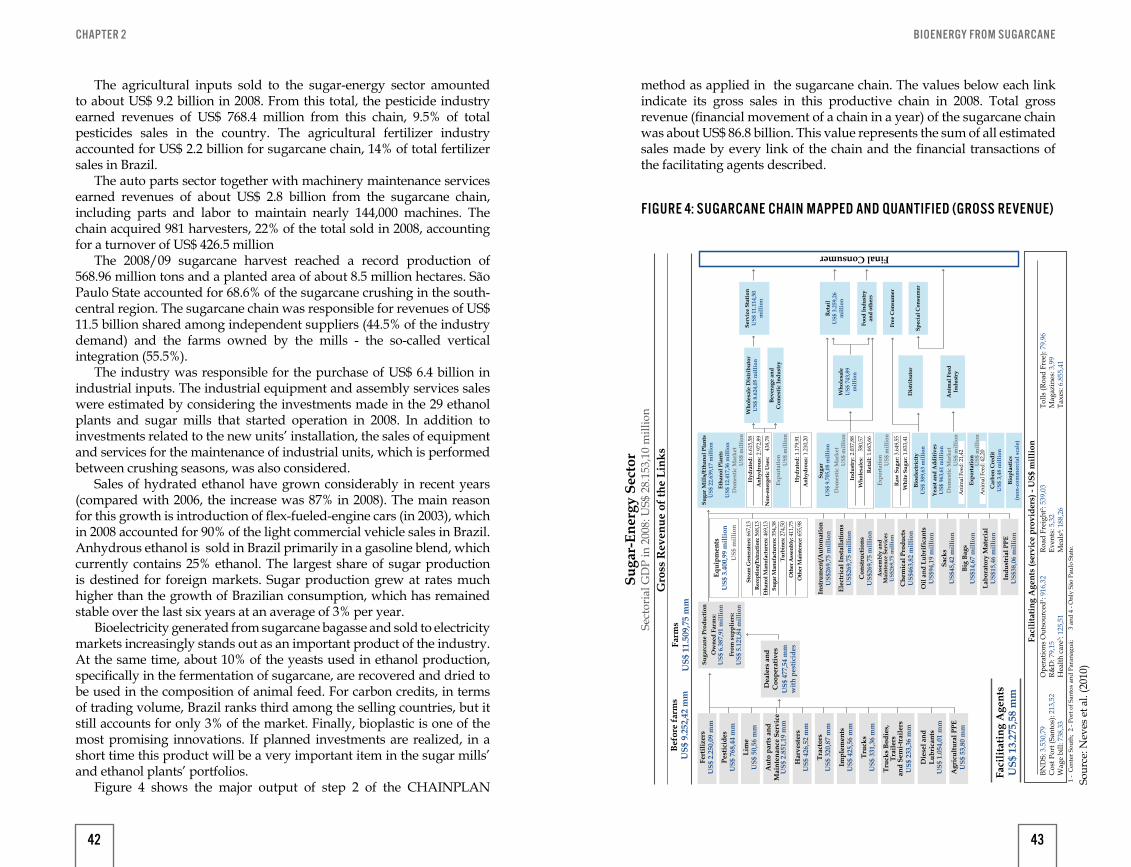
The agricultural inputs sold to the sugar-energy sector amounted to about US$ 9.2 billion in 2008. From this total, the pesticide industry earned revenues of US$ 768.4 million from this chain, 9.5% of total pesticides sales in the country. The agricultural fertilizer industry accounted for US$ 2.2 billion for sugarcane chain, 14% of total fertilizer sales in Brazil.
The auto parts sector together with machinery maintenance services earned revenues of about US$ 2.8 billion from the sugarcane chain, including parts and labor to maintain nearly 144,000 machines. The chain acquired 981 harvesters, 22% of the total sold in 2008, accounting for a turnover of US$ 426.5 million
The 2008/09 sugarcane harvest reached a record production of 568.96 million tons and a planted area of about 8.5 million hectares. São Paulo State accounted for 68.6% of the sugarcane crushing in the south-central region. The sugarcane chain was responsible for revenues of US$ 11.5 billion shared among independent suppliers (44.5% of the industry demand) and the farms owned by the mills - the so-called vertical integration (55.5%).
The industry was responsible for the purchase of US$ 6.4 billion in industrial inputs. The industrial equipment and assembly services sales were estimated by considering the investments made in the 29 ethanol plants and sugar mills that started operation in 2008. In addition to investments related to the new units’ installation, the sales of equipment and services for the maintenance of industrial units, which is performed between crushing seasons, was also considered.
Sales of hydrated ethanol have grown considerably in recent years (compared with 2006, the increase was 87% in 2008). The main reason for this growth is introduction of flex-fueled-engine cars (in 2003), which in 2008 accounted for 90% of the light commercial vehicle sales in Brazil. Anhydrous ethanol is sold in Brazil primarily in a gasoline blend, which currently contains 25% ethanol. The largest share of sugar production is destined for foreign markets. Sugar production grew at rates much higher than the growth of Brazilian consumption, which has remained stable over the last six years at an average of 3% per year.
Bioelectricity generated from sugarcane bagasse and sold to electricity markets increasingly stands out as an important product of the industry. At the same time, about 10% of the yeasts used in ethanol production, specifically in the fermentation of sugarcane, are recovered and dried to be used in the composition of animal feed. For carbon credits, in terms of trading volume, Brazil ranks third among the selling countries, but it still accounts for only 3% of the market. Finally, bioplastic is one of the most promising innovations. If planned investments are realized, in a short time this product will be a very important item in the sugar mills’ and ethanol plants’ portfolios.
Figure 4 shows the major output of step 2 of the CHAINPLAN
method as applied in the sugarcane chain. The values below each link indicate its gross sales in this productive chain in 2008. Total gross revenue (financial movement of a chain in a year) of the sugarcane chain was about US$ 86.8 billion. This value represents the sum of all estimated sales made by every link of the chain and the financial transactions of the facilitating agents described.
Dea
lers
and
Coo
pera
tives
US$
477
,54
mm
with
pes
ticid
es
Suga
rcan
e Pr
oduc
tion
Ow
ned
Farm
s:U
S$ 6
.387
,91
mill
ion
From
sup
plie
rs:
US$
5.1
21,8
4 m
illio
nU
S$ m
illio
nU
S$ m
illio
nD
omes
tic M
arke
t
US$
mill
ion
Dom
estic
Mar
ket
US$
mill
ion
Dom
estic
Mar
ket
US$
mill
ion
Expo
rtat
ion
US$
mill
ion
Expo
rtat
ion
Ani
mal
Fee
d: 2
1,42
US$
mill
ion
Ani
mal
Fee
d: 4
2,20
Final Consumer
Faci
litat
ing
Age
nts
US$
13.
275,
58 m
m
Befo
re fa
rms
US$
9.2
52,4
2 m
m
Fert
ilize
rsU
S$ 2
.250
,09
mm
Pest
icid
esU
S$ 7
68,4
4 m
m
Lim
eU
S$ 5
0,56
mm
Har
vest
ers
US$
426
,52
mm
Trac
tors
US$
320
,87
mm
Impl
emen
tsU
S$ 4
25,5
6 m
m
Truc
ksU
S$ 3
31,3
6 m
m
Truc
ks B
odie
s,Tr
aile
rsan
d Se
mi-t
raile
rsU
S$ 2
33,3
6 m
m
Die
sel a
ndLu
bric
ants
US$
1.0
54,0
1 m
m
Agr
icul
tura
l PPE
US$
53,
80 m
m
Aut
o pa
rts
and
Mai
nten
ance
Ser
vice
US$
2.8
51,1
9 m
m
Farm
sU
S$ 1
1.50
9,75
mm
Faci
litat
ing
Age
nts
(ser
vice
pro
vide
rs) -
US$
mill
ion
1 -
Cen
ter S
outh
; 2
- Por
t of S
anto
s an
d Pa
rana
guá;
3
and
4 - O
nly
São
Paul
o St
ate.
BND
S: 3
.530
,79
Cos
t Por
t (Sa
ntos
): 21
3,52
Wag
e bi
ll: 7
38,3
3
Ope
ratio
ns O
utso
urce
d1 : 91
6,32
R&D
: 79,
15H
ealth
car
e3 : 12
5,51
Road
Fre
ight
2 : 53
9,03
Even
ts: 5
,32
Mea
ls4 :
188,
26
Tolls
(Roa
d Fr
ee):
79,9
6M
agaz
ines
: 3,9
9Ta
xes:
6.8
55,4
1
Gro
ss R
even
ue o
f the
Lin
ks
Suga
r-En
ergy
Sec
tor
Sect
oria
l GD
P in
200
8: U
S$ 2
8.15
3,10
mill
ion
Equi
pmen
tsU
S$ 3
.400
,99
mill
ion
Suga
r Mill
s/Et
hano
l Pla
nts
US$
22.
639,
17 m
illio
n
Who
lesa
leU
S$ 7
43,8
9m
illio
n
Ret
ail
US$
3.2
59,2
6m
illio
n
Serv
ice
Stat
ion
US$
11.
114,
50m
illio
n
Etha
nol P
lant
sU
S$ 1
2.41
7,36
mill
ion
Suga
r U
S$ 9
.705
,08
mill
ion
Yeas
t and
Add
itive
sU
S$ 9
63,6
1 m
illio
n
Expo
rtat
ion
Stea
m G
ener
ator
s: R
ecep
tion/
Extra
ctio
n:
Etha
nol M
anuf
actu
rers
: Su
gar M
anuf
actu
rers
: Tu
rbin
es:
Oth
er A
ssen
bly:
O
ther
Mai
nten
ce: 66
7,13
568,
1346
9,13
354,
3827
4,50
411,
7565
5,98
Hyd
rate
d:
Anh
ydro
us:
Non
-ene
rget
ic U
ses:
6.61
5,58
2.97
2,89
438,
78
Indu
stry
: W
hole
sale
s: R
etai
l:
2.03
7,88
580,
571.
663,
66
Hyd
rate
d:
Anh
ydro
us: 1.
179,
911.
210,
20
Raw
Sug
ar:
Whi
te S
ugar
: 3.64
9,55
1.83
3,41
Inst
rum
ent/A
utom
atio
nU
S$26
9,75
mill
ion
Elec
tric
al In
stal
latio
nsU
S$26
9,75
mill
ion
Con
stru
ctio
nsU
S$26
9,75
mill
ion
Ass
embl
y an
dM
aint
ence
Ser
vice
sU
S$26
9,75
mill
ion
Che
mic
al P
rodu
cts
US$
463,
82 m
illio
n
Oil
and
Lubr
ific
ants
US$
94,1
9 m
illio
n
Sack
sU
S$45
,42
mill
ion
Big
Bags
US$
14,6
7 m
illio
n
Labo
rato
ry M
ater
ial
US$
15,4
6 m
illio
n
Indu
stri
al P
PEU
S$38
,06
mill
ion
Bioe
lect
rici
tyU
S$ 3
89,6
3 m
illio
n
Who
lesa
le D
istr
ibut
orU
S$ 8
.624
,05
mill
ion
Beve
rage
and
Com
estic
Indu
stry
Car
bon
Cre
dit
US$
3,4
8 m
illio
n
Biop
last
ics
(non
-com
mer
cial
sca
le)
Ani
mal
Fee
dIn
dust
ry
Dis
trib
utor
Food
Indu
stry
and
othe
rs
Free
Con
sum
er
Spec
ial C
onsu
mer
FIGURE 4: SUGARCANE CHAIN MAPPED AND QUANTIFIED (GROSS REVENUE)
Sour
ce: N
eves
et a
l. (2
010)
42 43
BIOENERGY FROM SUGARCANECHAPTER 2
According to the Brazilian Ministry of Labor, the sugarcane industry in 2008 accounted for 1.28 million formal jobs, with 481,662 allocated in the field of sugarcane cultivation; 561,292 in sugar mills for raw sugar production; 13,791 in sugar refining and milling; and 226,513 in ethanol production. This represents 2.15% of all Brazilian jobs, highlighting the importance of the sugar-energy sector. If informal employment is also taken into account, the number of jobs in the sector increases to 1.43 million. Considering also that every direct job generates two indirect jobs, a figure of 4.29 million people placed in jobs related to sugarcane is reached. The aggregate tax generated in the sugar-energy sector was estimated at US$ 6.8 billion.
A STRATEGIC PLAN FOR THE SUGARCANE CHAIN IN BRAZIL
When preparing this plan, it was helpful to consult agendas already established by many important Brazilian agribusiness organizations, such as UNICA (Sugarcane Industry Association), UDOP (Union of Bioenergy Producers), ORPLANA (Sugarcane Growers Association), CANAOESTE (Sugarcane Growers Association of Sao Paulo State), ABAG Ribeirao Preto (Brazilian Agribusiness Association in Ribeirao Preto City), CTC (Sugarcane Technological Center), IEA (Agricultural Economics Institute), and IAC (Campinas Agronomic Institute).
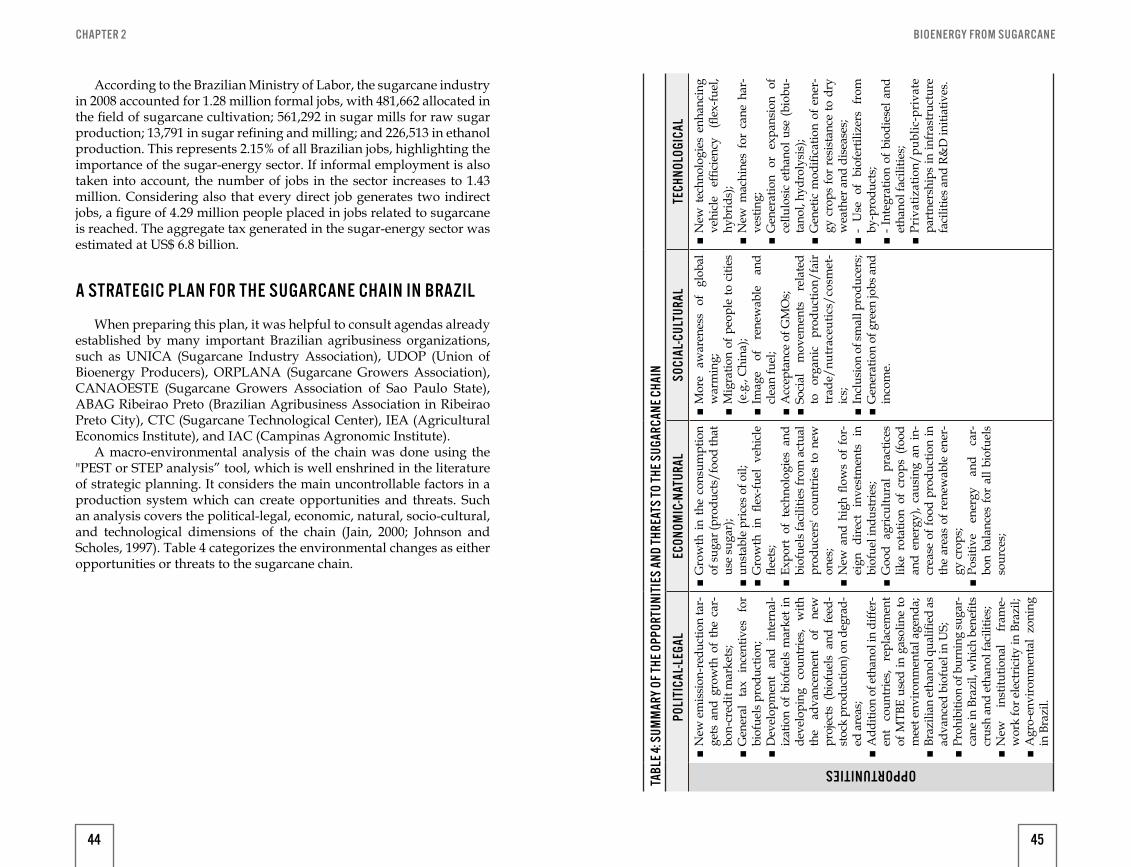
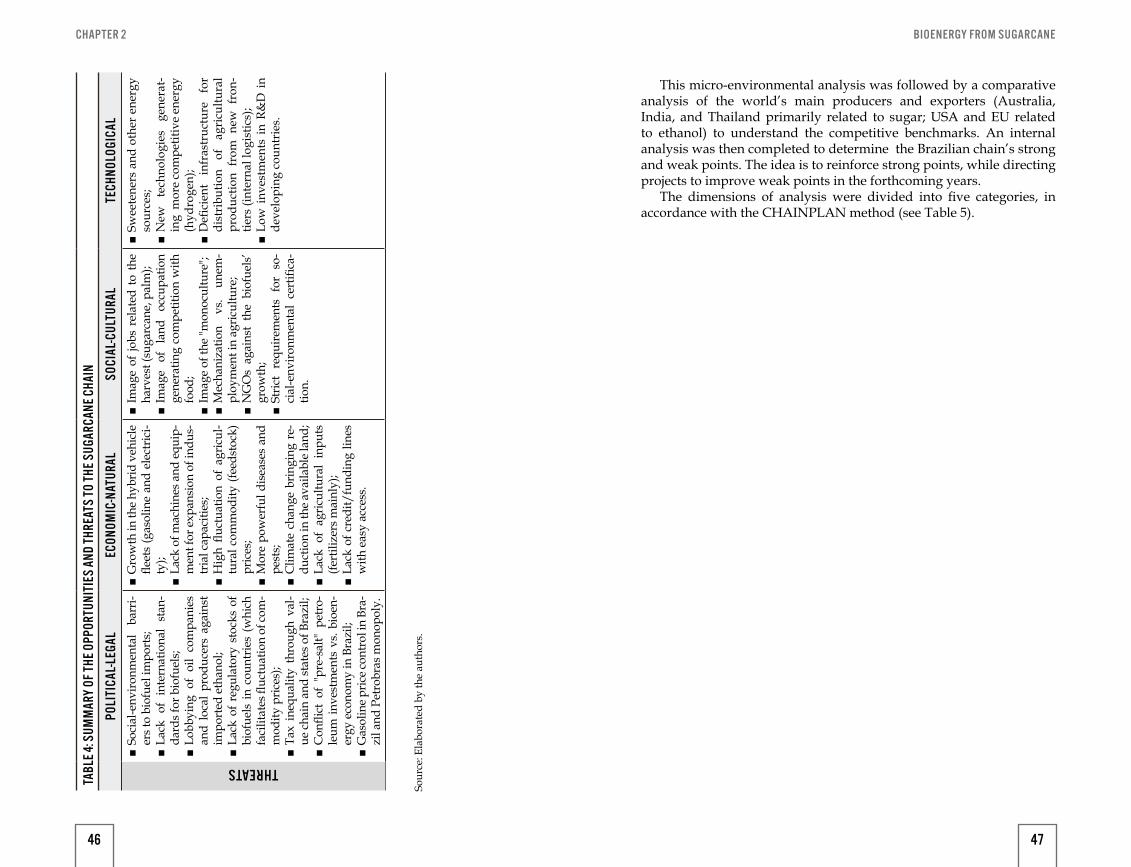
A macro-environmental analysis of the chain was done using the "PEST or STEP analysis” tool, which is well enshrined in the literature of strategic planning. It considers the main uncontrollable factors in a production system which can create opportunities and threats. Such an analysis covers the political-legal, economic, natural, socio-cultural, and technological dimensions of the chain (Jain, 2000; Johnson and Scholes, 1997). Table 4 categorizes the environmental changes as either opportunities or threats to the sugarcane chain.
TABL
E 4: S
UMM
ARY
OF T
HE O
PPOR
TUNI
TIES
AND
THR
EATS
TO T
HE S
UGAR
CANE
CHA
IN
POLI
TICA
L-LE
GAL
ECON
OMIC
-NAT
URAL
SOCI
AL-C
ULTU
RAL
TECH
NOLO
GICA
L
OPPORTUNITIES
■N
ew e
mis
sion
-red
uctio
n ta
r-ge
ts a
nd g
row
th o
f th
e ca
r-bo
n-cr
edit
mar
kets
; ■G
ener
al
tax
ince
ntiv
es
for
biof
uels
pro
duct
ion;
■D
evel
opm
ent
and
inte
rnal
-iz
atio
n of
bio
fuel
s m
arke
t in
deve
lopi
ng
coun
trie
s, w
ith
the
adva
ncem
ent
of
new
pr
ojec
ts (
biof
uels
and
fee
d-st
ock
prod
uctio
n) o
n de
grad
-ed
are
as;
■A
dditi
on o
f eth
anol
in d
iffer
-en
t co
untr
ies,
repl
acem
ent
of M
TBE
used
in g
asol
ine
to
mee
t env
ironm
enta
l age
nda;
■Br
azili
an et
hano
l qua
lified
as
adva
nced
bio
fuel
in U
S; ■Pr
ohib
ition
of b
urni
ng su
gar-
cane
in B
razi
l, w
hich
ben
efits
cr
ush
and
etha
nol f
acili
ties;
■N
ew
inst
itutio
nal
fram
e-w
ork
for e
lect
ricity
in B
razi
l; ■A
gro-
envi
ronm
enta
l zo
ning
in
Bra
zil.
■G
row
th in
the
con
sum
ptio
n of
suga
r (pr
oduc
ts/f
ood
that
us
e su
gar)
; ■un
stab
le p
rices
of o
il; ■G
row
th i
n fle
x-fu
el v
ehic
le
fleet
s; ■Ex
port
of
tech
nolo
gies
and
bi
ofue
ls fa
cilit
ies f
rom
act
ual
prod
ucer
s' co
untr
ies
to n
ew
ones
; ■N
ew a
nd h
igh
flow
s of
for
-ei
gn d
irect
inv
estm
ents
in
biof
uel i
ndus
trie
s; ■G
ood
agric
ultu
ral
prac
tices
lik
e ro
tatio
n of
cro
ps (
food
an
d en
ergy
), ca
usin
g an
in-
crea
se o
f foo
d pr
oduc
tion
in
the
area
s of
ren
ewab
le e
ner-
gy c
rops
; ■Po
sitiv
e en
ergy
an
d ca
r-bo
n ba
lanc
es fo
r al
l bio
fuel
s so
urce
s;
■M
ore
awar
enes
s of
gl
obal
w
arm
ing;
■M
igra
tion
of p
eopl
e to
citi
es
(e.g
., C
hina
); ■Im
age
of
rene
wab
le
and
clea
n fu
el;
■A
ccep
tanc
e of
GM
Os;
■So
cial
m
ovem
ents
re
late
d to
or
gani
c pr
oduc
tion/
fair
tr
ade/
nutr
aceu
tics/
cosm
et-
ics;
■In
clus
ion
of sm
all p
rodu
cers
; ■G
ener
atio
n of
gre
en jo
bs a
nd
inco
me.
■N
ew t
echn
olog
ies
enha
ncin
g ve
hicl
e ef
ficie
ncy
(flex
-fuel
, hy
brid
s);
■N
ew m
achi
nes
for
cane
har
-ve
stin
g; ■G
ener
atio
n or
exp
ansi
on o
f ce
llulo
sic
etha
nol u
se (b
iobu
-ta
nol,
hydr
olys
is);
■G
enet
ic m
odifi
catio
n of
ene
r-gy
cro
ps fo
r re
sist
ance
to d
ry
wea
ther
and
dis
ease
s; ■-
Use
of
biof
ertil
izer
s fr
om
by-p
rodu
cts;
■- I
nteg
ratio
n of
bio
dies
el a
nd
etha
nol f
acili
ties;
■Pr
ivat
izat
ion/
publ
ic-p
riva
te
part
ners
hips
in in
fras
truc
ture
fa
cilit
ies a
nd R
&D
initi
ativ
es.
44 45
BIOENERGY FROM SUGARCANECHAPTER 2
TABL
E 4: S
UMM
ARY
OF T
HE O
PPOR
TUNI
TIES
AND
THR
EATS
TO T
HE S
UGAR
CANE
CHA
IN
POLI
TICA
L-LE
GAL
ECON
OMIC
-NAT
URAL
SOCI
AL-C
ULTU
RAL
TECH
NOLO
GICA
LTHREATS
■So
cial
-env
ironm
enta
l ba
rri-
ers t
o bi
ofue
l im
port
s; ■La
ck o
f in
tern
atio
nal
stan
-da
rds f
or b
iofu
els;
■Lo
bbyi
ng o
f oi
l co
mpa
nies
an
d lo
cal
prod
ucer
s ag
ains
t im
port
ed e
than
ol;
■La
ck o
f re
gula
tory
sto
cks
of
biof
uels
in c
ount
ries
(whi
ch
faci
litat
es fl
uctu
atio
n of
com
-m
odity
pric
es);
■Ta
x in
equa
lity
thro
ugh
val-
ue c
hain
and
stat
es o
f Bra
zil;
■C
onfli
ct o
f "p
re-s
alt"
pet
ro-
leum
inve
stm
ents
vs.
bioe
n-er
gy e
cono
my
in B
razi
l; ■G
asol
ine p
rice c
ontr
ol in
Bra
-zi
l and
Pet
robr
as m
onop
oly.
■G
row
th in
the
hybr
id v
ehic
le
fleet
s (g
asol
ine
and
elec
tric
i-ty
); ■La
ck o
f mac
hine
s and
equ
ip-
men
t for
exp
ansi
on o
f ind
us-
tria
l cap
aciti
es;
■H
igh
fluct
uatio
n of
agr
icul
-tu
ral c
omm
odity
(fee
dsto
ck)
pric
es;
■M
ore
pow
erfu
l dis
ease
s an
d pe
sts;
■C
limat
e ch
ange
brin
ging
re-
duct
ion
in th
e av
aila
ble
land
; ■La
ck o
f ag
ricul
tura
l in
puts
(fe
rtili
zers
mai
nly)
; ■La
ck o
f cre
dit/
fund
ing
lines
w
ith e
asy
acce
ss.
■Im
age
of jo
bs r
elat
ed t
o th
e ha
rves
t (su
garc
ane,
pal
m);
■Im
age
of
land
oc
cupa
tion
gene
ratin
g co
mpe
titio
n w
ith
food
; ■Im
age
of th
e "m
onoc
ultu
re";
■M
echa
niza
tion
vs.
unem
-pl
oym
ent i
n ag
ricul
ture
; ■N
GO
s ag
ains
t th
e bi
ofue
ls’
grow
th;
■St
rict
requ
irem
ents
for
so-
cial
-env
ironm
enta
l ce
rtifi
ca-
tion.
■Sw
eete
ners
and
oth
er e
nerg
y so
urce
s; ■N
ew
tech
nolo
gies
ge
nera
t-in
g m
ore
com
petit
ive
ener
gy
(hyd
roge
n);
■D
efici
ent
infr
astr
uctu
re
for
dist
ribu
tion
of
agri
cultu
ral
prod
uctio
n fr
om n
ew f
ron-
tiers
(int
erna
l log
istic
s);
■Lo
w i
nves
tmen
ts i
n R&
D i
n de
velo
ping
cou
ntri
es.
Sour
ce: E
labo
rate
d by
the
auth
ors.
This micro-environmental analysis was followed by a comparative analysis of the world’s main producers and exporters (Australia, India, and Thailand primarily related to sugar; USA and EU related to ethanol) to understand the competitive benchmarks. An internal analysis was then completed to determine the Brazilian chain’s strong and weak points. The idea is to reinforce strong points, while directing projects to improve weak points in the forthcoming years.
The dimensions of analysis were divided into five categories, in accordance with the CHAINPLAN method (see Table 5).
46 47
BIOENERGY FROM SUGARCANETA
BLE 5
: SUM
MAR
Y OF
THE
STR
ENGT
HS A
ND W
EAKN
ESSE
S IN
THE
SUG
ARCA
NE C
HAIN
INNO
VATI
ON/R
&D/
PROD
UCTI
ONCO
MM
UNIC
ATIO
NDI
STRI
BUTI
ON A
ND
LOGI
STIC
SHU
MAN
RES
OURC
ES
AND
TRAI
NING
COOR
DINA
TION
AND
IN
STIT
UTIO
NAL E
NVIR
ONM
ENT
STRENGTHS ■Su
garc
ane
has
low
er b
iofu
el
cost
(th
an c
orn,
bee
t, ra
pe-
seed
); ■C
apac
ity o
f th
e m
atur
e an
d la
rge
indu
stry
in B
razi
l; ■St
rong
met
al-m
echa
nica
l in-
dust
ry d
edic
ated
to
etha
nol
faci
litie
s; ■C
apac
ity
of
expa
nsio
n to
ne
w la
nd in
Bra
zil;
■Su
garc
ane
varie
ties
mor
e re
-si
stan
t to
clim
ate
chan
ge;
■St
rong
agr
onom
ic a
nd b
io-
tech
nolo
gica
l in
telli
genc
e ce
nter
s in
Braz
il; ■To
tal u
se o
f by-
prod
ucts
and
re
sidu
es in
the
field
; ■Fl
ex-fu
el te
chno
logy
.
■Im
age
of
gree
n fu
el,
jobs
ge
n-er
ator
, en
viro
n-m
enta
lly
corr
ect,
expo
rter
, re
gion
-al
de
velo
pmen
t pr
omot
er, a
nd r
e-ne
wab
le fu
el;
■"F
ree"
ad
vert
is-
ing;
■U
NIC
A
(Sug
-ar
cane
In
dus-
try
Ass
ocia
tion)
co
mm
uni
cati
on
actio
ns i
n Br
azil,
U
SA a
nd E
U.
■V
ertic
al i
nteg
ratio
n of
et
hano
l fac
ilitie
s to
dis
-tr
ibut
ion
of fu
els;
■Tr
adin
g an
d oi
l co
m-
pani
es’
cont
rol
of t
he
sect
or;
■Bi
oele
ctric
ity
faci
litie
s co
ncen
trat
ion
clos
e to
hi
gh d
eman
d of
ele
c-tr
icity
and
com
plem
en-
tary
to h
ydro
elec
tric
ity
sour
ces.
■G
ood
trai
ning
ca-
paci
ty (u
nive
rsiti
es
and
rese
arch
inst
i-tu
tes)
in B
razi
l; ■U
DO
P (U
nion
of
Bi
oner
gy
Prod
uc-
ers)
co
rpor
ativ
e un
iver
sity
for
ex-
ecut
ives
and
tec
h-ni
cal w
orkf
orce
.
■C
onse
cana
mod
el (s
ugar
cane
pa
ymen
t for
mul
a);
■A
gric
ultu
ral p
artn
ersh
ips
for
suga
rcan
e pr
oduc
tion;
■A
ssoc
iatio
ns
and
coop
era-
tives
; ■V
olun
tary
agre
emen
t to
elim
-in
ate
the
prac
tice
of b
urni
ng
suga
rcan
e.
WEAKNESSES
■Lo
w p
rofit
abili
ty o
f the
sug-
arca
ne in
depe
nden
t su
ppli-
ers;
■H
igh
inve
stm
ents
in
cellu
-lo
sic
etha
nol
rese
arch
by
de
velo
ped
coun
trie
s. ■H
igh
inve
stm
ents
in h
ybri
d ca
r te
chno
logy
the
dev
el-
oped
cou
ntri
es.
■H
igh
inve
stm
ents
in
im
-pr
oved
eth
anol
(bio
buta
nol)
by d
evel
oped
cou
ntri
es.
■Im
age
of
labo
r co
nditi
ons
durin
g th
e ha
rves
t in
de-
velo
ping
co
un-
trie
s; ■C
once
ntra
tion
of
land
and
farm
ers;
■-
Poor
co
rpor
ate
gove
rnan
ce p
rac-
tices
by
the
suga
r m
ill se
ctor
.
■Ba
d ex
port
log
istic
s in
de
velo
ping
cou
ntrie
s; ■D
elay
of
etha
nol
pipe
-lin
e in
fra-
stru
ctur
e; ■Et
hano
l in
tern
al p
rice
fluct
uatio
n; ■La
ck o
f fu
el s
tock
ca-
paci
ty in
Bra
zil;
■D
ifficu
lty
of
conn
ec-
tion
to e
lect
rical
grid
by
suga
r mill
s.
■Lo
w
coor
dina
tion
betw
een
orga
ni-
zatio
ns
that
of
fer
trai
ning
(r
esea
rch
inst
itute
s an
d un
i-ve
rsiti
es);
■La
ck
of
exec
u-tiv
e an
d te
chni
cal
wor
kfor
ce;
■Re
allo
catio
n of
fo
rmer
su
garc
ane
cutte
rs.
■80
to
90%
of
the
prod
uctio
n co
st o
f et
hano
l co
mes
fro
m
suga
rcan
e;
■H
igh
vert
ical
int
egra
tion
of
biof
uel
faci
litie
s fo
r ag
ricul
-tu
ral p
rodu
ctio
n; ■N
on-p
aym
ent
of s
ugar
cane
by
fibe
r con
tent
; ■La
ck o
f lo
ng-te
rm c
ontr
acts
fo
r dis
trib
utio
n; ■La
ck o
f pa
ttern
con
trac
ts f
or
etha
nol e
xpor
ts
Sour
ce: E
labo
rate
d by
the
auth
ors.
The goals in the chain’s strategic plan must be clear and consistent and, whenever possible, quantitative. Thus, for the sugarcane chain, size-related goals could be established, such as a target for production and exportation volumes. The goals must also contribute to economic sustainability (income to the main links in the productive chain), the environment (to maintain the production bases for future generations), and people, aiming to promote jobs and income. Table 6 provides some suggestions.
Source: Elaborated by the authors.
TABLE 6: EXAMPLES OF STRATEGIC OBJECTIVES (GOALS) FOR 2020
TYPE OF GOAL DESCRIPTION
Sugarcane production ■ Produce X tons on a target cost of R$ x and on a target price of R$ y
Ethanol production ■ Produce X billions of liters, being responsible for 80% of Brazil’s fuel consumption on a tar-get cost of R$ x on a target price of R$ y
Energy production ■ Produce X MGW, being responsible for 15% of Brazil’s needs on a target cost of R$ x on a tar-get price of R$ y.
Sugar export ■ Export X tons to Y countries, being responsible for 60% of world exports, on a target price of R$ x
Ethanol export ■ Export X tons to Y countries, being responsi-ble for 60% of world exports, on a target price of R$ x
Volumes of production units ■ Operating units
Profit margins in different links ■ Expected margins
Job volume ■ Expected jobs Production of other products from sugarcane
■ Produce X liters of diesel and Y tons of plastic, among other products.
Indirect GHG emissions (land use change)
■ 80% of sugarcane plantation expansion should be on degraded or underused pastures.
■ Average agricultural yield should be increa-sed to 100 tons/ hectare through GMOs’ va-rieties.
Energy Balance
■ Energy balance of sugarcane chain should be increased to 10:1 through more efficient boilers, B2B biofuels consumption and multi--modal logistics.
48 49
BIOENERGY FROM SUGARCANECHAPTER 2
Brazil must pursue a cost-leading strategy based on economic, environmental, and social sustainability in order to supply broadest market lines of sugar buyers. Brazil’s sugarcane industry should also position itself as one of the cleanest industries in the world, taking solar energy and transforming it into biomass energy to be used by human beings.
To cope with new opportunities and threats, the chain needs to think strategically and change. Examples of strategic projects that could be implemented in the sugarcane chain are provided below for each of the following areas: coordination and institutional environment, production and innovation, communication, distribution and logistics, and human resources and training. These projects could be split between the public and the private sectors or be implemented jointly in some cases. They represent suggestions for strategic action that could ensure continuation of favorable conditions for the sugar-ethanol-energy sector.
EXAMPLES OF PROJECTS RELATED TO PRODUCTION, PRODUCTS, R&D, AND INNOVATION:
■ Encourage programs for vertical growth of sugarcane production (higher yield in the same area), through increased productivity, especially in genetic modification of sugarcane;
■ Promote research and development (R&D) through the formation of public-private partnerships (PPPs) and technological parks made up of agronomic institutes, intelligence centers in universities, private companies, technological centers and associations, with tax incentives and funds for the development of joint research in the sector;
■ Integrate and diversify farming and processing activities for food and energy production. The integration of sugar mill and ethanol distilleries with biodiesel plants will add additional products to the production mix of mills;
■ Strictly control the expansion of sugarcane plantations. Expansion should take place mainly in regions where there are degraded or underused pastures, and in accordance with the agro-environmental zoning of sugarcane production by the Brazilian Ministry of Agriculture (MAPA);.
■ Adapt large diesel engines for ethanol, aiming at the truck market for sugarcane suppliers and mills, as well as the market for tractors and urban buses;
■ Develop new products from ethanol and sugar in addition to those that have already been developed, such as biodegradable plastic and diesel;
■ Strengthen electric power production, to seize existing potential
in the sector, giving priority to this form of renewable energy through financing;
■ Strengthen the capability of the sugar and ethanol mills to include small producers through sustainable remuneration and long-term contracts;
■ Facilitate innovations related to other products (second- and third-generation ethanol) that could be processed at the mills.
EXAMPLES OF PROJECTS RELATED TO COMMUNICATION: ■ Strengthen the work of UNICA (Sugarcane Industry
Association) and APEX (Governmental Agency for Brazilian Exports’ Promotion) with the “Agora” project to promote the image of Brazilian ethanol as a sustainable fuel that reduces countries' dependence on imported and scarce oil; encourages the adoption of clean technologies (flex fuel, gasohol, local production in a sustainable manner, expansion of distribution net); ensures a sustainable production system, with a high energy balance (reduces emissions of greenhouse gases); allows the co-generation of clean energy (with the use of sugarcane bagasse); and generates carbon credits.
■ In partnership with municipalities and businesses, test the use of ethanol by city buses on a much larger scale. These buses could be painted and decorated with pictures about the chain, and through them people could gain knowledge and information;.
■ Petrobras could export gasoline ready for use, with anhydrous ethanol added to it, to neighboring countries. There is a clear possibility for Petrobras to become the first green oil company in the world. Petrobras has a very important role to play in promoting the image of ethanol, and ethanol (as well as biodiesel) has a very important role in establishing Petrobras' image;
■ Work on the development of African countries to jointly build an image of ethanol as a renewable, peaceful fuel;
■ Use gas stations as a communication tool for ethanol: "green" stations offer an opportunity for the supply chain to communicate with the final consumer. The sector has neglected this opportunity for decades;
■ Make use of knowledge portals for sugarcane (the UNICA web site or other sources), which offer everything that researchers and consumers need to know about sugarcane, with databases of theses and dissertations, articles, books, and videos. One must remember that this is the "new media" generation, and therefore information should be offered to people in new ways.
50 51
BIOENERGY FROM SUGARCANECHAPTER 2
EXAMPLES OF PROJECTS RELATED TO DISTRIBUTION AND LOGISTICS: ■ Implement mechanisms to encourage the compilation of strategic
stocks of ethanol. This will avoid ethanol price fluctuations, which harm the image of the product in the eyes of the consumer. Ensuring the safety of supply in domestic and international markets by maintaining regular stocks in Brazil and to the main consumer markets for Brazilian ethanol can improve the sector’s image in Brazil and around the world;
■ The mills in associative organizational forms, like franchising or joint-ventures, could have their own gas stations in cities. These concept stations (“factory outlets” called “green” or “eco” stations) would serve two basic functions: to establish retail prices of ethanol (hindered by the action of urban cartels or the power of oil distributors), and image communication to the final consumer, as stated above;
■ Speed up already-announced investments in ethanol pipelines, as well as in port facilities for ethanol export at the lowest possible cost;
■ Streamline the public-private partnerships (PPPs) and strengthen a broad privatization program of highways, railways, and ports;
■ Ensure general adoption of the standard contract for ethanol developed by IETHA (Association for International Trade of Ethanol). Technicians from Brazil, the EU and USA should first work to standardize the fuel and transform it into a commodity;
■ Companies should consider collective actions to strengthen the logistics of transportation, port storage, and distribution of sugar and ethanol, aiming to have very competitive costs;
■ Ensure easy access for mills to transmission lines (electrical power grids) of the SIN (National Interconnected System), to enable them to strengthen the energy supply.
EXAMPLES OF PROJECTS RELATED TO HUMAN RESOURCES AND TRAINING: ■ Map specific needs and coordinate the efforts of existing
organizations in the training of technicians and executives for the sugarcane production chain. The Union of Bioenergy Producers (UDOP) has done excellent work in this area;
■ Map the essential technical and undergraduate courses for the sugarcane agribusiness and its spatial distribution. Plan, along with many different organizations and the Ministry of Education, the granting of scholarships and incentives for research;
■ Implement training programs for workers who have lost their jobs after mechanization of harvesting (former sugarcane cutters). UNICA has been doing this through the “Renovacao” project;
■ Promote training of public employees related to agribusiness, in
order to improve performance in the management of food quality, sustainability, certification, and traceability;
■ Provide sustainability training for mill and farm employees; ■ Establish a digital platform for training, aimed at popularizing
existing knowledge; ■ Create a “Sustainable Regional Development” program to
stimulate sugar and ethanol mills to start thinking about the inclusion of local communities. Propose corporate social-responsibility projects to add local companies and/or small producers to the sugar/ethanol mill supply chain. SEBRAE (Brazilian Service of Support for Micro and Small Companies) could coordinate this kind of activity.
EXAMPLES OF PROJECTS RELATED TO COORDINATION AND INSTITUTIONAL ENVIRONMENT:
■ Federal and state governments need to focus on tax equality. The ethanol VAT rate could be reduced to 12% in all of the Brazilian states and federal taxes could be slightly reduced This reduction in revenues would be offset in part by increases in demand and production. This does not consider environmental benefits and internalization development;
■ Governments should also give greater tax benefits to "flex-fuel" vehicles as opposed to gasoline-fueled ones. American, French, and Japanese manufacturers have proven that these flex engines are fully feasible. Brazilian manufactures could, like the French manufacturers, export these cars and engines, spawning this technology and consumption to other markets;
■ Study whether the addition of anhydrous ethanol to gasoline could be expanded from the current 20–25% to nearly 30%. Many people with gasoline-fueled cars have already made this transition on their own;
■ In the Consecana (sugarcane payment formula by sugar content) review, which is usually performed every five years, greater importance could be given to sugarcane bagasse (payment per fiber content in the sugarcane);
■ Adjust the certification process of Brazilian ethanol from sugarcane, coordinated by UNICA, to fit the industry standards for quality demanded by developed countries, mainly on the issue of sustainability;
■ Utilize the sector's idle capacity to provide electricity by establishing a clear institutional framework and purchasing warrants, and by giving preferential treatment to this type of energy;
■ Create a list of priority countries for trade agreements (FTAs and tariff reductions) related to sugar and ethanol, and strengthen
52 53
BIOENERGY FROM SUGARCANECHAPTER 2
work in these countries. For example, Brazil has conditions to export not only sugar and ethanol, but also plant technology (facilities) to Africa and Latin America.
These are only some ideas generated through the authors' work in more than 10 projects in the Sugarcane chain. These ideas have been proposed in various contexts, and some have already been implemented, either by existing organizations or by governments. The authors recommend that coordination of this planning effort in Brazil be centralized and aimed at making the sector more sustainable, thereby increasing Brazil’s competitive advantage as a supplier of energy to the world. In a period with water, food, and energy crises, sugarcane is, without a doubt, Brazil’s best resource to help meet these needs.
CONCLUSIONS: THE FUTURE
Several factors have motivated governments to establish biofuels’ mandatory blending targets, including increasing oil prices, energy dependence and global warming. The basic idea behind biofuels is that when they are added to fossil fuels in our cars, part of the money flow moves from the oil business towards the agro-business. If someone in New York fills up his or her car tank with fuel consisting of 10% ethanol (E10), around 10% of the money spent by the car owner will not go to the oil business chain, but to the corn business chain. And this revolution is happening in several parts of the world, empowering agriculture and land owners. The future opportunities are great, since biofuels today account for only around 2-3% of total fuel consumption globally and there are plenty of areas available on the planet to support this development.
This article demonstrates how Brazil has been successful in adopting sugarcane policies – the Proalcool program in 70’s and 80’s, deregulation and free trade in 90’s , the consolidation of mandatory blending target (E25) and the launch of FFVs (Flex Fuel Vehicles) in the last decade -, taking advantage of this plant’s unparalleled capacity to transform solar energy into economic benefits.
In 2010, the sugarcane chain in Brazil was responsible for a GDP of US$ 30 billion, a financial movement of US$ 90 billion, and the generation of almost 4.5 million (direct and indirect) jobs. The chain was also responsible for US$ 7 billion in tax generation for federal and state governments; and its major products, sugar and ethanol, were responsible for US$ 12 billion in exports.
Brazil is self-sufficient in the supply of sugar to internal markets and it holds a 53% share of world sugar exports. Sugarcane generates not only sugar, but ethanol and bioelectricity. From the total fuel
consumed in the country, ethanol already accounts for 52%, and gasoline accounts for the remaining 48%.
Since more that 3 million new cars are sold per year in Brazil, and of these, 90% are flex fuel vehicles (which can use either gasoline or ethanol), it is expected that the ratio of fuel consumption will be 80% ethanol and 20% gasoline by 2015. Sugarcane production takes up only 9 million hectares (i.e. less than 3%) of the 350 million hectares available for agricultural development in Brazil.
After crushing the sugar cane, about 1/3 of its weight is bagasse. This bagasse is burned in boilers inside the industrial units, cogenerating electricity, which is partially used to run the mill, and partly sold to the consumers’ network, representing an additional source of income. Brazil estimates that by 2020, 15% of its electricity supply will come from sugarcane (a substantial increase from 3% in 2010).
The efficiency of ethanol makes it economically beneficial for consumers. Most mills produce ethanol at a cost of about US$ 0.40/liter, and the average retail price is US$ 0.80/liter (55-60% of the price of gasoline). At gas stations in Brazil, consumers can choose between E100 (100% hydrated ethanol) and normal gasoline, which for more than 10 years has contained 25% anhydrous ethanol, without causing any damage to gasoline engines.
Companies have started extracting several other products from sugarcane, the most promising of which are probably bio-plastic and diesel. Coca Cola recently launched its “plant-based plastic bottle”, 30% of which derives cane. Diesel derived directly from sugar is already in production in Brazil, using an engineered yeast-based technology developed by a company called Amyris in the USA. This cane diesel has been approved by Mercedes Benz for use in normal diesel engines. Important new developments related to sugarcane are expected in the near future. The first GMOs are expected by 2014, and could increase the sugar content by 40%. Hydrolysis has the potential to allow production to go from 8,000 liters of ethanol per hectare to 12-15,000.
Maintenance of the sugarcane chain’s competitiveness will depend on the operationalization of important strategic projects, in which responsible agents, deadlines, and budgets are clearly defined. More than ever, planning is necessary in this sector in order to take advantage of all the opportunities and to resolve weaknesses as the industry looks for equilibrium and sustainability. Because of this, we offer our proposal for this chain.
A suggestion for future research would be to apply the CHAINPLAN method to other sugarcane chains in other countries. This would allow researchers, policy makers and practitioners to compare results, to make easier the strategic planning of each other, and to look for benchmarks for improvements.
54 55
BIOENERGY FROM SUGARCANE
BY MARCOS FAVA NEVES, RAFAEL BORDONAL KALAKI, VINICIUS GUSTAVO TROMBIN AND JONNY MATEUS RODRIGUES
SUGARCANE INDUSTRY DEVELOPMENT ANALYSIS FROM THE PERSPECTIVE OF AGRO-INDUSTRIAL SYSTEM QUANTIFICATION
3
Originally published in Research in Agriculture 2016; 1 (2): 42-57
BIOENERGY FROM SUGARCANE
INTRODUCTION
Energy is a key element from the primary and fundamental activity of food production to the functioning of the most varied and technological economic sectors of a nation. The world energy matrix is constituted of renewable and non-renewable fuel, which according to its availability can supply growing fleet of vehicles and machines used to move the economy and enable economic and social development. According to the MAPA (Ministry of Agriculture, Livestock and Supply), the importance of energy security currently focuses on the challenge of supplying the development with clean energy using renewable resources, which has economic and environmental importance.
The Brazilian sugarcane industry shows its strength producing various forms of sustainable and renewable agro-energy (sugar, ethanol and electricity), being able to meet this demand without compromising the environment and the availability for future generations. When addressing this issue, some points deserve close attention such as the importance of economic and social development, entrepreneurship, contractual relationships, independent producers, and respect for workers and the environment arising from the development of this sector. This article will deal with issues related to the economy and development of the sector in Brazil.
In 2013, Brazil was the largest producer of sugarcane with a 39.4% share. Regarding the production of sugar, the country is also the biggest producer with 21.6% of the total and the largest exporter with a share of 50.1% about total exports. In ethanol production, the country occupied the second position with a total of 26.9% (FAO, 2013; USDA, 2014).
The sector has a strong impact as a wealth generator for the nation, and in 2013/2014 it generated US$ 43.4 billion, which was equivalent to about 2% of Brazil’s GDP. The total sum of the sales of the various links that make up the agro-industrial system of sugarcane reached US$ 107.7 billion. The trend is that these values continue to increase while other products, which today are not the main sources of income, gain more importance in wealth generation such as bioelectricity, yeast, bioplastics, sugarcane diesel, biobutanol, cellulosic ethanol and carbon credits (Neves & Trombin, 2014).
The sugarcane business consists of several links: (I) production of sugarcane; (II) processing of sugar, ethanol and derivatives; (III) research services, training, and technical and credit assistance; (IV) transport; (V) marketing; (VI) export; and (VII) end user. All these agents involved in the sugarcane industry form the Sugarcane Agro-industrial System.
The financial operation and the wealth generation of one sector are fundamental to the economic development of a city, a region, a state and/or country, and when they are economically developed, they have better conditions to promote their social development. Tax
59
BIOENERGY FROM SUGARCANECHAPTER 3
revenues play an important role as well as jobs that are distributors of income, since through the capitalization of workers they move the economy of their cities through sales in supermarkets, clothing stores, food establishments, leisure and others.
Sugarcane plants generate the income that circulates in the city and is widely distributed via wages, taxes and purchases of goods and services, moving sectors such as construction, restaurants, retail and others. It generates a multiplier effect (Neves & Trombin, 2014).
Authors such as Kaplinsky and Morris (2000), Kaplinsky and Fitter (2001), Castro (2000) and Neves (2008), discuss the importance of quantifying an agro-industrial system, claiming that this quantification allows to visualize financial flows throughout the chain, giving greater transparency and identifying the most important and deficient links and the importance of understanding broadly the environment in which an organization operates.
Neves (2008) developed the method of Strategic Planning and Management of Agribusiness Systems (GESis), which addresses the strategic management of an agro-industrial system and which brings in one of its steps the description stage, mapping and quantification of agro-industrial system, showing a sequence of steps to perform it. This method was applied in various agro-industrial systems such as wheat, milk, citrus, beef and sugarcane industry.
Since the importance of the sugarcane industry in Brazil is historic, dating back to the time of colonization (1500), and later walking side by side with the development of the country, being a mainstay of the Brazilian economy and also for being an important factor for the development of Brazil, this article aims to answer the following research problem: What has been the performance of the Brazilian sugarcane industry in the last five years like raised from mapping and quantification studies of agro-industrial systems?
In the face of the facts presented, this article aims to (I) analyze the development of the Brazilian sugarcane industry in the last five years, (II) using mapping and quantification studies of agro-industrial systems as a comparison instrument, and (III) assess whether the method of mapping and quantification of agro-industrial system (GESis) is a useful tool for analyzing the economic development of an agro-industrial system.
THEORETICAL FRAMEWORK
In this work the theoretical framework addresses the agro-industrial systems, the evolution of this concept, its characteristics and aspects related to the quantification of agribusiness systems. Besides that, the quantitation method of agro-industrial systems developed by
Neves (2008) is seen in detail.
2.1: APPROACH REGARDING AGRO-INDUSTRIAL SYSTEMS AND QUANTIFICATION OF AGRO-INDUSTRIAL SYSTEMS
A traditional and pioneering approach regarding agro-industrial system concept that is found in the literature is the one proposed by Goldberg (1968) who developed the theory of Commodity System Approach (CSA) in the USA in studies on the productive systems of citrus, wheat and soybeans. The term CSA indicates that a commodity system addresses all players involved in the production, processing and distribution of a product, emphasizing the sequence of product transformations in the system. The concept analyzes the traditional relationship of buying and selling and evaluates institutional bias, concluding that the final destination of agricultural products was the agricultural industry and not the end user.
Another traditional approach to agribusiness systems was proposed by Morvan (1985), in France, which defines a chain (“filière”) as a set of related operations to transform a product. The author also states that the filière analysis is an important tool for describing systems, organizing the integration of studies, and analyzing industrial policies of companies and collective strategies. Batalha (2001) complements claiming that the chain has complementary interdependence and is influenced by technology.
Zylbersztajn (2000) states that an Agribusiness System (SAG) can be defined as a succession of vertically arranged operations of production activities, from the production to the end user (Figure 1), covering the following key elements: agents, sectors, relations between them, institutional environment and support organizations.
INPUTS
Associations, Information, Research, Finance, Cooperatives and Companies.
AGRICULTURE INDUSTRY WHOLESALEDISTRIBUTION
DISTRIBUTIONRETAIL
CONSUMER
ORGANIZATIONAL ENVIRONMENT:
Culture, Traditions, Education, Custom, Laws and Regulations.INSTITUCIONAL ENVIRONMENT:
FIGURE 1: AGRIBUSINESS SYSTEM AND TYPICAL TRANSACTIONS
Source: Zylbersztajn, 2000.
60 61
BIOENERGY FROM SUGARCANECHAPTER 3
Zylbersztajn (1995) stresses the need for an agribusiness systemic approach, since there is a dependency relationship between the links of the chain and this relationship can not be ignored. This interdependence is present in the food supply chain concept proposed by Folkerts and Koehorst (1997).
Kaplinsky and Fitter (2001) aim to identify the value generated along the production chain. They analyze the global coffee chain by performing a method to map and quantify the sector. Their method is interesting as it incorporates the variable geographical location, clearly showing the essential steps and what is made in consuming countries. According to the authors, in order to achieve a more equitable global income distribution in the coffee chain, consumers should be educated to recognize that the best coffee is directly linked to its place of origin instead of its brand.
Kaplinsky and Morris (2000) point out that supply chain quantification methods tend to result in a tree of input and output streams which carry all information collected. Data can be found in different primary and secondary sources such as annual reports, balance sheet and interviews with key players in each link in the chain involved in the research and other areas.
According to Castro (2000), when analyzing a productive chain, the capital, translated in a particular currency (US Dollars, Brazilian Reais and others), is the most appropriate flow element for its measurement. Castro (2000) also states that the equity in the appropriation of economic benefits generated along the chain can be analyzed by quantifying the capital flow, starting at the end user and verifying the accumulation in other components of the chain.
It is important to highlight that this study does not use a network approach since the unit of analysis is not a network but an agro-industrial system (SAG). Besides that, agro-industrial system is considered limited by the borders of a particular country. The players in the agro-industrial system are: input suppliers, farmers, suppliers of industrial inputs, industries, distributors, service providers and consumers, in addition to facilitating agents, who are players that are linked to the agro-industrial system, but not directly (not allocated inside the main links).
Neves (2008), states that the productive system concept focuses the existing vertical relationships between agents, whereas the concept of network includes vertical, horizontal and lateral relationships between independent agents and, therefore, the network concept is more general. Ménard (2002) claims that networks are a hybrid form of governance and that the agro-industrial system is a special case of network.
2.2 STRATEGIC PLANNING AND MANAGEMENT OF AGRO-INDUSTRIAL SYSTEMS (GESIS)
The method of Strategic Planning and Management of Agro-Industrial Systems (GESis) was developed by Neves in 2008 and addresses the strategic management of an agricultural system, that is, its focus is in the direction of agro-industrial system in the long term. This method has already been applied several times in other agro-industrial systems such as wheat by Rossi and Neves (2004), milk by Cônsoli and Neves (2006), sugarcane by Neves, Trombin and Consoli (2010), beef by Neves, Trombin, Gerbasi and Kalaki (2014) and cotton by Neves and Pinto (2012). The method was also applied in agro-industrial systems abroad such as the milk chain in Argentina (2007) and wheat (2007) and milk (2010) in Uruguay.
The method of Strategic Planning and Management of Agro-Industrial Systems (GESis) is a five-step process as shown in Figure 2 below:
Step 1 refers to the initiative of any organization in the industry (usually a trade group), with research institutions and universities and/or government that aim to organize a planning process and a future vision for the system. The government can also take the initiative through sectoral chambers. At this step of the method, information on the production chain is received from research organizations, government and private sector. This step aims to identify the key players participating in the system, how to have representativeness in this system, the existing organizations and associations, that is, information on important topics about the agro-industrial system studied. This step already begins to join forces for the second step of the method (Neves, 2004, 2008).
Step 2, which was the focus of this research, aims to describe, map and quantify the agro-industrial system. It has been a major subject of study for the enrichment of scientific knowledge in administration: the systemic approach. The importance of understanding the environment
Initiatives of Leaders,
Government, and Research Institutes/
Universities in planning the future
of the agro-industrial
system
STEP 1Description,
Mapping and Quantification
of the agro-industrial
system
STEP 2Creation of a
Vertical Chain Organization in
the agro-industrial
system
STEP 3Elaboration of the Strategic Plan for
the agro-industrial
system
STEP 4Management of
Strategic Projects and Design of
contracts
STEP 5
FIGURE 2: METHOD OF STRATEGIC PLANNING AND MANAGEMENT OF AGRO-INDUSTRIAL SYSTEM (GESIS)
Source: Neves, 2008.
62 63
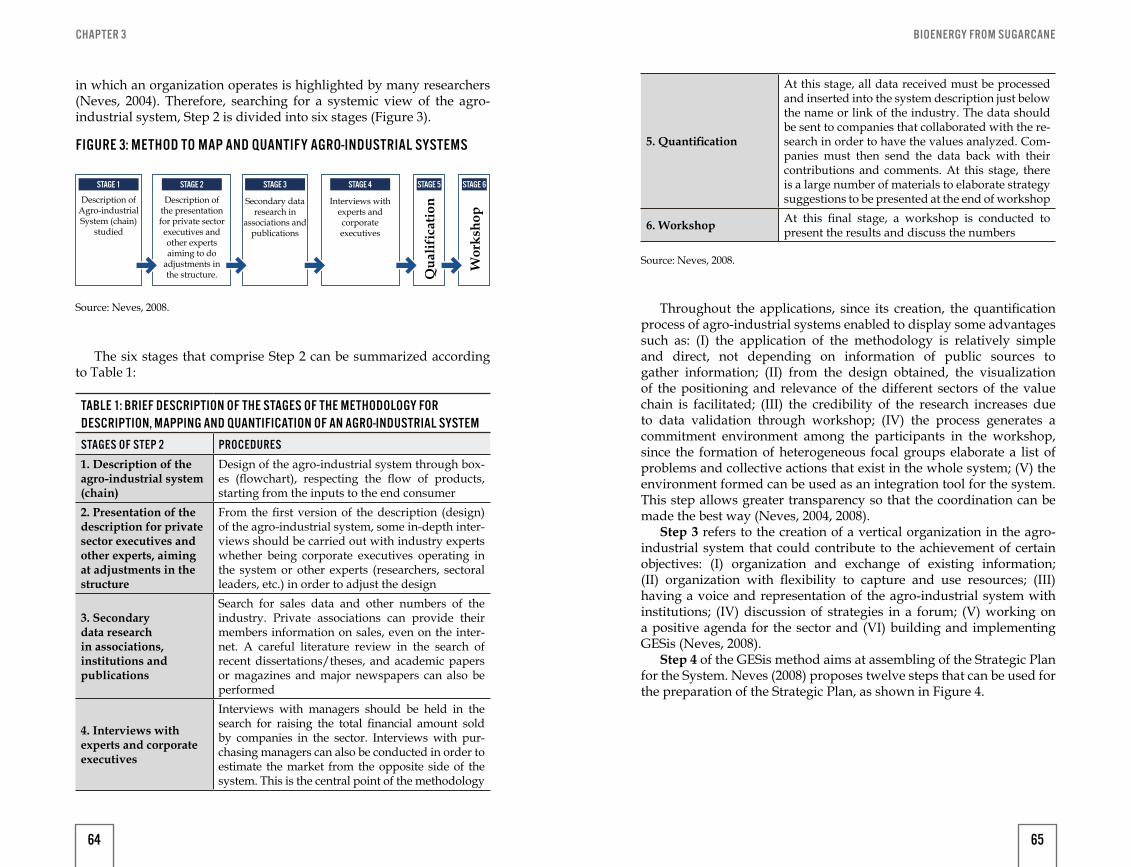
BIOENERGY FROM SUGARCANECHAPTER 3
in which an organization operates is highlighted by many researchers (Neves, 2004). Therefore, searching for a systemic view of the agro-industrial system, Step 2 is divided into six stages (Figure 3).
The six stages that comprise Step 2 can be summarized according to Table 1:
Description of Agro-industrial System (chain)
studied
Description of the presentation for private sector executives and other experts aiming to do
adjustments in the structure.
Secondary data research in
associations and publications
Interviews with experts and corporate executives
Qua
lific
atio
n
Wor
ksho
p
STAGE 1 STAGE 2 STAGE 3 STAGE 4 STAGE 5 STAGE 6
FIGURE 3: METHOD TO MAP AND QUANTIFY AGRO-INDUSTRIAL SYSTEMS
Source: Neves, 2008.
TABLE 1: BRIEF DESCRIPTION OF THE STAGES OF THE METHODOLOGY FOR DESCRIPTION, MAPPING AND QUANTIFICATION OF AN AGRO-INDUSTRIAL SYSTEM
STAGES OF STEP 2 PROCEDURES
1. Description of the agro-industrial system (chain)
Design of the agro-industrial system through box-es (flowchart), respecting the flow of products, starting from the inputs to the end consumer
2. Presentation of the description for private sector executives and other experts, aiming at adjustments in the structure
From the first version of the description (design) of the agro-industrial system, some in-depth inter-views should be carried out with industry experts whether being corporate executives operating in the system or other experts (researchers, sectoral leaders, etc.) in order to adjust the design
3. Secondary data research in associations, institutions and publications
Search for sales data and other numbers of the industry. Private associations can provide their members information on sales, even on the inter-net. A careful literature review in the search of recent dissertations/theses, and academic papers or magazines and major newspapers can also be performed
4. Interviews with experts and corporate executives
Interviews with managers should be held in the search for raising the total financial amount sold by companies in the sector. Interviews with pur-chasing managers can also be conducted in order to estimate the market from the opposite side of the system. This is the central point of the methodology
Throughout the applications, since its creation, the quantification process of agro-industrial systems enabled to display some advantages such as: (I) the application of the methodology is relatively simple and direct, not depending on information of public sources to gather information; (II) from the design obtained, the visualization of the positioning and relevance of the different sectors of the value chain is facilitated; (III) the credibility of the research increases due to data validation through workshop; (IV) the process generates a commitment environment among the participants in the workshop, since the formation of heterogeneous focal groups elaborate a list of problems and collective actions that exist in the whole system; (V) the environment formed can be used as an integration tool for the system. This step allows greater transparency so that the coordination can be made the best way (Neves, 2004, 2008).
Step 3 refers to the creation of a vertical organization in the agro-industrial system that could contribute to the achievement of certain objectives: (I) organization and exchange of existing information; (II) organization with flexibility to capture and use resources; (III) having a voice and representation of the agro-industrial system with institutions; (IV) discussion of strategies in a forum; (V) working on a positive agenda for the sector and (VI) building and implementing GESis (Neves, 2008).
Step 4 of the GESis method aims at assembling of the Strategic Plan for the System. Neves (2008) proposes twelve steps that can be used for the preparation of the Strategic Plan, as shown in Figure 4.
Source: Neves, 2008.
5. Quantification
At this stage, all data received must be processed and inserted into the system description just below the name or link of the industry. The data should be sent to companies that collaborated with the re-search in order to have the values analyzed. Com-panies must then send the data back with their contributions and comments. At this stage, there is a large number of materials to elaborate strategy suggestions to be presented at the end of workshop
6. Workshop At this final stage, a workshop is conducted to present the results and discuss the numbers
64 65
BIOENERGY FROM SUGARCANECHAPTER 3
Analysis of market and consumer in the system approach
Intr
oduc
tion
and
unde
rsta
ndin
g
1 2
Obj
ectiv
es fo
r the
sys
tem
4
Stra
tegy
for t
he c
hain
5
Con
solid
atio
n of
str
ateg
ic p
lans
11
Budg
et o
f the
GES
is
3
Production projects, research and
development and innovation
6
Communicationsprojects
7
Distribution and Logistic projects
8
Training projects inthe agro-industrial
system/human resources
9
Coordinationprojects and adaptation
to the instutitional environment
10
STAGE 1 STAGE 2
Analysis of the internal
situation and global
competitors(benchmarking)
Source: Neves, 2008.
FIGURE 4: SUMMARY OF THE STEP 4 OF THE GESIS METHOD
Step 5 of the method aims the administration of prioritized projects and the preparation of contracts. Several projects will emerge from the Step 4. Neves (2008) states that these projects should be worked out based on the traditional steps of a project, with description and analysis of objectives, actions, indicators of performance, suggestions of implementation, projects and plans related, teams, interpellations, deadlines, budgets and management forms. At this step, contracts between agents of the agro-industrial system should also be designed.
Due to the fact it is a method that addresses the strategic management of agro-industrial systems, the overall focus is in the longterm management, the definition of objectives and collective strategies that will be analyzed in an overall perspective, the development of a sustainable and viable structure in the long term.
The method is an effective implementation attempt to: (I) build a vertical organization that is able to implement the strategies with the creation of support of an organizational structure, distinctive skills, abilities and selected people for key positions; (II) install an administrative support system with policies, procedures and skills needed for the strategy of the organization created, (III) establish a supporting budgetary strategy, with a collection system that is fair and consistent between the links and members of the system; (IV) model a cooperative culture, establishing shared values, ethical standards and an institutional environment that supports collective strategy of the system; (V) establish a system of incentives related to the objectives and strategies, motivating the agents and links of the agro-industrial system
to perform the actions planned, inducing the desired performance and guiding actions to the result of the system; (VI) establish the practice of a strategic leadership for the organization of the system (Neves, 2008).
METHODOLOGICAL PROCEDURES
The objective of this research is to make a comparative analysis of the Brazilian sugarcane industry performance in 2008/2009 and 2013/2014 crops using GESis method for the mapping and quantification of agro-industrial systems. In order to do so, this study was characterized for being an exploratory and qualitative research.
The study was performed in 3 phases: (I) the search and analysis of mapping and quantitation studies of 2008/2009 and 2013/2014 crops; (II) transformation of values into a common comparative base; (III) analysis of the results of the 2008/2009 and 2013/2014 crops. It is important to highlight that data from mapping and quantification studies relating to 2008/2009 and 2013/2014 crops were obtained using the GESis method, allowing the comparison between them since they were obtained by the same calculation formula.
3.1 PHASE 1. SEARCH AND ANALYSIS OF MAPPING AND QUANTIFICATION STUDIES OF 2008/2009 AND 2013/2014 CROPS
In this phase of the research, the quantification results of the sugarcane industry in the 2008/09 and 2013/2014 crops were searched and analyzed. Two studies were consulted: mapping and quantification of sugarcane sector of the 2008/2009 crop and mapping and quantification of the 2013/2014 crop.
Quantification study of 2008/2009 crop: this study was conducted by Markestrat (Marketing & Strategy Projects and Research Center) in 2009 involving about 10 researchers for 5 months. The study showed for the first time to Brazil, the economic grandeur of sugarcane production chain, describing its links, identifying the financial flows between them, highlighting the enormous importance in generating jobs and taxes. The study results were published in several papers and book chapters. The study used in this research as a quantification data source of the 2008/2009 crop was the “Measurement of Sugar Cane Chain in Brazil”, written by Neves, Trombin and Consoli, published in the International Food and Agribusiness Management Review, Volume 13, Issue 3, in 2010. The search system used for obtaining the mapping and quantification of the sugarcane industry was the website “Science Direct”.
Quantification study of the 2013/2014 crop: the quantification study of the 2013/2014 crop was also performed by Markestrat in 2014, also involving nearly 10 researchers. This study was published in a book titled “A dimensão do setor sucroenergético: mapeamento e
66 67
BIOENERGY FROM SUGARCANECHAPTER 3
quantificação da safra 2013/2014”, coordinated by Neves and Trombin (2014), which served as data source for this study.
After searching the data in the studies cited, the variables were selected and collected, which were considered the most representative by the authors regarding the sector’s development. The selected variables were: GDP of the sector, total financial transaction, financial transactions of the link of agricultural inputs (before the farm), financial activities on the farms, financial activities of industrial inputs (after the farm), financial transactions of the link of mills/distilleries (after the farm), wages in the sector, taxes aggregated, total sugar sales, total ethanol sales, sales of bioelectricity, price of hydrous ethanol, price of sugar, price of sugarcane ton, price of bioelectricity, cost of agricultural production, cost of industrial production, industrial yield, agricultural productivity and industrial profitability.
3.2 PHASE 2. TRANSFORMATION OF VALUES IN A COMPARATIVE BASISBefore starting the comparison of the two studies, it was necessary
to turn them into the same standard unit of currency and value. The transformation of the studies in the same scale of value is fundamental due to the fact that, in a period of five years, the sector was affected by inflation and currency fluctuations. Therefore, it was decided to carry out a comparison of the studies bringing the values to the present value basis in March 2014. It was chosen March 2014 because it was when the quantification study of the 2013/2014 crop ended.
Since the study conducted in 2014 was already with the basis in March 2014, it was necessary to transform the study in 2009 to the basis of March 2014. This transformation was carried out in three steps: (I) the conversion of the values presented in the study in 2009 of dollar (US$) to real (R$), (II) the transformation of nominal values into current values based on March 2014, and (III) the conversion of the values of both studies in dollars.
The conversion of dollar to real, from the values regarding the quantification of 2008/2009, was made using the formula:
In which, VR$ = values in real (R$); VUS$ = values in dollar (US$); Cd = dollar exchange rate used in the 2009 study.
Then the transformation of the values in the 2009 study was made to current values with basis on March 2014. This transformation was carried out by inflating the values in 2009. It was used as a deflator index one of the indexes which measures inflation in Brazil, which is the General Price Index-Internal Availability (IGP-DI). The formula used in the transformation in the present values of March 2014 was:
2 Vr14 = Vn9 x ∑ (In13 + In12 + In11 + In10)
1 VR$ = VUS$ x Cd
In which, Vr14 = Current value in March 2014; Vn9 = Nominal value in 2009; In13 = IGP-DI collected in 2013; In12= IGP-DI collected in 2012; In11= IGP-DI collected in 2011; In10= IGP-DI collected in 2010.
After bringing the values in 2009 and 2014 to current values in the same comparative basis, the values were converted to US trade dollar using the average sale price in the 2013/14 crop, equivalent to US$ 1 = R$ 2.25, in order to give a comprehensive understanding of the scale of values. The conversion was carried out as follows:
In which, VR$ = values in real (R$); VUS$ = values in dollar (US$); Cd = dollar exchange rate used in the study in 2014.
Thus, this stage of the research results in the current values in the same comparative basis (March 2014) of the quantifications of 2008/2009 and 2013/2014 crops.
3.3 PHASE 3. COMPARATIVE ANALYSIS OF THE RESULTS OF THE 2008/2009 AND 2013/2014 CROPS
After the standardization of the numbers for the same comparison basis, the variation of the results for the period was calculated. The formula used to calculate the variation was:
And = Variation from 2009 to 2014; V14 = current values of the 2013/14 crop; V09 = current values of the 2009/08 crop.
The results were organized in a table for later analysis.
RESULTS
The variables selected for comparison of the studies were organized in Table 2. When analyzing the result found in 2008/2009 crop and comparing it with 2013/2014, it is concluded that the GDP of the sugarcane industry increased 44%, with the inflation already corrected from the IGP-DI. Although GDP increased, it can not be stated that the industry has shown better performance as a whole.
In this study, GDP was calculated from the sum of final sales of the production chain, that is, the total turnover generated by exports and sales of final products in the domestic market, thus it is directly influenced by the price and the quantity sold of final products. Another way to calculate GDP is by the sum of value added at each transaction. Due to the lack of this information, the calculation of GDP was carried out through the sales of its final products.
When performing a comparative analysis of prices between 2008/2009 and 2013/2014 crops, it was noted that, in the case of sugar,
3 VUS$ = VR$ ÷ Cd
4 V14 - V 09V 09=
68 69
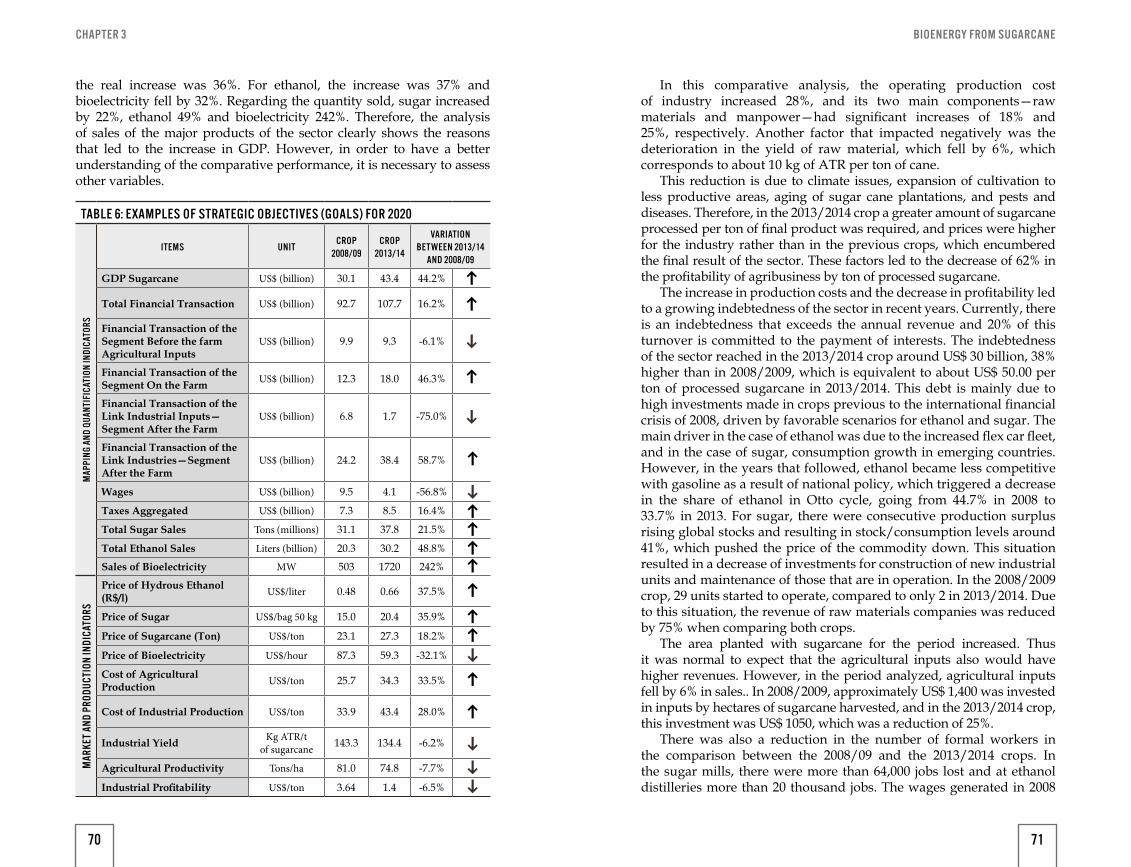
BIOENERGY FROM SUGARCANECHAPTER 3
the real increase was 36%. For ethanol, the increase was 37% and bioelectricity fell by 32%. Regarding the quantity sold, sugar increased by 22%, ethanol 49% and bioelectricity 242%. Therefore, the analysis of sales of the major products of the sector clearly shows the reasons that led to the increase in GDP. However, in order to have a better understanding of the comparative performance, it is necessary to assess other variables.
TABLE 6: EXAMPLES OF STRATEGIC OBJECTIVES (GOALS) FOR 2020
MAP
PING
AND
QUA
NTIF
ICAT
ION
INDI
CATO
RS
ITEMS UNITCROP
2008/09CROP
2013/14
VARIATION BET WEEN 2013/14
AND 2008/09
GDP Sugarcane US$ (billion) 30.1 43.4 44.2%
Total Financial Transaction US$ (billion) 92.7 107.7 16.2%
Financial Transaction of the Segment Before the farm Agricultural Inputs
US$ (billion) 9.9 9.3 -6.1%
Financial Transaction of the Segment On the Farm US$ (billion) 12.3 18.0 46.3%
Financial Transaction of the Link Industrial Inputs—Segment After the Farm
US$ (billion) 6.8 1.7 -75.0%
Financial Transaction of the Link Industries—Segment After the Farm
US$ (billion) 24.2 38.4 58.7%
Wages US$ (billion) 9.5 4.1 -56.8%
Taxes Aggregated US$ (billion) 7.3 8.5 16.4%
Total Sugar Sales Tons (millions) 31.1 37.8 21.5%
Total Ethanol Sales Liters (billion) 20.3 30.2 48.8%
Sales of Bioelectricity MW 503 1720 242%
MAR
KET A
ND P
RODU
CTIO
N IN
DICA
TORS
Price of Hydrous Ethanol (R$/l) US$/liter 0.48 0.66 37.5%
Price of Sugar US$/bag 50 kg 15.0 20.4 35.9%
Price of Sugarcane (Ton) US$/ton 23.1 27.3 18.2%
Price of Bioelectricity US$/hour 87.3 59.3 -32.1%
Cost of Agricultural Production US$/ton 25.7 34.3 33.5%
Cost of Industrial Production US$/ton 33.9 43.4 28.0%
Industrial Yield Kg ATR/tof sugarcane 143.3 134.4 -6.2%
Agricultural Productivity Tons/ha 81.0 74.8 -7.7%
Industrial Profitability US$/ton 3.64 1.4 -6.5%
In this comparative analysis, the operating production cost of industry increased 28%, and its two main components—raw materials and manpower—had significant increases of 18% and 25%, respectively. Another factor that impacted negatively was the deterioration in the yield of raw material, which fell by 6%, which corresponds to about 10 kg of ATR per ton of cane.
This reduction is due to climate issues, expansion of cultivation to less productive areas, aging of sugar cane plantations, and pests and diseases. Therefore, in the 2013/2014 crop a greater amount of sugarcane processed per ton of final product was required, and prices were higher for the industry rather than in the previous crops, which encumbered the final result of the sector. These factors led to the decrease of 62% in the profitability of agribusiness by ton of processed sugarcane.
The increase in production costs and the decrease in profitability led to a growing indebtedness of the sector in recent years. Currently, there is an indebtedness that exceeds the annual revenue and 20% of this turnover is committed to the payment of interests. The indebtedness of the sector reached in the 2013/2014 crop around US$ 30 billion, 38% higher than in 2008/2009, which is equivalent to about US$ 50.00 per ton of processed sugarcane in 2013/2014. This debt is mainly due to high investments made in crops previous to the international financial crisis of 2008, driven by favorable scenarios for ethanol and sugar. The main driver in the case of ethanol was due to the increased flex car fleet, and in the case of sugar, consumption growth in emerging countries. However, in the years that followed, ethanol became less competitive with gasoline as a result of national policy, which triggered a decrease in the share of ethanol in Otto cycle, going from 44.7% in 2008 to 33.7% in 2013. For sugar, there were consecutive production surplus rising global stocks and resulting in stock/consumption levels around 41%, which pushed the price of the commodity down. This situation resulted in a decrease of investments for construction of new industrial units and maintenance of those that are in operation. In the 2008/2009 crop, 29 units started to operate, compared to only 2 in 2013/2014. Due to this situation, the revenue of raw materials companies was reduced by 75% when comparing both crops.
The area planted with sugarcane for the period increased. Thus it was normal to expect that the agricultural inputs also would have higher revenues. However, in the period analyzed, agricultural inputs fell by 6% in sales.. In 2008/2009, approximately US$ 1,400 was invested in inputs by hectares of sugarcane harvested, and in the 2013/2014 crop, this investment was US$ 1050, which was a reduction of 25%.
There was also a reduction in the number of formal workers in the comparison between the 2008/09 and the 2013/2014 crops. In the sugar mills, there were more than 64,000 jobs lost and at ethanol distilleries more than 20 thousand jobs. The wages generated in 2008
70 71
BIOENERGY FROM SUGARCANECHAPTER 3
was about US$ 9.5 billion discounted to present values and although there were improvement in the average income of workers in the last four years, it a decrease in payrolls was found in the last crop due to the reduction of jobs. In 2013, the wage mass of the sector was US$ 4.13 billion, which corresponded to a decrease of 57%.
The variables selected allow us to analyze that, despite the sectoral GDP in 2013/2014 crop being higher than the 2008/2009 crop, not all links of the agro-industrial system presented growth. According to Neves and Trombin (2014), since 2009, about 50 industrial units in the south central region closed their operations in their last seven crops, and in the 2014/2015 crop, 10 units may suspend the activities.
CONCLUSIONS
The application of the method of Planning and Strategic Management of Agro-industrial Systems (GESis) was positive for both years. The fact that the method is flexible enabled a more coherent application in the sugarcane sector. Necessary adjustments to the reality of the sector were made in its first application in 2009. In 2014, the GESis was replicated with the adaptations already made in 2009. The method enabled to clearly see the performance of all the links that make up the agro-industrial system, analyzing which weakened and which improved for possible action proposals. It was possible to carry out a comparison between the two applications and measure the performance of the sector in the period since the values used were calculated by the same method, allowing a comparison basis.
It was concluded that the method Strategic Planning and Management of Agribusiness Systems (GESis) proved to be an important tool to analyze the performance of an agro-industrial system, pointing possible areas for improvement and opportunities in the system.
In this research only the values obtained in studies conducted in 2009 and 2014 were analyzed, which represented a limitation. An in-depth and qualitative research, aiming to understand the reasons that led to the performance of all variables analyzed would be important to have a deeper understanding of the sector’s development.
In the case of the sugarcane industry, which is the target of this research, it was concluded that the comparison between both studies contributes to both better visualization of the evolution of the sugarcane industry and a better understanding of situational reality of the sector. In the interval between one study and another, the ethanol stimulus policy that was in force at the time of the first quantification, encouraged farmers to increase sugarcane plantations and industries to install new processing units. Thus producers and industries that were
excited about the direction the government was addressing ethanol to have made the sugarcane industry grow in size and the production increased in the field and industry, leading to an increase in business along the chain and hence the increase in sectoral GDP.
However, when analyzing the economic reality, it was realized that the situation is no longer of growth as it was in that year because the sector’s competitiveness worsened mainly as a consequence of the artificially low price of gasoline held by the current government. The sugarcane industry that was considered one of the most successful for the national economy is now undergoing a crisis. In less than four years, there was a complete discontinuation of ethanol stimulus policy, resulting in widespread disbelief and low expectations about what can be offered, since there is no consistent long-term policy for fuels in Brazil.
By not encouraging the sugarcane industry, the government fails not only to stimulate the production of a fuel that pollutes 90% less than gasoline, but also reduces the possibility of several municipalities to experience impressive growth and hence improvement in the life quality of the population. A sector that has always been important for the economic development of Brazil now deserves greater attention, with clear policies and incentives to be effective as in the past.
72 73
BIOENERGY FROM SUGARCANE
BY MARCOS FAVA NEVES, RAFAEL BORDONAL KALAKI, MAIRUN JUNQUEIRA ALVES PINTO AND TASSIA GERBASI
SUGAR CANE AS A PROMOTER OF DEVELOPMENT: THE CASES OF QUIRINÓPOLIS AND UBERABA
4
Originally published in International Food and Agribusiness Symposium and Forum: Peo-ple Feed the World, 2014, Cape-Town, Africa.
BIOENERGY FROM SUGARCANE
INTRODUCTION
Since the primary and fundamental activity of food production, to the functioning of the most varied and technological economic sectors of a nation, energy is a key element. The global energy matrix consists of renewable and non-renewable fuels, which according to their availability, supply increasing fleets of vehicles and machinery used to move the economy and to enable economic and social development. In this scenario of full development, there are some fundamental issues: How to deal with resource scarcity? How to meet the demand, meeting the present needs without compromising the capacity of future generations?
Part of the answers is in sustainability practices and in the use of renewable energy sources, such as agro energy. According to MAPA (Ministry of Agriculture, Livestock and Supply), energy security is a major challenge of the century. The importance of energy security has focus on the challenge of supplying the development with clean energy, using renewable resources, having economic and environmental importance.
In this scenario, the Brazilian sugar-energy sector shows its strength, producing different forms of sustainable and renewable agro energy (sugar, ethanol and electricity), which are able to meet this demand without compromising the environment and availability for future generations. To address this issue, some points deserve much attention such as the importance of social and economic development, entrepreneurship, contractual relationships, independent producers and respect for the worker and the environment.
In 2012, Brazil was the world's largest producer of sugar cane with a share of 37.8%. Regarding sugar production, the country is the largest producer with 22.1% of the total and the largest exporter with a share of 48.7% in total exports. In ethanol production, the country occupied the position of the second largest producer with a total of 27.8%. (FAO, 2013).
The importance of the sugar-energy sector in Brazil is historic, dating from the time of colonization, and later walking side by side with the development of the country. Also, it is one of the mainstays of the Brazilian economy. The sector has a strong impact as a generator of wealth for the nation, with a balance of US$ 28.2 billion in 2008, which was equivalent to approximately 2% of Brazil's GDP. This value is greater than the GDP of some countries such as Afghanistan, Jamaica and Estonia. Considering the total sum of the sales of the various links that make up the sugar cane agribusiness system, it was worth US$ 86.8 billion. The trend is that these values will continue to increase whereas other products, which today are not the main sources of income, gain more importance in the generation of wealth in sectors such as
77
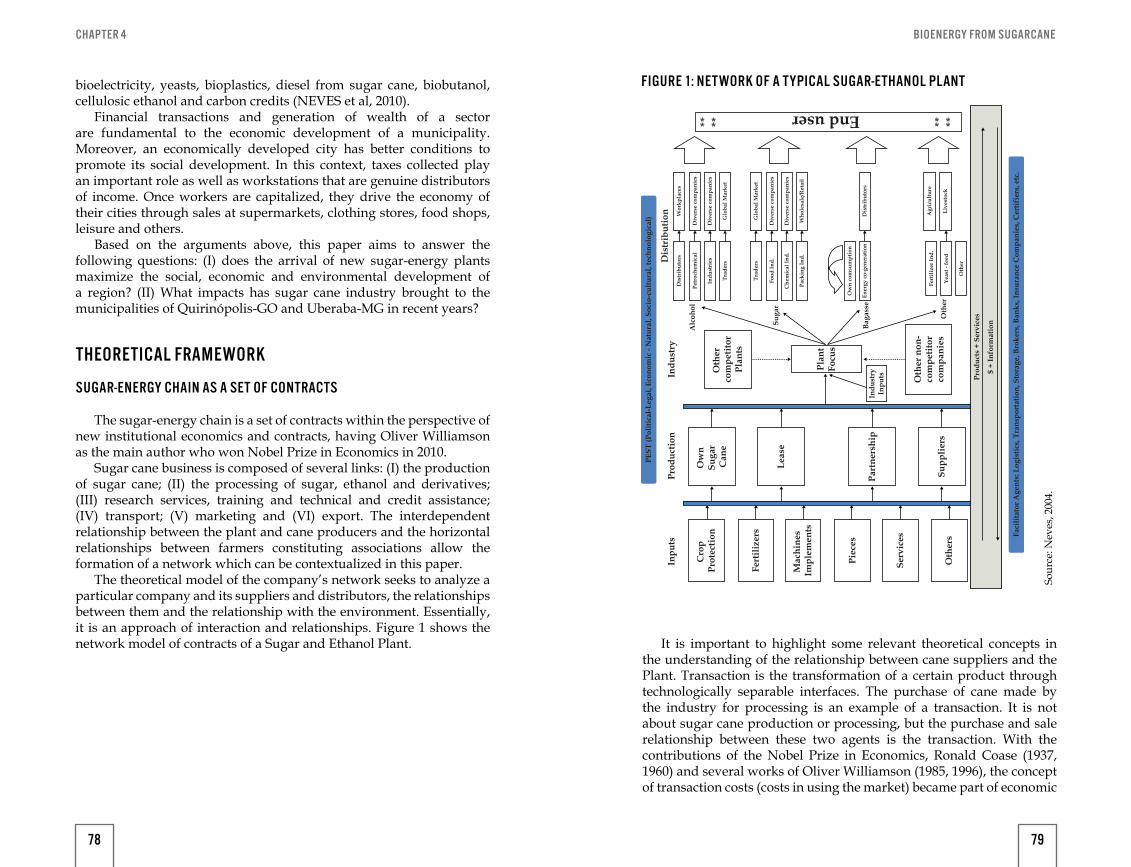
BIOENERGY FROM SUGARCANECHAPTER 4
bioelectricity, yeasts, bioplastics, diesel from sugar cane, biobutanol, cellulosic ethanol and carbon credits (NEVES et al, 2010).
Financial transactions and generation of wealth of a sector are fundamental to the economic development of a municipality. Moreover, an economically developed city has better conditions to promote its social development. In this context, taxes collected play an important role as well as workstations that are genuine distributors of income. Once workers are capitalized, they drive the economy of their cities through sales at supermarkets, clothing stores, food shops, leisure and others.
Based on the arguments above, this paper aims to answer the following questions: (I) does the arrival of new sugar-energy plants maximize the social, economic and environmental development of a region? (II) What impacts has sugar cane industry brought to the municipalities of Quirinópolis-GO and Uberaba-MG in recent years?
THEORETICAL FRAMEWORK
SUGAR-ENERGY CHAIN AS A SET OF CONTRACTS
The sugar-energy chain is a set of contracts within the perspective of new institutional economics and contracts, having Oliver Williamson as the main author who won Nobel Prize in Economics in 2010.
Sugar cane business is composed of several links: (I) the production of sugar cane; (II) the processing of sugar, ethanol and derivatives; (III) research services, training and technical and credit assistance; (IV) transport; (V) marketing and (VI) export. The interdependent relationship between the plant and cane producers and the horizontal relationships between farmers constituting associations allow the formation of a network which can be contextualized in this paper.
The theoretical model of the company’s network seeks to analyze a particular company and its suppliers and distributors, the relationships between them and the relationship with the environment. Essentially, it is an approach of interaction and relationships. Figure 1 shows the network model of contracts of a Sugar and Ethanol Plant. It is important to highlight some relevant theoretical concepts in
the understanding of the relationship between cane suppliers and the Plant. Transaction is the transformation of a certain product through technologically separable interfaces. The purchase of cane made by the industry for processing is an example of a transaction. It is not about sugar cane production or processing, but the purchase and sale relationship between these two agents is the transaction. With the contributions of the Nobel Prize in Economics, Ronald Coase (1937, 1960) and several works of Oliver Williamson (1985, 1996), the concept of transaction costs (costs in using the market) became part of economic
Inpu
tsPr
oduc
tion
Indu
stry
$ +
Info
rmat
ion
Prod
ucts
+ S
ervi
ces
Supp
liers
Part
ners
hip
Leas
e
Ow
n Su
gar
Can
eO
ther
co
mpe
titor
Plan
ts
Plan
tFo
cus
Oth
er n
on-
com
petit
orco
mpa
nies
Indu
stry
Inpu
ts
Oth
er
Baga
sse
Suga
r
Alc
ohol
Dis
trib
utor
s
Petr
oche
mic
alD
iver
se c
ompa
nies
Indu
stri
es
Trad
ers
Wor
kpla
ces
Div
erse
com
pani
es
Glo
bal M
arke
t
Trad
ers
Food
Ind.
Che
mic
al In
d.
Pack
ing
Ind.
Glo
bal M
arke
t
Div
erse
com
pani
es
Div
erse
com
pani
es
Who
lesa
le/R
etai
l
Ow
n co
msu
mpt
ion
Ener
gy c
o-ge
nera
tion
Fert
ilize
r Ind
.
Yeas
t - fe
ed
Oth
er
Live
stoc
k
Agr
icul
ture
Dis
trib
utor
s
** ** ** **
Dis
trib
utio
n
PEST
(Pol
itica
l-Leg
al, E
cono
mic
- N
atur
al, S
ocio
-cul
tura
l, te
chno
logi
cal)
Faci
litat
or A
gent
s: L
ogis
tics,
Tra
nspo
rtat
ion,
Sto
rage
, Bro
kers
, Ban
ks, I
nsur
ance
Com
pani
es, C
ertif
iers
, etc
.
Cro
p Pr
otec
tion
Fert
ilize
rs
Mac
hine
s Im
plem
ents
Piec
es
Serv
ices
Oth
ers
End user
FIGURE 1: NET WORK OF A TYPICAL SUGAR-ETHANOL PLANT
Sour
ce: N
eves
, 200
4.
78 79
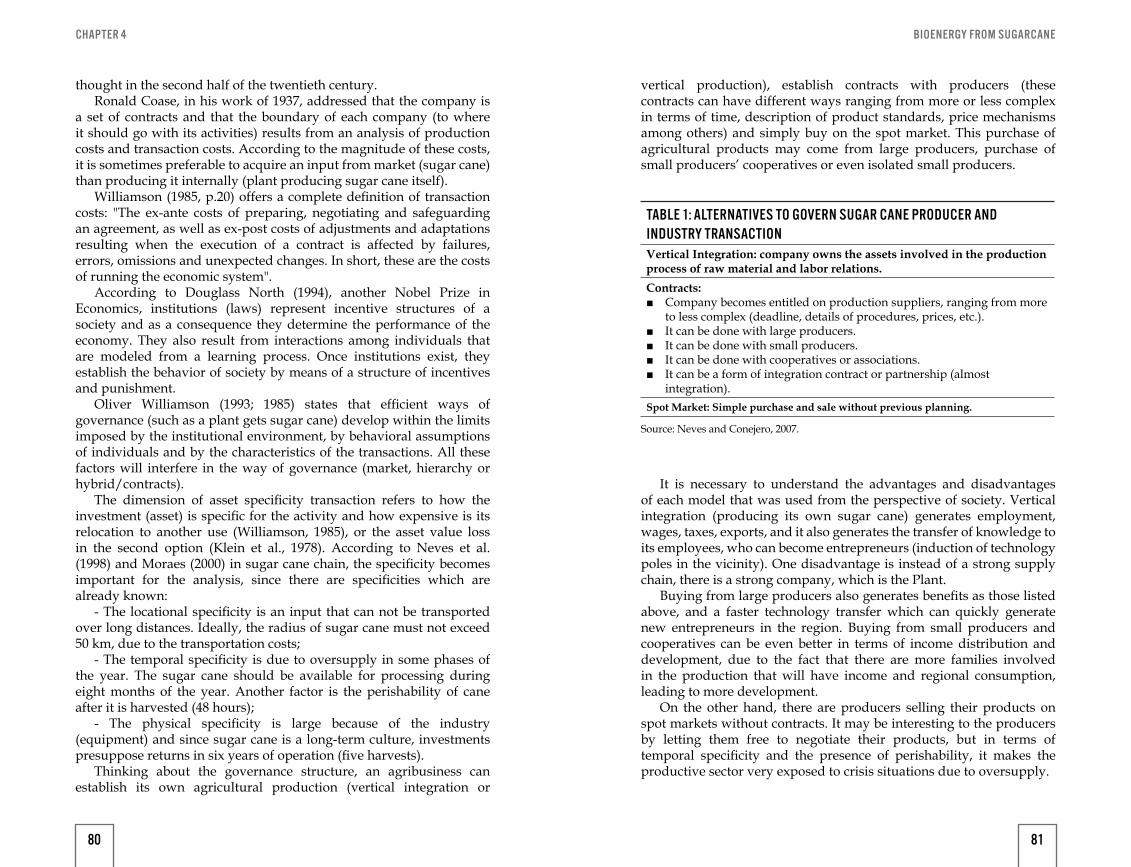
BIOENERGY FROM SUGARCANECHAPTER 4
thought in the second half of the twentieth century.Ronald Coase, in his work of 1937, addressed that the company is
a set of contracts and that the boundary of each company (to where it should go with its activities) results from an analysis of production costs and transaction costs. According to the magnitude of these costs, it is sometimes preferable to acquire an input from market (sugar cane) than producing it internally (plant producing sugar cane itself).
Williamson (1985, p.20) offers a complete definition of transaction costs: "The ex-ante costs of preparing, negotiating and safeguarding an agreement, as well as ex-post costs of adjustments and adaptations resulting when the execution of a contract is affected by failures, errors, omissions and unexpected changes. In short, these are the costs of running the economic system".
According to Douglass North (1994), another Nobel Prize in Economics, institutions (laws) represent incentive structures of a society and as a consequence they determine the performance of the economy. They also result from interactions among individuals that are modeled from a learning process. Once institutions exist, they establish the behavior of society by means of a structure of incentives and punishment.
Oliver Williamson (1993; 1985) states that efficient ways of governance (such as a plant gets sugar cane) develop within the limits imposed by the institutional environment, by behavioral assumptions of individuals and by the characteristics of the transactions. All these factors will interfere in the way of governance (market, hierarchy or hybrid/contracts).
The dimension of asset specificity transaction refers to how the investment (asset) is specific for the activity and how expensive is its relocation to another use (Williamson, 1985), or the asset value loss in the second option (Klein et al., 1978). According to Neves et al. (1998) and Moraes (2000) in sugar cane chain, the specificity becomes important for the analysis, since there are specificities which are already known:
- The locational specificity is an input that can not be transported over long distances. Ideally, the radius of sugar cane must not exceed 50 km, due to the transportation costs;
- The temporal specificity is due to oversupply in some phases of the year. The sugar cane should be available for processing during eight months of the year. Another factor is the perishability of cane after it is harvested (48 hours);
- The physical specificity is large because of the industry (equipment) and since sugar cane is a long-term culture, investments presuppose returns in six years of operation (five harvests).
Thinking about the governance structure, an agribusiness can establish its own agricultural production (vertical integration or
vertical production), establish contracts with producers (these contracts can have different ways ranging from more or less complex in terms of time, description of product standards, price mechanisms among others) and simply buy on the spot market. This purchase of agricultural products may come from large producers, purchase of small producers’ cooperatives or even isolated small producers.
TABLE 1: ALTERNATIVES TO GOVERN SUGAR CANE PRODUCER AND INDUSTRY TRANSACTION Vertical Integration: company owns the assets involved in the production process of raw material and labor relations.Contracts:
■ Company becomes entitled on production suppliers, ranging from more to less complex (deadline, details of procedures, prices, etc.).
■ It can be done with large producers. ■ It can be done with small producers. ■ It can be done with cooperatives or associations. ■ It can be a form of integration contract or partnership (almost
integration).Spot Market: Simple purchase and sale without previous planning.
Source: Neves and Conejero, 2007.
It is necessary to understand the advantages and disadvantages of each model that was used from the perspective of society. Vertical integration (producing its own sugar cane) generates employment, wages, taxes, exports, and it also generates the transfer of knowledge to its employees, who can become entrepreneurs (induction of technology poles in the vicinity). One disadvantage is instead of a strong supply chain, there is a strong company, which is the Plant.
Buying from large producers also generates benefits as those listed above, and a faster technology transfer which can quickly generate new entrepreneurs in the region. Buying from small producers and cooperatives can be even better in terms of income distribution and development, due to the fact that there are more families involved in the production that will have income and regional consumption, leading to more development.
On the other hand, there are producers selling their products on spot markets without contracts. It may be interesting to the producers by letting them free to negotiate their products, but in terms of temporal specificity and the presence of perishability, it makes the productive sector very exposed to crisis situations due to oversupply.
80 81
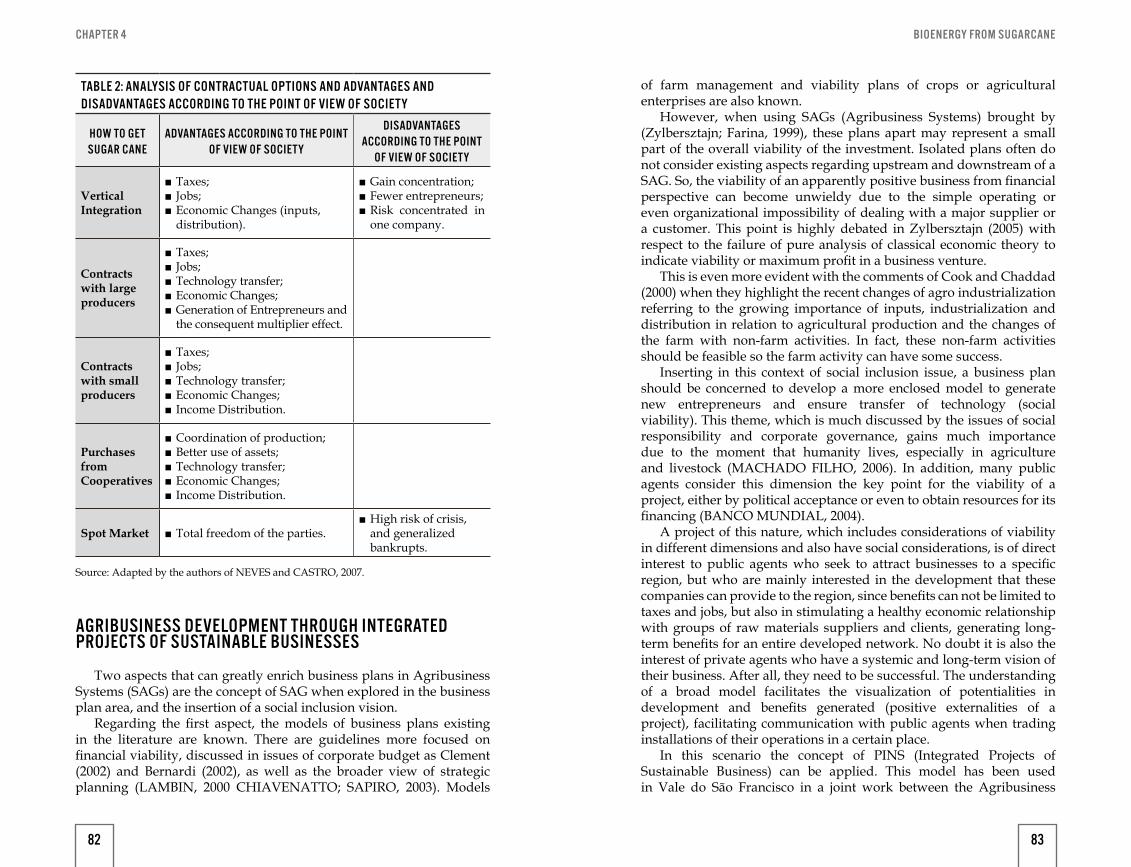
BIOENERGY FROM SUGARCANECHAPTER 4
TABLE 2: ANALYSIS OF CONTRACTUAL OPTIONS AND ADVANTAGES AND DISADVANTAGES ACCORDING TO THE POINT OF VIEW OF SOCIETY
HOW TO GET SUGAR CANE
ADVANTAGES ACCORDING TO THE POINT OF VIEW OF SOCIETY
DISADVANTAGES ACCORDING TO THE POINT
OF VIEW OF SOCIETY
Vertical Integration
■ Taxes; ■ Jobs; ■ Economic Changes (inputs, distribution).
■ Gain concentration; ■ Fewer entrepreneurs; ■ Risk concentrated in one company.
Contracts with large producers
■ Taxes; ■ Jobs; ■ Technology transfer; ■ Economic Changes; ■ Generation of Entrepreneurs and the consequent multiplier effect.
Contracts with small producers
■ Taxes; ■ Jobs; ■ Technology transfer; ■ Economic Changes; ■ Income Distribution.
Purchases from Cooperatives
■ Coordination of production; ■ Better use of assets; ■ Technology transfer; ■ Economic Changes; ■ Income Distribution.
Spot Market ■ Total freedom of the parties. ■ High risk of crisis, and generalized bankrupts.
Source: Adapted by the authors of NEVES and CASTRO, 2007.
AGRIBUSINESS DEVELOPMENT THROUGH INTEGRATED PROJECTS OF SUSTAINABLE BUSINESSES
Two aspects that can greatly enrich business plans in Agribusiness Systems (SAGs) are the concept of SAG when explored in the business plan area, and the insertion of a social inclusion vision.
Regarding the first aspect, the models of business plans existing in the literature are known. There are guidelines more focused on financial viability, discussed in issues of corporate budget as Clement (2002) and Bernardi (2002), as well as the broader view of strategic planning (LAMBIN, 2000 CHIAVENATTO; SAPIRO, 2003). Models
of farm management and viability plans of crops or agricultural enterprises are also known.
However, when using SAGs (Agribusiness Systems) brought by (Zylbersztajn; Farina, 1999), these plans apart may represent a small part of the overall viability of the investment. Isolated plans often do not consider existing aspects regarding upstream and downstream of a SAG. So, the viability of an apparently positive business from financial perspective can become unwieldy due to the simple operating or even organizational impossibility of dealing with a major supplier or a customer. This point is highly debated in Zylbersztajn (2005) with respect to the failure of pure analysis of classical economic theory to indicate viability or maximum profit in a business venture.
This is even more evident with the comments of Cook and Chaddad (2000) when they highlight the recent changes of agro industrialization referring to the growing importance of inputs, industrialization and distribution in relation to agricultural production and the changes of the farm with non-farm activities. In fact, these non-farm activities should be feasible so the farm activity can have some success.
Inserting in this context of social inclusion issue, a business plan should be concerned to develop a more enclosed model to generate new entrepreneurs and ensure transfer of technology (social viability). This theme, which is much discussed by the issues of social responsibility and corporate governance, gains much importance due to the moment that humanity lives, especially in agriculture and livestock (MACHADO FILHO, 2006). In addition, many public agents consider this dimension the key point for the viability of a project, either by political acceptance or even to obtain resources for its financing (BANCO MUNDIAL, 2004).
A project of this nature, which includes considerations of viability in different dimensions and also have social considerations, is of direct interest to public agents who seek to attract businesses to a specific region, but who are mainly interested in the development that these companies can provide to the region, since benefits can not be limited to taxes and jobs, but also in stimulating a healthy economic relationship with groups of raw materials suppliers and clients, generating long-term benefits for an entire developed network. No doubt it is also the interest of private agents who have a systemic and long-term vision of their business. After all, they need to be successful. The understanding of a broad model facilitates the visualization of potentialities in development and benefits generated (positive externalities of a project), facilitating communication with public agents when trading installations of their operations in a certain place.
In this scenario the concept of PINS (Integrated Projects of Sustainable Business) can be applied. This model has been used in Vale do São Francisco in a joint work between the Agribusiness
82 83
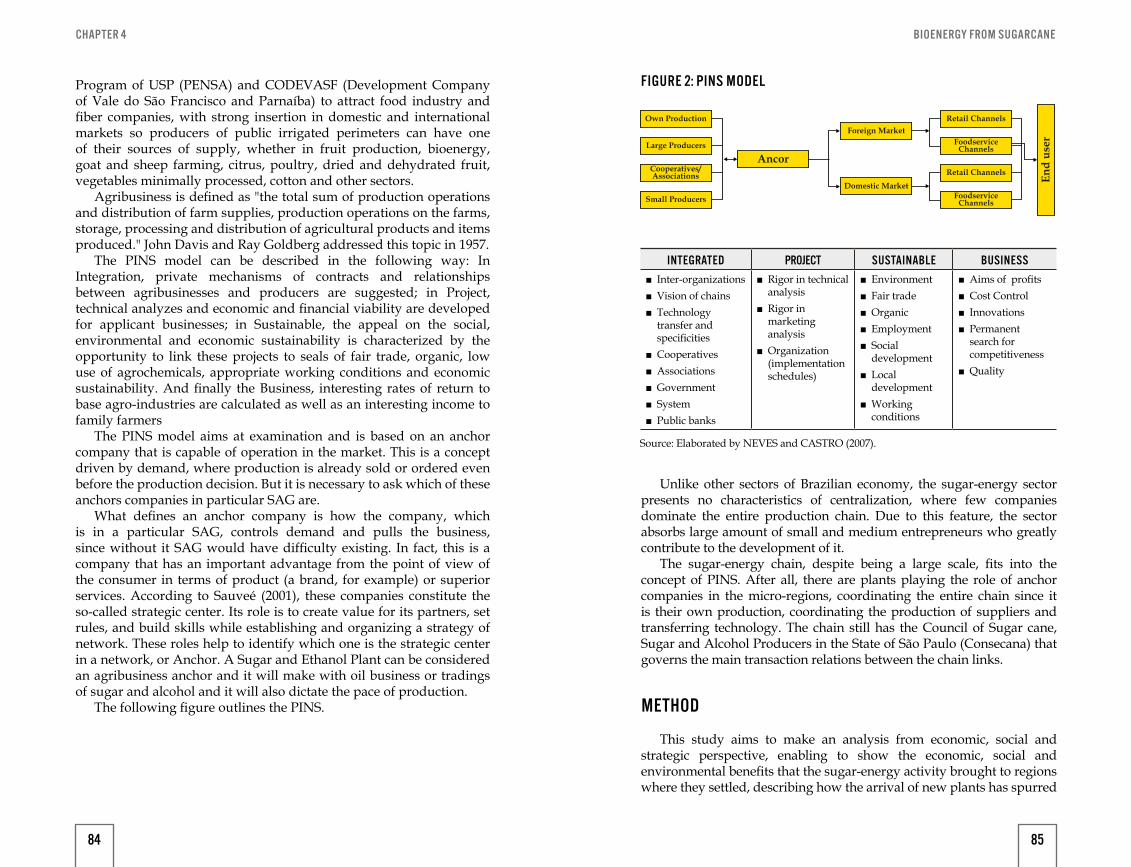
BIOENERGY FROM SUGARCANECHAPTER 4
Program of USP (PENSA) and CODEVASF (Development Company of Vale do São Francisco and Parnaíba) to attract food industry and fiber companies, with strong insertion in domestic and international markets so producers of public irrigated perimeters can have one of their sources of supply, whether in fruit production, bioenergy, goat and sheep farming, citrus, poultry, dried and dehydrated fruit, vegetables minimally processed, cotton and other sectors.
Agribusiness is defined as "the total sum of production operations and distribution of farm supplies, production operations on the farms, storage, processing and distribution of agricultural products and items produced." John Davis and Ray Goldberg addressed this topic in 1957.
The PINS model can be described in the following way: In Integration, private mechanisms of contracts and relationships between agribusinesses and producers are suggested; in Project, technical analyzes and economic and financial viability are developed for applicant businesses; in Sustainable, the appeal on the social, environmental and economic sustainability is characterized by the opportunity to link these projects to seals of fair trade, organic, low use of agrochemicals, appropriate working conditions and economic sustainability. And finally the Business, interesting rates of return to base agro-industries are calculated as well as an interesting income to family farmers
The PINS model aims at examination and is based on an anchor company that is capable of operation in the market. This is a concept driven by demand, where production is already sold or ordered even before the production decision. But it is necessary to ask which of these anchors companies in particular SAG are.
What defines an anchor company is how the company, which is in a particular SAG, controls demand and pulls the business, since without it SAG would have difficulty existing. In fact, this is a company that has an important advantage from the point of view of the consumer in terms of product (a brand, for example) or superior services. According to Sauveé (2001), these companies constitute the so-called strategic center. Its role is to create value for its partners, set rules, and build skills while establishing and organizing a strategy of network. These roles help to identify which one is the strategic center in a network, or Anchor. A Sugar and Ethanol Plant can be considered an agribusiness anchor and it will make with oil business or tradings of sugar and alcohol and it will also dictate the pace of production.
The following figure outlines the PINS.
Unlike other sectors of Brazilian economy, the sugar-energy sector presents no characteristics of centralization, where few companies dominate the entire production chain. Due to this feature, the sector absorbs large amount of small and medium entrepreneurs who greatly contribute to the development of it.
The sugar-energy chain, despite being a large scale, fits into the concept of PINS. After all, there are plants playing the role of anchor companies in the micro-regions, coordinating the entire chain since it is their own production, coordinating the production of suppliers and transferring technology. The chain still has the Council of Sugar cane, Sugar and Alcohol Producers in the State of São Paulo (Consecana) that governs the main transaction relations between the chain links.
METHOD
This study aims to make an analysis from economic, social and strategic perspective, enabling to show the economic, social and environmental benefits that the sugar-energy activity brought to regions where they settled, describing how the arrival of new plants has spurred
Small Producers
Own Production
Large Producers
Cooperatives/Associations
Ancor
Foreign Market
Domestic Market
Retail Channels
FoodserviceChannels
Retail Channels
FoodserviceChannels
End
user
INTEGRATED PROJECT SUSTAINABLE BUSINESS ■ Inter-organizations ■ Vision of chains ■ Technology transfer and specificities
■ Cooperatives ■ Associations ■ Government ■ System ■ Public banks
■ Rigor in technical analysis
■ Rigor in marketing analysis
■ Organization (implementation schedules)
■ Environment ■ Fair trade ■ Organic ■ Employment ■ Social development
■ Local development
■ Working conditions
■ Aims of profits ■ Cost Control ■ Innovations ■ Permanent search for competitiveness
■ Quality
FIGURE 2: PINS MODEL
Source: Elaborated by NEVES and CASTRO (2007).
84 85
BIOENERGY FROM SUGARCANECHAPTER 4
economic, environmental and social activities of a region bringing several benefits.
To achieve the objective of this paper, the study was conducted in three phases:
PHASE 1. SECONDARY DATA SURVEY: This stage consisted of gathering information from secondary sources
of the sector. Two techniques for gathering information, which are the desk research and documental analysis, were used at this stage:
Desk Research: a secondary data survey was performed through data sources from government, industry agents, research papers, journals and other data sources. These data include both the Brazilian industry and the municipalities of Quirinópolis and Uberaba.
Documental analysis: an existing documentary survey was conducted in the region, highlighting documents of Associations, Unions, SJC Plants, Uberaba, Vale do Tijuco, Grupo Delta, documents of the City of Quirinópolis and Uberaba and the Government of the States of Goiás and Minas Gerais , the Rural Syndicate, written materials about the region, and other documents which the researchers had access.
PHASE 2. PRIMARY DATA SURVEY: This stage consisted of gathering information from primary sources
in the industry. The in-depth interview technique was used in this phase.In-depth interviews: In the city of Quirinópolis interviews were
conducted in October 2012 with mayors, bank managers, independent sugar cane producers, associations of producers, plants, and other agents. In Uberaba, in-depth interviews occurred in September 2013, covering various economic agents in the region such as employees of Delta plants, Vale do Tijuco and Uberaba, the president of the Rural Syndicate, the Environment Secretary, the Agriculture Secretary, independent sugar cane producers, SENAR, SENAI, SEBRAE, Commercial and Industrial Association of Uberaba, plants, among others.
PHASE 3. CONSOLIDATION OF RESULTS: With the information from primary and secondary sources, data
consolidations and the analysis of the main information found were carried out aiming to show the impacts of the sugar-energy sector in the municipalities of Quirinópolis and Uberaba.
RESULTS AND DISCUSSIONSInitially it is necessary to describe the location of the cities studied.
Quirinópolis is located in the state of Goiás, in the central-west region of Brazil, 900 km from the city of São Paulo, while Uberaba is located in the state of Minas Gerais, in the southeast of the country, about 485 km from the city of São Paulo.
The State of Goiás is the second largest producer of sugar cane in the country, with 9.0% of the total produced in Brazil. The municipality of Quirinópolis, on the other hand, is the largest producer in the State of Goiás with a production of 13.5% (UNICA; CONAB 2013). The state of Minas Gerais is the third largest producer of cane sugar in the country with a share of 8.8% in domestic production. The city of Uberaba has a sugar cane production of 5.26 million tons in a planted area of 80,000 hectares, being the largest producer of sugar cane in the State of Minas Gerais, with a share of 6.5% and a grinding representing 10.7% of total grinding of State (UNICA; CANASAT 2013).
The benefits of the sugar-energy sector in these regions range from direct benefits such as generating jobs and taxes to indirect benefits such as the development of the local economy. The following will highlight some of these goals.
SOCIAL DEVELOPMENT
Within the social contributions, some advances provided by the arrival of sugarcane in these regions must be highlighted such as jobs created, qualification of manpower, improvement in wages (highlighted in Table 1) and income distribution. These points respond
FIGURE 1 - LOCATION OF THE MUNICIPALITY AND DIMENSION OF THE STUDY
Source: Elaborated by the authors.
86 87
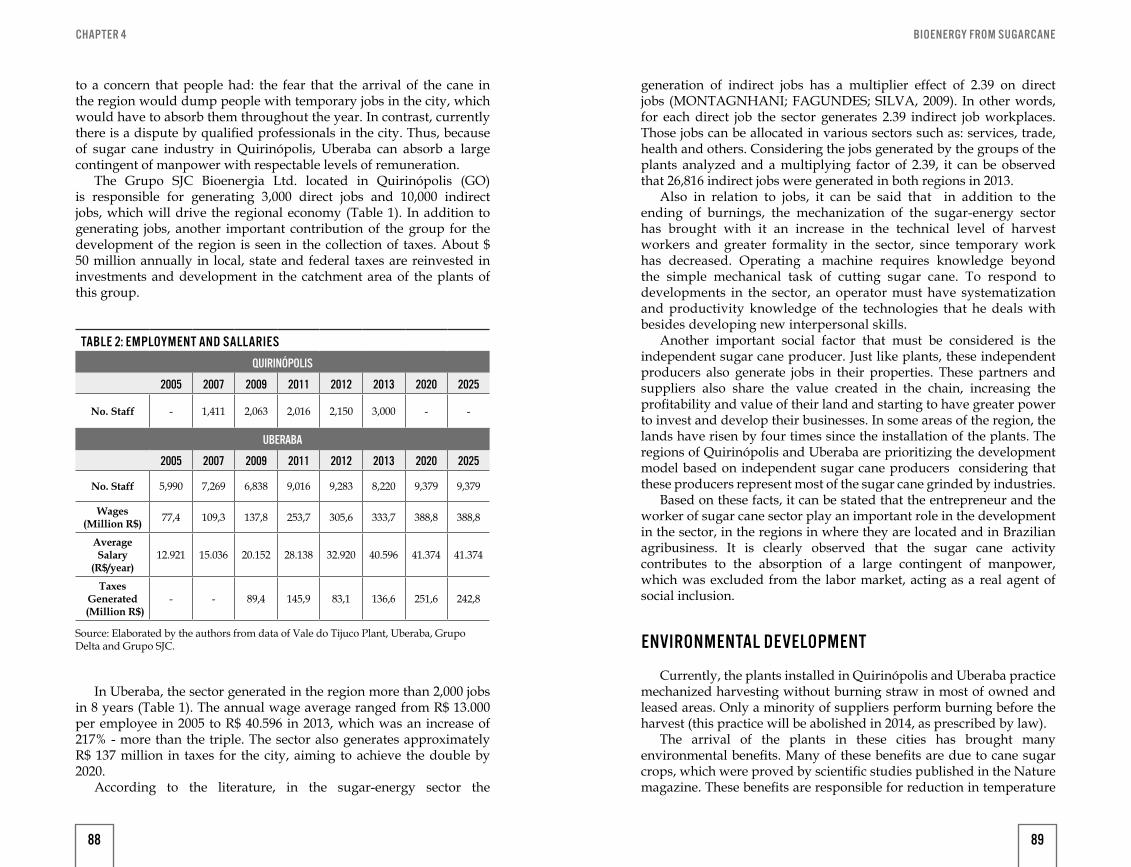
BIOENERGY FROM SUGARCANECHAPTER 4
to a concern that people had: the fear that the arrival of the cane in the region would dump people with temporary jobs in the city, which would have to absorb them throughout the year. In contrast, currently there is a dispute by qualified professionals in the city. Thus, because of sugar cane industry in Quirinópolis, Uberaba can absorb a large contingent of manpower with respectable levels of remuneration.
The Grupo SJC Bioenergia Ltd. located in Quirinópolis (GO) is responsible for generating 3,000 direct jobs and 10,000 indirect jobs, which will drive the regional economy (Table 1). In addition to generating jobs, another important contribution of the group for the development of the region is seen in the collection of taxes. About $ 50 million annually in local, state and federal taxes are reinvested in investments and development in the catchment area of the plants of this group.
In Uberaba, the sector generated in the region more than 2,000 jobs in 8 years (Table 1). The annual wage average ranged from R$ 13.000 per employee in 2005 to R$ 40.596 in 2013, which was an increase of 217% - more than the triple. The sector also generates approximately R$ 137 million in taxes for the city, aiming to achieve the double by 2020.
According to the literature, in the sugar-energy sector the
TABLE 2: EMPLOYMENT AND SALLARIES
QUIRINÓPOLIS
2005 2007 2009 2011 2012 2013 2020 2025
No. Staff - 1,411 2,063 2,016 2,150 3,000 - -
UBERABA
2005 2007 2009 2011 2012 2013 2020 2025
No. Staff 5,990 7,269 6,838 9,016 9,283 8,220 9,379 9,379
Wages(Million R$) 77,4 109,3 137,8 253,7 305,6 333,7 388,8 388,8
Average Salary
(R$/year)12.921 15.036 20.152 28.138 32.920 40.596 41.374 41.374
Taxes Generated
(Million R$) - - 89,4 145,9 83,1 136,6 251,6 242,8
Source: Elaborated by the authors from data of Vale do Tijuco Plant, Uberaba, Grupo Delta and Grupo SJC.
generation of indirect jobs has a multiplier effect of 2.39 on direct jobs (MONTAGNHANI; FAGUNDES; SILVA, 2009). In other words, for each direct job the sector generates 2.39 indirect job workplaces. Those jobs can be allocated in various sectors such as: services, trade, health and others. Considering the jobs generated by the groups of the plants analyzed and a multiplying factor of 2.39, it can be observed that 26,816 indirect jobs were generated in both regions in 2013.
Also in relation to jobs, it can be said that in addition to the ending of burnings, the mechanization of the sugar-energy sector has brought with it an increase in the technical level of harvest workers and greater formality in the sector, since temporary work has decreased. Operating a machine requires knowledge beyond the simple mechanical task of cutting sugar cane. To respond to developments in the sector, an operator must have systematization and productivity knowledge of the technologies that he deals with besides developing new interpersonal skills.
Another important social factor that must be considered is the independent sugar cane producer. Just like plants, these independent producers also generate jobs in their properties. These partners and suppliers also share the value created in the chain, increasing the profitability and value of their land and starting to have greater power to invest and develop their businesses. In some areas of the region, the lands have risen by four times since the installation of the plants. The regions of Quirinópolis and Uberaba are prioritizing the development model based on independent sugar cane producers considering that these producers represent most of the sugar cane grinded by industries.
Based on these facts, it can be stated that the entrepreneur and the worker of sugar cane sector play an important role in the development in the sector, in the regions in where they are located and in Brazilian agribusiness. It is clearly observed that the sugar cane activity contributes to the absorption of a large contingent of manpower, which was excluded from the labor market, acting as a real agent of social inclusion.
ENVIRONMENTAL DEVELOPMENT
Currently, the plants installed in Quirinópolis and Uberaba practice mechanized harvesting without burning straw in most of owned and leased areas. Only a minority of suppliers perform burning before the harvest (this practice will be abolished in 2014, as prescribed by law).
The arrival of the plants in these cities has brought many environmental benefits. Many of these benefits are due to cane sugar crops, which were proved by scientific studies published in the Nature magazine. These benefits are responsible for reduction in temperature
88 89
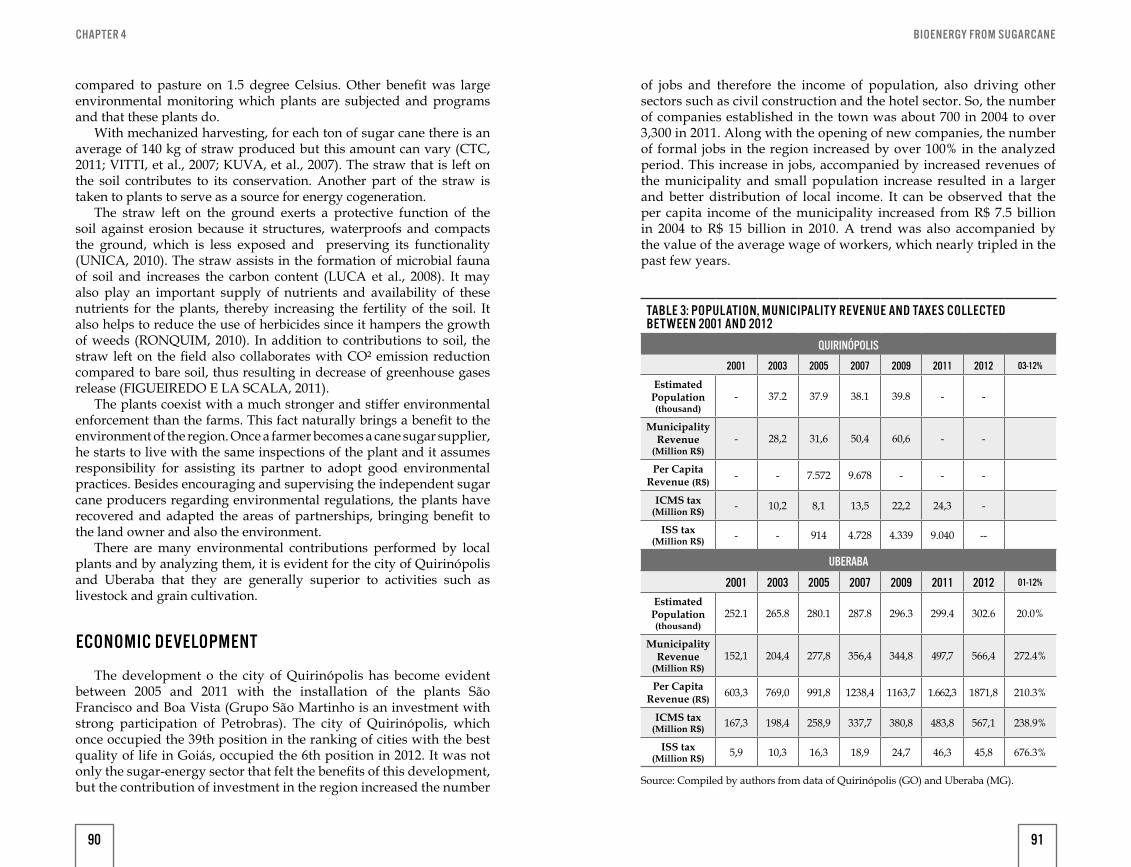
BIOENERGY FROM SUGARCANECHAPTER 4
compared to pasture on 1.5 degree Celsius. Other benefit was large environmental monitoring which plants are subjected and programs and that these plants do.
With mechanized harvesting, for each ton of sugar cane there is an average of 140 kg of straw produced but this amount can vary (CTC, 2011; VITTI, et al., 2007; KUVA, et al., 2007). The straw that is left on the soil contributes to its conservation. Another part of the straw is taken to plants to serve as a source for energy cogeneration.
The straw left on the ground exerts a protective function of the soil against erosion because it structures, waterproofs and compacts the ground, which is less exposed and preserving its functionality (UNICA, 2010). The straw assists in the formation of microbial fauna of soil and increases the carbon content (LUCA et al., 2008). It may also play an important supply of nutrients and availability of these nutrients for the plants, thereby increasing the fertility of the soil. It also helps to reduce the use of herbicides since it hampers the growth of weeds (RONQUIM, 2010). In addition to contributions to soil, the straw left on the field also collaborates with CO² emission reduction compared to bare soil, thus resulting in decrease of greenhouse gases release (FIGUEIREDO E LA SCALA, 2011).
The plants coexist with a much stronger and stiffer environmental enforcement than the farms. This fact naturally brings a benefit to the environment of the region. Once a farmer becomes a cane sugar supplier, he starts to live with the same inspections of the plant and it assumes responsibility for assisting its partner to adopt good environmental practices. Besides encouraging and supervising the independent sugar cane producers regarding environmental regulations, the plants have recovered and adapted the areas of partnerships, bringing benefit to the land owner and also the environment.
There are many environmental contributions performed by local plants and by analyzing them, it is evident for the city of Quirinópolis and Uberaba that they are generally superior to activities such as livestock and grain cultivation.
ECONOMIC DEVELOPMENT
The development o the city of Quirinópolis has become evident between 2005 and 2011 with the installation of the plants São Francisco and Boa Vista (Grupo São Martinho is an investment with strong participation of Petrobras). The city of Quirinópolis, which once occupied the 39th position in the ranking of cities with the best quality of life in Goiás, occupied the 6th position in 2012. It was not only the sugar-energy sector that felt the benefits of this development, but the contribution of investment in the region increased the number
of jobs and therefore the income of population, also driving other sectors such as civil construction and the hotel sector. So, the number of companies established in the town was about 700 in 2004 to over 3,300 in 2011. Along with the opening of new companies, the number of formal jobs in the region increased by over 100% in the analyzed period. This increase in jobs, accompanied by increased revenues of the municipality and small population increase resulted in a larger and better distribution of local income. It can be observed that the per capita income of the municipality increased from R$ 7.5 billion in 2004 to R$ 15 billion in 2010. A trend was also accompanied by the value of the average wage of workers, which nearly tripled in the past few years.
TABLE 3: POPULATION, MUNICIPALITY REVENUE AND TAXES COLLECTED BET WEEN 2001 AND 2012
QUIRINÓPOLIS
2001 2003 2005 2007 2009 2011 2012 03-12%
EstimatedPopulation (thousand)
- 37.2 37.9 38.1 39.8 - -
Municipality Revenue
(Million R$)- 28,2 31,6 50,4 60,6 - -
Per Capita Revenue (R$)
- - 7.572 9.678 - - -
ICMS tax(Million R$) - 10,2 8,1 13,5 22,2 24,3 -
ISS tax(Million R$) - - 914 4.728 4.339 9.040 --
UBERABA
2001 2003 2005 2007 2009 2011 2012 01-12%
EstimatedPopulation (thousand)
252.1 265.8 280.1 287.8 296.3 299.4 302.6 20.0%
Municipality Revenue
(Million R$)152,1 204,4 277,8 356,4 344,8 497,7 566,4 272.4%
Per Capita Revenue (R$)
603,3 769,0 991,8 1238,4 1163,7 1.662,3 1871,8 210.3%
ICMS tax(Million R$) 167,3 198,4 258,9 337,7 380,8 483,8 567,1 238.9%
ISS tax(Million R$) 5,9 10,3 16,3 18,9 24,7 46,3 45,8 676.3%
Source: Compiled by authors from data of Quirinópolis (GO) and Uberaba (MG).
90 91
BIOENERGY FROM SUGARCANECHAPTER 4
From the perspective of the development of the municipality, it was not possible to attribute its development only to the sugar-energy sector since it is the result of the sum of the sectors that comprise the city, and in the case of Uberaba other sectors also had strong growth. Thus, in the period 2001-2012, it was found that the municipality had an increase in its revenue in 270%. With higher income, the investments of the municipality in education, health, hotels, restaurants, security and others were also higher (Table 2). The ICMS tax increased 240%, and the ISS tax, which is paid directly to the municipality, meaning immediatte liquidity in revenue, has increased 676%. The per capita income of Uberaba increased from R$ 603 in 2001 to R$ 1.871 in 2012, an increase of about 210%. This economic growth is clearly reflected in the development of the economy and local businesses, increasing sales in supermarkets, retail stores, appliances, restaurants, bars and others. In the end, the sugar-energy chain in the region of Uberaba has a turnover of approximately R$ 3,3 billion in the local economy just in the last harvest accounted. This money is passed on to the population, market, neighboring municipalities, and is invested once again in health, education, the market itself, etc. In short, it is a highly beneficial financial move for the county and the micro-region.
By analyzing the data from these two regions it is clear that the sugar-energy sector directly contributed to the economic development of the regions. Direct contributions are seen by payment of taxes, as increased income of the city and increased income of the population. But still there are the indirect economic contributions such as new industries and trades that appear to meet the sector, better income distribution that contributes to the development of the local market and consequently a higher raise of tax for the municipalities. In other words, economic contributions from the sugar-energy sector are tangible.
CONCLUSIONS
Studies such as this portray the true importance of the sugar-energy sector for the development of a region. This development often goes unnoticed by people, or who do not give proper credits to the sugar-energy sector.
It is clearly noticed that the model adopted by the region is prioritizing the development by multiple gains, valuing farmers. This model is beneficial because it brings income to sugar cane supplier, to the agricultural partner and it also allows plants to have better planning and to gain efficiency in operations, that is, these three agents benefit in this context. This model also allows new suppliers or partners to benefit from the sector by integrating their activities with those of the plants. According to respondents, these small towns around Uberaba
are positively affected with the benefits from plants and the sector, promoting improvement in the quality of life of the population.
The development of Quirinópolis and Uberaba was evident in recent years and this is due to the arrival of sugar-energy industries in the municipalities and in the region. Generation of jobs, income distribution and the transformation of real “rural slums” with high rates of degraded pastures and insipient income generation, to a role of genuine agricultural enterprises and environmental benefits are undeniable. However, the lack of access to information creates distortion of the image of a sector that is still connected to the image of sugar cane lords and burnings, nonetheless it that still has much to offer to the population and should be encouraged.
Sugar cane plant generates income that circulates in the city and is widely distributed through wages, taxes and purchase of products and services, moving sectors such as civil construction, restaurants, retail and others, generating a multiplier effect. Just visit these municipalities that previously did not have plants (Quirinópolis and Uberaba) to meet “Chinese Brazil”, meaning pure entrepreneurship.
After the analysis of Brazil's competitiveness in various sectors under an international focus, the question remains: what other quick development alternative would these municipalities have in the midlands of Brazil? Just imagine the impact of 80 new plants planned in 80 cities in the midlands generating wealth. Other than that, having energy security is what all countries seek and unfortunately part of Brazil seems to want to walk in the opposite direction.
92 93
BIOENERGY FROM SUGARCANE
BY MARCOS ANTONIO CONEJERO, MARCOS FAVA NEVES AND MAIRUN JUNQUEIRA ALVES PINTO
ENVIRONMENTAL SCENARIOS FOR MANDATORY BIO-FUEL BLENDING TARGETS: AN APPLICATION OF INTUITIVE LOGICS
5
Originally published in International Food and Agribusiness Symposium and Forum: Peo-ple Feed the World, 2014, Cape-Town, Africa.
BIOENERGY FROM SUGARCANE
INTRODUCTION
The existence of a food and bioenergy global market depends on the development of transnational and sustainable agribusiness systems. In this process, strategic planning is core to the understanding of production systems and to enable the monitoring and adjustment of an increasingly dynamic international environment. In this setting, the construction and development of scenarios for mandatory bio-fuel blending targets, is critical to the future of food and bioenergy production chains. This is precisely the focal theme herein at hand.
Amongst the many tools a manager can resort to for strategic planning purposes, scenario planning comes to light given its ability to capture, in great detail, an extensive range of possibilities. By identifying basic trends and uncertainties, a manager can construct a series of scenarios that will help compensate for the most common mishaps concerning decision making – overconfidence and narrow mindedness (Schoemaker, 1995).
First, one ought to take a closer look at changes that are taking place in the macro-environment within the energy-centred world, regardless of corporate, governmental and social willingness.
In this analysis, a tool named “STEP analysis” is employed, commonly found when looking into strategic planning literature. Its purpose is to analyze major uncontrollable changes in productive systems so as to unveil opportunities and threats. These factors arise from the political-legal, economical-natural, social-cultural and technological environments (Neves, 2007a; Campomar and Ikeda, 2006; Jain, 2000; Johnson and Scholes, 1988).
Neves (2005) lists key factors which impact each dimension as depicted under the so-called PEST analysis framework. Amongst the most relevant political-legal factors, one should detail in special the: legal and political structure, political parties and their political orientation, legislative framework, institutions legitimating, antitrust policies, political stability and government, labour legislation, regulation on foreign trade, environmental legislation, pressure groups (e.g., NGOs), tax policies, etc.
From an economical-natural standpoint, it is relevant to bear in mind, amongst others: the industry´s life cycle, interest rates, exchange rates, credit availability, investment levels, employment, energy availability and costs, economic growth, taxes, subsidies, concentration of suppliers, concentration of buyers, etc. (Neves, 2005). As far as the socio-cultural environment is concerned, some of the most important factors worth paying attention to include: demography, life style, social mobility, education levels, behavioural patterns, urbanization, family size, aging of the population, environmental and social concerns, etc. (Neves, 2005).
97
BIOENERGY FROM SUGARCANECHAPTER 5
Finally, as to the technological environment, the main pondering factors comprise: the level of public and private investments in R&D, product life cycle, patents and intellectual property, input restrictions, concerns about ecoefficiency, pace and direction of technology transfers, etc (Neves, 2005).
Once having performed this analysis, the main trends and uncertainties to be considered when studying the world energy sector include:
■ Political-legal environment: the ratification of the Kyoto Protocol and its impacts on the patterns of energy consumption; restrictions on land (environmental impact) and water (for water recovery) usage; requirements regarding waste and residues; the imposition of emission reduction targets and the incremental adoption of bio-fuels, by countries.
■ Economic and natural environment: the ever increasing rise in oil prices; stronger competition between diverse renewable sources of energy; growth in sales of flex fuel and hybrid vehicles; the blending of biodiesel and ethanol with fossil fuels in order to reduce emissions; the opening of new markets for ethanol fuel (mainly the Asian market), new products (electricity) and the biomass competition; and finally, sustainable production chains.
■ Socio cultural environment: growth in the “green consumers” segment; affirmation of bio-fuel image as being that of a clean fuel; requirements for corporate social responsibility and governance; increased human health concerns; improved life quality quests; national produce defence; locally produced ethanol and biodiesel; convenience and product variety drives; fair trade enhancement upon purchase decision-making; growth in the consumption of specialty products and traceability requirements.
■ Technological environment: improvement in the efficiency of flex-fuel and hybrid vehicles; hydrogen cell: fuel of the future; patenting of technology for the production of ethanol; technology of burning biomass and/or use of methane gas; major investments in the search for cellulose ethanol; integration of the ethanol plant and biodiesel; diversification of sources and energy production.
Therefore, as the objective of this paper, the construction of alternative scenarios for mandatory bio-fuel blending targets will contribute to the worldwide incorporation of various future possibilities in the formulation of objectives, guidelines, and strategies and to the ensuring of sustainable growth of country agribusiness systems.
LITERATURE REVIEW
According to Zylbersztajn and Neves (2000) and Batalha (2001), the agribusiness systems (chains) hold the following basic elements for descriptive analysis: the agents, the relations between them, the sectors (inputs, agriculture, industry, and distribution), the supporting organizations and the institutional environment. Ultimately, this is no more than a macro analysis of a product flow, from suppliers to final consumers.
Every country ought to seek designing and constructing a process for the strategic planning and management of productive chains. This, in turn, should prioritize the fields of coordination and institutional adequacy (laws), production and products, communications, distribution and logistics and human resources, so as to define projects to foment strategic thinking and to promote changes, as deemed necessary. This approach likewise holds true when it comes to matters concerning bio-fuels (Neves, 2007b).
The traditional planning tool is very valuable and indispensable; however it is incomplete given that various elements are overseen. Scenario planning simplifies the avalanche of data into a limited number of possible states. Each scenario tells a story of how various elements might interact under certain conditions. Therefore scenario planning is a disciplined method for imagining possible futures which companies have applied to a great range of issues (Schoemaker, 1995). Scenario planning is a consolidated tool that assists strategic planning. Scenario planning helps all actors involved to develop and clarify practical choices, policies and alternative actions that might appear to be the necessary consequences of the scenario (Coates, 2000; Lambin, 2000).
Scenarios are descriptions of the possible futures concerning an issue. Their purpose is to help analysts and decision makers understand the assortment of events that might take place and their possible impacts. The scenario itself is not a forecast, although it may contain or be based on forecasts. Rather, a set of scenarios, typically three or four in number, is intended to stimulate thought concerning future events, the relationships between them and the uncertainties surrounding them (Obrien, 2004; Schwartz, 1991; Chermack, 2005; Blanning and Reinig, 1998; Heijden, 1994).
Scenario planning attempts to capture the richness and range of possibilities, stimulating decision makers to consider changes they would otherwise ignore. At the same time, it organizes these possibilities into narratives that are easier to grasp and use than large volumes of data. Organizations facing the following conditions will, in special, benefit from scenario planning (Schoemaker, 1995):
■ Uncertainty is high when compared to management´s ability to predict or adjust;
98 99
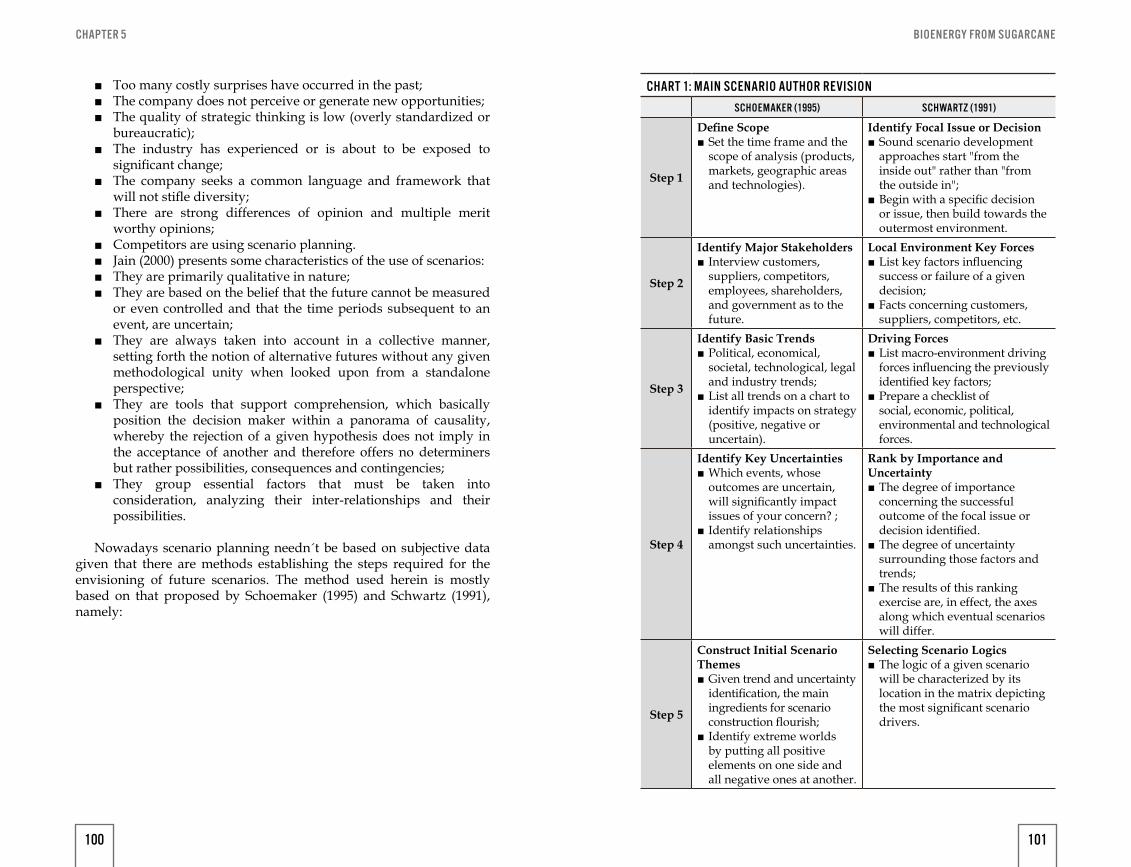
BIOENERGY FROM SUGARCANECHAPTER 5
■ Too many costly surprises have occurred in the past; ■ The company does not perceive or generate new opportunities; ■ The quality of strategic thinking is low (overly standardized or
bureaucratic); ■ The industry has experienced or is about to be exposed to
significant change; ■ The company seeks a common language and framework that
will not stifle diversity; ■ There are strong differences of opinion and multiple merit
worthy opinions; ■ Competitors are using scenario planning. ■ Jain (2000) presents some characteristics of the use of scenarios: ■ They are primarily qualitative in nature; ■ They are based on the belief that the future cannot be measured
or even controlled and that the time periods subsequent to an event, are uncertain;
■ They are always taken into account in a collective manner, setting forth the notion of alternative futures without any given methodological unity when looked upon from a standalone perspective;
■ They are tools that support comprehension, which basically position the decision maker within a panorama of causality, whereby the rejection of a given hypothesis does not imply in the acceptance of another and therefore offers no determiners but rather possibilities, consequences and contingencies;
■ They group essential factors that must be taken into consideration, analyzing their inter-relationships and their possibilities.
Nowadays scenario planning needn´t be based on subjective data given that there are methods establishing the steps required for the envisioning of future scenarios. The method used herein is mostly based on that proposed by Schoemaker (1995) and Schwartz (1991), namely:
CHART 1: MAIN SCENARIO AUTHOR REVISIONSCHOEMAKER (1995) SCHWARTZ (1991)
Step 1
Define Scope ■ Set the time frame and the scope of analysis (products, markets, geographic areas and technologies).
Identify Focal Issue or Decision ■ Sound scenario development approaches start "from the inside out" rather than "from the outside in";
■ Begin with a specific decision or issue, then build towards the outermost environment.
Step 2
Identify Major Stakeholders ■ Interview customers, suppliers, competitors, employees, shareholders, and government as to the future.
Local Environment Key Forces ■ List key factors influencing success or failure of a given decision;
■ Facts concerning customers, suppliers, competitors, etc.
Step 3
Identify Basic Trends ■ Political, economical, societal, technological, legal and industry trends;
■ List all trends on a chart to identify impacts on strategy (positive, negative or uncertain).
Driving Forces ■ List macro-environment driving forces influencing the previously identified key factors;
■ Prepare a checklist of social, economic, political, environmental and technological forces.
Step 4
Identify Key Uncertainties ■ Which events, whose outcomes are uncertain, will significantly impact issues of your concern? ;
■ Identify relationships amongst such uncertainties.
Rank by Importance and Uncertainty
■ The degree of importance concerning the successful outcome of the focal issue or decision identified.
■ The degree of uncertainty surrounding those factors and trends;
■ The results of this ranking exercise are, in effect, the axes along which eventual scenarios will differ.
Step 5
Construct Initial Scenario Themes
■ Given trend and uncertainty identification, the main ingredients for scenario construction flourish;
■ Identify extreme worlds by putting all positive elements on one side and all negative ones at another.
Selecting Scenario Logics ■ The logic of a given scenario will be characterized by its location in the matrix depicting the most significant scenario drivers.
100 101
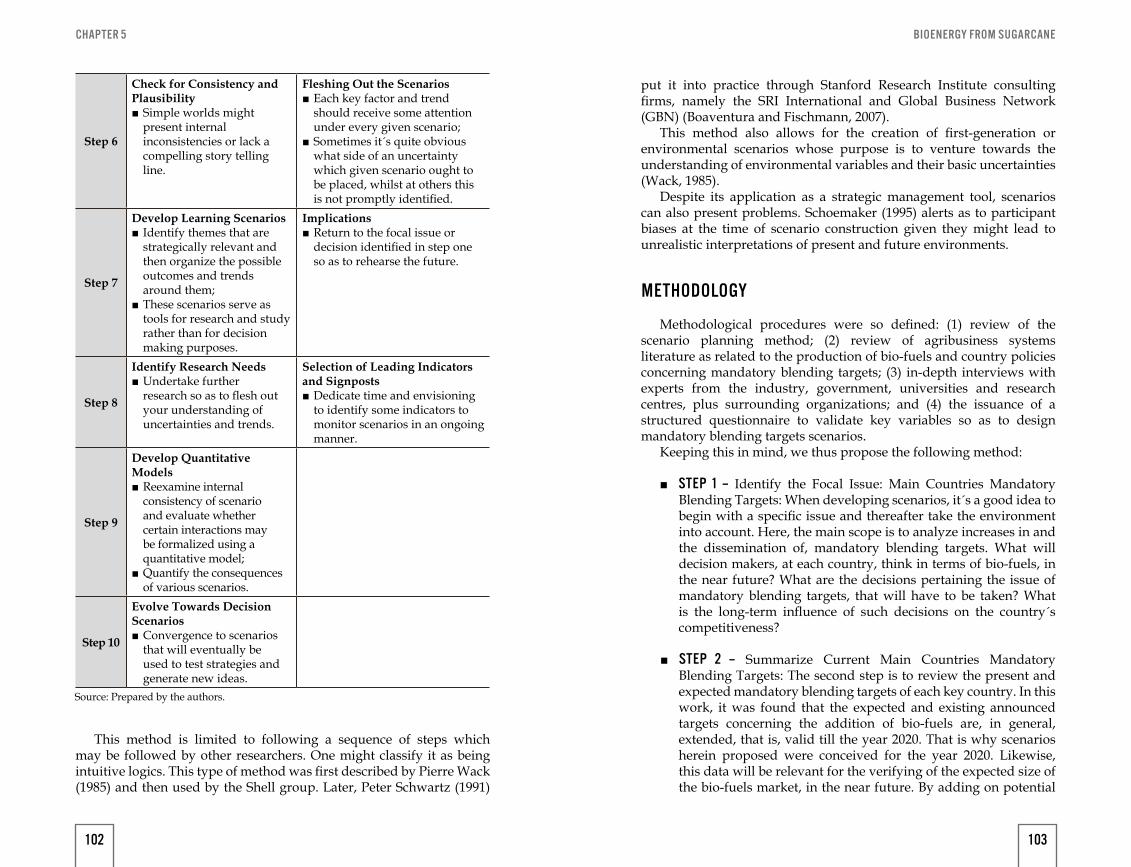
BIOENERGY FROM SUGARCANECHAPTER 5
Step 6
Check for Consistency and Plausibility
■ Simple worlds might present internal inconsistencies or lack a compelling story telling line.
Fleshing Out the Scenarios ■ Each key factor and trend should receive some attention under every given scenario;
■ Sometimes it´s quite obvious what side of an uncertainty which given scenario ought to be placed, whilst at others this is not promptly identified.
Step 7
Develop Learning Scenarios ■ Identify themes that are strategically relevant and then organize the possible outcomes and trends around them;
■ These scenarios serve as tools for research and study rather than for decision making purposes.
Implications ■ Return to the focal issue or decision identified in step one so as to rehearse the future.
Step 8
Identify Research Needs ■ Undertake further research so as to flesh out your understanding of uncertainties and trends.
Selection of Leading Indicators and Signposts
■ Dedicate time and envisioning to identify some indicators to monitor scenarios in an ongoing manner.
Step 9
Develop Quantitative Models
■ Reexamine internal consistency of scenario and evaluate whether certain interactions may be formalized using a quantitative model;
■ Quantify the consequences of various scenarios.
Step 10
Evolve Towards Decision Scenarios
■ Convergence to scenarios that will eventually be used to test strategies and generate new ideas.
Source: Prepared by the authors.
This method is limited to following a sequence of steps which may be followed by other researchers. One might classify it as being intuitive logics. This type of method was first described by Pierre Wack (1985) and then used by the Shell group. Later, Peter Schwartz (1991)
put it into practice through Stanford Research Institute consulting firms, namely the SRI International and Global Business Network (GBN) (Boaventura and Fischmann, 2007).
This method also allows for the creation of first-generation or environmental scenarios whose purpose is to venture towards the understanding of environmental variables and their basic uncertainties (Wack, 1985).
Despite its application as a strategic management tool, scenarios can also present problems. Schoemaker (1995) alerts as to participant biases at the time of scenario construction given they might lead to unrealistic interpretations of present and future environments.
METHODOLOGY
Methodological procedures were so defined: (1) review of the scenario planning method; (2) review of agribusiness systems literature as related to the production of bio-fuels and country policies concerning mandatory blending targets; (3) in-depth interviews with experts from the industry, government, universities and research centres, plus surrounding organizations; and (4) the issuance of a structured questionnaire to validate key variables so as to design mandatory blending targets scenarios.
Keeping this in mind, we thus propose the following method:
■ STEP 1 – Identify the Focal Issue: Main Countries Mandatory Blending Targets: When developing scenarios, it´s a good idea to begin with a specific issue and thereafter take the environment into account. Here, the main scope is to analyze increases in and the dissemination of, mandatory blending targets. What will decision makers, at each country, think in terms of bio-fuels, in the near future? What are the decisions pertaining the issue of mandatory blending targets, that will have to be taken? What is the long-term influence of such decisions on the country´s competitiveness?
■ STEP 2 – Summarize Current Main Countries Mandatory Blending Targets: The second step is to review the present and expected mandatory blending targets of each key country. In this work, it was found that the expected and existing announced targets concerning the addition of bio-fuels are, in general, extended, that is, valid till the year 2020. That is why scenarios herein proposed were conceived for the year 2020. Likewise, this data will be relevant for the verifying of the expected size of the bio-fuels market, in the near future. By adding on potential
102 103
BIOENERGY FROM SUGARCANECHAPTER 5
market simulations - given widespread adoption by countries of mandatory blending targets - one might figure out the level of production required for compliance with hypothetical bio-fuel policies, at several countries.
■ STEP 3 – Identify Key or Driving Forces: The third step involves listing key forces based on the macro-environment that influence mandatory blending targets. This is the most research-intensive step in the process. In this sense, the research has covered markets (oil, bio- fuels, feedstocks), new technologies (flex-fuel cars, hybrid cars, hydrogen cell, hydrolysis into cellulose ethanol and new agricultural varieties), political factors (governmental restrictions and incentives), economic forces (bio-fuels productivity, production costs and processing capacity) plus sustainability forces (social and environmental improvements).
■ STEP 4 – Key Force Validation with Experts: Once key forces have been defined, they ought to be submitted to experts for validation and suggestion purposes. This approach ensures both safety and strength to the analytical process itself. Forces and respective descriptions are forwarded by e-mail for approval, in compliance with a pre-qualified network of experts. Final key forces thus include consolidated answers and proposed modifications whilst excluding divergent opinions. In this study, the referred network derives from the annual International PENSA Conference on Agri-Food and Bioenergy Chain/Networks, organized by the University of Sao Paulo´s Agribusiness Intelligence Centre, Brazil (PENSA). The conference brings together professors and researchers from around the world that are engaged with bio-fuel issues. Experts are originally from Canada, the United States, Argentina, Brazil, Germany, France, The Netherlands, South Africa, India, China, Japan and Indonesia.
■ STEP 5 – Rank by Importance vs. Uncertainty and the Correlation Matrix: Next, key factors are ranked based on two criteria: first, the degree of importance to the success of the focal issue (mandatory blending targets); second, the degree of uncertainty surrounding such factors and trends. The concerned idea is to compile an opinion map (perceptual map) based on the assessment of the experts in as much as identifying the factors that are most important and most uncertain, is concerned. Their opinions do not constitute a random sample; therefore, they are not susceptible to statistical inference. The end result of this task
is a set of key variables for this study, which effectively are the environment variables that pose greater standing in terms of influencing the focal issue (mandatory blending targets) despite their uncertainty and the fact that they are capable of generating contrast scenarios, based on their eventually diverted, final resultant state.
■ STEP 6 – Designing key country mandatory blending targets scenarios: The results of the ranking exercise are effectively, the axes, and between these, eventual scenarios will differ. Determining these axes is one of the most important steps in the entire scenario-generating process. The goal is to end up with just a few scenarios (pessimistic, optimistic and realistic) that must be well understood by decision makers so as to truly be, of use.
These fundamental differences — or "scenario drivers"— must likewise be no more than a handful so as to avoid the triggering of an assortment of scenarios surrounding each and every possible uncertainty. Many things can happen, but only a few scenarios ought to be designed efficiently, in a detailed manner.
DATA PRESENTATION AND ANALYSIS
STEP ANALYSIS
In order to develop multiple scenarios concerning an issue that involves the future of the world’s energy and the dealing with an industry known for its high risks and long-term investment projects, various macro-environmental changes call for analysis. Chart 2 depicts environmental changes per opportunity or threat perception.
104 105
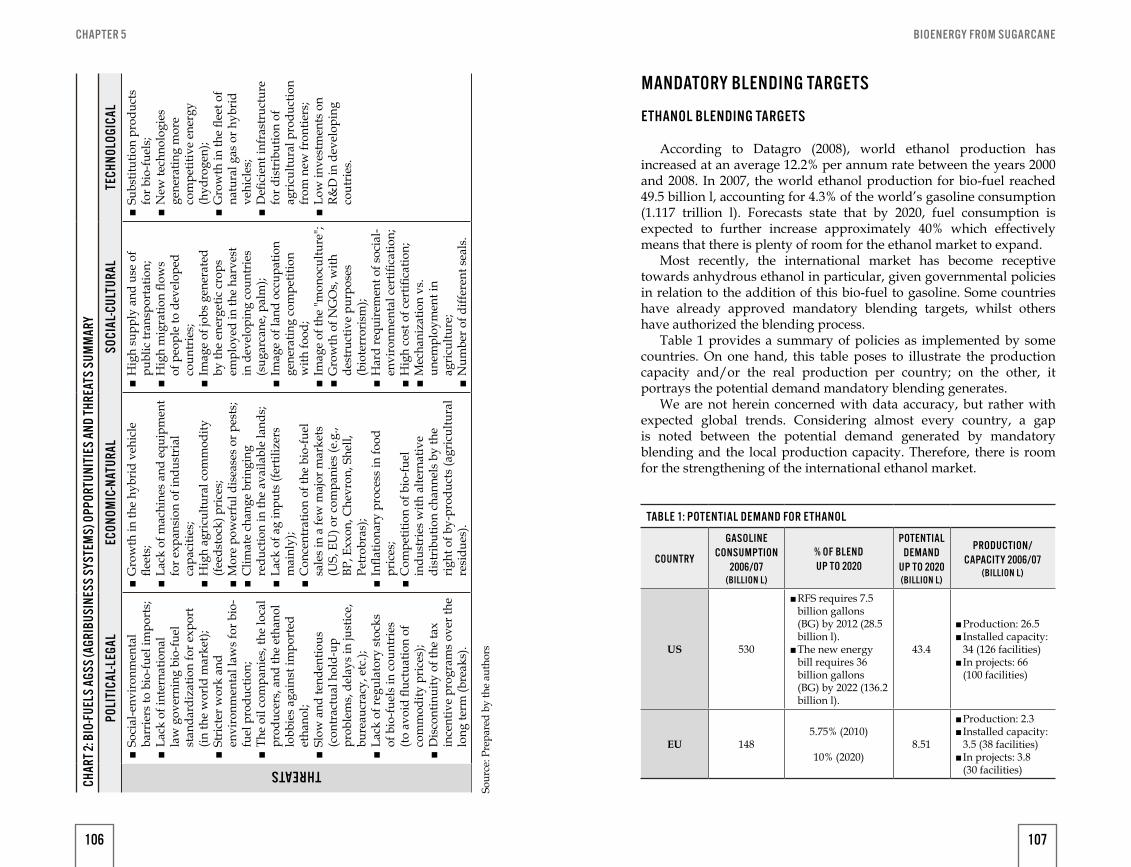
BIOENERGY FROM SUGARCANECHAPTER 5
CHAR
T 2: B
IO-F
UELS
AGS
S (A
GRIB
USIN
ESS
SYST
EMS)
OPP
ORTU
NITI
ES A
ND T
HREA
TS S
UMM
ARY
POLI
TICA
L-LE
GAL
ECON
OMIC
-NAT
URAL
SOCI
AL-C
ULTU
RAL
TECH
NOLO
GICA
L
THREATS
■So
cial
-env
iron
men
tal
barr
iers
to b
io-fu
el im
port
s; ■La
ck o
f int
erna
tiona
l la
w g
over
ning
bio
-fuel
st
anda
rdiz
atio
n fo
r exp
ort
(in th
e w
orld
mar
ket);
■St
rict
er w
ork
and
envi
ronm
enta
l law
s fo
r bio
- fu
el p
rodu
ctio
n; ■Th
e oi
l com
pani
es, t
he lo
cal
prod
ucer
s, a
nd th
e et
hano
l lo
bbie
s ag
ains
t im
port
ed
etha
nol;
■Sl
ow a
nd te
nden
tious
(c
ontr
actu
al h
old-
up
prob
lem
s, d
elay
s in
just
ice,
bu
reau
crac
y, e
tc.);
■La
ck o
f reg
ulat
ory
stoc
ks
of b
io-fu
els
in c
ount
ries
(to
avo
id fl
uctu
atio
n of
co
mm
odity
pri
ces)
; ■ D
isco
ntin
uity
of t
he ta
x in
cent
ive
prog
ram
s ove
r the
lo
ng te
rm (b
reak
s).
■G
row
th in
the
hybr
id v
ehic
le
fleet
s; ■La
ck o
f mac
hine
s an
d eq
uipm
ent
for e
xpan
sion
of i
ndus
tria
l ca
paci
ties;
■H
igh
agri
cultu
ral c
omm
odity
(fe
edst
ock)
pri
ces;
■M
ore
pow
erfu
l dis
ease
s or
pes
ts;
■C
limat
e ch
ange
bri
ngin
g re
duct
ion
in th
e av
aila
ble
land
s; ■La
ck o
f ag
inpu
ts (f
ertil
izer
s m
ainl
y);
■C
once
ntra
tion
of th
e bi
o-fu
el
sale
s in
a fe
w m
ajor
mar
kets
(U
S, E
U) o
r com
pani
es (e
.g.,
BP, E
xxon
, Che
vron
, She
ll,
Petr
obra
s);
■In
flatio
nary
pro
cess
in fo
od
pric
es;
■C
ompe
titio
n of
bio
-fuel
in
dust
ries
with
alte
rnat
ive
dist
ribu
tion
chan
nels
by
the
righ
t of b
y-pr
oduc
ts (a
gric
ultu
ral
resi
dues
).
■H
igh
supp
ly a
nd u
se o
f pu
blic
tran
spor
tatio
n; ■H
igh
mig
ratio
n flo
ws
of p
eopl
e to
dev
elop
ed
coun
trie
s; ■Im
age
of jo
bs g
ener
ated
by
the
ener
getic
cro
ps
empl
oyed
in th
e ha
rves
t in
dev
elop
ing
coun
trie
s (s
ugar
cane
, pal
m);
■Im
age
of la
nd o
ccup
atio
n ge
nera
ting
com
petit
ion
with
food
; ■Im
age
of th
e "m
onoc
ultu
re";
■G
row
th o
f NG
Os,
with
de
stru
ctiv
e pu
rpos
es
(bio
terr
oris
m);
■H
ard
requ
irem
ent o
f soc
ial-
envi
ronm
enta
l cer
tifica
tion;
■H
igh
cost
of c
ertifi
catio
n; ■M
echa
niza
tion
vs.
unem
ploy
men
t in
agri
cultu
re;
■N
umbe
r of d
iffer
ent s
eals
.
■Su
bstit
utio
n pr
oduc
ts
for b
io-fu
els;
■N
ew te
chno
logi
es
gene
ratin
g m
ore
com
petit
ive
ener
gy
(hyd
roge
n);
■G
row
th in
the
fleet
of
natu
ral g
as o
r hyb
rid
vehi
cles
; ■D
efici
ent i
nfra
stru
ctur
e fo
r dis
trib
utio
n of
ag
ricu
ltura
l pro
duct
ion
from
new
fron
tiers
; ■Lo
w in
vest
men
ts o
n R&
D in
dev
elop
ing
cout
ries
.
Sour
ce: P
repa
red
by th
e au
thor
s
MANDATORY BLENDING TARGETS
ETHANOL BLENDING TARGETS
According to Datagro (2008), world ethanol production has increased at an average 12.2% per annum rate between the years 2000 and 2008. In 2007, the world ethanol production for bio-fuel reached 49.5 billion l, accounting for 4.3% of the world’s gasoline consumption (1.117 trillion l). Forecasts state that by 2020, fuel consumption is expected to further increase approximately 40% which effectively means that there is plenty of room for the ethanol market to expand.
Most recently, the international market has become receptive towards anhydrous ethanol in particular, given governmental policies in relation to the addition of this bio-fuel to gasoline. Some countries have already approved mandatory blending targets, whilst others have authorized the blending process.
Table 1 provides a summary of policies as implemented by some countries. On one hand, this table poses to illustrate the production capacity and/or the real production per country; on the other, it portrays the potential demand mandatory blending generates.
We are not herein concerned with data accuracy, but rather with expected global trends. Considering almost every country, a gap is noted between the potential demand generated by mandatory blending and the local production capacity. Therefore, there is room for the strengthening of the international ethanol market.
TABLE 1: POTENTIAL DEMAND FOR ETHANOL
COUNTRY
GASOLINE CONSUMPTION
2006/07 (BILLION L)
% OF BLEND UP TO 2020
POTENTIAL DEMAND
UP TO 2020 (BILLION L)
PRODUCTION/ CAPACITY 2006/07
(BILLION L)
US 530
■RFS requires 7.5 billion gallons (BG) by 2012 (28.5 billion l). ■The new energy bill requires 36 billion gallons (BG) by 2022 (136.2 billion l).
43.4
■Production: 26.5 ■ Installed capacity: 34 (126 facilities) ■ In projects: 66 (100 facilities)
EU 1485.75% (2010)
10% (2020)8.51
■Production: 2.3 ■ Installed capacity: 3.5 (38 facilities) ■ In projects: 3.8 (30 facilities)
106 107
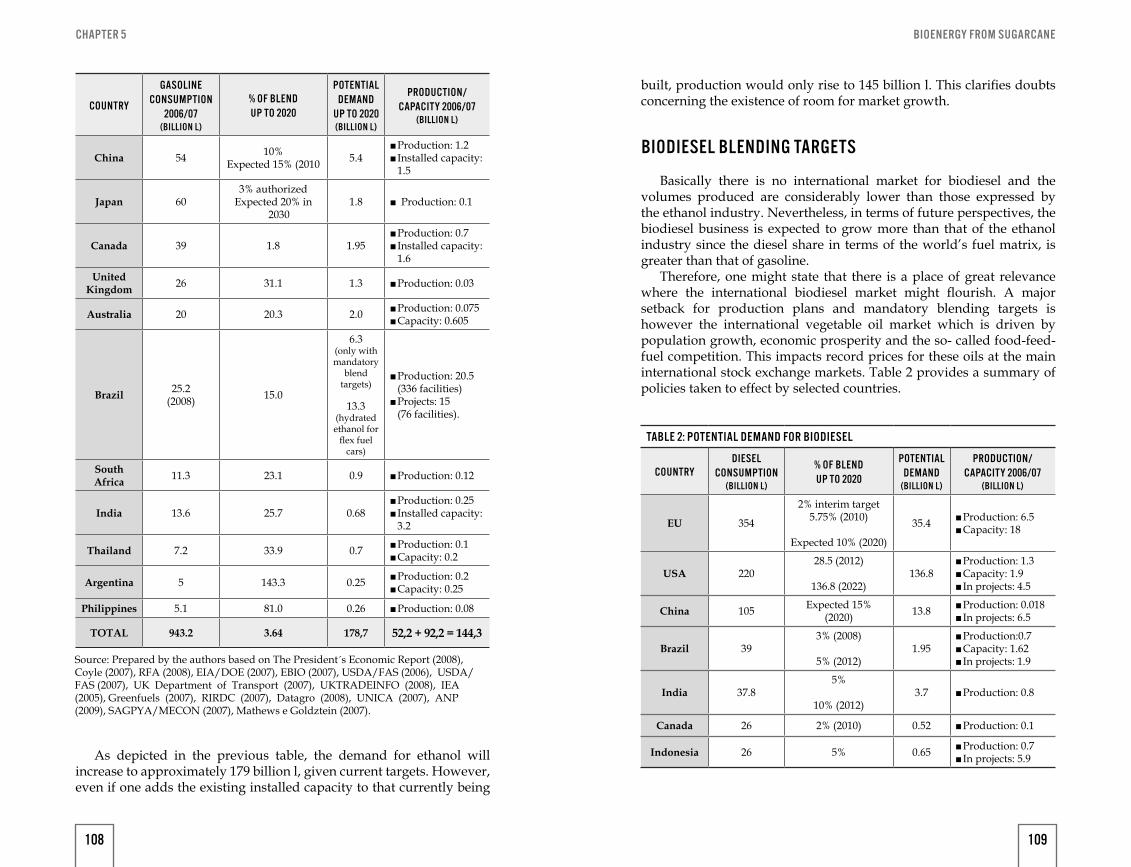
BIOENERGY FROM SUGARCANECHAPTER 5
COUNTRY
GASOLINE CONSUMPTION
2006/07 (BILLION L)
% OF BLEND UP TO 2020
POTENTIAL DEMAND
UP TO 2020 (BILLION L)
PRODUCTION/ CAPACITY 2006/07
(BILLION L)
China 54 10%Expected 15% (2010 5.4
■Production: 1.2 ■ Installed capacity: 1.5
Japan 603% authorized
Expected 20% in 2030
1.8 ■ Production: 0.1
Canada 39 1.8 1.95 ■Production: 0.7 ■ Installed capacity: 1.6
United Kingdom 26 31.1 1.3 ■Production: 0.03
Australia 20 20.3 2.0 ■Production: 0.075 ■Capacity: 0.605
Brazil 25.2 (2008) 15.0
6.3 (only with mandatory
blendtargets)
13.3 (hydrated ethanol for
flex fuelcars)
■Production: 20.5 (336 facilities) ■Projects: 15 (76 facilities).
South Africa 11.3 23.1 0.9 ■Production: 0.12
India 13.6 25.7 0.68 ■Production: 0.25 ■ Installed capacity: 3.2
Thailand 7.2 33.9 0.7 ■Production: 0.1 ■Capacity: 0.2
Argentina 5 143.3 0.25 ■Production: 0.2 ■Capacity: 0.25
Philippines 5.1 81.0 0.26 ■Production: 0.08
TOTAL 943.2 3.64 178,7 52,2 + 92,2 = 144,3
Source: Prepared by the authors based on The President´s Economic Report (2008), Coyle (2007), RFA (2008), EIA/DOE (2007), EBIO (2007), USDA/FAS (2006), USDA/FAS (2007), UK Department of Transport (2007), UKTRADEINFO (2008), IEA (2005), Greenfuels (2007), RIRDC (2007), Datagro (2008), UNICA (2007), ANP (2009), SAGPYA/MECON (2007), Mathews e Goldztein (2007).
As depicted in the previous table, the demand for ethanol will increase to approximately 179 billion l, given current targets. However, even if one adds the existing installed capacity to that currently being
built, production would only rise to 145 billion l. This clarifies doubts concerning the existence of room for market growth.
BIODIESEL BLENDING TARGETS
Basically there is no international market for biodiesel and the volumes produced are considerably lower than those expressed by the ethanol industry. Nevertheless, in terms of future perspectives, the biodiesel business is expected to grow more than that of the ethanol industry since the diesel share in terms of the world’s fuel matrix, is greater than that of gasoline.
Therefore, one might state that there is a place of great relevance where the international biodiesel market might flourish. A major setback for production plans and mandatory blending targets is however the international vegetable oil market which is driven by population growth, economic prosperity and the so- called food-feed-fuel competition. This impacts record prices for these oils at the main international stock exchange markets. Table 2 provides a summary of policies taken to effect by selected countries.
TABLE 2: POTENTIAL DEMAND FOR BIODIESEL
COUNTRYDIESEL
CONSUMPTION (BILLION L)
% OF BLEND UP TO 2020
POTENTIAL DEMAND
(BILLION L)
PRODUCTION/ CAPACITY 2006/07
(BILLION L)
EU 354
2% interim target 5.75% (2010)
Expected 10% (2020)
35.4 ■Production: 6.5 ■Capacity: 18
USA 22028.5 (2012)
136.8 (2022)136.8
■Production: 1.3 ■Capacity: 1.9 ■In projects: 4.5
China 105 Expected 15%(2020) 13.8 ■Production: 0.018
■In projects: 6.5
Brazil 393% (2008)
5% (2012)1.95
■Production:0.7 ■Capacity: 1.62 ■ In projects: 1.9
India 37.85%
10% (2012)3.7 ■Production: 0.8
Canada 26 2% (2010) 0.52 ■Production: 0.1
Indonesia 26 5% 0.65 ■Production: 0.7 ■In projects: 5.9
108 109
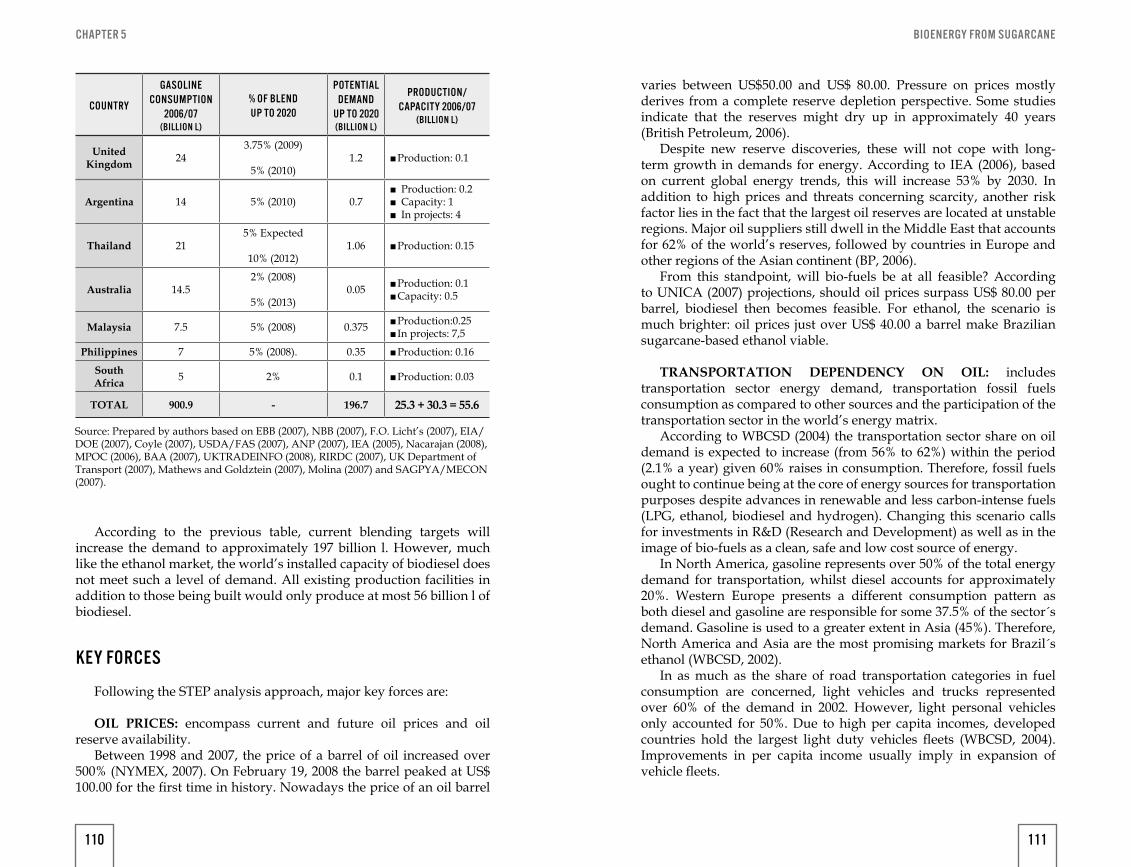
BIOENERGY FROM SUGARCANECHAPTER 5
COUNTRY
GASOLINE CONSUMPTION
2006/07 (BILLION L)
% OF BLEND UP TO 2020
POTENTIAL DEMAND
UP TO 2020 (BILLION L)
PRODUCTION/ CAPACITY 2006/07
(BILLION L)
United Kingdom 24
3.75% (2009)
5% (2010)1.2 ■Production: 0.1
Argentina 14 5% (2010) 0.7 ■ Production: 0.2 ■ Capacity: 1 ■ In projects: 4
Thailand 215% Expected
10% (2012)1.06 ■Production: 0.15
Australia 14.52% (2008)
5% (2013)0.05 ■Production: 0.1
■Capacity: 0.5
Malaysia 7.5 5% (2008) 0.375 ■Production:0.25 ■In projects: 7,5
Philippines 7 5% (2008). 0.35 ■Production: 0.16
South Africa 5 2% 0.1 ■Production: 0.03
TOTAL 900.9 - 196.7 25.3 + 30.3 = 55.6
Source: Prepared by authors based on EBB (2007), NBB (2007), F.O. Licht’s (2007), EIA/DOE (2007), Coyle (2007), USDA/FAS (2007), ANP (2007), IEA (2005), Nacarajan (2008), MPOC (2006), BAA (2007), UKTRADEINFO (2008), RIRDC (2007), UK Department of Transport (2007), Mathews and Goldztein (2007), Molina (2007) and SAGPYA/MECON (2007).
According to the previous table, current blending targets will increase the demand to approximately 197 billion l. However, much like the ethanol market, the world’s installed capacity of biodiesel does not meet such a level of demand. All existing production facilities in addition to those being built would only produce at most 56 billion l of biodiesel.
KEY FORCES
Following the STEP analysis approach, major key forces are:
OIL PRICES: encompass current and future oil prices and oil reserve availability.
Between 1998 and 2007, the price of a barrel of oil increased over 500% (NYMEX, 2007). On February 19, 2008 the barrel peaked at US$ 100.00 for the first time in history. Nowadays the price of an oil barrel
varies between US$50.00 and US$ 80.00. Pressure on prices mostly derives from a complete reserve depletion perspective. Some studies indicate that the reserves might dry up in approximately 40 years (British Petroleum, 2006).
Despite new reserve discoveries, these will not cope with long-term growth in demands for energy. According to IEA (2006), based on current global energy trends, this will increase 53% by 2030. In addition to high prices and threats concerning scarcity, another risk factor lies in the fact that the largest oil reserves are located at unstable regions. Major oil suppliers still dwell in the Middle East that accounts for 62% of the world’s reserves, followed by countries in Europe and other regions of the Asian continent (BP, 2006).
From this standpoint, will bio-fuels be at all feasible? According to UNICA (2007) projections, should oil prices surpass US$ 80.00 per barrel, biodiesel then becomes feasible. For ethanol, the scenario is much brighter: oil prices just over US$ 40.00 a barrel make Brazilian sugarcane-based ethanol viable.
TRANSPORTATION DEPENDENCY ON OIL: includes transportation sector energy demand, transportation fossil fuels consumption as compared to other sources and the participation of the transportation sector in the world’s energy matrix.
According to WBCSD (2004) the transportation sector share on oil demand is expected to increase (from 56% to 62%) within the period (2.1% a year) given 60% raises in consumption. Therefore, fossil fuels ought to continue being at the core of energy sources for transportation purposes despite advances in renewable and less carbon-intense fuels (LPG, ethanol, biodiesel and hydrogen). Changing this scenario calls for investments in R&D (Research and Development) as well as in the image of bio-fuels as a clean, safe and low cost source of energy.
In North America, gasoline represents over 50% of the total energy demand for transportation, whilst diesel accounts for approximately 20%. Western Europe presents a different consumption pattern as both diesel and gasoline are responsible for some 37.5% of the sector´s demand. Gasoline is used to a greater extent in Asia (45%). Therefore, North America and Asia are the most promising markets for Brazil´s ethanol (WBCSD, 2002).
In as much as the share of road transportation categories in fuel consumption are concerned, light vehicles and trucks represented over 60% of the demand in 2002. However, light personal vehicles only accounted for 50%. Due to high per capita incomes, developed countries hold the largest light duty vehicles fleets (WBCSD, 2004). Improvements in per capita income usually imply in expansion of vehicle fleets.
110 111
BIOENERGY FROM SUGARCANECHAPTER 5
GOVERNMENTAL BIO-FUEL INCENTIVES: relating to subsidies and tax incentives.
Much of the world’s production of bio-fuels calls for some kind of incentive such as subsidies or tax exemptions to ensure prices are economically viable as compared to fossil sources.
In this sense, OECD data (2005) (average 2002-2004) portrays major countries supporting internal producers (in terms of % of the growers’ gross revenues that derives from governmental support), namely: Japan (58%), the European Union (34%), Canada (22%), Mexico (21%) and the US (17%). In Brazil, only 3% of the producers’ revenues come from federal support in the form of subsidized interest rates that result from agricultural debt renegotiations.
Tax reductions spruce in varied modes. These may be applied to the production and trade of bio-fuels, flex-fuel vehicles and also in engine conversion services that allow for the use of ethanol, biodiesel or blended fuels. Some governments also offer special financing possibilities to projects engaged with bio-fuels.
The United States presents a combination of federal, state and local subsidies that cover each transaction of the entire productive chain (industry, storage facilities, distribution centres and final ethanol consumers) and also the purchase of clean vehicles.
In 2003, the European Commission authorized member states to grant tax exemptions for ethanol and biodiesel producers (Steenblik, 2007). The Brazilian government offers tax deductions for biodiesel companies that buy a minimum percentage (50%) of their feedstock from small growers, who produce a couple of specific oilseeds (Jatropha curca, castor oil and palm) in the northern and north-eastern regions of Brazil (Probiodiesel, 2007).
Some countries also reduce export tariffs for bio-fuels in an attempt to stimulate internal production. Argentina, for instance, has different tariffs for products of the soybean value chain. While soybean meal and oil exports are taxed 24.5% of total revenues, exports of biodiesel are taxed 5% (Mathews and Goldztein, 2007). Given this policy, the government can stimulate production without necessarily depending on the internal demand.
GOVERNMENTAL BIO-FUEL RESTRICTIONS: relating to
barriers (ad valorem and specific import taxes, import quotas, fuel standardization and certifications).
Whilst governmental incentives seek to encourage the domestic production of bio-fuels, there are some restrictions protecting local growers from foreign competition. These restrictions may include fuel standardization, requirements for specific productive skills, social and environmental certifications, import quotas and import tariffs, amongst others.
Import tariffs are the most relevant restriction alternative, such as ad valorem and specific tariffs, for instance. As per IEA´s (2004b) data, Australia, a strong producer of sugarcane-based ethanol, has a specific import tariff of US$ 0.24/l on ethanol. The European Union taxes imports on a US$ 0.10/l basis (forthcoming environmental certification requirements), whilst Canadian importers pay US$ 0.07/l, the same value per litre as that practiced in Brazil. In the US, the world’s largest ethanol market, the import tariff is US$ 0.54 per gallon – mandate expiring in 2010; however, it’s expected to be further extended.
Nevertheless, tariffs are not limited to final products. Some countries also apply import tariffs to raw materials employed in the production of bio-fuels.
CLEAN VEHICLE ADOPTION: comprises the size of the vehicle fleet and its growth rate, adoption rate of hybrid cars vs. flex-fuel cars by main countries, the perspective of introducing cars using hydrogen fuel cells, the growth in the number of light-duty vehicles (LDVs) and the number of cars owned by inhabitants.
Developed countries present the largest portion of the world’s fleet; however, it is in developing countries that the situation calls for greater attention. Goldman Sachs’ forecast indicates that by 2040, China and India will respectively portray 29 and 21 cars for every hundred inhabitants, totalling over 700 million cars.
Currently, the world’s largest fleet is to be found in the US, where there are approximately 250 million vehicles using American roads (RFA, 2008). The production of E85 (85% ethanol and 15% gasoline) cars, grows at a faster rate than that of other vehicles. In 2005 alone, E85 flex productions increased 16% as compared to a 5% growth in the production of vehicles that exclusively run on fossil fuels (OICA, 2007). According to the Renewable Fuels Association (RFA, 2008), the US fleet already accounts for 7 million E85 flex vehicles. The most relevant barrier to the wide spreading of this technology throughout the country however, is the low number of fuel stations that offer the product. Less than 2% of the 170 thousand American fuel stations offer E85 pumps.
Flex-fuel cars were adopted in Brazil since their very launch in 2003. This new technology promoted a major change in consumer behaviour due to the fact that it minimizes risks posed by exclusively ethanol fuelled cars, such as the shortage of fuel and high prices during mid-crops. The impact of flex-fuel vehicles (FFVs) in car sales was intense and rampant. In the market debut year, FFVs’ share in total light-duty vehicle sales topped 6.8%. In 2009, FFVs accounted for over 90% of total sales and already represent 40% of Brazil’s light vehicle fleet. Projections claim that by 2015, the Brazilian fleet will comprise 30 million vehicles, of which 19 million are expected to be of the FFV type
112 113
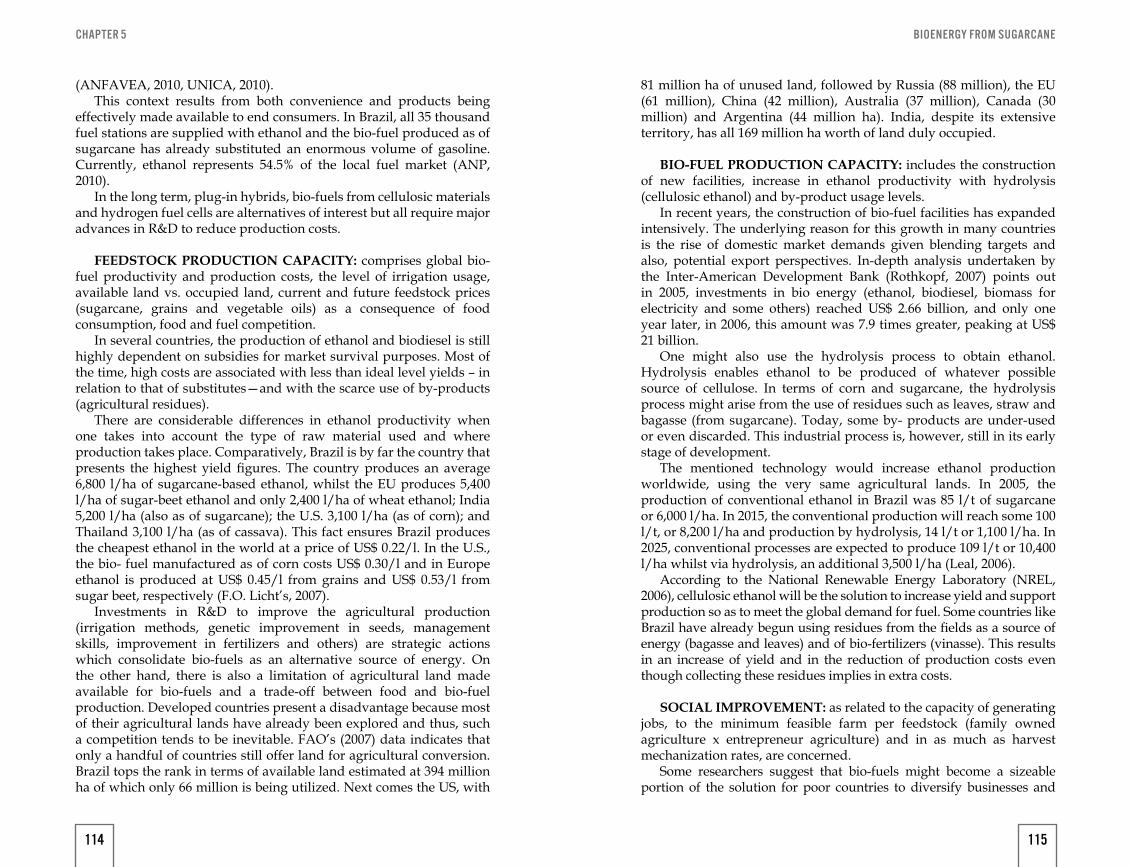
BIOENERGY FROM SUGARCANECHAPTER 5
(ANFAVEA, 2010, UNICA, 2010).This context results from both convenience and products being
effectively made available to end consumers. In Brazil, all 35 thousand fuel stations are supplied with ethanol and the bio-fuel produced as of sugarcane has already substituted an enormous volume of gasoline. Currently, ethanol represents 54.5% of the local fuel market (ANP, 2010).
In the long term, plug-in hybrids, bio-fuels from cellulosic materials and hydrogen fuel cells are alternatives of interest but all require major advances in R&D to reduce production costs.
FEEDSTOCK PRODUCTION CAPACITY: comprises global bio-fuel productivity and production costs, the level of irrigation usage, available land vs. occupied land, current and future feedstock prices (sugarcane, grains and vegetable oils) as a consequence of food consumption, food and fuel competition.
In several countries, the production of ethanol and biodiesel is still highly dependent on subsidies for market survival purposes. Most of the time, high costs are associated with less than ideal level yields – in relation to that of substitutes—and with the scarce use of by-products (agricultural residues).
There are considerable differences in ethanol productivity when one takes into account the type of raw material used and where production takes place. Comparatively, Brazil is by far the country that presents the highest yield figures. The country produces an average 6,800 l/ha of sugarcane-based ethanol, whilst the EU produces 5,400 l/ha of sugar-beet ethanol and only 2,400 l/ha of wheat ethanol; India 5,200 l/ha (also as of sugarcane); the U.S. 3,100 l/ha (as of corn); and Thailand 3,100 l/ha (as of cassava). This fact ensures Brazil produces the cheapest ethanol in the world at a price of US$ 0.22/l. In the U.S., the bio- fuel manufactured as of corn costs US$ 0.30/l and in Europe ethanol is produced at US$ 0.45/l from grains and US$ 0.53/l from sugar beet, respectively (F.O. Licht’s, 2007).
Investments in R&D to improve the agricultural production (irrigation methods, genetic improvement in seeds, management skills, improvement in fertilizers and others) are strategic actions which consolidate bio-fuels as an alternative source of energy. On the other hand, there is also a limitation of agricultural land made available for bio-fuels and a trade-off between food and bio-fuel production. Developed countries present a disadvantage because most of their agricultural lands have already been explored and thus, such a competition tends to be inevitable. FAO’s (2007) data indicates that only a handful of countries still offer land for agricultural conversion. Brazil tops the rank in terms of available land estimated at 394 million ha of which only 66 million is being utilized. Next comes the US, with
81 million ha of unused land, followed by Russia (88 million), the EU (61 million), China (42 million), Australia (37 million), Canada (30 million) and Argentina (44 million ha). India, despite its extensive territory, has all 169 million ha worth of land duly occupied.
BIO-FUEL PRODUCTION CAPACITY: includes the construction of new facilities, increase in ethanol productivity with hydrolysis (cellulosic ethanol) and by-product usage levels.
In recent years, the construction of bio-fuel facilities has expanded intensively. The underlying reason for this growth in many countries is the rise of domestic market demands given blending targets and also, potential export perspectives. In-depth analysis undertaken by the Inter-American Development Bank (Rothkopf, 2007) points out in 2005, investments in bio energy (ethanol, biodiesel, biomass for electricity and some others) reached US$ 2.66 billion, and only one year later, in 2006, this amount was 7.9 times greater, peaking at US$ 21 billion.
One might also use the hydrolysis process to obtain ethanol. Hydrolysis enables ethanol to be produced of whatever possible source of cellulose. In terms of corn and sugarcane, the hydrolysis process might arise from the use of residues such as leaves, straw and bagasse (from sugarcane). Today, some by- products are under-used or even discarded. This industrial process is, however, still in its early stage of development.
The mentioned technology would increase ethanol production worldwide, using the very same agricultural lands. In 2005, the production of conventional ethanol in Brazil was 85 l/t of sugarcane or 6,000 l/ha. In 2015, the conventional production will reach some 100 l/t, or 8,200 l/ha and production by hydrolysis, 14 l/t or 1,100 l/ha. In 2025, conventional processes are expected to produce 109 l/t or 10,400 l/ha whilst via hydrolysis, an additional 3,500 l/ha (Leal, 2006).
According to the National Renewable Energy Laboratory (NREL, 2006), cellulosic ethanol will be the solution to increase yield and support production so as to meet the global demand for fuel. Some countries like Brazil have already begun using residues from the fields as a source of energy (bagasse and leaves) and of bio-fertilizers (vinasse). This results in an increase of yield and in the reduction of production costs even though collecting these residues implies in extra costs.
SOCIAL IMPROVEMENT: as related to the capacity of generating jobs, to the minimum feasible farm per feedstock (family owned agriculture x entrepreneur agriculture) and in as much as harvest mechanization rates, are concerned.
Some researchers suggest that bio-fuels might become a sizeable portion of the solution for poor countries to diversify businesses and
114 115
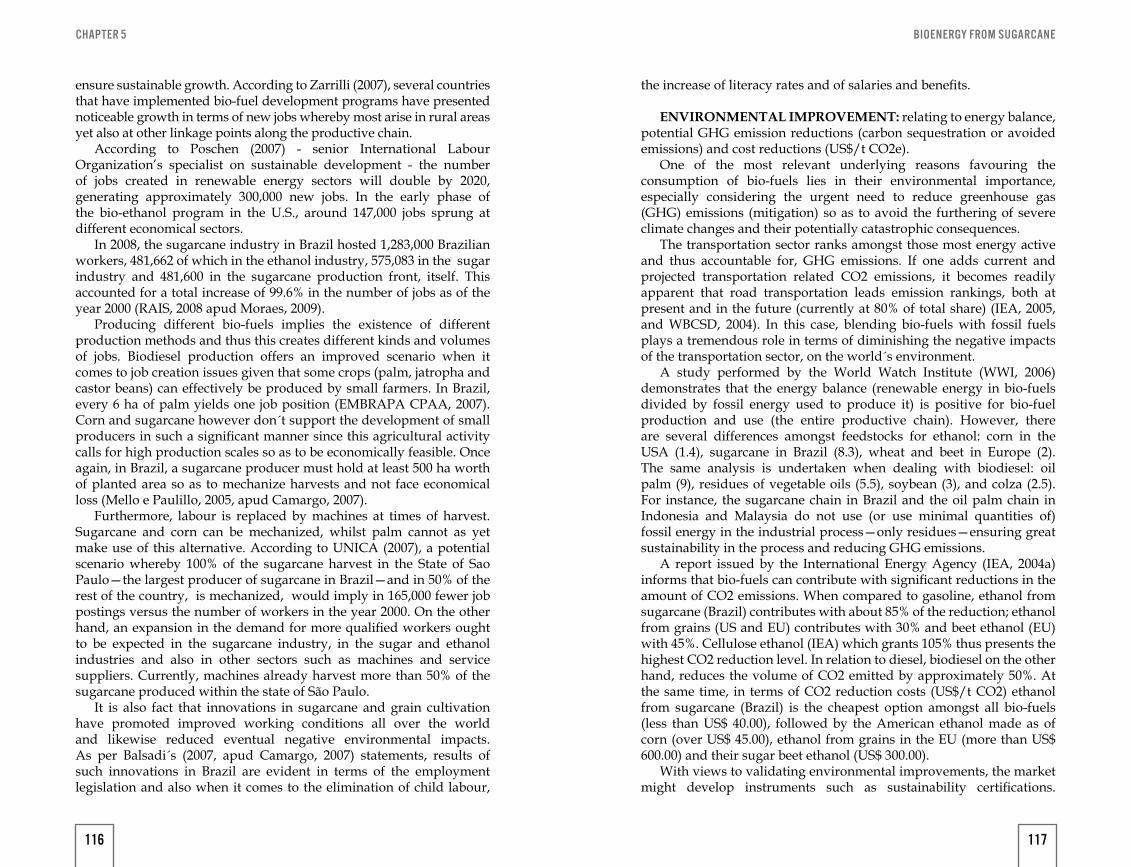
BIOENERGY FROM SUGARCANECHAPTER 5
ensure sustainable growth. According to Zarrilli (2007), several countries that have implemented bio-fuel development programs have presented noticeable growth in terms of new jobs whereby most arise in rural areas yet also at other linkage points along the productive chain.
According to Poschen (2007) - senior International Labour Organization’s specialist on sustainable development - the number of jobs created in renewable energy sectors will double by 2020, generating approximately 300,000 new jobs. In the early phase of the bio-ethanol program in the U.S., around 147,000 jobs sprung at different economical sectors.
In 2008, the sugarcane industry in Brazil hosted 1,283,000 Brazilian workers, 481,662 of which in the ethanol industry, 575,083 in the sugar industry and 481,600 in the sugarcane production front, itself. This accounted for a total increase of 99.6% in the number of jobs as of the year 2000 (RAIS, 2008 apud Moraes, 2009).
Producing different bio-fuels implies the existence of different production methods and thus this creates different kinds and volumes of jobs. Biodiesel production offers an improved scenario when it comes to job creation issues given that some crops (palm, jatropha and castor beans) can effectively be produced by small farmers. In Brazil, every 6 ha of palm yields one job position (EMBRAPA CPAA, 2007). Corn and sugarcane however don´t support the development of small producers in such a significant manner since this agricultural activity calls for high production scales so as to be economically feasible. Once again, in Brazil, a sugarcane producer must hold at least 500 ha worth of planted area so as to mechanize harvests and not face economical loss (Mello e Paulillo, 2005, apud Camargo, 2007).
Furthermore, labour is replaced by machines at times of harvest. Sugarcane and corn can be mechanized, whilst palm cannot as yet make use of this alternative. According to UNICA (2007), a potential scenario whereby 100% of the sugarcane harvest in the State of Sao Paulo—the largest producer of sugarcane in Brazil—and in 50% of the rest of the country, is mechanized, would imply in 165,000 fewer job postings versus the number of workers in the year 2000. On the other hand, an expansion in the demand for more qualified workers ought to be expected in the sugarcane industry, in the sugar and ethanol industries and also in other sectors such as machines and service suppliers. Currently, machines already harvest more than 50% of the sugarcane produced within the state of São Paulo.
It is also fact that innovations in sugarcane and grain cultivation have promoted improved working conditions all over the world and likewise reduced eventual negative environmental impacts. As per Balsadi´s (2007, apud Camargo, 2007) statements, results of such innovations in Brazil are evident in terms of the employment legislation and also when it comes to the elimination of child labour,
the increase of literacy rates and of salaries and benefits.
ENVIRONMENTAL IMPROVEMENT: relating to energy balance, potential GHG emission reductions (carbon sequestration or avoided emissions) and cost reductions (US$/t CO2e).
One of the most relevant underlying reasons favouring the consumption of bio-fuels lies in their environmental importance, especially considering the urgent need to reduce greenhouse gas (GHG) emissions (mitigation) so as to avoid the furthering of severe climate changes and their potentially catastrophic consequences.
The transportation sector ranks amongst those most energy active and thus accountable for, GHG emissions. If one adds current and projected transportation related CO2 emissions, it becomes readily apparent that road transportation leads emission rankings, both at present and in the future (currently at 80% of total share) (IEA, 2005, and WBCSD, 2004). In this case, blending bio-fuels with fossil fuels plays a tremendous role in terms of diminishing the negative impacts of the transportation sector, on the world´s environment.
A study performed by the World Watch Institute (WWI, 2006) demonstrates that the energy balance (renewable energy in bio-fuels divided by fossil energy used to produce it) is positive for bio-fuel production and use (the entire productive chain). However, there are several differences amongst feedstocks for ethanol: corn in the USA (1.4), sugarcane in Brazil (8.3), wheat and beet in Europe (2). The same analysis is undertaken when dealing with biodiesel: oil palm (9), residues of vegetable oils (5.5), soybean (3), and colza (2.5). For instance, the sugarcane chain in Brazil and the oil palm chain in Indonesia and Malaysia do not use (or use minimal quantities of) fossil energy in the industrial process—only residues—ensuring great sustainability in the process and reducing GHG emissions.
A report issued by the International Energy Agency (IEA, 2004a) informs that bio-fuels can contribute with significant reductions in the amount of CO2 emissions. When compared to gasoline, ethanol from sugarcane (Brazil) contributes with about 85% of the reduction; ethanol from grains (US and EU) contributes with 30% and beet ethanol (EU) with 45%. Cellulose ethanol (IEA) which grants 105% thus presents the highest CO2 reduction level. In relation to diesel, biodiesel on the other hand, reduces the volume of CO2 emitted by approximately 50%. At the same time, in terms of CO2 reduction costs (US$/t CO2) ethanol from sugarcane (Brazil) is the cheapest option amongst all bio-fuels (less than US$ 40.00), followed by the American ethanol made as of corn (over US$ 45.00), ethanol from grains in the EU (more than US$ 600.00) and their sugar beet ethanol (US$ 300.00).
With views to validating environmental improvements, the market might develop instruments such as sustainability certifications.
116 117
BIOENERGY FROM SUGARCANECHAPTER 5
The main bio-fuel certifications ideated to date arose from national governments, the private sector, non-governmental and international organizations. The certification process starts with the definition of sustainability principles that address environmental, social and economical concerns, establishes effective criteria, creates clear and precise indicators that allow for the quantification of benefits to achieve, defines an economically viable methodology and organizes monitoring systems (Mathews, 2008).
KEY FORCE RANKING AND CORRELATION MATRIX
Consolidated key forces were organized into a list. For ranking definition purposes, 27 experts from all continents were queried: Asia, Africa, America, Europe and Oceania. However, we only received 14 answers from the following countries : Argentina, Australia, Brazil, Canada, China, Japan, South Africa, France, the Netherlands and USA.
Experts were asked to analyze key forces and then classify these according to two variables, namely:
■ Each key force´s degree of importance for the success or failure of the focal issue (mandatory blending targets) according to a ranking score ranging from 0 (low importance) to 10 points (high importance);
■ Each key force´s degree of uncertainty according to a ranking score ranging from 0 (low uncertainty) to 10 points (high uncertainty).
Therefore, figure 1 shows an opinion map (perceptual map) identifying which factors are most important and most uncertain. Per specialized opinions, the most relevant factor for decisions concerning adding bio-fuels to either gasoline or diesel is the unit price of a barrel of oil. However, this is also mentioned as being the least certain, or predictable, factor.
Bio-fuel production capacity emerges as the most certain variable given that the amount of investment in traditional bio-fuel (1st generation) productive capacity and in cellulose bio-fuel (2nd generation) R&D development, is sizeable enough, to positively influence countries in their decisions concerning whether or not blending targets are worth adopting.
Setting aside the less relevant “clean vehicle adoption” aspect, the least important and second most uncertain (only short of oil prices) variables, according to experts, were those associated with the social and environmental aspects of bio-fuel production in as much as rural workers’ living standards, use of disposable agriculture residues, positive balance of GHG emissions throughout the entire productive chain and other issues, is concerned. Thus, it seems that specialists
are apparently most attentive to energy security and economic sustainability matters within their own economies as opposed to bio-fuel social and environmental impacts.
As foreseen, the decision to adopt or to do otherwise when it comes to flex-fuel automobiles barely influences those concerning mandatory blending targets. The main focus pertains to governmental incentives and restrictions as to domestic agriculture and the capacity to offer feedstock for the production of bio-fuels. Finally, uncertainties as to domestic protectionism are not of extreme relevance and are, furthermore, subject to positive modifications upon greater international trade of bio-fuels and feedstock
Finally, a matrix of correlation is prepared to identify the relationships amongst the key forces, since trends are capable of influencing one another. Here, the “+”sign means that the occurrence of one key force positively influences the other. The “-” sign indicates there is a negative influence of one key force over another. Finally, the “0” sign means that there is no effect at all and the “±” sign means that one trend impacts another both positively and negatively.
For example, oil prices will have a positive impact on the adoption of clean vehicles if they reach levels whereby running on bio-fuels becomes a cheaper alternative. On the other hand, if oil prices are lower than that of bio- fuels, this is deemed a negative impact. Table 3 presents this perspective.
FIG. 1: KEY FORCE PERCEPTUAL MAP
IMPORTANCE
UNCE
RTAI
NTY
6
5
4
3
2
1
05 6 7 8 9 10
Oil prices
Transport Oil Defendency
Biofuels Governmental Incentives
Biofuels Governmental Restrictions
Clean Vehicle Adoption
Feedstock Production Capacity
Biofuels Productions Capacity
Social Improvements
Environmental Improvements
Source: Prepared by authors.
118 119
BIOENERGY FROM SUGARCANECHAPTER 5TA
BLE 3
: KEY
FOR
CE C
ORRE
LATI
ON M
ATRI
X
KEY
FORC
ES
OIL PRICES
TRANSPORT
BIO-FUELS GOVERNMENTAL
INCENTIVES
BIO-FUELSGOVERNMENTAL RESTRICTIONS
CLEA VEHICLE ADO
FEEDSTOCKPRODUCTION
BIO-FUELSPRODUCTIO
SOCIAL IMPROVEMENT
ENVIRONMENTAL
Oil
Pric
es±
±±
±±
±0
0
Tran
spor
t oil
Dep
ende
ncy
++
++
+0
0
Bio-
fuel
s G
over
nmen
tal
ince
ntiv
es+
++
++
+
Bio-
fuel
s G
over
nmen
tal
Res
tric
tions
-±
±+
+
Cle
an V
ehic
le A
dopt
ion
+±
++
Feed
stoc
k Pr
oduc
tion
Cap
acity
+±
±
Bio-
Fuel
s Pr
oduc
tion
Cap
acity
±±
Soci
al Im
prov
emen
ts+
Envi
ronm
enta
l Im
prov
emen
ts
Sour
ce: P
repa
red
by th
e au
thor
s.
MANDATORY BLENDING TARGET SCENARIOS UP TO 2020
Since the international demand for bio-fuels depends on countries establishing mandatory blending targets, one might design scenarios for bio-fuel demand as of this institutional environment. To thus proceed, key analysis variables (or drivers) were required and these pertained to environment variables with the most power of influencing the focal issue (demand for bio- fuels), irrespective of their uncertainty, which are also capable of promoting the shaping of scenarios of contrast, depending on their varied, final condition.
In this sense, the last session selected key drivers by analyzing energy markets (oil, bio-fuels and feedstocks), new technologies (flex-fuel cars, hybrid cars, hydrogen cell, hydrolysis to cellulose ethanol and new agricultural varieties), political factors (governmental restrictions and incentives), economic forces (bio-fuels productivity, production costs and processing capacity) and sustainable forces (social and environmental improvements).
CHART 3: MANDATORY BLENDING TARGETS SCENARIOS UP TO Y2020.
"PESSIMISTIC" SCENARIO COUNTRIES REDUCE CURRENT
TARGETSUSA (BLENDING TARGETS 15% -> 10%)CHINA (BLENDING TARGETS 15% -> 10%)EU (10% -> 5,75%)
"EXPECTED" SCENARIO COUNTRIES MAINTAIN
CURRENT TARGETS
“OPTIMISTIC” SCENARIO RISE OF CURRENT
TARGETS+ ADOPTION BY OTHER COUNTRIES SUCH AS
RUSSIA AND JAPAN
Oil
Pric
es
■ Discovery of new wells. ■ Increase of production. ■ Barrel at US$ 40.
■ Steady production (at recent levels).
■ Low investments in prospecting new wells.
■ Barrel at US$ 80.
■ Production drop by major suppliers located at unstable regions (outputs below historical average/figures)
■ Scarce investments in discovering new wells.
■ Barrel at US$ 120.Tr
ansp
ort O
il D
epen
denc
y ■ Consecutive economic crises.
■ Lower credits. ■ Strengthen public clean transportation and fewer personal vehicles.
■ Strengthen rail, water and airway transportation.
■ Maintenance of economic prosperity, but with lower growth rates than in recent years.
■ Rise of economic prosperity.
■ Maintenance of current economic growth rate and personal and commercial vehicle sales.
120 121
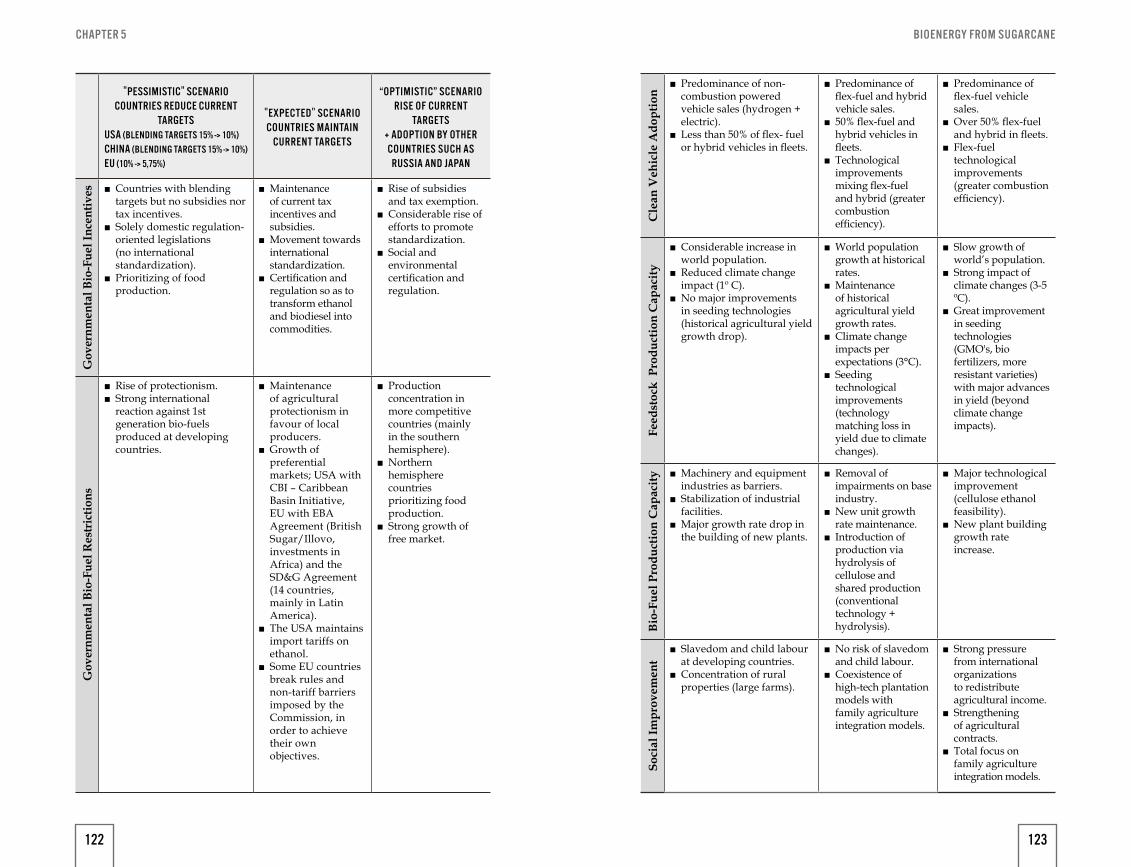
BIOENERGY FROM SUGARCANECHAPTER 5
"PESSIMISTIC" SCENARIO COUNTRIES REDUCE CURRENT
TARGETSUSA (BLENDING TARGETS 15% -> 10%)CHINA (BLENDING TARGETS 15% -> 10%)EU (10% -> 5,75%)
"EXPECTED" SCENARIO COUNTRIES MAINTAIN
CURRENT TARGETS
“OPTIMISTIC” SCENARIO RISE OF CURRENT
TARGETS+ ADOPTION BY OTHER COUNTRIES SUCH AS
RUSSIA AND JAPAN
Gov
ernm
enta
l Bio
-Fue
l Inc
entiv
es ■ Countries with blending targets but no subsidies nor tax incentives.
■ Solely domestic regulation-oriented legislations (no international standardization).
■ Prioritizing of food production.
■ Maintenance of current tax incentives and subsidies.
■ Movement towards international standardization.
■ Certification and regulation so as to transform ethanol and biodiesel into commodities.
■ Rise of subsidies and tax exemption.
■ Considerable rise of efforts to promote standardization.
■ Social and environmental certification and regulation.
Gov
ernm
enta
l Bio
-Fue
l Res
tric
tions
■ Rise of protectionism. ■ Strong international reaction against 1st generation bio-fuels produced at developing countries.
■ Maintenance of agricultural protectionism in favour of local producers.
■ Growth of preferential markets; USA with CBI – Caribbean Basin Initiative, EU with EBA Agreement (British Sugar/Illovo, investments in Africa) and the SD&G Agreement (14 countries, mainly in Latin America).
■ The USA maintains import tariffs on ethanol.
■ Some EU countries break rules and non-tariff barriers imposed by the Commission, in order to achieve their own objectives.
■ Production concentration in more competitive countries (mainly in the southern hemisphere).
■ Northern hemisphere countries prioritizing food production.
■ Strong growth of free market.
Cle
an V
ehic
le A
dopt
ion
■ Predominance of non- combustion powered vehicle sales (hydrogen + electric).
■ Less than 50% of flex- fuel or hybrid vehicles in fleets.
■ Predominance of flex-fuel and hybrid vehicle sales.
■ 50% flex-fuel and hybrid vehicles in fleets.
■ Technological improvements mixing flex-fuel and hybrid (greater combustion efficiency).
■ Predominance of flex-fuel vehicle sales.
■ Over 50% flex-fuel and hybrid in fleets.
■ Flex-fuel technological improvements (greater combustion efficiency).
Feed
stoc
k P
rodu
ctio
n C
apac
ity
■ Considerable increase in world population.
■ Reduced climate change impact (1º C).
■ No major improvements in seeding technologies (historical agricultural yield growth drop).
■ World population growth at historical rates.
■ Maintenance of historical agricultural yield growth rates.
■ Climate change impacts per expectations (3°C).
■ Seeding technological improvements (technology matching loss in yield due to climate changes).
■ Slow growth of world’s population.
■ Strong impact of climate changes (3-5 ºC).
■ Great improvement in seeding technologies (GMO's, bio fertilizers, more resistant varieties) with major advances in yield (beyond climate change impacts).
Bio-
Fuel
Pro
duct
ion
Cap
acity
■ Machinery and equipment industries as barriers.
■ Stabilization of industrial facilities.
■ Major growth rate drop in the building of new plants.
■ Removal of impairments on base industry.
■ New unit growth rate maintenance.
■ Introduction of production via hydrolysis of cellulose and shared production (conventional technology + hydrolysis).
■ Major technological improvement (cellulose ethanol feasibility).
■ New plant building growth rate increase.
Soci
al Im
prov
emen
t ■ Slavedom and child labour at developing countries.
■ Concentration of rural properties (large farms).
■ No risk of slavedom and child labour.
■ Coexistence of high-tech plantation models with family agriculture integration models.
■ Strong pressure from international organizations to redistribute agricultural income.
■ Strengthening of agricultural contracts.
■ Total focus on family agriculture integration models.
122 123
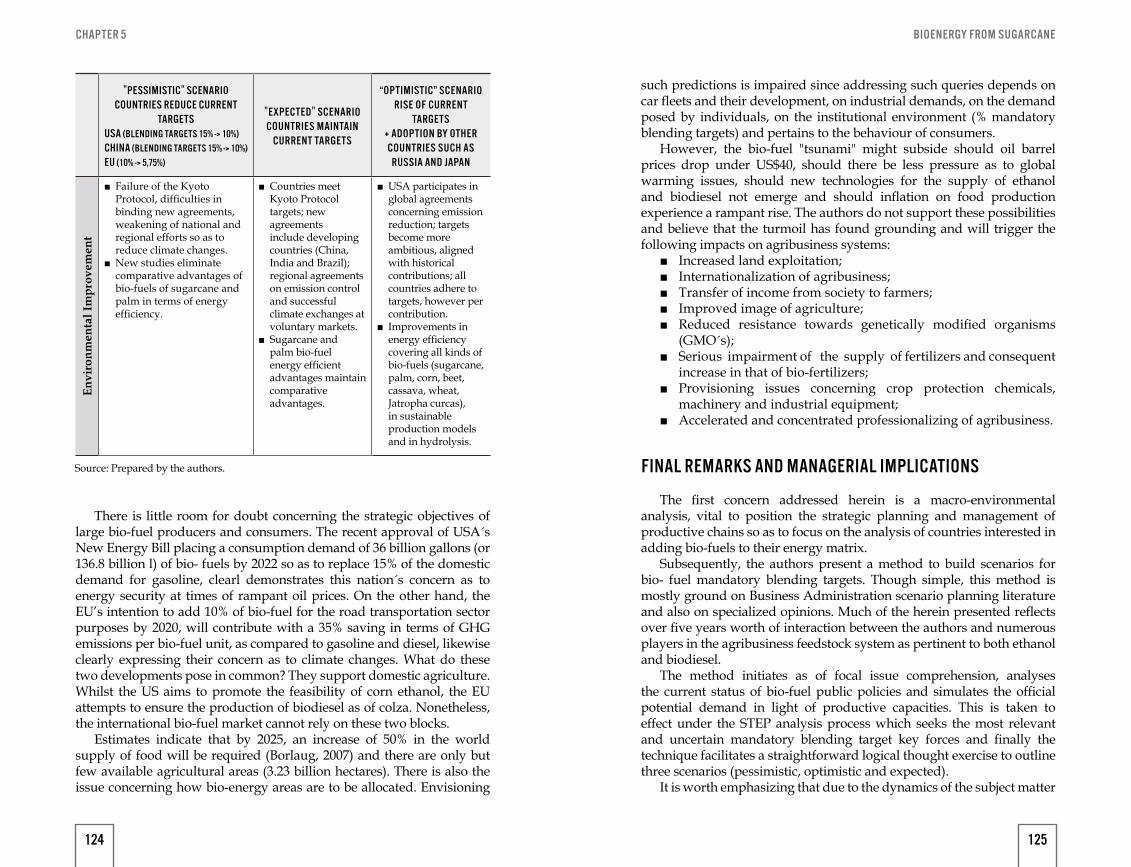
BIOENERGY FROM SUGARCANECHAPTER 5
There is little room for doubt concerning the strategic objectives of large bio-fuel producers and consumers. The recent approval of USA´s New Energy Bill placing a consumption demand of 36 billion gallons (or 136.8 billion l) of bio- fuels by 2022 so as to replace 15% of the domestic demand for gasoline, clearl demonstrates this nation´s concern as to energy security at times of rampant oil prices. On the other hand, the EU’s intention to add 10% of bio-fuel for the road transportation sector purposes by 2020, will contribute with a 35% saving in terms of GHG emissions per bio-fuel unit, as compared to gasoline and diesel, likewise clearly expressing their concern as to climate changes. What do these two developments pose in common? They support domestic agriculture. Whilst the US aims to promote the feasibility of corn ethanol, the EU attempts to ensure the production of biodiesel as of colza. Nonetheless, the international bio-fuel market cannot rely on these two blocks.
Estimates indicate that by 2025, an increase of 50% in the world supply of food will be required (Borlaug, 2007) and there are only but few available agricultural areas (3.23 billion hectares). There is also the issue concerning how bio-energy areas are to be allocated. Envisioning
"PESSIMISTIC" SCENARIO COUNTRIES REDUCE CURRENT
TARGETSUSA (BLENDING TARGETS 15% -> 10%)CHINA (BLENDING TARGETS 15% -> 10%)EU (10% -> 5,75%)
"EXPECTED" SCENARIO COUNTRIES MAINTAIN
CURRENT TARGETS
“OPTIMISTIC” SCENARIO RISE OF CURRENT
TARGETS+ ADOPTION BY OTHER COUNTRIES SUCH AS
RUSSIA AND JAPAN
Envi
ronm
enta
l Im
prov
emen
t
■ Failure of the Kyoto Protocol, difficulties in binding new agreements, weakening of national and regional efforts so as to reduce climate changes.
■ New studies eliminate comparative advantages of bio-fuels of sugarcane and palm in terms of energy efficiency.
■ Countries meet Kyoto Protocol targets; new agreements include developing countries (China, India and Brazil); regional agreements on emission control and successful climate exchanges at voluntary markets.
■ Sugarcane and palm bio-fuel energy efficient advantages maintain comparative advantages.
■ USA participates in global agreements concerning emission reduction; targets become more ambitious, aligned with historical contributions; all countries adhere to targets, however per contribution.
■ Improvements in energy efficiency covering all kinds of bio-fuels (sugarcane, palm, corn, beet, cassava, wheat, Jatropha curcas), in sustainable production models and in hydrolysis.
Source: Prepared by the authors.
such predictions is impaired since addressing such queries depends on car fleets and their development, on industrial demands, on the demand posed by individuals, on the institutional environment (% mandatory blending targets) and pertains to the behaviour of consumers.
However, the bio-fuel "tsunami" might subside should oil barrel prices drop under US$40, should there be less pressure as to global warming issues, should new technologies for the supply of ethanol and biodiesel not emerge and should inflation on food production experience a rampant rise. The authors do not support these possibilities and believe that the turmoil has found grounding and will trigger the following impacts on agribusiness systems:
■ Increased land exploitation; ■ Internationalization of agribusiness; ■ Transfer of income from society to farmers; ■ Improved image of agriculture; ■ Reduced resistance towards genetically modified organisms
(GMO´s); ■ Serious impairment of the supply of fertilizers and consequent
increase in that of bio-fertilizers; ■ Provisioning issues concerning crop protection chemicals,
machinery and industrial equipment; ■ Accelerated and concentrated professionalizing of agribusiness.
FINAL REMARKS AND MANAGERIAL IMPLICATIONS
The first concern addressed herein is a macro-environmental analysis, vital to position the strategic planning and management of productive chains so as to focus on the analysis of countries interested in adding bio-fuels to their energy matrix.
Subsequently, the authors present a method to build scenarios for bio- fuel mandatory blending targets. Though simple, this method is mostly ground on Business Administration scenario planning literature and also on specialized opinions. Much of the herein presented reflects over five years worth of interaction between the authors and numerous players in the agribusiness feedstock system as pertinent to both ethanol and biodiesel.
The method initiates as of focal issue comprehension, analyses the current status of bio-fuel public policies and simulates the official potential demand in light of productive capacities. This is taken to effect under the STEP analysis process which seeks the most relevant and uncertain mandatory blending target key forces and finally the technique facilitates a straightforward logical thought exercise to outline three scenarios (pessimistic, optimistic and expected).
It is worth emphasizing that due to the dynamics of the subject matter
124 125
BIOENERGY FROM SUGARCANECHAPTER 5
itself, a significant portion of recent publications concerning scenarios may not hold true in the near future. Nevertheless, investments in R&D are so expressive, that bio-fuel technical-scientific developments should continue to be of great significance.
Finally, environmental analysis that includes the preparation of scenarios is meaningless should countries not follow suit and conduct local analysis for the sake of their own agribusiness systems and do not realize how to best adapt to the overall environment. A clear cut understanding of domestic industry strengths and weaknesses is mandatory. The underlying concept rests on the fact that strengths are subject to exploitation whilst weak points are prone to improvement once strategic projects are developed to address critical issues including innovation, communication, distribution and logistics, human resources, and production system coordination.
BY MARCOS FAVA NEVES, JONNY MATEUS RODRIGUES, FELIPE GERARDI AND RAFAEL BORDONAL KALAKI
SUGAR CANE GROWERS SITUATION IN BRAZIL
6
Originally published in Originally published in 27th Annual IFAMA World Conference: Technology, Investment, and People: Business Solutions for Food Security, 2017, Miami, Flórida, USA.
126
BIOENERGY FROM SUGARCANE
INTRODUCTION
In 2014 Brazil was the largest producer of sugarcane with a 39.1% share. In sugar production, the country is also the biggest producer with 21% of the total and the largest exporter with a share of 45% in total exports. In ethanol production, the country occupied the second position with a total of 27% (FAO, 2014; RFA, 2015; USDA, 2015).
The sector has a strong impact as a wealth generator for the nation, and in 2013/2014 it generated US$ 43.4 billion, which was equivalent to about 2% of Brazil’s GDP. The total sum of the sales of the various links that make up the agro-industrial system of sugarcane reached US$ 107.7 billion. The trend is that these values continue to increase while other products, which today are not the main sources of income, gain more importance in wealth generation such as bioelectricity, yeast, bioplastics, sugarcane diesel, biobutanol, cellulosic ethanol and carbon credits (Neves & Trombin, 2014).
Currently, the sector has faced a crisis, imposing several challenges on it such as the increasing production costs that are tightening the margins of growers, indebtedness of the industrial units, lack of government support and specific public policies for the sector, control of prices, which interferes with the competitiveness of ethanol, among other problems.
In a time of crisis and difficulties faced by a sector, efficiency and competitiveness are solutions to face and overcome this situation. At this point, the analysis of the business brings a vision of opportunities and threats, points to be improved (weaknesses) and those that can be used as a competitive advantage (strengths).
Within this context, rural growers can use these tools to understand how their businesses participates in interactions with market players, what their differentials are in relation to their business or product, thus they are able to analyze and understand which aspects must be boosted and which should be reviewed to think about their business with a long-term vision.
Based on the arguments above, this paper aims to answer the following questions: What is the situation of Brazilian sugarcane growers in 2016? And how do they evaluate their competitiveness?
THEORETICAL FRAMEWORK
Authors such as ANSOFF (1977), PORTER (1980), CHANDLER (1962), and HAMMEL & PRAHALAD (1997), see competitiveness as a phenomenon directly linked to existing characteristics in a product or sector, which are related to the performance of the product or sector on the market or the technical efficiency of production processes.
129
BIOENERGY FROM SUGARCANECHAPTER 6
The concept of productivity is broad enough to assume different perspectives such as operational issues, planning, supply chain, among others. However, in this study, the concept of productivity will be seen from the perspective of the internal analysis of the business, resources and competencies of the company.
There are several internal analysis tools of a business found in the literature. Porter (1979) defines the interaction of a company in micro and macroenvironment using a model known as "Porter's 5 forces". Brought to the reality of the rural producer, it has as its central force its rivalry with other rural producers. This interaction allows other four interactions, such as the threat of new producers gaining access to the market, the threat of new substitutes, the bargaining power of suppliers and, finally, the bargaining power of customers (Boehlje et al., 2004).
For Chiavenato (2004), understanding the environment in which the company is inserted enables the identification of opportunities to be used by the company and also threats that the environment provides, which should be mitigated. Together with the external diagnosis, the company starts to look at itself and aims to identify strengths to be amplified and strengthened and points of difficulties, which must be carefully identified and repaired.
The main theoretical pillars that govern this paper are those related to internal analysis of the business, focusing on the analysis of resources, capabilities and core competencies. It also brings the concept of internal farm analysis, the theory of Farm Value Plate Analysis.
RESOURCES, CAPABILITIES AND CORE COMPETENCIES
Chiavenato (2004) understands and divides the internal analysis of a company into three main pillars: Analysis of Resources, Analysis of the Organizational Structure, and Performance Evaluation.
The concept of Analysis of Resources, encompasses any and all artifice that a company possesses in its benefit to carry out its activity, which can be physical structure, financial condition, human capital, among others. For Organizational Structure Analysis, the author considers how long-term strategy was defined in the company, and in which sectors it was more dismembered and requested, besides considering the division of labor within the organization. Finally, it defines the Performance Evaluation as the results presented by the company in a certain period of time (CHIAVENATO, 2004).
Gray et al. (2004) states that for a business to have a competitive advantage over its competitors, it needs to understand and combine aspects such as resources, capabilities and core competencies.
RESOURCES
The resources of a company constitute any and all artifices that a company possesses in its benefit for the accomplishment of its activity, ranging from physical, buildings, structure, machinery, financial, human and intellectual capital (CHIAVENATO, 2004).
For Gray et al. (2004), resource is all assets that producers have in their favor to carry out activities or support the company, which may be in a tangible scope classified as intangible.
Applied to the scope of the farm, tangible resources are classified as resources that encompass every palpable asset that an organization has in its benefit to carry out its production, being machinery, personnel, inputs, land and capital. Intangible resources are those related to a more abstract scope of business, the non-tangible parts of a farm that support the production process, and which may be, for example, the relationship with its suppliers of inputs, customers, other competing producers, and the community in which that farm operates (GRAY ET AL., 2004).
CAPABILITIES
For Grant (1996), capabilities within a company can be understood as the association of different sources of knowledge, culminating in several levels of capabilities, associated with a pyramid. At the base of the pyramid we have the knowledge of individuals that make up the company. This factor is added to specific tasks and activities of certain sectors of the company. Finally, the inherent knowledge of the company is complemented by activities that encompass interconnected or interdependent areas.
The concept of capacities and main skills, relates to what the producer has as best practices, assertive decisions in the business, and in general, all the differential generated by single elements of that business that brings competitive advantage (GRAY ET AL., 2004).
CORE COMPETENCIES
For Fleury (2000), the content of the term competence for an organization is directly associated with the ability to deal, interact and modify its resources in benefits of the organization aiming to generate value.
Kotler (2014) understands that the core competencies of a business are the generators of competitive advantage. In addition, they are the result of the correct use of essential resources perceived by consumers. In addition to this, the author states that are three inherent peculiarities.
130 131
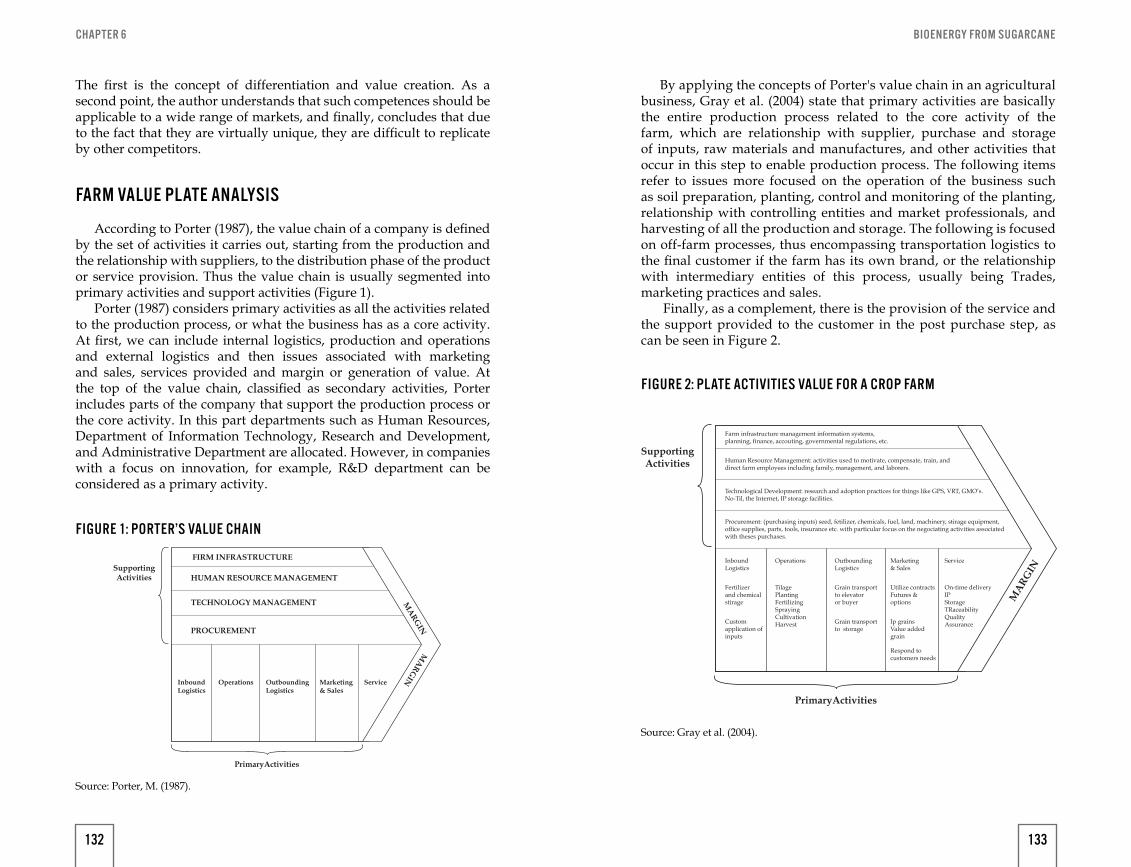
BIOENERGY FROM SUGARCANECHAPTER 6
The first is the concept of differentiation and value creation. As a second point, the author understands that such competences should be applicable to a wide range of markets, and finally, concludes that due to the fact that they are virtually unique, they are difficult to replicate by other competitors.
FARM VALUE PLATE ANALYSIS
According to Porter (1987), the value chain of a company is defined by the set of activities it carries out, starting from the production and the relationship with suppliers, to the distribution phase of the product or service provision. Thus the value chain is usually segmented into primary activities and support activities (Figure 1).
Porter (1987) considers primary activities as all the activities related to the production process, or what the business has as a core activity. At first, we can include internal logistics, production and operations and external logistics and then issues associated with marketing and sales, services provided and margin or generation of value. At the top of the value chain, classified as secondary activities, Porter includes parts of the company that support the production process or the core activity. In this part departments such as Human Resources, Department of Information Technology, Research and Development, and Administrative Department are allocated. However, in companies with a focus on innovation, for example, R&D department can be considered as a primary activity.
SupportingActivities
PrimaryActivities
FIRM INFRASTRUCTURE
HUMAN RESOURCE MANAGEMENT
TECHNOLOGY MANAGEMENT
PROCUREMENT
InboundLogistics
Operations ServiceMarketing & Sales
OutboundingLogistics
MA
RG
INM
AR
GIN
FIGURE 1: PORTER’S VALUE CHAIN
Source: Porter, M. (1987).
By applying the concepts of Porter's value chain in an agricultural business, Gray et al. (2004) state that primary activities are basically the entire production process related to the core activity of the farm, which are relationship with supplier, purchase and storage of inputs, raw materials and manufactures, and other activities that occur in this step to enable production process. The following items refer to issues more focused on the operation of the business such as soil preparation, planting, control and monitoring of the planting, relationship with controlling entities and market professionals, and harvesting of all the production and storage. The following is focused on off-farm processes, thus encompassing transportation logistics to the final customer if the farm has its own brand, or the relationship with intermediary entities of this process, usually being Trades, marketing practices and sales.
Finally, as a complement, there is the provision of the service and the support provided to the customer in the post purchase step, as can be seen in Figure 2.
FIGURE 2: PLATE ACTIVITIES VALUE FOR A CROP FARM
Source: Gray et al. (2004).
SupportingActivities
PrimaryActivities
Farm infrastructure management information systems,planning, finance, accouting, governmental regulations, etc.
Human Resource Management: activities used to motivate, compensate, train, anddirect farm employees including family, management, and laborers.
Technological Development: research and adoption practices for things like GPS, VRT, GMO’s.No-Til, the Internet, IP storage facilities.
Procurement: (purchasing inputs) seed, fetilizer, chemicals, fuel, land, machinery, stirage equipment,office supplies, parts, tools, insurance etc. with particular focus on the negociating activities associatedwith theses purchases.
InboundLogistics
Fertilizerand chemicalstirage
Operations
TilagePlantingFertilizingSprayingCultivationHarvest
Service
On-time deliveryIPStorageTRaceabilityQualityAssuranceCustom
application ofinputs
Marketing & Sales
Utilize contractsFutures & options
Ip grainsValue addedgrain
Respond to customers needs
OutboundingLogistics
Grain transportto elevatoror buyer
Grain transportto storage
MA
RG
IN
132 133
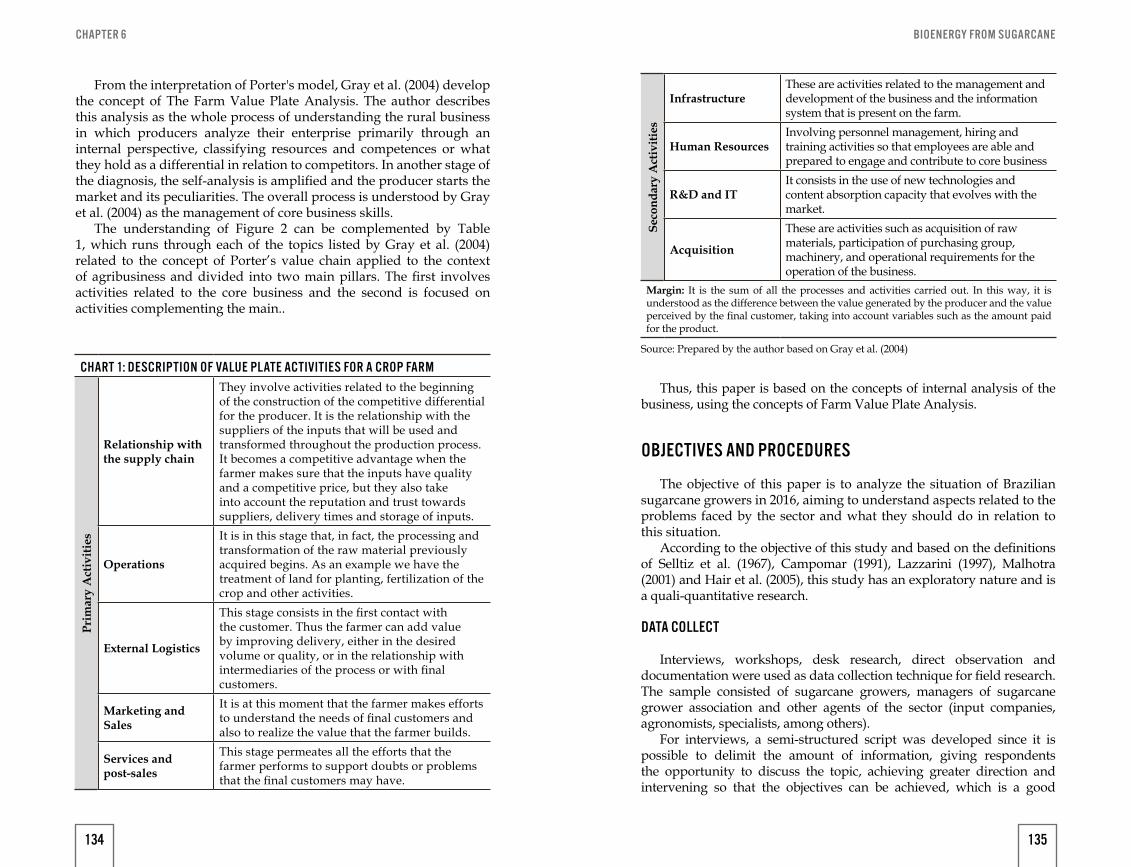
BIOENERGY FROM SUGARCANECHAPTER 6
From the interpretation of Porter's model, Gray et al. (2004) develop the concept of The Farm Value Plate Analysis. The author describes this analysis as the whole process of understanding the rural business in which producers analyze their enterprise primarily through an internal perspective, classifying resources and competences or what they hold as a differential in relation to competitors. In another stage of the diagnosis, the self-analysis is amplified and the producer starts the market and its peculiarities. The overall process is understood by Gray et al. (2004) as the management of core business skills.
The understanding of Figure 2 can be complemented by Table 1, which runs through each of the topics listed by Gray et al. (2004) related to the concept of Porter’s value chain applied to the context of agribusiness and divided into two main pillars. The first involves activities related to the core business and the second is focused on activities complementing the main..
CHART 1: DESCRIPTION OF VALUE PLATE ACTIVITIES FOR A CROP FARM
Prim
ary
Act
iviti
es
Relationship with the supply chain
They involve activities related to the beginning of the construction of the competitive differential for the producer. It is the relationship with the suppliers of the inputs that will be used and transformed throughout the production process. It becomes a competitive advantage when the farmer makes sure that the inputs have quality and a competitive price, but they also take into account the reputation and trust towards suppliers, delivery times and storage of inputs.
Operations
It is in this stage that, in fact, the processing and transformation of the raw material previously acquired begins. As an example we have the treatment of land for planting, fertilization of the crop and other activities.
External Logistics
This stage consists in the first contact with the customer. Thus the farmer can add value by improving delivery, either in the desired volume or quality, or in the relationship with intermediaries of the process or with final customers.
Marketing and Sales
It is at this moment that the farmer makes efforts to understand the needs of final customers and also to realize the value that the farmer builds.
Services and post-sales
This stage permeates all the efforts that the farmer performs to support doubts or problems that the final customers may have.
Thus, this paper is based on the concepts of internal analysis of the business, using the concepts of Farm Value Plate Analysis.
OBJECTIVES AND PROCEDURES
The objective of this paper is to analyze the situation of Brazilian sugarcane growers in 2016, aiming to understand aspects related to the problems faced by the sector and what they should do in relation to this situation.
According to the objective of this study and based on the definitions of Selltiz et al. (1967), Campomar (1991), Lazzarini (1997), Malhotra (2001) and Hair et al. (2005), this study has an exploratory nature and is a quali-quantitative research.
DATA COLLECT
Interviews, workshops, desk research, direct observation and documentation were used as data collection technique for field research. The sample consisted of sugarcane growers, managers of sugarcane grower association and other agents of the sector (input companies, agronomists, specialists, among others).
For interviews, a semi-structured script was developed since it is possible to delimit the amount of information, giving respondents the opportunity to discuss the topic, achieving greater direction and intervening so that the objectives can be achieved, which is a good
Seco
ndar
y A
ctiv
ities
InfrastructureThese are activities related to the management and development of the business and the information system that is present on the farm.
Human ResourcesInvolving personnel management, hiring and training activities so that employees are able and prepared to engage and contribute to core business
R&D and ITIt consists in the use of new technologies and content absorption capacity that evolves with the market.
Acquisition
These are activities such as acquisition of raw materials, participation of purchasing group, machinery, and operational requirements for the operation of the business.
Margin: It is the sum of all the processes and activities carried out. In this way, it is understood as the difference between the value generated by the producer and the value perceived by the final customer, taking into account variables such as the amount paid for the product.
Source: Prepared by the author based on Gray et al. (2004)
134 135
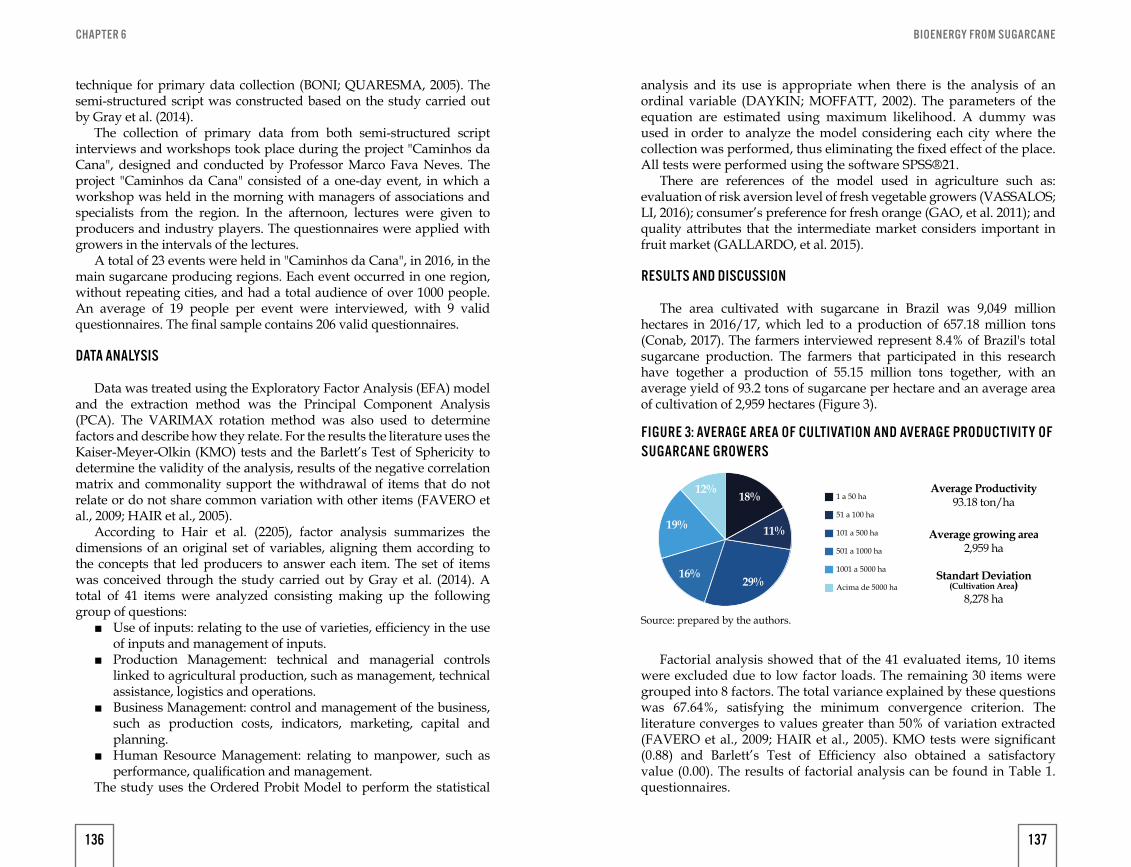
BIOENERGY FROM SUGARCANECHAPTER 6
technique for primary data collection (BONI; QUARESMA, 2005). The semi-structured script was constructed based on the study carried out by Gray et al. (2014).
The collection of primary data from both semi-structured script interviews and workshops took place during the project "Caminhos da Cana", designed and conducted by Professor Marco Fava Neves. The project "Caminhos da Cana" consisted of a one-day event, in which a workshop was held in the morning with managers of associations and specialists from the region. In the afternoon, lectures were given to producers and industry players. The questionnaires were applied with growers in the intervals of the lectures.
A total of 23 events were held in "Caminhos da Cana", in 2016, in the main sugarcane producing regions. Each event occurred in one region, without repeating cities, and had a total audience of over 1000 people. An average of 19 people per event were interviewed, with 9 valid questionnaires. The final sample contains 206 valid questionnaires.
DATA ANALYSIS
Data was treated using the Exploratory Factor Analysis (EFA) model and the extraction method was the Principal Component Analysis (PCA). The VARIMAX rotation method was also used to determine factors and describe how they relate. For the results the literature uses the Kaiser-Meyer-Olkin (KMO) tests and the Barlett’s Test of Sphericity to determine the validity of the analysis, results of the negative correlation matrix and commonality support the withdrawal of items that do not relate or do not share common variation with other items (FAVERO et al., 2009; HAIR et al., 2005).
According to Hair et al. (2205), factor analysis summarizes the dimensions of an original set of variables, aligning them according to the concepts that led producers to answer each item. The set of items was conceived through the study carried out by Gray et al. (2014). A total of 41 items were analyzed consisting making up the following group of questions:
■ Use of inputs: relating to the use of varieties, efficiency in the use of inputs and management of inputs.
■ Production Management: technical and managerial controls linked to agricultural production, such as management, technical assistance, logistics and operations.
■ Business Management: control and management of the business, such as production costs, indicators, marketing, capital and planning.
■ Human Resource Management: relating to manpower, such as performance, qualification and management.
The study uses the Ordered Probit Model to perform the statistical
analysis and its use is appropriate when there is the analysis of an ordinal variable (DAYKIN; MOFFATT, 2002). The parameters of the equation are estimated using maximum likelihood. A dummy was used in order to analyze the model considering each city where the collection was performed, thus eliminating the fixed effect of the place. All tests were performed using the software SPSS®21.
There are references of the model used in agriculture such as: evaluation of risk aversion level of fresh vegetable growers (VASSALOS; LI, 2016); consumer’s preference for fresh orange (GAO, et al. 2011); and quality attributes that the intermediate market considers important in fruit market (GALLARDO, et al. 2015).
RESULTS AND DISCUSSION
The area cultivated with sugarcane in Brazil was 9,049 million hectares in 2016/17, which led to a production of 657.18 million tons (Conab, 2017). The farmers interviewed represent 8.4% of Brazil's total sugarcane production. The farmers that participated in this research have together a production of 55.15 million tons together, with an average yield of 93.2 tons of sugarcane per hectare and an average area of cultivation of 2,959 hectares (Figure 3).
FIGURE 3: AVERAGE AREA OF CULTIVATION AND AVERAGE PRODUCTIVITY OF SUGARCANE GROWERS
1 a 50 ha
51 a 100 ha
101 a 500 ha
501 a 1000 ha
1001 a 5000 ha
Acima de 5000 ha
18%
11%
12%
29%16%
19%
Average Productivity93.18 ton/ha
Average growing area2,959 ha
Standart Deviation(Cultivation Area)
8,278 ha
Factorial analysis showed that of the 41 evaluated items, 10 items were excluded due to low factor loads. The remaining 30 items were grouped into 8 factors. The total variance explained by these questions was 67.64%, satisfying the minimum convergence criterion. The literature converges to values greater than 50% of variation extracted (FAVERO et al., 2009; HAIR et al., 2005). KMO tests were significant (0.88) and Barlett’s Test of Efficiency also obtained a satisfactory value (0.00). The results of factorial analysis can be found in Table 1. questionnaires.
Source: prepared by the authors.
136 137
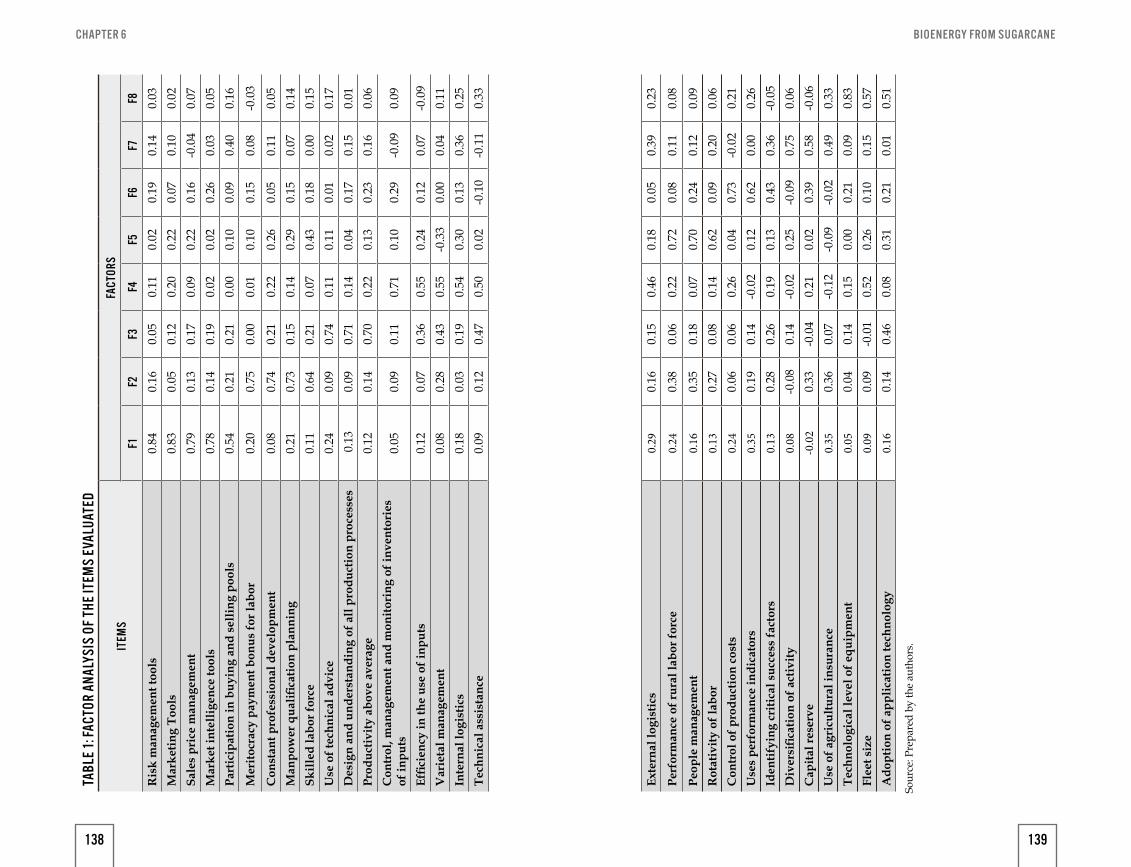
BIOENERGY FROM SUGARCANECHAPTER 6
TABL
E 1: F
ACTO
R AN
ALYS
IS O
F TH
E IT
EMS
EVAL
UATE
D
ITEM
SFA
CTOR
S
F1F2
F3F4
F5F6
F7F8
Ris
k m
anag
emen
t too
ls0.
840.
160.
050.
110.
020.
190.
140.
03M
arke
ting
Tool
s0.
830.
050.
120.
200.
220.
070.
100.
02Sa
les
pric
e m
anag
emen
t0.
790.
130.
170.
090.
220.
16-0
.04
0.07
Mar
ket i
ntel
ligen
ce to
ols
0.78
0.14
0.19
0.02
0.02
0.26
0.03
0.05
Part
icip
atio
n in
buy
ing
and
selli
ng p
ools
0.54
0.21
0.21
0.00
0.10
0.09
0.40
0.16
Mer
itocr
acy
paym
ent b
onus
for l
abor
0.20
0.75
0.00
0.01
0.10
0.15
0.08
-0.0
3
Con
stan
t pro
fess
iona
l dev
elop
men
t0.
080.
740.
210.
220.
260.
050.
110.
05M
anpo
wer
qua
lifica
tion
plan
ning
0.21
0.73
0.15
0.14
0.29
0.15
0.07
0.14
Skill
ed la
bor f
orce
0.11
0.64
0.21
0.07
0.43
0.18
0.00
0.15
Use
of t
echn
ical
adv
ice
0.24
0.09
0.74
0.11
0.11
0.01
0.02
0.17
Des
ign
and
unde
rsta
ndin
g of
all
prod
uctio
n pr
oces
ses
0.1
30.
090.
710.
140.
040.
170.
150.
01Pr
oduc
tivity
abo
ve a
vera
ge0.
120.
140.
700.
220.
130.
230.
160.
06C
ontr
ol, m
anag
emen
t and
mon
itori
ng o
f inv
ento
ries
of
inpu
ts0.
050.
090.
110.
710.
100.
29-0
.09
0.09
Effic
ienc
y in
the
use
of in
puts
0.12
0.07
0.36
0.55
0.24
0.12
0.07
-0.0
9V
arie
tal m
anag
emen
t0.
080.
280.
430.
55-0
.33
0.00
0.04
0.11
Inte
rnal
logi
stic
s0.
180.
030.
190.
540.
300.
130.
360.
25Te
chni
cal a
ssis
tanc
e0.
090.
120.
470.
500.
02-0
.10
-0.1
10.
33
Exte
rnal
logi
stic
s0.
290.
160.
150.
460.
180.
050.
390.
23
Perf
orm
ance
of r
ural
labo
r for
ce0.
240.
380.
060.
220.
720.
080.
110.
08
Peop
le m
anag
emen
t0.
160.
350.
180.
070.
700.
240.
120.
09R
otat
ivity
of l
abor
0.13
0.27
0.08
0.14
0.62
0.09
0.20
0.06
Con
trol
of p
rodu
ctio
n co
sts
0.24
0.06
0.06
0.26
0.04
0.73
-0.0
20.
21U
ses
perf
orm
ance
indi
cato
rs0.
350.
190.
14-0
.02
0.12
0.62
0.00
0.26
Iden
tifyi
ng c
ritic
al s
ucce
ss fa
ctor
s0.
130.
280.
260.
190.
130.
430.
36-0
.05
Div
ersi
ficat
ion
of a
ctiv
ity0.
08-0
.08
0.14
-0.0
20.
25-0
.09
0.75
0.06
Cap
ital r
eser
ve-0
.02
0.33
-0.0
40.
210.
020.
390.
58-0
.06
Use
of a
gric
ultu
ral i
nsur
ance
0.35
0.36
0.07
-0.1
2-0
.09
-0.0
20.
490.
33Te
chno
logi
cal l
evel
of e
quip
men
t0.
050.
040.
140.
150.
000.
210.
090.
83Fl
eet s
ize
0.09
0.09
-0.0
10.
520.
260.
100.
150.
57A
dopt
ion
of a
pplic
atio
n te
chno
logy
0.16
0.14
0.46
0.08
0.31
0.21
0.01
0.51
Sour
ce: P
repa
red
by th
e au
thor
s.
138 139
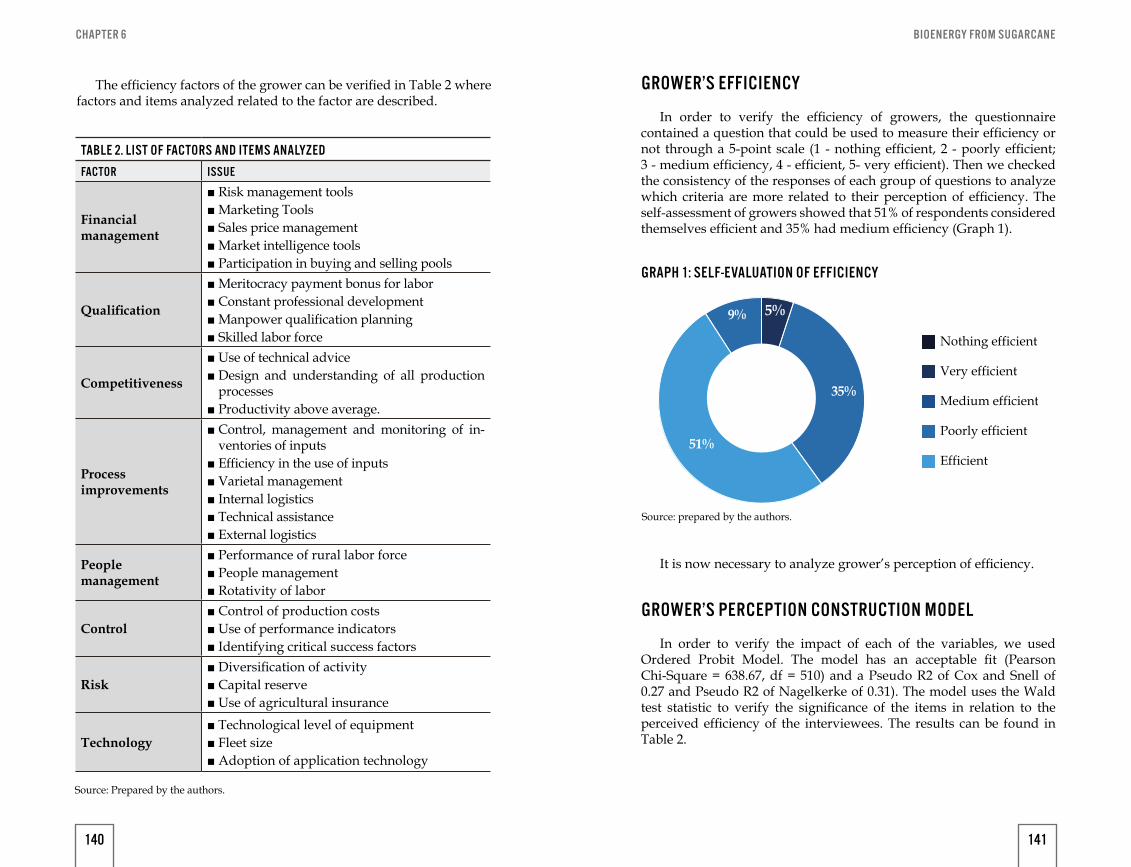
BIOENERGY FROM SUGARCANECHAPTER 6
The efficiency factors of the grower can be verified in Table 2 where factors and items analyzed related to the factor are described.
TABLE 2. LIST OF FACTORS AND ITEMS ANALYZED
FACTOR ISSUE
Financial management
■ Risk management tools ■ Marketing Tools ■ Sales price management ■ Market intelligence tools ■ Participation in buying and selling pools
Qualification
■ Meritocracy payment bonus for labor ■ Constant professional development ■ Manpower qualification planning ■ Skilled labor force
Competitiveness
■ Use of technical advice ■ Design and understanding of all production processes
■ Productivity above average.
Process improvements
■ Control, management and monitoring of in-ventories of inputs
■ Efficiency in the use of inputs ■ Varietal management ■ Internal logistics ■ Technical assistance ■ External logistics
People management
■ Performance of rural labor force ■ People management ■ Rotativity of labor
Control ■ Control of production costs ■ Use of performance indicators ■ Identifying critical success factors
Risk ■ Diversification of activity ■ Capital reserve ■ Use of agricultural insurance
Technology ■ Technological level of equipment ■ Fleet size ■ Adoption of application technology
Source: Prepared by the authors.
GROWER’S EFFICIENCY
In order to verify the efficiency of growers, the questionnaire contained a question that could be used to measure their efficiency or not through a 5-point scale (1 - nothing efficient, 2 - poorly efficient; 3 - medium efficiency, 4 - efficient, 5- very efficient). Then we checked the consistency of the responses of each group of questions to analyze which criteria are more related to their perception of efficiency. The self-assessment of growers showed that 51% of respondents considered themselves efficient and 35% had medium efficiency (Graph 1).
It is now necessary to analyze grower’s perception of efficiency.
GROWER’S PERCEPTION CONSTRUCTION MODEL
In order to verify the impact of each of the variables, we used Ordered Probit Model. The model has an acceptable fit (Pearson Chi-Square = 638.67, df = 510) and a Pseudo R2 of Cox and Snell of 0.27 and Pseudo R2 of Nagelkerke of 0.31). The model uses the Wald test statistic to verify the significance of the items in relation to the perceived efficiency of the interviewees. The results can be found in Table 2.
GRAPH 1: SELF-EVALUATION OF EFFICIENCY
Nothing efficient
Very efficient
Medium efficient
Poorly efficient
Efficient
35%
51%
9% 5%
Source: prepared by the authors.
140 141
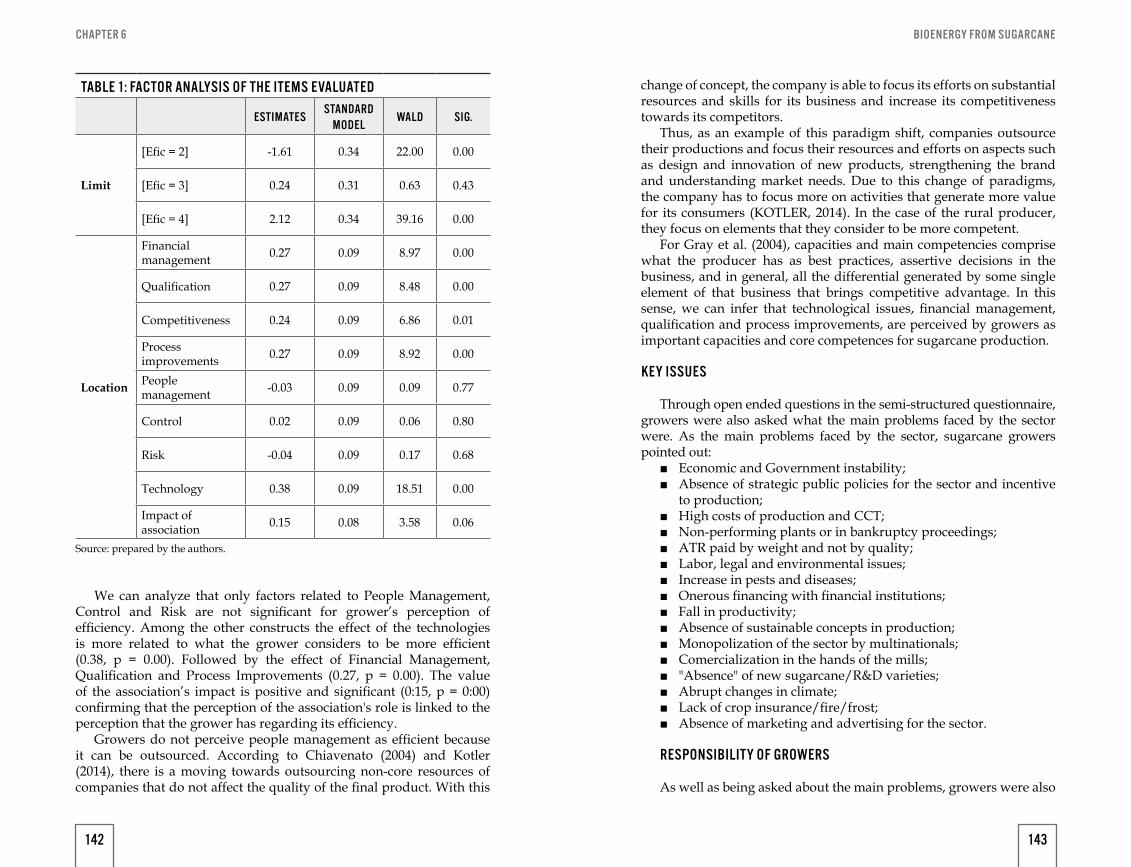
BIOENERGY FROM SUGARCANECHAPTER 6
TABLE 1: FACTOR ANALYSIS OF THE ITEMS EVALUATED
ESTIMATESSTANDARD
MODELWALD SIG.
Limit
[Efic = 2] -1.61 0.34 22.00 0.00
[Efic = 3] 0.24 0.31 0.63 0.43
[Efic = 4] 2.12 0.34 39.16 0.00
Location
Financial management 0.27 0.09 8.97 0.00
Qualification 0.27 0.09 8.48 0.00
Competitiveness 0.24 0.09 6.86 0.01
Process improvements 0.27 0.09 8.92 0.00
People management -0.03 0.09 0.09 0.77
Control 0.02 0.09 0.06 0.80
Risk -0.04 0.09 0.17 0.68
Technology 0.38 0.09 18.51 0.00
Impact of association 0.15 0.08 3.58 0.06
Source: prepared by the authors.
We can analyze that only factors related to People Management, Control and Risk are not significant for grower’s perception of efficiency. Among the other constructs the effect of the technologies is more related to what the grower considers to be more efficient (0.38, p = 0.00). Followed by the effect of Financial Management, Qualification and Process Improvements (0.27, p = 0.00). The value of the association’s impact is positive and significant (0:15, p = 0:00) confirming that the perception of the association's role is linked to the perception that the grower has regarding its efficiency.
Growers do not perceive people management as efficient because it can be outsourced. According to Chiavenato (2004) and Kotler (2014), there is a moving towards outsourcing non-core resources of companies that do not affect the quality of the final product. With this
change of concept, the company is able to focus its efforts on substantial resources and skills for its business and increase its competitiveness towards its competitors.
Thus, as an example of this paradigm shift, companies outsource their productions and focus their resources and efforts on aspects such as design and innovation of new products, strengthening the brand and understanding market needs. Due to this change of paradigms, the company has to focus more on activities that generate more value for its consumers (KOTLER, 2014). In the case of the rural producer, they focus on elements that they consider to be more competent.
For Gray et al. (2004), capacities and main competencies comprise what the producer has as best practices, assertive decisions in the business, and in general, all the differential generated by some single element of that business that brings competitive advantage. In this sense, we can infer that technological issues, financial management, qualification and process improvements, are perceived by growers as important capacities and core competences for sugarcane production.
KEY ISSUES
Through open ended questions in the semi-structured questionnaire, growers were also asked what the main problems faced by the sector were. As the main problems faced by the sector, sugarcane growers pointed out:
■ Economic and Government instability; ■ Absence of strategic public policies for the sector and incentive
to production; ■ High costs of production and CCT; ■ Non-performing plants or in bankruptcy proceedings; ■ ATR paid by weight and not by quality; ■ Labor, legal and environmental issues; ■ Increase in pests and diseases; ■ Onerous financing with financial institutions; ■ Fall in productivity; ■ Absence of sustainable concepts in production; ■ Monopolization of the sector by multinationals; ■ Comercialization in the hands of the mills; ■ "Absence" of new sugarcane/R&D varieties; ■ Abrupt changes in climate; ■ Lack of crop insurance/fire/frost; ■ Absence of marketing and advertising for the sector.
RESPONSIBILITY OF GROWERS
As well as being asked about the main problems, growers were also
142 143
BIOENERGY FROM SUGARCANECHAPTER 6
asked about the main actions they should have. They also cited actions they should take to help the sector solve the problems faced. These actions were:
■ Reducing costs and investing in cost planning; ■ Use new technologies; ■ Charge the government for better public policies and incentives
to the sector; ■ Improve productivity; ■ Improve business management, internal and external market
analysis; ■ Create partnerships; ■ Employee training; ■ Act through association; ■ Standardization and participation of ethanol in the national
energy matrix; ■ Unify payment methods to improve raw material quality; ■ Actively participate in meetings and committees; ■ Adhere to environmental and labor "nonconformities"; ■ Strengthening of national companies; ■ Assistance in marketing for the sector.
CONCLUSIONS
The Brazilian sugar and ethanol industry has been facing various problems and challenges in recent years, affecting all links in the chain. Sugarcane growers, in turn, are also affected by the problems of the sector and cite as main problems: economic and governmental instabilities of Brazil, absence of public and inceptive policies for the sector, high and increasing costs of production, and problems in the financial situation of several agro-industries. On the other hand, sugarcane growers consider themselves efficient, especially in relation to technologies, financial management, qualification and process improvement. They pointed out actions that they must take to avoid the problems mentioned above such as: reducing costs and investing in cost planning, charging the federal government for public policies, improving management of their business and creating partnerships.
BY LUCIANO THOMÉ E CASTRO, PRISCILLA MENDES MACHADO, MARCOS FAVA NEVES AND ROBERTO FAVA SCARE
SATISFACTION OF PRIVATE INTEREST ASSOCIATION’S MEMBERS: A STUDY WITH SUGARCANE PRODUCERS
7
Originally published in 27th Annual IFAMA World Conference: Technology, Investment, and People: Business Solutions for Food Security, 2017, Miami, Flórida, USA.
144
BIOENERGY FROM SUGARCANE
INTRODUCTION
The associations between growers of sugarcane in Brazil are formed by the guild of producers by producing regions. As an example, in south-central Brazil, there are 31 associations with about 18,000 sugarcane producers.
Until the early 1990s, the current regulations in the sector forced the participation of the producers in associations. With the deregulation, the producers would be free to to voluntarily join whichever association they preferred, regardless of the region located in they were, starting financial contributions. Other changes have taken place in the sector with the deregulation and the end of state support apparatus. From that moment on, the relationship of the actors through the associations was expanded in order to increase participation in the political process, and the members of associations had new demands, searching for cost reduction and product differentiation (Mello & Paulillo, 2005).
Given the importance of the association for producers and the freedom to join the associations they liked the most, the ben-efits provided by them can define their existence and stability. This is because the voluntary nature of associations positions their members as clients, demanding for specific services and choosing to remain bound to it by weighing the costs and benefits arising from membership. These costs are mainly related to entrepreneurs’ time of opportunity costs and capital opportunity costs for the maintenance of the association. Thus, managers must seek to draw attractive actions in order to ensure the continued participation of its members (Conejero, 2011; Nassar & Zylbersztajn, 2004).
Associations can provide a range of individual and collective benefits, as well as facilitate the growth of economic and social relations among their members. The degree to which associations provide desired benefits to the members can vary considerably, which ultimately affects their participation in association activities and makes many members feel disappointed with the business. Therefore, an important task for the long-term sustainability of business associations is to understand the determinants of adherence of member satisfaction (Newbery, Sauer, Gorton, Phillipson, & Atterton, 2013).
In this context, this paper aims to identify predictor elements of satisfaction presented by the producers of sugarcane with the associations they belong to. In order to do this, a model was developed by the authors for a subsequent examination through statistical analysis. We will present below the factors studied by leading theorists of the subject and that were added to the model of the research.
147
BIOENERGY FROM SUGARCANECHAPTER 7
SATISFACTION IN THE CONTEXT OF ASSOCIATIVISM
Since the existing relationship between members and association is similar to the relationship between customer and company, the concept of satisfaction developed by marketing theorists in the business context can be applied. Oliver (1996) argues that there are plenty of concepts for satisfaction, which hinder a simple definition for that term. However, he presents his own definition, stating that satisfaction is the judgment that a characteristic of the product or service however, he presents his own definition stating that satisfaction is the perception of a characteristic of a product or service, or of the product or service in a whole, which enable a pleasant experience related to their consumption. Another definition is given by Kotler (2000, p. 58), stating that satisfaction “[...] is the feeling of pleasure or disappointment resulting from the comparison of the performance (or result) obtained from a product in relation to buyer’s expectations”. Kotler (2000) asserts that satisfaction is achieved when the perceived result is equal to or greater than the expectations presented by the buyer.
Importing the concept of satisfaction to the context of association, it can be said that the members’ satisfaction occurs when they get results equal to or higher than expected by being part of the group. Thus, it can be said that the reasons that lead companies or individuals to become part of the association are the same reasons that will make them stay if these factors are sufficiently met and matched.
In voluntary associations system, the motivation of members and their interpretations of associativity maintains the logic of membership, being a determinant factor of success or failure of the association (Bennett & Ramsden, 2000). Previous research has identified a number of reasons for membership in business associations, highlighting the following aspects: the acquisition of information, access to specific services, lobbying and self-regulation, representation of collective interests, marketing and group buying opportunities, social benefits, compliments and accreditation (Bennett & Ramsden, 2007; Newbery et al., 2013).
The analysis of the motivation for membership of compa-nies and individuals can be made in the light of the logic of services and of collective activity. The logic of services means that associations have to respond to the individual and specific needs and demands of the members, causing the association to resemble a business service company. On the other hand, the logic of collective activity focuses on the association’s role in acting on behalf of all, or at least the majority, or in the inter-ests of its members. The logic of collective activity, particularly in the search for representational influence, lead associations to seek a ratio as high as possible of members of its sector or relevant area of interest, in order to maximize its legitimacy to speak
on behalf of the sector as a whole (Bennett & Ramsden, 2000).We then note that membership to an association is given both for
reasons of individual aspects and collective aspects. According to Bennett and Ramsden (2007), associations are able to offer some unique blends of individual benefits tailored to niche strategies, and collective benefits arising from shared information and opportunities.
These aspects were presented by Olson (1971) when studying collective actions, stating that, in large groups, both collective and individual interests should be promoted. Unlike the small groups, collective rewards are not enough to attract participants in large groups. Thus, it is necessary that the members understand the individual benefits that they can get by being part of a given group. That is because, according to Olson (1971), the larger the group, the farther it gets to get even an ideal supply of any collective good, and lower the probability of the group to act in order to obtain even a minimal amount of such good. Thus, the larger the group, the less it promotes its common interests; consequently, an additional incentive should be given for companies or individuals to become part of it. Based on these aspects, the following hypotheses have been proposed by the research:
HYPOTHESIS 1Individual benefits provided to producers through the association influence on the satisfaction perceived by the members.
HYPOTHESIS 2Collective benefits provided to producers through the association influence on the satisfaction perceived by the members.
Both individual and collective benefits offered by associations cover different aspects that can contribute to the satisfaction of participants in the groups. Below, we present the different types of individual and collective benefits offered by the associations to their members
INDIVIDUAL BENEFITS
Individual benefits are those provided individually to participants, so that the benefit received is different for each one. Although economic incentives are of great importance to members of associations, social and psychological aspects such as prestige and respect are also relevant to them. Some scholars of organizational theory point out that social incentives should be analyzed in the same way monetary incentives are (Olson, 1971). Thus, these two kinds of benefits will be presented herein.
148 149
BIOENERGY FROM SUGARCANECHAPTER 7
ECONOMIC ASPECTS
Economic aspects is one of the individual benefits provided by associations to their members. According to Olson (1971), the group's growth provides the cost reduction assigned to each participant in order to increase the benefits available to them. Moreover, according to Bennett and Robson (2001), this cost reduction comes primarily from savings in transaction costs and economies of scale provided by associations from the specific services offered by them. Thus, the gain of expertise that the association may have in the execution of certain services may represent a financial gain to the members and, in addition, there is potentially a transactional efficiency of the member with the association that does not motivate the development on its own of a given service; in other words, it is better to hire the association than to develop the services on their own (Williamson, 1985). Thus, it can be said that the economic benefits offered by them arise from the individual and collective services available to members.
Based on the interpretation that in general financial returns affect the motivation and satisfaction of individuals, we developed the following research hypothesis:
Hypothesis 1a: The monetary returns available to producers through the association influence the satisfaction perceived by the members.
CONTACTS
Associations are networks of connections that go beyond economic issues by allowing knowledge and confidence to be developed among their members. Thus, participants are able to obtain benefits from the institutional environment in which they operate (Bennett & Ramsden, 2007). From the moment that associations are perceived as horizontal networks, they can be understood as environments with a collective action and are capable of generating factors such as social capital, collective learning and reputation, providing greater competitiveness for members (Barra, Oliveira, & Machado, 2007). Once associations can be construed as business networks, the benefits suggested by literature may be transported to network associations. Among the benefits, there is the establishment of contacts and important relationships through the existing relationship with the association and its members. According to Hákansson and Snehota (1997), the relationship between two actors can change the way they are perceived by other existing actors. This perceived identity affects the possibilities of acting and may contribute to building new relationships. Thus, the links devel-oped between companies in business relationships affect their behavior and identities.
Based on the importance of building relationships and important contacts for the development of companies, the following hypothesis was developed:
Hypothesis 1b: The possibility of building contacts and important relationships for producers through an association influences the satisfaction perceived by the members.
Based on the importance of building relationships and important contacts for the development of companies, the following hypothesis was developed:
Hypothesis 1b: The possibility of building contacts and important relationships for producers throughan an association influences the satisfaction perceived by the members.
HONOR
The honor aspect presented here is linked to the feeling generated in the associations’ members to be part of a group. Thus, when they are identified as part of a particular group, this feeling is developed by the members.
Some researches have discussed the relationship between the identification of the actors with the group of which they are part and their active participation in collective actions devel-oped within the group. It has been observed that those actors having a higher degree of identification with the group are intrinsically more motivated to participate in collective actions and are more committed to the goals and interests of the group. Thus, to these participants, concern for the collective purposes individual goals. In contrast, participants who identify less with the groups of which they are part are less willing to contribute to the unique goals of the group, being willing to commit with the collective goals that are, in fact, their own individual goals (Van Zomeren, Spears, & Leach, 2008). Once this identification with the group can influence the level of participation of members, it is possible that it may also affect their satisfaction. Also, since the honor was established here as the feeling generated by membership in the association, the following hypothesis was formulated:
Hypothesis 1c. The sense of honor provided by membership in the association influences the satisfaction perceived by the members.
Although the associations allow the scope of purely personal individual interests, a characteristic of their is to promote the common interests of the group; therefore it is essential that they develop this function (Olson, 1971), as detailed below.
150 151
BIOENERGY FROM SUGARCANECHAPTER 7
COLLECTIVE BENEFITS
Collective benefits are those common to all participants, so that no member of the group can be excluded and nor be denied the satisfaction provided by them. We present below four types of collective benefits: services, representativeness, trust and relevance of associations. Nassar and Zylbersztajn (2004) also showed that associations formed by large and homogeneous groups of members tend to have a greater range of common benefits.
PERCEPTION OF SERVICE SUPPLY
According to Bennett and Ramsden (2000), the main reason that leads members to join the association is access to services, be them specific or collective. Similarly, the main reason that lead members to leave the associations is dissatisfaction with the services offered by them. A survey conducted by Newbery et al. (2013) showed that associations based on services provide higher levels of satisfaction to their members. According to Bennett and Robson (2001), the main services offered by the associations consist of collective and self-regulation functions. However, other low-cost services, at low frequency and short periods are also offered to participants. The authors point out that many of these less prominent services are attractive to new members who see them as services that can be used if one day they need them. The authors define this factor as a kind of insurance rate, once it will be available to members when needed.
As quoted in the text on individual aspects, the services offered by associations are the main sources of economic benefits of the members. But here we do not emphasize the satisfaction displayed by the participants to the services used by them and their returns, but how much they believe all the services available to them are in accordance with the needs of those who are part of the association. Thus, all the services provided are highlighted, including the less frequent ones, analyzed by Bennett and Robson (2001). Based on these aspects, the following research hypotheses were developed:
Hypothesis 2a: Perception of the service offerings available to producers influences the satisfaction perceived by the members.
REPRESENTATIVENESS
Representational influence is the goal of almost every business associations and is a fundamental part of the constitutional mission and democratic structure of almost all of them (Bennett and Ramsden,
2000). In this sense, one of the main collective benefits offered by the associations are the representation activities, by seeking to promote and defend the interests of members who are part of it (Perry, 2012). This power of representation is built through the participation of members in training arrangements so that the greater the reputation of the collective actors involved, the greater the reputation of the entire association (Mello & Paulillo, 2005). Greater legitimacy of the association itself demonstrates its strength to seek the protection of the interests of members and to change the institutional environment as representative private institution (North, 1994).
Despite the importance of the representativeness of associations, studies have shown that it is not the main reason of affiliation for companies or individuals. As shown above, the main motivation of the participants would be the services offered. Nevertheless, representation is also a source of motivation and satisfaction of members and therefore we formulated the following research hypothesis:
Hypothesis 2b. The representative nature of the association influences the satisfaction perceived by the members.
TRUST
Bennett and Ramsden (2000) argues that associations enjoy a certain context of trust by providing a specific relationship market with its members, which is different from other business service providers. This allows organizations to connect more closely to their “customers” than in a relationship of pure market.
Koutsou, Partalidou and Ragkos (2014) highlight the fact that recent research has linked confidence to collective action and cooperation between members of groups for mutual benefits. This aspect is underscored by Durston (2003, apud Barra et al., 2007) by stating that the share capital resulting from certain social relationships provide trust, reciprocity and cooperation between those involved, and can generate greater benefit to those who have it.
According Koutsou et al. (2014), the existence of trust between members and members with the institution of which they are part provides the network breakthrough for collective action, influencing the development of the group. From the authors’ point of view, there is a distinction between networks and collective actions. While networks are characterized by interactions and conviviality, collective actions are characterized by the synergies developed to achieve the common goals.
Also according to the authors, this trust refers to one of the features provided by the social capital. This aspect is high-lighted by Putnam (2005, p. 177) by stating that social capital refers to “[...] the characteristics of social organization, such as trust, norms and
152 153
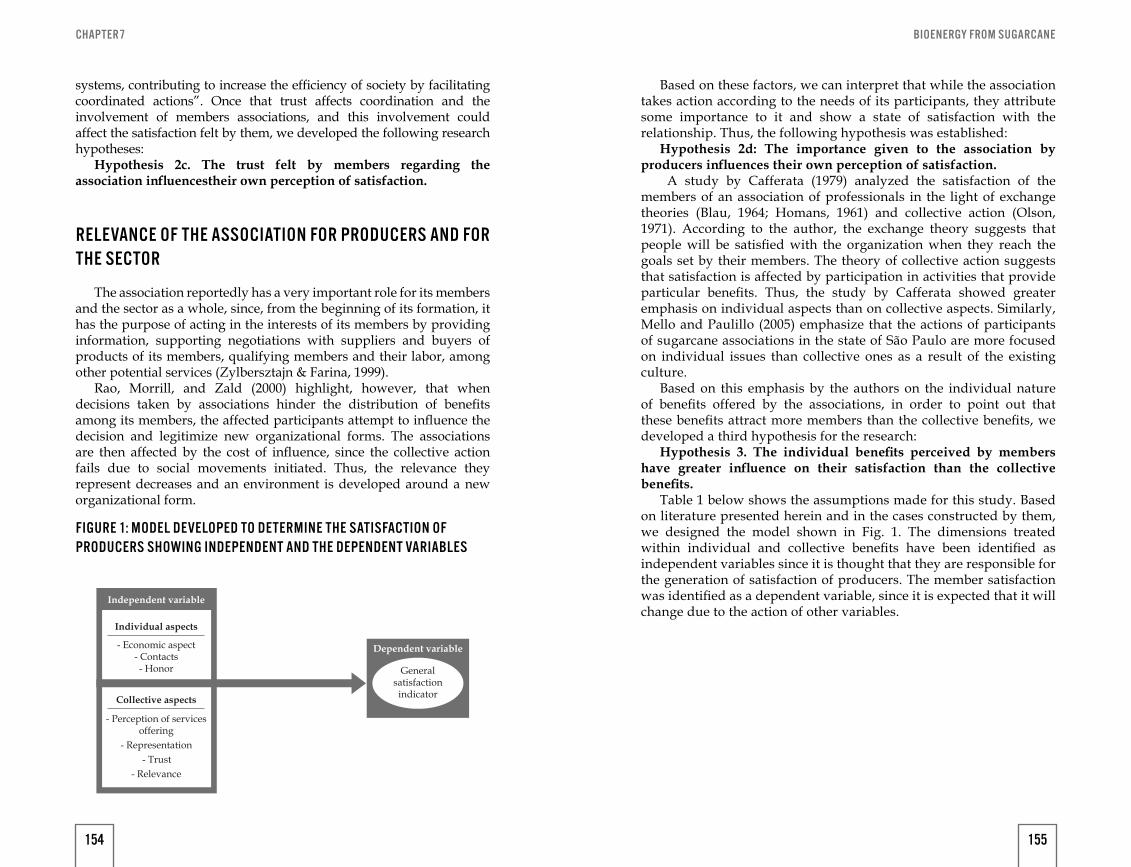
BIOENERGY FROM SUGARCANECHAPTER 7
systems, contributing to increase the efficiency of society by facilitating coordinated actions”. Once that trust affects coordination and the involvement of members associations, and this involvement could affect the satisfaction felt by them, we developed the following research hypotheses:
Hypothesis 2c. The trust felt by members regarding the association influencestheir own perception of satisfaction.
RELEVANCE OF THE ASSOCIATION FOR PRODUCERS AND FOR THE SECTOR
The association reportedly has a very important role for its members and the sector as a whole, since, from the beginning of its formation, it has the purpose of acting in the interests of its members by providing information, supporting negotiations with suppliers and buyers of products of its members, qualifying members and their labor, among other potential services (Zylbersztajn & Farina, 1999).
Rao, Morrill, and Zald (2000) highlight, however, that when decisions taken by associations hinder the distribution of benefits among its members, the affected participants attempt to influence the decision and legitimize new organizational forms. The associations are then affected by the cost of influence, since the collective action fails due to social movements initiated. Thus, the relevance they represent decreases and an environment is developed around a new organizational form.
FIGURE 1: MODEL DEVELOPED TO DETERMINE THE SATISFACTION OF PRODUCERS SHOWING INDEPENDENT AND THE DEPENDENT VARIABLES
Independent variable
Individual aspects
- Economic aspect- Contacts- Honor
Collective aspects
- Perception of servicesoffering
- Representation- Trust
- Relevance
Dependent variable
Generalsatisfaction
indicator
Based on these factors, we can interpret that while the association takes action according to the needs of its participants, they attribute some importance to it and show a state of satisfaction with the relationship. Thus, the following hypothesis was established:
Hypothesis 2d: The importance given to the association by producers influences their own perception of satisfaction.
A study by Cafferata (1979) analyzed the satisfaction of the members of an association of professionals in the light of exchange theories (Blau, 1964; Homans, 1961) and collective action (Olson, 1971). According to the author, the exchange theory suggests that people will be satisfied with the organization when they reach the goals set by their members. The theory of collective action suggests that satisfaction is affected by participation in activities that provide particular benefits. Thus, the study by Cafferata showed greater emphasis on individual aspects than on collective aspects. Similarly, Mello and Paulillo (2005) emphasize that the actions of participants of sugarcane associations in the state of São Paulo are more focused on individual issues than collective ones as a result of the existing culture.
Based on this emphasis by the authors on the individual nature of benefits offered by the associations, in order to point out that these benefits attract more members than the collective benefits, we developed a third hypothesis for the research:
Hypothesis 3. The individual benefits perceived by members have greater influence on their satisfaction than the collective benefits.
Table 1 below shows the assumptions made for this study. Based on literature presented herein and in the cases constructed by them, we designed the model shown in Fig. 1. The dimensions treated within individual and collective benefits have been identified as independent variables since it is thought that they are responsible for the generation of satisfaction of producers. The member satisfaction was identified as a dependent variable, since it is expected that it will change due to the action of other variables.
154 155
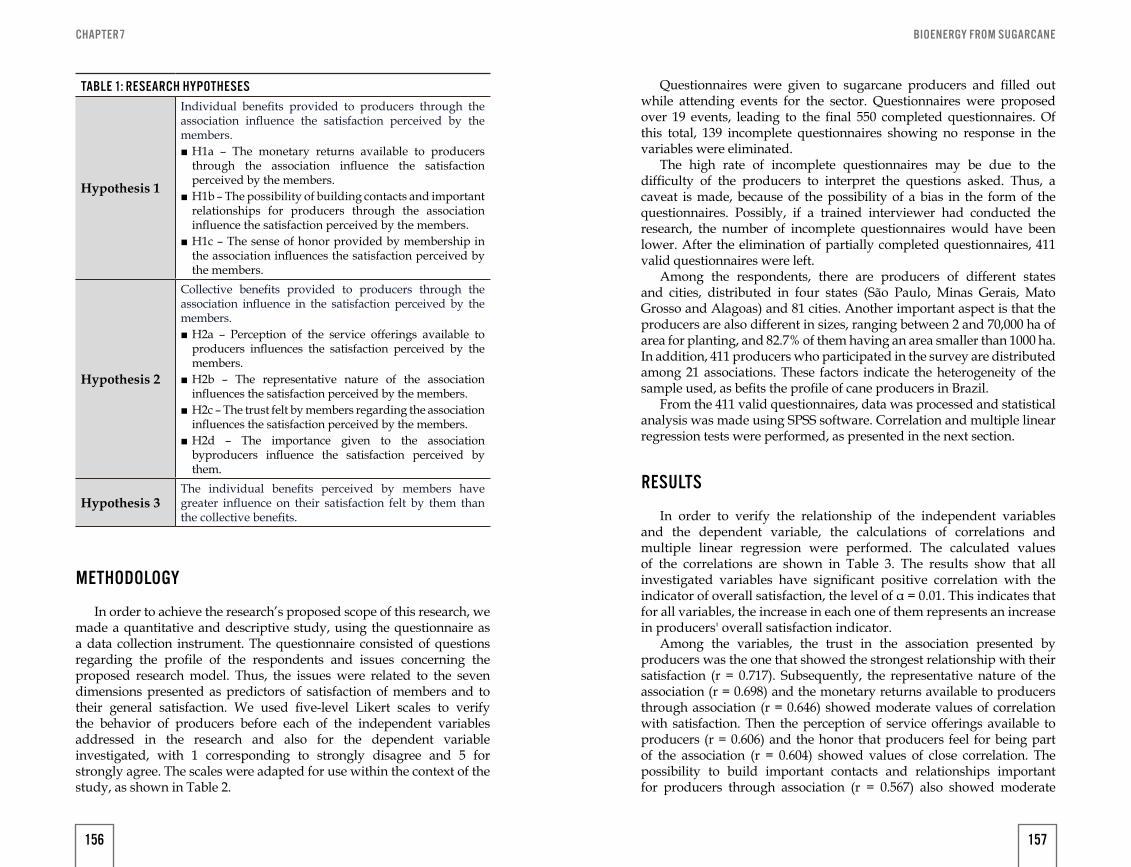
BIOENERGY FROM SUGARCANECHAPTER 7
TABLE 1: RESEARCH HYPOTHESES
Hypothesis 1
Individual benefits provided to producers through the association influence the satisfaction perceived by the members.
■ H1a – The monetary returns available to producers through the association influence the satisfaction perceived by the members.
■ H1b – The possibility of building contacts and important relationships for producers through the association influence the satisfaction perceived by the members.
■ H1c – The sense of honor provided by membership in the association influences the satisfaction perceived by the members.
Hypothesis 2
Collective benefits provided to producers through the association influence in the satisfaction perceived by the members.
■ H2a – Perception of the service offerings available to producers influences the satisfaction perceived by the members.
■ H2b – The representative nature of the association influences the satisfaction perceived by the members.
■ H2c – The trust felt by members regarding the association influences the satisfaction perceived by the members.
■ H2d – The importance given to the association byproducers influence the satisfaction perceived by them.
Hypothesis 3The individual benefits perceived by members have greater influence on their satisfaction felt by them than the collective benefits.
METHODOLOGY
In order to achieve the research’s proposed scope of this research, we made a quantitative and descriptive study, using the questionnaire as a data collection instrument. The questionnaire consisted of questions regarding the profile of the respondents and issues concerning the proposed research model. Thus, the issues were related to the seven dimensions presented as predictors of satisfaction of members and to their general satisfaction. We used five-level Likert scales to verify the behavior of producers before each of the independent variables addressed in the research and also for the dependent variable investigated, with 1 corresponding to strongly disagree and 5 for strongly agree. The scales were adapted for use within the context of the study, as shown in Table 2.
Questionnaires were given to sugarcane producers and filled out while attending events for the sector. Questionnaires were proposed over 19 events, leading to the final 550 completed questionnaires. Of this total, 139 incomplete questionnaires showing no response in the variables were eliminated.
The high rate of incomplete questionnaires may be due to the difficulty of the producers to interpret the questions asked. Thus, a caveat is made, because of the possibility of a bias in the form of the questionnaires. Possibly, if a trained interviewer had conducted the research, the number of incomplete questionnaires would have been lower. After the elimination of partially completed questionnaires, 411 valid questionnaires were left.
Among the respondents, there are producers of different states and cities, distributed in four states (São Paulo, Minas Gerais, Mato Grosso and Alagoas) and 81 cities. Another important aspect is that the producers are also different in sizes, ranging between 2 and 70,000 ha of area for planting, and 82.7% of them having an area smaller than 1000 ha. In addition, 411 producers who participated in the survey are distributed among 21 associations. These factors indicate the heterogeneity of the sample used, as befits the profile of cane producers in Brazil.
From the 411 valid questionnaires, data was processed and statistical analysis was made using SPSS software. Correlation and multiple linear regression tests were performed, as presented in the next section.
RESULTS
In order to verify the relationship of the independent variables and the dependent variable, the calculations of correlations and multiple linear regression were performed. The calculated values of the correlations are shown in Table 3. The results show that all investigated variables have significant positive correlation with the indicator of overall satisfaction, the level of α = 0.01. This indicates that for all variables, the increase in each one of them represents an increase in producers' overall satisfaction indicator.
Among the variables, the trust in the association presented by producers was the one that showed the strongest relationship with their satisfaction (r = 0.717). Subsequently, the representative nature of the association (r = 0.698) and the monetary returns available to producers through association (r = 0.646) showed moderate values of correlation with satisfaction. Then the perception of service offerings available to producers (r = 0.606) and the honor that producers feel for being part of the association (r = 0.604) showed values of close correlation. The possibility to build important contacts and relationships important for producers through association (r = 0.567) also showed moderate
156 157
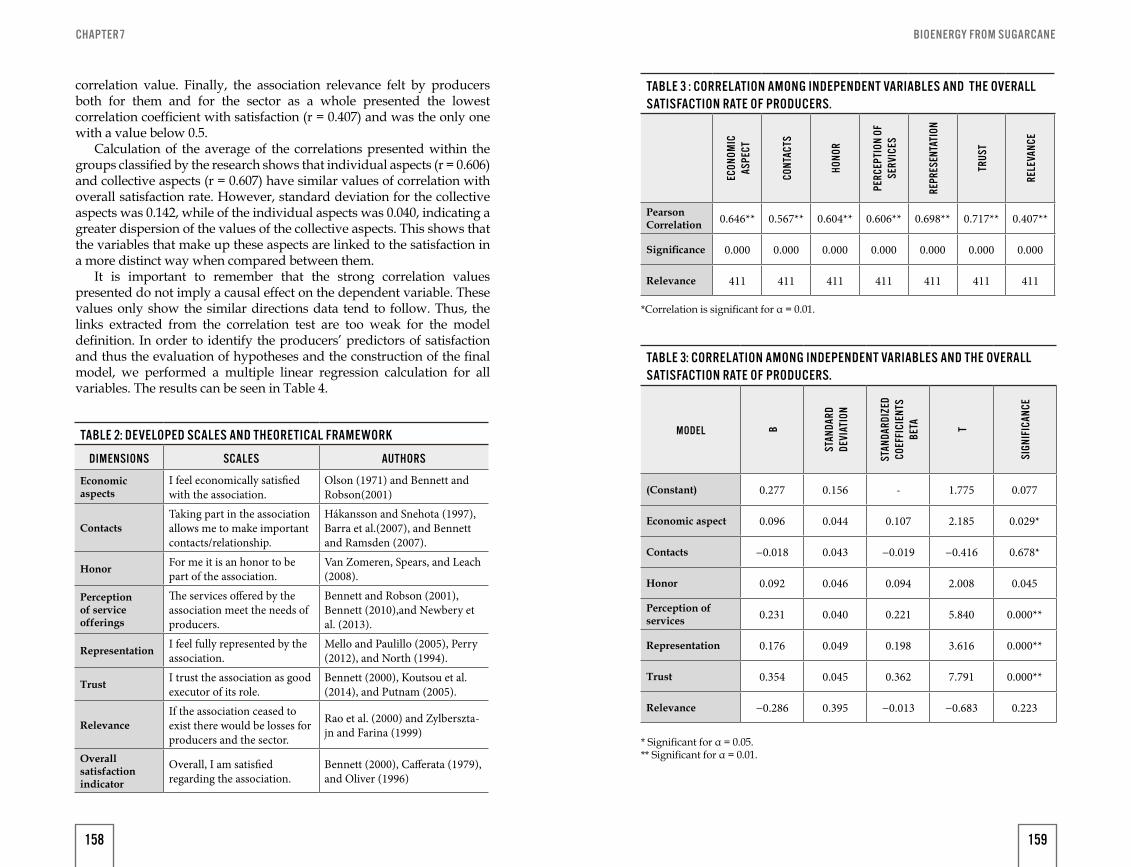
BIOENERGY FROM SUGARCANECHAPTER 7
correlation value. Finally, the association relevance felt by producers both for them and for the sector as a whole presented the lowest correlation coefficient with satisfaction (r = 0.407) and was the only one with a value below 0.5.
Calculation of the average of the correlations presented within the groups classified by the research shows that individual aspects (r = 0.606) and collective aspects (r = 0.607) have similar values of correlation with overall satisfaction rate. However, standard deviation for the collective aspects was 0.142, while of the individual aspects was 0.040, indicating a greater dispersion of the values of the collective aspects. This shows that the variables that make up these aspects are linked to the satisfaction in a more distinct way when compared between them.
It is important to remember that the strong correlation values presented do not imply a causal effect on the dependent variable. These values only show the similar directions data tend to follow. Thus, the links extracted from the correlation test are too weak for the model definition. In order to identify the producers’ predictors of satisfaction and thus the evaluation of hypotheses and the construction of the final model, we performed a multiple linear regression calculation for all variables. The results can be seen in Table 4.
TABLE 2: DEVELOPED SCALES AND THEORETICAL FRAMEWORK
DIMENSIONS SCALES AUTHORS
Economic aspects
I feel economically satisfied with the association.
Olson (1971) and Bennett and Robson(2001)
ContactsTaking part in the association allows me to make important contacts/relationship.
Hákansson and Snehota (1997), Barra et al.(2007), and Bennett and Ramsden (2007).
Honor For me it is an honor to be part of the association.
Van Zomeren, Spears, and Leach (2008).
Perception of service offerings
The services offered by the association meet the needs of producers.
Bennett and Robson (2001), Bennett (2010),and Newbery et al. (2013).
Representation I feel fully represented by the association.
Mello and Paulillo (2005), Perry (2012), and North (1994).
Trust I trust the association as good executor of its role.
Bennett (2000), Koutsou et al. (2014), and Putnam (2005).
RelevanceIf the association ceased to exist there would be losses for producers and the sector.
Rao et al. (2000) and Zylberszta-jn and Farina (1999)
Overall satisfaction indicator
Overall, I am satisfied regarding the association.
Bennett (2000), Cafferata (1979), and Oliver (1996)
TABLE 3 : CORRELATION AMONG INDEPENDENT VARIABLES AND THE OVERALL SATISFACTION RATE OF PRODUCERS.
ECON
OMIC
AS
PECT
CONT
ACTS
HONO
R
PERC
EPTI
ON O
F SE
RVIC
ES
REPR
ESEN
TATI
ON
TRUS
T
RELE
VANC
E
Pearson Correlation 0.646** 0.567** 0.604** 0.606** 0.698** 0.717** 0.407**
Significance 0.000 0.000 0.000 0.000 0.000 0.000 0.000
Relevance 411 411 411 411 411 411 411
TABLE 3: CORRELATION AMONG INDEPENDENT VARIABLES AND THE OVERALL SATISFACTION RATE OF PRODUCERS.
MODEL B
STAN
DARD
DE
VIAT
ION
STAN
DARD
IZED
CO
EFFI
CIEN
TS
BETA T
SIGN
IFIC
ANCE
(Constant) 0.277 0.156 - 1.775 0.077
Economic aspect 0.096 0.044 0.107 2.185 0.029*
Contacts −0.018 0.043 −0.019 −0.416 0.678*
Honor 0.092 0.046 0.094 2.008 0.045
Perception of services 0.231 0.040 0.221 5.840 0.000**
Representation 0.176 0.049 0.198 3.616 0.000**
Trust 0.354 0.045 0.362 7.791 0.000**
Relevance −0.286 0.395 −0.013 −0.683 0.223
*Correlation is significant for α = 0.01.
* Significant for α = 0.05.** Significant for α = 0.01.
158 159
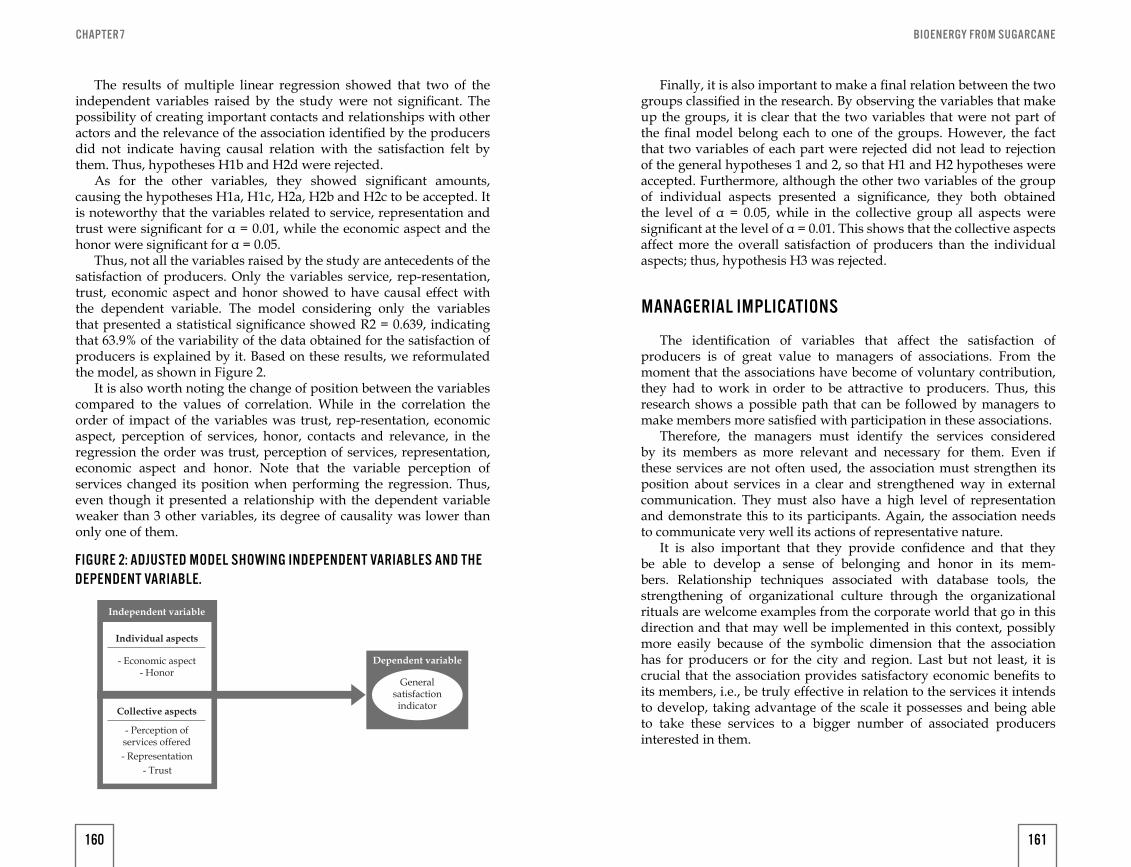
BIOENERGY FROM SUGARCANECHAPTER 7
The results of multiple linear regression showed that two of the independent variables raised by the study were not significant. The possibility of creating important contacts and relationships with other actors and the relevance of the association identified by the producers did not indicate having causal relation with the satisfaction felt by them. Thus, hypotheses H1b and H2d were rejected.
As for the other variables, they showed significant amounts, causing the hypotheses H1a, H1c, H2a, H2b and H2c to be accepted. It is noteworthy that the variables related to service, representation and trust were significant for α = 0.01, while the economic aspect and the honor were significant for α = 0.05.
Thus, not all the variables raised by the study are antecedents of the satisfaction of producers. Only the variables service, rep-resentation, trust, economic aspect and honor showed to have causal effect with the dependent variable. The model considering only the variables that presented a statistical significance showed R2 = 0.639, indicating that 63.9% of the variability of the data obtained for the satisfaction of producers is explained by it. Based on these results, we reformulated the model, as shown in Figure 2.
It is also worth noting the change of position between the variables compared to the values of correlation. While in the correlation the order of impact of the variables was trust, rep-resentation, economic aspect, perception of services, honor, contacts and relevance, in the regression the order was trust, perception of services, representation, economic aspect and honor. Note that the variable perception of services changed its position when performing the regression. Thus, even though it presented a relationship with the dependent variable weaker than 3 other variables, its degree of causality was lower than only one of them.
FIGURE 2: ADJUSTED MODEL SHOWING INDEPENDENT VARIABLES AND THE DEPENDENT VARIABLE.
Independent variable
Individual aspects
- Economic aspect- Honor
Collective aspects
- Perception ofservices offered- Representation
- Trust
Dependent variable
Generalsatisfaction
indicator
Finally, it is also important to make a final relation between the two groups classified in the research. By observing the variables that make up the groups, it is clear that the two variables that were not part of the final model belong each to one of the groups. However, the fact that two variables of each part were rejected did not lead to rejection of the general hypotheses 1 and 2, so that H1 and H2 hypotheses were accepted. Furthermore, although the other two variables of the group of individual aspects presented a significance, they both obtained the level of α = 0.05, while in the collective group all aspects were significant at the level of α = 0.01. This shows that the collective aspects affect more the overall satisfaction of producers than the individual aspects; thus, hypothesis H3 was rejected.
MANAGERIAL IMPLICATIONS
The identification of variables that affect the satisfaction of producers is of great value to managers of associations. From the moment that the associations have become of voluntary contribution, they had to work in order to be attractive to producers. Thus, this research shows a possible path that can be followed by managers to make members more satisfied with participation in these associations.
Therefore, the managers must identify the services considered by its members as more relevant and necessary for them. Even if these services are not often used, the association must strengthen its position about services in a clear and strengthened way in external communication. They must also have a high level of representation and demonstrate this to its participants. Again, the association needs to communicate very well its actions of representative nature.
It is also important that they provide confidence and that they be able to develop a sense of belonging and honor in its mem-bers. Relationship techniques associated with database tools, the strengthening of organizational culture through the organizational rituals are welcome examples from the corporate world that go in this direction and that may well be implemented in this context, possibly more easily because of the symbolic dimension that the association has for producers or for the city and region. Last but not least, it is crucial that the association provides satisfactory economic benefits to its members, i.e., be truly effective in relation to the services it intends to develop, taking advantage of the scale it possesses and being able to take these services to a bigger number of associated producers interested in them.
160 161
BIOENERGY FROM SUGARCANECHAPTER 7
CONCLUSION
This study was able to identify the predecessor dimensions and predictors of satisfaction of the producers concerning the associations to which they belong. From the multiple linear regression analysis of the variables identified in the baseline with the overall satisfaction rate, five dimensions composed the final model: perception of services offered, representation, trust, economic aspect and honor.
As shown at the beginning of the work, satisfaction of the members of the associations are consequences of the reach of individual and collective benefits consistent with their expectations. Accordingly, aspects have been identified for both types of benefits. However, the collective aspects had greater impact on satisfaction of the members than the individual ones, unlike expected before the achievement of the research. Both dimensions that make up the individual aspects – economic factors and honor felt by the members for being part of the association – showed less significance when compared to the other dimensions.
Another aspect to be considered is that, since it was identified that 63.9% of the variability of the data obtained for the satisfaction of producers is explained from the model composed of five dimensions, it appears that there are other issues that can cause satisfaction of producers. Thus, future research may try to determine other sources of satisfaction among them.
Future research may also try to identify moderating variables that may influence the relationship between the dimensions found here and satisfaction. Internal features of associations and producers, as well as characteristics of the existing relationship, can be one of the aspects that can compose these variables.
CONFLICTS OF INTERESTThe authors declare no conflicts of interest.
ACKNOWLEDGMENTAuthors would like to thank FAPESP for the financial support
provided to this research project, as well as the instititutional support from Orplana (Organização dos Plantadores de Cana da Região Centro-Sul do Brasil).
BY GABRIEL VICENTINI PEREIRA, MARCOS FAVA NEVES, FLAVIO RUHNKE VALÉRIO, FÁBIO GUSMAN DELSIN, RAFAEL
BORDONAL KALAKI
AN OVERVIEW OF SUGAR FARMERS IN 2017 FROM THE PERSPECTIVE OF THE RELATIONSHIP
8
Originally published in 28th Annual IFAMA World Conference: Disruptive Innovations: better business, management, science, government, 2018, Buenos Aires, Argentina.
162
BIOENERGY FROM SUGARCANE
INTRODUCTION
The sugar-energy sector in Brazil has had great importance since colonization, having walked along with the country in its progress and development. Besides that, it is currently recognized as a pillar of the Brazilian economy. In 2017, Brazil appears as the largest sugarcane producer in the world, reaching 633.26 million tons, in addition to being responsible for 48% of the world exports (CONAB, 2018). Proving the relevance of this sector to the country, sugarcane currently covers 8.7 million hectares in Brazil, which corresponds to 4.35% of the Brazilian arable land (FAO, 2017).
The sector has a large impact on the Brazilian economy, being a great generator of resources for the country, because taking into account only the harvest of 2016/2017 the sector generated a GDP of US$ 47.13 billion, which is equivalent to approximately 2.4 % of national GDP (CEPEA, 2018).
Nowadays, the sector has been facing some challenges such as high cost of production, which has a direct impact on farmers' margins; producing units with a high degree of indebtedness; lack of public policies created by the government; and lack of price controls that directly interfere with the competitiveness of ethanol compared to other sources of energy. (NEVES et al., 2017)
In times when there are difficulties in the sector, the relationship between all links of the chain can provide improvements for everyone involved in the industry. According to Berry (1995), there are three levels of relationship that provide different levels of benefits: in the financial scope, with monetary incentives and discounts for customer loyalty; in the social scope, with better interaction between customer and consumer; and in the structural scope, where a higher level of relationship is developed, making the connection between supplier and client difficult to unlink.
Within this context, sugarcane farmers can use these benefits brought by the improvement of relationships to solidify and protect themselves, thinking about their business in the short and long term.
Based on the arguments described, this study intends to answer the following question: how to improve the relationships of Brazilian sugarcane farmers with other links in the production chain?
OBJECTIVES
The objective of this study is to analyze the importance of the relationship for the development of sugarcane farmers in Brazil, and the way in which they evaluate these already existing relationships.
165
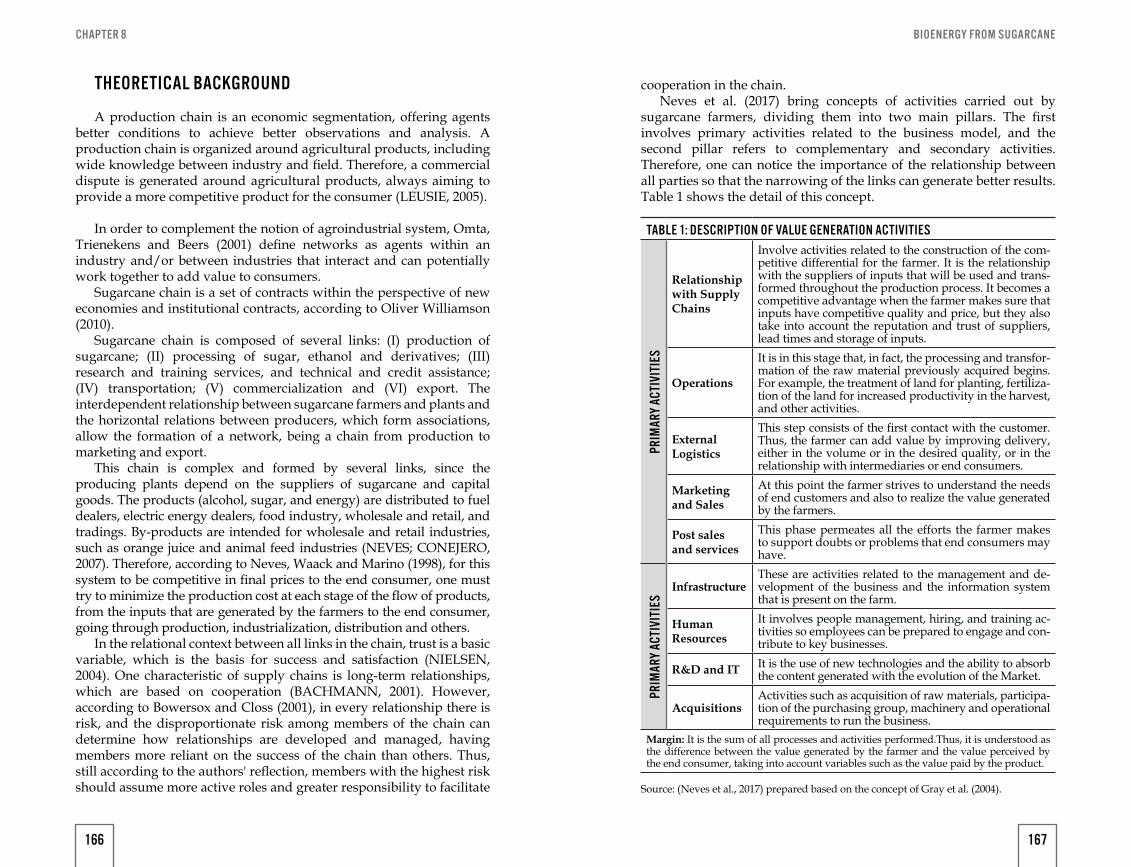
BIOENERGY FROM SUGARCANECHAPTER 8
THEORETICAL BACKGROUND
A production chain is an economic segmentation, offering agents better conditions to achieve better observations and analysis. A production chain is organized around agricultural products, including wide knowledge between industry and field. Therefore, a commercial dispute is generated around agricultural products, always aiming to provide a more competitive product for the consumer (LEUSIE, 2005).
In order to complement the notion of agroindustrial system, Omta, Trienekens and Beers (2001) define networks as agents within an industry and/or between industries that interact and can potentially work together to add value to consumers.
Sugarcane chain is a set of contracts within the perspective of new economies and institutional contracts, according to Oliver Williamson (2010).
Sugarcane chain is composed of several links: (I) production of sugarcane; (II) processing of sugar, ethanol and derivatives; (III) research and training services, and technical and credit assistance; (IV) transportation; (V) commercialization and (VI) export. The interdependent relationship between sugarcane farmers and plants and the horizontal relations between producers, which form associations, allow the formation of a network, being a chain from production to marketing and export.
This chain is complex and formed by several links, since the producing plants depend on the suppliers of sugarcane and capital goods. The products (alcohol, sugar, and energy) are distributed to fuel dealers, electric energy dealers, food industry, wholesale and retail, and tradings. By-products are intended for wholesale and retail industries, such as orange juice and animal feed industries (NEVES; CONEJERO, 2007). Therefore, according to Neves, Waack and Marino (1998), for this system to be competitive in final prices to the end consumer, one must try to minimize the production cost at each stage of the flow of products, from the inputs that are generated by the farmers to the end consumer, going through production, industrialization, distribution and others.
In the relational context between all links in the chain, trust is a basic variable, which is the basis for success and satisfaction (NIELSEN, 2004). One characteristic of supply chains is long-term relationships, which are based on cooperation (BACHMANN, 2001). However, according to Bowersox and Closs (2001), in every relationship there is risk, and the disproportionate risk among members of the chain can determine how relationships are developed and managed, having members more reliant on the success of the chain than others. Thus, still according to the authors' reflection, members with the highest risk should assume more active roles and greater responsibility to facilitate
cooperation in the chain.Neves et al. (2017) bring concepts of activities carried out by
sugarcane farmers, dividing them into two main pillars. The first involves primary activities related to the business model, and the second pillar refers to complementary and secondary activities. Therefore, one can notice the importance of the relationship between all parties so that the narrowing of the links can generate better results. Table 1 shows the detail of this concept.
TABLE 1: DESCRIPTION OF VALUE GENERATION ACTIVITIES
PRIM
ARY
ACTI
VITI
ES
Relationship with Supply Chains
Involve activities related to the construction of the com-petitive differential for the farmer. It is the relationship with the suppliers of inputs that will be used and trans-formed throughout the production process. It becomes a competitive advantage when the farmer makes sure that inputs have competitive quality and price, but they also take into account the reputation and trust of suppliers, lead times and storage of inputs.
Operations
It is in this stage that, in fact, the processing and transfor-mation of the raw material previously acquired begins. For example, the treatment of land for planting, fertiliza-tion of the land for increased productivity in the harvest, and other activities.
External Logistics
This step consists of the first contact with the customer. Thus, the farmer can add value by improving delivery, either in the volume or in the desired quality, or in the relationship with intermediaries or end consumers.
Marketing and Sales
At this point the farmer strives to understand the needs of end customers and also to realize the value generated by the farmers.
Post sales and services
This phase permeates all the efforts the farmer makes to support doubts or problems that end consumers may have.
PRIM
ARY
ACTI
VITI
ES
InfrastructureThese are activities related to the management and de-velopment of the business and the information system that is present on the farm.
Human Resources
It involves people management, hiring, and training ac-tivities so employees can be prepared to engage and con-tribute to key businesses.
R&D and IT It is the use of new technologies and the ability to absorb the content generated with the evolution of the Market.
AcquisitionsActivities such as acquisition of raw materials, participa-tion of the purchasing group, machinery and operational requirements to run the business.
Margin: It is the sum of all processes and activities performed.Thus, it is understood as the difference between the value generated by the farmer and the value perceived by the end consumer, taking into account variables such as the value paid by the product.
Source: (Neves et al., 2017) prepared based on the concept of Gray et al. (2004).
166 167
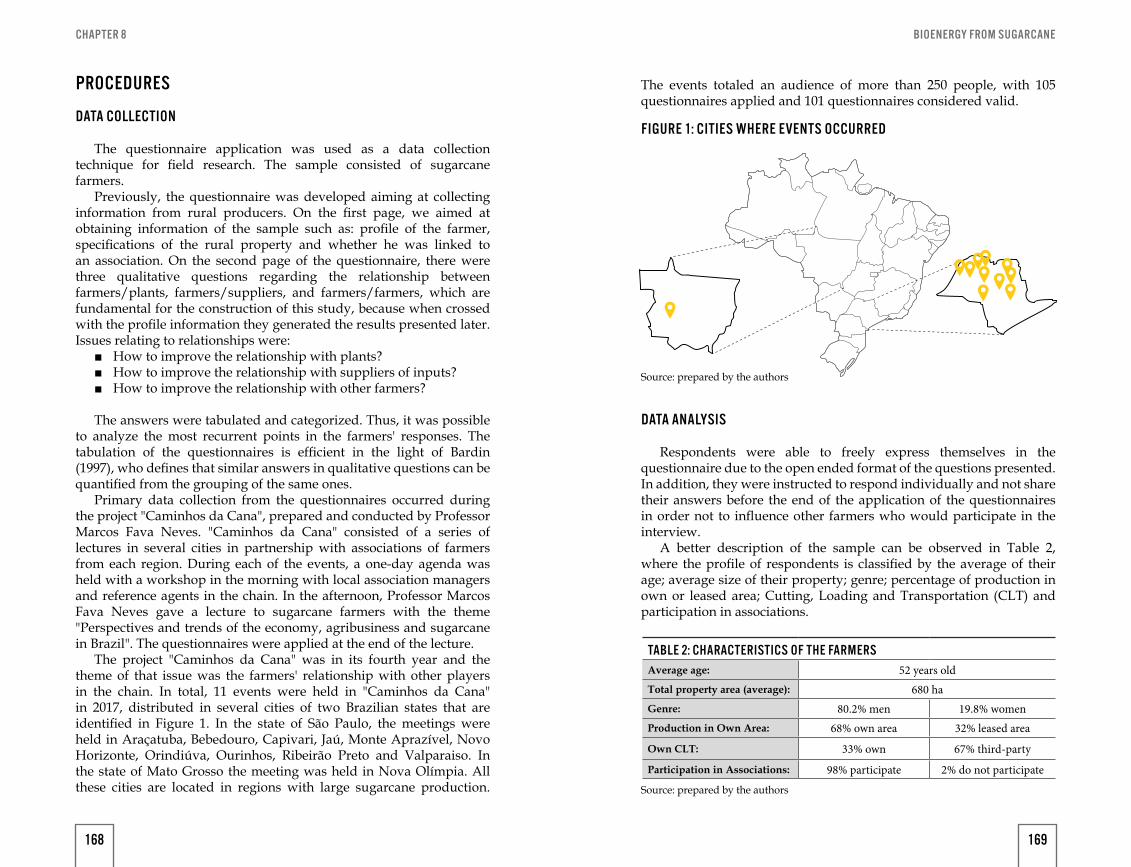
BIOENERGY FROM SUGARCANECHAPTER 8
PROCEDURES
DATA COLLECTION
The questionnaire application was used as a data collection technique for field research. The sample consisted of sugarcane farmers.
Previously, the questionnaire was developed aiming at collecting information from rural producers. On the first page, we aimed at obtaining information of the sample such as: profile of the farmer, specifications of the rural property and whether he was linked to an association. On the second page of the questionnaire, there were three qualitative questions regarding the relationship between farmers/plants, farmers/suppliers, and farmers/farmers, which are fundamental for the construction of this study, because when crossed with the profile information they generated the results presented later. Issues relating to relationships were:
■ How to improve the relationship with plants? ■ How to improve the relationship with suppliers of inputs? ■ How to improve the relationship with other farmers?
The answers were tabulated and categorized. Thus, it was possible to analyze the most recurrent points in the farmers' responses. The tabulation of the questionnaires is efficient in the light of Bardin (1997), who defines that similar answers in qualitative questions can be quantified from the grouping of the same ones.
Primary data collection from the questionnaires occurred during the project "Caminhos da Cana", prepared and conducted by Professor Marcos Fava Neves. "Caminhos da Cana" consisted of a series of lectures in several cities in partnership with associations of farmers from each region. During each of the events, a one-day agenda was held with a workshop in the morning with local association managers and reference agents in the chain. In the afternoon, Professor Marcos Fava Neves gave a lecture to sugarcane farmers with the theme "Perspectives and trends of the economy, agribusiness and sugarcane in Brazil". The questionnaires were applied at the end of the lecture.
The project "Caminhos da Cana" was in its fourth year and the theme of that issue was the farmers' relationship with other players in the chain. In total, 11 events were held in "Caminhos da Cana" in 2017, distributed in several cities of two Brazilian states that are identified in Figure 1. In the state of São Paulo, the meetings were held in Araçatuba, Bebedouro, Capivari, Jaú, Monte Aprazível, Novo Horizonte, Orindiúva, Ourinhos, Ribeirão Preto and Valparaiso. In the state of Mato Grosso the meeting was held in Nova Olímpia. All these cities are located in regions with large sugarcane production.
The events totaled an audience of more than 250 people, with 105 questionnaires applied and 101 questionnaires considered valid.
DATA ANALYSIS
Respondents were able to freely express themselves in the questionnaire due to the open ended format of the questions presented. In addition, they were instructed to respond individually and not share their answers before the end of the application of the questionnaires in order not to influence other farmers who would participate in the interview.
A better description of the sample can be observed in Table 2, where the profile of respondents is classified by the average of their age; average size of their property; genre; percentage of production in own or leased area; Cutting, Loading and Transportation (CLT) and participation in associations.
FIGURE 1: CITIES WHERE EVENTS OCCURRED
Source: prepared by the authors
Source: prepared by the authors
TABLE 2: CHARACTERISTICS OF THE FARMERSAverage age: 52 years oldTotal property area (average): 680 ha Genre: 80.2% men 19.8% womenProduction in Own Area: 68% own area 32% leased area
Own CLT: 33% own 67% third-party
Participation in Associations: 98% participate 2% do not participate
168 169
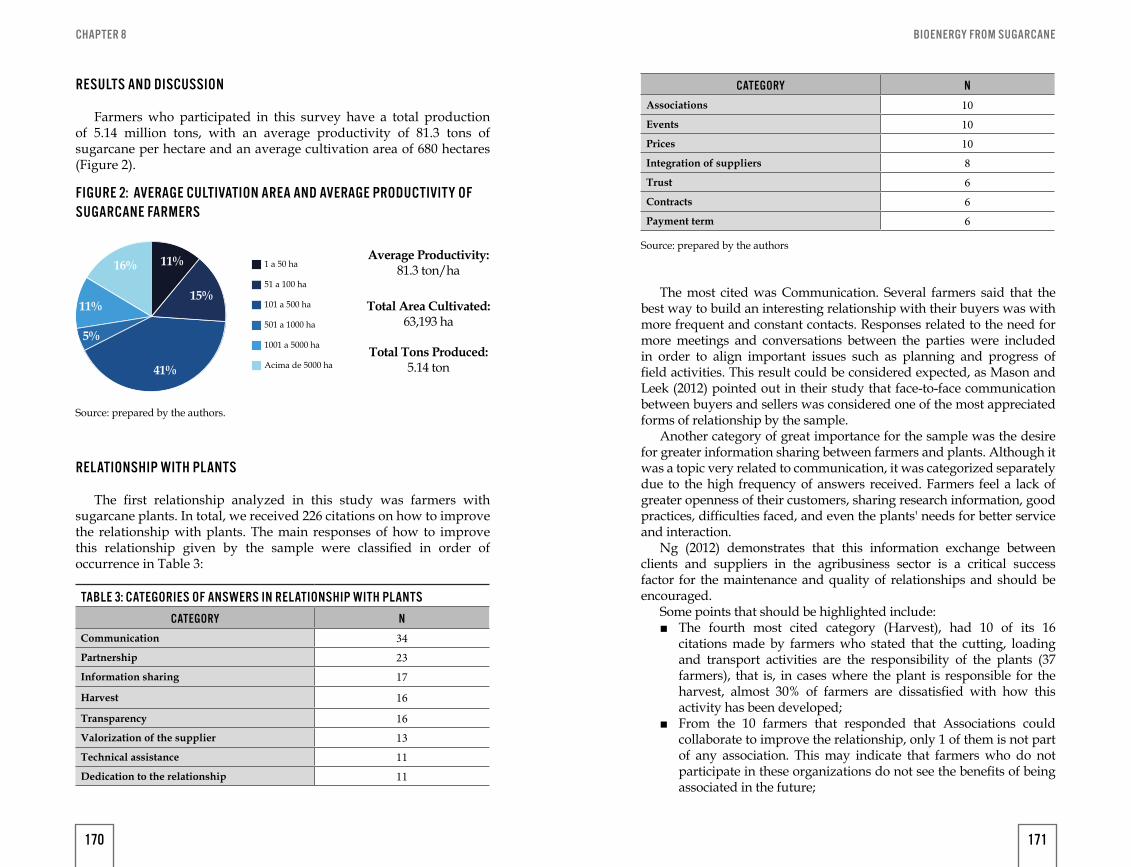
BIOENERGY FROM SUGARCANECHAPTER 8
RESULTS AND DISCUSSION
Farmers who participated in this survey have a total production of 5.14 million tons, with an average productivity of 81.3 tons of sugarcane per hectare and an average cultivation area of 680 hectares (Figure 2).
RELATIONSHIP WITH PLANTS
The first relationship analyzed in this study was farmers with sugarcane plants. In total, we received 226 citations on how to improve the relationship with plants. The main responses of how to improve this relationship given by the sample were classified in order of occurrence in Table 3:
1 a 50 ha
51 a 100 ha
101 a 500 ha
501 a 1000 ha
1001 a 5000 ha
Acima de 5000 ha
Average Productivity:81.3 ton/ha
Total Area Cultivated:63,193 ha
Total Tons Produced:5.14 ton
11%
15%
41%
5%
11%
16%
FIGURE 2: AVERAGE CULTIVATION AREA AND AVERAGE PRODUCTIVITY OF SUGARCANE FARMERS
Source: prepared by the authors.
TABLE 3: CATEGORIES OF ANSWERS IN RELATIONSHIP WITH PLANTS
CATEGORY NCommunication 34Partnership 23Information sharing 17
Harvest 16
Transparency 16Valorization of the supplier 13Technical assistance 11Dedication to the relationship 11
Source: prepared by the authors
CATEGORY NAssociations 10Events 10Prices 10Integration of suppliers 8Trust 6Contracts 6Payment term 6
The most cited was Communication. Several farmers said that the best way to build an interesting relationship with their buyers was with more frequent and constant contacts. Responses related to the need for more meetings and conversations between the parties were included in order to align important issues such as planning and progress of field activities. This result could be considered expected, as Mason and Leek (2012) pointed out in their study that face-to-face communication between buyers and sellers was considered one of the most appreciated forms of relationship by the sample.
Another category of great importance for the sample was the desire for greater information sharing between farmers and plants. Although it was a topic very related to communication, it was categorized separately due to the high frequency of answers received. Farmers feel a lack of greater openness of their customers, sharing research information, good practices, difficulties faced, and even the plants' needs for better service and interaction.
Ng (2012) demonstrates that this information exchange between clients and suppliers in the agribusiness sector is a critical success factor for the maintenance and quality of relationships and should be encouraged.
Some points that should be highlighted include: ■ The fourth most cited category (Harvest), had 10 of its 16
citations made by farmers who stated that the cutting, loading and transport activities are the responsibility of the plants (37 farmers), that is, in cases where the plant is responsible for the harvest, almost 30% of farmers are dissatisfied with how this activity has been developed;
■ From the 10 farmers that responded that Associations could collaborate to improve the relationship, only 1 of them is not part of any association. This may indicate that farmers who do not participate in these organizations do not see the benefits of being associated in the future;
170 171
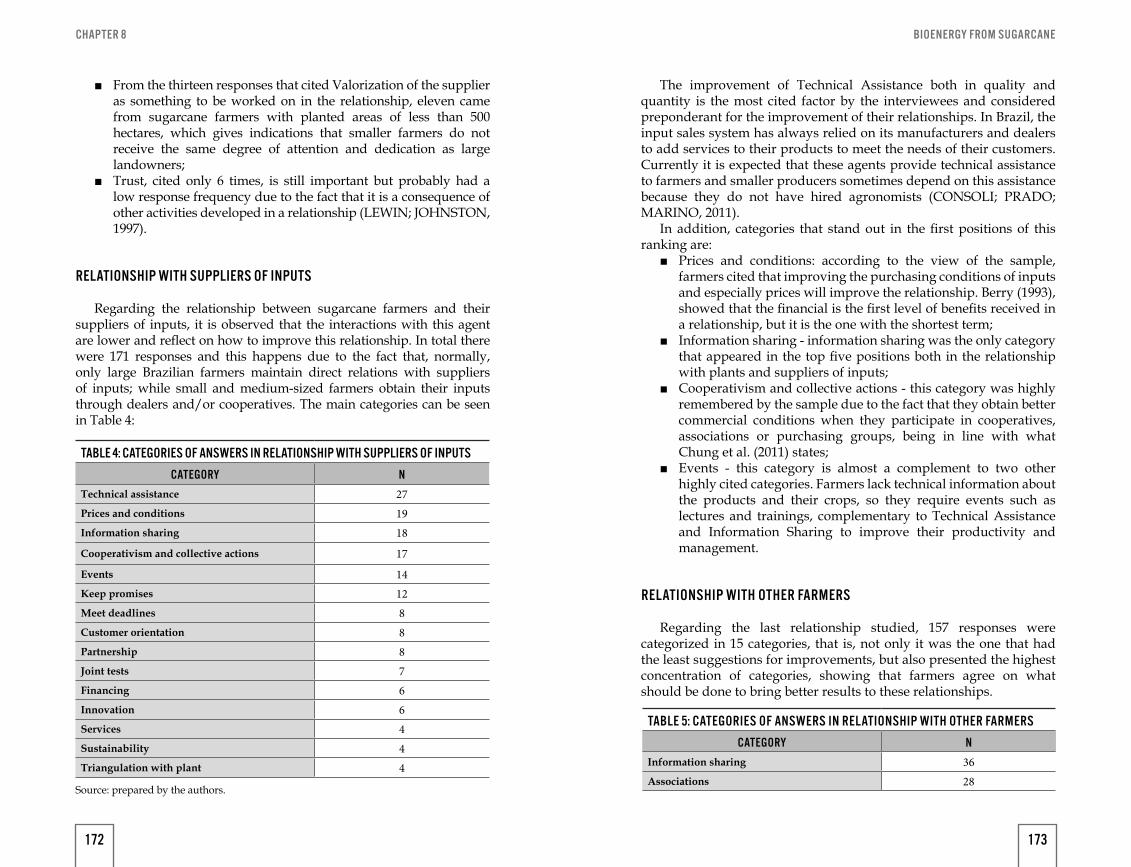
BIOENERGY FROM SUGARCANECHAPTER 8
■ From the thirteen responses that cited Valorization of the supplier as something to be worked on in the relationship, eleven came from sugarcane farmers with planted areas of less than 500 hectares, which gives indications that smaller farmers do not receive the same degree of attention and dedication as large landowners;
■ Trust, cited only 6 times, is still important but probably had a low response frequency due to the fact that it is a consequence of other activities developed in a relationship (LEWIN; JOHNSTON, 1997).
RELATIONSHIP WITH SUPPLIERS OF INPUTS
Regarding the relationship between sugarcane farmers and their suppliers of inputs, it is observed that the interactions with this agent are lower and reflect on how to improve this relationship. In total there were 171 responses and this happens due to the fact that, normally, only large Brazilian farmers maintain direct relations with suppliers of inputs; while small and medium-sized farmers obtain their inputs through dealers and/or cooperatives. The main categories can be seen in Table 4:
TABLE 4: CATEGORIES OF ANSWERS IN RELATIONSHIP WITH SUPPLIERS OF INPUTS
CATEGORY NTechnical assistance 27Prices and conditions 19Information sharing 18
Cooperativism and collective actions 17
Events 14Keep promises 12Meet deadlines 8Customer orientation 8Partnership 8Joint tests 7Financing 6Innovation 6Services 4Sustainability 4Triangulation with plant 4
Source: prepared by the authors.
The improvement of Technical Assistance both in quality and quantity is the most cited factor by the interviewees and considered preponderant for the improvement of their relationships. In Brazil, the input sales system has always relied on its manufacturers and dealers to add services to their products to meet the needs of their customers. Currently it is expected that these agents provide technical assistance to farmers and smaller producers sometimes depend on this assistance because they do not have hired agronomists (CONSOLI; PRADO; MARINO, 2011).
In addition, categories that stand out in the first positions of this ranking are:
■ Prices and conditions: according to the view of the sample, farmers cited that improving the purchasing conditions of inputs and especially prices will improve the relationship. Berry (1993), showed that the financial is the first level of benefits received in a relationship, but it is the one with the shortest term;
■ Information sharing - information sharing was the only category that appeared in the top five positions both in the relationship with plants and suppliers of inputs;
■ Cooperativism and collective actions - this category was highly remembered by the sample due to the fact that they obtain better commercial conditions when they participate in cooperatives, associations or purchasing groups, being in line with what Chung et al. (2011) states;
■ Events - this category is almost a complement to two other highly cited categories. Farmers lack technical information about the products and their crops, so they require events such as lectures and trainings, complementary to Technical Assistance and Information Sharing to improve their productivity and management.
RELATIONSHIP WITH OTHER FARMERS
Regarding the last relationship studied, 157 responses were categorized in 15 categories, that is, not only it was the one that had the least suggestions for improvements, but also presented the highest concentration of categories, showing that farmers agree on what should be done to bring better results to these relationships.
TABLE 5: CATEGORIES OF ANSWERS IN RELATIONSHIP WITH OTHER FARMERS
CATEGORY NInformation sharing 36Associations 28
172 173
BIOENERGY FROM SUGARCANECHAPTER 8
Source: prepared by the authors.
CATEGORY NEvents 28
Partnership 19
Collective actions 14Friendship 7Communication 7Cooperativism 6Trust 5Policy 2Get knowledge 1Loans 1Innovation 1Unions 1Plants 1
In the most cited category, Information Sharing, it was mentioned the need for farmers to share cases of success and good agricultural practices with their peers, so that good examples are disseminated and followed by all.
Two categories had the same number of responses and occupied the second position in the ranking of Table 5: Associations and Events. Farmers have made it clear that these two categories are ways of maintaining contact with other farmers and are also ways to share information and ideas.
According to Neves (2012), one of the benefits of performing collective action is to reduce costs by gaining scale or by not having to immobilize resources with machines and equipment. This is precisely what sugarcane farmers have in mind when classifying collective actions as the fifth most important category for developing relationships with their colleagues. Many have cited joint development operation (such as harvest and machine acquisitions) and/or increasing the bargaining power and obtain discounts when forming purchasing groups of inputs, for example.
CONCLUSIONS
The results point to the main actions, suggested by the farmers interviewed, to improve their relationships with important agents in the production chain. In the relationship with plants, the need to
improve interaction, communication and sense of partnership between the links stands out, maintaining a relationship in which information is shared and the organizations are transparent.
In the case of suppliers of inputs, the most important points included Technical Assistance, Prices and conditions, Information sharing, Cooperativism, and Events. It is noticed that (perhaps because it is the only relation studied in which the farmers are the clients) of the five main actions, three are activities that are carried out by the suppliers of inputs to satisfy their desires (Technical Assistance, Prices and conditions, and Events), with few solutions in which they need to engage or devote efforts and resources.
For the relationship with other farmers, the central points are Information Sharing and Collective Actions, mainly through Associations and Events, promoting greater partnership among farmers. It was clear in the study that Information Sharing (the only category present in the top 5 of the three relationships) is the central point that fosters the relations of the sugarcane farmers studied.
A final highlight is that the relationship with plants, probably because of its importance and because it is a relationship more difficult to be managed, was the agent that had more answers, showing that managers of both links must structure and plan in order to improve these relationships.
The main limitations of the study include the small sample of farmers interviewed, which prevent the information obtained in the results from being extrapolated to all sugarcane farmers in the country. The same limitation also prevented some analysis and cutbacks in the sample.
Another point that may have skewed the sample is the fact that the farmers interviewed were selected in a non-random way and for convenience. Thus, their opinions may not reflect the industry average. Some categories of responses may also have been induced. For example, answers that cite associations as a way of improving the relationship are in part due to the fact that the questionnaires were applied in an event organized in partnership with local associations and most part of the interviewees were members of them.
Finally, one should also take into account that some farmers did not fully understand the question, since their answers not always pointed out activities or actions of improvement in the relationships.
As research suggestions, studies should be done to better understand the satisfaction of sugarcane farmers with their existing relationships in a qualitative and deeper way. Moreover, the categories that were the most cited in this study could also have their motivations better understood with focused case studies.
174 175
BIOENERGY FROM SUGARCANE
BY RAFAEL BORDONAL KALAKI, JULIANA BORBA DE MORAES FARINELLI, ALINE HELEN DA SILVA, MAÍRA RODRIGUES
NASCIMENTO, MARCOS FAVA NEVES
SUSTAINABILITY IN THE SUGARCANE PRODUCTION THE CASE OF SOCICANA AND TOP CANA PROGRAM
9
BIOENERGY FROM SUGARCANE
In the early 2000s, Paulo de Araújo Rodrigues, who is a sugarcane farmer, was thinking from his farm office about the challenges of sustainability, the demands that consumer markets had on products, and how he could demonstrate a more sustainable sugarcane production that would meet market demands and add value to his activity.
“Consumers are looking for products with greater sustainable appeal and I have been practicing it for generations. How can I show the world that I have sustainable agriculture? How can I add value to and differentiate my production based on my sustainable practices?” – Paulo de Araújo Rodrigues
In another office, off the field and in one of the largest cities in the world, Solidaridad10, an international civil society organization with an office in São Paulo, Brazil, wondered how it could support farmers to improve their agriculture practices to become more sustainable.
“How to act in the sugarcane chain in Brazil seeking innovative solutions to the producer’s demands? How to contribute to making production more sustainable? Which stakeholders should I engage with to achieve these goals?” - Rodrigo Castro
In the city of Guariba, Bruno Rangel Geraldo Martins, president of Socicana, an association of sugarcane growers, also thought about the future challenges and how the association, through collective actions, could generate value for its members and make them even more competitive and sustainable.
“The act of being part of Socicana is voluntary, that is, the grower only associates when he realizes its worth. What could Socicana do to show value to its members? How to build loyalty and show that the benefit of participating in a collective action agency can benefit growers? How could Socicana help them increase sustainable development?” – Bruno Rangel Geraldo Martins
It was in this scenario with different agents and challenges, but with common interests, that Socicana developed the Top Cana Program in partnership with Solidaridad, which is a program for continuous improvement and sustainable development of sugarcane production.
HOW IT ALL STARTED AND THE CHALLENGES OF THE FUTURE
The sugar-energy sector has been important for Brazil since the country’s colonization (15th century), and it has been the central engine of the economy. In the state of São Paulo, sugarcane cultivation began to gain more importance from the 1930s, with the decline of Brazilian coffee.
10. Solidaridad is an international civil society organization with over 50 years of experience and operations in over 40 countries focused on the sustainability of value chains. In Brazil, Solidaridad operates in eight commodity chains, contributing to food security and the implementation of good agricultural practices in the context of climate change adaptation and mitigation.
179
BIOENERGY FROM SUGARCANECHAPTER 9
After that, the sugar activity started to grow, with the implementation of sugarcane fields and industrial units in the state. In the 1950s, sugarcane production in the state of São Paulo showed a sixfold increase. However, the consolidation of the sector took place from November 14th, 1975 on, when the Brazilian federal government created the Pro-Álcool (National Fuel Alcohol Program), which aimed to stimulate the production of alcohol (ethanol), as well as the production of cars fueled by ethanol, reduce and replace the consumption of petroleum products (which in that decade reached record prices), add anhydrous ethanol to gasoline, and reduce oil imports.
An important factor to consider concerning the Brazilian sugar-energy sector is its organizational transformation throughout recent history. Until the late 1990s, the Brazilian government regulated the sector. The government set the price of products and the quotas of production. The pricing methodology was performed by the IAA (Sugar and Alcohol Institute) and aimed to ensure profitability for agricultural growers and mills. The price was set for each producing state and calculated from production cost spreadsheets plus a share representing the profit. Also, to ensure the rights of farmers and assist in the promotion of public policies, the sector adopted the model of regional associations, in which participation was mandatory and determined by Law 4.870. Since 1990, the IAA was extinguished and the Brazilian government ceased to regulate the sector and to set prices, leaving the sector in a void concerning the operating rules of raw material pricing and remuneration.
Faced with the challenge of deregulation, the private initiative created Consecana (The State of São Paulo Sugarcane, Sugar and Ethanol Growers Council) in 1999. Consecana is a non-profit institution, created to provide transparency in the pricing of sugarcane. Consecana is made up of sugarcane growers, represented by Orplana (the Organization of Cane Planters of the Center-South Region of Brazil) and sugar and alcohol industries, represented by UNICA (Brazilian Sugarcane Industry Association). The sugarcane payment system uses a methodology based on the measurement of the Total Retrievable Sugar (ATR), which is the total amount (in weight) of sugar not lost in the industrial process of milling. Therefore, the ATR is a quality index that reflects how many kilograms of sugar are present in the cane plant. Based on a series of criteria and standard measures that include the average price of sugar and ethanol in the market, the percentage of sugarcane prices in the average cost of sugar and ethanol, and production mix of each industrial mill, Consecana publishes every month the kilogram of ATR price that is valid for all mills that participate in the system.
In addition to the challenge of pricing, in 2003, the sanction of Law 4,870 that dealt with growers’ affiliation to regional associations
was revoked. Thus, the participation in associations was no longer compulsory and became voluntary, which was a new challenge for the associations, since now they had to prove their worth to their members to remain affiliated.
As stated initially, Pró-Alcool was created to stimulate ethanol production and mainly to reduce Brazil's dependence on oil. Today, the reasons for adopting ethanol go beyond this dependence. There is a worldwide search for conscious consumption, resource use reduction, and greenhouse gas emission reduction. These concerns lead to global events to discuss these issues. One of them was the COP 21 that occurred in December 2015. COP 21 (21st Conference of the Parties) is a Framework Convention on Climate Change, which seeks to understand and find solutions to climate change. The Conference of the Parties is the principal decision-making body of the United Nations Framework Convention on Climate Change (UNFCCC).
During the event, 195 participating countries signed agreements (iNDC - Intended Nationally Determined Contribution), where each country committed themselves reducing greenhouse gases and setting clear targets for this reduction. In this regard, Brazil has also reached an agreement, in which it proposes to reduce greenhouse gas emissions, mainly by increasing the share of renewable energy and bioenergy in its energy matrix.
The commitments made by Brazil at COP 21 to increase the share of renewable energy will imply an increase in the demand for sustainable electricity and biofuels. In this scenario, the sugar-energy sector is placed as an important pillar of this growth since it offers ethanol, which is the biofuel produced from sugarcane, and bioelectricity generated in the industrial units using by-products of sugar and ethanol production.
The challenges of reducing dependence on oil use in the 1970s, coupled with the current challenges of sustainable production and clean energy, and the Brazilian commitment made at COP21, once again bring the focus to the sugarcane industry and, consequently, sugarcane growers of Brazil.
SOCICANA
Socicana (Association of Sugar Cane suppliers of Guariba) is an association formed by agricultural sugarcane growers in Guariba region in the state of São Paulo. The association was founded in 1951, headquartered in Guariba-SP and represents 1,220 members, an approximate production of 6.1 million tons of sugarcane and an area of 72 thousand hectares.
Vision: To be a reference in providing services to the associate, to be recognized as a leader in the articulation and management of
180 181
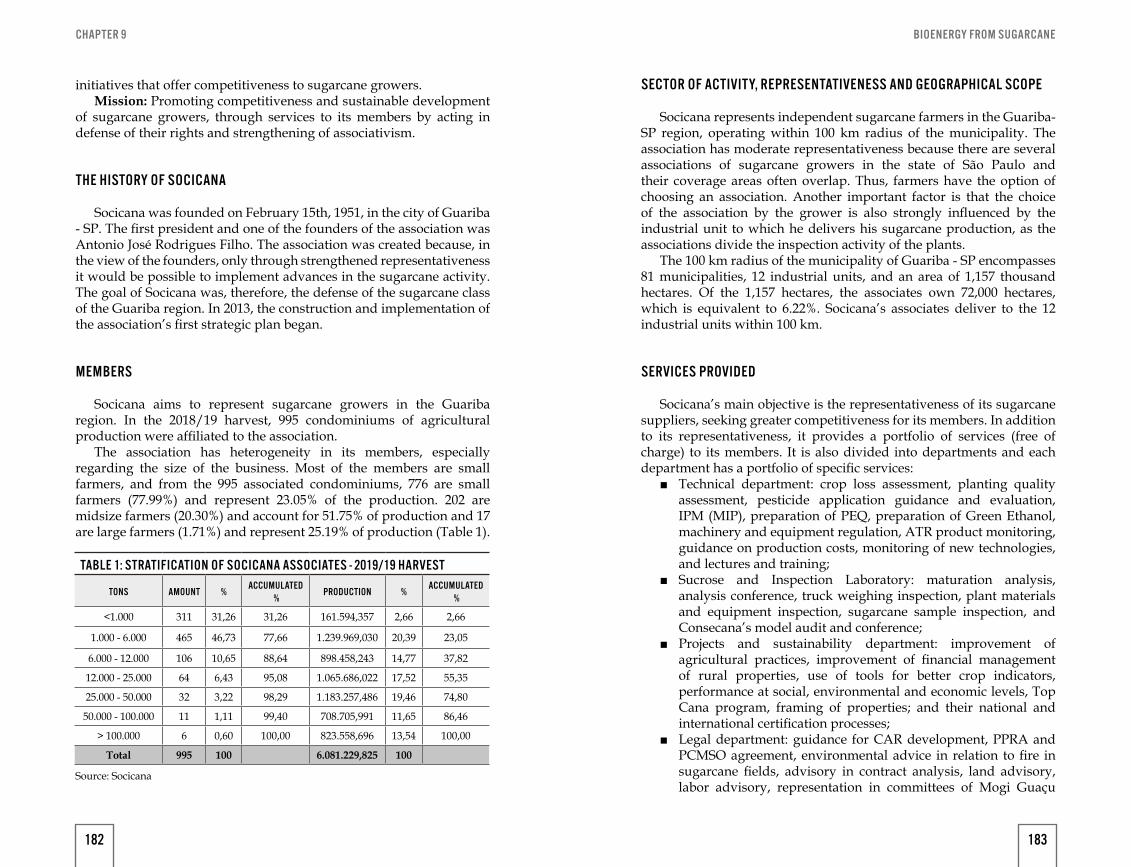
BIOENERGY FROM SUGARCANECHAPTER 9
initiatives that offer competitiveness to sugarcane growers.Mission: Promoting competitiveness and sustainable development
of sugarcane growers, through services to its members by acting in defense of their rights and strengthening of associativism.
THE HISTORY OF SOCICANA
Socicana was founded on February 15th, 1951, in the city of Guariba - SP. The first president and one of the founders of the association was Antonio José Rodrigues Filho. The association was created because, in the view of the founders, only through strengthened representativeness it would be possible to implement advances in the sugarcane activity. The goal of Socicana was, therefore, the defense of the sugarcane class of the Guariba region. In 2013, the construction and implementation of the association’s first strategic plan began.
MEMBERS
Socicana aims to represent sugarcane growers in the Guariba region. In the 2018/19 harvest, 995 condominiums of agricultural production were affiliated to the association.
The association has heterogeneity in its members, especially regarding the size of the business. Most of the members are small farmers, and from the 995 associated condominiums, 776 are small farmers (77.99%) and represent 23.05% of the production. 202 are midsize farmers (20.30%) and account for 51.75% of production and 17 are large farmers (1.71%) and represent 25.19% of production (Table 1).
TABLE 1: STRATIFICATION OF SOCICANA ASSOCIATES - 2019/19 HARVEST
TONS AMOUNT %ACCUMULATED
%PRODUCTION %
ACCUMULATED %
<1.000 311 31,26 31,26 161.594,357 2,66 2,66
1.000 - 6.000 465 46,73 77,66 1.239.969,030 20,39 23,05
6.000 - 12.000 106 10,65 88,64 898.458,243 14,77 37,82
12.000 - 25.000 64 6,43 95,08 1.065.686,022 17,52 55,35
25.000 - 50.000 32 3,22 98,29 1.183.257,486 19,46 74,80
50.000 - 100.000 11 1,11 99,40 708.705,991 11,65 86,46
> 100.000 6 0,60 100,00 823.558,696 13,54 100,00
Total 995 100 6.081.229,825 100
Source: Socicana
SECTOR OF ACTIVITY, REPRESENTATIVENESS AND GEOGRAPHICAL SCOPE
Socicana represents independent sugarcane farmers in the Guariba-SP region, operating within 100 km radius of the municipality. The association has moderate representativeness because there are several associations of sugarcane growers in the state of São Paulo and their coverage areas often overlap. Thus, farmers have the option of choosing an association. Another important factor is that the choice of the association by the grower is also strongly influenced by the industrial unit to which he delivers his sugarcane production, as the associations divide the inspection activity of the plants.
The 100 km radius of the municipality of Guariba - SP encompasses 81 municipalities, 12 industrial units, and an area of 1,157 thousand hectares. Of the 1,157 hectares, the associates own 72,000 hectares, which is equivalent to 6.22%. Socicana’s associates deliver to the 12 industrial units within 100 km.
SERVICES PROVIDED
Socicana’s main objective is the representativeness of its sugarcane suppliers, seeking greater competitiveness for its members. In addition to its representativeness, it provides a portfolio of services (free of charge) to its members. It is also divided into departments and each department has a portfolio of specific services:
■ Technical department: crop loss assessment, planting quality assessment, pesticide application guidance and evaluation, IPM (MIP), preparation of PEQ, preparation of Green Ethanol, machinery and equipment regulation, ATR product monitoring, guidance on production costs, monitoring of new technologies, and lectures and training;
■ Sucrose and Inspection Laboratory: maturation analysis, analysis conference, truck weighing inspection, plant materials and equipment inspection, sugarcane sample inspection, and Consecana’s model audit and conference;
■ Projects and sustainability department: improvement of agricultural practices, improvement of financial management of rural properties, use of tools for better crop indicators, performance at social, environmental and economic levels, Top Cana program, framing of properties; and their national and international certification processes;
■ Legal department: guidance for CAR development, PPRA and PCMSO agreement, environmental advice in relation to fire in sugarcane fields, advisory in contract analysis, land advisory, labor advisory, representation in committees of Mogi Guaçu
182 183
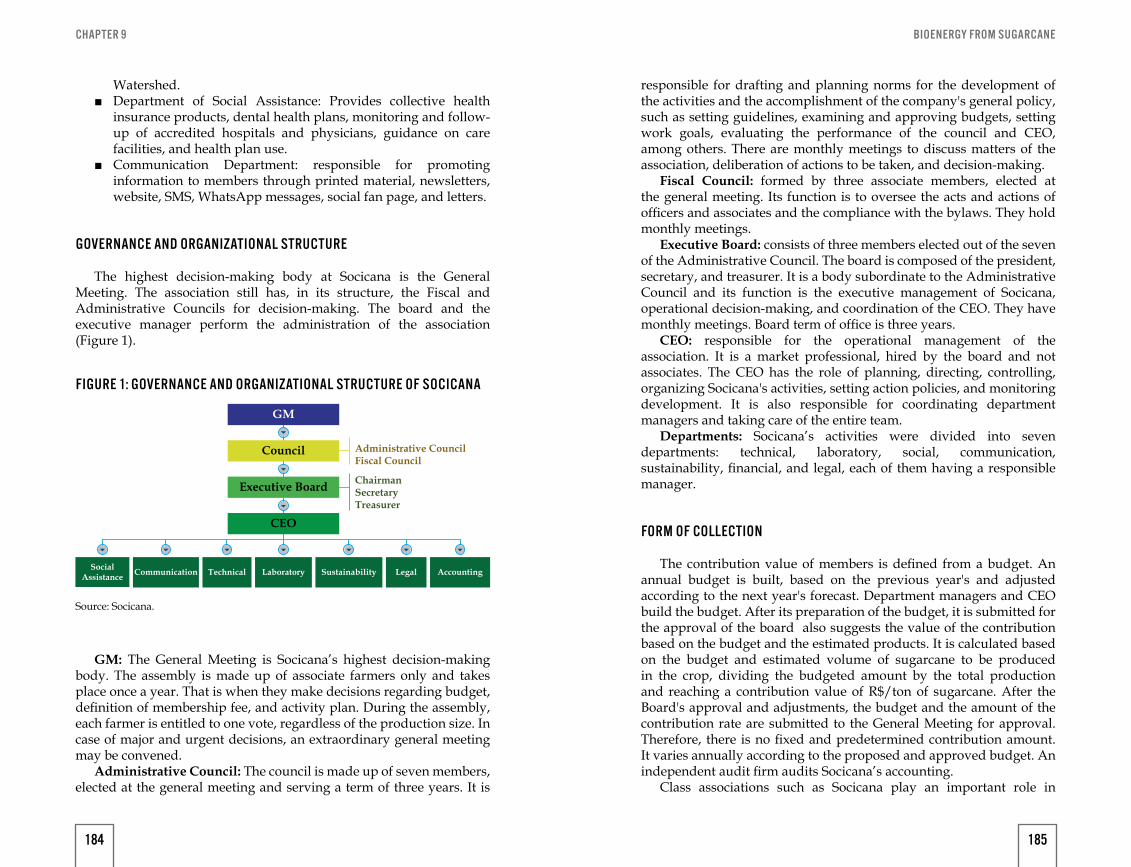
BIOENERGY FROM SUGARCANECHAPTER 9
Watershed. ■ Department of Social Assistance: Provides collective health
insurance products, dental health plans, monitoring and follow-up of accredited hospitals and physicians, guidance on care facilities, and health plan use.
■ Communication Department: responsible for promoting information to members through printed material, newsletters, website, SMS, WhatsApp messages, social fan page, and letters.
GOVERNANCE AND ORGANIZATIONAL STRUCTURE
The highest decision-making body at Socicana is the General Meeting. The association still has, in its structure, the Fiscal and Administrative Councils for decision-making. The board and the executive manager perform the administration of the association (Figure 1).
GM: The General Meeting is Socicana’s highest decision-making body. The assembly is made up of associate farmers only and takes place once a year. That is when they make decisions regarding budget, definition of membership fee, and activity plan. During the assembly, each farmer is entitled to one vote, regardless of the production size. In case of major and urgent decisions, an extraordinary general meeting may be convened.
Administrative Council: The council is made up of seven members, elected at the general meeting and serving a term of three years. It is
Administrative CouncilFiscal Council
ChairmanSecretaryTreasurer
SocialAssistance Communication Technical Laboratory Sustainability Legal Accounting
GM
CEO
Council
Executive Board
Source: Socicana.
FIGURE 1: GOVERNANCE AND ORGANIZATIONAL STRUCTURE OF SOCICANA
responsible for drafting and planning norms for the development of the activities and the accomplishment of the company's general policy, such as setting guidelines, examining and approving budgets, setting work goals, evaluating the performance of the council and CEO, among others. There are monthly meetings to discuss matters of the association, deliberation of actions to be taken, and decision-making.
Fiscal Council: formed by three associate members, elected at the general meeting. Its function is to oversee the acts and actions of officers and associates and the compliance with the bylaws. They hold monthly meetings.
Executive Board: consists of three members elected out of the seven of the Administrative Council. The board is composed of the president, secretary, and treasurer. It is a body subordinate to the Administrative Council and its function is the executive management of Socicana, operational decision-making, and coordination of the CEO. They have monthly meetings. Board term of office is three years.
CEO: responsible for the operational management of the association. It is a market professional, hired by the board and not associates. The CEO has the role of planning, directing, controlling, organizing Socicana's activities, setting action policies, and monitoring development. It is also responsible for coordinating department managers and taking care of the entire team.
Departments: Socicana’s activities were divided into seven departments: technical, laboratory, social, communication, sustainability, financial, and legal, each of them having a responsible manager.
FORM OF COLLECTION
The contribution value of members is defined from a budget. An annual budget is built, based on the previous year's and adjusted according to the next year's forecast. Department managers and CEO build the budget. After its preparation of the budget, it is submitted for the approval of the board also suggests the value of the contribution based on the budget and the estimated products. It is calculated based on the budget and estimated volume of sugarcane to be produced in the crop, dividing the budgeted amount by the total production and reaching a contribution value of R$/ton of sugarcane. After the Board's approval and adjustments, the budget and the amount of the contribution rate are submitted to the General Meeting for approval. Therefore, there is no fixed and predetermined contribution amount. It varies annually according to the proposed and approved budget. An independent audit firm audits Socicana’s accounting.
Class associations such as Socicana play an important role in
184 185
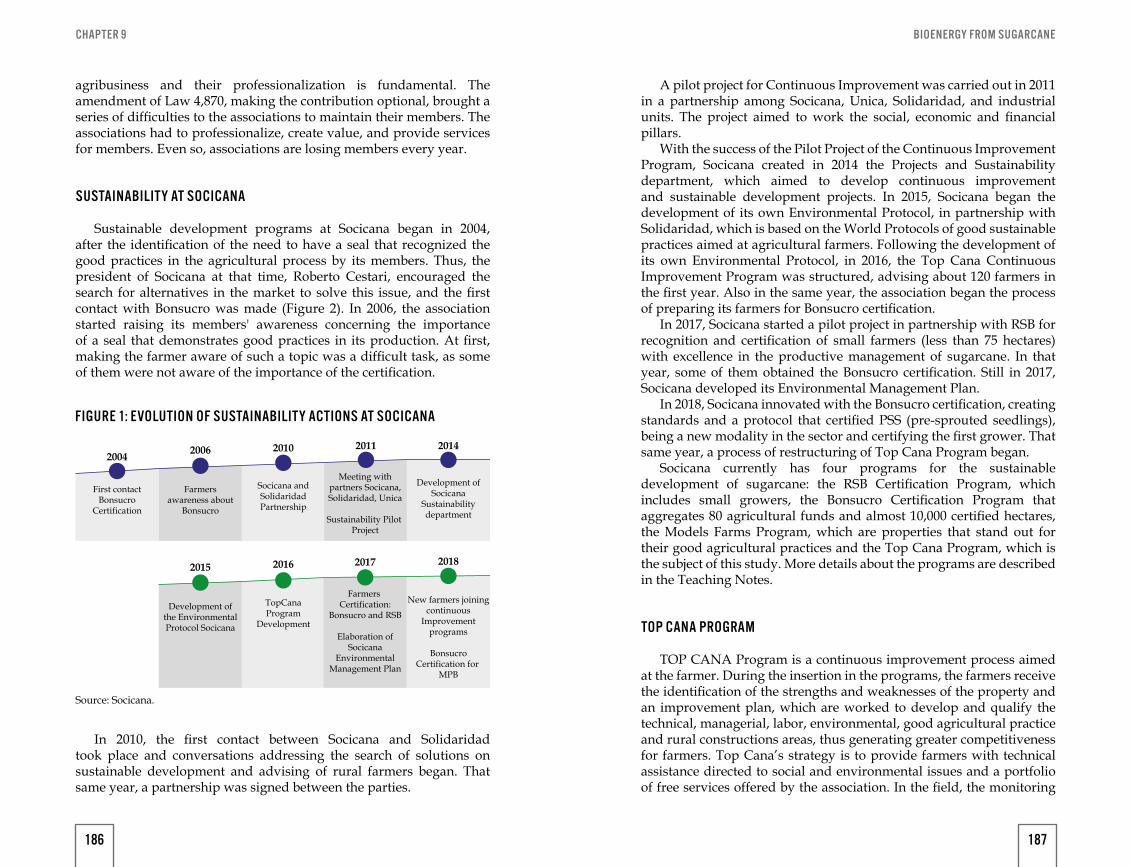
BIOENERGY FROM SUGARCANECHAPTER 9
agribusiness and their professionalization is fundamental. The amendment of Law 4,870, making the contribution optional, brought a series of difficulties to the associations to maintain their members. The associations had to professionalize, create value, and provide services for members. Even so, associations are losing members every year.
SUSTAINABILITY AT SOCICANA
Sustainable development programs at Socicana began in 2004, after the identification of the need to have a seal that recognized the good practices in the agricultural process by its members. Thus, the president of Socicana at that time, Roberto Cestari, encouraged the search for alternatives in the market to solve this issue, and the first contact with Bonsucro was made (Figure 2). In 2006, the association started raising its members' awareness concerning the importance of a seal that demonstrates good practices in its production. At first, making the farmer aware of such a topic was a difficult task, as some of them were not aware of the importance of the certification.
In 2010, the first contact between Socicana and Solidaridad took place and conversations addressing the search of solutions on sustainable development and advising of rural farmers began. That same year, a partnership was signed between the parties.
Development ofthe EnvironmentalProtocol Socicana
TopCanaProgram
Development
Farmers Certification:
Bonsucro and RSB
Elaboration ofSocicana
EnvironmentalManagement Plan
New farmers joiningcontinuous
Improvementprograms
BonsucroCertification for
MPB
2004 2006 2010 2011
2015 2016 2017 2018
2014
First contactBonsucro
Certification
Farmersawareness about
Bonsucro
Socicana andSolidaridadPartnership
Meeting withpartners Socicana,Solidaridad, Unica
Sustainability Pilot Project
Development ofSocicana
Sustainabilitydepartment
FIGURE 1: EVOLUTION OF SUSTAINABILITY ACTIONS AT SOCICANA
Source: Socicana.
A pilot project for Continuous Improvement was carried out in 2011 in a partnership among Socicana, Unica, Solidaridad, and industrial units. The project aimed to work the social, economic and financial pillars.
With the success of the Pilot Project of the Continuous Improvement Program, Socicana created in 2014 the Projects and Sustainability department, which aimed to develop continuous improvement and sustainable development projects. In 2015, Socicana began the development of its own Environmental Protocol, in partnership with Solidaridad, which is based on the World Protocols of good sustainable practices aimed at agricultural farmers. Following the development of its own Environmental Protocol, in 2016, the Top Cana Continuous Improvement Program was structured, advising about 120 farmers in the first year. Also in the same year, the association began the process of preparing its farmers for Bonsucro certification.
In 2017, Socicana started a pilot project in partnership with RSB for recognition and certification of small farmers (less than 75 hectares) with excellence in the productive management of sugarcane. In that year, some of them obtained the Bonsucro certification. Still in 2017, Socicana developed its Environmental Management Plan.
In 2018, Socicana innovated with the Bonsucro certification, creating standards and a protocol that certified PSS (pre-sprouted seedlings), being a new modality in the sector and certifying the first grower. That same year, a process of restructuring of Top Cana Program began.
Socicana currently has four programs for the sustainable development of sugarcane: the RSB Certification Program, which includes small growers, the Bonsucro Certification Program that aggregates 80 agricultural funds and almost 10,000 certified hectares, the Models Farms Program, which are properties that stand out for their good agricultural practices and the Top Cana Program, which is the subject of this study. More details about the programs are described in the Teaching Notes.
TOP CANA PROGRAM
TOP CANA Program is a continuous improvement process aimed at the farmer. During the insertion in the programs, the farmers receive the identification of the strengths and weaknesses of the property and an improvement plan, which are worked to develop and qualify the technical, managerial, labor, environmental, good agricultural practice and rural constructions areas, thus generating greater competitiveness for farmers. Top Cana’s strategy is to provide farmers with technical assistance directed to social and environmental issues and a portfolio of free services offered by the association. In the field, the monitoring
186 187
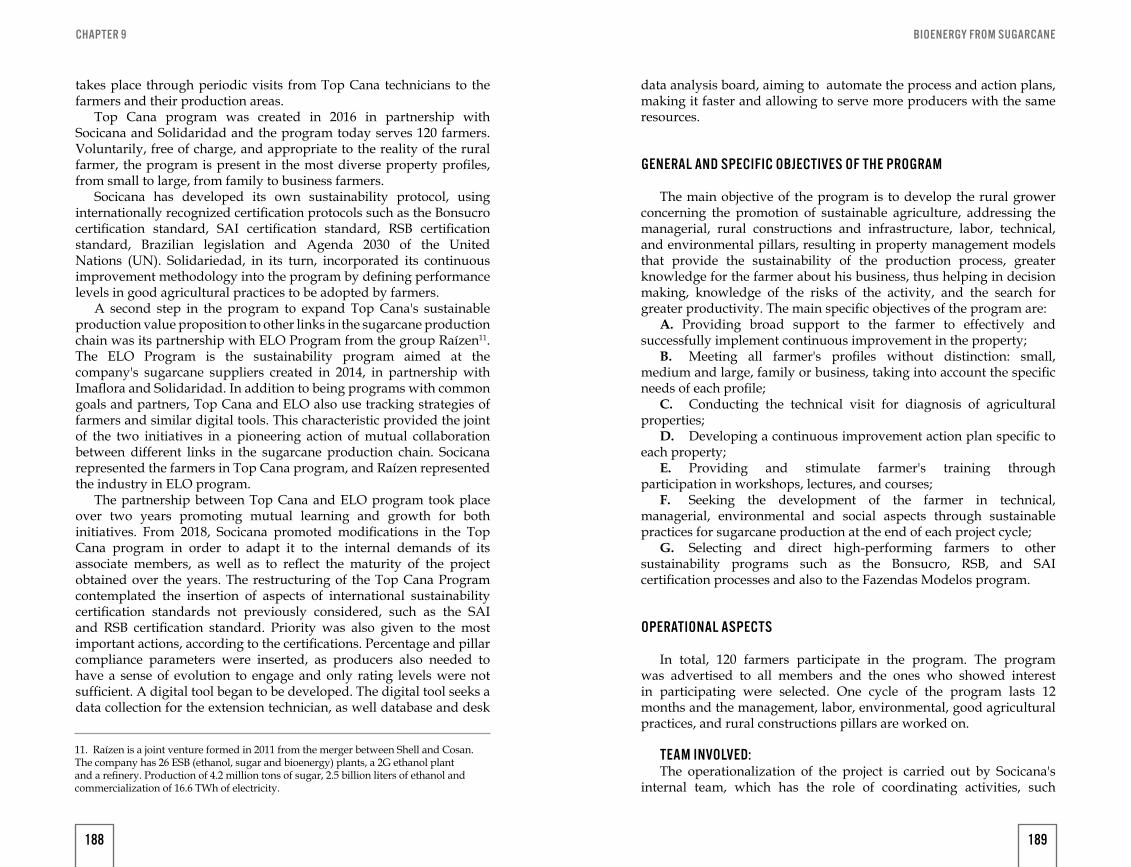
BIOENERGY FROM SUGARCANECHAPTER 9
takes place through periodic visits from Top Cana technicians to the farmers and their production areas.
Top Cana program was created in 2016 in partnership with Socicana and Solidaridad and the program today serves 120 farmers. Voluntarily, free of charge, and appropriate to the reality of the rural farmer, the program is present in the most diverse property profiles, from small to large, from family to business farmers.
Socicana has developed its own sustainability protocol, using internationally recognized certification protocols such as the Bonsucro certification standard, SAI certification standard, RSB certification standard, Brazilian legislation and Agenda 2030 of the United Nations (UN). Solidariedad, in its turn, incorporated its continuous improvement methodology into the program by defining performance levels in good agricultural practices to be adopted by farmers.
A second step in the program to expand Top Cana's sustainable production value proposition to other links in the sugarcane production chain was its partnership with ELO Program from the group Raízen11. The ELO Program is the sustainability program aimed at the company's sugarcane suppliers created in 2014, in partnership with Imaflora and Solidaridad. In addition to being programs with common goals and partners, Top Cana and ELO also use tracking strategies of farmers and similar digital tools. This characteristic provided the joint of the two initiatives in a pioneering action of mutual collaboration between different links in the sugarcane production chain. Socicana represented the farmers in Top Cana program, and Raízen represented the industry in ELO program.
The partnership between Top Cana and ELO program took place over two years promoting mutual learning and growth for both initiatives. From 2018, Socicana promoted modifications in the Top Cana program in order to adapt it to the internal demands of its associate members, as well as to reflect the maturity of the project obtained over the years. The restructuring of the Top Cana Program contemplated the insertion of aspects of international sustainability certification standards not previously considered, such as the SAI and RSB certification standard. Priority was also given to the most important actions, according to the certifications. Percentage and pillar compliance parameters were inserted, as producers also needed to have a sense of evolution to engage and only rating levels were not sufficient. A digital tool began to be developed. The digital tool seeks a data collection for the extension technician, as well database and desk
11. Raízen is a joint venture formed in 2011 from the merger between Shell and Cosan. The company has 26 ESB (ethanol, sugar and bioenergy) plants, a 2G ethanol plant and a refinery. Production of 4.2 million tons of sugar, 2.5 billion liters of ethanol and commercialization of 16.6 TWh of electricity.
data analysis board, aiming to automate the process and action plans, making it faster and allowing to serve more producers with the same resources.
GENERAL AND SPECIFIC OBJECTIVES OF THE PROGRAM
The main objective of the program is to develop the rural grower concerning the promotion of sustainable agriculture, addressing the managerial, rural constructions and infrastructure, labor, technical, and environmental pillars, resulting in property management models that provide the sustainability of the production process, greater knowledge for the farmer about his business, thus helping in decision making, knowledge of the risks of the activity, and the search for greater productivity. The main specific objectives of the program are:
A. Providing broad support to the farmer to effectively and successfully implement continuous improvement in the property;
B. Meeting all farmer's profiles without distinction: small, medium and large, family or business, taking into account the specific needs of each profile;
C. Conducting the technical visit for diagnosis of agricultural properties;
D. Developing a continuous improvement action plan specific to each property;
E. Providing and stimulate farmer's training through participation in workshops, lectures, and courses;
F. Seeking the development of the farmer in technical, managerial, environmental and social aspects through sustainable practices for sugarcane production at the end of each project cycle;
G. Selecting and direct high-performing farmers to other sustainability programs such as the Bonsucro, RSB, and SAI certification processes and also to the Fazendas Modelos program.
OPERATIONAL ASPECTS
In total, 120 farmers participate in the program. The program was advertised to all members and the ones who showed interest in participating were selected. One cycle of the program lasts 12 months and the management, labor, environmental, good agricultural practices, and rural constructions pillars are worked on.
TEAM INVOLVED:The operationalization of the project is carried out by Socicana's
internal team, which has the role of coordinating activities, such
188 189
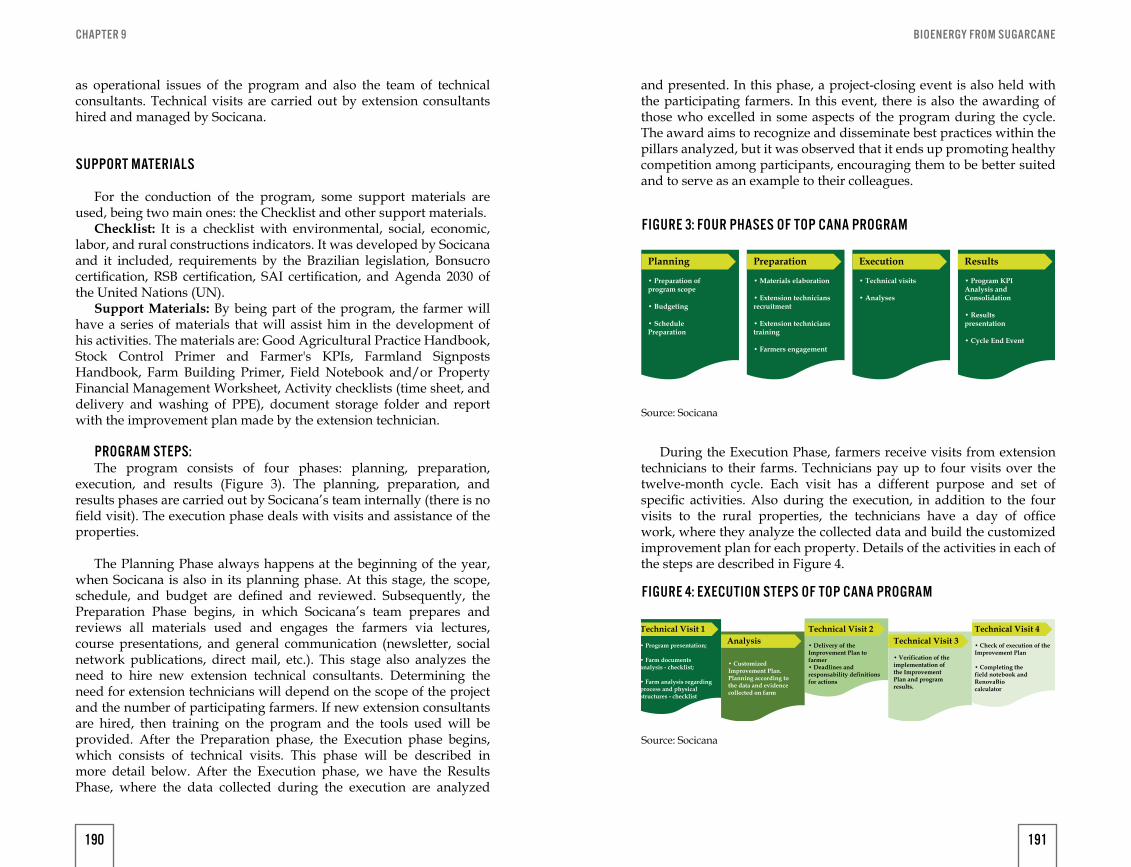
BIOENERGY FROM SUGARCANECHAPTER 9
as operational issues of the program and also the team of technical consultants. Technical visits are carried out by extension consultants hired and managed by Socicana.
SUPPORT MATERIALS
For the conduction of the program, some support materials are used, being two main ones: the Checklist and other support materials.
Checklist: It is a checklist with environmental, social, economic, labor, and rural constructions indicators. It was developed by Socicana and it included, requirements by the Brazilian legislation, Bonsucro certification, RSB certification, SAI certification, and Agenda 2030 of the United Nations (UN).
Support Materials: By being part of the program, the farmer will have a series of materials that will assist him in the development of his activities. The materials are: Good Agricultural Practice Handbook, Stock Control Primer and Farmer's KPIs, Farmland Signposts Handbook, Farm Building Primer, Field Notebook and/or Property Financial Management Worksheet, Activity checklists (time sheet, and delivery and washing of PPE), document storage folder and report with the improvement plan made by the extension technician.
PROGRAM STEPS:The program consists of four phases: planning, preparation,
execution, and results (Figure 3). The planning, preparation, and results phases are carried out by Socicana’s team internally (there is no field visit). The execution phase deals with visits and assistance of the properties.
The Planning Phase always happens at the beginning of the year, when Socicana is also in its planning phase. At this stage, the scope, schedule, and budget are defined and reviewed. Subsequently, the Preparation Phase begins, in which Socicana’s team prepares and reviews all materials used and engages the farmers via lectures, course presentations, and general communication (newsletter, social network publications, direct mail, etc.). This stage also analyzes the need to hire new extension technical consultants. Determining the need for extension technicians will depend on the scope of the project and the number of participating farmers. If new extension consultants are hired, then training on the program and the tools used will be provided. After the Preparation phase, the Execution phase begins, which consists of technical visits. This phase will be described in more detail below. After the Execution phase, we have the Results Phase, where the data collected during the execution are analyzed
and presented. In this phase, a project-closing event is also held with the participating farmers. In this event, there is also the awarding of those who excelled in some aspects of the program during the cycle. The award aims to recognize and disseminate best practices within the pillars analyzed, but it was observed that it ends up promoting healthy competition among participants, encouraging them to be better suited and to serve as an example to their colleagues.
During the Execution Phase, farmers receive visits from extension technicians to their farms. Technicians pay up to four visits over the twelve-month cycle. Each visit has a different purpose and set of specific activities. Also during the execution, in addition to the four visits to the rural properties, the technicians have a day of office work, where they analyze the collected data and build the customized improvement plan for each property. Details of the activities in each of the steps are described in Figure 4.
Planning
• Preparation ofprogram scope
• Budgeting
• SchedulePreparation
Preparation
• Materials elaboration
• Extension techniciansrecruitment
• Extension technicians training
• Farmers engagement
Execution
• Technical visits
• Analyses
Results
• Program KPIAnalysis and Consolidation
• Resultspresentation
• Cycle End Event
FIGURE 3: FOUR PHASES OF TOP CANA PROGRAM
FIGURE 4: EXECUTION STEPS OF TOP CANA PROGRAM
Source: Socicana
Source: Socicana
Technical Visit 1Analysis• Program presentation;
• Farm documents analysis - checklist;
• Farm analysis regarding process and physicalstructures - checklist
• CustomizedImprovement Plan.Planning according tothe data and evidencecollected on farm
• Delivery of theImprovement Plan tofarmer• Deadlines and responsability definitionsfor actions
• Verification of theimplementation ofthe ImprovementPlan and program results.
• Check of execution of theImprovement Plan
• Completing the field notebook andRenovaBiocalculator
Technical Visit 2 Technical Visit 4Technical Visit 3
190 191
BIOENERGY FROM SUGARCANECHAPTER 9
Throughout the program cycle, either during visits or later via telephone, farmers are assisted by extension technicians, who guide them, ask questions and also direct them to use Socicana’s portfolio of services, providing them with full support.
Socicana operates by managing the program, providing support to field technicians and supervising their work. Besides, Socicana makes available to participating farmers its entire portfolio of services, courses, and training, according to the demand diagnosed, ensuring project monitoring and success.
The program cycle lasts 12 months. After this period, the farmer is evaluated and his permanence in the program will depend on the result achieved. In case of good performance, the farmer may migrate to the certification programs or remain in Top Cana for another cycle to implement the necessary improvements in his property and the management of his business.
After the evaluation, they are classified into four levels according to the requirements: attention, bronze, silver, and gold (Table 2). The rankings take into account compliance with the requirements, which may be essential, basic, and advanced.
Besides the general suitability in levels, farmers can track their progress through the assessment and levels within each pillar as well as a final result of meeting the requirements. From this view, they can assess which pillar needs adjustments and also how much is left to level up. In Table 3, one can see an example of the result delivered to the farmer.
TABLE 2: TOP CANA'S FARMER RATING LEVELSREQUIREMENTS LEVEL ATTENTION BRONZE SILVER GOLD
Essential Requirements Less than 100% 100% 100% 100%
Basic Requirements 75% 80% 100%
Advanced Requirements 50% 75%
TABLE 3: EXAMPLE OF FARMERS’ CLASSIFICATIONPILLARS GENERAL SUITABILITY CLASSIFICATION
Overall Performance 74% Silver
Management 90% Gold
Labor 70% Silver
Environmental 95% Gold
Good Agricultural Practice 60% Bronze
Rural Constructions 45% Attention
Source: Socicana
Source: elaborated by the authors
Since 2015, Top Cana has traveled 37,467 km and performed 723 field visits. In order to get an upgrade, farmers relied on Socicana’s assistance through the services offered, which generated 810 agriculture technical services, 75 legal services, 115 services in the laboratory, 7 services of social assistance and health plans and 981 services of projects and sustainability. In 2020, its objective is to expand its actions by increasing the number of farmers served, restructuring its actions, forming new partnerships, and improving its services.
The analysis of the results was based on the checklist database applied to rural properties upon entering the Program (2013, 2015 and 2017) and on the last update of the checklist dated 2019, making it possible to check the evolution of the properties as a result of the Top Cana Program and the actions developed by Socicana. Thirty out of 120 properties visited in 2019 participating in the Top Cana Program were sampled. This sample was statistically representative with a confidence level of 95% and a margin of error of 5%, but here in this paper, we don't intend to make statistical analysis. The analysis of the results followed the logical structure of the checklist: General Data, Management Pillar, Labor Pillar, Environmental Pillar, Good Agricultural Practices Pillar, Rural Constructions Pillar, and Overall Performance. We will present just the general analysis. It is possible to find the detailed analysis by the pillar in the Teaching Notes.
GENERAL DATASugarcane is the main source of income in 78.13% of farms, and
family-based agriculture is present in 27.7% of the sampled properties. Female presence in the sugarcane activity was not very expressive, being about 16% of the properties headed by women, in 28% of them there is female participation in house chores, 13% have participation in administrative and office activities. Men predominantly occupy the agricultural area.
The average productivity of the properties is 88 tons of sugarcane per hectare against the national average of 73.49 tons per hectare (Conab 2018/2019). Crop diversification is present in about 68.75% of the properties and this value has remained unchanged since the beginning of the Program, as it can be seen in Figure 5.
192 193
BIOENERGY FROM SUGARCANECHAPTER 9
Crop Diversification
Before:Soy 55%Peanut 41%Fruits 9%Horti 5%Cattle 9%Chicken 9%Pork 5%Humus 5%
After:Soy 55%Peanut 41%Fruits 9%Horti 5%Cattle 9%Chicken 9%
31% 69%
No Yes
FIGURE 5: CROP DIVERSIFICATION IN TOP CANA PROGRAM
FIGURE 6: AVERAGE PERFORMANCE OF PROPERTIES IN RELATION TO NECESSARY ADJUSTMENTS
Source: Authors
Crop diversification is a favorable practice for farmers to remain in the sugarcane industry, especially in small and medium properties because it is possible to diversify income, make extra revenue from crop rotation and lower costs.
OVERALL PERFORMANCEFigure 6 shows that on the average the farms present performance
improvement in relation to the fulfilment of the requisites. The farms went from an overall performance average of 74% at the beginning of the program to 88% in 2019. Regarding the pillars, on average, growers also showed improvements in each of them.
Fulfilled average
After
Overall Performance
Rural Constructions
Good Agricultural Practice
Environmental
Labor
Management
Before
10%0% 30%20% 40% 50% 60% 70% 80% 90% 100%
84%93%
70%83%
72%90%
74%90%
69%83%
74%88%
Source: Authors
FIGURE 7: EVOLUTION IN FARM RATING
Source: Authors
Regarding the overall rating, most growers showed improvement in levels (Figure 7). No growers have downgraded during the program. Only five growers, out of the thirty analyzed, remained at the same level of classification, which does not mean that they did not evolve, because all of them had evolved, but probably the evolution was not enough to change levels. On the other hand, growers upgraded more than one level and one grower upgraded two levels in evolution, moving out of the attention rating to the gold rating.
In the Overall Performance, all properties showed improvements due to the adjustments made on the farms, as indicated in the Improvement Plans. Table 4 shows that at the beginning of Top Cana Program more than half of the farms were in the Attention and Bronze levels, except for the Management Pillar. During the Program, there was significant migration to the Silver and Gold levels, currently consisting of 13 and 11 farms respectively.
Remained at level
Attention
Bronze
SilverGold
11
13
4
2
Leved up Leved down
194 195
BIOENERGY FROM SUGARCANECHAPTER 9
TABLE 4: NUMBER OF FARMS BEFORE AND AFTER TOP CANE PROGRAMNUMBER OF
FARMSATTENTION BRONZE SILVER GOLD
PILLARS BEFORE AFTER BEFORE AFTER BEFORE AFTER BEFORE AFTER
Management 5 2 4 2 14 10 7 16
Labor 12 3 9 12 7 9 2 6
Environmental 13 2 8 4 8 15 1 9
Good Agricultural Practice
12 0 9 3 6 16 3 11
Rural Constructions 15 5 3 5 9 6 3 14
Overall Performance 10 2 12 4 8 13 0 11
Source: elaborated by the authors
The evolution of the program participants was clear and evident, showing that the program, in fact, brought improvements to the development of the growers’ activity and especially in relation to the development of sustainable agriculture.
PROGRAM BENEFITS
Top Cana brings a number of benefits to those involved. Some them are:
FARMER BENEFITS ■ Business development and improvement; ■ Agricultural Property Management; ■ Sustainable Production; ■ Compliance with legal and certification requirements; ■ Risk reduction;
SOCIAL BENEFITS ■ Agricultural production respecting the environment and people; ■ Preservation and less use of natural resources ■ Local economy development;
SOCICANA BENEFITS ■ More consolidated and developed farmers; ■ Strengthening of Associativism (dissemination of knowledge); ■ Notion of value to the associate; ■ Increase the provision of services and activities in the associated;
■ Successful model of farmer’s property management.
MILLS BENEFITS ■ Suppliers committed to sustainable production; ■ Demonstration of compliance with environmental and social
goals throughout the raw material production chain; ■ Risk reduction by suppliers; ■ Market accessibility of the plant.
CONCLUSION
Sustainability is a reality in agricultural production and should be increasingly demanded by society. Anticipating the demand and taking actions that further promote sustainability in agribusiness bring competitive advantages to those who practice them. Farmers individually could hardly develop some level of sustainability, often by lack of knowledge, access to information and technical assistance, especially small farmers. In this way, associations, as a form of collective action, can help their associates to promote sustainable development, especially by taking the approach of continuous improvement, encouraging them, at their time and available financial resources. The continuous improvement process developed by Socicana prepares farmers for international certifications as long as they consider in their standards, the main topics of major certifications.
While the program contributes to the growers through technical assistance, guidance and capacity building for sustainable agriculture, it also benefits Socicana as it generates service for the other departments of the association and heightens the feeling of value from the growers. For Solidaridad, the benefit is to support a successful project, thus fulfilling the organization's mission and vision. The partnership established by different agents to solve the common challenges of developing a production chain proved to be a success in this case.
The great challenges of the programs are still in convincing new producers to join the program and prove the benefits to those who participate. There is still a challenge for Socicana to maintain the program over the long term, as the program requires considerable financial resources.
ACKNOWLEDGEMENTS
The authors would like to thank Socicana for allowing this experience to be disseminated and to help finding a way to promote sustainability in agribusiness. We also would like to thank Solidaridad
196 197
BIOENERGY FROM SUGARCANECHAPTER 9
for all the support and help in the conception and for implementing the early stages of the program. The authors would also like to thank the farmers who participate in the Top Cana program for engaging in the activities and seeking continuous improvement of their business.
BY MARCOS FAVA NEVES
CLEAN ENERGY POLICIES FOR CHINA: THE CASE OF ETHANOL
10
Originally published in China Agricultural Economic Review 2010; 2 (4): 472-483.
198 199
BIOENERGY FROM SUGARCANE
INTRODUCTION
Sustainability has gotten a huge increase in awareness over the world. The facts for this arousal could be justified by the rise in expectations of consumers (society is more aware of problems), the emergence of new generations worried with planet conditions, the scarcity of natural resources on the planet for its growing population and living.
JEL classification – M16, Q18, Q20, Q42, Q56The author would like to thank Marco Antonio Conejero and Mairun
Junqueira Alves Pinto for their contributions.Standards, global warming risks, bringing about floods and
hunger due to changes in agricultural areas, and finally, the impact of communications via internet, which allows immediate knowledge of disasters, bad behavior of companies, excess pollution and others have beeb, mobilizing groups and causing reactions as never seen before.
At a company level there is a growing concern that they have to reduce impacts of their activities on the environment, to increase transparency and a better flow of information, promote corporate social responsibility, more inclusion and less social imbalance and finally, to increase the company’s usage of natural and renewable resources/energy.
Sustainability has three traditional major pillars. The economic dimension (profit), the environmental dimension (planet) and the social dimension (people). On the economic (profit) side, the major factors to be considered are how companies, networks and productive chains are dealing with margins, profit, compensation, losses in the chain, communication issues for final consumers, improving credit conditions with benefits to sustainable projects, risk management (knowledge of financial markets and instruments), information technology (information access; reduction of transaction costs) and overall strategies to reduce costs and achieve economic sustainability of the business. Without economic sustainability, any other request is impossible, since companies cannot afford to pay for it, if they do not have margins. This is a first and important step. A company must be economically sustainable. Sometimes, this is forgotten by some agents, NGOs and other organizations.
On the social (people) side, the major factors to be considered are the working conditions for its employees, conditions that are also applied to the company’s suppliers and distributors, their health and safety, types of labor, working atmosphere climate, safety equipments, to promoting actions for the local community, motivating cooperation, having friendly initiatives towards small holders, trying to do technology transfer for small holders to improve local companies capacity and promoting benefits for consumers.
On the environment side (planet), the major factors to be considered
201
BIOENERGY FROM SUGARCANECHAPTER 10
are the impact of the company on the environment, impact of the company’s integrated suppliers, impact of transports (food miles), packaging (trying always to recycle/reuse/rebuilt – using new materials and less materials), waste management (generating less waste; separating and recycling, generating energy/fertilizers from waste), use of energy, emissions, water management (company's view of usage, protecting water, management, and spreading best practices), more digital and less paper, reuse of materials, green and environmentally oriented buildings and facilities, carbon emissions/neutralization (carbon footprint), among others. Consumers also have an incredible task here, by changing habits and having a more responsible consumption behavior.
OBJECTIVES AND METHODOLOGY OF THE STUDY
After this short introduction on sustainability, this research uses the traditional case study methodology, to focus the analysis on the sugarcane industry in Brazil. This case study, together with previous projects and experiences of the researcher on this particular industry, is used to reach the objective of addressing the importance of ethanol as an energy alternative for China. It will discuss the three major pillars of sustainability using as an example to China, a case of success to: ethanol policy in Brazil. First, it will discuss the need of more energy production and the macro-environmental drivers towards renewable sources of fuel and energy, as ethanol. Then, the dimensions of sustainability, using the case of ethanol, will be addressed.
MACRO-ENVIRONMENTAL DRIVERS FOR THE ADOPTION OF RENEWABLE SOURCES OF ENERGY AND ETHANOL
The use of biofuels, where ethanol is included is stimulated not only by environmental issues, but economic issues. Only 1.5% of the fuels consumed today come from biofuels, and the other 99% from fossil sources. Out of this 1.5%, ethanol represents 90%.
Between 1998 and 2007, the price of the oil barrel increased more than 500% (New York Mercantile Exchange, 2007). On February 19, 2008, the barrel reached US$100.00 for the first time in history, and then moved to US$140. Nowadays the price of oil barrel stands between US$70.00 and US$80.00. Pressure on prices comes mainly from the perspective of consumption and reserves depletion. Although being very controversial, some studies indicate that the reserves should dry out in around 40 years British Petroleum (BP, 2006).
Despite the discovery of new reserves, they may be unable to meet the long-term growth in the energy demand. According to International
Energy Agency (IEA, 2006), based on the current trends of global energy, the demand will rise up to 53% by 2030. Over 70% of this increase comes from developing countries, led by China and India. Imports of oil and gas in the organization for economic cooperation and development (OECD) and developing Asia grow even faster than demand. World oil demand will reach 116 million of barrels a day (b/d) in 2030, up from 84 millionb/d in 2005. China in 2000 had a consumption of 4.5 million b/day, and in 2010 this was 8.5 million b/day. But when we look at per capita consumption, the USA has a consumption of 22 barrels/person/day, and China still has 2.4 barrels/person/day. What will happen to Chinese growth?
Another risk factor, in addition to the unsteady prices and to the possibility of scarcity, is the fact that the largest oil reserves are found in unstable regions. The main suppliers of oil remain in the Middle East, with 62% of the world’s reserves, followed by the countries in Europe and in other regions of the Asian continent (BP, 2006).
From this perspective, will biofuels be viable? According to UNICA (2007) projections, with oil prices above US$80.00 per barrel, biodiesel from the sources used today becomes viable. For ethanol, the scenario is even better: oil prices being just over US$40.00 a barrel make Brazilian ethanol derived from sugarcane already viable in economic terms.
In a more open and traded economy, the transportation sector is expected to increase its share on oil products from 56 to 62%. Therefore, fossil fuels should keep at the core of energy source for transportation, despite the advances in renewable and less carbon-intense fuels (LPG, ethanol, biodiesel and hydrogen). Changing this scenario will demand investments in research and development (R&D) as well as in the image of biofuels as a clean, safe and low-cost energy source (WBCSD, 2004).
In North America gasoline represents more than 50% of the total energy demand for transportation while diesel represents something around 20%. West Europe shows a different consumption pattern as both diesel and gasoline respond to some 37.5% of the sector demand each. In Asia, gasoline is more used (45%). Improvements in per capita income usually mean enlargement in the vehicle fleet.
The world’s largest fleet is in the USA. There are around 250 million vehicles running on American roads. However, it is in developing countries that the situation requires more attention. Goldman Sachs forecast indicates that by 2040 China and India will have, respectively, 29 and 21 cars for every 100 inhabitants, totalling more than 700 million cars. What about these impacts?
The automobile sector is one that has a remarkable investment in R&D to use alternative sources of energy in engines. Two cases serve as reminders: the hybrid car (a car that combines a gasoline engine with an electric battery) and the flex-fuel car (an engine that can be fueled with gasoline, ethanol or a blend of both). The production of E85 (85% ethanol
202 203
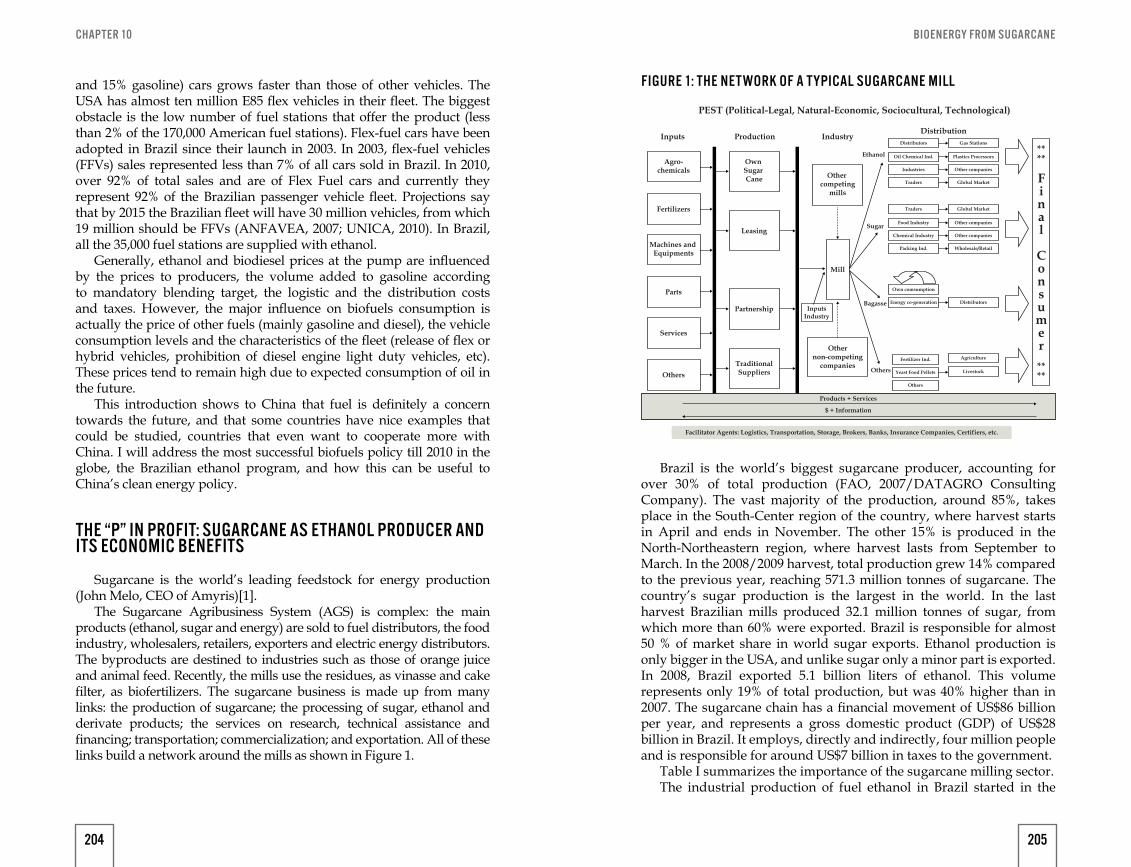
BIOENERGY FROM SUGARCANECHAPTER 10
and 15% gasoline) cars grows faster than those of other vehicles. The USA has almost ten million E85 flex vehicles in their fleet. The biggest obstacle is the low number of fuel stations that offer the product (less than 2% of the 170,000 American fuel stations). Flex-fuel cars have been adopted in Brazil since their launch in 2003. In 2003, flex-fuel vehicles (FFVs) sales represented less than 7% of all cars sold in Brazil. In 2010, over 92% of total sales and are of Flex Fuel cars and currently they represent 92% of the Brazilian passenger vehicle fleet. Projections say that by 2015 the Brazilian fleet will have 30 million vehicles, from which 19 million should be FFVs (ANFAVEA, 2007; UNICA, 2010). In Brazil, all the 35,000 fuel stations are supplied with ethanol.
Generally, ethanol and biodiesel prices at the pump are influenced by the prices to producers, the volume added to gasoline according to mandatory blending target, the logistic and the distribution costs and taxes. However, the major influence on biofuels consumption is actually the price of other fuels (mainly gasoline and diesel), the vehicle consumption levels and the characteristics of the fleet (release of flex or hybrid vehicles, prohibition of diesel engine light duty vehicles, etc). These prices tend to remain high due to expected consumption of oil in the future.
This introduction shows to China that fuel is definitely a concern towards the future, and that some countries have nice examples that could be studied, countries that even want to cooperate more with China. I will address the most successful biofuels policy till 2010 in the globe, the Brazilian ethanol program, and how this can be useful to China’s clean energy policy.
THE “P” IN PROFIT: SUGARCANE AS ETHANOL PRODUCER AND ITS ECONOMIC BENEFITS
Sugarcane is the world’s leading feedstock for energy production (John Melo, CEO of Amyris)[1].
The Sugarcane Agribusiness System (AGS) is complex: the main products (ethanol, sugar and energy) are sold to fuel distributors, the food industry, wholesalers, retailers, exporters and electric energy distributors. The byproducts are destined to industries such as those of orange juice and animal feed. Recently, the mills use the residues, as vinasse and cake filter, as biofertilizers. The sugarcane business is made up from many links: the production of sugarcane; the processing of sugar, ethanol and derivate products; the services on research, technical assistance and financing; transportation; commercialization; and exportation. All of these links build a network around the mills as shown in Figure 1.
Brazil is the world’s biggest sugarcane producer, accounting for over 30% of total production (FAO, 2007/DATAGRO Consulting Company). The vast majority of the production, around 85%, takes place in the South-Center region of the country, where harvest starts in April and ends in November. The other 15% is produced in the North-Northeastern region, where harvest lasts from September to March. In the 2008/2009 harvest, total production grew 14% compared to the previous year, reaching 571.3 million tonnes of sugarcane. The country’s sugar production is the largest in the world. In the last harvest Brazilian mills produced 32.1 million tonnes of sugar, from which more than 60% were exported. Brazil is responsible for almost 50 % of market share in world sugar exports. Ethanol production is only bigger in the USA, and unlike sugar only a minor part is exported. In 2008, Brazil exported 5.1 billion liters of ethanol. This volume represents only 19% of total production, but was 40% higher than in 2007. The sugarcane chain has a financial movement of US$86 billion per year, and represents a gross domestic product (GDP) of US$28 billion in Brazil. It employs, directly and indirectly, four million people and is responsible for around US$7 billion in taxes to the government.
Table I summarizes the importance of the sugarcane milling sector.The industrial production of fuel ethanol in Brazil started in the
Inputs Production Industry
$ + Information
Products + Services
TraditionalSuppliers
Partnership
Leasing
Own Sugar Cane Other
competingmills
Mill
Othernon-competing
companies
InputsIndustry
Others
Bagasse
Sugar
Ethanol
Distributors
Oil Chemical Ind. Plastics Processors
Industries
Traders
Gas Stations
Other companies
Global Market
Traders
Food Industry
Chemical Industry
Packing Ind.
Global Market
Other companies
Other companies
Wholesale/Retail
Own comsumption
Energy co-generation
Fertilizer Ind.
Yeast Food Pellets
Others
Livestock
Agriculture
Distributors
Final
Consumer
****
****
Distribution
PEST (Political-Legal, Natural-Economic, Sociocultural, Technological)
Facilitator Agents: Logistics, Transportation, Storage, Brokers, Banks, Insurance Companies, Certifiers, etc.
Agro-chemicals
Fertilizers
Machines and Equipments
Parts
Services
Others
FIGURE 1: THE NET WORK OF A TYPICAL SUGARCANE MILL
204 205
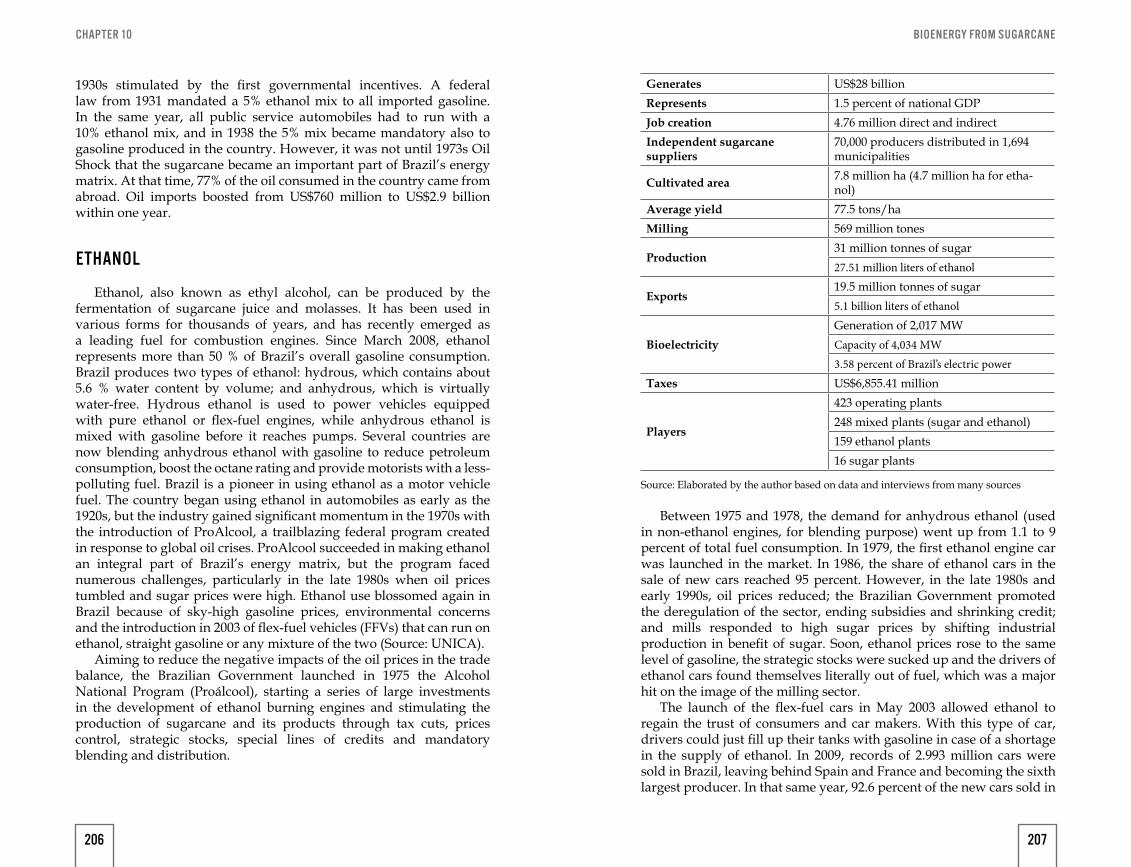
BIOENERGY FROM SUGARCANECHAPTER 10
1930s stimulated by the first governmental incentives. A federal law from 1931 mandated a 5% ethanol mix to all imported gasoline. In the same year, all public service automobiles had to run with a 10% ethanol mix, and in 1938 the 5% mix became mandatory also to gasoline produced in the country. However, it was not until 1973s Oil Shock that the sugarcane became an important part of Brazil’s energy matrix. At that time, 77% of the oil consumed in the country came from abroad. Oil imports boosted from US$760 million to US$2.9 billion within one year.
ETHANOL
Ethanol, also known as ethyl alcohol, can be produced by the fermentation of sugarcane juice and molasses. It has been used in various forms for thousands of years, and has recently emerged as a leading fuel for combustion engines. Since March 2008, ethanol represents more than 50 % of Brazil’s overall gasoline consumption. Brazil produces two types of ethanol: hydrous, which contains about 5.6 % water content by volume; and anhydrous, which is virtually water-free. Hydrous ethanol is used to power vehicles equipped with pure ethanol or flex-fuel engines, while anhydrous ethanol is mixed with gasoline before it reaches pumps. Several countries are now blending anhydrous ethanol with gasoline to reduce petroleum consumption, boost the octane rating and provide motorists with a less-polluting fuel. Brazil is a pioneer in using ethanol as a motor vehicle fuel. The country began using ethanol in automobiles as early as the 1920s, but the industry gained significant momentum in the 1970s with the introduction of ProAlcool, a trailblazing federal program created in response to global oil crises. ProAlcool succeeded in making ethanol an integral part of Brazil’s energy matrix, but the program faced numerous challenges, particularly in the late 1980s when oil prices tumbled and sugar prices were high. Ethanol use blossomed again in Brazil because of sky-high gasoline prices, environmental concerns and the introduction in 2003 of flex-fuel vehicles (FFVs) that can run on ethanol, straight gasoline or any mixture of the two (Source: UNICA).
Aiming to reduce the negative impacts of the oil prices in the trade balance, the Brazilian Government launched in 1975 the Alcohol National Program (Proálcool), starting a series of large investments in the development of ethanol burning engines and stimulating the production of sugarcane and its products through tax cuts, prices control, strategic stocks, special lines of credits and mandatory blending and distribution.
Between 1975 and 1978, the demand for anhydrous ethanol (used in non-ethanol engines, for blending purpose) went up from 1.1 to 9 percent of total fuel consumption. In 1979, the first ethanol engine car was launched in the market. In 1986, the share of ethanol cars in the sale of new cars reached 95 percent. However, in the late 1980s and early 1990s, oil prices reduced; the Brazilian Government promoted the deregulation of the sector, ending subsidies and shrinking credit; and mills responded to high sugar prices by shifting industrial production in benefit of sugar. Soon, ethanol prices rose to the same level of gasoline, the strategic stocks were sucked up and the drivers of ethanol cars found themselves literally out of fuel, which was a major hit on the image of the milling sector.
The launch of the flex-fuel cars in May 2003 allowed ethanol to regain the trust of consumers and car makers. With this type of car, drivers could just fill up their tanks with gasoline in case of a shortage in the supply of ethanol. In 2009, records of 2.993 million cars were sold in Brazil, leaving behind Spain and France and becoming the sixth largest producer. In that same year, 92.6 percent of the new cars sold in
Generates US$28 billionRepresents 1.5 percent of national GDPJob creation 4.76 million direct and indirectIndependent sugarcane suppliers
70,000 producers distributed in 1,694 municipalities
Cultivated area 7.8 million ha (4.7 million ha for etha-nol)
Average yield 77.5 tons/haMilling 569 million tones
Production31 million tonnes of sugar27.51 million liters of ethanol
Exports19.5 million tonnes of sugar5.1 billion liters of ethanol
BioelectricityGeneration of 2,017 MWCapacity of 4,034 MW3.58 percent of Brazil’s electric power
Taxes US$6,855.41 million
Players
423 operating plants248 mixed plants (sugar and ethanol)159 ethanol plants16 sugar plants
Source: Elaborated by the author based on data and interviews from many sources
206 207
BIOENERGY FROM SUGARCANECHAPTER 10
the country were flex-fuel (ANFAVEA, 2007).Internal ethanol demand was stagnated between 11.5 and 13.0
billion liters from 1986 until 2007. In 2009, flex-fuel demand reached 22.8 billion liters, being 16.4 billion for flex-fuel cars and 6.3 billion to attend to the mandatory blending that varies from 20 to 25 percent. In February 2008, ethanol consumption overcame gasoline for the first time since the peak of Proa´lcool in the second half of the 1980s. With the gradual substitution of gasoline cars to flex-fuel cars, ethanol consumption tend to keep on increasing as long as prices are favorable. Estimates indicate that in 2015, 80 percent of the fuel consumed in the country for cars will be ethanol.
In order to meet the growing demand, production has more than doubled sized in just some years, going from 11 billion liters in 2001/2002 to 26 billion liters in 2009/2010.
There is also the possibility of using hydrolysis process to obtain ethanol. Hydrolysis allows the ethanol to be produced from any possible source of cellulose. In the case of corn and sugarcane, the hydrolysis process will be done by using residues such as leaves, straw, and bagasse (from sugarcane). This technology would increase ethanol production worldwide using the same agricultural lands. In 2005, the production of conventional ethanol in Brazil was 85 l/t of sugarcane or 6,000 l/ha. In 2015, the conventional production will reach 100 l/t or 8,200 l/ha, and the production by hydrolysis 14 l/t or 1,100 l/ha. In 2025, conventional processes are expected to produce 109 l/t or 10,400 l/ha, and hydrolysis some more 3,500 l/ha (Leal, 2006).
According to the National Renewable Energy Laboratory (2006), cellulosic ethanol will be the solution to increase yield and enable the production to meet the global demand for fuel. Some countries like Brazil have already begun using residues from the fields as a source of energy (bagasse and leaves) and biofertilizers (vinasse). This results in the increase of yield and in the reduction of production costs even though collecting these residues implies some costs.
In 2010, several new technologies are coming to market. There is one involving engineered yeasts developed by a company named Amyris that will produce diesel directly from sugarcane, and can also produce airplane fuel and other fuels. Commercial production of plastics from ethanol is also on the move and recently Coca-Cola announced its new bottle from cane plastic. This part showed the “profit” part of ethanol business, which is a good starting point to attract Chinese interest.
THE “P” IN PEOPLE: SOCIAL BENEFITS ON ETHANOL BUSINESS
Some researchers suggest that biofuels could be a big part of
the solution for poor countries to diversify business and ensure sustainable growth. According to Zarrilli (2007), several countries that implemented biofuels development programs have shown noticeable growth in job creation, most of them created in the rural areas but also in other links throughout the productive chain. According to Poschen (2007), the senior International Labour Organization’s specialist on sustainable development, the amount of jobs created in the renewable energy sector will double until 2020, generating approximately 300,000 new jobs. In the early phase of the bio-ethanol program in the USA, around 147,000 jobs were created in different sectors of the economy.
The sugar industry in Brazil is very developed in terms of corporate social responsibility. Among the major groups that make part of the UNICA Industry Association, these practices are linked to the sustainable development of people. UNICA and its member companies continually develop programs aimed at improving labor conditions and establishing national benchmarks. According to National ANNUAL Social Information Report (2008, apud Moraes, 2007) this industry is one of Brazil’s most relevant in terms of job creation – around 1.3 million jobs. A research conducted by UNICA showed that the average wage paid by member companies was twice as much of the current federal minimum wage.
Brazilian laws comply with International Labor Organization Standards, covering work conditions and receive frequent government inspections. Cane cutters have collective labor agreements and innovative programs to improve labor conditions are being put in place, including the elimination of outsourcing for manual sugarcane cutters, better transportation standards, and increased transparency in performance measurements and employee compensations. UNICA also has a socio-environmental duty encouraging best environmental and responsibility indicators that track corporate responsibility performance in the industry, with the aim of encouraging best environmental and sustainable practices.
Other projects include the Social Balance Program developed with the Brazilian Institute for Social and Economic Analysis (iBase) and data gathering for UNICA’s global reporting initiatives on sustainability (GRI) (Source: Unica Report). In 2008, member companies invested over R$160 million in 618 projects within social, environmental, cultural, educational, sports and health areas, benefiting approximately some 480,000 people.
Biofuels can be an important component of the “people” dimension of sustainability, creating jobs, promoting development, interiorizing the economic activities of a country, since it moves money from cities to farm areas and with this, contributing to the distribution of income.
208 209
BIOENERGY FROM SUGARCANECHAPTER 10
THE “P” IN PLANET: ENVIRONMENTAL BENEFITS OF ETHANOL BUSINESS
One of the most important reasons for biofuels consumption is its environmental importance, especially considering the urgent necessity of reducing greenhouse gas (GHG) emissions (mitigation) as a way to avoid bigger climate changes and their potentially catastrophic consequences. The transportation sector is one of the greatest responsible for GHG emissions related to the energetic activity. By joining current and projected CO2 emissions from transportation, it is possible to identify that road transportation leads the emission ranking both in the present and in the future (currently 3/4) (IEA, 2005; WBCSD, 2004). In this case, adding biofuels to fossil fuels has a tremendous important role in diminishing the negative impacts of the transportation sector on the environment.
The environmental benefit of cane ethanol, when used as a fuel in car tanks is clear. A research from EMBRAPA (Brazilian Agriculture Research Agency) compared the emissions of three similar vehicles, produced in Brazil by the same company, and equipped with diesel and flex-fuel engine.
Clean energy policies for China emits 3.65 kg CO2/l of fuel, the flex engine with ethanol emits 0.68 kg CO2/l of fuel and the diesel, 4 kg. Note the supremacy of ethanol in terms of emissions.
A study of the Worldwatch Institute (2006) shows that energy balance (renewable energy in the biofuels produced by unit of fossil energy used) is positive for the biofuels: corn in the USA (1:1.4), sugarcane in Brazil (1:8.3), and wheat and beet in Europe (1:2).Ethanol will reach 10:1 by 2020 with the hydrolysis process of the bagasse and the leaves and with the trade of electricity. As far as carbon balance goes (avoided emissions and produced emissions), in a scenario for 2020 the use of E100 FFVs would reduce 2.259 t CO2e/m3 and the use of E25 gasoline vehicles would reduce 2.585 t CO2e/m3.
HERE IS THE OPPORTUNITY FOR CHINA
A report of the (IEA, 2004) shows that biofuels can contribute to significantly reducing the amount of CO2 emissions. Ethanol from sugarcane (Brazil) contributes with about 85 percent of the reduction, ethanol from grains (USA and European Union (EU)) contributes with 30 percent and ethanol from beet (EU) contributes with 45 percent. At the same time, in terms of cost of CO2 reduction (US$/tonne CO2) ethanol from sugarcane (Brazil) is the cheapest option among all the biofuels (less than US$40.00). After, there is the American ethanol made out of corn (over US$45.00), ethanol from grains in the EU (more
than US$600.00) and ethanol from sugar beet in the EU (US$300.00).Hence, among the technological possibilities for China to reduce
energy consumption and as a consequence in GHG emissions, it is suggested: reducing the weight of vehicles (lighter materials, improved aerodynamics), improving engine efficiency (direct injection, hybrid vehicles), and a higher use of alternative fuels (biofuels, natural gas, hydrogen/fuel cell and batteries). Adoption of biofuels is the best option to make sure the transportation sector plays its role in reducing GHG emissions.
Lately, the international market for biofuels has been opened especially to anhydrous ethanol due to governmental policies towards adding the biofuels to gasoline. Some countries have already approved mandatory blending targets, while some others have just authorized blending.
Among the big producers and consumers of biofuels, their strategic objectives are very clear. The USA’s recent approval of the New Energy Bill, which demands a consumption of 36 billion gallons (or 136.8 billion liters) by 2022 in order to replace 15 percent of the domestic gasoline demand, makes their concern about the energy security evident in times of unstable oil prices. The EU’s intention on adding 10 percent of biofuels to the road transportation sector by 2020 should avoid 35 percent GHG emissions for each unity of biofuels in comparison to gasoline and diesel, and makes their concern about the climate changes clear. So there is a clear movement in the world, towards sustainable biofuels. Where does China position itself?
CONCLUDING REMARKS: HOW DOES ETHANOL FIT TO CHINESE GOVERNMENT FIVE-YEAR PLANS AND HOW WILL IT BENEFIT CHINESE PEOPLE?
This paper has the objective to show how Brazil has been successful in adopting an ethanol policy for the last 40 years. In 2009, from the fuel consumed in the country, ethanol already accounted for 52 percent, against 48 percent of gasoline. In 2015, it is expected that this ratio will be 80/20.
China has several possibilities with ethanol, and a larger proximity with the example of Brazil is a strategy. China has low-carbon commitments, and ethanol is a source. Here are some possible contributions to the debate.
In the five-year plan: a suggestion for China to start building up supply chains for a strategy of adopting a E10 policy (10 percent of anhydrous ethanol blended to gasoline), with a perspective of moving to E25 policy, as the one seen in Brazil. This will contribute to reduce transport pollution in major cities. Depending on the size of the cities,
210 211
BIOENERGY FROM SUGARCANECHAPTER 10
even the blending on gasoline can be different, like E25 for large cities, and E15 for smaller cities and country side.
In order to have ethanol, China may invest more in the country to produce it from cane in some regions, and mostly on second generation from cellulosic sources building up sustainable facilities, using technology from Brazil that has a 40 year experience in this business. An integrated model with a network of small farmers may be a solution here.
China can also, instead of importing oil, substitute part of its imports and consumption towards importing ethanol from Brazil and from African countries, bringing a clean fuel to the country to be blended with gasoline. This strategy will reduce dependency from oil producing countries, and enhance the relationship with other countries.
Another important possibility for China is, together with Brazilian technology and investments, invest in producing ethanol in some African countries and supply to Chinese and other markets, and even to invest in ethanol production and logistics in Brazil and then provide direct imports to China. These are some of the preliminary benefits for China’s ethanol adoption.
SOME POSSIBLE BENEFITS FOR CHINESE PEOPLE IN ADOPTION OF ETHANOL
For the Chinese people and society, ethanol may represent several benefits, as the ones seen in Brazil, USA, Colombia, Angola, Thailand, Mocambique and other countries. A first benefit for these societies, is that ethanol reduces dependencies on oil and consequently, on some unstable environments that are the major oil selling countries nowadays. A second benefit, is the amount of jobs generated in research, production, trade and services, in all parts of the ethanol chain, from equipment suppliers, towards ethanol distribution.
Another benefit for Chinese society is to, via an ethanol strategy, increase relationship and trade with important emerging partners as Brazil and other African nations, which will be future suppliers of food also to China. This is a strategic movement of building up a position with these important food, fuel, feed and fiber suppliers for the future growing population and demand.
One of the most important benefits for Chinese population is the immediate reduction in pollution at the major cities. As compared to gasoline and diesel, ethanol’s emissions are increasingly smaller, and improving the quality of the air would benefit younger generations and also general quality of life.
From a business perspective, ethanol can generate possibilities of international investments for Chinese people and companies, making
profits outside China and repatriating these resources to help the development and income distribution in China. These investments will also allow China to understand and have access to world class technology that is dominated nowadays by ethanol producing countries, mainly Brazil. Finally, China can give a strong contribution towards mitigation of climate change over the world.
There are several strategies than can make part of China’s positioning on ethanol. This fuel has proven to be the most efficient in competing with gasoline in the last 40 years, and China must have a strategic plan on ethanol. China has a large avenue
Clean energy policies for China of opportunities to follow. Larger collaboration with Brazil in this field is a future development agenda for government, institutions and private sector. The University of Sao Paulo is open for this collaboration and to help China in this strategic plan.
212 213
BY MARCOS FAVA NEVES AND FABIO RIBAS CHADDAD
THE BENEFITS OF SUGARCANE CHAIN DEVELOPMENT IN AFRICA
11
Originally published in International Food and Agribusiness Management Review 2012; 15 (1): 157-164.
BIOENERGY FROM SUGARCANE
INTRODUCTION
Sustainability has received a great deal of attention across the world in recent years and has become a central part of the agribusiness agenda. This increased awareness can be attributed to the rise in consumer expectations about the way food is produced and where it comes from; the emergence of a new generation more worried about planet conditions; the scarcity and, in some cases, depletion of natural resources as farmers increase production to feed a growing population; and the effects of climate change. Perhaps more importantly, the advent of the Internet and the viral growth of social networking enable real time dissemination of information about natural disasters, unethical behavior of companies, among others, mobilizing groups and broad societal reaction as never seen before.
The impacts for agrifood system participants are hard to ignore. Farmers and agribusiness companies are now expected to reduce their environmental footprint, to increase transparency and facilitate a better flow of information, to be better governed and promote corporate social responsibility, to be more inclusive, and to be better stewards of the environment and increase the usage of renewable energy sources. The legitimacy of agribusiness firms – and entire agrifood value chains – is not only dependent on economic factors but also on social and environmental sustainability. Simply put, in the 21st Century planet and people matter as much as profits.
The current consensus on sustainability is based on three major pillars: the economic dimension (profit), the environmental dimension (planet) and the social dimension (people). On the economic side, the major factors to be considered are how companies, value chains and networks are dealing with margins, profits, compensation, chain losses, communicating with final consumers, improving credit conditions with benefits to sustainable projects, risk management, information technology and overall strategies to reduce costs and eliminate waste. Without economic sustainability, private firms cannot afford to respond to society’s demands – a fact sometimes forgotten by some sustainability advocates.
Doing well economically is not enough. On the social side, society demands companies to comply with labor laws and adopt world-class working conditions not only for employees but also for suppliers and distributors. In addition, society increasingly expects businesses to foster local community development, to incentivize collaboration and cooperation along the value chain, to adopt smallholder-friendly initiatives, to facilitate technology transfer and capacity building for smallholders and to offer broader consumer benefits. Finally, on the environment side, the major factors to be considered are related to the impacts of the company – and integrated suppliers – on the
217
BIOENERGY FROM SUGARCANECHAPTER 11
environment. These include transportation issues (food miles), packaging (recycle/reuse/rebuilt and using new materials and fewer materials), waste management, emissions, water management, green buildings and facilities, and carbon footprint, just to name a few.
To some extent, these changes are occurring in developed and some emerging economies. But how about poor countries – particularly in Africa?
THE ROLE OF BIOFUELS IN DELIVERING SUSTAINABILITY
Some researchers suggest that biofuels could play a big part in the solution for poor countries to diversify business and ensure sustainable development. According to Zarrilli (2007), several countries that implemented biofuels development programs have experienced significant job creation, especially in rural areas but also along the value chain. Poschen (2007), the senior International Labor Organization’s specialist on sustainable development, estimates the amount of jobs created in the renewable energy sector will double by 2020 with about 300,000 new jobs. In the early phase of the bio-ethanol program in the US, around 147,000 jobs were created in different sectors of the economy.
This short article outlines some potential benefits of biofuel development in Africa. The development of the sugarcane industry in Brazil may serve as a model. The industry output is impres-sive: 550 million metric tons of sugarcane are used as raw material to produce 31 MMT of sugar (equivalent to 20% of world production), 27 billion liters of ethanol (30% of world production) and bioelectricity. Ethanol production alone creates 465,000 direct jobs, which is six times larger than the oil industry in Brazil. According to industry estimates, the average wage paid by member companies of the Brazilian Sugarcane Industry Association (UNICA) was twice as much as the current federal minimum wage. Ethanol production is present in 1,042 municipalities across the country, compared to only 176 for oil. This translates into more income distribution and community development in rural areas. As for the environment, the use of sugarcane ethanol has generated a reduction of 600 million tons in CO2 emission since 1975, an amount equivalent to the carbon sequestered with the planting of 2 billion trees. In economic terms, specialists conclude that for every liter of ethanol use, the country saves US$ 20 cents in carbon mitigation costs. Air Quality researchers at the University of São Paulo School of Medicine estimate that if every car in São Paulo metropolitan region were fueled exclusively with gasoline, the city would face annually more than 400 additional deaths, 25,000 hospitalizations and an increase of US$ 80 million in healthcare expenses.
Chaddad (2010) describes the leading role of the Brazilian Sugarcane Industry Association (UNICA) in coordinating value chain participants and also in advancing the sustainability agen-da. Since 2007 UNICA has been working on several fronts to facilitate industry-wide sustainability efforts, including:
■ signing an agreement with the government of São Paulo state – called Green Protocol;
■ in which the industry voluntarily agreed to speed up the phasing-out of the practice of sugarcane burning;
■ leading the Brazilian Climate Alliance with 15 other organizations to propose proactive policies in Brazil and in global climate change negotiations. UNICA has also created an educational program about climate changes that will impact more than 2 million students in Brazil;
■ signing the National Commitment to Enhance Work Conditions in the Sugarcane Indus-try together with labor unions and the federal government – the first national agreement to recognize best labor practices. From the 400 cane mills in operation throughout Brazil, more than 300 have voluntarily signed on to the Commitment;
■ launching a “retooling” program for cane workers to lessen the impact of harvest mechanization on job losses. The project will train 7,000 workers per year (mostly sugarcane cutters) to prepare them to take on other jobs in the sugarcane industry or in other sectors;
■ hiring a team of professionals to foster the adoption of Corporate Social Responsibility (CSR) practices by sugarcane mills. In addition, since 2008 UNICA has adopted sustainability reports – following the model developed by the Global Reporting Initiative (GRI);
■ to communicate its social, environmental and economic performance. In 2008, member companies invested over R$ 160 million in 618 projects within social, environmental, cultural, education, sport and health areas, benefiting some 480 thousand people in communities with sugarcane production;
■ engaging with several multi-stakeholder initiatives (MSIs). It is represented at the board of directors of Bonsucro and helped develop a certification scheme for sustainable sugarcane production. The first sugarcane processors to receive Bonsucro sustainability certification in 2011 are based in Brazil.
The same economic, social and environmental benefits could also happen in Africa. The sustainability practices outlined above could serve as a benchmark for Africa. Our main message and objective is to show how biofuels – and sugarcane in particular – can contribute to
218 219
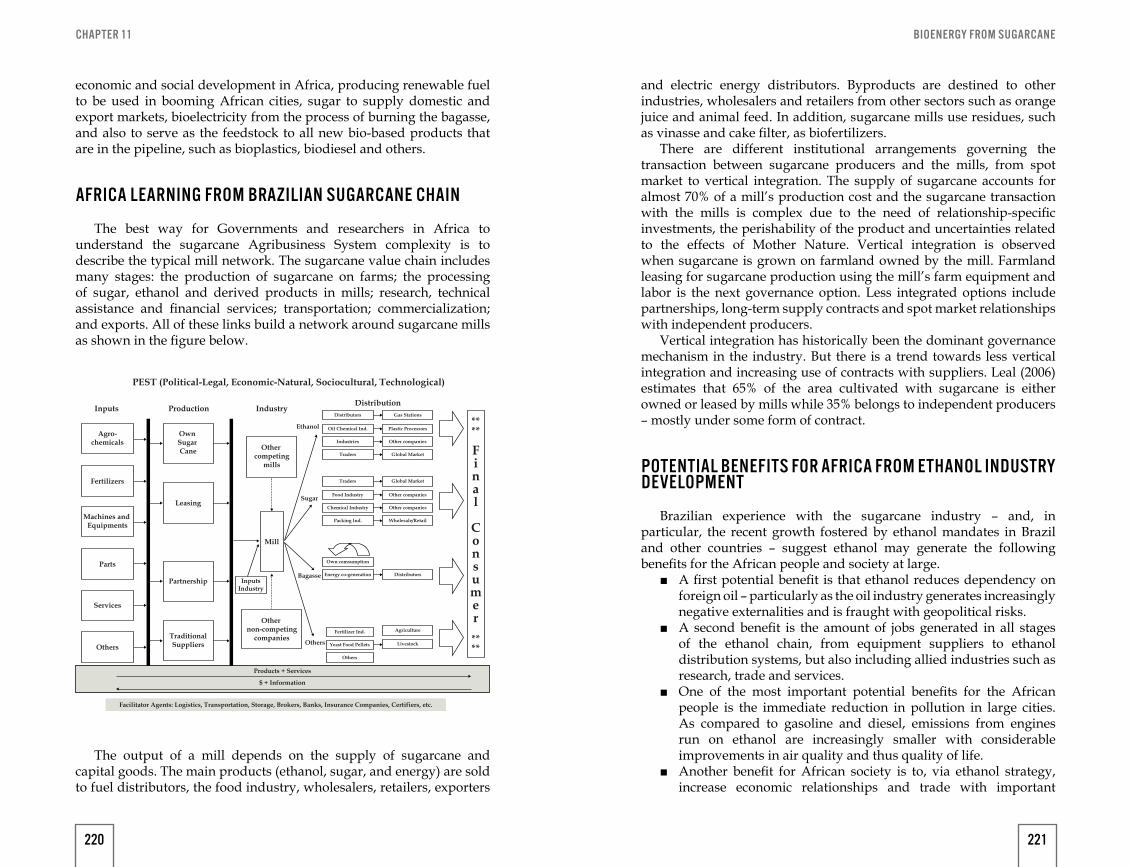
BIOENERGY FROM SUGARCANECHAPTER 11
economic and social development in Africa, producing renewable fuel to be used in booming African cities, sugar to supply domestic and export markets, bioelectricity from the process of burning the bagasse, and also to serve as the feedstock to all new bio-based products that are in the pipeline, such as bioplastics, biodiesel and others.
AFRICA LEARNING FROM BRAZILIAN SUGARCANE CHAIN
The best way for Governments and researchers in Africa to understand the sugarcane Agribusiness System complexity is to describe the typical mill network. The sugarcane value chain includes many stages: the production of sugarcane on farms; the processing of sugar, ethanol and derived products in mills; research, technical assistance and financial services; transportation; commercialization; and exports. All of these links build a network around sugarcane mills as shown in the figure below.
The output of a mill depends on the supply of sugarcane and capital goods. The main products (ethanol, sugar, and energy) are sold to fuel distributors, the food industry, wholesalers, retailers, exporters
Inputs Production Industry
$ + Information
Products + Services
TraditionalSuppliers
Partnership
Leasing
Own Sugar Cane Other
competingmills
Mill
Other non-competing
companies
InputsIndustry
Others
Bagasse
Sugar
Ethanol
Distributors
Oil Chemical Ind. Plastic Processors
Industries
Traders
Gas Stations
Other companies
Global Market
Traders
Food Industry
Chemical Industry
Packing Ind.
Global Market
Other companies
Other companies
Wholesale/Retail
Own comsumption
Energy co-generation
Fertilizer Ind.
Yeast Food Pellets
Others
Livestock
Agriculture
Distributors
Final
Consumer
****
****
Distribution
PEST (Political-Legal, Economic-Natural, Sociocultural, Technological)
Facilitator Agents: Logistics, Transportation, Storage, Brokers, Banks, Insurance Companies, Certifiers, etc.
Agro-chemicals
Fertilizers
Machines and Equipments
Parts
Services
Others
and electric energy distributors. Byproducts are destined to other industries, wholesalers and retailers from other sectors such as orange juice and animal feed. In addition, sugarcane mills use residues, such as vinasse and cake filter, as biofertilizers.
There are different institutional arrangements governing the transaction between sugarcane producers and the mills, from spot market to vertical integration. The supply of sugarcane accounts for almost 70% of a mill’s production cost and the sugarcane transaction with the mills is complex due to the need of relationship-specific investments, the perishability of the product and uncertainties related to the effects of Mother Nature. Vertical integration is observed when sugarcane is grown on farmland owned by the mill. Farmland leasing for sugarcane production using the mill’s farm equipment and labor is the next governance option. Less integrated options include partnerships, long-term supply contracts and spot market relationships with independent producers.
Vertical integration has historically been the dominant governance mechanism in the industry. But there is a trend towards less vertical integration and increasing use of contracts with suppliers. Leal (2006) estimates that 65% of the area cultivated with sugarcane is either owned or leased by mills while 35% belongs to independent producers – mostly under some form of contract.
POTENTIAL BENEFITS FOR AFRICA FROM ETHANOL INDUSTRY DEVELOPMENT
Brazilian experience with the sugarcane industry – and, in particular, the recent growth fostered by ethanol mandates in Brazil and other countries – suggest ethanol may generate the following benefits for the African people and society at large.
■ A first potential benefit is that ethanol reduces dependency on foreign oil – particularly as the oil industry generates increasingly negative externalities and is fraught with geopolitical risks.
■ A second benefit is the amount of jobs generated in all stages of the ethanol chain, from equipment suppliers to ethanol distribution systems, but also including allied industries such as research, trade and services.
■ One of the most important potential benefits for the African people is the immediate reduction in pollution in large cities. As compared to gasoline and diesel, emissions from engines run on ethanol are increasingly smaller with considerable improvements in air quality and thus quality of life.
■ Another benefit for African society is to, via ethanol strategy, increase economic relationships and trade with important
220 221
BIOENERGY FROM SUGARCANECHAPTER 11
emerging partners among African nations and also with other emerging economies such as Brazil, China and India.
■ From a business perspective, ethanol can generate opportunities for foreign direct investment for African people and companies, selling products and making profits outside Africa and repatriating these resources to help the development and income distribution in the continent.
■ These investments will also allow Africa to have access to world-class technology that is currently dominated by ethanol producing countries.
■ Finally, Africa can provide a strong contribution towards mitigation of climate change in the 21st century.
AN OUTLINE OF STRATEGIES FOR SUGARCANE INDUSTRY DEVELOPMENT IN AFRICA
This article had the objective to show how Brazil has benefitted from adopting an ethanol development policy for the last 40 years that resulted in generation of a booming sugarcane industry with several economic, social and environmental benefits to society. Just to summarize, in 2010 the Brazilian sugarcane industry supplied 100% of the domestic sugar market and produced enough of a surplus to export 53% of the international sugar market. In addition, the industry produced enough ethanol to supply 52% of the domestic market use of light-vehicle fuels (compared to 48% for gasoline). In 2015, this share is expected to reach 80% versus only 20% for gasoline. This was accomplished with the use of 9 million hectares of sugarcane from the esti-mated 350 million hectares of available farmland in the country.
Africa can follow several strategies to foster the development of the sugarcane chain, including emulating the Brazilian experience. In what follows, we offer some possible contributions to this debate.
■ A Strategic Plan should be developed as, to our knowledge, it is not existent yet. This article and Chaddad (2010) provide several pieces of relevant information about Brazilian industry, how it is organized, the relevant policies and the leading role of UNICA. A next step would be to adapt the Brazilian model to the specific environment and conditions of countries in Africa.
■ A suggestion for Africa to get started in building up supply chains in preparation for an ethanol or renewable fuel mandate (such as in Brazil, the U.S. and the European Union, to name a few). The initial mandate could start as an E10 policy (10% of anhydrous ethanol blended to gasoline), with a perspective of moving to an E25 policy when production capabilities are in place.
■ In order to be able to increase ethanol production, Africa may
initially invest in agricultural research and technical assistance to produce sugarcane, sugar and ethanol in some regions with existing technologies, and subsequently develop second generation biofuels from cellulosic sources, perhaps adapting Brazilian technologies that have been developed since the 1970s.
■ An integrated model based on a network of small farmers may be a useful approach to foster sugarcane production and rural development.
■ Another important possibility for Africa is to invest in ethanol production in some selected African countries with favorable conditions, which could supply other African nations. This would serve as the basis for an oil import substitution policy aimed at substituting oil imports for ethanol produced in the continent. This strategy will reduce dependency from oil producing countries and enhance the economic ties among African nations.
There are several alternative strategies that can be part of Africa’s future positioning on sugar-cane and biofuels. The international sugar market is growing and, except for Brazil, the most relevant sugar exporters face considerable challenges. In the case of ethanol, it has proven to be the most efficient biofuel in competing with gasoline in the last 40 years, and Africa may gain with a strategic plan on ethanol. Africa has a long avenue of opportunities to follow. Increased collabo-ration with Brazil in this field is a future development agenda for Governments, NGOs and the private sector. The University of Sao Paulo is open for this collaboration and to help Africa in this strategic plan.
222 223
BY MARCOS FAVA NEVES, ALLAN W. GRAY AND BRIAN A. BOURQUARD
COPERSUCAR: A WORLD LEADER IN SUGAR AND ETHANOL
12
Originally published in International Food and Agribusiness Management Review 2016; 19 (2): 207-240
BIOENERGY FROM SUGARCANE
Luís Pogetti looks out the window of his office located in the heart of São Paulo, Brazil, a city with 20 million people. He is executive president of the board of Copersucar, an ethanol and sugar trading company with 600 employees and over $8.1 billion1 in sales. Luís notices the traffic jams across São Paulo and considers the amount of fuel being consumed. With almost 3.5 million new cars sold each year, there will be 50 million cars in Brazil by 2020.
Eighty-five percent of all new cars sold are flex-fuel, which means that in 2020, 40 million cars will be capable of using ethanol, gasoline, or both, depending on the consumer’s choice based on economics, environmental and even employment issues. Copersucar, which currently produces 12% of the world’s ethanol, is also its largest ethanol trader. In the future, how many of these cars will use ethanol, and how much ethanol will be needed? It’s a difficult question: ethanol consumption depends on the price of its major competitor, gasoline, and with the recent fall of oil prices in 2014 and 2015, what will the situation look like?
As Luís looks out at the traffic, so many questions run through his mind. Will ethanol be feasible as a worldwide gasoline additive commodity, increasing export opportunities? Will US public policies allow the adoption of E153, given the current consumption of gas in the United States? Can E85 4 be a competitive, feasible alternative that breaks the blend wall? Will second-generation ethanol come to market using other biomass sources that are more competitive than sugarcane, which is Copersucar’s source?
Copersucar is also the world’s largest trader of sugar, a commodity that has worldwide consumption growth of 2–3% per year. Copersucar currently has a 12% market share, selling 8.6 million tons and exporting 6.9 million tons in the crop year, 2013–2014 (the sugar crop year is from 1-April to 31-March).
Luís wonders what will happen to the sugar market by 2020. Will Asian demand continue to increase based on the consumption of industrialized products that use sugar? Will other countries be able to undercut Brazil in sugar production costs and emerge as new world suppliers? How should he manage the low prices and excess of sugar production of 2013–2014, given its effects on cash flows and investment capacity of farmers and industries? Will the recent campaigns against sugar and suggestions of tax increases for soft drinks and others have a negative impact? Copersucar’s partner mills also produce electric energy from biomass, and even with the relatively small economic growth, Brazil faces energy consumption growth of 5–7% per year. Energy from biomass at current prices and costs cannot compete with other energy sources in an institutional environment that does not value its renewability and cleanliness through taxes and prices. What will happen in the Brazilian energy market? How will regulations
227
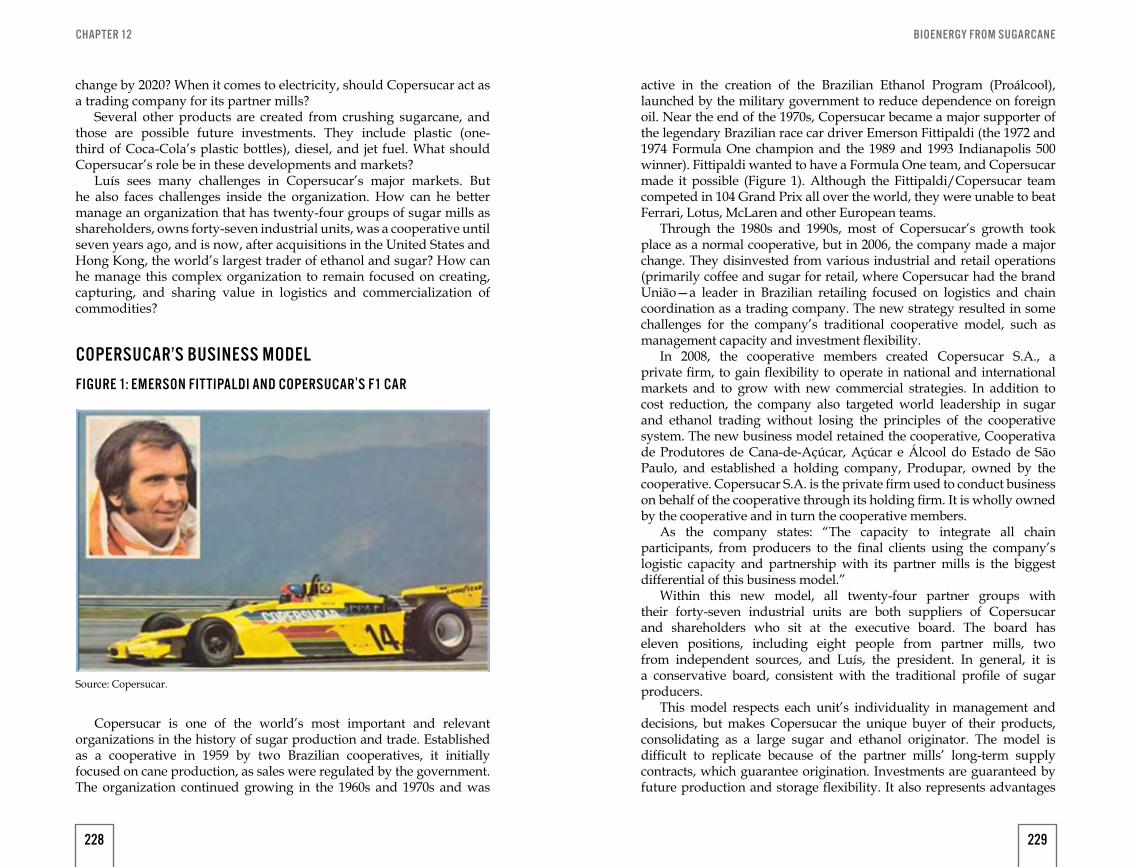
BIOENERGY FROM SUGARCANECHAPTER 12
change by 2020? When it comes to electricity, should Copersucar act as a trading company for its partner mills?
Several other products are created from crushing sugarcane, and those are possible future investments. They include plastic (one-third of Coca-Cola’s plastic bottles), diesel, and jet fuel. What should Copersucar’s role be in these developments and markets?
Luís sees many challenges in Copersucar’s major markets. But he also faces challenges inside the organization. How can he better manage an organization that has twenty-four groups of sugar mills as shareholders, owns forty-seven industrial units, was a cooperative until seven years ago, and is now, after acquisitions in the United States and Hong Kong, the world’s largest trader of ethanol and sugar? How can he manage this complex organization to remain focused on creating, capturing, and sharing value in logistics and commercialization of commodities?
COPERSUCAR’S BUSINESS MODEL
FIGURE 1: EMERSON FITTIPALDI AND COPERSUCAR'S F1 CAR
Source: Copersucar.
Copersucar is one of the world’s most important and relevant organizations in the history of sugar production and trade. Established as a cooperative in 1959 by two Brazilian cooperatives, it initially focused on cane production, as sales were regulated by the government. The organization continued growing in the 1960s and 1970s and was
active in the creation of the Brazilian Ethanol Program (Proálcool), launched by the military government to reduce dependence on foreign oil. Near the end of the 1970s, Copersucar became a major supporter of the legendary Brazilian race car driver Emerson Fittipaldi (the 1972 and 1974 Formula One champion and the 1989 and 1993 Indianapolis 500 winner). Fittipaldi wanted to have a Formula One team, and Copersucar made it possible (Figure 1). Although the Fittipaldi/Copersucar team competed in 104 Grand Prix all over the world, they were unable to beat Ferrari, Lotus, McLaren and other European teams.
Through the 1980s and 1990s, most of Copersucar’s growth took place as a normal cooperative, but in 2006, the company made a major change. They disinvested from various industrial and retail operations (primarily coffee and sugar for retail, where Copersucar had the brand União—a leader in Brazilian retailing focused on logistics and chain coordination as a trading company. The new strategy resulted in some challenges for the company’s traditional cooperative model, such as management capacity and investment flexibility.
In 2008, the cooperative members created Copersucar S.A., a private firm, to gain flexibility to operate in national and international markets and to grow with new commercial strategies. In addition to cost reduction, the company also targeted world leadership in sugar and ethanol trading without losing the principles of the cooperative system. The new business model retained the cooperative, Cooperativa de Produtores de Cana-de-Açúcar, Açúcar e Álcool do Estado de São Paulo, and established a holding company, Produpar, owned by the cooperative. Copersucar S.A. is the private firm used to conduct business on behalf of the cooperative through its holding firm. It is wholly owned by the cooperative and in turn the cooperative members.
As the company states: “The capacity to integrate all chain participants, from producers to the final clients using the company’s logistic capacity and partnership with its partner mills is the biggest differential of this business model.”
Within this new model, all twenty-four partner groups with their forty-seven industrial units are both suppliers of Copersucar and shareholders who sit at the executive board. The board has eleven positions, including eight people from partner mills, two from independent sources, and Luís, the president. In general, it is a conservative board, consistent with the traditional profile of sugar producers.
This model respects each unit’s individuality in management and decisions, but makes Copersucar the unique buyer of their products, consolidating as a large sugar and ethanol originator. The model is difficult to replicate because of the partner mills’ long-term supply contracts, which guarantee origination. Investments are guaranteed by future production and storage flexibility. It also represents advantages
228 229
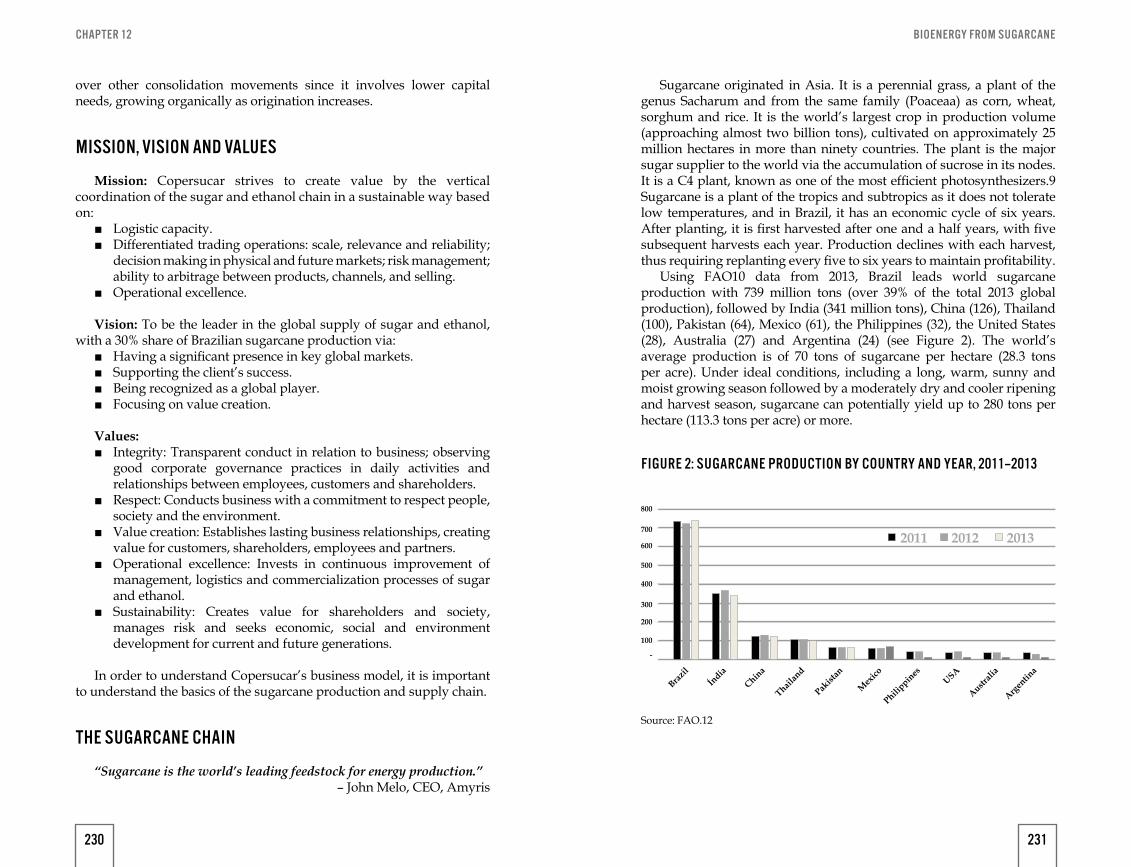
BIOENERGY FROM SUGARCANECHAPTER 12
over other consolidation movements since it involves lower capital needs, growing organically as origination increases.
MISSION, VISION AND VALUES
Mission: Copersucar strives to create value by the vertical coordination of the sugar and ethanol chain in a sustainable way based on:
■ Logistic capacity. ■ Differentiated trading operations: scale, relevance and reliability;
decision making in physical and future markets; risk management; ability to arbitrage between products, channels, and selling.
■ Operational excellence.
Vision: To be the leader in the global supply of sugar and ethanol, with a 30% share of Brazilian sugarcane production via:
■ Having a significant presence in key global markets. ■ Supporting the client’s success. ■ Being recognized as a global player. ■ Focusing on value creation.
Values: ■ Integrity: Transparent conduct in relation to business; observing
good corporate governance practices in daily activities and relationships between employees, customers and shareholders.
■ Respect: Conducts business with a commitment to respect people, society and the environment.
■ Value creation: Establishes lasting business relationships, creating value for customers, shareholders, employees and partners.
■ Operational excellence: Invests in continuous improvement of management, logistics and commercialization processes of sugar and ethanol.
■ Sustainability: Creates value for shareholders and society, manages risk and seeks economic, social and environment development for current and future generations.
In order to understand Copersucar’s business model, it is important to understand the basics of the sugarcane production and supply chain.
THE SUGARCANE CHAIN
“Sugarcane is the world’s leading feedstock for energy production.”– John Melo, CEO, Amyris
Sugarcane originated in Asia. It is a perennial grass, a plant of the genus Sacharum and from the same family (Poaceaa) as corn, wheat, sorghum and rice. It is the world’s largest crop in production volume (approaching almost two billion tons), cultivated on approximately 25 million hectares in more than ninety countries. The plant is the major sugar supplier to the world via the accumulation of sucrose in its nodes. It is a C4 plant, known as one of the most efficient photosynthesizers.9 Sugarcane is a plant of the tropics and subtropics as it does not tolerate low temperatures, and in Brazil, it has an economic cycle of six years. After planting, it is first harvested after one and a half years, with five subsequent harvests each year. Production declines with each harvest, thus requiring replanting every five to six years to maintain profitability.
Using FAO10 data from 2013, Brazil leads world sugarcane production with 739 million tons (over 39% of the total 2013 global production), followed by India (341 million tons), China (126), Thailand (100), Pakistan (64), Mexico (61), the Philippines (32), the United States (28), Australia (27) and Argentina (24) (see Figure 2). The world’s average production is of 70 tons of sugarcane per hectare (28.3 tons per acre). Under ideal conditions, including a long, warm, sunny and moist growing season followed by a moderately dry and cooler ripening and harvest season, sugarcane can potentially yield up to 280 tons per hectare (113.3 tons per acre) or more.
FIGURE 2: SUGARCANE PRODUCTION BY COUNTRY AND YEAR, 2011–2013
-
100
200
300
400
500
600
700
800
Brazil
Índia
China
Thailan
d
Pakist
an
Mex
ico
Philippin
esUSA
Australi
a
Argen
tina
Sugarcane Production by Country
2011 2012 2013
Source: FAO.12
230 231
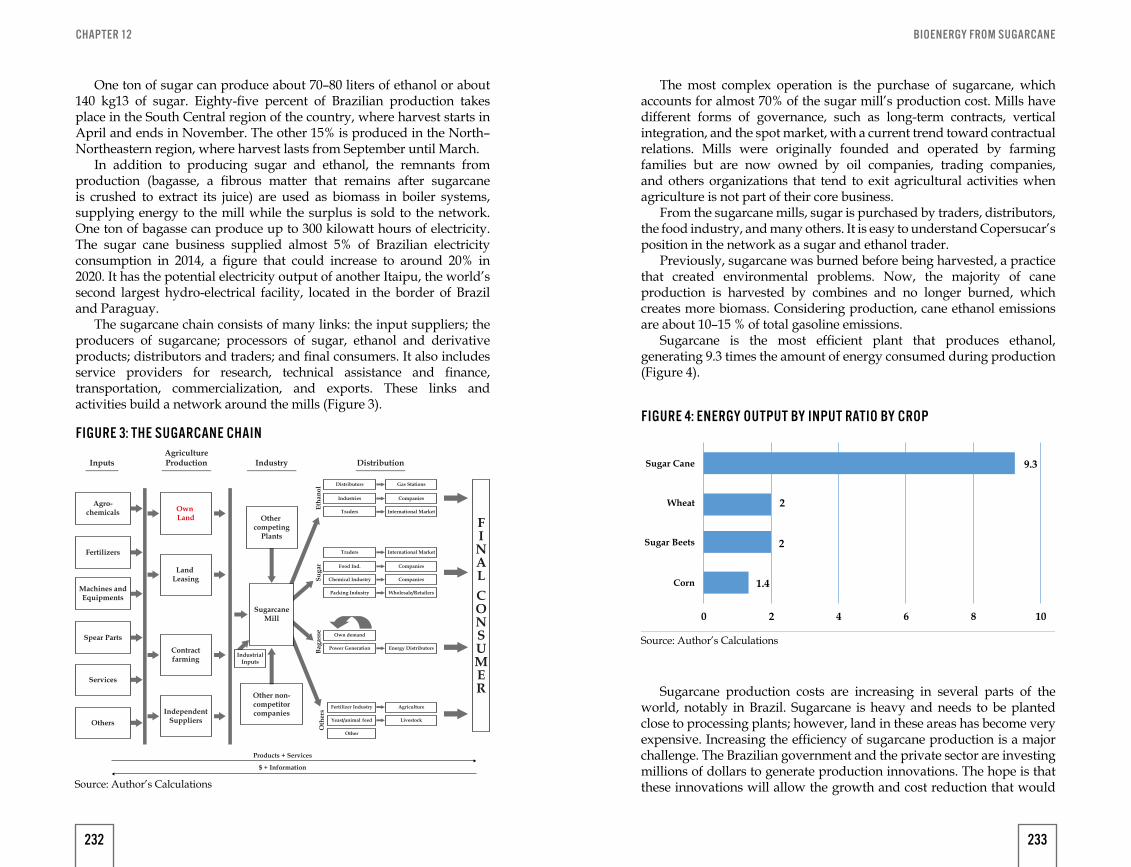
BIOENERGY FROM SUGARCANECHAPTER 12
One ton of sugar can produce about 70–80 liters of ethanol or about 140 kg13 of sugar. Eighty-five percent of Brazilian production takes place in the South Central region of the country, where harvest starts in April and ends in November. The other 15% is produced in the North– Northeastern region, where harvest lasts from September until March.
In addition to producing sugar and ethanol, the remnants from production (bagasse, a fibrous matter that remains after sugarcane is crushed to extract its juice) are used as biomass in boiler systems, supplying energy to the mill while the surplus is sold to the network. One ton of bagasse can produce up to 300 kilowatt hours of electricity. The sugar cane business supplied almost 5% of Brazilian electricity consumption in 2014, a figure that could increase to around 20% in 2020. It has the potential electricity output of another Itaipu, the world’s second largest hydro-electrical facility, located in the border of Brazil and Paraguay.
The sugarcane chain consists of many links: the input suppliers; the producers of sugarcane; processors of sugar, ethanol and derivative products; distributors and traders; and final consumers. It also includes service providers for research, technical assistance and finance, transportation, commercialization, and exports. These links and activities build a network around the mills (Figure 3).
FIGURE 3: THE SUGARCANE CHAIN
Source: Author’s Calculations
InputsAgricultureProduction Industry
$ + Information
Products + Services
IndependentSuppliers
Contractfarming
Land Leasing
Own Land
SugarcaneMill
Oth
ers
Bag
asse
Su
gar
Eth
anol
Distributors
Industries Companies
Traders
Gas Stations
International Market
Traders
Food Ind.
Chemical Industry
Packing Industry
International Market
Companies
Companies
Wholesale/Retailers
Own demand
Power Generation
Fertilizer Industry
Yeast/animal feed
Other
Livestock
Agriculture
Energy Distributors
FINAL
CONSUMER
Distribution
Agro-chemicals
Fertilizers
Machines andEquipments
Spear Parts
Services
Others
IndustrialInputs
Other non-competitorcompanies
Other competing
Plants
The most complex operation is the purchase of sugarcane, which accounts for almost 70% of the sugar mill’s production cost. Mills have different forms of governance, such as long-term contracts, vertical integration, and the spot market, with a current trend toward contractual relations. Mills were originally founded and operated by farming families but are now owned by oil companies, trading companies, and others organizations that tend to exit agricultural activities when agriculture is not part of their core business.
From the sugarcane mills, sugar is purchased by traders, distributors, the food industry, and many others. It is easy to understand Copersucar’s position in the network as a sugar and ethanol trader.
Previously, sugarcane was burned before being harvested, a practice that created environmental problems. Now, the majority of cane production is harvested by combines and no longer burned, which creates more biomass. Considering production, cane ethanol emissions are about 10–15 % of total gasoline emissions.
Sugarcane is the most efficient plant that produces ethanol, generating 9.3 times the amount of energy consumed during production (Figure 4).
Sugarcane production costs are increasing in several parts of the world, notably in Brazil. Sugarcane is heavy and needs to be planted close to processing plants; however, land in these areas has become very expensive. Increasing the efficiency of sugarcane production is a major challenge. The Brazilian government and the private sector are investing millions of dollars to generate production innovations. The hope is that these innovations will allow the growth and cost reduction that would
FIGURE 4: ENERGY OUTPUT BY INPUT RATIO BY CROP
Source: Author’s Calculations
0 4 6 8 10
9.3
2
2
2
1.4
Sugar Cane
Energy Output to Input Ratio by Crop
Wheat
Sugar Beets
Corn
232 233
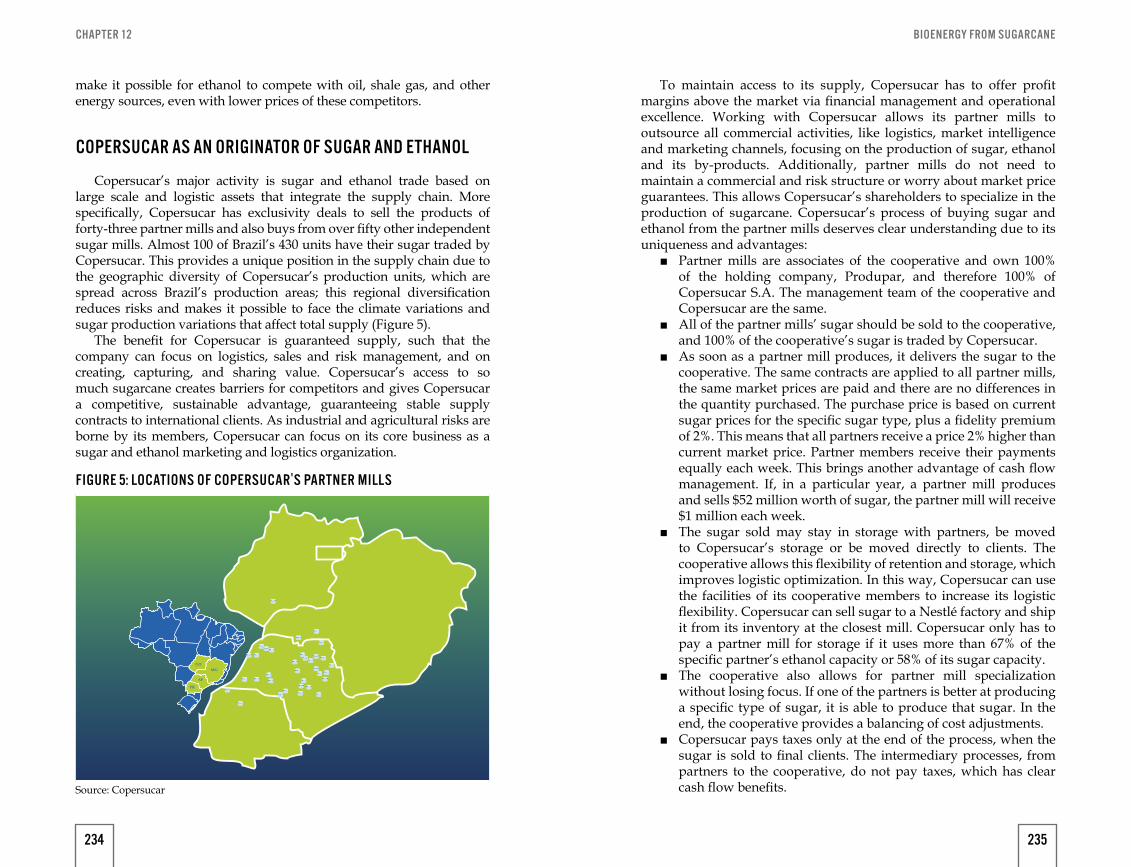
BIOENERGY FROM SUGARCANECHAPTER 12
make it possible for ethanol to compete with oil, shale gas, and other energy sources, even with lower prices of these competitors.
COPERSUCAR AS AN ORIGINATOR OF SUGAR AND ETHANOL
Copersucar’s major activity is sugar and ethanol trade based on large scale and logistic assets that integrate the supply chain. More specifically, Copersucar has exclusivity deals to sell the products of forty-three partner mills and also buys from over fifty other independent sugar mills. Almost 100 of Brazil’s 430 units have their sugar traded by Copersucar. This provides a unique position in the supply chain due to the geographic diversity of Copersucar’s production units, which are spread across Brazil’s production areas; this regional diversification reduces risks and makes it possible to face the climate variations and sugar production variations that affect total supply (Figure 5).
The benefit for Copersucar is guaranteed supply, such that the company can focus on logistics, sales and risk management, and on creating, capturing, and sharing value. Copersucar’s access to so much sugarcane creates barriers for competitors and gives Copersucar a competitive, sustainable advantage, guaranteeing stable supply contracts to international clients. As industrial and agricultural risks are borne by its members, Copersucar can focus on its core business as a sugar and ethanol marketing and logistics organization.
GO
MG
SP
PR
FIGURE 5: LOCATIONS OF COPERSUCAR'S PARTNER MILLS
Source: Copersucar
To maintain access to its supply, Copersucar has to offer profit margins above the market via financial management and operational excellence. Working with Copersucar allows its partner mills to outsource all commercial activities, like logistics, market intelligence and marketing channels, focusing on the production of sugar, ethanol and its by-products. Additionally, partner mills do not need to maintain a commercial and risk structure or worry about market price guarantees. This allows Copersucar’s shareholders to specialize in the production of sugarcane. Copersucar’s process of buying sugar and ethanol from the partner mills deserves clear understanding due to its uniqueness and advantages:
■ Partner mills are associates of the cooperative and own 100% of the holding company, Produpar, and therefore 100% of Copersucar S.A. The management team of the cooperative and Copersucar are the same.
■ All of the partner mills’ sugar should be sold to the cooperative, and 100% of the cooperative’s sugar is traded by Copersucar.
■ As soon as a partner mill produces, it delivers the sugar to the cooperative. The same contracts are applied to all partner mills, the same market prices are paid and there are no differences in the quantity purchased. The purchase price is based on current sugar prices for the specific sugar type, plus a fidelity premium of 2%. This means that all partners receive a price 2% higher than current market price. Partner members receive their payments equally each week. This brings another advantage of cash flow management. If, in a particular year, a partner mill produces and sells $52 million worth of sugar, the partner mill will receive $1 million each week.
■ The sugar sold may stay in storage with partners, be moved to Copersucar’s storage or be moved directly to clients. The cooperative allows this flexibility of retention and storage, which improves logistic optimization. In this way, Copersucar can use the facilities of its cooperative members to increase its logistic flexibility. Copersucar can sell sugar to a Nestlé factory and ship it from its inventory at the closest mill. Copersucar only has to pay a partner mill for storage if it uses more than 67% of the specific partner’s ethanol capacity or 58% of its sugar capacity.
■ The cooperative also allows for partner mill specialization without losing focus. If one of the partners is better at producing a specific type of sugar, it is able to produce that sugar. In the end, the cooperative provides a balancing of cost adjustments.
■ Copersucar pays taxes only at the end of the process, when the sugar is sold to final clients. The intermediary processes, from partners to the cooperative, do not pay taxes, which has clear cash flow benefits.
234 235
BIOENERGY FROM SUGARCANECHAPTER 12
Copersucar is the largest player in Brazil and operates in a quickly consolidating international industry. Some competitors like Dreyfus, Bunge, Noble and Cargill are multi-product trading companies. Guarani, owned by the French Farmers Cooperative Tereos, is very active in sugar beet production in Europe. Cosan, which is partially owned by Shell, has advanced to the ethanol distribution channel in Brazil, owning logistics and gas stations. Sāo Martinho is also operating in cane diesel and other innovations. Some companies have refineries and distribute their own sugar brand at the Brazilian retail level. Strategies are diverse amongst the major players.
Global sugar competition is intense but dominated by large organizations. Multi-product trading firms, such as Bunge and Louis Dreyfus, have made inroads into sugar refining and trading over the past decade. Bunge began trading sugar in 2006 and has since acquired eight sugar mills in Brazil, capable of crushing 21 million tons of cane and producing an estimated 1.5 million tons of sugar per year. Bunge’s mills are also equipped to produce ethanol, and like Copersucar’s millers, can switch between the two commodity outputs. Louis Dreyfus entered the Brazilian market in 2009 with its purchase of a large Brazilian operator, naming the new operation Biosev. Biosev operates twelve sugar and ethanol mills, capable of crushing 38 million tons of cane and producing 2.8 million tons of sugar and 1.8 million tons of ethanol each year.
To compete, Copersucar has expanded significantly. Its cane-crushing capacity moved from 72 million tons in 2007-2008 to almost 130 million tons in 2013-2014 (Table 1).
Before choosing Copersucar as their trader, companies typically consider competitors’ offers and the “make-versus-buy” option. This is why Copersucar must perform better and constantly innovate to offer benefits of the of the purchase decision to use Copersucar. Member companies, as well as Copersucar’s independent suppliers, always have one question in mind: could I perform better and cheaper without
TABLE 1: SUGARCANE CRUSHED UNDER COPERSUCAR BY SOURCE
2008–2009 2009–2010 2010–2011 2011–2012 2012–2013 2013–2014
Members 68 74 82.2 84.8 94.8 101.4
Outside 4 11.5 14.4 24.5 19.4 27.8
Total Cane 72 85.5 96.6 109.3 114.2 129.2
Note: *Millions of tonsSource: Copersucar
Copersucar? For example, Clealco, which owned 7% of Copersucar and was one of its most important participants, left the group in 2013, complaining about trading prices. (See Appendix 2 for a list of Copersucar’s participants and shares.)
Beyond reducing costs for its partner mills, Copersucar’s challenge is to gain new partners and to operate as the originator for other producer groups in order to increase asset utilization, turnover, and financial performance.
COPERSUCAR AS A LOGISTIC OPERATOR AND TRADING COMPANY
Copersucar has to outperform as a logistic operator and trading company. This is its core business, and sugar and ethanol are commodities with high transportation costs when compared to their value, so any cost difference is significant.
Logistic assets include storage capacity for 2.5 million tons for sugar and 3 billion liters of ethanol, internal logistics (contracts for using trains), pipelines for ethanol (as a 20% owner of Logum Logistica), and export logistics (vessels and transport companies such as Copa Shipping).
Copersucar has long-term contracts with train system operators in Brazil that carry sugar to Santos Port. Using trains allows Copersucar to save 70,000 250–mile truck trips. Copersucar’s goal is to move 70% of its sugar via rail systems in 2015.
Copersucar, as well as other companies and government institutions, invested $1.5 billion in logistics, making it possible to bring sugar transport costs down from $50 to $42 per ton. Together with other companies, Copersucar is participating in the Logum Initiative, an 800-mile pipeline that will carry ethanol from the producing regions to the port (Figure 6). The first phase, with 200 miles already operational in 2013, has made it possible to take ethanol from Ribeirão Preto to the petrochemical cluster of Paulinia (a distribution hub of fuels in Brazil) and then to Santos Port. This initiative will replace 1.2 million truckloads between the production area and Santos Port, avoiding more than 250 million miles of truck movement and 350,000 tons of CO2 emissions each year.
236 237
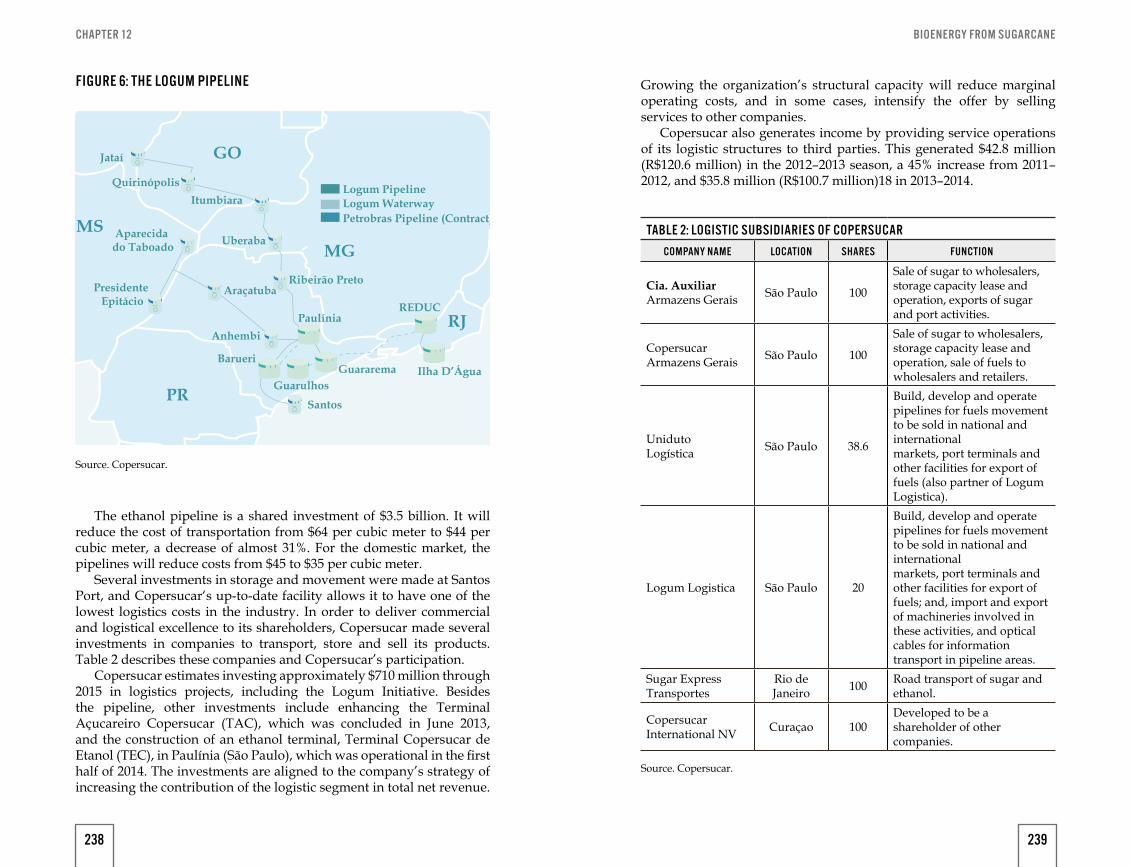
BIOENERGY FROM SUGARCANECHAPTER 12
FIGURE 6: THE LOGUM PIPELINE
GO
MS
Logum Pipeline
Jataí
Quirinópolis
Itumbiara
UberabaAparecida
do Taboado
Presidente Epitácio
AraçatubaRibeirão Preto
Paulínia
Anhembi
Barueri
Guarulhos
Santos
Guararema Ilha D’Água
REDUC
Logum WaterwayPetrobras Pipeline (Contract)
PR
MG
RJ
Source. Copersucar.
The ethanol pipeline is a shared investment of $3.5 billion. It will reduce the cost of transportation from $64 per cubic meter to $44 per cubic meter, a decrease of almost 31%. For the domestic market, the pipelines will reduce costs from $45 to $35 per cubic meter.
Several investments in storage and movement were made at Santos Port, and Copersucar‘s up-to-date facility allows it to have one of the lowest logistics costs in the industry. In order to deliver commercial and logistical excellence to its shareholders, Copersucar made several investments in companies to transport, store and sell its products. Table 2 describes these companies and Copersucar’s participation.
Copersucar estimates investing approximately $710 million through 2015 in logistics projects, including the Logum Initiative. Besides the pipeline, other investments include enhancing the Terminal Açucareiro Copersucar (TAC), which was concluded in June 2013, and the construction of an ethanol terminal, Terminal Copersucar de Etanol (TEC), in Paulínia (São Paulo), which was operational in the first half of 2014. The investments are aligned to the company’s strategy of increasing the contribution of the logistic segment in total net revenue.
Growing the organization’s structural capacity will reduce marginal operating costs, and in some cases, intensify the offer by selling services to other companies.
Copersucar also generates income by providing service operations of its logistic structures to third parties. This generated $42.8 million (R$120.6 million) in the 2012–2013 season, a 45% increase from 2011–2012, and $35.8 million (R$100.7 million)18 in 2013–2014.
TABLE 2: LOGISTIC SUBSIDIARIES OF COPERSUCARCOMPANY NAME LOCATION SHARES FUNCTION
Cia. AuxiliarArmazens Gerais São Paulo 100
Sale of sugar to wholesalers, storage capacity lease andoperation, exports of sugar and port activities.
CopersucarArmazens Gerais São Paulo 100
Sale of sugar to wholesalers, storage capacity lease andoperation, sale of fuels to wholesalers and retailers.
UnidutoLogística São Paulo 38.6
Build, develop and operate pipelines for fuels movement to be sold in national and internationalmarkets, port terminals and other facilities for export of fuels (also partner of Logum Logistica).
Logum Logistica São Paulo 20
Build, develop and operate pipelines for fuels movement to be sold in national and internationalmarkets, port terminals and other facilities for export of fuels; and, import and export of machineries involved in these activities, and optical cables for informationtransport in pipeline areas.
Sugar ExpressTransportes
Rio de Janeiro 100 Road transport of sugar and
ethanol.
CopersucarInternational NV Curaçao 100
Developed to be a shareholder of other companies.
Source. Copersucar.
238 239
BIOENERGY FROM SUGARCANECHAPTER 12
SALES EFFORTS AND STRATEGIES
In addition to excellence in logistical performance, Copersucar seeks to grow and develop worldwide sales of sugar and ethanol in competition with global trading companies. Both commodity markets, sugar and ethanol, involve significant risks and regulations.
Geographically, Copersucar’s most important market is Brazil; however, the organization operates and sells in many global markets.
In order to build its global presence, Copersucar invested in companies around the world (Table 3). Copersucar made three recent, significant moves in sugar and ethanol chains. Copersucar Asia, a subsidiary based in Hong Kong, was founded in order to build more proximity with Asian buyers and to originate sugar in Asia, thus expanding Copersucar’s supply beyond Brazil. This also allows Copersucar to be a year-round supplier to China, as Brazilian production is not competitive there for part of the year due to freight costs.
TABLE 3: SALES AND MARKETING SUBSIDIARIESCOMPANY NAME LOCATION SHARES FUNCTION
Cia. Auxiliar Armazens Gerais São Paulo 100
Sales of sugar to wholesalers, storage capacity lease and operation, exports of sugar and port activities
CopersucarArmazens Gerais São Paulo 100
Sales of sugar to wholesalers, storage capacity lease and operation, sales of fuels to wholesalers and retailers
Copersucar International NV Curaçao 100
Developed to be a shareholder of other companies
Copersucar Trading A.V.V. Aruba 100
Imports and exports of sugar and ethanol acquired mostly from the Cooperative of Sugar Planters and Producers of São Paulo
Copersucar Europe B.V.
Rotterdam, NETH 100 Sugar and ethanol trade
Copersucar North America, LLC
Franklin, TN USA 100 Participate as a shareholder of
the capital of other companiesCopersucar Asia Hong Kong 100 Sugar and ethanol tradingEco-Energy Global Biofuels LLC
Franklin, TN USA 65 Ethanol origination and trade
Source: Copersucar.
The second major international expansion was the creation of Alvean, a joint venture between Copersucar and Cargill announced in 2014. The move surprised the industry globally, and is expected to contribute in the near future to both organizations. From the August 2014 press release:
“Cargill and Copersucar have successfully completed all required regulatory clearances to form Alvean, their new 50/50 sugar trading joint venture. Operating as an independent entity, Alvean will begin integrating global activities to originate, commercialize and trade raw and white sugar. Alvean will bring together two of the world’s leading and most respected sugar trading operations. Our customers will benefit from the complementary strengths of Copersucar and Cargill,” said Ivo Sarjanovic, new Chief Executive Officer of Alvean. “We will have a strong combined global supply chain, a worldwide presence and excellent logistics management.” Sarjanovic, who previously headed up Cargill’s global sugar business, continued, “I am very confident that we are embarking on an exciting journey which will reshape the sugar industry. We are bringing together the best of both Cargill’s and Copersucar’s sugar expertise, talents and capabilities—the base on which we build our new and unparalleled company, Alvean.” Soren Hoed Jensen, Alvean’s Chief Operating Officer, explained the origin of the new company’s name: “Alvi, derived from the Latin word albus signifies ‘white/crystal clear’ and symbolizes our engagement to be ethical and inclusive towards our partners. The suffix ‘an’ brings the notion of movement, expressing the dynamism of the sugar market and our commitment to be the unique link between supply and demand around the world. Alvean will seek new ways to be innovative and agile for the benefit of our customers and suppliers by bringing comprehensive global market knowledge and trading expertise.
“Alvean’s trading activities will be based in Geneva, Switzerland. The joint venture will also have offices in Bangkok, Bilbao, Delhi, Dubai, Hong Kong, Jakarta, Miami, Moscow, Sao Paulo, and Shanghai.”
– Press Announcement, 20-August, 2014.
The third global move occurred in ethanol. In 2012, Copersucar acquired 65% of Eco-Energy, a US based trading company founded in 1992 in California. Eco-Energy has a 9% market share of the US ethanol trade, with sales of $3.1 billion in 2012. This acquisition cost $90 million and was financed entirely by Banco do Brasil (Brazilian Federal Pubic Bank) in a project finance style. Now based in Nashville, Tenn., Eco-Energy originates ethanol from sixteen units with exclusivity contracts, representing 60% of its ethanol origination. Like Copersucar
240 241
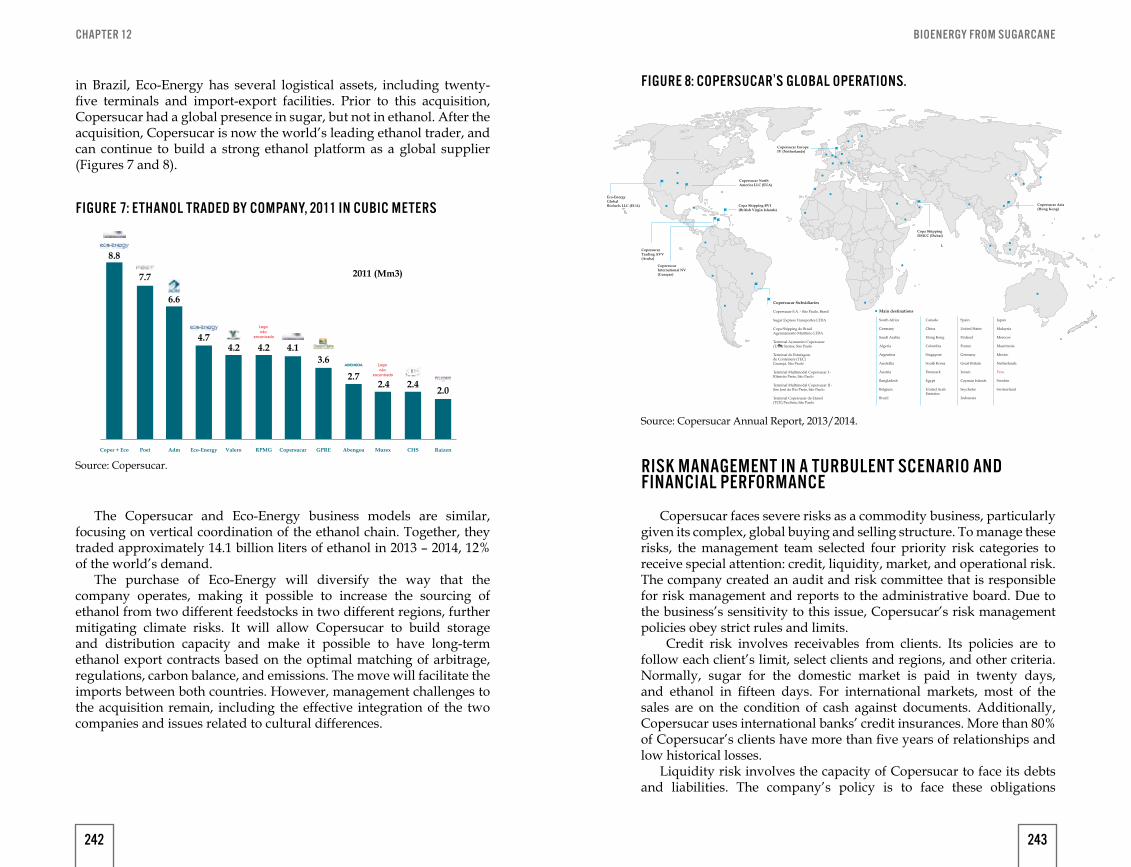
BIOENERGY FROM SUGARCANECHAPTER 12
in Brazil, Eco-Energy has several logistical assets, including twenty-five terminals and import-export facilities. Prior to this acquisition, Copersucar had a global presence in sugar, but not in ethanol. After the acquisition, Copersucar is now the world’s leading ethanol trader, and can continue to build a strong ethanol platform as a global supplier (Figures 7 and 8).
The Copersucar and Eco-Energy business models are similar, focusing on vertical coordination of the ethanol chain. Together, they traded approximately 14.1 billion liters of ethanol in 2013 – 2014, 12% of the world’s demand.
The purchase of Eco-Energy will diversify the way that the company operates, making it possible to increase the sourcing of ethanol from two different feedstocks in two different regions, further mitigating climate risks. It will allow Copersucar to build storage and distribution capacity and make it possible to have long-term ethanol export contracts based on the optimal matching of arbitrage, regulations, carbon balance, and emissions. The move will facilitate the imports between both countries. However, management challenges to the acquisition remain, including the effective integration of the two companies and issues related to cultural differences.
2011 (Mm3)
8.8
7.7
6.6
4.74.2 4.2 4.1
3.6
2.72.4 2.4
2.0
Coper + Eco Poet Adm Eco-Energy Valero RPMG GPRE Abengoa Murex CHS RaízenCopersucar
Logo não
encontrado
Logo não
encontrado
FIGURE 7: ETHANOL TRADED BY COMPANY, 2011 IN CUBIC METERS
Source: Copersucar. RISK MANAGEMENT IN A TURBULENT SCENARIO AND FINANCIAL PERFORMANCE
Copersucar faces severe risks as a commodity business, particularly given its complex, global buying and selling structure. To manage these risks, the management team selected four priority risk categories to receive special attention: credit, liquidity, market, and operational risk. The company created an audit and risk committee that is responsible for risk management and reports to the administrative board. Due to the business’s sensitivity to this issue, Copersucar’s risk management policies obey strict rules and limits.
Credit risk involves receivables from clients. Its policies are to follow each client’s limit, select clients and regions, and other criteria. Normally, sugar for the domestic market is paid in twenty days, and ethanol in fifteen days. For international markets, most of the sales are on the condition of cash against documents. Additionally, Copersucar uses international banks’ credit insurances. More than 80% of Copersucar’s clients have more than five years of relationships and low historical losses.
Liquidity risk involves the capacity of Copersucar to face its debts and liabilities. The company’s policy is to face these obligations
FIGURE 8: COPERSUCAR'S GLOBAL OPERATIONS.
Source: Copersucar Annual Report, 2013/2014.
Copersucar Trading AVV(Aruba)
Eco-EnergyGlobalBiofuels LLC (EUA)
Copersucar International NV(Curaçao)
Copersucar Subsidiaries
Copersucar S.A. - São Paulo, Brasil
Sugar Express Transportes LTDA Copa Shipping do BrasilAgenciamento Marítimo LTDA
Terminal Açurareiro Copersucar (TAC) Santos, São Paulo
Terminal de Estufagem de Conteiners (TEC) Guarujá, São Paulo
Terminal Multimodal Copersucar I - Ribeirão Preto, São Paulo
Terminal Multimodal Copersucar II - São José do Rio Preto, São Paulo
Terminal Copersucar de Etanol (TCE) Paulínia, São Paulo
Main destinations
South Africa
Germany
Saudi Arabia
Algeria
Argentina
Austrália
Áustria
Bangladesh
Belgium
Brazil
Canada
China
Hong Kong
Colombia
Singapore
South Korea
Denmark
Egypt
United Arab Emirates
Spain
United States
Finland
France
Germany
Great Britain
Iemen
Cayman Islands
Seycheles
Indonesia
Japan
Malaysia
Morocos
Mauritania
Mexico
Netherlands
Peru
Sweden
Switzerland
Copa Shipping BVI(British Virgin Islands)
Copa Shipping DMCC (Dubai)
Copersucar Asia(Hong Kong)
Copersucar North America LLC (EUA)
Copersucar Europe IV (Netherlands)
242 243
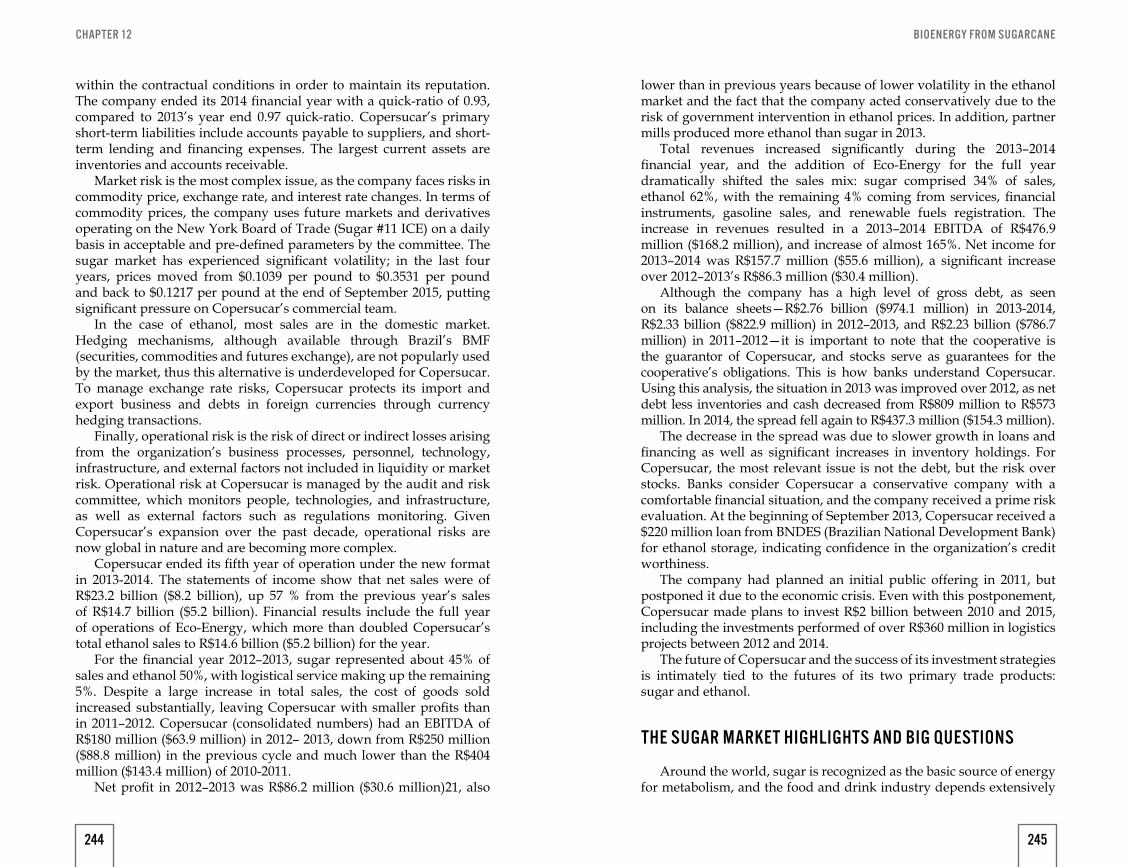
BIOENERGY FROM SUGARCANECHAPTER 12
within the contractual conditions in order to maintain its reputation. The company ended its 2014 financial year with a quick-ratio of 0.93, compared to 2013’s year end 0.97 quick-ratio. Copersucar’s primary short-term liabilities include accounts payable to suppliers, and short-term lending and financing expenses. The largest current assets are inventories and accounts receivable.
Market risk is the most complex issue, as the company faces risks in commodity price, exchange rate, and interest rate changes. In terms of commodity prices, the company uses future markets and derivatives operating on the New York Board of Trade (Sugar #11 ICE) on a daily basis in acceptable and pre-defined parameters by the committee. The sugar market has experienced significant volatility; in the last four years, prices moved from $0.1039 per pound to $0.3531 per pound and back to $0.1217 per pound at the end of September 2015, putting significant pressure on Copersucar’s commercial team.
In the case of ethanol, most sales are in the domestic market. Hedging mechanisms, although available through Brazil’s BMF (securities, commodities and futures exchange), are not popularly used by the market, thus this alternative is underdeveloped for Copersucar. To manage exchange rate risks, Copersucar protects its import and export business and debts in foreign currencies through currency hedging transactions.
Finally, operational risk is the risk of direct or indirect losses arising from the organization’s business processes, personnel, technology, infrastructure, and external factors not included in liquidity or market risk. Operational risk at Copersucar is managed by the audit and risk committee, which monitors people, technologies, and infrastructure, as well as external factors such as regulations monitoring. Given Copersucar’s expansion over the past decade, operational risks are now global in nature and are becoming more complex.
Copersucar ended its fifth year of operation under the new format in 2013-2014. The statements of income show that net sales were of R$23.2 billion ($8.2 billion), up 57 % from the previous year’s sales of R$14.7 billion ($5.2 billion). Financial results include the full year of operations of Eco-Energy, which more than doubled Copersucar’s total ethanol sales to R$14.6 billion ($5.2 billion) for the year.
For the financial year 2012–2013, sugar represented about 45% of sales and ethanol 50%, with logistical service making up the remaining 5%. Despite a large increase in total sales, the cost of goods sold increased substantially, leaving Copersucar with smaller profits than in 2011–2012. Copersucar (consolidated numbers) had an EBITDA of R$180 million ($63.9 million) in 2012– 2013, down from R$250 million ($88.8 million) in the previous cycle and much lower than the R$404 million ($143.4 million) of 2010-2011.
Net profit in 2012–2013 was R$86.2 million ($30.6 million)21, also
lower than in previous years because of lower volatility in the ethanol market and the fact that the company acted conservatively due to the risk of government intervention in ethanol prices. In addition, partner mills produced more ethanol than sugar in 2013.
Total revenues increased significantly during the 2013–2014 financial year, and the addition of Eco-Energy for the full year dramatically shifted the sales mix: sugar comprised 34% of sales, ethanol 62%, with the remaining 4% coming from services, financial instruments, gasoline sales, and renewable fuels registration. The increase in revenues resulted in a 2013–2014 EBITDA of R$476.9 million ($168.2 million), and increase of almost 165%. Net income for 2013–2014 was R$157.7 million ($55.6 million), a significant increase over 2012–2013’s R$86.3 million ($30.4 million).
Although the company has a high level of gross debt, as seen on its balance sheets—R$2.76 billion ($974.1 million) in 2013-2014, R$2.33 billion ($822.9 million) in 2012–2013, and R$2.23 billion ($786.7 million) in 2011–2012—it is important to note that the cooperative is the guarantor of Copersucar, and stocks serve as guarantees for the cooperative’s obligations. This is how banks understand Copersucar. Using this analysis, the situation in 2013 was improved over 2012, as net debt less inventories and cash decreased from R$809 million to R$573 million. In 2014, the spread fell again to R$437.3 million ($154.3 million).
The decrease in the spread was due to slower growth in loans and financing as well as significant increases in inventory holdings. For Copersucar, the most relevant issue is not the debt, but the risk over stocks. Banks consider Copersucar a conservative company with a comfortable financial situation, and the company received a prime risk evaluation. At the beginning of September 2013, Copersucar received a $220 million loan from BNDES (Brazilian National Development Bank) for ethanol storage, indicating confidence in the organization’s credit worthiness.
The company had planned an initial public offering in 2011, but postponed it due to the economic crisis. Even with this postponement, Copersucar made plans to invest R$2 billion between 2010 and 2015, including the investments performed of over R$360 million in logistics projects between 2012 and 2014.
The future of Copersucar and the success of its investment strategies is intimately tied to the futures of its two primary trade products: sugar and ethanol.
THE SUGAR MARKET HIGHLIGHTS AND BIG QUESTIONS
Around the world, sugar is recognized as the basic source of energy for metabolism, and the food and drink industry depends extensively
244 245
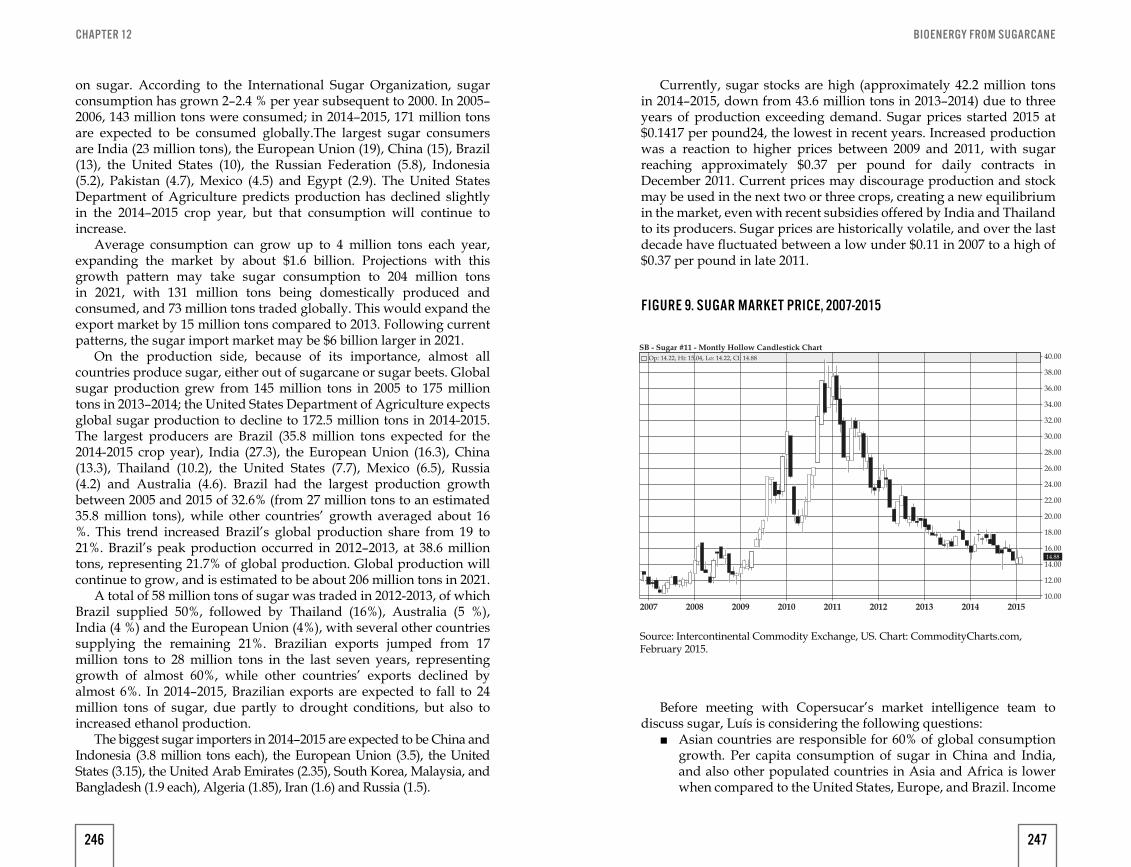
BIOENERGY FROM SUGARCANECHAPTER 12
on sugar. According to the International Sugar Organization, sugar consumption has grown 2–2.4 % per year subsequent to 2000. In 2005– 2006, 143 million tons were consumed; in 2014–2015, 171 million tons are expected to be consumed globally.The largest sugar consumers are India (23 million tons), the European Union (19), China (15), Brazil (13), the United States (10), the Russian Federation (5.8), Indonesia (5.2), Pakistan (4.7), Mexico (4.5) and Egypt (2.9). The United States Department of Agriculture predicts production has declined slightly in the 2014–2015 crop year, but that consumption will continue to increase.
Average consumption can grow up to 4 million tons each year, expanding the market by about $1.6 billion. Projections with this growth pattern may take sugar consumption to 204 million tons in 2021, with 131 million tons being domestically produced and consumed, and 73 million tons traded globally. This would expand the export market by 15 million tons compared to 2013. Following current patterns, the sugar import market may be $6 billion larger in 2021.
On the production side, because of its importance, almost all countries produce sugar, either out of sugarcane or sugar beets. Global sugar production grew from 145 million tons in 2005 to 175 million tons in 2013–2014; the United States Department of Agriculture expects global sugar production to decline to 172.5 million tons in 2014-2015. The largest producers are Brazil (35.8 million tons expected for the 2014-2015 crop year), India (27.3), the European Union (16.3), China (13.3), Thailand (10.2), the United States (7.7), Mexico (6.5), Russia (4.2) and Australia (4.6). Brazil had the largest production growth between 2005 and 2015 of 32.6% (from 27 million tons to an estimated 35.8 million tons), while other countries’ growth averaged about 16 %. This trend increased Brazil’s global production share from 19 to 21%. Brazil’s peak production occurred in 2012–2013, at 38.6 million tons, representing 21.7% of global production. Global production will continue to grow, and is estimated to be about 206 million tons in 2021.
A total of 58 million tons of sugar was traded in 2012-2013, of which Brazil supplied 50%, followed by Thailand (16%), Australia (5 %), India (4 %) and the European Union (4%), with several other countries supplying the remaining 21%. Brazilian exports jumped from 17 million tons to 28 million tons in the last seven years, representing growth of almost 60%, while other countries’ exports declined by almost 6%. In 2014–2015, Brazilian exports are expected to fall to 24 million tons of sugar, due partly to drought conditions, but also to increased ethanol production.
The biggest sugar importers in 2014–2015 are expected to be China and Indonesia (3.8 million tons each), the European Union (3.5), the United States (3.15), the United Arab Emirates (2.35), South Korea, Malaysia, and Bangladesh (1.9 each), Algeria (1.85), Iran (1.6) and Russia (1.5).
Currently, sugar stocks are high (approximately 42.2 million tons in 2014–2015, down from 43.6 million tons in 2013–2014) due to three years of production exceeding demand. Sugar prices started 2015 at $0.1417 per pound24, the lowest in recent years. Increased production was a reaction to higher prices between 2009 and 2011, with sugar reaching approximately $0.37 per pound for daily contracts in December 2011. Current prices may discourage production and stock may be used in the next two or three crops, creating a new equilibrium in the market, even with recent subsidies offered by India and Thailand to its producers. Sugar prices are historically volatile, and over the last decade have fluctuated between a low under $0.11 in 2007 to a high of $0.37 per pound in late 2011.
FIGURE 9. SUGAR MARKET PRICE, 2007-2015
2007 2008
SB - Sugar #11 - Montly Hollow Candlestick ChartOp: 14.22, Hi: 15.04, Lo: 14.22, CI: 14.88
2009 2010 2011 2012 2013 2014 2015
40.00
38.00
36.00
34.00
32.00
30.00
28.00
26.00
24.00
22.00
20.00
18.00
16.00
14.00
12.00
10.00
14.88
Source: Intercontinental Commodity Exchange, US. Chart: CommodityCharts.com, February 2015.
Before meeting with Copersucar’s market intelligence team to discuss sugar, Luís is considering the following questions:
■ Asian countries are responsible for 60% of global consumption growth. Per capita consumption of sugar in China and India, and also other populated countries in Asia and Africa is lower when compared to the United States, Europe, and Brazil. Income
246 247
BIOENERGY FROM SUGARCANECHAPTER 12
growth and urbanization that drives the market of soft drinks, chocolate, sweets, juices and other products that use sugar may bring huge impacts to these regions. For example, China’s 2012 per capita consumption of 24 pounds is 44 % of the world’s 2012 average.
■ India was responsible for the major sugar price volatility, due to its production variation and also its high consumption. With land pressures and the need to produce more grains for its domestic consumers, will India have the capacity to expand sugar production to meet its demand, or will the country focus on other crops for its growing population, consolidating itself as a net sugar importer?
■ Some sugar-producing countries are adopting mandates to blend ethanol to gasoline. India started a 5% blend in 2013 and other countries such as Thailand, the European Union, Australia, Mexico and Brazil either already have or are discussing mandates. How will these affect sugar production as they will create ethanol markets that compete for sugarcane and sugar beets?
■ With current sugar prices, production is not economically feasible in some areas and for some industrial groups. Which industries (such as oil, food, and trading companies) and countries will be able to consolidate and lead sugar expansion in a total, low-cost basis (production and logistics), taking advantage of the growth of import markets?
■ Which new plants or production technologies might provide a breakthrough in the relatively old-fashioned and traditional sugar industry?
■ Although sugarcane has lower production costs than sugar beets and other sources, will substitute products, such as a sweetener with its own price and cost structure, take market share from sugarcane?
■ The European Union highly subsidizes sugar beet production. What will happen in the coming years with the reform of the Common Agricultural Policy, and how will this affect European Union production and consumption balance?
■ Brazil is the largest player in the sugar market. Approximately 40 to 60 % of Brazilian sugarcane goes to ethanol, which is consumed mostly in the domestic market for Brazil’s growing fleet of flex-fuel vehicles. Will ethanol be competitive with gasoline, diverting more cane to E100 ethanol (pure ethanol) in the future and removing some sugar from the international market?
■ How will climate changes and general weather conditions impact the production capacities of different regions?
■ As ethanol can be produced from both corn and sugarcane, there is a growing relationship in their prices. How will future corn prices affect sugar prices and consumption? In the same way, gasoline competes directly with ethanol as fuel, and ethanol is also directly linked to sugar. How will oil prices affect sugar prices and consumption?
Regarding the domestic market, Brazilian sugar production has experienced almost continuous growth in the last 20 years. The sector represents 2% of the country’s GDP and in 2014, exports totaled $13.2 billion, generating significant tax revenues and employment.
Retail sugar sales to consumers comprise 40% of total consumption, while industry sales are responsible for 60% of domestic demand. Within industry, 20% of total demand is used for producing soft drinks and 10% for producing candy and chocolate. Brazil’s per capita chocolate consumption is 15 times lower than in Sweden and ten times lower than in the United States, and per capita consumption of soft drinks in Brazil is one-fourth that of the United States, indicating there is still room for growth in sugar consumption through industrialized products.
In 2013–2014, Copersucar traded about 8.6 million tons of sugar, up 10% from 2012–2013’s production of 7.8 million tons. The company exported 6.9 million tons, over 13% more than 2012–2013, to about twenty-five clients, mostly refiners. In the Latin American market, Copersucar has about 330 clients, the majority of whom are in the food industry.
According to Luís, of the total 73 million tons of sugar to be traded in 2021-2022, Brazil may provide about 37 million tons, representing over 10 million tons of new export opportunities. Together with the 2.5 million tons traded in Brazil’s domestic market, the sugar opportunity in 2021–2022 will total approximately 12.5 million tons. Copersucar will be able to act in a market that may be $4.28 billion larger. Luís is not considering Copersucar Asia in these numbers, as the subsidiary may source sugar from other countries.
Important to the growth and future of Copersucar is the Brazilian Real to US Dollar exchange rate. At the end of February 2014, the exchange rate was R$1 (BRL) = $0.427 (USD); at the end of February 2015, the rate had fallen to R$1 = $0.349, a decline of over 18%. The decline reflects not only a strengthening of US dollar over the period, but also international concern over the Brazilian economy, and thus a weakening Real.Luís worries about the sugar business; however, with some careful considerations, he can predict with relative certainty what the sugar market will do. This is not the case for ethanol, where the market is driven by external forces. The uncertainty surrounding the ethanol
248 249
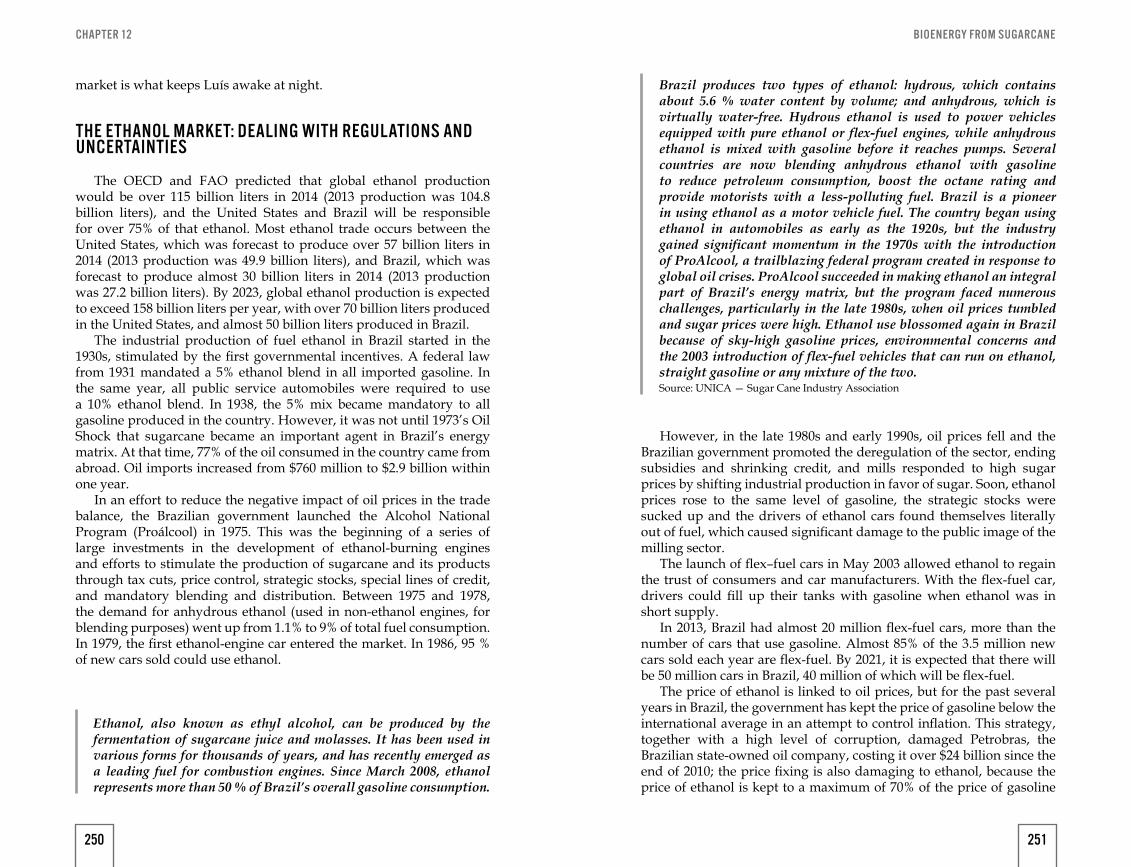
BIOENERGY FROM SUGARCANECHAPTER 12
market is what keeps Luís awake at night.
THE ETHANOL MARKET: DEALING WITH REGULATIONS AND UNCERTAINTIES
The OECD and FAO predicted that global ethanol production would be over 115 billion liters in 2014 (2013 production was 104.8 billion liters), and the United States and Brazil will be responsible for over 75% of that ethanol. Most ethanol trade occurs between the United States, which was forecast to produce over 57 billion liters in 2014 (2013 production was 49.9 billion liters), and Brazil, which was forecast to produce almost 30 billion liters in 2014 (2013 production was 27.2 billion liters). By 2023, global ethanol production is expected to exceed 158 billion liters per year, with over 70 billion liters produced in the United States, and almost 50 billion liters produced in Brazil.
The industrial production of fuel ethanol in Brazil started in the 1930s, stimulated by the first governmental incentives. A federal law from 1931 mandated a 5% ethanol blend in all imported gasoline. In the same year, all public service automobiles were required to use a 10% ethanol blend. In 1938, the 5% mix became mandatory to all gasoline produced in the country. However, it was not until 1973’s Oil Shock that sugarcane became an important agent in Brazil’s energy matrix. At that time, 77% of the oil consumed in the country came from abroad. Oil imports increased from $760 million to $2.9 billion within one year.
In an effort to reduce the negative impact of oil prices in the trade balance, the Brazilian government launched the Alcohol National Program (Proálcool) in 1975. This was the beginning of a series of large investments in the development of ethanol-burning engines and efforts to stimulate the production of sugarcane and its products through tax cuts, price control, strategic stocks, special lines of credit, and mandatory blending and distribution. Between 1975 and 1978, the demand for anhydrous ethanol (used in non-ethanol engines, for blending purposes) went up from 1.1% to 9% of total fuel consumption. In 1979, the first ethanol-engine car entered the market. In 1986, 95 % of new cars sold could use ethanol.
Ethanol, also known as ethyl alcohol, can be produced by the fermentation of sugarcane juice and molasses. It has been used in various forms for thousands of years, and has recently emerged as a leading fuel for combustion engines. Since March 2008, ethanol represents more than 50 % of Brazil’s overall gasoline consumption.
However, in the late 1980s and early 1990s, oil prices fell and the Brazilian government promoted the deregulation of the sector, ending subsidies and shrinking credit, and mills responded to high sugar prices by shifting industrial production in favor of sugar. Soon, ethanol prices rose to the same level of gasoline, the strategic stocks were sucked up and the drivers of ethanol cars found themselves literally out of fuel, which caused significant damage to the public image of the milling sector.
The launch of flex–fuel cars in May 2003 allowed ethanol to regain the trust of consumers and car manufacturers. With the flex-fuel car, drivers could fill up their tanks with gasoline when ethanol was in short supply.
In 2013, Brazil had almost 20 million flex-fuel cars, more than the number of cars that use gasoline. Almost 85% of the 3.5 million new cars sold each year are flex-fuel. By 2021, it is expected that there will be 50 million cars in Brazil, 40 million of which will be flex-fuel.
The price of ethanol is linked to oil prices, but for the past several years in Brazil, the government has kept the price of gasoline below the international average in an attempt to control inflation. This strategy, together with a high level of corruption, damaged Petrobras, the Brazilian state-owned oil company, costing it over $24 billion since the end of 2010; the price fixing is also damaging to ethanol, because the price of ethanol is kept to a maximum of 70% of the price of gasoline
Brazil produces two types of ethanol: hydrous, which contains about 5.6 % water content by volume; and anhydrous, which is virtually water-free. Hydrous ethanol is used to power vehicles equipped with pure ethanol or flex-fuel engines, while anhydrous ethanol is mixed with gasoline before it reaches pumps. Several countries are now blending anhydrous ethanol with gasoline to reduce petroleum consumption, boost the octane rating and provide motorists with a less-polluting fuel. Brazil is a pioneer in using ethanol as a motor vehicle fuel. The country began using ethanol in automobiles as early as the 1920s, but the industry gained significant momentum in the 1970s with the introduction of ProAlcool, a trailblazing federal program created in response to global oil crises. ProAlcool succeeded in making ethanol an integral part of Brazil’s energy matrix, but the program faced numerous challenges, particularly in the late 1980s, when oil prices tumbled and sugar prices were high. Ethanol use blossomed again in Brazil because of sky-high gasoline prices, environmental concerns and the 2003 introduction of flex-fuel vehicles that can run on ethanol, straight gasoline or any mixture of the two.Source: UNICA — Sugar Cane Industry Association
250 251
BIOENERGY FROM SUGARCANECHAPTER 12
since ethanol gets lower miles per gallon. At the end of 2014, Petrobras was forced to raise the wholesale price of gas by 3% and diesel by 5%, which portends increasing inflation throughout the economy. In 2015, the Brazilian Government, in an effort to bring some equilibrium to their fiscal situation, raised taxes on gasoline and diesel (called CIDE), resulting in a price increase of approximately $0.10 per liter.
In some cases, to compensate for price changes, the Brazilian government can alter the blending level of anhydrous ethanol in gasoline, and it ranges from 18 to 27%, depending on sugarcane production.
The story of ethanol in the United States is equally interesting, although much shorter. In 2005, the Environmental Protection Agency (EPA) created the renewable fuels standard (RFS). The objective was to use 36 billion gallons of renewable fuel by 2022, corresponding to 23% of consumption. The RFS2 was delivered in 2007, which differentiated between the sources of ethanol and considered greenhouse gas emissions.
Ethanol in the United States is also linked to public policy. Until the end of 2011, oil companies received a blending credit of $0.45 per gallon ($0.119 per liter), called the VEETC — Volumetric Ethanol Exercise Tax Credit. The VEETC was eliminated on January 1, 2012. At the same time, the ethanol import tariff of $0.54 per gallon ($0.142 per liter) was eliminated, resulting in a more open and competitive ethanol market within the United States.
Although ethanol uses less than 5% of the world’s grain production, almost 40% of US corn goes to ethanol production, generating significant complaints from meat producers. Because of this, communicating about ethanol in the United States is much more challenging than in Brazil.
The mandate in the United States fixed an ethanol target of 13.8 billion gallons for 2013 and 14.4 billion gallons for 2014. But with gasoline consumption declining from 142 billion gallons in 2007 to 135.6 billion gallons in 2013 (although lower gasoline prices in 2015 will likely increase consumption), and a maximum ethanol to gasoline blend level of 10%, the blend wall is lower than the fixed ethanol target. In 2011, the Environmental Protection Agency approved a blend of 15% ethanol (E15) for sale at clearly advertised and separate pumps, but only for cars manufactured after 2001. These challenges made E15 implementation more difficult; as such, it can be found in less than fifty gas stations around the United States.
In his meetings with the Copersucar and the Eco-Energy market intelligence team, Luís is considering some important questions about the future of ethanol:
■ In late 2013, the US Energy Information Administration predicted that in 2014, China would be a larger net importer
of oil than the US. With the extensive sales of new cars, and oil consumption in the growing truck fleet, it is expected that in 2020, 70% of China’s oil needs will come from imports of about $500 billion per year. The number of cars will jump from 20 million in 2005 to 160 million in 2020.29 What will be China’s influence in oil prices and the role of ethanol, particularly as the largest Chinese cities already face severe pollution challenges?
■ Concerns regarding environmental issues, global warming and the instability of oil prices have led a growing number of countries to add ethanol to their fuel matrix. What should we expect? Will this movement continue creating blending markets for ethanol all over the world?
■ India created a “Green Initiative” that mandates a 5% ethanol blend to gasoline. Many in India see the mandate as a transfer of wealth from oil companies to sugar producers. What will be the future of ethanol in India? With a significant sugarcane crop, and given current sugar prices, will India have a more aggressive policy on ethanol to substitute oil imports, copying Brazilian policies?
■ The future of the US ethanol mandate is often questioned by the media and targeted for change or elimination by politicians. If changes occur, how could they impact the future domestic consumption of ethanol? Will E85 be economically feasible and serve the 11 million flex-fuel cars (out of a total of 240 million cars) on the road in the United States? If the amount produced in the United States exceeds the blending target, will US exports of ethanol be economically attractive? Classified by the EPA as an advanced fuel, and receiving special tax treatment, what will be the role of sugarcane ethanol in the United States?
■ There are several promising sugarcane production innovations in the pipeline – will innovation in sugarcane production result in the ability to produce three or four times more ethanol using the same sugarcane production acreage, making ethanol more competitive?
■ If 50 % of Brazil’s Flex-Fuel cars used hydrous ethanol, the market could be up to 33.6 billion liters by 2021. A 27% blend of anhydrous ethanol blended to gasoline could create a market of 14 billion liters by 2021, up from 8.4 billion in 2013. What will happen in the domestic Brazilian ethanol market? Will it serve flex-fuel car drivers?
■ Will cellulosic ethanol be feasible in the short term, challenging the feedstock used today to produce ethanol, such as sugarcane, corn, and beets?
■ What will be the impact of shale gas on the US ethanol market and in the global market in the long term? The Brent Crude
252 253
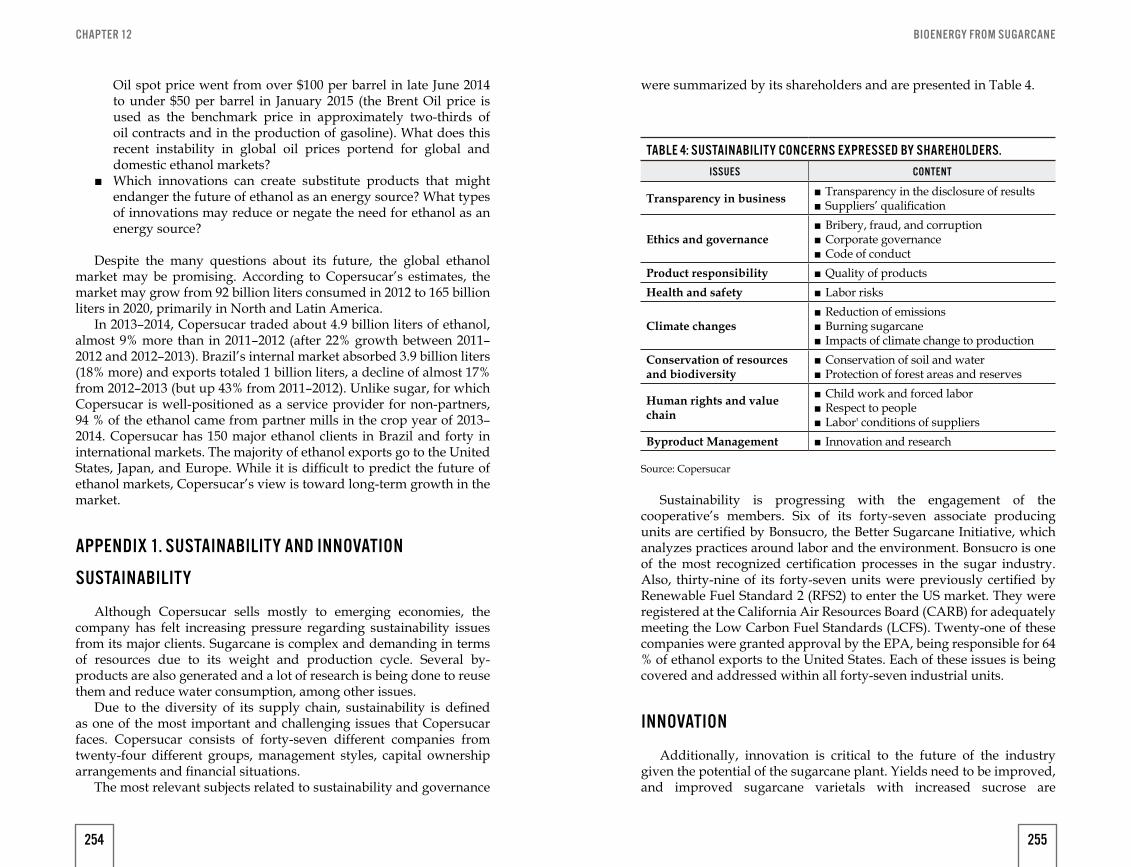
BIOENERGY FROM SUGARCANECHAPTER 12
Oil spot price went from over $100 per barrel in late June 2014 to under $50 per barrel in January 2015 (the Brent Oil price is used as the benchmark price in approximately two-thirds of oil contracts and in the production of gasoline). What does this recent instability in global oil prices portend for global and domestic ethanol markets?
■ Which innovations can create substitute products that might endanger the future of ethanol as an energy source? What types of innovations may reduce or negate the need for ethanol as an energy source?
Despite the many questions about its future, the global ethanol market may be promising. According to Copersucar’s estimates, the market may grow from 92 billion liters consumed in 2012 to 165 billion liters in 2020, primarily in North and Latin America.
In 2013–2014, Copersucar traded about 4.9 billion liters of ethanol, almost 9% more than in 2011–2012 (after 22% growth between 2011–2012 and 2012–2013). Brazil’s internal market absorbed 3.9 billion liters (18% more) and exports totaled 1 billion liters, a decline of almost 17% from 2012–2013 (but up 43% from 2011–2012). Unlike sugar, for which Copersucar is well-positioned as a service provider for non-partners, 94 % of the ethanol came from partner mills in the crop year of 2013–2014. Copersucar has 150 major ethanol clients in Brazil and forty in international markets. The majority of ethanol exports go to the United States, Japan, and Europe. While it is difficult to predict the future of ethanol markets, Copersucar’s view is toward long-term growth in the market.
APPENDIX 1. SUSTAINABILITY AND INNOVATION
SUSTAINABILITY
Although Copersucar sells mostly to emerging economies, the company has felt increasing pressure regarding sustainability issues from its major clients. Sugarcane is complex and demanding in terms of resources due to its weight and production cycle. Several by-products are also generated and a lot of research is being done to reuse them and reduce water consumption, among other issues.
Due to the diversity of its supply chain, sustainability is defined as one of the most important and challenging issues that Copersucar faces. Copersucar consists of forty-seven different companies from twenty-four different groups, management styles, capital ownership arrangements and financial situations.
The most relevant subjects related to sustainability and governance
Sustainability is progressing with the engagement of the cooperative’s members. Six of its forty-seven associate producing units are certified by Bonsucro, the Better Sugarcane Initiative, which analyzes practices around labor and the environment. Bonsucro is one of the most recognized certification processes in the sugar industry. Also, thirty-nine of its forty-seven units were previously certified by Renewable Fuel Standard 2 (RFS2) to enter the US market. They were registered at the California Air Resources Board (CARB) for adequately meeting the Low Carbon Fuel Standards (LCFS). Twenty-one of these companies were granted approval by the EPA, being responsible for 64 % of ethanol exports to the United States. Each of these issues is being covered and addressed within all forty-seven industrial units.
INNOVATION
Additionally, innovation is critical to the future of the industry given the potential of the sugarcane plant. Yields need to be improved, and improved sugarcane varietals with increased sucrose are
were summarized by its shareholders and are presented in Table 4.
TABLE 4: SUSTAINABILITY CONCERNS EXPRESSED BY SHAREHOLDERS.ISSUES CONTENT
Transparency in business ■ Transparency in the disclosure of results ■ Suppliers’ qualification
Ethics and governance ■ Bribery, fraud, and corruption ■ Corporate governance ■ Code of conduct
Product responsibility ■ Quality of productsHealth and safety ■ Labor risks
Climate changes ■ Reduction of emissions ■ Burning sugarcane ■ Impacts of climate change to production
Conservation of resources and biodiversity
■ Conservation of soil and water ■ Protection of forest areas and reserves
Human rights and value chain
■ Child work and forced labor ■ Respect to people ■ Labor' conditions of suppliers
Byproduct Management ■ Innovation and research
Source: Copersucar
254 255
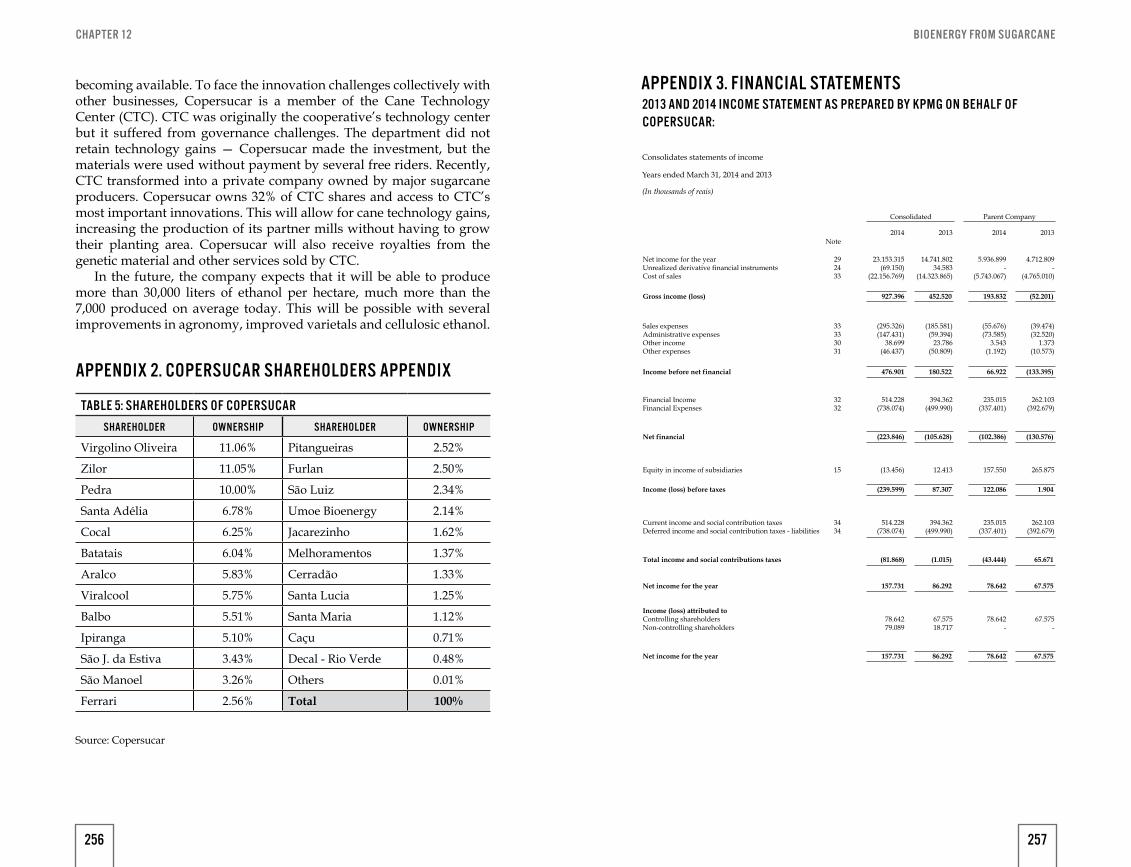
BIOENERGY FROM SUGARCANECHAPTER 12
becoming available. To face the innovation challenges collectively with other businesses, Copersucar is a member of the Cane Technology Center (CTC). CTC was originally the cooperative’s technology center but it suffered from governance challenges. The department did not retain technology gains — Copersucar made the investment, but the materials were used without payment by several free riders. Recently, CTC transformed into a private company owned by major sugarcane producers. Copersucar owns 32% of CTC shares and access to CTC’s most important innovations. This will allow for cane technology gains, increasing the production of its partner mills without having to grow their planting area. Copersucar will also receive royalties from the genetic material and other services sold by CTC.
In the future, the company expects that it will be able to produce more than 30,000 liters of ethanol per hectare, much more than the 7,000 produced on average today. This will be possible with several improvements in agronomy, improved varietals and cellulosic ethanol.
APPENDIX 2. COPERSUCAR SHAREHOLDERS APPENDIX
TABLE 5: SHAREHOLDERS OF COPERSUCARSHAREHOLDER OWNERSHIP SHAREHOLDER OWNERSHIP
Virgolino Oliveira 11.06% Pitangueiras 2.52%
Zilor 11.05% Furlan 2.50%
Pedra 10.00% São Luiz 2.34%
Santa Adélia 6.78% Umoe Bioenergy 2.14%
Cocal 6.25% Jacarezinho 1.62%
Batatais 6.04% Melhoramentos 1.37%
Aralco 5.83% Cerradão 1.33%
Viralcool 5.75% Santa Lucia 1.25%
Balbo 5.51% Santa Maria 1.12%
Ipiranga 5.10% Caçu 0.71%
São J. da Estiva 3.43% Decal - Rio Verde 0.48%
São Manoel 3.26% Others 0.01%
Ferrari 2.56% Total 100%
Source: Copersucar
APPENDIX 3. FINANCIAL STATEMENTS
Consolidates statements of income
Years ended March 31, 2014 and 2013
Consolidated
2014Note
2013 2014 2013
Net income for the yearUnrealized derivative financial instrumentsCost of sales
292433
23.153.315(69.150)
(22.156.769)
927.396Gross income (loss)
14.741.80234.583
(14.323.865)
5.936.899-
(5.743.067)
4.712.809-
(4.765.010)
Parent Company
(In thousands of reais)
452.520 193.832 (52.201)
Financial IncomeFinancial Expenses
3232
514.228(738.074)
(223.846)Net financial
394.362(499.990)
235.015(337.401)
262.103(392.679)
(105.628) (102.386) (130.576)
Income (loss) attributed toControlling shareholdersNon-controlling shareholders
78.64279.089
157.731Net income for the year
67.57518.717
78.642-
67.575-
86.292 78.642 67.575
Current income and social contribution taxesDeferred income and social contribution taxes - liabilities
3434
514.228(738.074)
(81.868)Total income and social contributions taxes
394.362(499.990)
235.015(337.401)
262.103(392.679)
(1.015) (43.444) 65.671
157.731Net income for the year 86.292 78.642 67.575
Equity in income of subsidiaries 15 (13.456)
(239.599)Income (loss) before taxes
12.413 157.550 265.875
87.307 122.086 1.904
Sales expensesAdministrative expensesOther incomeOther expenses
33333031
(295.326)(147.431)
38.699(46.437)
476.901Income before net financial
(185.581)(59.394)
23.786(50.809)
(55.676)(73.585)
3.543(1.192)
(39.474)(32.520)
1.373(10.573)
180.522 66.922 (133.395)
2013 AND 2014 INCOME STATEMENT AS PREPARED BY KPMG ON BEHALF OF COPERSUCAR:
256 257
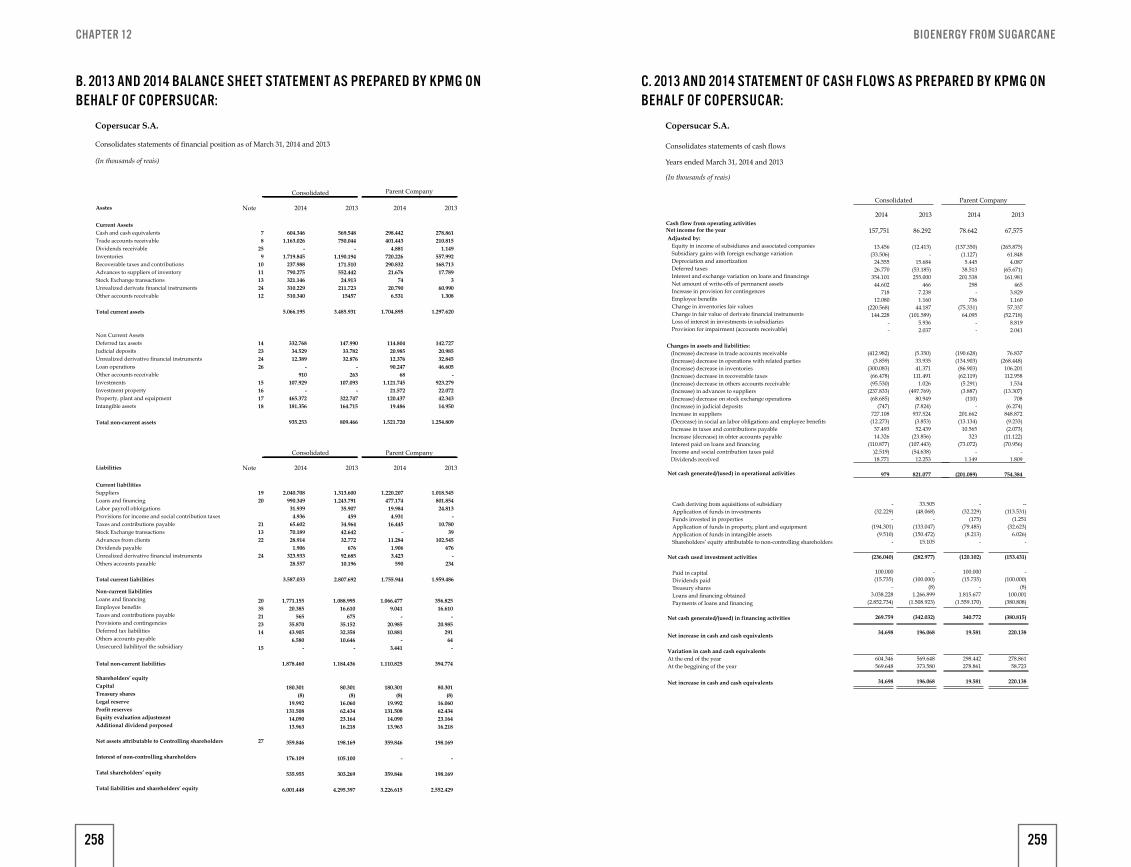
BIOENERGY FROM SUGARCANECHAPTER 12
B. 2013 AND 2014 BALANCE SHEET STATEMENT AS PREPARED BY KPMG ON BEHALF OF COPERSUCAR:
Consolidates statements of financial position as of March 31, 2014 and 2013
Consolidated
2014Note
78
259
1011132412
604.3461.163.026
-1.719.845
237.988790.275321.146310.229510.340
5.066.195
278.861210.815
1.149557.992168.713
17.7893
60.9901.308
1.297.620
298.442401.443
4.881720.226290.832
21.67674
20.7906.531
1.704.895
569.548750.044
-1.190.194
171.510552.442
24.913211.723
15457
3.485.931
332.76834.52912.389
-910
107.929-
465.372181.356
935.253
142.72720.98532.84546.605
-923.279
22.07242.34314.950
1.254.809
114.80420.98512.37690.247
681.121.745
21.572120.437
19.486
1.521.720
147.99033.78232.876
-263
107.093-
322.747164.715
809.466
14232426
15161718
2013 2014 2013Asstes
Total current assets
Total non-current assets
Current AssetsCash and cash equivalentsTrade accounts receivableDividends receivableInventoriesRecoverable taxes and contributionsAdvances to suppliers of inventoryStock Exchange transactionsUnrealized derivate financial instrumentsOther accounts receivable
Non Current AssetsDeferred tax assetsJudicial depositsUnrealized derivative financial instrumentsLoan operationsOther accounts receivableInvestmentsInvestment propertyProperty, plant and equipmentIntangible assets
Parent Company
(In thousands of reais)
Copersucar S.A.
Consolidated Parent Company
2014Note
1920
211322
24
2.040.708990.349
31.9394.936
65.60270.18928.914
1.906323.933
28.557
3.587.033
1.018.545801.854
24.813-
10.78039
102.545676
-234
1.959.486
1.220.207477.174
19.9844.931
16.445-
11.2841.9063.423
590
1.755.944
1.313.6001.243.791
35.907459
34.96442.64232.772
67692.68510.196
2.807.692
2035212314
15
1.771.15520.385
56535.87043.905
6.580-
1.878.460
356.82516.610
-20.985
29164
-
394.774
1.066.4779.041
-20.98510.881
-3.441
1.110.825
1.088.99516.610
67535.15232.35810.646
-
1.184.436
27
180.301(8)
19.992131.508
14.09013.963
359.846
176.109
535.955
6.001.448
80.301(8)
16.06062.43423.16416.218
198.169
-
198.169
2.552.429
180.301(8)
19.992131.508
14.09013.963
359.846
-
359.846
3.226.615
80.301(8)
16.06062.43423.16416.218
198.169
105.100
303.269
4.295.397
2013 2014 2013Liabilities
Total current liabilities
Total non-current liabilities
Current liabilitiesSuppliersLoans and financingLabor payroll obloigationsProvisions for income and social contribution taxesTaxes and contributions payableStock Exchange transactionsAdvances from clientsDividends payableUnrealized derivative financial instrumentsOthers accounts pauable
Non-current liabilitiesLoans and financingEmployee benefitsTaxes and contributions payableProvisions and contingenciesDeferred tax liabilitiesOthers accounts payableUnsecured liabilityof the subsidiary
Shareholders’ equityCapitalTreasury sharesLegal reserveProfit reservesEquity evaluation adjustmentAdditional dividend porposed
Net assets attributable to Controlling shareholders
Interest of non-controlling shareholders
Tatal shareholders’ equity
Total liabilities and shareholders’ equity
C. 2013 AND 2014 STATEMENT OF CASH FLOWS AS PREPARED BY KPMG ON BEHALF OF COPERSUCAR:
Consolidates statements of cash flows
Years ended March 31, 2014 and 2013
Consolidated
2014
157,751 78.642 67,57586.292
(265.875)61.8484.087
(65.671)161.981
4653.8291.160
57.337(52.718)
8.8192.041
(137.350)(1.127)
5.44538.513
201.538298
-736
(75.331)64.095
--
(12.413)-
15.684(53.185)255.000
4667.2381.160
44.187(101.589)
5.9362.037
13.456(33.506)
24.55526.770
354.10144.602
71812.080
(220.568)144.228
--
76.837(268.448)
106.201112.958
1.534(13.307)
708(6.274)
848.872(9.233)(2.073)
(11.122)(70.956)
-1.809
754.384
(190.628)(134.903)(86.903)(62.119)(5.291)(3.887)
(110)-
201.662(13.134)
10.565323
(73.072)-
1.149
(201.089)
(5.350)33.93541.371
111.4911.026
(497.769)80.949(7.824)
937.524(3.853)52.439
(23.856)(107.443)(54.638)
12.253
821.077
(412.982)(3.859)
(300.083)(66.478)(95.530)
(237.833)(68.685)
(747)727.108(12.273)
37.49314.326
(110.877))2.519)18.771
979
--(113.531)
(1.251(32.623)
6.026)-
(153.431)
-(32.229)
(175)(79.485)(8.213)
-
(120.102)
33.505(48.068)
-(133.047)(150.472)
15.105
(282.977)
-(32.229)
-(194.301)
(9.510)-
(236.040)
-(100.000)
(8)100.001
(380.808)
(380.815)
220.138
100.000(15.735)
-1.815.677
(1.559.170)
340.772
19.581
-(100.000)
(8)1.266.899
(1.508.923)
(342.032)
196.068
100.000(15.735)
-3.038.228
(2.852.734)
269.759
34.698
278.86158.723
220.138
298.442278.861
19.581
569.648373.580
196.068
604.346569.648
34.698
2013 2014 2013Cash flow from operating activitiesNet income for the yearAdjusted by: Equity in income of subsidiares and associated companies Subsidiary gains with foreign exchange variation Depreciation and amortization Deferred taxes Interest and exchange variation on loans and financings Net amount of write-offs of permanent assets Increase in provision for contingences Employee benefits Change in inventories fair values Change in fair value of derivate financial instruments Loss of interest in investments in subsidiaries Provision for impairment (accounts receivable)
Changes in assets and liabilities: (Increase) decrease in trade accounts receivable (Increase) decrease in operations with related parties (Increase) decrease in inventories (Increase) decrease in recoverable taxes (Increase) decrease in others accounts receivable (Increase) in advances to suppliers (Increase) decrease on stock exchange operations (Increase) in judicial deposits Increase in suppliers (Decrease) in social an labor obligations and employee benefits Increase in taxes and contributions payable Increase (decrease) in ohter accounts payable Interest paid on loans and financing Income and social contribution taxes paid Dividends received
Cash deriving from aquisitions of subsidiaryApplication of funds in investmentsFunds invested in propertiesApplication of funds in property, plant and equipmentApplication of funds in intangible assetsShareholders’ equity attributable to non-controlling shareholders
Paid in capitalDividends paidTreasury sharesLoans and financing obtainedPayments of loans and financing
Variation in cash and cash equivalentsAt the end of the yearAt the beggining of the year
Net cash generated/(used) in operational activities
Net cash generated/(used) in financing activities
Net cash used investment activities
Net increase in cash and cash equivalents
Net increase in cash and cash equivalents
Parent Company
(In thousands of reais)
Copersucar S.A.
258 259
BIOENERGY FROM SUGARCANE
BY MARCOS FAVA NEVES AND RAFAEL BORDONAL KALAKI
SOCIOECONOMIC SCENARIO OF THE SUGAR-ENERGY SECTOR: A VISION OF THE FUTURE
13
BIOENERGY FROM SUGARCANE
MAIN TRENDS
The main trends of the sector will be presented on this topic. For didatic purposes, it was decided to separate them according to the main products of the chain.
SUGARCANE
According to estimates for the year 2030 made by the authors of this chapter, Brazil will have a production of 942.75 million tons of sugarcane, with an average productivity of 148.08 kg of ATR per ton of sugarcane and a production of 100 tons of sugarcane per hectare, reaching 11.8 million hectares cultivated (considering a renewal rate of 20%).
Concerning the innovations planned for sugarcane, there are several possibilities such as the development of a herbicide-tolerant sugarcane, innovations in biological control, sugarcane seeds that can generate production gains by reducing crop failures and costs, development of new genes with photosynthetic efficiency, higher sugar content and drought tolerance, high technology seeking to reduce the number of machines and people involved in planting and harvesting, and the achievement of a higher production rate.
SUGAR
According to the OECD-FAO (2016), the forecast for 2025 is a production of 210.03 million tons. The growth will be 23% in less than a decade, which is something that has not happened in the last period since the growth of the last crop was 0.4%. By 2030, the authors estimate growth of 36.4%, reaching 232.9 million tons (Graph 10).
263
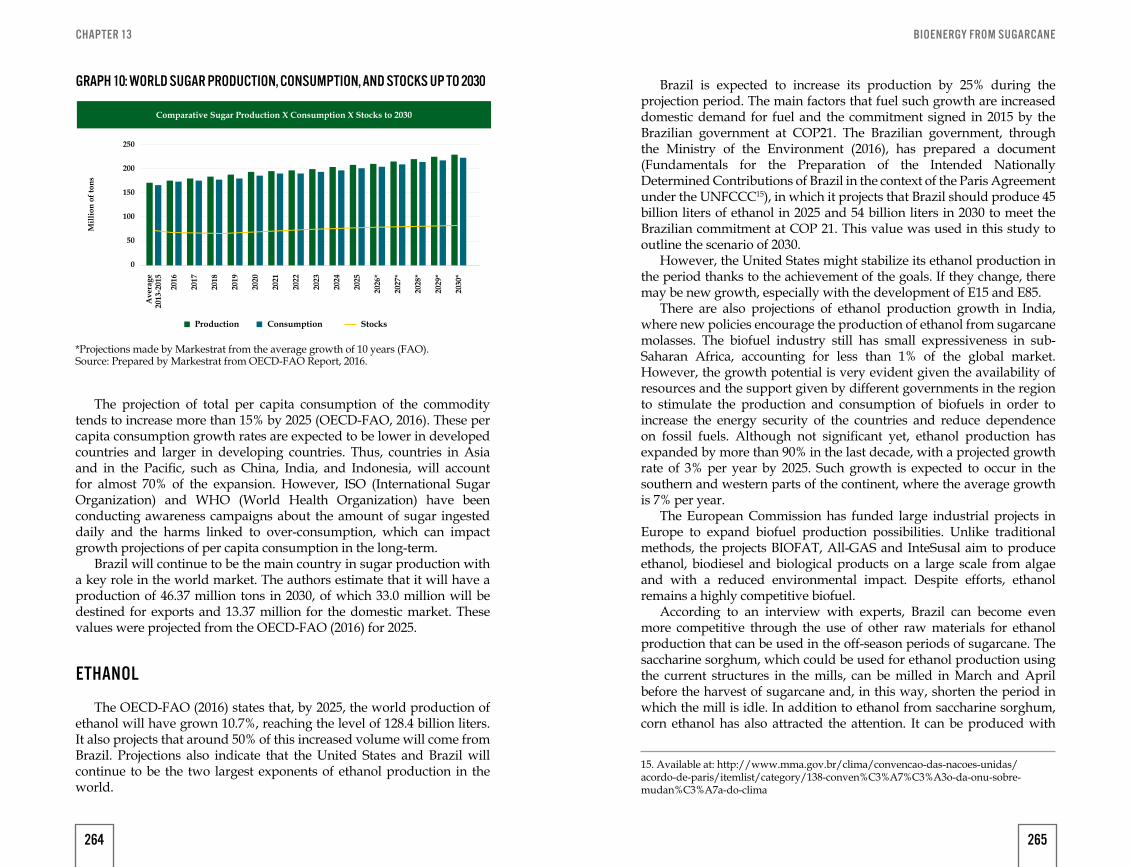
BIOENERGY FROM SUGARCANECHAPTER 13
The projection of total per capita consumption of the commodity tends to increase more than 15% by 2025 (OECD-FAO, 2016). These per capita consumption growth rates are expected to be lower in developed countries and larger in developing countries. Thus, countries in Asia and in the Pacific, such as China, India, and Indonesia, will account for almost 70% of the expansion. However, ISO (International Sugar Organization) and WHO (World Health Organization) have been conducting awareness campaigns about the amount of sugar ingested daily and the harms linked to over-consumption, which can impact growth projections of per capita consumption in the long-term.
Brazil will continue to be the main country in sugar production with a key role in the world market. The authors estimate that it will have a production of 46.37 million tons in 2030, of which 33.0 million will be destined for exports and 13.37 million for the domestic market. These values were projected from the OECD-FAO (2016) for 2025.
ETHANOL
The OECD-FAO (2016) states that, by 2025, the world production of ethanol will have grown 10.7%, reaching the level of 128.4 billion liters. It also projects that around 50% of this increased volume will come from Brazil. Projections also indicate that the United States and Brazil will continue to be the two largest exponents of ethanol production in the world.
Comparative Sugar Production X Consumption X Stocks to 2030
250
200
150
100
50
0
Mill
ion
of to
ns
Ave
rage
2013
-201
5
2016
2017
2018
2019
2020
2021
2022
2023
2024
2025
2026
*
2027
*
2028
*
2029
*
2030
*
Production Consumption Stocks
GRAPH 10: WORLD SUGAR PRODUCTION, CONSUMPTION, AND STOCKS UP TO 2030
*Projections made by Markestrat from the average growth of 10 years (FAO).Source: Prepared by Markestrat from OECD-FAO Report, 2016.
15. Available at: http://www.mma.gov.br/clima/convencao-das-nacoes-unidas/acordo-de-paris/itemlist/category/138-conven%C3%A7%C3%A3o-da-onu-sobre-mudan%C3%A7a-do-clima
Brazil is expected to increase its production by 25% during the projection period. The main factors that fuel such growth are increased domestic demand for fuel and the commitment signed in 2015 by the Brazilian government at COP21. The Brazilian government, through the Ministry of the Environment (2016), has prepared a document (Fundamentals for the Preparation of the Intended Nationally Determined Contributions of Brazil in the context of the Paris Agreement under the UNFCCC15), in which it projects that Brazil should produce 45 billion liters of ethanol in 2025 and 54 billion liters in 2030 to meet the Brazilian commitment at COP 21. This value was used in this study to outline the scenario of 2030.
However, the United States might stabilize its ethanol production in the period thanks to the achievement of the goals. If they change, there may be new growth, especially with the development of E15 and E85.
There are also projections of ethanol production growth in India, where new policies encourage the production of ethanol from sugarcane molasses. The biofuel industry still has small expressiveness in sub-Saharan Africa, accounting for less than 1% of the global market. However, the growth potential is very evident given the availability of resources and the support given by different governments in the region to stimulate the production and consumption of biofuels in order to increase the energy security of the countries and reduce dependence on fossil fuels. Although not significant yet, ethanol production has expanded by more than 90% in the last decade, with a projected growth rate of 3% per year by 2025. Such growth is expected to occur in the southern and western parts of the continent, where the average growth is 7% per year.
The European Commission has funded large industrial projects in Europe to expand biofuel production possibilities. Unlike traditional methods, the projects BIOFAT, All-GAS and InteSusal aim to produce ethanol, biodiesel and biological products on a large scale from algae and with a reduced environmental impact. Despite efforts, ethanol remains a highly competitive biofuel.
According to an interview with experts, Brazil can become even more competitive through the use of other raw materials for ethanol production that can be used in the off-season periods of sugarcane. The saccharine sorghum, which could be used for ethanol production using the current structures in the mills, can be milled in March and April before the harvest of sugarcane and, in this way, shorten the period in which the mill is idle. In addition to ethanol from saccharine sorghum, corn ethanol has also attracted the attention. It can be produced with
264 265
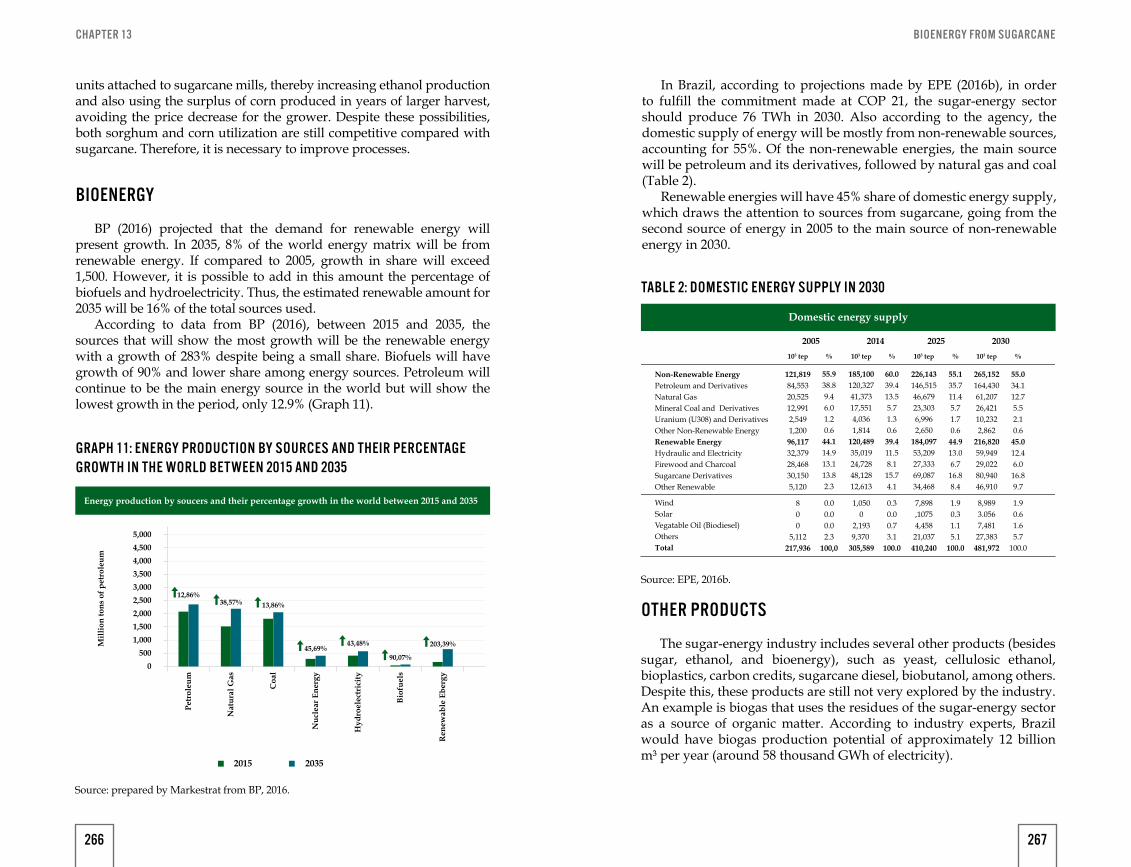
BIOENERGY FROM SUGARCANECHAPTER 13
units attached to sugarcane mills, thereby increasing ethanol production and also using the surplus of corn produced in years of larger harvest, avoiding the price decrease for the grower. Despite these possibilities, both sorghum and corn utilization are still competitive compared with sugarcane. Therefore, it is necessary to improve processes.
BIOENERGY
BP (2016) projected that the demand for renewable energy will present growth. In 2035, 8% of the world energy matrix will be from renewable energy. If compared to 2005, growth in share will exceed 1,500. However, it is possible to add in this amount the percentage of biofuels and hydroelectricity. Thus, the estimated renewable amount for 2035 will be 16% of the total sources used.
According to data from BP (2016), between 2015 and 2035, the sources that will show the most growth will be the renewable energy with a growth of 283% despite being a small share. Biofuels will have growth of 90% and lower share among energy sources. Petroleum will continue to be the main energy source in the world but will show the lowest growth in the period, only 12.9% (Graph 11).
Energy production by soucers and their percentage growth in the world between 2015 and 2035
5,0004,5004,0003,5003,0002,5002,0001,5001,000
5000
Mill
ion
tons
of p
etro
leum
Petr
oleu
m
12,86%38,57% 13,86%
45,69%43,48% 203,39%
Nat
ural
Gas
Coa
l
Nuc
lear
Ene
rgy
Hyd
roel
ectr
icity
Biof
uels
Ren
ewab
le E
berg
y
2015 2035
90,07%
GRAPH 11: ENERGY PRODUCTION BY SOURCES AND THEIR PERCENTAGE GROWTH IN THE WORLD BET WEEN 2015 AND 2035
Source: prepared by Markestrat from BP, 2016.
In Brazil, according to projections made by EPE (2016b), in order to fulfill the commitment made at COP 21, the sugar-energy sector should produce 76 TWh in 2030. Also according to the agency, the domestic supply of energy will be mostly from non-renewable sources, accounting for 55%. Of the non-renewable energies, the main source will be petroleum and its derivatives, followed by natural gas and coal (Table 2).
Renewable energies will have 45% share of domestic energy supply, which draws the attention to sources from sugarcane, going from the second source of energy in 2005 to the main source of non-renewable energy in 2030.
OTHER PRODUCTS
The sugar-energy industry includes several other products (besides sugar, ethanol, and bioenergy), such as yeast, cellulosic ethanol, bioplastics, carbon credits, sugarcane diesel, biobutanol, among others. Despite this, these products are still not very explored by the industry. An example is biogas that uses the residues of the sugar-energy sector as a source of organic matter. According to industry experts, Brazil would have biogas production potential of approximately 12 billion m³ per year (around 58 thousand GWh of electricity).
TABLE 2: DOMESTIC ENERGY SUPPLY IN 2030
Domestic energy supply
2005
Non-Renewable EnergyPetroleum and DerivativesNatural GasMineral Coal and DerivativesUranium (U308) and DerivativesOther Non-Renewable EnergyRenewable EnergyHydraulic and ElectricityFirewood and CharcoalSugarcane DerivativesOther Renewable
121,81984,55320,52512,9912,5491,200
96,11732,37928,46830,1505,120
55.034.112.75.52.10.6
45.012.46.0
16.89.7
265,152164,43061,20726,42110,2322,862
216,82059,94929,02280,94046,910
55.135.711.45.71.70.6
44.913.06.7
16.88.4
226,143146,51546,67923,3036,9962,650
184,09753,20927,33369,08734,468
60.039.413.55.71.30.6
39.411.58.1
15.74.1
185,100120,32741,37317,5514,0361,814
120,48935,01924,72848,12812,613
55.938.89.46.01.20.6
44.114.913.113.82.3
800
5,112217,936
0.00.00.02.3
100,0
1,0500
2,1939,370
305,589
0.30.00.73.1
100.0
7,898,10754,458
21,037410,240
1.90.31.15.1
100.0
8,9893.0567,481
27,383481,972
1.90.61.65.7
100.0
WindSolarVegatable Oil (Biodiesel)OthersTotal
103 tep % 103 tep % 103 tep % 103 tep %
2014 2025 2030
Source: EPE, 2016b.
266 267
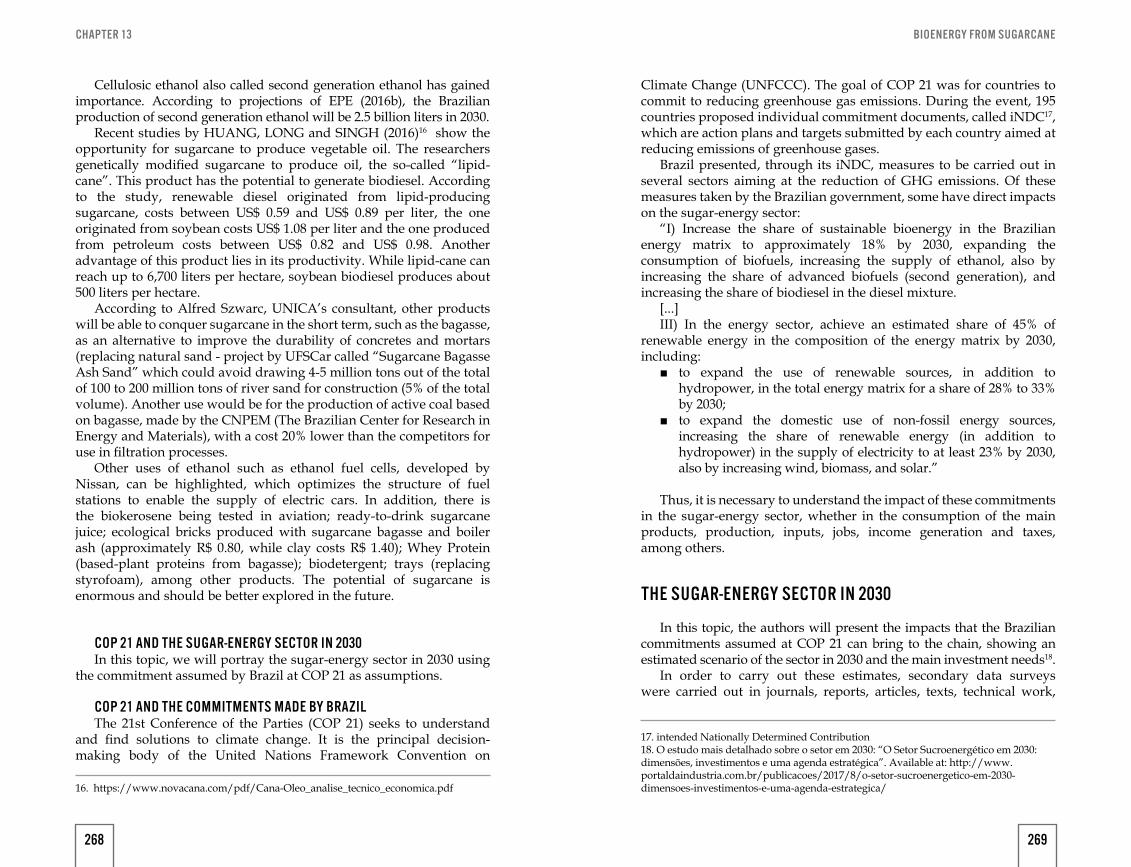
BIOENERGY FROM SUGARCANECHAPTER 13
Cellulosic ethanol also called second generation ethanol has gained importance. According to projections of EPE (2016b), the Brazilian production of second generation ethanol will be 2.5 billion liters in 2030.
Recent studies by HUANG, LONG and SINGH (2016)16 show the opportunity for sugarcane to produce vegetable oil. The researchers genetically modified sugarcane to produce oil, the so-called “lipid-cane”. This product has the potential to generate biodiesel. According to the study, renewable diesel originated from lipid-producing sugarcane, costs between US$ 0.59 and US$ 0.89 per liter, the one originated from soybean costs US$ 1.08 per liter and the one produced from petroleum costs between US$ 0.82 and US$ 0.98. Another advantage of this product lies in its productivity. While lipid-cane can reach up to 6,700 liters per hectare, soybean biodiesel produces about 500 liters per hectare.
According to Alfred Szwarc, UNICA’s consultant, other products will be able to conquer sugarcane in the short term, such as the bagasse, as an alternative to improve the durability of concretes and mortars (replacing natural sand - project by UFSCar called “Sugarcane Bagasse Ash Sand” which could avoid drawing 4-5 million tons out of the total of 100 to 200 million tons of river sand for construction (5% of the total volume). Another use would be for the production of active coal based on bagasse, made by the CNPEM (The Brazilian Center for Research in Energy and Materials), with a cost 20% lower than the competitors for use in filtration processes.
Other uses of ethanol such as ethanol fuel cells, developed by Nissan, can be highlighted, which optimizes the structure of fuel stations to enable the supply of electric cars. In addition, there is the biokerosene being tested in aviation; ready-to-drink sugarcane juice; ecological bricks produced with sugarcane bagasse and boiler ash (approximately R$ 0.80, while clay costs R$ 1.40); Whey Protein (based-plant proteins from bagasse); biodetergent; trays (replacing styrofoam), among other products. The potential of sugarcane is enormous and should be better explored in the future.
COP 21 AND THE SUGAR-ENERGY SECTOR IN 2030In this topic, we will portray the sugar-energy sector in 2030 using
the commitment assumed by Brazil at COP 21 as assumptions.
COP 21 AND THE COMMITMENTS MADE BY BRAZILThe 21st Conference of the Parties (COP 21) seeks to understand
and find solutions to climate change. It is the principal decision-making body of the United Nations Framework Convention on
16. https://www.novacana.com/pdf/Cana-Oleo_analise_tecnico_economica.pdf
Climate Change (UNFCCC). The goal of COP 21 was for countries to commit to reducing greenhouse gas emissions. During the event, 195 countries proposed individual commitment documents, called iNDC17, which are action plans and targets submitted by each country aimed at reducing emissions of greenhouse gases.
Brazil presented, through its iNDC, measures to be carried out in several sectors aiming at the reduction of GHG emissions. Of these measures taken by the Brazilian government, some have direct impacts on the sugar-energy sector:
“I) Increase the share of sustainable bioenergy in the Brazilian energy matrix to approximately 18% by 2030, expanding the consumption of biofuels, increasing the supply of ethanol, also by increasing the share of advanced biofuels (second generation), and increasing the share of biodiesel in the diesel mixture.
[...]III) In the energy sector, achieve an estimated share of 45% of
renewable energy in the composition of the energy matrix by 2030, including:
■ to expand the use of renewable sources, in addition to hydropower, in the total energy matrix for a share of 28% to 33% by 2030;
■ to expand the domestic use of non-fossil energy sources, increasing the share of renewable energy (in addition to hydropower) in the supply of electricity to at least 23% by 2030, also by increasing wind, biomass, and solar.”
Thus, it is necessary to understand the impact of these commitments in the sugar-energy sector, whether in the consumption of the main products, production, inputs, jobs, income generation and taxes, among others.
THE SUGAR-ENERGY SECTOR IN 2030
In this topic, the authors will present the impacts that the Brazilian commitments assumed at COP 21 can bring to the chain, showing an estimated scenario of the sector in 2030 and the main investment needs18.
In order to carry out these estimates, secondary data surveys were carried out in journals, reports, articles, texts, technical work,
17. intended Nationally Determined Contribution18. O estudo mais detalhado sobre o setor em 2030: “O Setor Sucroenergético em 2030: dimensões, investimentos e uma agenda estratégica”. Available at: http://www.portaldaindustria.com.br/publicacoes/2017/8/o-setor-sucroenergetico-em-2030-dimensoes-investimentos-e-uma-agenda-estrategica/
268 269
BIOENERGY FROM SUGARCANECHAPTER 13
among other sources of information already published. Primary data sources were also used through depth interviews with sectoral organizations, specialists, agroindustries, more than 230 interviews with rural producers from 70 regions, associations, and workshops with associations and producers. The GESis method, developed by Neves (2008), was used to construct the scenario.
IMPACTS ON THE CHAIN
If Brazil fulfills all the commitments assumed at COP 21, in 2030 the country will produce 54 billion liters of ethanol, 46 million tons of sugar and 76 TWh of electricity. To achieve these values of ethanol, sugar and bioenergy production, about 940 million tons of sugarcane will be needed (41% higher than current production - 666 million tons), which will lead to the need for 11.8 million hectares (3.12 million hectares more than the amount used in 2016 - considering renovation areas).
Considering the values of production and area as a basis of calculation, the GDP of the sugar-energy sector was estimated in 2030. Therefore, in this scenario, it would reach US$ 74.49 billion (72% higher than the sector's GDP in the 2013/14 crop). The values and the representation of each product for GDP composition can be seen in Table 3.
TABLE 3: GDP OF THE SUGAR-ENERGY SECTOR IN 2030
PRODUCT
DOMESTIC MARKET (DM)
FOREIGN MARKET (FM)
TOTAL(DM+ FM)
US$ (millions) US$ (millions) US$ (millions)
Ethanol
Hydrous 32,459.58 812.42 33,272.00
Anhydrous 13,210.39 1,550.42 14,760.80
Non-Energy 1,214.10 - 1,214.10
Sugar 7,904.32 13,133.35 21,037.66
Bioelectricity 3,740.09 - 3,740.09
Bioplastic 121.89 284.40 406.29
Yeast and additives 20.93 33.68 54.61
Carbon credit - 0.36 0.36
Total 58,671.28 15,814.63 74,485.91
Source: prepared by Markestrat.
The sales financial movement of the various products along the chain generates revenue in the form of taxes to the government. Considering only IPI (Tax on industrial products), ICMS (Circulation of Goods and Services Tax), PIS (Contribution to the Social Integration Plan) and COFINS (Contribution for Financing of Social Security), the sector could raise US$ 19.23 billion in aggregate taxes. If compared to the sector in 2013, tax revenues will grow 126%, going from US$ 8.5 billion in 2013 to US$ 19.2 billion in 2030.
In 2030, the sector will generate 261 thousand direct jobs. The average monthly compensation of a worker in the sector will be US$ 424, leading to a total wage bill of US$ 1.33 billion (R$ 5.91 billion). The number of indirect jobs will be about 624 thousand19. Compared to 2013, in 2030, 80 thousand new direct jobs and 190 thousand indirect jobs would be created and the sector's wage bill would increase from R$ 3.05 billion to R$ 5.90 billion in 2030.
It is possible to trace the industry scenario, detailing the movement of each chain link in 2030 (Figure 5).
Considering the financial movement, which is the sum of the billing of all the links in the chain or all the money that passed directly by the sugar-energy sector, the sector would reach a value of US$ 206.64 billion, that is, 92% greater than the financial movement in the 2013/14 crop (Table 4).
TABLE 4: FINANCIAL MOVEMENT OF THE SUGAR-ENERGY SECTOR IN 2030
PRODUCTTOTAL (DM+ FM)
US$ (millions)
Before the Farm 12,487.58
On the Farm 54,957.33
Industrial inputs 4,129.96
Mills 64,376.36
Distribution 66,958.08
Facilitating agents 3,726.95
Total 206,636.26
Source: prepared by Markestrat.
19. The indirect employment generation factor (2.39) developed by Montagnhani, Fagundes and Silva (2009) was used.
270 271
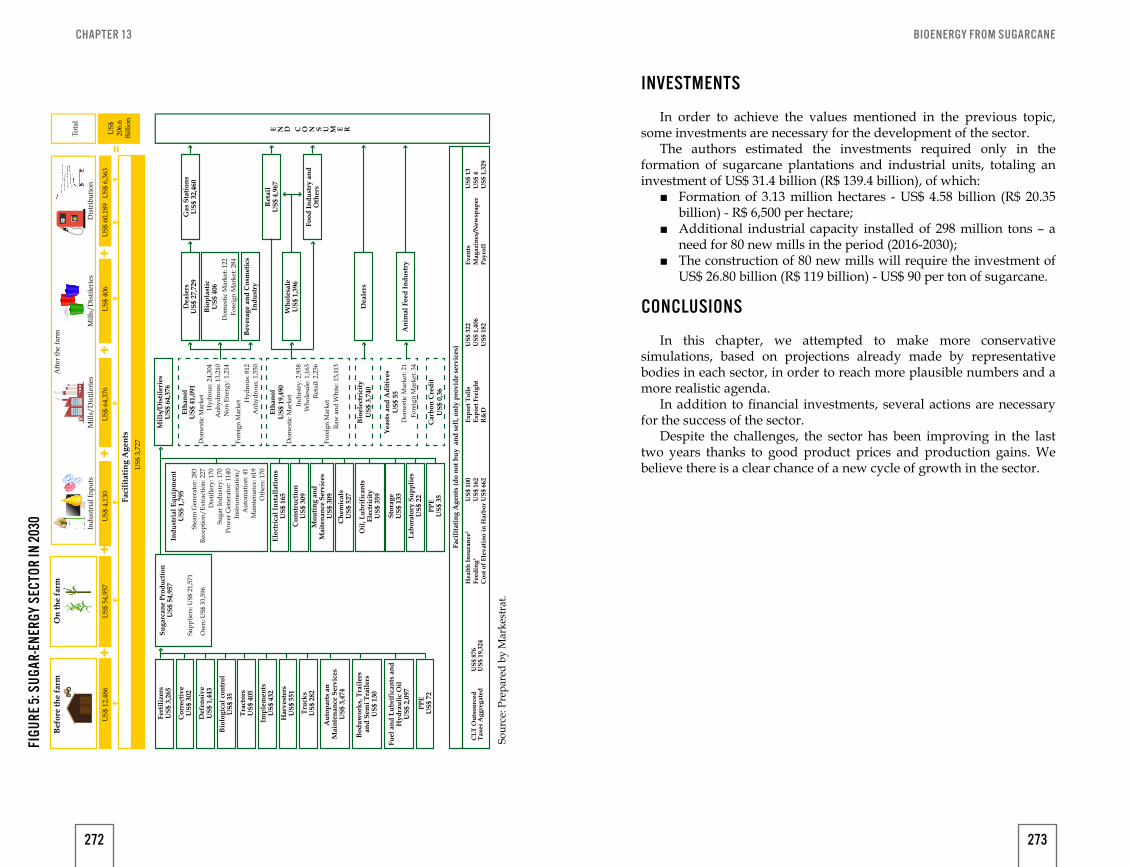
BIOENERGY FROM SUGARCANECHAPTER 13
Bef
ore
the
farm
Faci
lita
tin
g A
gen
ts
Fert
iliz
ers
US
$ 3,
265
Su
garc
ane
Pro
du
ctio
nU
S$
54,9
57In
du
stri
al E
qu
ipm
ent
US
$ 1,
795
Mil
ls/D
isti
leri
esU
S$
64,3
76
Eth
anol
US
$ 41
,091
Eth
anol
US
$ 19
,490
Yea
sts
and
Ad
itiv
esU
S$
55
Bio
elec
tric
ity
US
$ 3,
740
Car
bon
Cre
dit
US
$ 0,
36
An
imal
Fee
d I
nd
ust
ry
Dea
lers
Wh
oles
ale
US
$ 1,
396
Bev
erag
e an
d C
osm
etic
sIn
du
stry
Bio
pla
stic
US
$ 40
6
Dea
lers
US
$ 27
,729
Gas
Sta
tion
sU
S$
32,4
60
Ret
ail
US
$ 4,
967
Food
In
du
stry
an
dO
ther
s
Ele
ctri
cal I
nst
alla
tion
sU
S$
165
Con
stru
ctio
nU
S$
309
Mou
tin
g an
d
Mai
ten
ance
Ser
vice
s U
S$
309
Oil
, Lu
bri
fica
nts
E
lect
rici
tyU
S$
359
Sto
rage
US
$ 13
3
Lab
orat
ory
Su
pp
lies
US
$ 22
Faci
lita
tin
g A
gen
ts (d
o n
ot b
uy
an
d s
ell,
only
pro
vid
e se
rvic
es)
CL
T O
uts
ourc
edT
axes
Agg
rega
ted
Hea
lth
In
sura
nce
2
Feed
ing3
Cos
t of
Ele
vati
no
in H
arb
or
US
$ 10
0U
S$
162
US
$ 66
2
Exp
ort T
olls
Exp
ort F
reig
ht
R&
D
US
$ 32
2U
S$
1,40
6U
S$
182
Eve
nts
Mag
azin
es/N
ewsp
aper
Pay
roll
US
$ 13
US
$ 4
US
$ 1,
329
US
$ 87
6U
S$
19,3
24
PP
EU
S$
35
Ch
emic
als
US
$ 52
7
Supp
liers
: US$
21,
571
Stea
m G
ener
ator
: 283
Rec
eptio
n/Ex
trac
tion:
227
Dis
tille
ry: 1
70Su
gar
Indu
stry
: 170
Pow
er G
ener
ator
: 114
0In
stru
men
tatio
n/A
utom
atio
n: 4
1M
aint
enan
ce: 6
19O
ther
s: 1
70
Hyd
rous
: 24,
304
Anh
ydro
us: 1
3,21
0N
on E
nerg
y: 1
,214
Indu
stry
: 2,9
38W
hole
sale
: 1,1
63R
etai
l: 2,
256
Hyd
rous
: 812
Anh
ydro
us: 1
,550
Raw
and
Whi
te: 1
3,11
3
Dom
estic
Mar
ket
Dom
estic
Mar
ket
Dom
estic
Mar
ket:
21Fo
reig
n M
arke
t: 34
Fore
ign
Mar
ket
Fore
ign
Mar
ket:
284
Dom
estic
Mar
ket:
122
Fore
ign
Mar
ket
Ow
n: U
S$ 3
3,59
6
Cor
rect
ive
US
$ 30
2
Def
ensi
veU
S$
1,44
3
Bio
logi
cal c
ontr
olU
S$
35
Tra
ctor
sU
S$
405
Imp
lem
ents
US
$ 43
2
Har
vest
ers
US
$ 55
1
Tru
cks
US
$ 28
2
PP
EU
S$
72
Au
top
arts
an
M
ain
ten
ance
Ser
vice
sU
S$
3,47
4
Bod
uw
ork
s, T
rail
ers
and
Sem
i Tra
iler
sU
S$
130
Fuel
an
d L
ub
rifi
can
ts a
nd
Hyd
rau
lic
Oil
US
$ 2,
097
On
the
farm
Indu
stri
al In
puts
Mill
s/D
istil
erie
sM
ills/
Dis
tiler
ies
Dis
trib
utio
n
Tota
l
US$
206.
6Bi
llion
E N D C O N S U M E R
Aft
er th
e fa
rm
US$
12,
486
US$
54,
957
US$
4,1
30
US$
3,7
27
US$
64,
376
US$
406
US$
60,
189
US$
6,3
63+
++
++
=
FIGU
RE 5:
SUG
AR-E
NERG
Y SE
CTOR
IN 20
30
Sour
ce: P
repa
red
by M
arke
stra
t.
INVESTMENTS
In order to achieve the values mentioned in the previous topic, some investments are necessary for the development of the sector.
The authors estimated the investments required only in the formation of sugarcane plantations and industrial units, totaling an investment of US$ 31.4 billion (R$ 139.4 billion), of which:
■ Formation of 3.13 million hectares - US$ 4.58 billion (R$ 20.35 billion) - R$ 6,500 per hectare;
■ Additional industrial capacity installed of 298 million tons – a need for 80 new mills in the period (2016-2030);
■ The construction of 80 new mills will require the investment of US$ 26.80 billion (R$ 119 billion) - US$ 90 per ton of sugarcane.
CONCLUSIONS
In this chapter, we attempted to make more conservative simulations, based on projections already made by representative bodies in each sector, in order to reach more plausible numbers and a more realistic agenda.
In addition to financial investments, several actions are necessary for the success of the sector.
Despite the challenges, the sector has been improving in the last two years thanks to good product prices and production gains. We believe there is a clear chance of a new cycle of growth in the sector.
272 273
BIOENERGY FROM SUGARCANE
FINAL MESSAGE
The sugar energy sector is of historical importance to Brazil. The sector has a strong impact in the generation of wealth for the nation, as well as its social importance in the job generation and income distribution, as well as its environmental importance, with many benefits to the environment and population.
The sector has been through challenges in the last few years, as the increasing cost of production which is compromising growers margins, indebtness of industrial units, weak support from the government and specific public policies aimed at the valuing of the sector, among other problems. Besides financial investments, various actions are necessary for the success of the sector.
Despite the challenges, we believe that a clear chance of a new growth cycle of the sector exists:
I – Sovereignty - Proálcool 1974 - 1975 - The Pro Álcool Program was the first great landmark for
the sugar energy sector in Brazil. It was a program from the federal government which stimulated the use of ethanol, increase of the sugar energy park and development of technology, as vehicles running only on ethanol. A great expansion and consolidation of the sector moment.
II – Technology - Flex Fuel 2003 - 2004 - The development of the flex fuel technology of combustion
engines in vehicles was another great landmark for the sector. Technology allowed consumers to choose between using gasoline or ethanol, at the moment of filling up.
III – Global Sustainability - Thus, we see that from 2017 on a new cycle of consolidation
of the sector began: the sustainability cycle. The world seeks and values renewable sources of energy and fuels. The sector has sustainability in its DNA and its practices. RenovaBio, a program created by the Brazilian government, starts to acknowledge the positive externalities of Ethanol, without subsidies and interventions, only leaving the choice to the consumer. As seen, the Brazilian government committed in COP 21 with its iNDC and the valuing of renewable fuels. A series of sustainable products deriving from the sector started to gain space as the production of biogas, biopolimeres, plastic and green packaging and biodegradables, thus, the sustainable moment.
There is a giant oportunity for the sustainable development and the sugar energy sector has the tools to catch these oportunities, we have sugar cane, a plant that is truly a highly efficient machine to transform
275
BIOENERGY FROM SUGARCANE
solar energy and water into bioenergy, we have rural producers with their will to work and efficiency, we have cooperatives and associations coordenating and helping ruaral producers, we have mills, great transformers of raw material in many bioproducts. Let's go forward, seeking development, economy, technology and sustainability, this is the mission of the sugar energy sector.
REFERENCES
CHAPTER 1
Batalha, M.O., (org), 2001. In Gestão agroindustrial. 2ª ed., São Paulo: Atlas, 2001. v. 1, 23–63.Batalha, M.O., and A.L. Silva, 2001. Gerenciamento de Sistemas Agroindustriais: Definições e Correntes Metodológicas. In: Batalha, M.O. (Coord.). Gestão agroindustrial. 2ª ed. São Paulo: Atlas, v.1, pp. 23–63.Consoli, M.A., and M.F. Neves, 2006. Estratégias para o Leite no Brasil. 1st ed., São Paulo: Atlas, 291 pp.Goldberg, R.A., 1968. Agribusiness coordination: A system approach to wheat, soybean and Florida orange economies. Division of Research, Graduate School of Business and Administration, Harvard University, 256 pp.Hardman, P.A., M.A.G. Darroch, and G.F. Ortmann, 2002. Improving cooperation to make the South African fresh apple export value chain more competitive. Journal on Chain and Network Science, v. 2, n. 1, 61–72.Jain, S.C., 2000. Marketing Planning & Strategy, 6th ed., Cincinnati, USA: Thomson Learning.Johnson, G., and K. Scholes, 1997. Exploring Corporate Strategy. 4th ed., Prentice Hall.Lazzarini, S.G., F.R. Chaddad, and M.L. Cook, 2001. Integrating supply chain and network analyses: The study of net chains. Journal on Chain and Network Science. v. 1, n. 1, 7–22.Morvan, Y., 1985. Filière de Production, in Fondaments d’economie industrielle, Economica, 199–231.Neves, M.F., 2007. A Method for Demand Driven Strategic Planning and Management for Food Chains (The ChainPlan Method). In: 17th Annual World Forum and Symposium - Food Culture: Tradition, Innovation and Trust - A Positive Force for Modern Agribusiness, 2007, Parma, Italy: June. Neves, M.F., R.M. Rossi, L.T. Castro, F.F. Lopes, and M.K. Marino, 2004. A framework for mapping and quantifying value chains towards collective actions. European Marketing Academy, Murcia. International Food Agribusiness Management Association, Montroeux.Neves, M.F., and F.F. Lopes, 2005. Estratégias para a Laranja no Brasil. 1. ed. São Paulo: Atlas, 224 p.Neves, M.F.; Trombin, V.G.; Consoli, A.M. Mapping and Quantification of the Sugar-Energy Sector in Brazil. In: Proceedings of 2010 IAMA (International Food And Agribusiness Management Association)
277
BIOENERGY FROM SUGARCANEREFERENCES
World Symposium & Forum, 2010, Boston, MA, USA. Omta, O., J. Trienekens, and G. Beers, 2001. The knowledge domain of chain and network science. Journal on Chain and Network Science, v. 1, n. 2, 77–85.Rossi, R., and M.F. Neves, 2004 . Estratégias para o Trigo no Brasil. 1. ed. São Paulo: Editora Atlas, 224 pp.
CHAPTER 2
Batalha, M.O., 2001. Gestão agroindustrial. 2ª ed., São Paulo: Atlas, 1, 23-63.Batalha, M.O., and A.L. Silva, 2001. Gerenciamento de Sistemas Agroindustriais: Definições e Correntes Metodológicas. In: Batalha, M.O. (Coord.). Gestão agroindustrial. 2ª ed. São Paulo: Atlas, v.1, pp. 23-63.Consoli, M.A., and M.F. Neves, 2006. Estratégias para o Leite no Brasil. 1st ed., São Paulo: Atlas, 291 pp.Goldberg, R.A., 1968. Agribusiness coordination: A system approach to wheat, soybean and Florida orange economies. Division of Research, Graduate School of Business and Administration, Harvard University, 256 pp.Marcos Fava Neves, Vinicius Gustavo Trombin and Marco Antonio ConejeroHardman, P.A., M.A.G. Darroch and G.F. Ortmann, 2002. Improving cooperation to make the South African fresh apple export value chain more competitive. Journal on Chain and Network Science, 2: 61-72.Jain, S.C., 2000. Marketing Planning & Strategy, 6th ed., Cincinnati, USA: Thomson Learning.Johnson, G., and K. Scholes, 1997. Exploring Corporate Strategy. 4th ed., Prentice Hall.Lazzarini, S.G., F.R. Chaddad, and M.L. Cook, 2001. Integrating supply chain and network analyses: The study of net chains. Journal on Chain and Network Science, 1: 7-22.Morvan, Y., 1985. Filière de Production, in Fondaments d’economie industrielle, Economica, 199-231.Neves, M.F., 2007. A Method for Demand Driven Strategic Planning and Management for Food Chains (The ChainPlan Method). In: 17th Annual World Forum and Symposium - Food Culture: Tradition, Innovation and Trust - A Positive Force for Modern Agribusiness, 2007, Parma, Italy: June.Neves, M.F., R.M. Rossi, L.T. Castro, F.F. Lopes and M.K. Marino, 2004. A framework for mapping and quantifying value chains towards collective actions. European Marketing Academy, Murcia. International Food Agribusiness Management Association, Montroeux.
Neves, M.F. and F.F. Lopes, 2005. Estratégias para a Laranja no Brasil.1. ed. São Paulo: Atlas, 224 p.Neves, M.F., V.G. Trombin and A.M. Consoli, 2010. Mapping and Quantification of the Sugar-Energy Sector in Brazil. In: Proceedings of 2010 IAMA (International Food And Agribusiness Management Association) World Symposium & Forum, 2010, Boston, MA, USA.Omta, O., J. Trienekens and G. Beers, 2001. The knowledge domain of chain and network science. Journal on Chain and Network Science, 1: 77-85.Rossi, R. and M.F. Neves, 2004. Estratégias para o Trigo no Brasil.1. ed. São Paulo: Editora Atlas, 224 pp.
CHAPTER 3
Batalha, M. O. (Ed.). (2001). Gestão agroindustrial [Agribusiness Management] (2nd ed.). São Paulo: Atlas.Brasil. Ministério da Agricultura, Pecuária e Abastecimento (MAPA). (n.d.). Retrieved November 7, 2014, from http://www.agricultura.gov.br/Castro, A. M. G. (2000). Análise da competitividade de cadeias produtivas. Workshop de Cadeia Produtivas e Extensão Rural da Amazônia. Manaus: EMBRAPA. Consoli, M. A., & Neves, M. F. (Eds.). (2006). Estratégias para o Leite no Brasil [Strategies for Milk in Brazil] (1st ed.). São Paulo: Atlas.Davis, J. H., & Goldberg, R. A. (1957). A Concept of agribusiness. Division of research. Graduate School of Business Administration. Boston: Harvard University.FAO—Food and Agriculture Organization of the United Nations. (n.d.). FAOSTAT. Retrieved November 13, 2014, from http://www.faostat.fao.org/site/377/default.aspx Folkerts, H., & Koehorst, H. (1997). Challenges in international food supply chains: Vertical co-ordination in the European agribusiness and food industries. Supply Chain Management: An International Journal, 2(1), 11-14.Goldberg, R. A. (1968). Agribusiness coordination: A systems approach to the wheat, soybean, and Florida orange economics. Division of Research, Harvard University.Kaplinsky, R., & Fitter, R. (2001). Who Gains from Product Rents as the Coffee Market Becomes More Differentiated? A Value Chain Analysis, IDS Bulletin Paper, Institute of Development Studies: Sussex.Kaplinsky, R., & Morris, M. (2000). A Handbook for Value Chain Research. Prepared for the IDRC, Institute of Development Studies: Sussex.Ménard, C. (2002). The economics of hybrid organizations. Pantheon-
278 279
BIOENERGY FROM SUGARCANEREFERENCES
Sorbonne: UP.Morvan, Y. (1985). Filière de production (pp. 199-231). Fondaments d’economie industrielle, Economica. Neves, M. F. (2004). Uma proposta de Modelo para o planejamento e gestão estratégica de marketing nas organizações. Tese (Livre-Docência)—Departamento de Administração, Faculdade de Economia, Administração e Contabilidade de Ribeirão Preto, Universidade de São Paulo, Ribeirão Preto.Neves, M. F. (2008). Método para planejamento e gestão estratégica de sistemas agroindustriais (GESis). São Paulo: RAUSP—Revista de Administração da Universidade de São Paulo, 43(4), 331-343.Neves, M. F., & Lopes, F. F. (Eds.). (2005). Estratégias para a Laranja no Brasil (1st ed.). São Paulo: Atlas. Neves, M. F., & Pinto, M. J. A. (Eds.). (2012). Estratégias para o algodão no Brasil. São Paulo: Atlas. Neves, M. F., & Trombin, V. G. (Eds.). (2014). A dimensão do setor sucroenergético: Mapeamento e quantificação da safra 2013/2014. Ribeirão Preto: Markestrat. Neves, M. F., Trombin, V. G., & Cônsoli, M. A. (2010). O mapa sucroenergético do Brasil. In E. L. L. de Souza, & I. C. Macedo (Eds.), Etanol e bioeletricidade: A cana-de-açúcar no futuro da matriz energética (pp. 15-43). São Paulo: Luc Projetos de Comunicação.Neves, M. F., Trombin, V. G., & Cônsoli, M. A. (Eds.). (2010). Measurement of Sugar Cane Chain in Brazil. International Food and Agribusiness Management Review, 13(3), 37-54.Neves, M. F., Trombin, V. G., Gerbasi, T., & Kalaki, R. B. (2014). Mapping and Quantification of the Beef Chain in Brazil. International Food and Agribusiness Management Review, 17(2), 125-138. Rossi, R. M., & Neves, M. F. (2004). Estratégias para o trigo no Brasil. São Paulo: Atlas. UNICA—União da Indústria de Cana-de-Açúcar. (n.d.). Retrieved November 23, 2014, from http://www.unica.com.br/UNITED STATES. (n.d.). U.S. Department of Agriculture. PSD Online. Retrieved March 6, 2014, from http://www.fas.usda.gov/psdonline/psdQuery.aspxZylberstajn, D. (1995). Estruturas de governança e coordenação do agribusiness: Uma aplicação da nova economia das instituições. Tese (Livre-Docência)—Departamento de Administração, Faculdade de Economia, Administração e Contabilidade, Universidade de São Paulo, São Paulo.Zylbersztajn, D. (2000). Conceitos gerais, evolução e apresentação do sistema agroindustrial. In D. Zylbersztajn, & M. F. Neves (Eds.), Economia e gestão dos negócios agroalimentares (pp. 1-21). São Paulo: Pioneira.
CHAPTER 4
BANCO MUNDIAL. Brasil: Agricultura Irrigada na Região do Semi-Árido Brasileiro: Impactos Sociais e Externalidades, abril de 2004.BERNARDI, L. A. Manual de Empreendedorismo e Gestão. São Paulo: Atlas, 1a Ed. 2003, 314p.BRASIL. Ministério da Agricultura, Pecuária e Abastecimento (MAPA). Disponível em: http://www.agricultura.gov.br/. Acesso em: 7 novembro 2012.CLEMENTE, A. Projetos Empresariais e Públicos. São Paulo: Atlas, 2a. Ed., 2002, 341 p.CHIAVENATO, Idalberto; SAPIRO, Arão. Planejamento estratégico: fundamentos e aplicações. Rio de Janeiro: Elsevier, 2003.COASE, R H. The Nature of the Firm. Economica N.S., 4: 386-405, 1937. Reprinted in WILLIAMSON, O. E.; WINTER, S. (eds.). The Nature of the Firm: Origins, Evolution, Development. New York: Oxford University Press, 1991. pp. 18-33.COASE, R H. The Nature of the Firm. Economica N.S., 4: 386-405, 1937. Reprinted in COASE, R., “The Firm, The Market and the Law”, University of Chicago Press, 1988.COASE, R. The problem of social cost. Journal of Law and Economics, vol. 3, pp 1-44, 1960.CONAB – Companhia Nacional de Abastecimento. Acompanhamento de safra brasileira: cana de açúcar, segundo levantamento, agosto de 2013. Disponível em < http://www.conab.gov.br/OlalaCMS/uploads/arquivos/13_08_08_09_39_29_boletim_cana_portugues_-_abril_2013_1o_lev.pdf>. Acesso em: 27 set 2013.COOK, M. L.; CHADDAD, F. R. Agroindustralization of the Global Agrifood Economy: Bridging Development Economics and Agribusiness Research. In Agricultural Economics, v. 23, n. 3, p. 207-218, 2000. CONEJERO, M. A. et al. Arranjos contratuais complexos na transação de cana à usina de açúcar e álcool: um estudo de caso no centro-sul do Brasil. XXXII EnAnpad. Rio Janeiro: Anpad, 2008. CTC – CENTRO DE TECNOLOGIA CANAVIEIRA. 2011 Disponível em: <http://www.ctcanavieira.com.br/site/> Acesso em: 10 de out 2013.DAVIS, J.H.; GOLDBERG, R.A. A Concept of Agribusiness. Division of Research. Harvard University, Boston, 1957. 136p.DAVIS, J; GOLDBERG, R. Concept of agribusiness, A. Boston. Harvard University/Division of Research/Graduate School of Business Administration, 1957. 136 p. FAO – Food and Agriculture Organization of the United Nations. FAOSTAT. Disponível em: <http://faostat.fao.org/site/377/default.aspx>. Acesso em: out 2013.
280 281
BIOENERGY FROM SUGARCANEREFERENCES
FIGUEIREDO, E. B., LA SCALA, N . Greenhouse gas balance due to the conversion of sugarcane areas from burned to green harvest in Brazil. Agriculture, Ecosystems & Environment (Print), v. 141, p. 77-85, 2011.KLEIN, B., CRAWFORD, R.G. and ALCHIAN, A.A. Vertical Integration, Appropriable Rents, and the Competitive Contracting Process. The Journal of Law and Economics, Vol. 21, n.2, 1978. pp.297-326.KUVA, M.A. et al. Fitossociologia de comunidades de plantas daninhas em agroecossistema cana-crua. Planta Daninha. v. 25, n.3, p. 501-511. Viçosa, 2007.LAMBIN, J.-J.. Marketing Estratégico. 4a. ed. Portugal: McGraw-Hill, 2000.LUCA, E. F. FELLER, C.; CERRI C. C.; BARTHÈS, B.; CHAPLOT, V.; CAMPOS, D. C.; MANECHINI, C. Avaliação de atributos físicos e estoques de carbono e nitrogênio em solos com queima e sem queima de canavial. Revista Brasileira de Ciências do Solo, Viçosa , v. 32, n. 2, 2008.PORTER, M. E. (1998b). On Competition. Harvard Business School Press.MACHADO FILHO. C. P. Governança Corporativa e Responsabilidade Social. Pioneira, 2006. 206 pg. MORAES, M. A. F. D., A Desregulamentação do Setor Sucroalcooleiro do Brasil. Americana, SP: Caminho Editorial, 2000.MONTAGNHANI, B.A.; FAGUNDES, M.B.B.; SILVA, J.F. O papel da agroindústria canavieira na geração de empregos e no desenvolvimento local: o caso da usina mundial no município de Mirandópolis, Estado de São Paulo. Informações Econômicas. v.39, n.12, São Paulo, 2009.NEVES, M. F. Um modelo para o planejamento e gestão estratégica de marketing (orientação para o mercado) nas organizações. Tese de Livre Docência apresentada ao Departamento de Administração da Faculdade de Economia, Administração e Contabilidade de Ribeirão Preto da Universidade de São Paulo, 2004.NEVES, M. F. ; CASTRO, Luciano T. Agronegócio, Agregação de Valor e Sustentabilidade. In: XXXI EnAnpad, 2007, Rio de Janeiro. XXXI EnAnpad, 2007. v. 31.NEVES, M.F.; CONEJERO, M. A. Sistema Agroindustrial da Cana: Cenários e Agenda Estratégica. São Paulo: Economia Aplicada –Brazilian Journal of Applied Economics, Debates, v. 11, nº 04 pág. 587-604, Out-Dez 2007.NEVES, M.F.; TROMBIM, V.G.; CONSOLI, M.A. Measurement of Sugar Cane Chain in Brazil. Revista International Food and Agribusiness Management Review – IFAMR. Disponível em <https://www.ifama.org/publications/journal/IFAMRArchive.aspx>, College Station, Texas A&M University-Department of Agricultural
Economics/Estados Unidos, v. 13, edição 3, p. 37-53, set 2010.NORTH, D.C. Economic Performance trough time. The American Economic Review, june, 1994, pp. 359-368.RONQUIM, C. C. Queimada na colheita de cana-de-açúcar: impacots ambientais, sociais e econômicos. Embrapa Monitoramento por Satélite. Documentos, 77. Campinas: Embrapa Monitoramento por Satélite, dez de 2010.SAUVÉE, L. Strategic interdependence and governance: empirical evidence with two agri-food networks in the fresh and processed vegetable sectors in France. In: V Congresso Internacional de Economia e Gestão de Redes Agroalimentares, 2001, Ribeirão Preto.UNICA – União da Indústria de Cana-de-Açúcar. Cana-de-açúcar processada pelas usinas brasileiras. Disponível em: <http://www.unica.com.br/>. Acesso em: 23 jul. 2010.UNICA – União da Indústria de Cana-de-Açúcar. Etanol e Bioeletricidade: a cana de açúcar no futuro da matriz energética. Souza, E. l.; Macedo, I. C. (coord.) São Paulo: Luc Projetos de Comunicação, 2010. 314pUNICA – União da Indústria de Cana-de-Açúcar. Bioeletricidade: a energia verde e inteligente do Brasil. São Paulo: UNICA, 2011.UNITED STATES. U.S. Department of Agriculture. PSD Online. Disponível em: <http://www.fas.usda.gov/psdonline/psdQuery.aspx> Acesso em: 06 mar. 2012.WILLIAMSON, O. E. Mechanisms of Governance. New York: Oxford University Press, 429p, 1996.WILLIAMSON, O. E. The Economic Institutions of Capitalism: Firms, Markets, Relational Contracting. New York: The Free Press, p. 449, 1985.WILLIAMSON, O. E. Transaction cost economics and organization theory. Industrial and Corporate Change, Oxford, v.2, n.1, p.107-156, January 1993.YIN, R.K. Case study research: design and methods. 6.ed. Newbury Park, CA: Sage, 1989.ZYLBERSZTAJN, D.; FARINA, E.M.M.Q. 1999. Strictly Coordinated Food-Systems: Exploring the Limits of the Coasian Firm. International Food and Agribusiness Management Review, 2, pp. 249-26.ZYLBERSZTAJN, D. Estruturas de Governança e Coordenação do Agribusiness: Uma Aplicação da Nova Economia das Instituições. 1995. 238p. Tese (Livre-Docência) – Departamento de Administração, Faculdade de Economia, Administração e Contabilidade, Universidade de São Paulo, São Paulo.ZYLBERSZTAJN, D. Papel dos Contratos na Coordenação Agro-industrial: um olhar além dos mercados. XLII Congresso Brasileiro de Economia Rural, 2005, Ribeirão Preto.
282 283
BIOENERGY FROM SUGARCANEREFERENCES
CHAPTER 5
ANFAVEA, National Automotive Vehicle Manufacturers Association (2010). São Paulo, Brazil. Many documents. Recuperado em agosto de 2010, de http://www.anfavea.com.br/tabelas.html.ANP, National Agency of Petroleum, Natural Gas and Bio-fuels (2010). Rio de Janeiro, Brazil. Recuperado em agosto de 2010, de http://www.anp.gov.br.BAA, Biodiesel Association of Australia (2007). Bowral, Australia. Recuperado em agosto de 2010, de http://www.biodiesel.org.au.Batalha M O (2001) (Coord.). Gestão agroindustrial (2ª ed.), São Paulo: Atlas. Blanning RW and Reinig BA (1998). Building Scenarios for Hong Kong using EMS.Long Range Planning, 31 (6), 900–910.Boaventura J.M.G & Fishcmann A.A (2007). Um Método para Cenários Empregando Stakeholder Analysis: um Estudo no Setor de Automação Comercial. Revista de Administração da USP, 42 (2).Borlaug NE (2007). Vocação da terra. Revista Agroanalysis, 27 (3), Recuperado em agosto de 2010, de (http://www.agroanalysis.com.br/index.php?area= conteudo&esp_id=10&from=especial&epc_id=80).BP, British Petroleum (2006). Statistical Review of World Energy. London, UK: BP. Recuperado em agosto de 2010, de http://www.bp.com.Camargo J M (2007). Relações de trabalho na agricultura paulista no período recente. Tese (Doutorado em Ciências Econômicas) – Instituto de Economia da Universidade Estadual de Campinas. Campinas: Universidade Estadual de Campinas.Campomar M.C & Ikeda A.A (2006). Planejamento de marketing: e a confecção de planos. São Paulo: Saraiva.Chermack T (2005). Studying scenario planning: Theory, research suggestions, and hypotheses. Technological Forecasting & Social Change, (72), 59–73.Coates, JF (2000). Scenario planning. Technological Forecasting & Social Change, (65), 115–123.Commission of the European Communities (2006). An EU Strategy for Bio-fuels, Brussels.Commission of the European Communities (2007). Bio-fuel Progress Report. Brussels, Belgium. Recuperado em agosto de 2010, de http://www.ebb- eu.org/legislation.php.Costa PFS (2007). A estrutura que precede uma commodity. IETHA, International Ethanol Trade Association. Forum Internacional sobre o Futuro do Alcool. Revista Opiniões, Set. 2007. Recuperado em agosto de 2010, de http://www.fenasucro.com.br/forum/2007/.Coyle W (2007). The Future of Bio-fuels: A Global Perspective. Amber Waves, Economic Research Service, 6 (5), 24-29, Recuperado em agosto
de 2010, de (http://www.ers.usda.gov.Marco Antonio Conejero; Marcos Fava Neves & Mairun Junqueira Alves PintoDatagro (2008, janeiro). Tendências de preço para açúcar e álcool no Brasil. I Workshop Nacional da Cana-de-Açúcar,1, São Paulo.EBB, European Biodiesel Board (2007). The EU Biodiesel Industry. Brussels: Belgium. Recuperado em agosto de 2010, de http://www.ebb-eu.org.EBIO, the European Bioethanol Fuel Association (2007). Bruxelas: Bélgica.Recuperado em agosto de 2010, de http://www.ebio.org/.Economic Report of the President (2008). US Government Printing Office. Washington, DC: February. Recuperado em agosto de 2010, de http://www.gpoaccess.gov/eop/.EIA, Energy Information Administration (2007). Washington DC, USA: U.S Department of Energy. Recuperado em agosto de 2010, de http://www.eia.doe.gov.EMBRAPA CPAA, Empresa Brasileira de Pesquisa Agropecuária Amazônia Ocidental (2007). Recuperado em agosto de 2010, de http://www. cpaa.embrapa.br/.F.O. LICHT'S (2007). World Ethanol & Bio-fuels Reports. Kent, UK: Agra-net. Recuperado em agosto de 2010, de http://www.agra-net.com.FAO, Food and Agriculture Organization of the United Nations and OCDE, Organization for Economic Cooperation and Development (2007). OECD-FAO Agricultural Outlook: 2007-2016. Recuperado em agosto de 2010, de http://www.agri-outlook.org/dataoecd/55/42/39098268.pdf.FAO, Food and Agriculture Organization of the United Nations. FAOSTAT. Rome: Italy. Recuperado em agosto de 2010, de http://faostat.fao.org/site/ 377/default.aspx.GREEN FUELS, Canadian Renewable Fuels Association (2007). Toronto, Canada.Recuperado em agosto de 2010, de http://www.greenfuels.org.Heijden K (2004). Cenários: a arte de conversação estratégica. Porto Alegre, Brazil: Bookman.ICONE, Institute for International Trade Negotiations (2007). Many documents. São Paulo, Brazil. Recuperado em agosto de 2010, de http://www. iconebrasil.org.br.IEA, International Energy Agency (2004a). Bio-fuels for Transport: An International Perspective. Paris, France. Recuperado em agosto de 2010, de http://www.iea.org/textbase/nppdf/free/2004/bio-fuels2004.pdf.IEA, International Energy Agency (2004b). World Energy Outlook 2004. Paris, France. Recuperado em agosto de 2010, de http://www.
284 285
BIOENERGY FROM SUGARCANEREFERENCES
worldenerg youtlook.org/2004.asp.IEA, International Energy Agency (2005). World Energy Outlook 2005. Paris, France (187). Recuperado em agosto de 2010, de http://www.worldenerg youtlook.org/2005.asp.IEA, International Energy Agency (2006). World Energy Outlook 2006. Paris, France. Recuperado em agosto de 2010, de http://www.iea.org/ textbase/press/pressdetail.asp?PRESS_REL_ID=187.Scenarios for mandatory bio-fuel blending targets: an application of intuitive logicsIICA, Inter-American Institute for Cooperation on Agriculture (2007). Agroenergy and Bio-fuels Atlas of the Americas: Ethanol. Sao Jose, Costa Rica. Recuperado em agosto de 2010, de http://www.iica.int/Eng/organizacion/ LTGC/Agroenergia/Pages/default.aspx.Jain, S.C (2000). Marketing Planning & Strategy (6ª ed.). Cincinnati, USA: Thomson Learning.Johnson, G. & Scholes K. (1997). Exploring Corporate Strategy (4ª ed.). Prentice Hall.Lambin, J.J (2000). Marketing Estratégico (4ª ed.). Portugal: McGraw-Hill.Leal, M.R.L.V. (2006). O teor de energia da cana-de-açúcar. NIPE, Núcleo Interdisciplinar de Planejamento Estratégico. Universidade Estadual de Campinas. F.O.Licht’s 2nd Sugar and Ethanol Brazil. March, São Paulo, Brazil. Recuperado em agosto de 2010, de www.nipeunicamp.org.br.Mathews, J.A (2008). Towards a Sustainably Certifiable Futures Contract for Bio- fuels. Energy Policy. Recuperado em agosto de 2010, de http://www. elsevier.com/locate/enpol.Mathews, J.A & Goldztein H (2007, outubro). Capturing Latecomer Advantages in the Argentine Biofuels Industry. VI International PENSA Conference, Ribeirão Preto.Molina CA (2007, september). Biodiesel Industry Takes Off in Argentina. Biodiesel Magazine, Grand Forks, USA. Recuperado em agosto de 2010, de http://www.biodieselmagazine.com.Moraes MAFD (2007, October/December). O mercado de trabalho da agroindústria canavieira: desafios e oportunidades. Economia Aplicada, 11, (4), 605-619.Moraes MAFD (2009, December). Externalidades sociais dos diferentes combustíveis no Brasil. Seminario Etanol e Bioeletricidade: a contribuição da cana para o desenvolvimento sustentável, ESALQ.MPOC, Ministry of Plantation Industries and Commodities (2006). The National Bio-fuel Policy. Putrajaya: Malaysia. Recuperado em agosto de 2010, de http://www.mpoc.org.my/download/mktstat/Bio-fuel%20Policy.pdf.Nacarajan M (2008). Bio-fuel Development in Malaysia. International Symposium on Agricultural and Bio-fuel. Bangkok, Thailand.
Recuperado em agosto de 2010, de http://www.the-convention.co.jp/bio-fuel/program/2malaysia.pdf.Nastari, P. (2008, January). Tendências de preços para açucar e alcool no Brasil.I Workshop Nacional da Cana-de-Açucar, São Paulo, Brazil.NBB, National Biodiesel Board (2007). The US Biodiesel Industry. Jefferson City, USA. Recuperado em agosto de 2010, de http://www.biodiesel.org.Neves, M.F. (2005). Planejamento e gestão estratégica de marketing. São Paulo: Atlas.Neves, M.F. (2007a). Strategic Marketing Plans and Collaborative Actions.Marketing Intelligence and Planning, 25 (2),175-192.Marco Antonio Conejero; Marcos Fava Neves & Mairun Junqueira Alves PintoNeves, M.F. (2007b, June). A Method for Demand Driven Strategic Planning and Management for Food Chains (The ChainPlan Method). 17th Annual World Forum and Symposium - Food Culture: Tradition, Innovation and Trust - A Positive Force for Modern Agribusiness, 2007, Parma, Italy.NREL, National Renewable Energy Laboratory (2006). From Biomass to Bio-fuels: NREL Leads the Way. Golden, USA. Recuperado em agosto de 2010, de http://www.nrel.gov.NYMEX, New York Mercantile Exchange. Recuperado em agosto de 2010, de http://www.nymex.com/index.aspx.O’Brien, F.A. (2004). Scenario Planning - lessons for practice for teaching and learning. European Journal of Operational Research, (152), 709-722.OECD, Organization for Economic Cooperation and Development (2005). Producer and Consumer Support Estimates, OECD Database 1986-2004. Paris, France. Recuperado em agosto de 2010, de http://www.oecd.org/ document/54/0,3343,en_2825_494532_35009718_1_1_1_1,00.html#NME.OICA, International Organization of Motor Vehicle Manufacturers (2007). Paris, France. Recuperado em agosto de 2010, de http://oica.net.Poschen, P. (2007). Green jobs and Global Warming. ILO (International Labour Office) Online. Recuperado em agosto de 2010, de http://www.ilo.org/ global/About_the_ILO/Media_and_public_ information/Feature_stories/lang-- en/WCMS_087408/index.htm.Probiodiesel, Programa Nacional de Produção e Uso do Biodiesel (2007). Brasília: Brazil. Recuperado em agosto de 2010, de http://www.biodiesel.gov.br/.RFA, Renewable Fuels Association. (2008). Annual Industry Outlook. Renewable Fuels Association, Washington DC, USA. Recuperado em
286 287
BIOENERGY FROM SUGARCANEREFERENCES
agosto de 2010, de http://www.ethanolrfa.org.RIRDC, Rural Industries Research and Development Corporation (2007). Bio- fuels in Australia–issues and prospects. Project no. CSW–44A. Barton, Australia: Australian Government. Recuperado em agosto de 2010, de http://www.rirdc.gov.au.Rothkopf, G. (2007). A Blue Print for Green Energy in the Americas: Strategic Analysis of Opportunities for Brazil and the Hemisphere. Featuring: The Global Biorfuels Outlook 2007. The Inter-American Development Bank.SAGPYA, Secretaria de Agricultura, Gaderia, Pesca y Alimentos e MECON, Ministry of Economy and Production of Argentina (2007). National Bio-fuels Proramme. Buenos Aires: Argentina. Recuperado em agosto de 2010, de http://www.sagpya.mecon.gov.ar.Schoemaker, P.J.H. (1995). Scenario Planning: A Tool for Strategic Thinking.Sloan Management Review: 25-40.Schwartz, P. (1991). The Art of the Long View. New York, USA: Doubleday.Steenblik R (2007). Bio-fuels–At What Cost? Government support for ethanol and biodiesel in selected OECD countries. The Global Subsidies Initiative of the International Institute for Sustainable Development (IISD), Geneva,Scenarios for mandatory bio-fuel blending targets: an application of intuitive logicsSwitzerland. Recuperado em agosto de 2010, de http://www.globalsub sidies.org/IMG/pdf/bio-fuel_synthesis_report_26_9_07_master_2_.pdfUK Department for Transport (2007). Promotion and Use of Bio-fuels in the United Kingdom during 2006: UK Report to European Commission under Article 4 of the Bio-fuels Directive (2003/30/EC). London, UK. Recuperado em agosto de 2010, de http://www.dft.gov.uk/pgr/roads/environment/ukre ptoecbio-fuels2003301?page=1.UKTRADEINFO (2008, February). Hydrocarbon Oils Bulletin. HM Revenue and Customs, Essex, UK. Recuperado em agosto de 2010, de http://www.uktradeinfo.co.uk.UNICA, Sugarcane Industry Union (2010). Many documents. Sao Paulo, Brazil.Recuperado em agosto de 2010, de http://english.unica.com.br/.USDA, Foreign Agricultural Service (2007). GAIN (Global Agriculture Information Network) Report Bio-fuels. Washingt DC, USA: many numbers. Recuperado em agosto de 2010, de http://www.fas.usda.gov.Van Dam J. et al. (2006, December). Overview of recent developments in sustainable biomass certification. Copernicus Institute for Sustainable Development, Utrecht University, and the Environment
and Natural Resources Service, Food and Agriculture Organization of the United Nations, Rome, Italy, Oeko-Institut (Institute for Applied Ecology), Darmstadt, IEA Bioenergy Task40. Recuperado em agosto de 2010, d e http://www.fairbiotrade. org_files\fwd.html.Wack, P. (1985, September/October). S c e n a r i o s : uncharted water ahead.Harvard Business Review, Bost, USA, 63 (5): 73-89.WBCSD, World Business Council on Sustainable Development (2002). Move. Sustain. The Sustainability Mobility Project. The Sustainable Mobility Project. Recuperado em agosto de 2010, de http://www.wbcsd.org/.WBCSD, World Business Council on Sustainable Development (2004). Mobility 2030: Meeting the challenges to sustainability. The Sustainable Mobility Project. Full report. Recuperado em agosto de 2010, de http://www. wbcsd.org/web/publications/mobility/mobil ity-full.pdf.WWI, The Worldwatch Institute (2006). Bio-fuels for Transportation: Global Potential an Implications for Sustainable Agriculture and Energy in the 21st Century. Extended Summary, Washingt, DC. German Federal Ministry of Food, Agriculture and Consumer Protection, Agency of Technical Cooperation and the Agency of Renewable Resources.Zarrilli, S. (2007). The emerging of bio-fuels market: regulatory, trade and development implications. UNCTAD (United Nations Conference on Trade and Development) Bio-fuels Initiative. New York, US and Geneva, Switzerland. Recuperado em agosto de 2010, de http://www.unctad.org/en/docs/ ditcted20064_en.pdf.Zylbersztajn, D. & Neves, M.F (orgs.) (2000). Economia e Gestão dos Negócios Agroalimentares. São Paulo: Pioneira.
CHAPTER 6
Ansoff, H. I. Estratégia empresarial. São Paulo: Mc Graw-Hill do Brasil, 1977.Boehlje, M. et al. STRATEGY DEVELOPMENT FOR THE FARM BUSINESS: OPTIONS AND ANALYSIS TOOLS. West Lafayette: Staff Paper, 2004. Boni, V.; Quaresma, S. J. Aprendendo a entrevistar: como fazer entrevistas em Ciências Sociais. Revista eletrônica dos pós-graduandos em Sociologia Política da UFSC, Santa Catarina, v. 2, n. 1, p. 68-80, jan.-jul. 2005. Available at <http://goo.gl/6lXV4>. Accessed: Dec 12, 2014.Campomar, M. C. Do uso do “estudo de caso” em pesquisas para dissertações e teses em Administração. Revista de Administração da
288 289
BIOENERGY FROM SUGARCANEREFERENCES
USP, São Paulo, v. 26, n. 3, p. 95-97, jul.-set. 1991.Chandler, A. D. Jr. Strategy and structure: chapters in the history of the American industry enterprise. Massachusetts: M.I.T Press, 1962.Chiavenato, Idalberto. Introdução à teoria geral da Administração. 7. ed. São Paulo: Elsevier Editora, 2004.CONAB – Companhia Nacional de Abastecimento. Acompanhamento de safra brasileira: cana de açúcar, terceiro levantamento, dezembro de 2016. Available at < http://www.conab.gov.br/OlalaCMS/uploads/arquivos/16_12_27_16_30_01_boletim_cana_portugues_-3o_lev_-_16-17.pdf>. Accessed: Jan 12, 2017.Daykin, Anne R.; Moffatt, Peter G. Analyzing ordered responses: A review of the ordered probit model. Understanding Statistics: Statistical Issues in Psychology, Education, and the Social Sciences, v. 1, n. 3, p. 157-166, 2002.Food and Agriculture Organization oh the United Nations - FAO. (n.d.). FAOSTAT. Retrieved Dezember 10, 2016, from http://www.faostat.fao.org/site/377/default.aspx Fávero, L. P., P. Belfiore, F. L. Silva; B. L. Chan. Análise de dados: modelagem multivariada para tomada de decisões (Data analysis: multivariate modelling for decision making). Elsevier, Rio de Janeiro, 2009. Fleury, M. T.; Fleury, A. Estratégias empresariais e formação de competências. São Paulo: Atlas, 2000.Gallardo, R. Karina et al. Market Intermediaries’ Ratings of Importance for Rosaceous Fruits’ Quality Attributes. International Food and Agribusiness Management Review, v. 18, n. 4, p. 121, 2015.Gao, Zhifeng et al. Consumer preferences for fresh citrus: impacts of demographic and behavioral characteristics. International Food and Agribusiness Management Review, v. 14, n. 1, 2011.Grant, R.M., 1996. Prospering in dynamically-competitive environments: organizational capability as knowledge integration.Gray, A., M. BOEHLJE, C. DOBBINS, AND C. EHMKE. 2004. “The Internal Analysis of Your Farm Business: What Is Your Farm’s Competitive Advantage?” Purdue Extension. EC-721, Purdue University.Hair JR, Joseph F. et al. Análise multivariada de dados. Análise multivariada de dados, 2005.Hair JR. J. F.; BABIN, B.; MONEY, A. H. et al. Fundamentos de métodos de pesquisa em administração. Porto Alegre: Bookman, 2005. Kotler, P.; KELLER, K. Administração de Marketing. 14 ed. São Paulo: Pearson, 2014.Lazzarini, S. G. Estudos de caso para fins de pesquisa: aplicabilidade e limitações do método. In: FARINA et al. (coord.). Estudo de caso em Agribusiness. São Paulo: Pioneira, 1997. p 9-13.Malhotra, N. K. Pesquisa de marketing: uma orientação aplicada. 3. ed.
Porto Alegre: Bookman, 2001. Mccreadie, Karen. A Arte da Guerra SUN TZU: uma interpretação em 52 ideias brilhantes: 1. ed. São Paulo: Globo, 2008.Neves, M. F.; TROMBIN, V. G. (coord.) A dimensão do setor sucroenergético: mapeamento e quantificação da safra 2013/14”. Ribeirão Preto: Markestrat, 2014. Neves, M. F.; TROMBIN, V. G. (coord.) A dimensão do setor sucroenergético: mapeamento e quantificação da safra 2013/14. Ribeirão Preto: Markestrat, 2014. Available at: <http://markestrat.org/pt-br/publicacao.php?id_item=474>>. Accessed: Nov 10, 2016.Porter, M. E. (1980) Competitive strategy: techniques for analyzing industries and competitors. New York: Free Press, 1980.Porter, Michael E. (1979) "How competitive forces shape strategy", Harvard business Review, March/April 1979.Porter, Michael E. (1987) "From Competitive Advantage to Corporate Strategy", Harvard Business Review, May/June 1987.Renewable Fuels Association - RFA. Industry Statistics - World Fuel Ethanol Production. < http://ethanolrfa.org/resources/industry/statistics/>. Accessed: Oct 18, 2016.Rodrigues, J. N.; et al. 50 Gurus Para o Século XXI. 1. ed. Lisboa: Centro Atlântico.PT, 2005.Selltiz, C. et al. Métodos de pesquisa nas relações sociais. São Paulo: Herder, 1967.UNITED STATES. (n.d.). U.S. Department of Agriculture. PSD Online. Retrieved November 6, 2016, from http://www.fas.usda.gov/psdonline/psdQuery.aspxVassalos, Michael; LI, Yingbo. Assessing the Impact of Fresh Vegetable Growers’ Risk Aversion Levels and Risk Preferences on the Probability of Adopting Marketing Contracts: A Bayesian Approach. International Food and Agribusiness Management Review, v. 19, n. 1, p. 25, 2016.
CHAPTER 7
Barra, G. M. J., Oliveira, V. C. S., & Machado, R. T. M. (2007). O papel das associac¸ões de interesse privado no mercado cafeeiro brasileiro. Revista de Gestão USP, 14(2), 17–31.Bennett, R. J., & Ramsden, M. (2000). The logic of membership of sectorial business associations. Review of Social Economy, 58(1), 17–42.Bennett, R. J., & Ramsden, M. (2007). The contribution of business associations to SMEs. International Small Business Journal, 25(1), 49.Bennett, R. J., & Robson, P. J. A. (2001). Exploring the market potential and bundling of business association services. Journal of Services Marketing, 15(3), 222–239. 254 L. Thomé e Castro et al. / Revista de Administração 51 (2016) 246–254
290 291
BIOENERGY FROM SUGARCANEREFERENCES
Blau, P. (1964). Exchange and power in social life. New York, NY: Wiley. Cafferata, G. L. (1979). Member and leader satisfaction with a professionalassociation: An exchange perspective. Administrative Science Quarterly, 24, 472–483.Conejero, M. A. (2011). Planejamento e gestão estratégica de associa¸cões de interesse privado do agronegócio: Uma contribui¸cão empírica (Doctoral’s thesis). São Paulo: Faculdade de Economia, Administrac¸ão e Contabilidade, Universidade de São Paulo.Durston, J. (2003). Capital social: Parte del problema, parte de la solución, su papel en la persistencia y en la superación de la pobreza en América Latina y el Caribe. In R. Atria, & M. Siles (Eds.), Capital social y reducción de la pobreza en América Latina y el Caribe: En busca de un nuevo paradigma (pp. 147–202). Santiago do Chile: Comissão Econômica para América Latina e o Caribe; University of Michigan Press.Hákansson, H., & Snehota, I. (1997). Analyzing business relationships. In D.Ford (Ed.), Understanding business markets. London: The Dryden Press.Homans, G. C. (1961). Social behavior: Its elementary forms. New York, NY: Harcourt, Brace and World.Kotler, P. (2000). Administra¸cão de Marketing. São Paulo, SP: Prentice Hall. Koutsou, S., Partalidou, M., & Ragkos, A. (2014). Young farmers’ social capitalin Greece: Trust levels and collective actions. Journal of Rural Studies, 34, 204–211.Mello, L. F., & Paulillo, F. O. T. (2005). Metamorfoses da rede de poder sucroalcooleira paulista e desafios da autogestão setorial. Agric, 52(1), 41–62.Nassar, A., & Zylbersztajn, D. (2004). Associac¸ões de interesse no Agronegócio Brasileiro. Revista de Administra¸cão, 39(2), 141–152.Newbery, R., Sauer, J., Gorton, M., Phillipson, J., & Atterton, J. (2013). Determi-nants of the performance of business associations in rural settlements in the United Kingdom: An analysis of members’ satisfaction and willingness-to-pay for association survival. Environment and Planning A, 45(4), 967–985.North, D. C. (1994). Economic Performance trough time. American Economic Review, 359–368.Oliver, R. L. (1996). Satisfaction: A behavioral perspective on consumer. New York, NY: Prince.Olson, M. (1971). The logic of collective: Public goods and the theory of groups. pp. 186. Cambridge: Harvard University Press.Perry, M. (2012). Trade associations in Ireland and New Zealand: Does insti-tutional context matter for collective action? Irish Journal of Management, 31(2), 19–44.Putnam, R. (2005). Comunidade e Democracia: A experiência da Itália
mod-erna. Rio de Janeiro, RJ: Editora Fundação Getúlio Vargas.Rao, H., Morrill, C., & Zald, M. N. (2000). Power plays: How social move-ments and collective action create new organizational forms. Research in Organizational Behavior, 22, 237–281.Van Zomeren, M., Spears, R., & Leach, C. W. (2008). Exploring psychological mechanisms of collective action: Does relevance of group identity influence how people cope with collective disadvantage? British Journal of Social Psychology, 47(2), 353–372.Williamson, O. E. (1985). The economic institutions of capitalism. USA: Macmillan.Zylbersztajn, D., & Farina, E. M. M. Q. (1999). Strictly coordinated food-systems: Exploring the limits of the Coasian firm. International Food and Agribusiness Management Review, 2(2), 249–265.
CHAPTER 8
BACHMANN, R. Trust, power and control n trans-organizational relations. Organization Studies , v. 22 n. 2, p. 337-365, 2001.BARDIN. L. Análise de conteúdo. Lisboa: Editora Edições 70, 1977.BERRY, L. L. Relationship marketing of services - growing interest, emerging perspectives. Journal of the Academy of Marketing Science, v. 23, n. 4, p 236-245, 1995.BOWERSOX, D.; CLOSS, D. Logística empresarial: o processo de integração da cadeia de suprimento. São Paulo: Atlas, 2001.CEPEA – Centro de Estudos Avançados em Economia Aplicada. PIB de Cadeias Agropecuárias: Cana-de-açúcar, junho de 2017. Available at https://www.cepea.esalq.usp.br/br/pib-de-cadeias-agropecuarias.aspx Accessed : May 12, 2018.CHUNG, J. et al. The impact of marketing orientation on Chinese retailer’s channel relationships. Journal of Business & Industrial Marketing, v. 26, n. 1, p. 14-25, 2011.CONAB – Companhia Nacional de Abastecimento. Acompanhamento de safra brasileira: cana de açúcar, quarto levantamento, abril de 2018. Available at https://www.conab.gov.br/index.php/info-agro/safras/cana Accessed: May10, 2018.CONSOLI, M. A.; PRADO, L. S.; MARINO, M. K. (Org.). AgroDistribuidor: o futuro da distribuição de insumos no Brasil. São Paulo: Atlas, 2011.FAO - Food and Agriculture Organization oh the United Nations - (n.d.). FAOSTAT. Retrieved Dezember 10, 2017, from http://www.faostat.fao.org/site/377/default.aspxGRAY, Allan et al. The Internal Analysis of Your Farm Business: What Is Your Farmʼs Competitive Advantage?, 2004. LEUSIE, M. Análise da cadeia de produção e desenvolvimento. In:
292 293
BIOENERGY FROM SUGARCANEREFERENCES
Lages, V.; Lagares, L.; Braga, C. (orgs.). Valorização de produtos com diferencial de qualidade e identidade: indicações geográficas e certificações para competitividade nos negócios. Brasília: Sebrae, 2005.LEWIN, J. F.; JOHNSTON, W. J. Relationship marketing theory in practice: a case study. Journal of Business Research, v. 39, p. 23-31, 1997.MASON, K.; LEEK, S. Communication practices in a business relationship: creating, relating and adapting communication artifacts through time. Industrial Marketing Management, v. 41, p. 319-332, 2012.NEVES, M. F. Demand driven strategic planning. New York: Routledge, 2012.NEVES, M. F. et al. Sugarcane growers’ situation in Brazil 2016. In: IFAMA World Forum & Symposium, June 18-21th, 2017, Miami (FL) USA. Proceedings.. Washington: International Food and Agribusiness Management Association, 2017.NEVES, M. F.; CONEJERO, M. A. Sistema agroindustrial da cana: cenários e agenda estratégica. Economia Aplicada, v. 11, n. 4, p. 1, 2007.NEVES, M. F.; WAACK, R. S. & MARINO, M. K. – Sistema Agroindustrial de Cana-de-Açucar: Caracterização das Transações entre Empresas de Insumos, Produtores de Cana e Usinas – Anais do XXXVI Congresso da Sociedade Brasileira de Economia e Sociologia Rural – SOBER, Poços de Caldas, MG., 10 a 14 de agosto de 1998, v. 01, p. 559-572.NG, E. An empirical study on the critical success factors of supplier-distributor relationships. Contemporary Management Research, v. 8, n. 2, p. 161-180, 2012.NIELSEN, B. The role of trust in collaborative relationships: a multidimensional approach. Management, v. 7, n. 3, p. 239-256, 2004.OMTA, O., TRIENEKENS, J., & BEERS, G. 2001. The knowledge domain of chain and network science. Journal on Chain and Network Science. Wageningen, v. 1, n. 2, 77–85.WILLIAMSON, Oliver E. Transaction cost economics: The natural progression. Journal of Retailing, v. 86, n. 3, p. 215-226, 2010.
CHAPTER 9
ANFAVEA (2007), National Automotive Vehicle Manufacturers Association, Many documents, available at: www.anfavea.com.br/tabelas.htmlBP (2006), Statistical Review of World Energy, BP, London, available at: www.bp.comFAO (2007), OECD-FAO Agricultural Outlook: 2007-2016, Food and Agriculture Organization of the United Nations and OCDE,
Organization for Economic Cooperation and Development, available at: www.agri-outlook.org/dataoecd/55/42/39098268.pdfIEA (2004), World Energy Outlook 2004, International Energy Agency, Paris, available at:www.worldenergyoutlook.org/2004.aspIEA (2005), World Energy Outlook 2005, International Energy Agency, Paris, available at:www.worldenergyoutlook.org/2005.aspIEA (2006), World Energy Outlook 2006, International Energy Agency, Paris.Leal, M.R.L.V. (2006), “O teor de energia da cana-de-ac¸u´car”, in Licht, F.O. (Ed.), 2nd Sugar and Ethanol Brazil, NIPE, Nu´cleo Interdisciplinar de Planejamento Estrate´gico. UNICAMP – Universidade Estadual de Campinas, Campinas, March, available at: www.nipeunicamp.org.brMoraes, M.A.F.D. (2007), “O mercado de trabalho da agroindu´stria canavieira: desafios e oportunidades”, Economia Aplicada, Vol. 11 No. 4, pp. 605-19.National Renewable Energy Laboratory (2006), From Biomass to Biofuels: NREL Leads the Way,Golden, National Renewable Energy Laboratory, Lakewood, CO, available at: www.nrel.govNew York Mercantile Exchange (2007), available at: www.nymex.com/index.aspxPoschen, P. (2007), Green Jobs and Global Warming, International Labour Office (ILO), Geneva, available at: www.ilo.org/global/About_the_ILO/Media_and_public_information/ Feature_stories/lang–en/WCMS_087408/Index.htmUNICA (2007), Sugarcane Industry Union, Many documents, UNICA, Sao Paulo, available at:www.portalunica.com.br/portalunicaenglish/?Secao¼lectures%20and%20presentationsUNICA (2010), Sugarcane Industry Union, available at: www.portalunica.com.br/ portalunicaenglish/?Secao¼lectures%20and%20presentationsWBCSD (2004), Mobility 2030: Meeting the Challenges to Sustainability. The Sustainable Mobility Project. Full Report, World Business Council on Sustainable Development, available at: www.wbcsd.org/web/publications/mobility/mobility-full.pdfWorldwatch Institute (2006), Biofuels for Transportation: Global Potential an Implications for Sustainable Agriculture and Energy in the 21st Century, Extended Summary, German Federal Ministry of Food, Agriculture and Consumer Protection, Agency of Technical Cooperation and the Agency of Renewable Resources, WWI, Washington, DC.Zarrilli, S. (2007), “The emerging of biofuels market: regulatory, trade
294 295
BIOENERGY FROM SUGARCANEREFERENCES
and development implications”, paper presented at United Nations Conference on Trade and Development (UNCTAD) BioFuels Initiative, New York, NY and Geneva, available at: www.unctad.org/ en/docs/ditcted20064_en.pdf
Further Reading ANP, National Agency of Petroleum, Natural Gas and Biofuels (2007), Rio de Janeiro, available at:www.anp.gov.brCamargo, J.M. (2007), Relac¸o˜es de trabalho na agricultura paulista no perı´odo recente, Tese (Doutorado em Cieˆncias Econoˆmicas) – Instituto de Economia da Universidade Estadual de Campinas, Universidade Estadual de Campinas, Campinas.RFA (2008), Annual Industry Outlook, Renewable Fuels Association, Washington, DC, available at:www.ethanolrfa.org
CHAPTER 10
ANFAVEA (National Automotive Vehicle Manufacturers Association), São Paulo, Brazil. Many documents available at http://www.anfavea.com.br/tabelas.html.ANP (National Agency of Petroleum, Natural Gas and Biofuels), Rio de Janeiro, Brazil. Many documents available at http://www.anp.gov.br.British Petroleum. 2006. Statistical Review of World Energy. London, UK, available at http://www.bp.com/bodycopyarticle.do?categoryId=1&contentId=7052055Chaddad, F.R. 2010. UNICA: Challenges to Deliver Sustainability in the Brazilian SugarcaneIndustry. International Food and Agribusiness Management Review 13(4): 173-192.IEA (International Energy Agency), World Energy Outlook 2006. Paris, France, available at http://www.iea.org/textbase/press/pressdetail.asp?PRESS_REL_ID=187.Leal, M.R.L.V. (2006). O teor de energia da cana-de-açúcar, NIPE, Núcleo Interdisciplinar de Planejamento Estratégico. UNICAMP -Universidade Estadual de Campinas. In: F.O.Licht’s 2nd Sugar and Ethanol Brazil. March, São Paulo. www.nipeunicamp.org.br.Poschen P. 2007. Green jobs and Global Warming. International Labor Office. Online: http://www.ilo.org/global/About_the_ILO/Media_and_public_information/Feature_storie s/lang--en/WCMS_087408/index.htm.RFA (Renewable Fuels Association), Annual Industry Outlook. Renewable Fuels Association, Washington DC, available at http://
www.ethanolrfa.org.UNICA (Brazilian Sugarcane Industry Association), São Paulo, Brazil. Many documents online: http://www.portalunica.com.br/portalunicaenglish/?Secao=lectures%20and%20presentati ons.Zarrilli, S. 2007. The emerging of biofuels market: regulatory, trade and development implica-tions,” UNCTAD (United Nations Conference on Trade and Development) Biofuels Iniative, New York and Geneva, available at http://www.unctad.org/en/docs/ditcted20064_en.pdf.
CHAPTER 12
BIOFUELS DIGEST. Biofuels mandates around the world: 2016. Available at: <http://www.biofuelsdigest.com/bdigest/2016/01/03/biofuels-mandates-around-the-world-2016/>. Accessed on: Nov 05, 2016.BRASIL. Fundamentos para a elaboração da pretendida contribuição nacionalmente determinada (iNDC) do Brasil no contexto do acordo de paris sob a UNFCCC. 2016b Available at: <http://www.mma.gov.br/images/arquivos/clima/convencao/indc/Bases_elaboracao_iNDC.pdf>. Accessed on: Jan 15, 2017. COMPANHIA NACIONAL DE ABASTECIMENTO - CONAB. Séries históricas. 2016a. Available at: <http://www.conab.gov.br/conteudos.php?a=1252&t=2&Pagina_objcmsconteudos=2#A_objcmsconteudos>. Accessed on: Dec 16, 2016. EMPRESA DE PESQUISA ENERGÉTICA – EPE. 2016b. O compromisso do brasil no combate às mudanças climáticas: produção e uso de energia. jun. 2016. Available at: <http://www.epe.gov.br/mercado/Documents/NT%20COP21%20iNDC.pdf>. Accessed on: Nov 17, 2016.HUANG, H.; LONG, S.; SINGH, V. Modeling and analysis: biodiesel and ethanol co-production from lipid-producing sugarcane. Biofuels, bioproducts, biorefining. v. 10, p. 299-315, 2016. MINISTÉRIO DO MEIO AMBIENTE – MMA. Fundamentos para a elaboração da pretendida contribuição nacionalmente determinada (iNDC) do Brasil no contexto do acordo de Paris sob a UNFCCC. 2016. Available at: <http://www.mma.gov.br/clima/convencao-das-nacoes-unidas/acordo-de-paris/itemlist/category/138-conven%C3%A7%C3%A3o-da-onu-sobre-mudan%C3%A7a-do-clima>. Accessed on: Jan 10, 2017.NEVES, M. F. Método para planejamento e gestão estratégica de sistemas agroindustriais (GESis). Revista de Administração da Universidade de São Paulo, 43(4), 331-343, 2008. NEVES, M. F.; TROMBIN, V. G. (Coord.) A dimensão do setor sucroenergético: mapeamento e quantificação da safra 2013/14. Ribeirão Preto: Markestrat, 2014. Available at: <http://markestrat.
296 297
REFERENCES
org/pt-br/publicacao.php?id_item=474>. Accessed on: Nov 10, 2016.Organisation for Economic Co-operation and Development – OECD. OECD-FAO agricultural outlook 2016-2025. 2016. Available at: <http://www.oecd.org/publications/oecd-fao-agricultural-outlook-19991142.htm>. Accessed on: Jan 12, 2017.SOUZA, Z. J. Bioeletricidade: potencial de uso de combustível como gás natural, óleo diesel e biomassa para geração térmica. Fórum de geração termoelétrica: cenários. Rio de Janeiro, maio 2014. Available at: <http://unica.com.br/documentos/apresentacoes>. Accessed on: Jun 11, 2014. UNIÃO DA INDÚSTRIA DE CANA-DE-AÇÚCAR – UNICA. Unicadata. 2016c. Available at: < http://www.unicadata.com.br/index.php?idioma=1>. Accessed on: Dec 06, 2016UNITED STATES. Departamento of Agriculture - USDA. PSD online. 2016a. Available at: <http://www.fas.usda.gov/psdonline/psdQuery.aspx>. Accessed on: Dec 12, 2016.UNITED STATES DEPARTMENT OF AGRICULTURE – USDA. Ethanol data. 2016b. Available at: <http://www.ers.usda.gov/topics/farm-economy/bioenergy/background.aspx>. Accessed on: Nov 18, 2016.
298
Sugarcane and all of its chain is an example of bionergy, both toward supplying houses, industries and moving cities, and as ethanol to fuel our cars being a fuel which pollutes less than gasoline, and also energy for human beings, through sugar, a pure and cheap energy source. All those benefits come in a suistainable way, with a chain which emits less carbon and environmental impacts when compared to others, a green sea on the field of capturing carbon from atmosphere, a sustainable and renewable chain with high indexes of circular economy practices.
The book is a collection of the advancements of bioenergy from sugarcane, the panorama of the sector in Brazil and in the world, experiences in other countries and a view of this important bioenergy chain to the world


