VU Research Portal Dating individual diamond growth zones Gress, M.U. 2020 document version Publisher's PDF, also known as Version of record Link to publication in VU Research Portal citation for published version (APA) Gress, M. U. (2020). Dating individual diamond growth zones: A first step towards quantifying the temporal evolution of the mantle carbon cycle. General rights Copyright and moral rights for the publications made accessible in the public portal are retained by the authors and/or other copyright owners and it is a condition of accessing publications that users recognise and abide by the legal requirements associated with these rights. • Users may download and print one copy of any publication from the public portal for the purpose of private study or research. • You may not further distribute the material or use it for any profit-making activity or commercial gain • You may freely distribute the URL identifying the publication in the public portal ? Take down policy If you believe that this document breaches copyright please contact us providing details, and we will remove access to the work immediately and investigate your claim. E-mail address: [email protected]Download date: 31. Jan. 2022
Transcript
VU Research Portal
Dating individual diamond growth zones
Gress, M.U.
2020
document versionPublisher's PDF, also known as Version of record
Link to publication in VU Research Portal
citation for published version (APA)Gress, M. U. (2020). Dating individual diamond growth zones: A first step towards quantifying the temporalevolution of the mantle carbon cycle.
General rightsCopyright and moral rights for the publications made accessible in the public portal are retained by the authors and/or other copyright ownersand it is a condition of accessing publications that users recognise and abide by the legal requirements associated with these rights.
• Users may download and print one copy of any publication from the public portal for the purpose of private study or research. • You may not further distribute the material or use it for any profit-making activity or commercial gain • You may freely distribute the URL identifying the publication in the public portal ?
Take down policyIf you believe that this document breaches copyright please contact us providing details, and we will remove access to the work immediatelyand investigate your claim.
2.1 What is the genetic origin of inclusions in diamond?
2.2 What are the number, timing and spatial scale of diamond-forming events?
2.3 Potential implications for the temporal evolution of the deep carbon cycle?
3. Methods
4. Outline
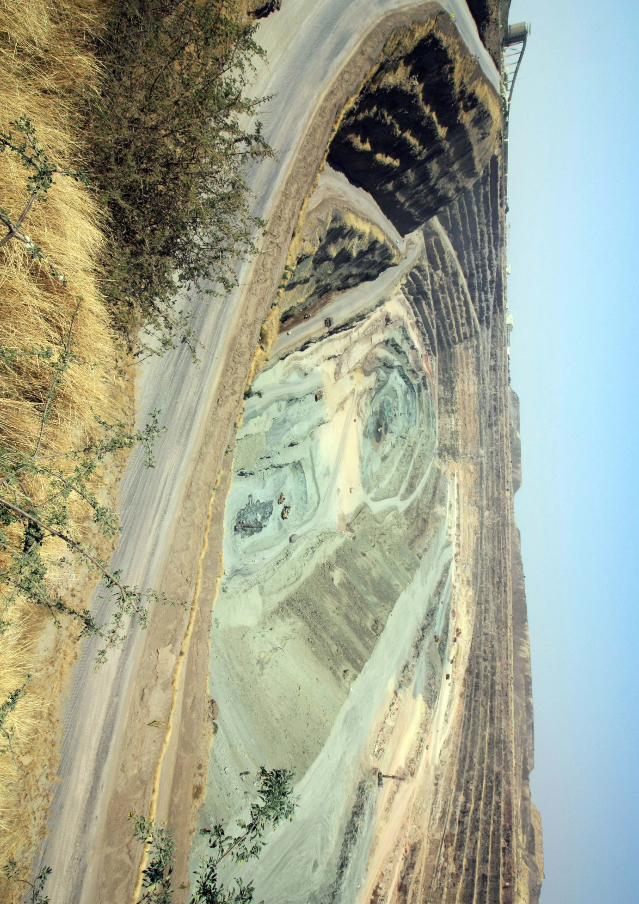
Previous pages. Orapa diamond mine (AK1) in NE Botswana, 09/2017. The open pit has a surface extent of 1.8 x 1.2 km and is currently ~ 250 m deep. The mine has a grade of ~ 88 carats per 100 tons with a daily production of ~ 22,000 tons.
INTRODUCTION
21
1. Introduction
Diamonds are […] by far more than the famous lyrics of a Broadway composition that made
them the object of desire for many. Their inimitable sparkle along with the physical properties,
as the hardest known natural material on Earth, has fascinated people for thousands of years.
However, these unique properties enable the deployment of diamond beyond the gem-stone
and jewellery industry in a broad range of applications e.g., optical/high-powered laser systems,
quantum information technology, invasive surgical treatment or in highly abrasive and corrosive
environments. In addition, diamond mining operations locally provide a platform for economic
stability that theoretically enables the local people to benefit from diamond revenues in various
sectors (education, health, etc., see Brook (2012)).
Scientifically, diamond’s strength and inert nature enables it to endure severe conditions
prevailing inside Earth’s mantle (100’s of kilometres deep and temperatures > 1000°C). The
inertness with its surrounding environment makes it the ideal carrier for ambient mantle material
that has been encapsulated during diamond growth and subsequently shielded from alteration
until its accidental transport to the surface through kimberlite magmatism. The study of these
time-capsules and their inclusions provides us with an image of the structure and processes
prevailing in the otherwise inaccessible interior of our planet. Given the age of some diamonds
(up to 3,500,000,000 years) they allow us to trace the evolution of Earth since its early existence.
1.1 Rationale of the thesis
In the past decades, research has made major advances in understanding the conditions required
for diamond formation, its crystal properties and for the identification of the source carbon, as
summarized in the following sections. Diamonds also enable scientists to trace major processes
that affected Earth in the past to better understand processes occurring at present, such as plate
tectonics (Shirey & Richardson, 2011) or the scale of element (re-)cycling over time (Shirey et al.,
2013; 2019; Howell et al., 2020). Such studies, however, require precise dating of diamonds
before correct implications can be drawn, and the timing of diamond formation has been the
subject of active research.
Botswanan diamonds are known for their unusual predominance of the eclogitic
paragenesis (see 1.2.4.4) that is ascribed to subduction of oceanic lithosphere into Earth’s mantle
(Ireland et al., 1994; Foley et al., 2002; Stachel et al., 2004b). Thus, in this thesis the study of
diamonds from several Botswanan locations (see 1.4) enables discussion of three controversial
aspects of diamond petrology that are expanded upon in 1.5 at the end of this chapter:
- 1st objective: The genetic origin of diamond inclusions
- 2nd objective: The number, timing and spatial scale of diamond-forming events
- 3rd objective: The implications for the temporal evolution of the deep carbon cycle
CHAPTER 1
22
The following sections provide a general overview of lithospheric diamonds, the geological
background and information on the samples of this study to introduce the reader to the topic.
For further information digging deeper into the topic, the text refers to the extensive literature
reviews available.
1.2 Diamonds
Elemental carbon occurs in two major forms in nature, graphite and diamond. Graphite is one of
the softest minerals, consisting of layers of weakly bound carbon. In contrast, the polymorph
diamond with a cubic crystal structure is the hardest known mineral that widely occurs in extra-
/terrestrial bodies (Allamandola et al., 1993; Alexander, 2001) and allows major implications to
be determined on the processes responsible for their formation (see compilation in Pearson et al.
(2003)).
Depending on carbon saturation in the diamond-forming fluid, diamond occurs as
monocrystalline crystals (like the samples in this study), polycrystalline aggregates, or with fibrous
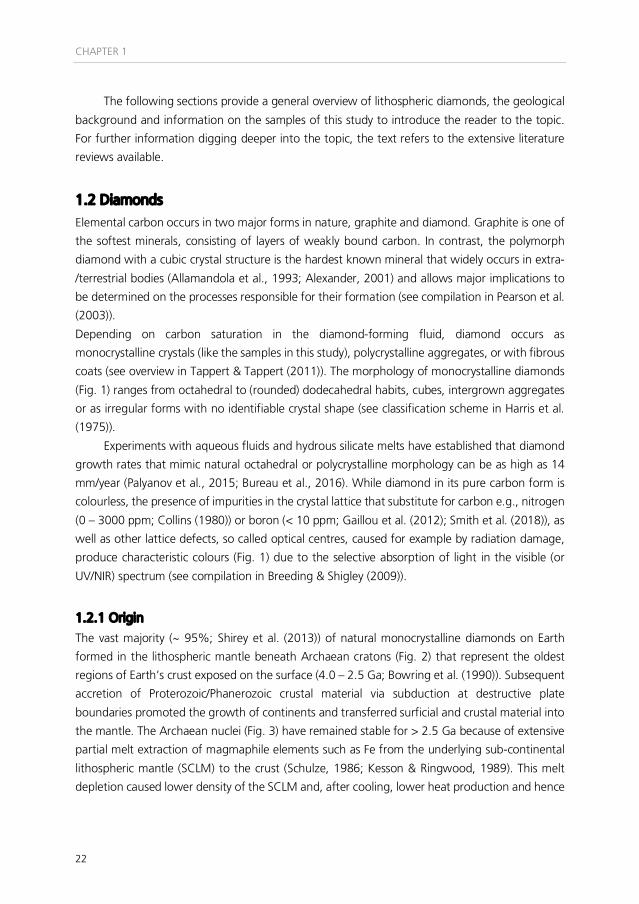
coats (see overview in Tappert & Tappert (2011)). The morphology of monocrystalline diamonds
(Fig. 1) ranges from octahedral to (rounded) dodecahedral habits, cubes, intergrown aggregates
or as irregular forms with no identifiable crystal shape (see classification scheme in Harris et al.
(1975)).
Experiments with aqueous fluids and hydrous silicate melts have established that diamond
growth rates that mimic natural octahedral or polycrystalline morphology can be as high as 14
mm/year (Palyanov et al., 2015; Bureau et al., 2016). While diamond in its pure carbon form is
colourless, the presence of impurities in the crystal lattice that substitute for carbon e.g., nitrogen
(0 – 3000 ppm; Collins (1980)) or boron (< 10 ppm; Gaillou et al. (2012); Smith et al. (2018)), as
well as other lattice defects, so called optical centres, caused for example by radiation damage,
produce characteristic colours (Fig. 1) due to the selective absorption of light in the visible (or
UV/NIR) spectrum (see compilation in Breeding & Shigley (2009)).
1.2.1 Origin
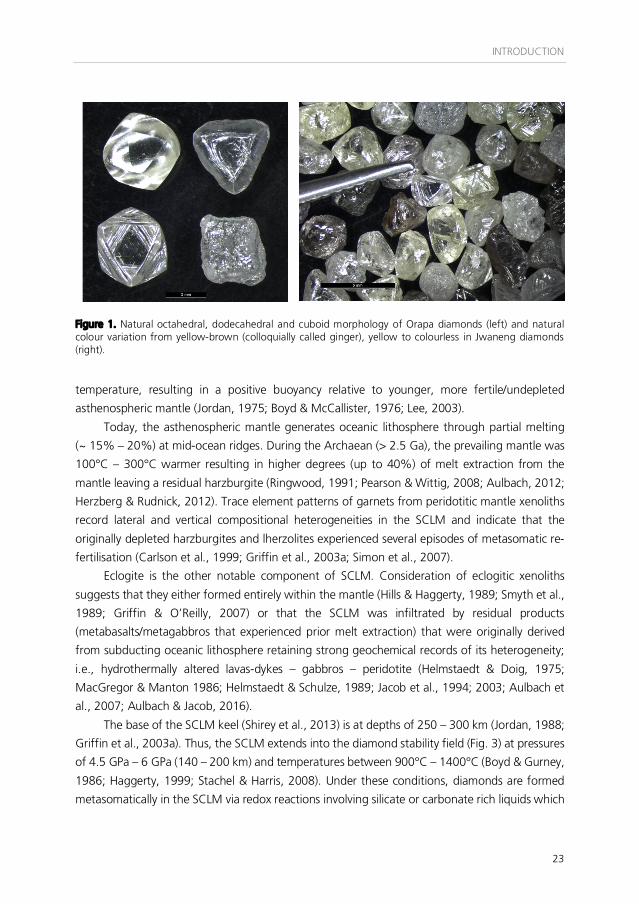
The vast majority (~ 95%; Shirey et al. (2013)) of natural monocrystalline diamonds on Earth
formed in the lithospheric mantle beneath Archaean cratons (Fig. 2) that represent the oldest
regions of Earth’s crust exposed on the surface (4.0 – 2.5 Ga; Bowring et al. (1990)). Subsequent
accretion of Proterozoic/Phanerozoic crustal material via subduction at destructive plate
boundaries promoted the growth of continents and transferred surficial and crustal material into
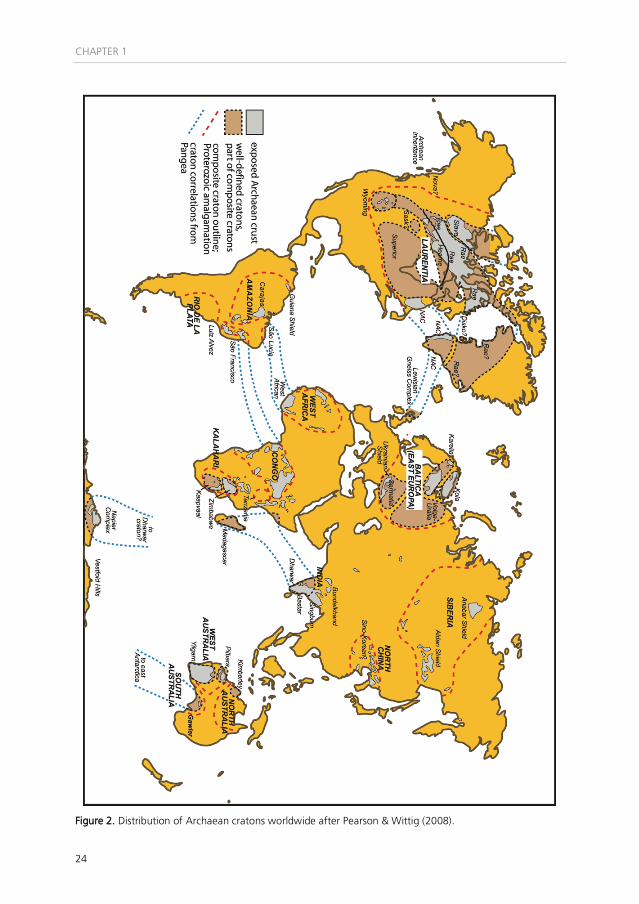
the mantle. The Archaean nuclei (Fig. 3) have remained stable for > 2.5 Ga because of extensive
partial melt extraction of magmaphile elements such as Fe from the underlying sub-continental
lithospheric mantle (SCLM) to the crust (Schulze, 1986; Kesson & Ringwood, 1989). This melt
depletion caused lower density of the SCLM and, after cooling, lower heat production and hence
INTRODUCTION
23
Figure 1. Natural octahedral, dodecahedral and cuboid morphology of Orapa diamonds (left) and natural colour variation from yellow-brown (colloquially called ginger), yellow to colourless in Jwaneng diamonds (right).
temperature, resulting in a positive buoyancy relative to younger, more fertile/undepleted
MacGregor & Manton 1986; Helmstaedt & Schulze, 1989; Jacob et al., 1994; 2003; Aulbach et
al., 2007; Aulbach & Jacob, 2016).
The base of the SCLM keel (Shirey et al., 2013) is at depths of 250 – 300 km (Jordan, 1988;
Griffin et al., 2003a). Thus, the SCLM extends into the diamond stability field (Fig. 3) at pressures
of 4.5 GPa – 6 GPa (140 – 200 km) and temperatures between 900°C – 1400°C (Boyd & Gurney,
1986; Haggerty, 1999; Stachel & Harris, 2008). Under these conditions, diamonds are formed
metasomatically in the SCLM via redox reactions involving silicate or carbonate rich liquids which
CHAPTER 1
24
Figure 2. Distribution of Archaean cratons worldwide after Pearson & Wittig (2008).
INTRODUCTION
25
Figure 3. Structure of continental crust (top) subdivided into an Archaean nucleus (rose) surrounded by Proterozoic (purple) and younger (light yellow) continental crustal units together with the schematic structure of the sub-continental lithospheric (SCLM) and convecting asthenospheric mantle, after Shirey et al. (2013). Physical conditions for diamond growth in the Earth (bottom), after Cartigny et al. (2014).
CHAPTER 1
26
are commonly referred as high-density C-H-O fluids or low degree melts at supra-solidus
conditions (Deines, 1980; Schrauder & Navon, 1993; Sobolev et al. 1998; 2009; Stachel et al.,
2005; Stachel & Luth, 2015). Henceforth, the term fluid is used in this research in context with
diamond-forming processes, because distinction between the role of high-density fluids and
melts is difficult to resolve.
Several studies recognised a small fraction of sublithospheric or so-called super-deep
diamonds that formed in the lower mantle at depths exceeding 660 km but that are not further
discussed in this thesis (Harte et al., 1999; McCammon, 2001; Stachel & Harris, 2009; Harte,
2010; Smith et al, 2016; 2018). Other lithospheric occurrences include ultrahigh-pressure
diamonds formed in the context of collisional orogenic belts (Sobolev & Shatsky, 1990;
Ogasawara, 2005) or impact craters from meteorites (Masaitis, 1995).
1.2.2 Xenocrystic relationship to kimberlites
As outlined in section 1.3.1, lithospheric diamonds form in the SCLM via metasomatic processes
and reside in the stable parts beneath Archaean cratons. At the surface, these diamonds occur
as xenocrysts (pre-existing crystals in an igneous host) in kimberlite (or lamproite) volcanic pipes,
or due to their erosion in placer deposits. Accordingly, they were transported to the surface
during kimberlite magmatism that can imprint surface textures through oxidation (e.g., trigons,
pits, hillocks; see overview in Tappert & Tappert (2011)) on monocrystalline diamonds
(Fedortchouk et al., 2019).
Kimberlites are ultrabasic, Si-undersaturated magmas, low in Al and Na, rich in CO2 and
H2O that are generated at the base of the lithosphere (cf, lamproites) or beneath (Kjarsgaard et
al., 2009; Woodhead et al., 2019; Pearson et al., 2019). During their rapid ascent to the surface,
within a few hours (O’hara et al., 1975; Edwards & Russell, 1998), the melts sample prevailing
crustal and mantle xenoliths and xenocrysts (such as diamond) that record the composition of
the local SCLM (Pearson et al., 2019). Kimberlites are distributed globally and some argue they
originate from a largely isolated mantle reservoir that evolved over ~ 2.5 Ga and partly
experienced massive contamination by subducted material in the Mesozoic (Woodhead et al.,
2019).
1.2.3 Nitrogen content & aggregation
The nitrogen content and its aggregation state within the diamond plays an important role in
determining diamond colour. Importantly, this crystal lattice defect facilitates a classification
scheme (Evans, 1992; Mainwood, 1994). Nitrogen is thought to be compatible in diamond during
precipitation under all known redox conditions (Thomassot et al., 2007; Stachel & Harris, 2009;
Petts et al., 2015; Hogberg et al., 2016) and diffusion takes place on a scale of 0.1 µm at SCLM
conditions, over > 4.5 Ga (Koga et al., 2003). Through the application of non-destructive Fourier
Transform Infrared Spectroscopy (FTIR), the nitrogen content and its aggregation state can be
quantitatively determined.
INTRODUCTION
27
Diamonds with no detectable nitrogen content by FTIR (usually ≤ 10 at.ppm) are classified
as Type II, whereas diamonds with higher content are classified as Type I (see overview in Tappert
& Tappert (2011)). Type I diamonds can be subdivided based on the manner of the nitrogen
coordination in the diamond crystal lattice. During diamond precipitation from a fluid, nitrogen
is included into the crystal lattice as single (or isolated) substitutional atoms, so called C-centres.
A diamond containing the majority of nitrogen as C-centres is known as Type Ib. At prevailing
mantle conditions (900°C – 1400°C and 4.5 GPa – 6 GPa) diffusion on a relatively short length
scale (~ 30 – 100 nm; Koga et al. (2003)) of nitrogen atoms within the diamond lattice leads to
progressive aggregation as pairs of nitrogen atoms, so called A-centres, and sub-sequently to
four nitrogen atoms surrounding a vacancy, so call B-centres. A diamond containing the majority
of nitrogen as A-centres is known as Type IaA (Boyd et al., 1994) and as B-centres, it is known
as Type IaB (Boyd et al., 1995). The majority of natural diamonds are Type IaAB i.e., a combination
of A- and B-centres. The conversion rate between these aggregation states is a function of
nitrogen content, temperature and time and can be used to calculate a relative mantle storage
temperature (i.e., depth) or mantle residence time for the diamond when three of these four
parameters are known (Taylor et al., 1990; Mendelssohn & Milledge, 1995; Leahy & Taylor,
1997). Importantly, these are average temperatures experienced over the diamond’s entire
residence in the mantle lithosphere. Since N content and aggregation can be quantified by FTIR,
calculations on relative diamond age can be coupled with the thermobarometry determined on
while insight into mantle storage temperature can be constrained by radiometric inclusion dating
(Pearson et al., 1998; Aulbach et al., 2009b; Smit et al., 2016a).
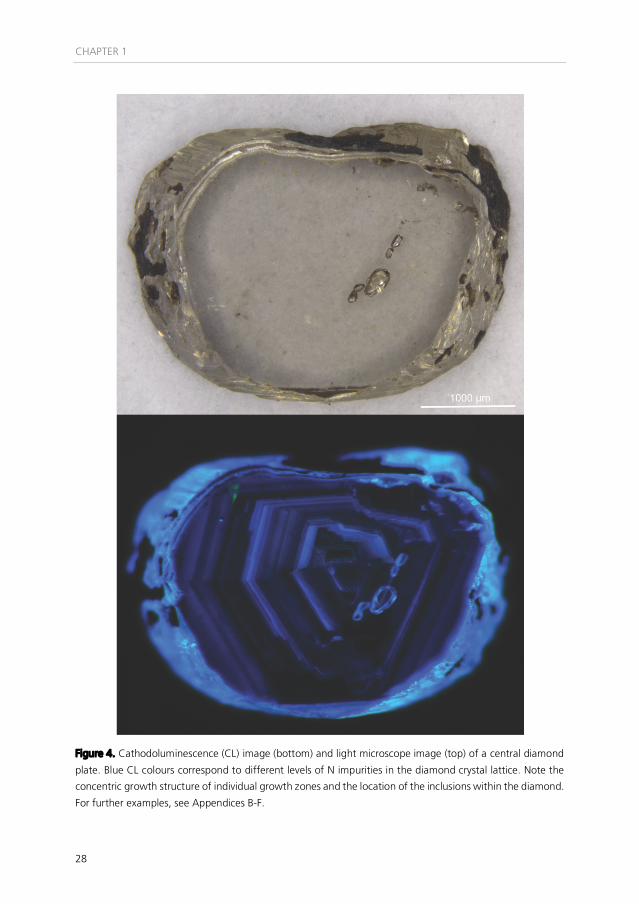
Combined cathodoluminescence (CL) and FTIR (later coupled with C-N isotope) studies on
central growth plates of diamonds (Fig. 4; Appendices B – F) reveal the growth history of
diamonds and have established that many individual diamonds record evidence of resorption and
marked internal zonation (Bulanova, 1995; Howell et al., 2012a). These observations indicated
marked variations in the composition of diamond-forming fluids that formed the individual
growth zones (Wiggers de Vries et al., 2013; Hogberg et al., 2016; Smit et al., 2016b) and they
demonstrate a potentially complex growth history within the diamond that will affect the N
aggregation systematics (Kohn et al., 2016).
However, the theoretical understanding of N aggregation during mantle residence still
provides a good first approximation for relative diamond ages unless they were stored for
extended periods (100’s Myr) in unusually cold (< 900°C) or warm (> 1300°C) lithosphere.
(Richardson & Harris, 1997; Pearson et al., 1998; 1999; Navon, 1999; Aulbach et al., 2009b; Smit
et al., 2016b; Timmerman et al., 2017). Importantly, however, the high thermal stability of the
lithosphere means that regional cooling rates are low (0.4°C – 1°C per Myr; Bedini et al., 2004;
Michaut & Jaupart, 2004) so that temperature slowly decrease, unless there is a major thermal
perturbation due to a tectono-magmatic event.
CHAPTER 1
28
Figure 4. Cathodoluminescence (CL) image (bottom) and light microscope image (top) of a central diamond
plate. Blue CL colours correspond to different levels of N impurities in the diamond crystal lattice. Note the
concentric growth structure of individual growth zones and the location of the inclusions within the diamond.
For further examples, see Appendices B-F.
INTRODUCTION
29
1.2.4 Inclusion paragenesis
Inclusions studied in this thesis are generally between 50 – 500 µm in (spherical) size and 1 – 150
µg in weight. Diamond inclusions (silicates, sulphides, oxides) reflect the prevailing composition
of the growth environment in the SCLM which allows for classification into different genetic
groups. Understanding the genetic origin of the inclusions and their time of formation are crucial
aspects to interpret processes within the SCLM and to constrain its structure (see objectives in
1.5.1 & 1.5.2).
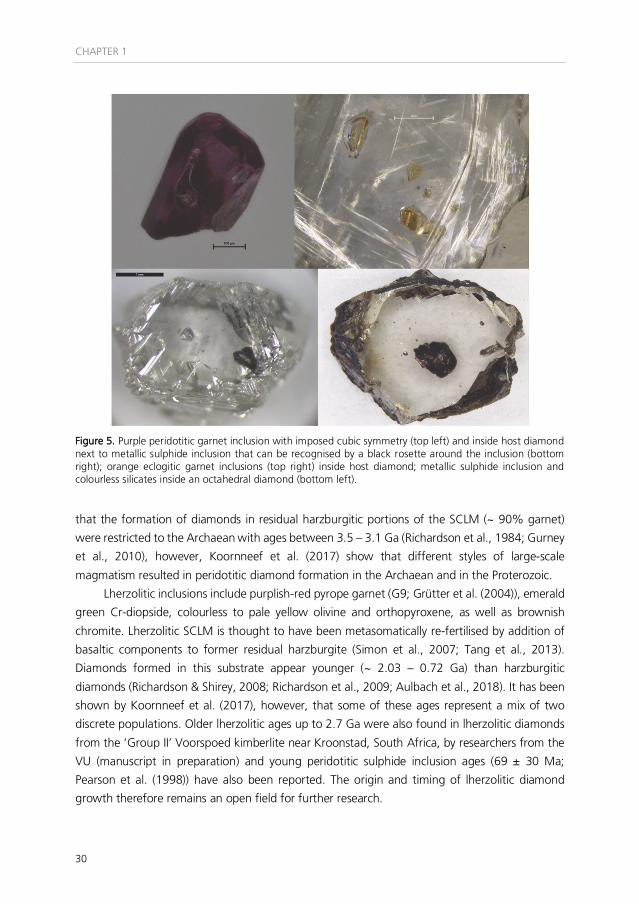
Initial distinction between silicate mineral assemblages is based on differences in colour (Fig.
5) between, for example, eclogitic pyrope-almandine garnet (orange) and peridotitic pyrope
garnet (purple) inclusions (see overview in Tappert & Tappert (2011)). Sulphide inclusions are
almost ubiquitously associated with a characteristic rosette fracture system around the inclusion,
however, their paragenesis cannot be discriminated by optical examination. The paragenesis of
sulphide inclusions is discriminated by Ni and Os contents (Yefimova et al., 1983; Bulanova et al.,
1996; Pearson et al., 1998; Pearson & Shirey, 1999). At high temperatures in the mantle,
sulphides are present as mono-sulphide solid solution (mss). During cooling after kimberlite
eruption and transport to the near surface, low temperature phases such as pentlandite
((Fe,Ni)9S8), pyrrhotite (Fe1-xS), chalcopyrite (CuFeS2) and pyrite (FeS) are exsolved.
In general, diamond-forming fluids are considered to perturbate the most incompatible
elements (e.g., LREE or large ion lithophile elements) in the protolith mineralogy and allow to
make inferences on the fluid composition, while the original protolith signature is reflected in
more compatible elements (e.g., major or high field-strength elements; see Stachel et al.
(2004b)). Geochemical analysis of the inclusions allows a more precise classification of the
diamonds (see review in Stachel & Harris (2008)). In this respect, two main inclusion parageneses
have been recognised, peridotitic (P-type) and eclogitic (E-type), that relate to the two dominant
types of mantle rocks, peridotite and eclogite (Sobolev, 1977; Meyer, 1987; Bureau et al., 2016).
Mantle peridotite and associated minerals can be subdivided into a predomi-nantly
harzburgitic, lherzolitic and minor wehrlitic suites (Dawson & Stephens, 1975; Stachel & Harris,
2008). A third, less abundant transitional paragenesis, websteritic (W-type) is also recognised
(Gurney, 1984; Sobolev, 1984). The relative abundance of the parageneses varies from mine to
mine (Stachel & Harris, 2008; 2009), hence, the mineral abundance studies of this research (see Chapters 3, 5, 6) will add valuable insight for the distribution in Botswanan diamonds.
1.2.4.1 Peridotitic (P-type) suite
Peridotitic inclusions include greenish to colourless olivine, pyrope garnet, ortho- and
clinopyroxene (e.g., emerald green Cr-diopside), brown to black chromite, as well as Ni- (> 12
wt.%) and Os- (2 – 30 ppm) rich sulphides. With respect to garnet the classification is based on
diagnostic Ca and Cr contents (see classification in Grütter et al. (2004)).
Harzburgitic purple coloured (G10) pyrope garnets (Fig. 5) are characterised by low CaO (0
– 3 wt.%) and high Cr2O3 (1 – 22 wt.%) contents (Grütter et al., 2004). It was previously assumed
CHAPTER 1
30
Figure 5. Purple peridotitic garnet inclusion with imposed cubic symmetry (top left) and inside host diamond next to metallic sulphide inclusion that can be recognised by a black rosette around the inclusion (bottom right); orange eclogitic garnet inclusions (top right) inside host diamond; metallic sulphide inclusion and colourless silicates inside an octahedral diamond (bottom left).
that the formation of diamonds in residual harzburgitic portions of the SCLM (~ 90% garnet)
were restricted to the Archaean with ages between 3.5 – 3.1 Ga (Richardson et al., 1984; Gurney
et al., 2010), however, Koornneef et al. (2017) show that different styles of large-scale
magmatism resulted in peridotitic diamond formation in the Archaean and in the Proterozoic.
Lherzolitic inclusions include purplish-red pyrope garnet (G9; Grütter et al. (2004)), emerald
green Cr-diopside, colourless to pale yellow olivine and orthopyroxene, as well as brownish
chromite. Lherzolitic SCLM is thought to have been metasomatically re-fertilised by addition of
basaltic components to former residual harzburgite (Simon et al., 2007; Tang et al., 2013).
Diamonds formed in this substrate appear younger (~ 2.03 – 0.72 Ga) than harzburgitic
diamonds (Richardson & Shirey, 2008; Richardson et al., 2009; Aulbach et al., 2018). It has been
shown by Koornneef et al. (2017), however, that some of these ages represent a mix of two
discrete populations. Older lherzolitic ages up to 2.7 Ga were also found in lherzolitic diamonds
from the ‘Group II’ Voorspoed kimberlite near Kroonstad, South Africa, by researchers from the
VU (manuscript in preparation) and young peridotitic sulphide inclusion ages (69 ± 30 Ma;
Pearson et al. (1998)) have also been reported. The origin and timing of lherzolitic diamond
growth therefore remains an open field for further research.
INTRODUCTION
31
1.2.4.3 Eclogitic (E-type) suite
Eclogitic inclusions, that constitute the majority of samples in this research, include orange
pyrope-almandine garnet (Fig. 5), pale green omphacite, blue kyanite, colourless coesite, black
elongated rutile and corundum. The garnets (G3) are low in Cr2O3 (< 1 wt.%) with a broad range
in CaO (6 – 32 wt.%; Grütter et al. (2004)). Sulphides have low Ni contents (< 12 wt.%) and
high Re/Os ratios due to their low (< 800 ppb) Os contents (see Pearson et al. (1998)).
Eclogitic inclusions have been shown to have geochemical signatures inherited from Earth’s
near surface such as Eu anomalies (Jacob, 2004; Weiss et al. 2015; Aulbach & Jacob 2016), highly
variable oxygen isotope ratios (Schulze et al., 2003; Sobolev et al., 2011; Ickert et al., 2013) and
mass independently fractionated (MIF) sulphur signatures from the Archaean (Chaussidon et al.,
1987; Farquhar et al., 2002; Thomassot et al., 2009; Smit et al., 2019a) that established a general
link to subduction (see review in Shirey et al. (2013)). Inclusion ages range from ~ 2.9 – 0.1 Ga
(Richardson et al., 2004; Smit et al., 2016a; Timmerman et al., 2017) and suggest the occurrence
of multiple distinct generations (see review in Gurney et al. (2010)) that potentially allow tracing
of subduction and major plate tectonic processes (Shirey & Richardson, 2011).
1.2.4.4 Transitional suite
This suite includes websteritic and pyroxenitic inclusions, predominantly garnet (orange – brown),
ortho- (colourless) and clinopyroxene (light green) and sulphides. Garnets fall in the G4 and G5
categories after Grütter et al. (2004), sulphides overlap with compositions intermediate between
E- and P-type (Pearson et al., 1998). Websteritic mantle appears related to re-fertilisation
reactions of slab-derived melts with peridotitic SCLM (Aulbach et al., 2002; Taylor et al., 2003;
Bodinier et al., 2008; Smit et al., 2014) or the occurrence of reaction envelopes around an
ascending mantle plume (Sleep, 2006; Viljoen et al., 2018). The Orapa cluster, part of this study,
is one of the few locations on the Kalahari Craton where a websteritic diamond suite is present
(Gurney et al., 1984; Deines et al., 1993; Viljoen et al., 1998, 2018; Aulbach et al., 2002; Stachel
& Harris, 2008; Helmstaedt et al., 2010) enabling this study to provide new age and petrogenetic
constraints on this paragenesis.
1.2.5 Constraints on carbon sources
Carbon isotope ratios determined on distinct diamond growth zones are used to characterise the
diamond-forming fluid and to identify potential sources for carbon (Deines, 1980). In addition to
the energetically unfavourable direct conversion from graphite to diamond (Boyd et al., 1988;
1994), diamonds form through redox reactions i.e., by reduction of carbonate (CO2 and CO%&')
or by oxidation of methane (CH4) in variously buffered mantle environments (Shirey et al., 2013;
2019; Cartigny et al., 2014).
The carbon isotope composition is expressed in delta notation relative to Vienna PeeDee
Belemnite (VPDB), δ13CVPDB [‰] = (13C/12Csample / 13C/12CVPDB - 1) x 103. Similar notation is used for
nitrogen isotopes, δ15NAIR [‰] = (15N/14Nsample / 15N/14NAIR - 1) x 103, that are expressed relative to the
CHAPTER 1
32
composition of air (Cartigny et al., 2014; Hogberg et al., 2016). In terrestrial diamonds, δ13C
ranges from -41‰ to +5‰ with a mode at -5 ± 1‰ (Cartigny et al., 2014). Peridotitic diamonds
are relatively restricted to between -10‰ to -1‰, whereas eclogitic diamonds cover the full range
(Cartigny et al., 2014). Several models have been proposed to account for this isotopic variability
(see reviews in Cartigny et al. (2014); Shirey et al. (2019); Howell et al. (2020)) and include a
heterogeneous carbon isotope composition of the mantle (Deines, 1980; Deines et al., 1993),
different carbon sources in the mantle and the involvement of recycled (e.g., marine carbonates,
organic material) crustal material (Galimov, 1991; Kirkley et al., 1991; Li et al., 2019), high
temperature Rayleigh fractionation processes in the mantle (Javoy et al., 1986; Kirkley et al.,
1991; Cartigny et al., 1999; Thomassot et al., 2007) and to a lesser extent, changing P-T- fO2 and
pH conditions during diamond growth (Deines et al., 1989; Boyd et al., 1992; Sverjensky &
Huang, 2015).
In support of Jablon & Navon (2016), recent findings of Krebs et al. (2019) suggest a similar
origin between fibrous and monocrystalline diamonds involving common fluids. Their various
end-members (saline, high-/low-Mg carbonatitic and silicic; Schrauder & Navon, 1994; Weiss et
al., 2009) were previously only attributed with the genesis of fibrous diamonds (Navon et al.,
1988).
1.3 General information
The diamonds used in this research are from the 93.1 Ma Cretaceous Orapa kimberlite cluster in
NE Botswana (Allsopp et al., 1989; Davis, 1977), including Orapa (OR), Letlhakane (LK) and
Damtshaa (DM) mines (see Chapter 5) that are 20 to 30 km apart and extend over an area of ~
450 km2. Additional diamonds are from the 235 ± 4 Ma kimberlites (Kinny et al., 1989) at
Jwaneng (JW) mine (see Chapters 2 to 4), Earth’s richest diamond mine by value (Field et al.,
2008). Jwaneng is located 360 km to the southwest of the Orapa cluster in SE Botswana. The
distance between these locations allows a detailed comparison of diamond-forming processes
occurring in the SCLM on a regional scale.
In order to obtain a representative set of inclusion-bearing diamonds from these locations,
several sampling campaigns were undertaken at the Diamond Trading Company Botswana
(DTCB) in Gaborone in the past 5 years. This provided the opportunity to perform an inclusion
abundance study on run-of -mine production (see Chapters 3, 5 and 6). Such studies are rare
due to the restricted access to the samples. Sampling concentrated on diamonds containing
multiple large (> 50 μm) garnet (gnt), clinopyroxene (cpx) and sulphide inclusions. In total, over
370,000 gem to near-gem quality diamonds (~ 194,000 carats) ranging in size from 0.1 to 0.8
carat (DTC sieve classes +07, +09, +11 and 3 grainers) were characterised visually for their
inclusion (> 10 µm in size) content using binocular microscopes by a total of 12 researchers.
INTRODUCTION
33
1.3.1 Geological setting
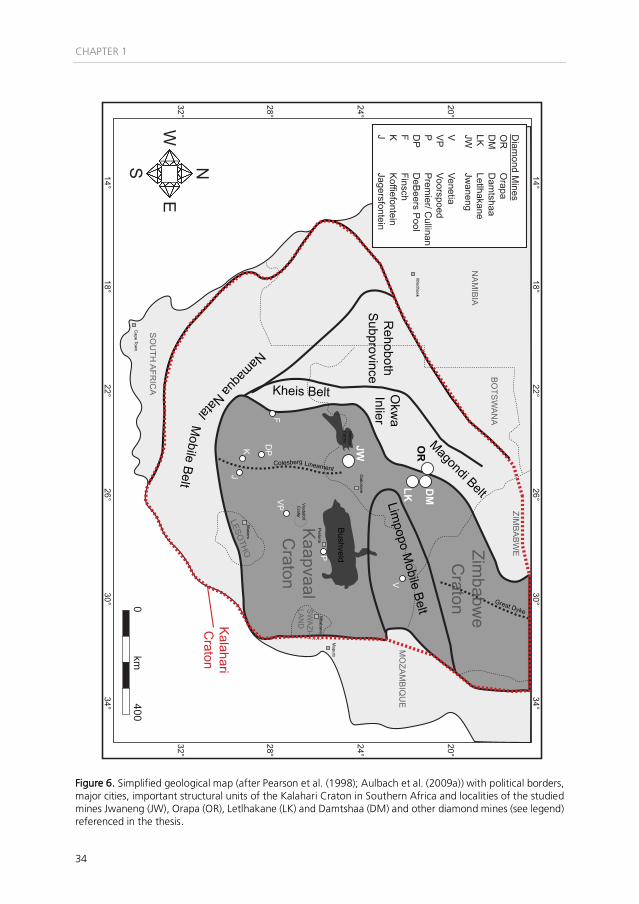
Geologically, Jwaneng is situated near the NW margin of the Archaean Kaapvaal Craton, whereas
the Orapa cluster is located on the boundary between the Proterozoic Kheis-Okwa-Magondi
Mobile Belt and the Archaean Zimbabwe Craton (Fig. 6). Together with the Limpopo Mobile Belt,
all these geological units are the major constituents of the well-studied Kalahari Craton (Jacobs
et al., 2008) and its underlying SCLM (see review in Griffin et al. (2003b)) that has an extended
history as a part of several super-continents e.g., Rodinia, Gondwana or Pangea (Oriolo & Becker,
2018).
The Kaapvaal Craton (1.2 x 10⁶ km2) formed between 3.7 – 2.7 Ga and consists of two
shields, the ~ 3.7 Ga Witwatersrand block in the east and the ~ 3.2 Ga Kimberley block in the
west that are in juxtaposition along the N-S trending Colesberg magnetic lineament (see review
in Thomas et al. (1993)). The ~ 3.64 Ga Ancient Gneiss Complex and the 3.5 – 3.2 Ga Barberton
Greenstone Belt in the Witwatersrand block represent the oldest shield in southern Africa and
carry remnants of the first continental crust that formed between ~ 3.2 to 3.08 Ga (Armstrong
et al., 1990; de Wit et al., 1992; Thomas et al., 1993; Moser et al., 2001). The oldest harzburgitic
diamond inclusions formed around this time (3.2 – 3.3 Ga) and indicate that the lithospheric
mantle in this area was already > 150 km thick (Richardson et al., 1984; de Wit et al., 1992). The
oldest exposed crystalline basement rocks in the Kimberley block are the ~ 3.18 – 2.88 Ga
Kraaipan and Amalia greenstone belts (Schmitz et al., 2004). The Witwatersrand block
amalgamated via west-dipping subduction/collision with the Kimberley block and stabilised the
Craton between 2.9 – 2.7 Ga (de Wit et al., 1992; Schmitz et al., 2004). Late Archaean (3.1 –
2.6 Ga) craton development is further characterised by extensional processes in the central and
southern parts resulting in the Dominion, Witwatersrand, Pongola and Ventersdorp sedimentary
basins (de Wit et al., 1992; Thomas et al., 1993).
The Zimbabwe Craton, to the northeast of the Kaapvaal, also consists of two different
blocks. The Tokwe Terrain is made up of ~ 3.5 – 3.3 Ga tonalitic gneisses with relicts of older
greenstone successions that are unconformably overlain by ~ 2.9 – 2.8 Ga conglomerates,
volcanics and sedimentary sequences; the Northwestern accretionary Terrain is separated from
the Tokwe block by 2.75 – 2.65 Ga greenstone belts (Griffin et al., 2003b). Both terrains
experienced potassic granite intrusions associated with the Great Dyke and its satellites at 2.69 –
2.57 Ga (Wilson, 1996). The Kaapvaal and Zimbabwe cratons subsequently amalgamated along
the Limpopo Province at ~ 2.7 – 2.6 Ga during the Limpopo Orogeny (Barton & van Reenen,
1992; de Wit et al., 1992; Roering et al., 1992; Goodwin, 1996; Frei et al., 1999).
The Limpopo Mobile Belt, marking their suture zone, is subdivided into three zones of which
the Central Zone experienced crustal stabilisation at ~ 3.4 – 3.27 Ga (Zeh et al., 2007; 2010) and
was proposed to represent a separate micro-continent carrying the 3.8 Ga granulite-
/amphibolite-facies Sand River Gneiss (Griffin et al., 2003b). The Northern and Southern Zones
are considered as high-grade metamorphic equivalents of the reworked Kaapvaal and Zimbabwe
craton margins (van der Meer et al., 2013). The SCLM beneath the Limpopo Mobile Belt is ~ 235
CHAPTER 1
34
Figure 6. Simplified geological map (after Pearson et al. (1998); Aulbach et al. (2009a)) with political borders, major cities, important structural units of the Kalahari Craton in Southern Africa and localities of the studied mines Jwaneng (JW), Orapa (OR), Letlhakane (LK) and Damtshaa (DM) and other diamond mines (see legend) referenced in the thesis.
20°
24°
28°
32°
20°
24°
28°
32°
34°30°
26°22°
18°14°
34°30°
26°22°
18°14°
Bushveld
Molopo
Farms
Vredefort C
rater
Pretoria
Cape Tow
n
Windhoek
Gaborone
Maseru
Mbabane
Maputo
NA
MIB
IA
SO
UTH
AFR
ICA
BO
TSW
AN
A
LESOTH
O
SW
AZI-
LAN
D
MO
ZAM
BIQ
UE
ZIMB
AB
WE
Namaqua NatalKheis Belt O
kwa
InlierMobile Belt
Limpopo M
obile Belt
Magondi Belt
Rehoboth
Subprovince
Colesberg
Great Dyke
Kaapvaal C
raton
Zimbabw
eC
raton
Lineament
Diam
ond Mines
OR
O
rapaD
M
Dam
tshaaLK
Letlhakane
JW
Jwaneng
V
VenetiaV
P Voorspoed
P P
remier/ C
ullinanD
P D
eBeers P
oolF
FinschK
K
offiefonteinJ
Jagersfontein
NS
EW
0400
km
JW OR
DM
LK
FD
PKJ
VP
P
V
Kalahari
Craton
INTRODUCTION
35
km deep and records melt depletion (up to 50%) between 50 – 130 km with Si-enriched
metasomatism characteristic of the Kaapvaal Craton, whereas the origin of deeper, more
enriched parts between 130 – 235 km is unclear (van der Meer et al., 2013). The upper mantle
part beneath the Limpopo Mobile Belt is also believed to represent the most depleted and least
modified SCLM that was sampled by kimberlites (Griffin et al., 2003b). The SCLM beneath the
Kaapvaal and Zimbabwe cratons extends to 250 – 300 km depth and thickened via melt additions
from the asthenosphere or underplating (James et al., 2001). The formerly depleted
harzburgitic/lherzolitic SCLM has been progressively re-fertilised by melt metasomatism during
episodes of massive intraplate magmatism (Griffin et al., 2003b) including the 2.06 Ga Bushveld
Large Igneous Province (LIP) and its satellites (e.g., at Molopo Farms), that carry world’s largest
reserves of platinum-group elements (Cawthorn & Walraven, 1998; Zeh et al., 2015), the 1.11
Ga Umkondo LIP (Hanson et al., 2004a) or the 0.18 Ga Karoo-Ferrar LIP (Svensen et al., 2012).
Post-Archaean and early Proterozoic evolution in the area was dominated by intra-cratonic
extension accompanied by sedimentation of the Transvaal Supergroup into which the Bushveld
LIP intruded. The Vredefort crater (~ 300 km in diameter), the largest verified impact crater on
Earth, formed around ~ 2.02 Ga (Roering et al., 1990). Potentially during the ~ 2.0 – 1.7 Ga
Eburian orogenesis, the Kheis-Okwa-Magondi Belts containing the ~ 2.0 Ga Mahalapy granite-
migmatite complex as basement began to amalgamate along the north western edge of the
Kaapvaal Craton (Thomas et al., 1993). The Kheis Belt consists of siliciclastic sediments and
volcanic rocks deposited on the passive margin of the Kaapvaal Craton, the Okwa Inlier basement
is overlain by low-grade clastic sediments and limestones, the Magondi Belt contains thick
sequences of meta-sediments and -volcanics, interpreted as deposits on the passive margin of
the Zimbabwe Craton (Griffin et al., 2003b). West of the Kheis-Okwa-Magondi Belt, the
Rehoboth Subprovince that reflects the transition from a volcanic arc into a back-arc setting
accreted between 1.8 – 1.75 Ga and marks the completion of the assembly of the 7 x 10⁶ km2
Proto-Kalahari Craton (Jacobs et al., 2008). These mobile belts contain relatively fertile reworked
Archaean SCLM that mixed with Paleo-/Mesoproterozoic material (Griffin et al., 2003b).
Subsequent crustal growth e.g., during the 1.2 – 1.0 Ga Kibaran orogeny or formation of
the Namaqua-Natal Orogenic Belt, accompanied by widespread anorogenic magmatism between
1.4 – 1.1 Ga, occurred through accretion of Paleo-/Mesoproterozoic microcontinents or arcs and
resulted in the 13 x 106 km2 Kalahari Craton (Jacobs et al., 1993; 2008; Thomas et al., 1993). At
~ 0.95 – 0.9 Ga, the end of the Namaqua-Natal orogenesis, extensive continental rifting initiated
the breakup of the Rodinia supercontinent and culminated in the assembly of the Gondwana
supercontinent (Oriolo & Becker, 2018). Around this time, the Neoproterozoic Pan-African
Orogeny formed e.g., the Damara Belt, which is part of world’s largest sediment-hosted Cu (Pb-
Zn-Co-Ag-W-Ta) deposits in the Kalahari, West Congo and Central African Copperbelts (Thomas
et al., 1993; Oriolo & Becker, 2018; Borg & Gauert, 2018).
Following the Pan-African tectono-thermal event, the Cape Supergroup was deposited
along the southern passive continental margin of the Kalahari Craton in the Early Phanerozoic
CHAPTER 1
36
and formed the Cape Fold Belt in the Carboniferous to Early Permian; terrestrial sediments of the
Karoo Supergroup were subsequently deposited in an intracontinental basin in which the
extensive Karoo flood basalts mark the initiation of Gondwana breakup in the Early Jurassic
(Thomas et al., 1993). In this tectonic setting, kimberlitic magmatism occurred over a period of
520 – 80 Ma and transported diamonds from the SCLM to the surface at several locations (see
review in Field et al. (2008)). Further details on the geological background and current state of
research are provided in Chapters 3 to 6.
1.3.1.1 Jwaneng
Jwaneng mine, 120 km west of Gaborone, Botswana, is part of a field encompassing 28
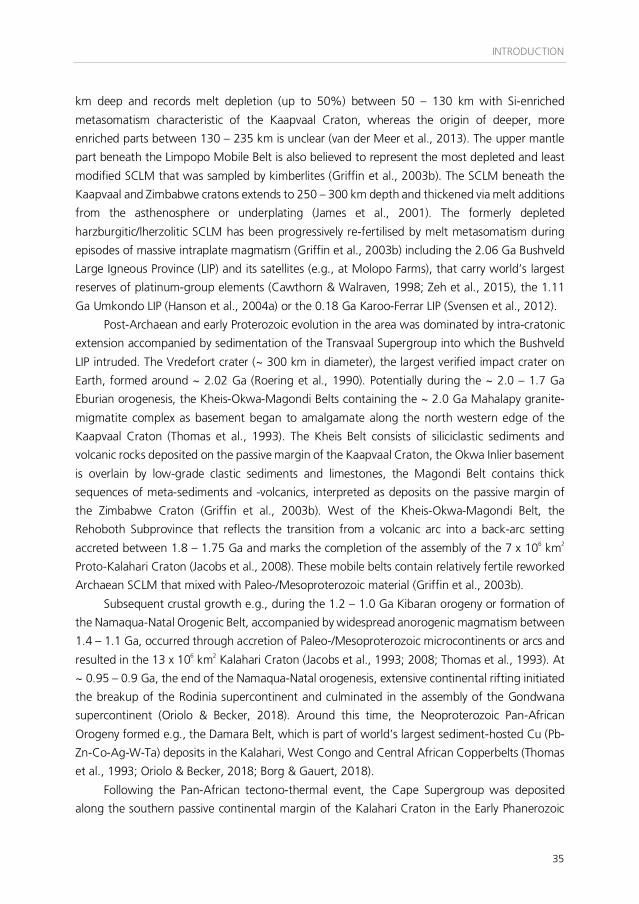
kimberlites (Brown et al, 2008). The open-pit mine (Fig. 7) itself consists of three steep-sided
interconnected pipes (North, Centre and South Lobes) with a surface area of 54 ha and
dominated by volcaniclastic and dark pyroclastic kimberlite (2424D/K2).
At 235 ± 4 Ma, the kimberlites intruded into quarzitic shales and dolomites of the
Proterozoic Transvaal Supergroup and the pipe contains inclusions of unconsolidated Karoo
sediments that have been eroded in the meantime (Kinny et al., 1989; Brown et al, 2008; Field
et al., 2008). Notably, they are the only kimberlites in southern Africa with Permian emplacement
ages (Field et al., 2008). The Transvaal Supergroup in this area is also cross-cut by the products
of voluminous intraplate volcanism associated with the adjacent 1.1 Ga Umkondo Large Igneous
Province (LIP; Hanson et al., 2004a). Discovered underneath a 40 m thick layer of Kalahari
sediments in 1973, Jwaneng has been in operation since 1982 and is considered to be the world’s
richest diamond mine by value and produced ~ 11.9 million carats in 2018. According to
Debswana, the open-pit is currently mined in ‘Cut-8’ until 2024, increasing the depth of mine
from 400 to 650 m. The mine’s lifespan will be extended until at least 2035 by developing Cut-
9 that is expected to mine an additional 53 million carats.
diamonds and their inclusions have been the subject of extensive research and have contributed
to a better understanding of diamond-forming processes and the involved components (see
introduction of Chapters 2 to 4).
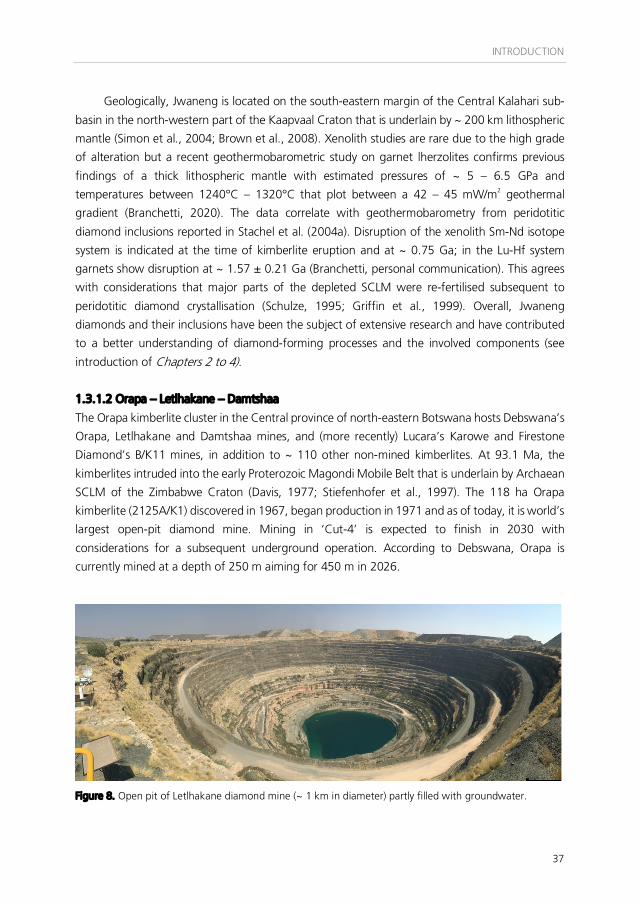
1.3.1.2 Orapa – Letlhakane – Damtshaa
The Orapa kimberlite cluster in the Central province of north-eastern Botswana hosts Debswana’s
Orapa, Letlhakane and Damtshaa mines, and (more recently) Lucara’s Karowe and Firestone
Diamond’s B/K11 mines, in addition to ~ 110 other non-mined kimberlites. At 93.1 Ma, the
kimberlites intruded into the early Proterozoic Magondi Mobile Belt that is underlain by Archaean
SCLM of the Zimbabwe Craton (Davis, 1977; Stiefenhofer et al., 1997). The 118 ha Orapa
kimberlite (2125A/K1) discovered in 1967, began production in 1971 and as of today, it is world’s
largest open-pit diamond mine. Mining in ‘Cut-4’ is expected to finish in 2030 with
considerations for a subsequent underground operation. According to Debswana, Orapa is
currently mined at a depth of 250 m aiming for 450 m in 2026.
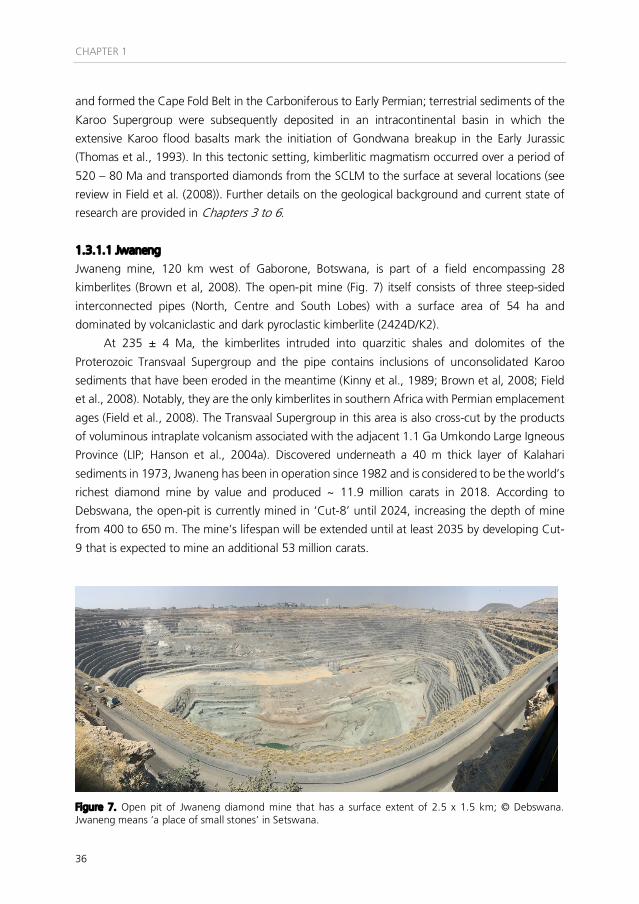
Figure 8. Open pit of Letlhakane diamond mine (~ 1 km in diameter) partly filled with groundwater.
CHAPTER 1
38
The nearby 15.2 ha Letlhakane mine (2125D/K1 & D/K2) was in operation from 1977 –
2017 (Fig. 8) and its tailings are now processed extending the mine’s life-time for 20 years.
Damtshaa, a 24.5 ha satellite operation of Orapa, consists of four kimberlites that are planned
to be successively mined from 2003 until 2017 (2125B/K12), 2026 (2125B/K9) and thereafter
(2125B/K1 & B/K15). The Orapa, Letlhakane and Damtshaa mines yielded a combined production
of 12.2 million carats in 2018. In addition to Jwaneng, Letlhakane is the second major source of
samples for this thesis and hosts a varied suite of mantle xenoliths, mainly peridotites
(Stiefenhofer, 1993; Stiefenhofer et al., 1997). At Orapa, peridotite xenoliths are absent
potentially due to the highly weathered nature of the kimberlite and eclogite xenoliths dominate
at the surface (Shee & Gurney, 1977; McDonald & Viljoen, 2006). Previous studies of peridotitic
xenoliths from Letlhakane record pressure-temperature conditions comparable to xenoliths from
kimberlites from the Kaapvaal Craton and define a geotherm corresponding to 40 mW/m2
surface heat flow (Borst, 2012; Stiefenhofer, 1993; Stiefenhofer et al., 1997). The source region
of Letlhakane diamonds experienced a higher degree of partial melting relative to Orapa (Deines
& Harris, 2004).
Many of the first diamond and inclusion studies were initially undertaken using diamonds
from the Orapa kimberlite cluster. As for Jwaneng, the samples contributed to a better
understanding of diamond-forming processes, the abundance of inclusion paragenesis and
interpretation of carbon sources (see introduction of Chapter 5).
2. Research Objectives
The following sections describe the research objectives outlined in section 1.1 and summarise the
state of current knowledge on the corresponding topics. They also highlight major advances in
diamond research in the past decades.
2.1 What is the genetic origin of inclusions in diamond?
In order to correctly interpret diamond inclusion ages, it has to be established at what time
mineral inclusions formed with respect to the diamond host i.e., before (proto-) or during (syn-
chronous) diamond crystallisation. Moreover, it is important to establish if chemical equilibrium
existed between the inclusion and the surrounding mantle/diamond-forming media at the time
of encapsulation (syn-genetic).
The cubo-octahedral morphology imposed by diamond on incorporated inclusions (Fig. 5)
that naturally crystallise in different crystal systems such as the cubic (for garnet), monoclinic (for
cpx) or hexagonal (for monosulphide solid solution) has long been considered as proof for
inclusions precipitating synchronously (simultaneously) with the enclosing diamond growth zone
from the diamond-forming fluid (Futergendler & Frank-Kamenetsky, 1961; Orlov, 1977; Sobolev,
1977, Harris & Gurney, 1979; Meyer, 1987; Bulanova, 1995). However, the presence of proto-
genetic (pre-existing) inclusions, that are considered to have formed prior to diamond
INTRODUCTION
39
crystallisation lacking such cubo-octahedral morphology, raise concerns with this general
assumption (Bulanova, 1995; Taylor et al., 2003; Nestola et al., 2014; 2017; Agrosi et al., 2016;
Nimis et al., 2016).
Possible evidence for proto-genetic inclusions/de-coupling of diamond and inclusion-
forming sources is provided by sulphur isotope anomalies that indicate the presence of Archaean
surficial material in Proterozoic sulphide inclusions (Chaussidon et al., 1987; Farquhar et al., 2002,
Thomassot et al., 2009; Smit et al., 2016a; 2019a). These data undoubtedly indicate that older
sulphur was incorporated into sulphides that were subsequently trapped in diamonds and raise
the question of whether siderophile elements are recycled within the SCLM at the time of
diamond formation or whether the sulphides are protogenetic. However, modelling of chemical
diffusive equilibration between a fluid and a protogenetic inclusion under diamond-forming
conditions (1100°C and 5 GPa) previously demonstrated that isotopic resetting would generally
occur over geologically short time scales (Nestola et al., 2019). Conservative estimates of these
authors yielded diffusion rates for REE (e.g., Sm) of ~ 0.52 Myr to equilibrate a garnet grain of
100 µm radius. For a 500 µm spherical pyrrhotite (the most common sulphide inclusion in
diamond) Os diffusion (> 500°C) would have occurred on a similar time-scale ≤ 0.5 Ma (Brenan
et al., 2000).
Thus, the term ‘synchronous’ has been proposed to describe the relationship between
diamond and its inclusions (Nestola et al., 2017) because uncertainties in inclusion dating studies
commonly are in the order of 10’s of millions of years, far above the equilibration rates. Such
equilibrium state is also indicated by isochronous relationships between different inclusions from
the same diamond that have the same initial ratio (Westerlund et al., 2004; Aulbach et al., 2018).
In addition, syngenetic textures in protogenetic inclusions may also provide strong evidence that
inclusions co-crystallised with the diamonds.
In order to place inclusion ages in a geological context, the growth histories of the dated
individual diamonds must be determined. The complex growth histories between host diamond
and inclusion have been studied by an integrated approach (Wiggers de Vries et al., 2011)
combining CL imaging and electron backscatter diffraction (EBSD) to quantitatively identify the
crystallographic orientations of the diamond inclusions and to study the diamond-inclusion
interface in eclogitic samples from Jwaneng (see Chapter 2).
2.2 What are the number, timing and spatial scale of diamond-forming events?
Diamonds have a broad range of size, colour and morphology that indicates that they represent
multiple suites (see Chapter 3) that formed in different parts of the SCLM (Stachel et al., 2004b;
Stachel & Luth, 2015). Although only 1 – 10% of all diamonds are inclusion-bearing (Gurney,
1986; Deines & Harris, 2004; Stachel & Harris, 2008), their study allows general implications to
be reached for inclusion-free diamonds (Richardson et al., 1984). Inclusion dating studies (see
review in Smit & Shirey (2019)) initially focussed on the U-Pb (Welke et al., 1974; Kramers, 1979,
Eldrige et al., 1991) and Ar-Ar systems (Burgess et al., 1989; Phillips et al., 1989). Subsequently,
CHAPTER 1
40
the Sm-Nd (Richardson et al., 1984) and Re-Os (Pearson et al., 1998) isochron techniques,
coupled with spectroscopic (CL, FTIR) and compositional (C-N isotopes) properties of the diamond
host (Boyd et al., 1987; Taylor et al., 1990; Deines et al., 1993; Bulanova, 1995; Cartigny et al.,
1998) appeared to provide strong evidence of episodic diamond formation, recurring throughout
the Archaean and Proterozoic Eras (see reviews in Stachel & Harris (2008); Gurney et al. (2010);
Helmstaedt et al. (2010)).
Due to the low Os content in single sulphide inclusions and thus, low Os ion yield, the
analysis of single sulphide inclusions for Re-Os isotope systematics can be achieved using a
secondary electron multiplier (SEM) in peak-jumping mode as the detection unit in mass
spectrometry. This approach is not viable for the Rb-Sr or Sm-Nd isotope analysis of silicate
inclusions as precisions better than 0.05% are required for good age determinations. Hence,
either large individual (> mg) silicates (Smith et al., 1991) were analysed using Faraday Cups (FCs)
to establish model and isochron ages or garnet/cpx inclusions with similar characteristics were
pooled (10 – 100 µg per inclusion) in order to obtain a quantifiable signal for mass spectrometry
(Richardson et al., 1984; 1990).
Technical advances in isotope mass spectrometry through the deployment of latest
generation highly sensitive detectors (FCs attached to amplifiers with 1013 Ohm resistors;
Koornneef et al. (2013); (2014)) now allow dating of individual diamond silicate inclusions (see Chapters 4, 5) using the Sm-Nd system (Timmerman et al., 2017; Koornneef et al., 2017).
Together with the well-established Re-Os system for sulphide inclusions (Pearson et al., 1998),
the application of these different isotopic systems is capable of validating whether mineral
inclusions recovered from the same growth zone of a diamond are in equilibrium with the
surrounding mantle and diamond-forming fluid and thus, record the time of diamond growth
(see Chapter 6).
Yet, this combined approach of Sm-Nd and Re-Os dating on co-genetic silicate and sulphide
inclusions from the same diamond growth zone has not been undertaken before. Inclusions from
adjacent growth zones within a diamond will establish the time between individual diamond-
forming events. Examination of diamonds from adjacent kimberlites (Orapa, Letlhakane,
Damtshaa) within a cluster will provide a local (10’s of km) snapshot of diamond formation (see Chapter 5). Comparison to other kimberlites (Jwaneng) will establish if regional scale (100’s of
km) processes occurred across the Kalahari Craton (see Chapters 5, 6).
2.3 Potential implications for the temporal evolution of the deep carbon cycle?
Carbon, along with hydrogen, nitrogen and oxygen, is one of the basic constituents for life on
Earth and by tracing its cycling between distinct reservoirs (atmosphere, hydrosphere, lithosphere)
it is possible to draw major conclusions regarding planetary scale differentiation and plate
tectonics (Shirey & Richardson, 2011). However, the large carbon reservoirs inside Earth (~ 1016
to 1017 tons carbon; Dasgupta & Hirschmann, 2010) are particularly difficult to access (Shirey et
al., 2019; Howell et al., 2020).
INTRODUCTION
41
Although diamonds represent only a fraction (83 ppt; Kelemen & Manning, 2015) of Earth’s
mantle, they have the potential to address fundamental questions of how Earth has evolved.
According to Shirey et al. (2013), ~ 30% of diamonds worldwide contain crustal/sedimentary
carbon recycled from Earth’s surface and transferred into the mantle via subduction. By relating
eclogitic inclusion ages to C and N isotope characteristics of individual diamond growth zones,
information concerning the deep cycling of carbon and other volatile species may be obtained
(see Chapters 4 to 6). Implications derived from the scale and style of diamond formation may
ultimately provide a first step for the study of the temporal evolution of the deep carbon cycle
(see Chapter 7) in order to contribute to models of the past, present and future carbon cycle.
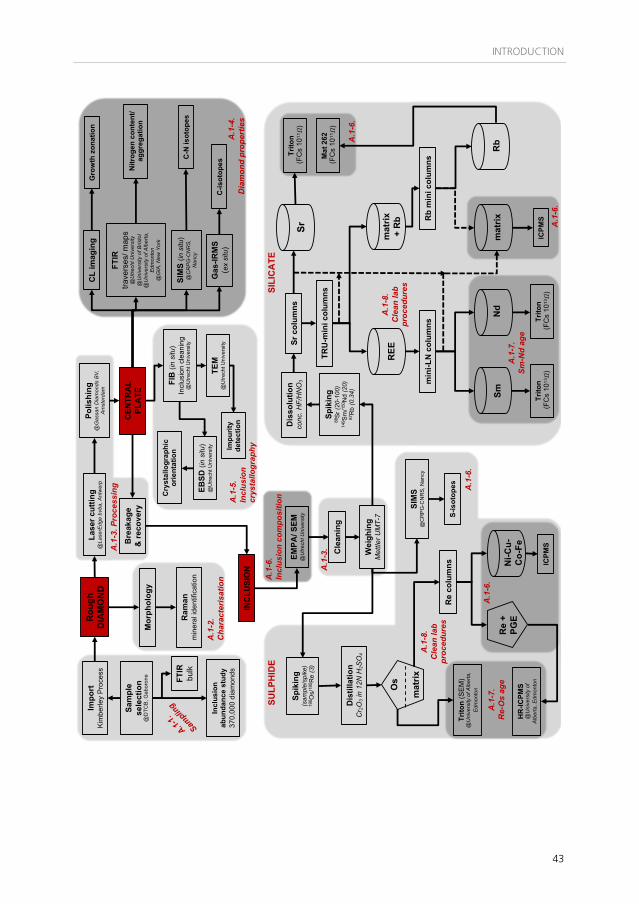
3. Methods
Combination of multiple spectroscopic and geochemical techniques introduced in the past
decades have proven to effectively extract information from diamonds and their inclusions. The
methods deployed in this study will integrate these applications in combination with state-of-
the-art technology in radiogenic isotope dating. In this respect, a ‘standard procedure’ (Fig.9) has
been established according to the studies of Wiggers de Vries et al. (2011; 2013), Smit et al.
(2016a) and Timmerman et al. (2017). Technical remarks on the deployed methods
supplementing the sketch and reference to the corresponding methods section of Chapters 2 to 6 can be found in Appendix A.1.
4. Outline
This PhD thesis consists of five main Chapters (2 to 6) that have been individually published in (or
submitted to) peer-reviewed journals and they systematically assess the objectives of the PhD
project (outlined in 1.5). The current section gives a short description for each chapter. Chapter
7 will synthesise constraints on diamond formation beneath Botswana based on the conclusions
from all previous chapters.
In addition, I made significant contributions to two publications, in the Journal of Geochemical Exploration (Appendix A.2) and Nature Communications (Appendix A.3). The
papers are not part of the main body of work for this thesis but they include valuable aspects
related to data evaluation of inclusion major element composition and support the presented
findings on inclusion ages observed in other locations.
Chapter 1. This chapter provides a summary of the rationales and objectives of this PhD
research project and a general overview of lithospheric diamond research with a focus on
southern Africa.
Chapter 2. Examination of crystallographic growth relationships between inclusions and
the host diamond and provides insight into the genetic origin of the inclusions (first objective).
CHAPTER 1
42
Findings allow assessment of what information (e.g., age, geochemical environment, P-T)
determined from an inclusion can also be applied to the diamond host. For this study, I co-
supervised a master student, Q. van den Heuvel, on a day-to-day basis and I made major
contributions to data re-evaluation and writing the article.
Chapter 3. Reassessment of Jwaneng’s diamond populations by CL, FTIR and inclusion
composition to establish the number of discrete diamond-forming events (second objective). The
results demonstrate that detailed petrographic and spectrographic examination is necessary to
in Chapter 3 – are used to address the multi-stage growth history of diamonds (second objective)
and different diamond-forming processes and to draw implications for the deep carbon cycle
(third objective).
Chapter 5. The evolution of the SCLM beneath Orapa, Letlhakane and Damtshaa is
revealed through Sm-Nd isochron ages of eclogitic and websteritic silicate inclusions. The data
allow insight into the local scale of diamond formation in the Orapa cluster (second objective)
and potential carbon sources are discussed (third objective).
Chapter 6. Correlation between Re-Os and Sm-Nd isochron ages of co-genetic, individual
sulphide and silicate inclusions from the Orapa cluster and Jwaneng are used to validate if mineral
inclusions in diamond record the time of diamond growth (first objective), establish the timing
and spatial scale of diamond-forming events (second objective) and provide insight into the deep
cycling of volatiles (third objective).
Chapter 7. This chapter represents a synopsis with the implications and conclusions from
the previous chapters in order to provide constraints on diamond formation beneath Botswana.
Appendices The appendices A – F include all aspects related to data evaluation and
interpretation, deployed methodology and references to the online repositories of electronic
supplemental material that were published together with the corresponding articles in Chapters 1 to 7.
Figure 9: (right) Schematic processing of a diamond and the inclusions with reference to Appendix A.1. Light grey shades delimit discrete complexes of the protocol, dark grey shades highlight the essential analytical techniques carried out in this research.