215
| Date post: | 08-May-2023 |
| Category: |
Documents |
| Upload: | khangminh22 |
| View: | 0 times |
| Download: | 0 times |

UNITED STATESSECURITIES AND EXCHANGE COMMISSION
WASHINGTON, D.C. 20549
FORM 10-K
[X] ANNUAL REPORT PURSUANT TO SECTION 13 OR 15(d) OF THE SECURITIES EXCHANGE ACT OF 1934
For the fiscal year ended December 31, 2009 [ ] TRANSITION REPORT PURSUANT TO SECTION 13 OR 15(d) OF THE SECURITIES EXCHANGE ACT OF 1934
Commission File Number: 1-13274
MACK-CALI REALTY CORPORATION(Exact Name of Registrant as specified in its charter)
Maryland 22-3305147(State or other jurisdiction of incorporation or organization)
(IRS EmployerIdentification No.)
343 Thornall Street, Edison, New Jersey 08837-2206(Address of principal executive offices) (Zip code)
(732) 590-1000(Registrant’s telephone number, including area code)
Securities registered pursuant to Section 12(b) of the Act:
(Title of Each Class)
(Name of Each Exchange on Which Registered)
Common Stock, $0.01 par value New York Stock Exchange
Securities registered pursuant to Section 12(g) of the Act:None
Indicate by check mark if the registrant is a well-known seasoned issuer, as defined in Rule 405 of the Securities Act. Yes X No ___
Indicate by check mark if the registrant is not required to file reports pursuant to Section 13 or Section 15(d) of the Exchange Act. Yes ___ No X
Indicate by check mark whether the registrant (1) has filed all reports required to be filed by Section 13 or 15(d) of the Securities Exchange Act of 1934 during the preceding 12months (or for such shorter period that the registrant was required to file such reports), and (2) has been subject to such filing requirements for the past 90 days. Yes X No ___
Indicate by check mark whether the registrant has submitted electronically and posted on its corporate Web site, if any, every Interactive Data File required to be submitted andposted pursuant to Rule 405 of Regulation S-T (§232.405 of this chapter) during the preceding 12 months (or for such shorter period that the registrant was required to submit andpost such files). Yes ___ No ___ (the Registrant is not yet required to submit Interactive Data)
Indicate by check mark if disclosure of delinquent filers pursuant to Item 405 of Regulation S-K is not contained herein, and will not be contained, to the best of the registrant’sknowledge, in definitive proxy or information statements incorporated by reference in Part III of this Form 10-K or any amendments to this Form 10-K. [ X ]
Indicate by check mark whether the registrant is a large accelerated filer, an accelerated filer, a non-accelerated filer, or a smaller reporting company. See the definitions of“large accelerated filer,” “accelerated filer” and “smaller reporting company” in Rule 12b-2 of the Exchange Act.
Large accelerated filer x Acceleratedfiler ¨
Non-accelerated filer ¨ (Do not check if a smaller reporting company) Smallerreporting company ¨
Indicate by check mark whether the registrant is a shell company (as defined in Rule 12b-2 of the Exchange Act.) Yes ___ No X
As of June 30, 2009, the aggregate market value of the voting stock held by non-affiliates of the registrant was $1,754,174,430. The aggregate market value was computed withreference to the closing price on the New York Stock Exchange on such date. This calculation does not reflect a determination that persons are affiliates for any other purpose.
As of February 8, 2010, 79,190,883 shares of common stock, $0.01 par value, of the Company (“Common Stock”) were outstanding.
LOCATION OF EXHIBIT INDEX: The index of exhibits is contained herein on page number 124.
DOCUMENTS INCORPORATED BY REFERENCE: Portions of the registrant’s definitive proxy statement for fiscal year ended December 31, 2009 to be issued inconjunction with the registrant’s annual meeting of shareholders expected to be held on May 25, 2010 are incorporated by reference in Part III of this Form 10-K. The definitiveproxy statement will be filed by the registrant with the SEC not later than 120 days from the end of the registrant’s fiscal year ended December 31, 2009.

FORM 10-K
Table of Contents
PART I Page No.Item 1 Business 3Item 1A Risk Factors 8Item 1B Unresolved Staff Comments 17Item 2 Properties 18Item 3 Legal Proceedings 38Item 4 Submission of Matters to a Vote of Security Holders 38 PART II Item 5 Market for Registrant’s Common Equity, Related Stockholder Matters and Issuer Purchases of Equity Securities 39Item 6 Selected Financial Data 42Item 7 Management’s Discussion and Analysis of Financial Condition and Results of Operations 43Item 7A Quantitative and Qualitative Disclosures About Market Risk 62Item 8 Financial Statements and Supplementary Data 63Item 9 Changes in and Disagreements with Accountants on Accounting and Financial Disclosure 64Item 9A Controls and Procedures 64Item 9B Other Information 65 PART III Item 10 Directors, Executive Officers and Corporate Governance 65Item 11 Executive Compensation 65Item 12 Security Ownership of Certain Beneficial Owners and Management and Related Stockholder Matters 65Item 13 Certain Relationships and Related Transactions, and Director Independence 65Item 14 Principal Accounting Fees and Services 65 PART IV Item 15 Exhibits and Financial Statement Schedules 66 SIGNATURES 122 EXHIBIT INDEX 124
2
PART I
ITEM 1. BUSINESS
GENERALMack-Cali Realty Corporation, a Maryland corporation (together with its subsidiaries, the “Company”), is a fully-integrated, self-administered and self-managed real estateinvestment trust (“REIT”) that owns and operates a real estate portfolio comprised predominantly of Class A office and office/flex properties located primarily in the Northeast. TheCompany performs substantially all commercial real estate leasing, management, acquisition, development and construction services on an in-house basis. Mack-Cali RealtyCorporation was incorporated on May 24, 1994. The Company’s executive offices are located at 343 Thornall Street, Edison, New Jersey 08837-2206, and its telephone number is(732) 590-1000. The Company has an internet website at www.mack-cali.com.
As of December 31, 2009, the Company owned or had interests in 289 properties, aggregating approximately 33.2 million square feet, plus developable land (collectively, the“Properties”), which are leased to approximately 2,100 tenants. The Properties are comprised of: (a) 268 wholly-owned or Company-controlled properties consisting of 162 officebuildings and 95 office/flex buildings aggregating approximately 30.5 million square feet, six industrial/warehouse buildings totaling approximately 387,400 square feet, two stand-alone retail properties totaling approximately 17,300 square feet, and three land leases (collectively, the “Consolidated Properties”); and (b) 20 buildings, which are primarily officeproperties, aggregating approximately 2.2 million square feet, and a 350-room hotel, which are owned by unconsolidated joint ventures in which the Company has investmentinterests. Unless otherwise indicated, all references to square feet represent net rentable area. As of December 31, 2009, the office, office/flex, industrial/warehouse and stand-aloneretail properties included in the Consolidated Properties were 90.1 percent leased. Percentage leased includes all leases in effect as of the period end date, some of which havecommencement dates in the future, and leases that expire at the period end date. Leases that expire as of December 31, 2009 aggregate 64,672 square feet, or 0.2 percent of the netrentable square footage. The Properties are located in five states, primarily in the Northeast, and the District of Columbia. See Item 2: Properties.
The Company’s strategy has been to focus its operations, acquisition and development of office properties in high-barrier-to-entry markets and sub-markets where it believes it is, orcan become, a significant and preferred owner and operator. The Company plans to continue this strategy by expanding through acquisitions and/or development in Northeastmarkets where it has, or can achieve, similar status. The Company believes that its Properties have excellent locations and access and are well-maintained and professionallymanaged. As a result, the Company believes that its Properties attract high quality tenants and achieve among the highest rental, occupancy and tenant retention rates within theirmarkets. The Company also believes that its extensive market knowledge provides it with a significant competitive advantage, which is further enhanced by its strong reputation for,and emphasis on, delivering highly responsive, professional management services. See “Business Strategies.”
As of December 31, 2009, executive officers and directors of the Company and their affiliates owned approximately eight percent of the Company’s outstanding shares of CommonStock (including Units redeemable into shares of Common Stock). As used herein, the term “Units” refers to limited partnership interests in Mack-Cali Realty, L.P., a Delawarelimited partnership (the “Operating Partnership”) through which the Company conducts its real estate activities. The Company’s executive officers have been employed by theCompany and/or its predecessor companies for an average of approximately 22 years.
BUSINESS STRATEGIESOperationsReputation: The Company has established a reputation as a highly-regarded landlord with an emphasis on delivering quality tenant services in buildings it owns and/or manages. TheCompany believes that its continued success depends in part on enhancing its reputation as an operator of choice, which will facilitate the retention of current tenants and theattraction of new tenants. The Company believes it provides a superior level of service to its tenants, which should in turn, allow the Company to outperform the market with respectto occupancy rates, as well as improve tenant retention.
3
Communication with tenants: The Company emphasizes frequent communication with tenants to ensure first-class service to the Properties. Property management personnelgenerally are located on site at the Properties to provide convenient access to management and to ensure that the Properties are well-maintained. Property management’s primaryresponsibility is to ensure that buildings are operated at peak efficiency in order to meet both the Company’s and tenants’ needs and expectations. Property management personneladditionally budget and oversee capital improvements and building system upgrades to enhance the Properties’ competitive advantages in their respective markets and to maintain thequality of the Properties.
Additionally, the Company’s in-house leasing representatives develop and maintain long-term relationships with the Company’s diverse tenant base and coordinate leasing,expansion, relocation and build-to-suit opportunities within the Company’s portfolio. This approach allows the Company to offer office space in the appropriate size and location tocurrent or prospective tenants in any of its sub-markets.
Portfolio Management: The Company plans to continue to own and operate a portfolio of properties in high-barrier-to-entry markets, with a primary focus in the Northeast. TheCompany’s primary objectives are to maximize operating cash flow and to enhance the value of its portfolio through effective management, acquisition, development and propertysales strategies, as follows:
The Company seeks to maximize the value of its existing portfolio through implementing operating strategies designed to produce the highest effective rental and occupancy rates andlowest tenant installation cost within the markets that it operates, and further within the parameters of those markets. The Company continues to pursue internal growth throughleasing vacant space, re-leasing space at higher effective rents with contractual rent increases and developing or redeveloping space for its diverse base of high credit tenants,including Wyndham Worldwide Operations, National Union Fire Insurance and The United States of America - GSA. In addition, the Company seeks economies of scale throughvolume discounts to take advantage of its size and dominance in particular sub-markets, and operating efficiencies through the use of in-house management, leasing, marketing,financing, accounting, legal, development and construction services.
Acquisitions: The Company also believes that growth opportunities exist through acquiring operating properties or properties for redevelopment with attractive returns in its coreNortheast sub-markets where, based on its expertise in leasing, managing and operating properties, it believes it is, or can become, a significant and preferred owner andoperator. The Company intends either directly or through joint ventures to acquire, invest in or redevelop additional properties that: (i) are expected to provide attractive initial yieldswith potential for growth in cash flow from operations; (ii) are well-located, of high quality and competitive in their respective sub-markets; (iii) are located in its existing sub-markets or in sub-markets in which the Company can become a significant and preferred owner and operator; and (iv) it believes have been under-managed or are otherwise capableof improved performance through intensive management, capital improvements and/or leasing that should result in increased effective rental and occupancy rates.
Development: The Company seeks to selectively develop additional properties either directly or through joint ventures where it believes such development will result in a favorablerisk-adjusted return on investment in coordination with the above operating strategies. Such development primarily will occur: (i) when leases have been executed prior toconstruction; (ii) in stable core Northeast sub-markets where the demand for such space exceeds available supply; and (iii) where the Company is, or can become, a significant andpreferred owner and operator.
Property Sales: While management’s principal intention is to own and operate its properties on a long-term basis, it periodically assesses the attributes of each of its properties, with aparticular focus on the supply and demand fundamentals of the sub-markets in which they are located. Based on these ongoing assessments, the Company may, from time to time,decide to sell any of its properties.
FinancialThe Company currently intends to maintain a ratio of debt-to-undepreciated assets (total debt of the Company as a percentage of total undepreciated assets) of 50 percent or less,however there can be no assurance that the Company will be successful in maintaining this ratio. As of December 31, 2009 and 2008, the Company’s total debt constitutedapproximately 39.8 and 40.6 percent of total undepreciated assets of the Company, respectively. The Company has three investment grade credit ratings. Standard & Poor’s RatingServices (“S&P”) and Fitch, Inc. (“Fitch”) have each assigned their BBB rating to existing and prospective senior unsecured debt of the Operating Partnership and their BB+ rating toexisting and prospective preferred stock offerings of the Company. Moody’s Investors Service (“Moody’s”) has assigned its Baa2 rating to existing and prospective senior unsecureddebt of the Operating Partnership and its Baa3 rating to existing and prospective preferred stock offerings of the Company. Although there is no limit in the Company’sorganizational documents on the amount of indebtedness that the Company may incur or a requirement for the maintenance of investment grade credit ratings, the Company hasentered into certain financial agreements which contain covenants that limit the Company’s ability to incur indebtedness under certain circumstances. The Company intends toconduct its operations so as to best be able to maintain its investment grade debt rating status. The Company intends to utilize the most appropriate sources of capital for futureacquisitions, development, capital improvements and other investments, which may include funds from operating activities, proceeds from property and land sales, short-term andlong-term borrowings (including draws on the Company’s revolving credit facility), and the issuance of additional debt or equity securities.
4
EMPLOYEES
As of December 31, 2009, the Company had approximately 422 full-time employees.
COMPETITION
The leasing of real estate is highly competitive. The Properties compete for tenants with lessors and developers of similar properties located in their respective markets primarily onthe basis of location, the quality of properties, leasing terms (including rent and other charges and allowances for tenant improvements), services provided, the design and condition ofthe Properties, and reputation as an owner and operator of quality office properties in the relevant market. The Company also experiences competition when attempting to acquire ordispose of real estate, including competition from domestic and foreign financial institutions, other REITs, life insurance companies, pension trusts, trust funds, partnerships,individual investors and others.
REGULATIONS
Many laws and governmental regulations apply to the ownership and/or operation of the Properties and changes in these laws and regulations, or their interpretation by agencies andthe courts, occur frequently.
Under various laws and regulations relating to the protection of the environment, an owner of real estate may be held liable for the costs of removal or remediation of certainhazardous or toxic substances located on or in the property. These laws often impose liability without regard to whether the owner was responsible for, or even knew of, the presenceof such substances. The presence of such substances may adversely affect the owner’s ability to rent or sell the property or to borrow using such property as collateral and mayexpose it to liability resulting from any release of, or exposure to, such substances. Persons who arrange for the disposal or treatment of hazardous or toxic substances at anotherlocation may also be liable for the costs of removal or remediation of such substances at the disposal or treatment facility, whether or not such facility is owned or operated by suchperson. Certain environmental laws impose liability for the release of asbestos-containing materials into the air, and third parties may also seek recovery from owners or operators ofreal properties for personal injury associated with asbestos-containing materials and other hazardous or toxic substances.
In connection with the ownership (direct or indirect), operation, management and development of real properties, the Company may be considered an owner or operator of suchproperties or as having arranged for the disposal or treatment of hazardous or toxic substances and, therefore, potentially liable for removal or remediation costs, as well as certainother related costs, including governmental penalties and injuries to persons and property.
There can be no assurance that (i) future laws, ordinances or regulations will not impose any material environmental liability, (ii) the current environmental condition of the Propertieswill not be affected by tenants, by the condition of land or operations in the vicinity of the Properties (such as the presence of underground storage tanks), or by third parties unrelatedto the Company, or (iii) the Company’s assessments reveal all environmental liabilities and that there are no material environmental liabilities of which the Company is aware. Ifcompliance with the various laws and regulations, now existing or hereafter adopted, exceeds the Company’s budgets for such items, the Company’s ability to make expecteddistributions to stockholders could be adversely affected.
5
There are no other laws or regulations which have a material effect on the Company’s operations, other than typical federal, state and local laws affecting the development andoperation of real property, such as zoning laws.
INDUSTRY SEGMENTS
The Company operates in two industry segments: (i) real estate; and (ii) construction services. As of December 31, 2009, the Company does not have any foreign operations and itsbusiness is not seasonal. Please see our financial statements attached hereto and incorporated by reference herein for financial information relating to our industry segments.
RECENT DEVELOPMENTS
On March 1, 2009, the Company placed in service a 249,409 square-foot, class A office building, which is fully leased through August 2024. The building is located in the Mack-Cali Business Campus in Parsippany, New Jersey.
On April 29, 2009, the Company acquired SL Green’s interests in the Mack-Green-Gale LLC and subsidiaries (“Mack-Green”) and 55 Corporate Partners, LLC (“55 Corporate”)joint ventures (the “SL Green Transactions”) for $5 million. As a result, the Company owns 100 percent of Mack-Green and 55 Corporate. Concurrent with the SL GreenTransactions, the loan agreement with an affiliate of Gramercy Capital Corporation (“Gramercy”) on six office properties indirectly owned by Mack-Green was restructuredproviding Gramercy with the power to control the activities that are most important to the properties’ economic performance. At the time of the restructuring, the estimated fair valueof the six properties was less than the aggregate carrying amount of the non-recourse mortgage loans.
As a result of the SL Green Transactions and the agreement with Gramercy, as of April 29, 2009, the Company began consolidating 11 office properties, aggregating approximately1.5 million square feet, owned and controlled by Mack-Green, and a pre-leased 205,000 square foot office development project owned and controlled by 55 Corporate. The Companyalso has retained a non-controlling interest in entities that own 100 percent of six office properties, aggregating 786,198 square feet, which were previously indirectly owned byMack-Green. See “Mack-Green-Gale LLC” and “55 Corporate Partners, LLC” under Note 4: Investments in Unconsolidated Joint Ventures – to the Financial Statements for furtherdiscussion on the transactions.
The Company’s core markets continue to be weak. The percentage leased in the Company’s consolidated portfolio of stabilized operating properties was 90.1 percent at December31, 2009, as compared to 91.3 percent at December 31, 2008 and 92.7 percent at December 31, 2007. Percentage leased includes all leases in effect as of the period end date, some ofwhich have commencement dates in the future and leases that expire at the period end date. Leases that expired as of December 31, 2009, 2008 and 2007 aggregate 64,672, 67,473and 146,261 square feet, respectively, or 0.2, 0.2 and 0.5 percentage of the net rentable square footage, respectively. Rental rates on the Company’s space that was re-leased (basedon first rents payable) during the year ended December 31, 2009 decreased an average of 9.3 percent compared to rates that were in effect under the prior leases, as compared to a 1.5percent increase in 2008 and a 0.2 percent decrease in 2007. The Company believes that vacancy rates may continue to increase in some of its markets through 2010 and possiblybeyond. As a result, the Company’s future earnings and cash flow may continue to be negatively impacted by current market conditions.
The Company expects that the impact of the current state of the economy, including rising unemployment and the unprecedented volatility in the financial and credit markets, willcontinue to have a dampening effect on the fundamentals of its business, including increases in past due accounts, defaults, lower occupancy and reduced effective rents. Theseconditions would negatively affect the Company’s future net income and cash flows and could have a material adverse effect on the Company’s financial condition.
FINANCING ACTIVITY
On January 27, 2009, the Company obtained $64.5 million in mortgage financing from Guardian Life Insurance Company of America. The two mortgage loans, which arecollateralized by one and three office properties located in Clark and Red Bank, New Jersey, respectively, both carry an effective rate of 7.31 percent per annum and carry a 10-yearterm.
6
On April 29, 2009, in connection with the SL Green Transactions, the Company consolidated 11 office properties, which are encumbered by mortgage loans with Wachovia CMBS aslender which were recorded at an aggregate amount of approximately $151.1 million at the closing date. The mortgage loans carry an average effective interest rate of 10.66 percentper annum and mature through May 2016.
On May 6, 2009, the Company completed a public offering of 11,500,000 shares of Common Stock and used the net proceeds, which totaled approximately $274.8 million (afteroffering costs), to repay borrowings under its unsecured revolving credit facility.
On June 30, 2009, the Company obtained $17.0 million in mortgage financing from Valley National Bank. The mortgage loan, which is collateralized by an office property inWoodbridge, New Jersey, is for a 25-year term and bears interest at an effective rate of 6.94 percent per annum through the end of the 10th year. The coupon interest rate will bereset at the end of year 10 and year 20 at 225 basis points over the 10-year treasury yield 45 days prior to the reset dates, with a minimum rate of 6.875 percent.
On August 14, 2009, the Operating Partnership completed the sale of $250 million face amount of 7.750 percent senior unsecured notes due August 15, 2019 with interest payablesemi-annually in arrears. The net proceeds of approximately $246.2 million, after underwriting discount, were used for general corporate purposes.
On January 15, 2010, the Company refinanced its $150 million secured loan with The Prudential Insurance Company of America. The new loan also includes VPCM, LLC, awholly-owned subsidiary of the Virginia Retirement System, as co-lender. The mortgage loan, which is collateralized by seven properties, is for a seven-year term and carries aninterest rate of 6.25 percent.
AVAILABLE INFORMATION
The Company’s internet website is www.mack-cali.com. The Company makes available free of charge on or through its website its annual reports on Form 10-K, quarterly reports onForm 10-Q, current reports on Form 8-K and amendments to those reports filed or furnished pursuant to Section 13(a) of the Securities Exchange Act of 1934, as amended, as soon asreasonably practicable after it electronically files or furnishes such materials to the Securities and Exchange Commission. In addition, the Company’s internet website includes otheritems related to corporate governance matters, including, among other things, the Company’s corporate governance principles, charters of various committees of the Board ofDirectors, and the Company’s code of business conduct and ethics applicable to all employees, officers and directors. The Company intends to disclose on its internet website anyamendments to or waivers from its code of business conduct and ethics as well as any amendments to its corporate governance principles or the charters of various committees of theBoard of Directors. Copies of these documents may be obtained, free of charge, from our internet website. Any shareholder also may obtain copies of these documents, free ofcharge, by sending a request in writing to: Mack-Cali Investor Relations Department, 343 Thornall Street, Edison, NJ 08837-2206.
DISCLOSURE REGARDING FORWARD-LOOKING STATEMENTS
We consider portions of this report, including the documents incorporated by reference, to be forward-looking statements within the meaning of Section 21E of the SecuritiesExchange Act of 1934, as amended. We intend such forward-looking statements to be covered by the safe harbor provisions for forward-looking statements contained in Section 21Eof such act. Such forward-looking statements relate to, without limitation, our future economic performance, plans and objectives for future operations and projections of revenueand other financial items. Forward-looking statements can be identified by the use of words such as “may,” “will,” “plan,” “should,” “expect,” “anticipate,” “estimate,” “continue” orcomparable terminology. Forward-looking statements are inherently subject to risks and uncertainties, many of which we cannot predict with accuracy and some of which we mightnot even anticipate. Although we believe that the expectations reflected in such forward-looking statements are based upon reasonable assumptions at the time made, we can give noassurance that such expectations will be achieved. Future events and actual results, financial and otherwise, may differ materially from the results discussed in the forward-lookingstatements. Readers are cautioned not to place undue reliance on these forward-looking statements.
Among the factors about which we have made assumptions are:
7
· risks and uncertainties affecting the general economic climate and conditions, including the impact of the general economic recession as it impacts the national
and local economies, which in turn may have a negative effect on the fundamentals of our business and the financial condition of our tenants;· the value of our real estate assets, which may limit our ability to dispose of assets at attractive prices or obtain or maintain debt financing secured by our
properties or on an unsecured basis;· the extent of any tenant bankruptcies or of any early lease terminations;· our ability to lease or re-lease space at current or anticipated rents;· changes in the supply of and demand for office, office/flex and industrial/warehouse properties;· changes in interest rate levels and volatility in the securities markets;· changes in operating costs;· our ability to obtain adequate insurance, including coverage for terrorist acts;· the availability of financing on attractive terms or at all, which may adversely impact our ability to pursue acquisition and development opportunities and
refinance existing debt and our future interest expense;· changes in governmental regulation, tax rates and similar matters; and· other risks associated with the development and acquisition of properties, including risks that the development may not be completed on schedule, that the tenants
will not take occupancy or pay rent, or that development or operating costs may be greater than anticipated.
For further information on factors which could impact us and the statements contained herein, see Item 1A: Risk Factors. We assume no obligation to update and supplementforward-looking statements that become untrue because of subsequent events, new information or otherwise.
ITEM 1A. RISK FACTORS
Our results from operations and ability to make distributions on our equity and debt service on our indebtedness may be affected by the risk factors set forth below. All investorsshould consider the following risk factors before deciding to purchase securities of the Company. The Company refers to itself as “we” or “our” in the following risk factors.
Adverse economic and geopolitical conditions in general and the Northeastern office markets in particular could have a material adverse effect on our results ofoperations, financial condition and our ability to pay distributions to you.
Our business may be affected by the unprecedented volatility in the financial and credit markets, the general global economic recession, and other market or economic challengesexperienced by the U.S. economy or real estate industry as a whole. Our business may also be adversely affected by local economic conditions, as substantially all of our revenuesare derived from our properties located in the Northeast, particularly in New Jersey, New York and Pennsylvania. Because our portfolio consists primarily of office and office/flexbuildings (as compared to a more diversified real estate portfolio) located principally in the Northeast, if economic conditions persist or deteriorate, then our results of operations,financial condition and ability to service current debt and to pay distributions to our shareholders may be adversely affected by the following, among other potential conditions:
· significant job losses in the financial and professional services industries may occur, which may decrease demand for our office space, causing market rental rates andproperty values to be negatively impacted;
· our ability to borrow on terms and conditions that we find acceptable, or at all, may be limited, which could reduce our ability to pursue acquisition and developmentopportunities and refinance existing debt, reduce our returns from both our existing operations and our acquisition and development activities and increase our futureinterest expense;
· reduced values of our properties may limit our ability to dispose of assets at attractive prices or to obtain debt financing secured by our properties and may reduce theavailability of unsecured loans;
· the value and liquidity of our short-term investments and cash deposits could be reduced as a result of a deterioration of the financial condition of the institutions thathold our cash deposits or the institutions or assets in which we have made short-term investments, the dislocation of the markets for our short-term investments,increased volatility in market rates for such investments or other factors;
· reduced liquidity in debt markets and increased credit risk premiums for certain market participants may impair our ability to access capital; and· one or more lenders under our line of credit could refuse or be unable to fund their financing commitment to us and we may not be able to replace the financing
commitment of any such lenders on favorable terms, or at all.
8
These conditions, which could have a material adverse effect on our results of operations, financial condition and ability to pay distributions, may continue or worsen in the future.
Our performance is subject to risks associated with the real estate industry.General: Our business and our ability to make distributions or payments to our investors depend on the ability of our properties to generate funds in excess of operating expenses(including scheduled principal payments on debt and capital expenditures). Events or conditions that are beyond our control may adversely affect our operations and the value of ourProperties. Such events or conditions could include:
· changes in the general economic climate and conditions, including the impact of the current global economic recession;· changes in local conditions, such as an oversupply of office space, a reduction in demand for office space, or reductions in office market rental rates;
· decreased attractiveness of our properties to tenants;· competition from other office and office/flex properties;· our inability to provide adequate maintenance;
· increased operating costs, including insurance premiums, utilities and real estate taxes, due to inflation and other factors which may not necessarily be offset byincreased rents;
· changes in laws and regulations (including tax, environmental, zoning and building codes, and housing laws and regulations) and agency or court interpretations ofsuch laws and regulations and the related costs of compliance;
· changes in interest rate levels and the availability of financing;· the inability of a significant number of tenants to pay rent;· our inability to rent office space on favorable terms; and
· civil unrest, earthquakes, acts of terrorism and other natural disasters or acts of God that may result in uninsured losses.
We may suffer adverse consequences if our revenues decline since our operating costs do not necessarily decline in proportion to our revenue: We earn a significant portion of ourincome from renting our properties. Our operating costs, however, do not necessarily fluctuate in relation to changes in our rental revenue. This means that our costs will notnecessarily decline even if our revenues do. Our operating costs could also increase while our revenues do not. If our operating costs increase but our rental revenues do not, we maybe forced to borrow to cover our costs, we may incur losses and we may not have cash available for distributions to our stockholders.
Financially distressed tenants may be unable to pay rent: If a tenant defaults, we may experience delays and incur substantial costs in enforcing our rights as landlord and protectingour investments. If a tenant files for bankruptcy, a potential court judgment rejecting and terminating such tenant’s lease could adversely affect our ability to make distributions orpayments to our investors as we may be unable to replace the defaulting tenant with a new tenant at a comparable rental rate without incurring significant expenses or a reduction inrental income.
Renewing leases or re-letting space could be costly: If a tenant does not renew its lease upon expiration or terminates its lease early, we may not be able to re-lease the space. If atenant does renew its lease or we re-lease the space, the terms of the renewal or new lease, including the cost of required renovations or concessions to the tenant, may be lessfavorable than the current lease terms, which could adversely affect our ability to make distributions or payments to our investors.
Adverse developments concerning some of our major tenants and industry concentrations could have a negative impact on our revenue: Recent developments in the general economyand the global credit markets have had a significant adverse effect on many companies in numerous industries. We have tenants concentrated in various industries that may beexperiencing adverse effects of current economic conditions. Our business could be adversely affected if any of these tenants or any other tenants became insolvent, declaredbankruptcy or otherwise refused to pay rent in a timely manner or at all.
9
Our insurance coverage on our properties may be inadequate or our insurance providers may default on their obligations to pay claims: We currently carry comprehensive insuranceon all of our properties, including insurance for liability, fire and flood. We cannot guarantee that the limits of our current policies will be sufficient in the event of a catastrophe toour properties. We cannot guarantee that we will be able to renew or duplicate our current insurance coverage in adequate amounts or at reasonable prices. In addition, while ourcurrent insurance policies insure us against loss from terrorist acts and toxic mold, in the future, insurance companies may no longer offer coverage against these types of losses, or, ifoffered, these types of insurance may be prohibitively expensive. If any or all of the foregoing should occur, we may not have insurance coverage against certain types of lossesand/or there may be decreases in the limits of insurance available. Should an uninsured loss or a loss in excess of our insured limits occur, we could lose all or a portion of the capitalwe have invested in a property or properties, as well as the anticipated future revenue from the property or properties. Nevertheless, we might remain obligated for any mortgage debtor other financial obligations related to the property or properties. We cannot guarantee that material losses in excess of insurance proceeds will not occur in the future. If any of ourproperties were to experience a catastrophic loss, it could seriously disrupt our operations, delay revenue and result in large expenses to repair or rebuild the property. Such eventscould adversely affect our ability to make distributions or payments to our investors. If one or more of our insurance providers were to fail to pay a claim as a result of insolvency,bankruptcy or otherwise, the nonpayment of such claims could have an adverse effect on our financial condition and results of operations. In addition, if one or more of our insuranceproviders were to become subject to insolvency, bankruptcy or other proceedings and our insurance policies with the provider were terminated or canceled as a result of thoseproceedings, we cannot guarantee that we would be able to find alternative coverage in adequate amounts or at reasonable prices. In such case, we could experience a lapse in any oradequate insurance coverage with respect to one or more properties and be exposed to potential losses relating to any claims that may arise during such period of lapsed or inadequatecoverage.
Illiquidity of real estate limits our ability to act quickly: Real estate investments are relatively illiquid. Such illiquidity may limit our ability to react quickly in response to changes ineconomic and other conditions. If we want to sell an investment, we might not be able to dispose of that investment in the time period we desire, and the sales price of thatinvestment might not recoup or exceed the amount of our investment. The prohibition in the Internal Revenue Code of 1986, as amended (the “Code”), and related regulations on areal estate investment trust holding property for sale also may restrict our ability to sell property. In addition, we acquired a significant number of our properties from individuals towhom we issued Units as part of the purchase price. In connection with the acquisition of these properties, in order to preserve such individual’s income tax deferral, we contractuallyagreed not to sell or otherwise transfer the properties for a specified period of time, except in a manner which does not result in recognition of any built-in-gain (which may result inan income tax liability) or which reimburses the appropriate individuals for the income tax consequences of the recognition of such built-in-gains. As of December 31, 2009, 11 ofour properties, with an aggregate net book value of approximately $199.8 million, were subject to these restrictions, which expire periodically through 2016. For those propertieswhere such restrictions have lapsed, we are generally required to use commercially reasonable efforts to prevent any sale, transfer or other disposition of the subject properties fromresulting in the recognition of built-in gain to the appropriate individuals. 126 of our properties, with an aggregate net book value of approximately $1.8 billion, have lapsedrestrictions and are subject to these conditions. The above limitations on our ability to sell our investments could adversely affect our ability to make distributions or payments to ourinvestors.
Americans with Disabilities Act compliance could be costly: Under the Americans with Disabilities Act of 1990 (“ADA”), all public accommodations and commercial facilities mustmeet certain federal requirements related to access and use by disabled persons. Compliance with the ADA requirements could involve removal of structural barriers from certaindisabled persons’ entrances. Other federal, state and local laws may require modifications to or restrict further renovations of our properties with respect to such accesses. Althoughwe believe that our properties are substantially in compliance with present requirements, noncompliance with the ADA or related laws or regulations could result in the United Statesgovernment imposing fines or private litigants being awarded damages against us. Such costs may adversely affect our ability to make distributions or payments to our investors.
Environmental problems are possible and may be costly: Various federal, state and local laws and regulations subject property owners or operators to liability for the costs ofremoval or remediation of certain hazardous or toxic substances located on or in the property. These laws often impose liability without regard to whether the owner or operator wasresponsible for or even knew of the presence of such substances. The presence of or failure to properly remediate hazardous or toxic substances (such as toxic mold) may adverselyaffect our ability to rent, sell or borrow against contaminated property and may impose liability upon us for personal injury to persons exposed to such substances. Various laws andregulations also impose liability on persons who arrange for the disposal or treatment of hazardous or toxic substances at another location for the costs of removal or remediation ofsuch substances at the disposal or treatment facility. These laws often impose liability whether or not the person arranging for such disposal ever owned or operated the disposalfacility. Certain other environmental laws and regulations impose liability on owners or operators of property for injuries relating to the release of asbestos-containing or othermaterials into the air, water or otherwise into the environment. As owners and operators of property and as potential arrangers for hazardous substance disposal, we may be liableunder such laws and regulations for removal or remediation costs, governmental penalties, property damage, personal injuries and related expenses. Payment of such costs andexpenses could adversely affect our ability to make distributions or payments to our investors.
10
We face risks associated with property acquisitions: We have acquired in the past, and our long-term strategy is to continue to pursue the acquisition of properties and portfolios ofproperties in New Jersey, New York and Pennsylvania and in the Northeast generally, including large real estate portfolios that could increase our size and result in alterations to ourcapital structure. We may be competing for investment opportunities with entities that have greater financial resources. Several office building developers and real estate companiesmay compete with us in seeking properties for acquisition, land for development and prospective tenants. Such competition may adversely affect our ability to make distributions orpayments to our investors by:
· reducing the number of suitable investment opportunities offered to us;· increasing the bargaining power of property owners;· interfering with our ability to attract and retain tenants;· increasing vacancies which lowers market rental rates and limits our ability to negotiate rental rates; and/or· adversely affecting our ability to minimize expenses of operation.
Our acquisition activities and their success are subject to the following risks:
· adequate financing to complete acquisitions may not be available on favorable terms or at all as a result of the unprecedented volatility in the financial and creditmarkets;
· even if we enter into an acquisition agreement for a property, we may be unable to complete that acquisition and risk the loss of certain non-refundable deposits andincurring certain other acquisition-related costs;
· the actual costs of repositioning or redeveloping acquired properties may be greater than our estimates;· any acquisition agreement will likely contain conditions to closing, including completion of due diligence investigations to our satisfaction or other conditions that are
not within our control, which may not be satisfied; and· we may be unable to quickly and efficiently integrate new acquisitions, particularly acquisitions of portfolios of properties, into our existing operations, and acquired
properties may fail to perform as expected; which may adversely affect our results of operations and financial condition.
New acquisitions may fail to perform as expected: We may acquire new office properties, assuming that we are able to obtain capital on favorable terms. Such newly acquiredproperties may not perform as expected and may subject us to unknown liability with respect to liabilities relating to such properties for clean-up of undisclosed environmentalcontamination or claims by tenants, vendors or other persons against the former owners of the properties. Inaccurate assumptions regarding future rental or occupancy rates couldresult in overly optimistic estimates of future revenues. In addition, future operating expenses or the costs necessary to bring an acquired property up to standards established for itsintended market position may be underestimated.
Development of real estate could be costly: As part of our operating strategy, we may acquire land for development or construct on owned land, under certain conditions. Includedamong the risks of the real estate development business are the following, which may adversely affect our ability to make distributions or payments to our investors:
· financing for development projects may not be available on favorable terms;· long-term financing may not be available upon completion of construction; and· failure to complete construction on schedule or within budget may increase debt service expense and construction costs.
11

Property ownership through joint ventures could subject us to the contrary business objectives of our co-venturers: We, from time to time, invest in joint ventures or partnerships inwhich we do not hold a controlling interest in the assets underlying the entities in which we invest, including joint ventures in which (i) we own a direct interest in an entity whichcontrols such assets, or (ii) we own a direct interest in an entity which owns indirect interests, through one or more intermediaries, of such assets. These investments involve risksthat do not exist with properties in which we own a controlling interest with respect to the underlying assets, including the possibility that our co-venturers or partners may, at anytime, have business, economic or other objectives that are inconsistent with our objectives. Because we lack a controlling interest, our co-venturers or partners may be in a position totake action contrary to our instructions or requests or contrary to our policies or objectives. While we seek protective rights against such contrary actions, there can be no assurancethat we will be successful in procuring any such protective rights, or if procured, that the rights will be sufficient to fully protect us against contrary actions. Our organizationaldocuments do not limit the amount of available funds that we may invest in joint ventures or partnerships. If the objectives of our co-venturers or partners are inconsistent with ours,it may adversely affect our ability to make distributions or payments to our investors.
Our real estate construction management activities are subject to risks particular to third-party construction projects.As we may perform fixed price construction services for third parties, we are subject to a variety of risks unique to these activities. If construction costs of a project exceed originalestimates, such costs may have to be absorbed by us, thereby making the project less profitable than originally estimated, or possibly not profitable at all. In addition, a constructionproject may be delayed due to government or regulatory approvals, supply shortages, or other events and circumstances beyond our control, or the time required to complete aconstruction project may be greater than originally anticipated. If any such excess costs or project delays were to be material, such events may adversely effect our cash flow andliquidity and thereby impact our ability to pay dividends or make distributions to our investors.
Debt financing could adversely affect our economic performance.Scheduled debt payments and refinancing could adversely affect our financial condition: We are subject to the risks normally associated with debt financing. These risks, includingthe following, may adversely affect our ability to make distributions or payments to our investors:
· our cash flow may be insufficient to meet required payments of principal and interest;· payments of principal and interest on borrowings may leave us with insufficient cash resources to pay operating expenses;· we may not be able to refinance indebtedness on our properties at maturity; and· if refinanced, the terms of refinancing may not be as favorable as the original terms of the related indebtedness.
As of December 31, 2009, we had total outstanding indebtedness of $2.3 billion comprised of $1.6 billion of senior unsecured notes and approximately $755 million of mortgages,loans payable and other obligations. We may have to refinance the principal due on our current or future indebtedness at maturity, and we may not be able to do so.
If we are unable to refinance our indebtedness on acceptable terms, or at all, events or conditions that may adversely affect our ability to make distributions or payments to ourinvestors include the following:
· we may need to dispose of one or more of our properties upon disadvantageous terms;· prevailing interest rates or other factors at the time of refinancing could increase interest rates and, therefore, our interest expense;· we may be subject to an event of default pursuant to covenants for our indebtedness;· if we mortgage property to secure payment of indebtedness and are unable to meet mortgage payments, the mortgagee could foreclose upon such property or appoint a
receiver to receive an assignment of our rents and leases; and· foreclosures upon mortgaged property could create taxable income without accompanying cash proceeds and, therefore, hinder our ability to meet the real estate
investment trust distribution requirements of the Code.
12
We are obligated to comply with financial covenants in our indebtedness that could restrict our range of operating activities: The mortgages on our properties contain customarynegative covenants, including limitations on our ability, without the prior consent of the lender, to further mortgage the property, to enter into new leases outside of stipulatedguidelines or to materially modify existing leases. In addition, our revolving credit facility contains customary requirements, including restrictions and other limitations on our abilityto incur debt, debt to assets ratios, secured debt to total assets ratios, interest coverage ratios and minimum ratios of unencumbered assets to unsecured debt. The indentures underwhich our senior unsecured debt have been issued contain financial and operating covenants including coverage ratios and limitations on our ability to incur secured and unsecureddebt. These covenants limit our flexibility in conducting our operations and create a risk of default on our indebtedness if we cannot continue to satisfy them. Some of our debtinstruments are cross-collateralized and contain cross default provisions with other debt instruments. Due to this cross-collateralization, a failure or default with respect to certaindebt instruments or properties could have an adverse impact on us or our properties that are subject to the cross-collateralization under the applicable debt instrument. Failure tocomply with these covenants could cause a default under the agreements and, in certain circumstances, our lenders may be entitled to accelerate our debt obligations. Defaults underour debt agreements could materially and adversely affect our financial condition and results of operations.
Rising interest rates may adversely affect our cash flow: As of December 31, 2009, there were no outstanding borrowings under our revolving credit facility under which borrowingsbear interest at variable rates. We may incur indebtedness in the future that bears interest at variable rates. Variable rate debt creates higher debt service requirements if marketinterest rates increase. Higher debt service requirements could adversely affect our ability to make distributions or payments to our investors and/or cause us to default under certaindebt covenants.
Our degree of leverage could adversely affect our cash flow: We fund acquisition opportunities and development partially through short-term borrowings (including our revolvingcredit facility), as well as from proceeds from property sales and undistributed cash. We expect to refinance projects purchased with short-term debt either with long-termindebtedness or equity financing depending upon the economic conditions at the time of refinancing. Our Board of Directors has a general policy of limiting the ratio of ourindebtedness to total undepreciated assets (total debt as a percentage of total undepreciated assets) to 50 percent or less, although there is no limit in Mack-Cali Realty, L.P.’s or ourorganizational documents on the amount of indebtedness that we may incur. However, we have entered into certain financial agreements which contain financial and operatingcovenants that limit our ability under certain circumstances to incur additional secured and unsecured indebtedness. The Board of Directors could alter or eliminate its current policyon borrowing at any time at its discretion. If this policy were changed, we could become more highly leveraged, resulting in an increase in debt service that could adversely affectour cash flow and our ability to make distributions or payments to our investors and/or could cause an increased risk of default on our obligations.
We are dependent on external sources of capital for future growth: To qualify as a real estate investment trust under the Code, we must distribute to our shareholders each year atleast 90 percent of our net taxable income, excluding any net capital gain. Because of this distribution requirement, it is not likely that we will be able to fund all future capital needs,including for acquisitions and developments, from income from operations. Therefore, we will have to rely on third-party sources of capital, which may or may not be available onfavorable terms or at all. Our access to third-party sources of capital depends on a number of things, including the market’s perception of our growth potential and our current andpotential future earnings. Moreover, additional equity offerings may result in substantial dilution of our shareholders’ interests, and additional debt financing may substantiallyincrease our leverage.
Competition for skilled personnel could increase our labor costs.We compete with various other companies in attracting and retaining qualified and skilled personnel. We depend on our ability to attract and retain skilled management personnelwho are responsible for the day-to-day operations of our company. Competitive pressures may require that we enhance our pay and benefits package to compete effectively for suchpersonnel. We may not be able to offset such added costs by increasing the rates we charge our tenants. If there is an increase in these costs or if we fail to attract and retain qualifiedand skilled personnel, our business and operating results could be harmed.
13
We are dependent on our key personnel whose continued service is not guaranteed.We are dependent upon our executive officers for strategic business direction and real estate experience. While we believe that we could find replacements for these key personnel,loss of their services could adversely affect our operations. We have entered into an employment agreement (including non-competition provisions) which provides for a continuousfour-year employment term with each of Mitchell E. Hersh, Barry Lefkowitz and Roger W. Thomas and a continuous one-year employment term with Michael A. Grossman andMark Yeager. We do not have key man life insurance for our executive officers.
Certain provisions of Maryland law and our charter and bylaws could hinder, delay or prevent changes in control.Certain provisions of Maryland law, our charter and our bylaws have the effect of discouraging, delaying or preventing transactions that involve an actual or threatened change incontrol. These provisions include the following:
Classified Board of Directors: Our Board of Directors is divided into three classes with staggered terms of office of three years each. The classification and staggered terms of officeof our directors make it more difficult for a third party to gain control of our board of directors. At least two annual meetings of stockholders, instead of one, generally would berequired to affect a change in a majority of the board of directors.
Removal of Directors: Under our charter, subject to the rights of one or more classes or series of preferred stock to elect one or more directors, a director may be removed only forcause and only by the affirmative vote of at least two-thirds of all votes entitled to be cast by our stockholders generally in the election of directors. Neither the Maryland GeneralCorporation Law nor our charter define the term “cause.” As a result, removal for “cause” is subject to Maryland common law and to judicial interpretation and review in the contextof the facts and circumstances of any particular situation.
Number of Directors, Board Vacancies, Terms of Office: We have, in our bylaws, elected to be subject to certain provisions of Maryland law which vest in the Board of Directors theexclusive right to determine the number of directors and the exclusive right, by the affirmative vote of a majority of the remaining directors, even if the remaining directors do notconstitute a quorum, to fill vacancies on the board. These provisions of Maryland law, which are applicable even if other provisions of Maryland law or the charter or bylaws provideto the contrary, also provide that any director elected to fill a vacancy shall hold office for the remainder of the full term of the class of directors in which the vacancy occurred, ratherthan the next annual meeting of stockholders as would otherwise be the case, and until his or her successor is elected and qualifies.
Stockholder Requested Special Meetings: Our bylaws provide that our stockholders have the right to call a special meeting only upon the written request of the stockholders entitledto cast not less than a majority of all the votes entitled to be cast by the stockholders at such meeting.
Advance Notice Provisions for Stockholder Nominations and Proposals: Our bylaws require advance written notice for stockholders to nominate persons for election as directors at,or to bring other business before, any meeting of stockholders. This bylaw provision limits the ability of stockholders to make nominations of persons for election as directors or tointroduce other proposals unless we are notified in a timely manner prior to the meeting.
Exclusive Authority of the Board to Amend the Bylaws: Our bylaws provide that our board of directors has the exclusive power to adopt, alter or repeal any provision of the bylaws orto make new bylaws. Thus, our stockholders may not effect any changes to our bylaws.
Preferred Stock: Under our charter, our Board of Directors has authority to issue preferred stock from time to time in one or more series and to establish the terms, preferences andrights of any such series of preferred stock, all without approval of our stockholders.
Duties of Directors with Respect to Unsolicited Takeovers: Maryland law provides protection for Maryland corporations against unsolicited takeovers by limiting, among otherthings, the duties of the directors in unsolicited takeover situations. The duties of directors of Maryland corporations do not require them to (a) accept, recommend or respond to anyproposal by a person seeking to acquire control of the corporation, (b) authorize the corporation to redeem any rights under, or modify or render inapplicable, any stockholders rightsplan, (c) make a determination under the Maryland Business Combination Act or the Maryland Control Share Acquisition Act, or (d) act or fail to act solely because of the effect ofthe act or failure to act may have on an acquisition or potential acquisition of control of the corporation or the amount or type of consideration that may be offered or paid to thestockholders in an acquisition. Moreover, under Maryland law, the act of a director of a Maryland corporation relating to or affecting an acquisition or potential acquisition of controlis not subject to any higher duty or greater scrutiny than is applied to any other act of a director. Maryland law also contains a statutory presumption that an act of a director of aMaryland corporation satisfies the applicable standards of conduct for directors under Maryland law.
14
Ownership Limit: In order to preserve our status as a real estate investment trust under the Code, our charter generally prohibits any single stockholder, or any group of affiliatedstockholders, from beneficially owning more than 9.8 percent of our outstanding capital stock unless our Board of Directors waives or modifies this ownership limit.
Maryland Business Combination Act: The Maryland Business Combination Act provides that unless exempted, a Maryland corporation may not engage in business combinations,including mergers, dispositions of 10 percent or more of its assets, certain issuances of shares of stock and other specified transactions, with an “interested stockholder” or an affiliateof an interested stockholder, for five years after the most recent date on which the interested stockholder became an interested stockholder, and thereafter unless specified criteria aremet. An interested stockholder is generally a person owning or controlling, directly or indirectly, 10 percent or more of the voting power of the outstanding stock of the Marylandcorporation. Our board of directors has exempted from this statute business combinations between the Company and certain affiliated individuals and entities. However, unless ourboard adopts other exemptions, the provisions of the Maryland Business Combination Act will be applicable to business combinations with other persons.
Maryland Control Share Acquisition Act: Maryland law provides that “control shares” of a corporation acquired in a “control share acquisition” shall have no voting rights except tothe extent approved by a vote of two-thirds of the votes eligible to cast on the matter under the Maryland Control Share Acquisition Act. “Control shares” means shares of stock that,if aggregated with all other shares of stock previously acquired by the acquirer, would entitle the acquirer to exercise voting power in electing directors within one of the followingranges of the voting power: one-tenth or more but less than one-third, one-third or more but less than a majority or a majority or more of all voting power. A “control shareacquisition” means the acquisition of control shares, subject to certain exceptions.
If voting rights of control shares acquired in a control share acquisition are not approved at a stockholder’s meeting, then subject to certain conditions and limitations, the issuer mayredeem any or all of the control shares for fair value. If voting rights of such control shares are approved at a stockholder’s meeting and the acquirer becomes entitled to vote amajority of the shares of stock entitled to vote, all other stockholders may exercise appraisal rights. Our bylaws contain a provision exempting from the Maryland Control ShareAcquisition Act any acquisitions of shares by certain affiliated individuals and entities, any directors, officers or employees of the Company and any person approved by the board ofdirectors prior to the acquisition by such person of control shares. Any control shares acquired in a control share acquisition which are not exempt under the foregoing provisions ofour bylaws will be subject to the Maryland Control Share Acquisition Act.
Consequences of failure to qualify as a real estate investment trust could adversely affect our financial condition. Failure to maintain ownership limits could cause us to loseour qualification as a real estate investment trust: In order for us to maintain our qualification as a real estate investment trust under the Code, not more than 50 percent in value ofour outstanding stock may be actually and/or constructively owned by five or fewer individuals (as defined in the Code to include certain entities). We have limited the ownership ofour outstanding shares of our common stock by any single stockholder to 9.8 percent of the outstanding shares of our common stock. Our Board of Directors could waive thisrestriction if they were satisfied, based upon the advice of tax counsel or otherwise, that such action would be in our best interests and would not affect our qualification as a realestate investment trust under the Code. Common stock acquired or transferred in breach of the limitation may be redeemed by us for the lesser of the price paid and the averageclosing price for the 10 trading days immediately preceding redemption or sold at the direction of us. We may elect to redeem such shares of common stock for Units, which arenontransferable except in very limited circumstances. Any transfer of shares of common stock which, as a result of such transfer, causes us to be in violation of any ownership limit,will be deemed void. Although we currently intend to continue to operate in a manner which will enable us to continue to qualify as a real estate investment trust under the Code, it ispossible that future economic, market, legal, tax or other considerations may cause our Board of Directors to revoke the election for us to qualify as a real estate investmenttrust. Under our organizational documents, our Board of Directors can make such revocation without the consent of our stockholders.
15
In addition, the consent of the holders of at least 85 percent of Mack-Cali Realty, L.P.’s partnership units is required: (i) to merge (or permit the merger of) us with another unrelatedperson, pursuant to a transaction in which Mack-Cali Realty, L.P. is not the surviving entity; (ii) to dissolve, liquidate or wind up Mack-Cali Realty, L.P.; or (iii) to convey orotherwise transfer all or substantially all of Mack-Cali Realty, L.P.’s assets. As of February 8, 2010, as general partner, we own approximately 85.6 percent of Mack-Cali Realty,L.P.’s outstanding common partnership units.
Tax liabilities as a consequence of failure to qualify as a real estate investment trust: We have elected to be treated and have operated so as to qualify as a real estate investment trustfor federal income tax purposes since our taxable year ended December 31, 1994. Although we believe we will continue to operate in such manner, we cannot guarantee that we willdo so. Qualification as a real estate investment trust involves the satisfaction of various requirements (some on an annual and some on a quarterly basis) established under highlytechnical and complex tax provisions of the Code. Because few judicial or administrative interpretations of such provisions exist and qualification determinations are fact sensitive,we cannot assure you that we will qualify as a real estate investment trust for any taxable year.
If we fail to qualify as a real estate investment trust in any taxable year, we will be subject to the following:
· we will not be allowed a deduction for dividends paid to shareholders;· we will be subject to federal income tax at regular corporate rates, including any alternative minimum tax, if applicable; and· unless we are entitled to relief under certain statutory provisions, we will not be permitted to qualify as a real estate investment trust for the four taxable years
following the year during which we were disqualified.
A loss of our status as a real estate investment trust could have an adverse effect on us. Failure to qualify as a real estate investment trust also would eliminate the requirement thatwe pay dividends to our stockholders.
Other tax liabilities: Even if we qualify as a real estate investment trust under the Code, we are subject to certain federal, state and local taxes on our income and property and, insome circumstances, certain other state and local taxes. In addition, our taxable REIT subsidiaries will be subject to federal, state and local income tax for income received inconnection with certain non-customary services performed for tenants and/or third parties.
Risk of changes in the tax law applicable to real estate investment trusts: Since the Internal Revenue Service, the United States Treasury Department and Congress frequently reviewfederal income tax legislation, we cannot predict whether, when or to what extent new federal tax laws, regulations, interpretations or rulings will be adopted. Any of such legislativeaction may prospectively or retroactively modify our and Mack-Cali Realty, L.P.’s tax treatment and, therefore, may adversely affect taxation of us, Mack-Cali Realty, L.P., and/orour investors.
Changes in market conditions could adversely affect the market price of our common stock.As with other publicly traded equity securities, the value of our common stock depends on various market conditions, which may change from time to time. The market price of ourcommon stock could change in ways that may or may not be related to our business, our industry or our operating performance and financial condition. Among the marketconditions that may affect the value of our common stock are the following:
· the extent of your interest in us; · the general reputation of REITs and the attractiveness of our equity securities in comparison to other equity securities, including securities issued by other real estate-
based companies; · our financial performance; and · general stock and bond market conditions.
The market value of our common stock is based primarily upon the market’s perception of our growth potential and our current and potential future earnings and cash dividends.Consequently, our common stock may trade at prices that are higher or lower than our net asset value per share of common stock.
16

ITEM 1B. UNRESOLVED STAFF COMMENTS
None.
17

ITEM 2. PROPERTIES
PROPERTY LIST
As of December 31, 2009, the Company’s Consolidated Properties consisted of 263 in-service office, office/flex and industrial/warehouse properties, as well as two stand-alone retailproperties and three land leases. The Consolidated Properties are located primarily in the Northeast. The Consolidated Properties are easily accessible from major thoroughfares andare in close proximity to numerous amenities. The Consolidated Properties contain a total of approximately 30.9 million square feet, with the individual properties ranging from6,216 to 1,246,283 square feet. The Consolidated Properties, managed by on-site employees, generally have attractively landscaped sites and atriums in addition to quality design andconstruction. The Company’s tenants include many service sector employers, including a large number of professional firms and national and international businesses. TheCompany believes that all of its properties are well-maintained and do not require significant capital improvements.
18
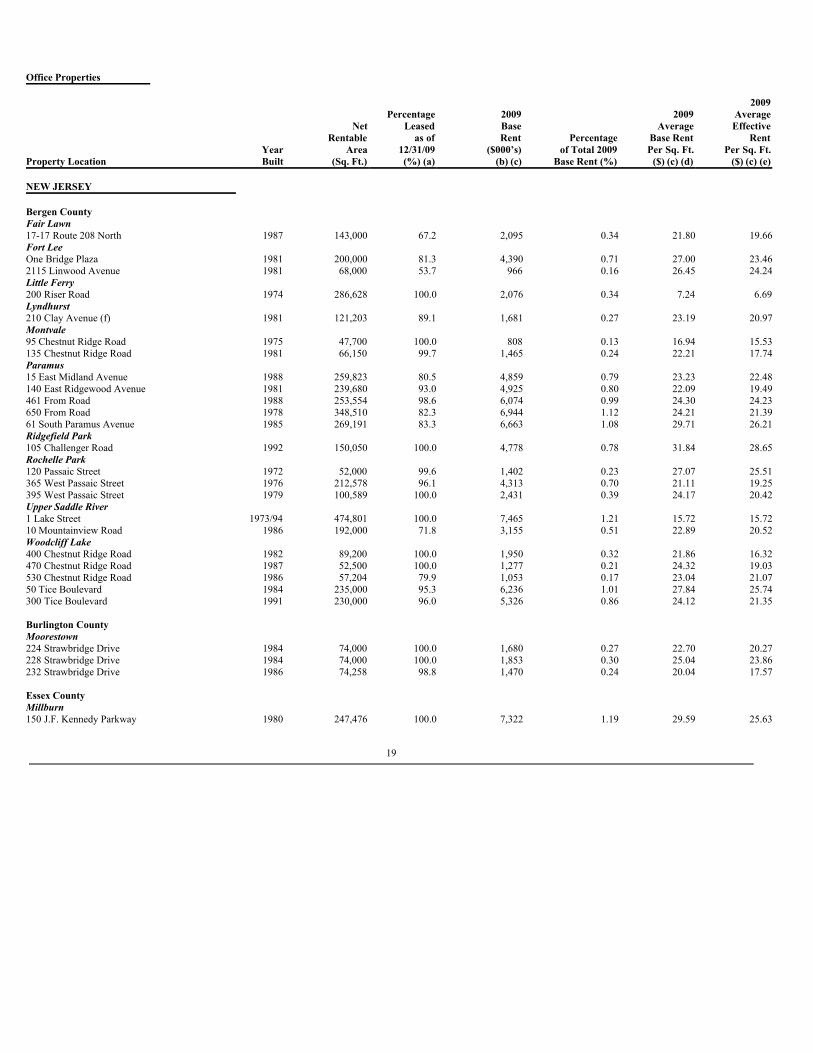
Office Properties 2009 Percentage 2009 2009 Average Net Leased Base Average Effective Rentable as of Rent Percentage Base Rent Rent Year Area 12/31/09 ($000’s) of Total 2009 Per Sq. Ft. Per Sq. Ft.Property Location Built (Sq. Ft.) (%) (a) (b) (c) Base Rent (%) ($) (c) (d) ($) (c) (e) NEW JERSEY Bergen County Fair Lawn 17-17 Route 208 North 1987 143,000 67.2 2,095 0.34 21.80 19.66Fort Lee One Bridge Plaza 1981 200,000 81.3 4,390 0.71 27.00 23.462115 Linwood Avenue 1981 68,000 53.7 966 0.16 26.45 24.24Little Ferry 200 Riser Road 1974 286,628 100.0 2,076 0.34 7.24 6.69Lyndhurst 210 Clay Avenue (f) 1981 121,203 89.1 1,681 0.27 23.19 20.97Montvale 95 Chestnut Ridge Road 1975 47,700 100.0 808 0.13 16.94 15.53135 Chestnut Ridge Road 1981 66,150 99.7 1,465 0.24 22.21 17.74Paramus 15 East Midland Avenue 1988 259,823 80.5 4,859 0.79 23.23 22.48140 East Ridgewood Avenue 1981 239,680 93.0 4,925 0.80 22.09 19.49461 From Road 1988 253,554 98.6 6,074 0.99 24.30 24.23650 From Road 1978 348,510 82.3 6,944 1.12 24.21 21.3961 South Paramus Avenue 1985 269,191 83.3 6,663 1.08 29.71 26.21Ridgefield Park 105 Challenger Road 1992 150,050 100.0 4,778 0.78 31.84 28.65Rochelle Park 120 Passaic Street 1972 52,000 99.6 1,402 0.23 27.07 25.51365 West Passaic Street 1976 212,578 96.1 4,313 0.70 21.11 19.25395 West Passaic Street 1979 100,589 100.0 2,431 0.39 24.17 20.42Upper Saddle River 1 Lake Street 1973/94 474,801 100.0 7,465 1.21 15.72 15.7210 Mountainview Road 1986 192,000 71.8 3,155 0.51 22.89 20.52Woodcliff Lake 400 Chestnut Ridge Road 1982 89,200 100.0 1,950 0.32 21.86 16.32470 Chestnut Ridge Road 1987 52,500 100.0 1,277 0.21 24.32 19.03530 Chestnut Ridge Road 1986 57,204 79.9 1,053 0.17 23.04 21.0750 Tice Boulevard 1984 235,000 95.3 6,236 1.01 27.84 25.74300 Tice Boulevard 1991 230,000 96.0 5,326 0.86 24.12 21.35 Burlington County Moorestown 224 Strawbridge Drive 1984 74,000 100.0 1,680 0.27 22.70 20.27228 Strawbridge Drive 1984 74,000 100.0 1,853 0.30 25.04 23.86232 Strawbridge Drive 1986 74,258 98.8 1,470 0.24 20.04 17.57 Essex County Millburn 150 J.F. Kennedy Parkway 1980 247,476 100.0 7,322 1.19 29.59 25.63
19
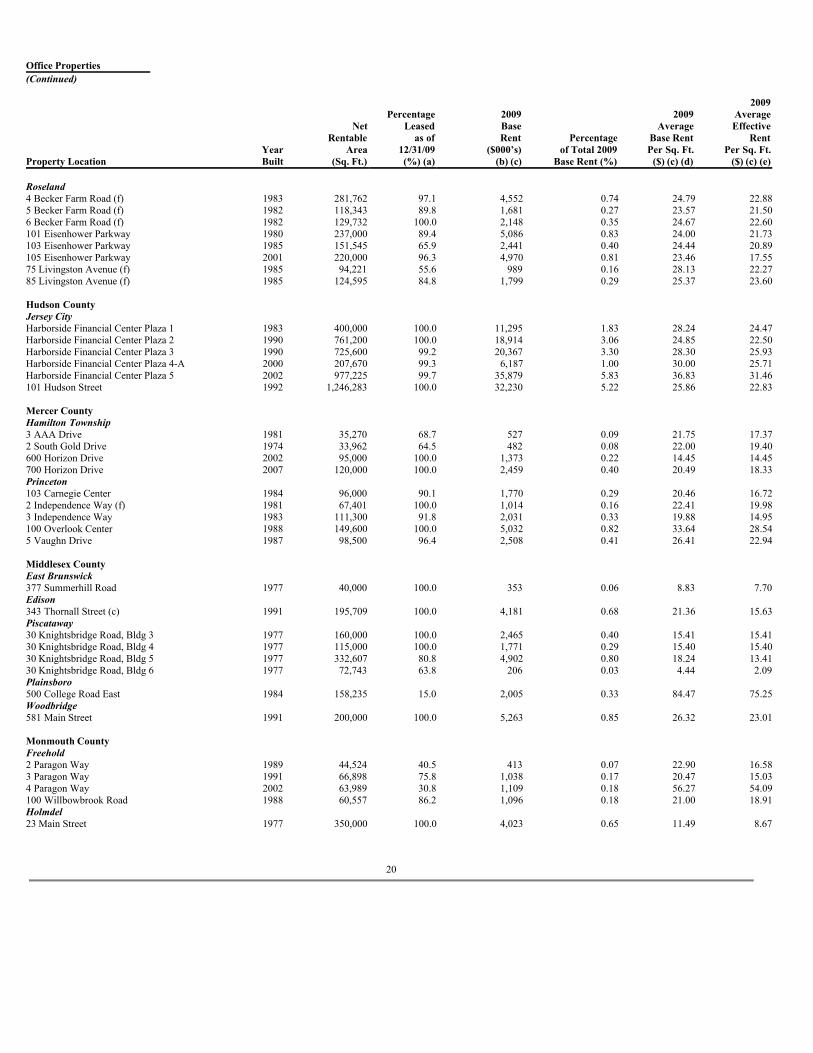
Office Properties (Continued) 2009 Percentage 2009 2009 Average Net Leased Base Average Effective Rentable as of Rent Percentage Base Rent Rent Year Area 12/31/09 ($000’s) of Total 2009 Per Sq. Ft. Per Sq. Ft.Property Location Built (Sq. Ft.) (%) (a) (b) (c) Base Rent (%) ($) (c) (d) ($) (c) (e) Roseland 4 Becker Farm Road (f) 1983 281,762 97.1 4,552 0.74 24.79 22.885 Becker Farm Road (f) 1982 118,343 89.8 1,681 0.27 23.57 21.506 Becker Farm Road (f) 1982 129,732 100.0 2,148 0.35 24.67 22.60101 Eisenhower Parkway 1980 237,000 89.4 5,086 0.83 24.00 21.73103 Eisenhower Parkway 1985 151,545 65.9 2,441 0.40 24.44 20.89105 Eisenhower Parkway 2001 220,000 96.3 4,970 0.81 23.46 17.5575 Livingston Avenue (f) 1985 94,221 55.6 989 0.16 28.13 22.2785 Livingston Avenue (f) 1985 124,595 84.8 1,799 0.29 25.37 23.60 Hudson County Jersey City Harborside Financial Center Plaza 1 1983 400,000 100.0 11,295 1.83 28.24 24.47Harborside Financial Center Plaza 2 1990 761,200 100.0 18,914 3.06 24.85 22.50Harborside Financial Center Plaza 3 1990 725,600 99.2 20,367 3.30 28.30 25.93Harborside Financial Center Plaza 4-A 2000 207,670 99.3 6,187 1.00 30.00 25.71Harborside Financial Center Plaza 5 2002 977,225 99.7 35,879 5.83 36.83 31.46101 Hudson Street 1992 1,246,283 100.0 32,230 5.22 25.86 22.83 Mercer County Hamilton Township 3 AAA Drive 1981 35,270 68.7 527 0.09 21.75 17.372 South Gold Drive 1974 33,962 64.5 482 0.08 22.00 19.40600 Horizon Drive 2002 95,000 100.0 1,373 0.22 14.45 14.45700 Horizon Drive 2007 120,000 100.0 2,459 0.40 20.49 18.33Princeton 103 Carnegie Center 1984 96,000 90.1 1,770 0.29 20.46 16.722 Independence Way (f) 1981 67,401 100.0 1,014 0.16 22.41 19.983 Independence Way 1983 111,300 91.8 2,031 0.33 19.88 14.95100 Overlook Center 1988 149,600 100.0 5,032 0.82 33.64 28.545 Vaughn Drive 1987 98,500 96.4 2,508 0.41 26.41 22.94 Middlesex County East Brunswick 377 Summerhill Road 1977 40,000 100.0 353 0.06 8.83 7.70Edison 343 Thornall Street (c) 1991 195,709 100.0 4,181 0.68 21.36 15.63Piscataway 30 Knightsbridge Road, Bldg 3 1977 160,000 100.0 2,465 0.40 15.41 15.4130 Knightsbridge Road, Bldg 4 1977 115,000 100.0 1,771 0.29 15.40 15.4030 Knightsbridge Road, Bldg 5 1977 332,607 80.8 4,902 0.80 18.24 13.4130 Knightsbridge Road, Bldg 6 1977 72,743 63.8 206 0.03 4.44 2.09Plainsboro 500 College Road East 1984 158,235 15.0 2,005 0.33 84.47 75.25Woodbridge 581 Main Street 1991 200,000 100.0 5,263 0.85 26.32 23.01 Monmouth County Freehold 2 Paragon Way 1989 44,524 40.5 413 0.07 22.90 16.583 Paragon Way 1991 66,898 75.8 1,038 0.17 20.47 15.034 Paragon Way 2002 63,989 30.8 1,109 0.18 56.27 54.09100 Willbowbrook Road 1988 60,557 86.2 1,096 0.18 21.00 18.91Holmdel 23 Main Street 1977 350,000 100.0 4,023 0.65 11.49 8.67
20
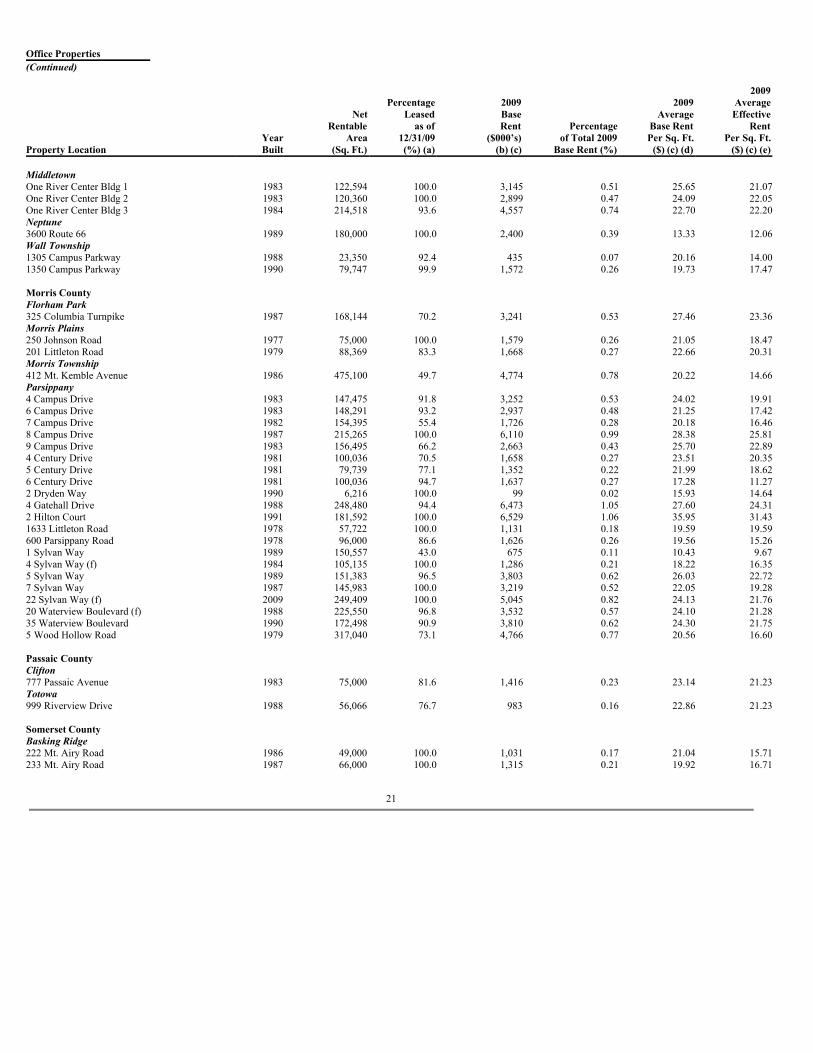
Office Properties (Continued) 2009 Percentage 2009 2009 Average Net Leased Base Average Effective Rentable as of Rent Percentage Base Rent Rent Year Area 12/31/09 ($000’s) of Total 2009 Per Sq. Ft. Per Sq. Ft.Property Location Built (Sq. Ft.) (%) (a) (b) (c) Base Rent (%) ($) (c) (d) ($) (c) (e) Middletown One River Center Bldg 1 1983 122,594 100.0 3,145 0.51 25.65 21.07One River Center Bldg 2 1983 120,360 100.0 2,899 0.47 24.09 22.05One River Center Bldg 3 1984 214,518 93.6 4,557 0.74 22.70 22.20Neptune 3600 Route 66 1989 180,000 100.0 2,400 0.39 13.33 12.06Wall Township 1305 Campus Parkway 1988 23,350 92.4 435 0.07 20.16 14.001350 Campus Parkway 1990 79,747 99.9 1,572 0.26 19.73 17.47 Morris County Florham Park 325 Columbia Turnpike 1987 168,144 70.2 3,241 0.53 27.46 23.36Morris Plains 250 Johnson Road 1977 75,000 100.0 1,579 0.26 21.05 18.47201 Littleton Road 1979 88,369 83.3 1,668 0.27 22.66 20.31Morris Township 412 Mt. Kemble Avenue 1986 475,100 49.7 4,774 0.78 20.22 14.66Parsippany 4 Campus Drive 1983 147,475 91.8 3,252 0.53 24.02 19.916 Campus Drive 1983 148,291 93.2 2,937 0.48 21.25 17.427 Campus Drive 1982 154,395 55.4 1,726 0.28 20.18 16.468 Campus Drive 1987 215,265 100.0 6,110 0.99 28.38 25.819 Campus Drive 1983 156,495 66.2 2,663 0.43 25.70 22.894 Century Drive 1981 100,036 70.5 1,658 0.27 23.51 20.355 Century Drive 1981 79,739 77.1 1,352 0.22 21.99 18.626 Century Drive 1981 100,036 94.7 1,637 0.27 17.28 11.272 Dryden Way 1990 6,216 100.0 99 0.02 15.93 14.644 Gatehall Drive 1988 248,480 94.4 6,473 1.05 27.60 24.312 Hilton Court 1991 181,592 100.0 6,529 1.06 35.95 31.431633 Littleton Road 1978 57,722 100.0 1,131 0.18 19.59 19.59600 Parsippany Road 1978 96,000 86.6 1,626 0.26 19.56 15.261 Sylvan Way 1989 150,557 43.0 675 0.11 10.43 9.674 Sylvan Way (f) 1984 105,135 100.0 1,286 0.21 18.22 16.355 Sylvan Way 1989 151,383 96.5 3,803 0.62 26.03 22.727 Sylvan Way 1987 145,983 100.0 3,219 0.52 22.05 19.2822 Sylvan Way (f) 2009 249,409 100.0 5,045 0.82 24.13 21.7620 Waterview Boulevard (f) 1988 225,550 96.8 3,532 0.57 24.10 21.2835 Waterview Boulevard 1990 172,498 90.9 3,810 0.62 24.30 21.755 Wood Hollow Road 1979 317,040 73.1 4,766 0.77 20.56 16.60 Passaic County Clifton 777 Passaic Avenue 1983 75,000 81.6 1,416 0.23 23.14 21.23Totowa 999 Riverview Drive 1988 56,066 76.7 983 0.16 22.86 21.23 Somerset County Basking Ridge 222 Mt. Airy Road 1986 49,000 100.0 1,031 0.17 21.04 15.71233 Mt. Airy Road 1987 66,000 100.0 1,315 0.21 19.92 16.71
21
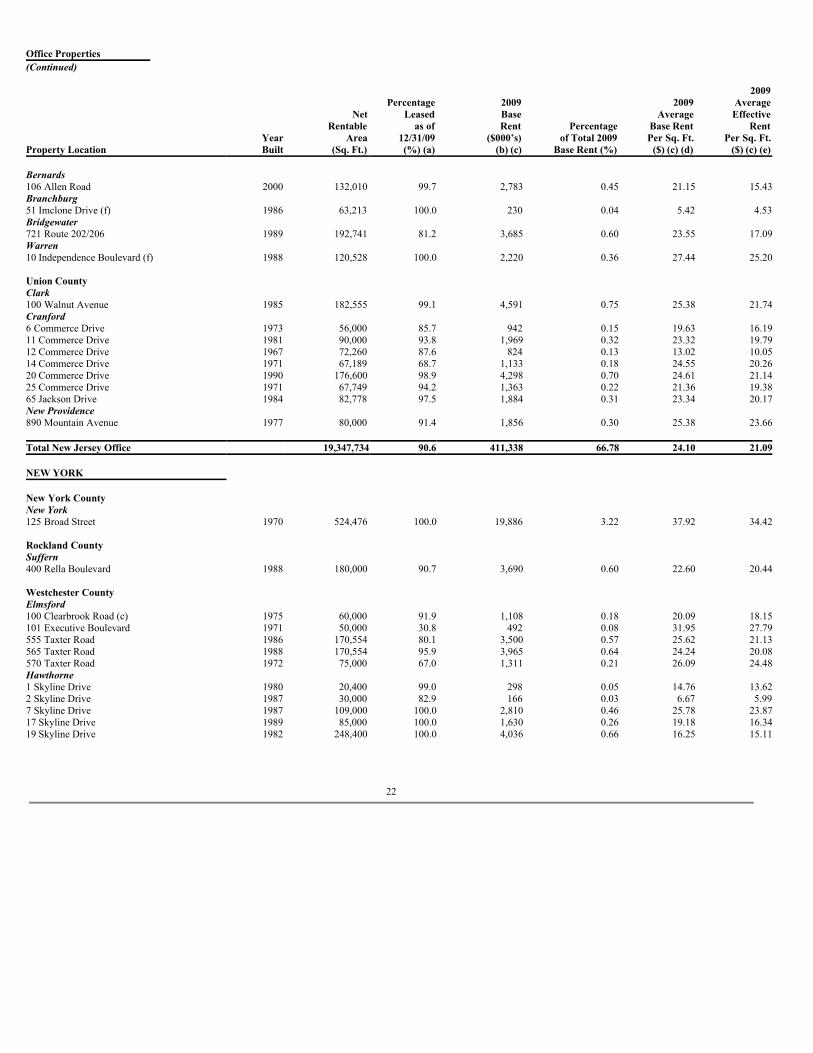
Office Properties (Continued) 2009 Percentage 2009 2009 Average Net Leased Base Average Effective Rentable as of Rent Percentage Base Rent Rent Year Area 12/31/09 ($000’s) of Total 2009 Per Sq. Ft. Per Sq. Ft.Property Location Built (Sq. Ft.) (%) (a) (b) (c) Base Rent (%) ($) (c) (d) ($) (c) (e) Bernards 106 Allen Road 2000 132,010 99.7 2,783 0.45 21.15 15.43Branchburg 51 Imclone Drive (f) 1986 63,213 100.0 230 0.04 5.42 4.53Bridgewater 721 Route 202/206 1989 192,741 81.2 3,685 0.60 23.55 17.09Warren 10 Independence Boulevard (f) 1988 120,528 100.0 2,220 0.36 27.44 25.20 Union County Clark 100 Walnut Avenue 1985 182,555 99.1 4,591 0.75 25.38 21.74Cranford 6 Commerce Drive 1973 56,000 85.7 942 0.15 19.63 16.1911 Commerce Drive 1981 90,000 93.8 1,969 0.32 23.32 19.7912 Commerce Drive 1967 72,260 87.6 824 0.13 13.02 10.0514 Commerce Drive 1971 67,189 68.7 1,133 0.18 24.55 20.2620 Commerce Drive 1990 176,600 98.9 4,298 0.70 24.61 21.1425 Commerce Drive 1971 67,749 94.2 1,363 0.22 21.36 19.3865 Jackson Drive 1984 82,778 97.5 1,884 0.31 23.34 20.17New Providence 890 Mountain Avenue 1977 80,000 91.4 1,856 0.30 25.38 23.66 Total New Jersey Office 19,347,734 90.6 411,338 66.78 24.10 21.09 NEW YORK New York County New York 125 Broad Street 1970 524,476 100.0 19,886 3.22 37.92 34.42 Rockland County Suffern 400 Rella Boulevard 1988 180,000 90.7 3,690 0.60 22.60 20.44 Westchester County Elmsford 100 Clearbrook Road (c) 1975 60,000 91.9 1,108 0.18 20.09 18.15101 Executive Boulevard 1971 50,000 30.8 492 0.08 31.95 27.79555 Taxter Road 1986 170,554 80.1 3,500 0.57 25.62 21.13565 Taxter Road 1988 170,554 95.9 3,965 0.64 24.24 20.08570 Taxter Road 1972 75,000 67.0 1,311 0.21 26.09 24.48Hawthorne 1 Skyline Drive 1980 20,400 99.0 298 0.05 14.76 13.622 Skyline Drive 1987 30,000 82.9 166 0.03 6.67 5.997 Skyline Drive 1987 109,000 100.0 2,810 0.46 25.78 23.8717 Skyline Drive 1989 85,000 100.0 1,630 0.26 19.18 16.3419 Skyline Drive 1982 248,400 100.0 4,036 0.66 16.25 15.11
22
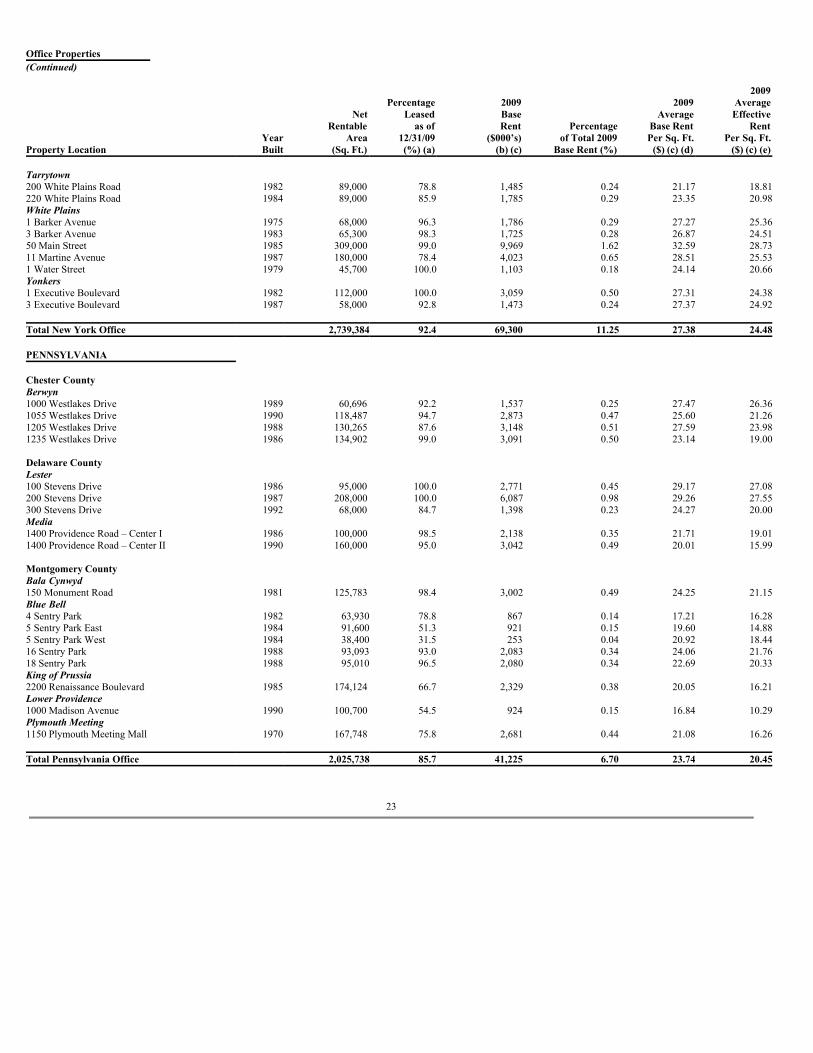
Office Properties (Continued) 2009 Percentage 2009 2009 Average Net Leased Base Average Effective Rentable as of Rent Percentage Base Rent Rent Year Area 12/31/09 ($000’s) of Total 2009 Per Sq. Ft. Per Sq. Ft.Property Location Built (Sq. Ft.) (%) (a) (b) (c) Base Rent (%) ($) (c) (d) ($) (c) (e) Tarrytown 200 White Plains Road 1982 89,000 78.8 1,485 0.24 21.17 18.81220 White Plains Road 1984 89,000 85.9 1,785 0.29 23.35 20.98White Plains 1 Barker Avenue 1975 68,000 96.3 1,786 0.29 27.27 25.363 Barker Avenue 1983 65,300 98.3 1,725 0.28 26.87 24.5150 Main Street 1985 309,000 99.0 9,969 1.62 32.59 28.7311 Martine Avenue 1987 180,000 78.4 4,023 0.65 28.51 25.531 Water Street 1979 45,700 100.0 1,103 0.18 24.14 20.66Yonkers 1 Executive Boulevard 1982 112,000 100.0 3,059 0.50 27.31 24.383 Executive Boulevard 1987 58,000 92.8 1,473 0.24 27.37 24.92 Total New York Office 2,739,384 92.4 69,300 11.25 27.38 24.48 PENNSYLVANIA Chester County Berwyn 1000 Westlakes Drive 1989 60,696 92.2 1,537 0.25 27.47 26.361055 Westlakes Drive 1990 118,487 94.7 2,873 0.47 25.60 21.261205 Westlakes Drive 1988 130,265 87.6 3,148 0.51 27.59 23.981235 Westlakes Drive 1986 134,902 99.0 3,091 0.50 23.14 19.00 Delaware County Lester 100 Stevens Drive 1986 95,000 100.0 2,771 0.45 29.17 27.08200 Stevens Drive 1987 208,000 100.0 6,087 0.98 29.26 27.55300 Stevens Drive 1992 68,000 84.7 1,398 0.23 24.27 20.00Media 1400 Providence Road – Center I 1986 100,000 98.5 2,138 0.35 21.71 19.011400 Providence Road – Center II 1990 160,000 95.0 3,042 0.49 20.01 15.99 Montgomery County Bala Cynwyd 150 Monument Road 1981 125,783 98.4 3,002 0.49 24.25 21.15Blue Bell 4 Sentry Park 1982 63,930 78.8 867 0.14 17.21 16.285 Sentry Park East 1984 91,600 51.3 921 0.15 19.60 14.885 Sentry Park West 1984 38,400 31.5 253 0.04 20.92 18.4416 Sentry Park 1988 93,093 93.0 2,083 0.34 24.06 21.7618 Sentry Park 1988 95,010 96.5 2,080 0.34 22.69 20.33King of Prussia 2200 Renaissance Boulevard 1985 174,124 66.7 2,329 0.38 20.05 16.21Lower Providence 1000 Madison Avenue 1990 100,700 54.5 924 0.15 16.84 10.29Plymouth Meeting 1150 Plymouth Meeting Mall 1970 167,748 75.8 2,681 0.44 21.08 16.26 Total Pennsylvania Office 2,025,738 85.7 41,225 6.70 23.74 20.45
23
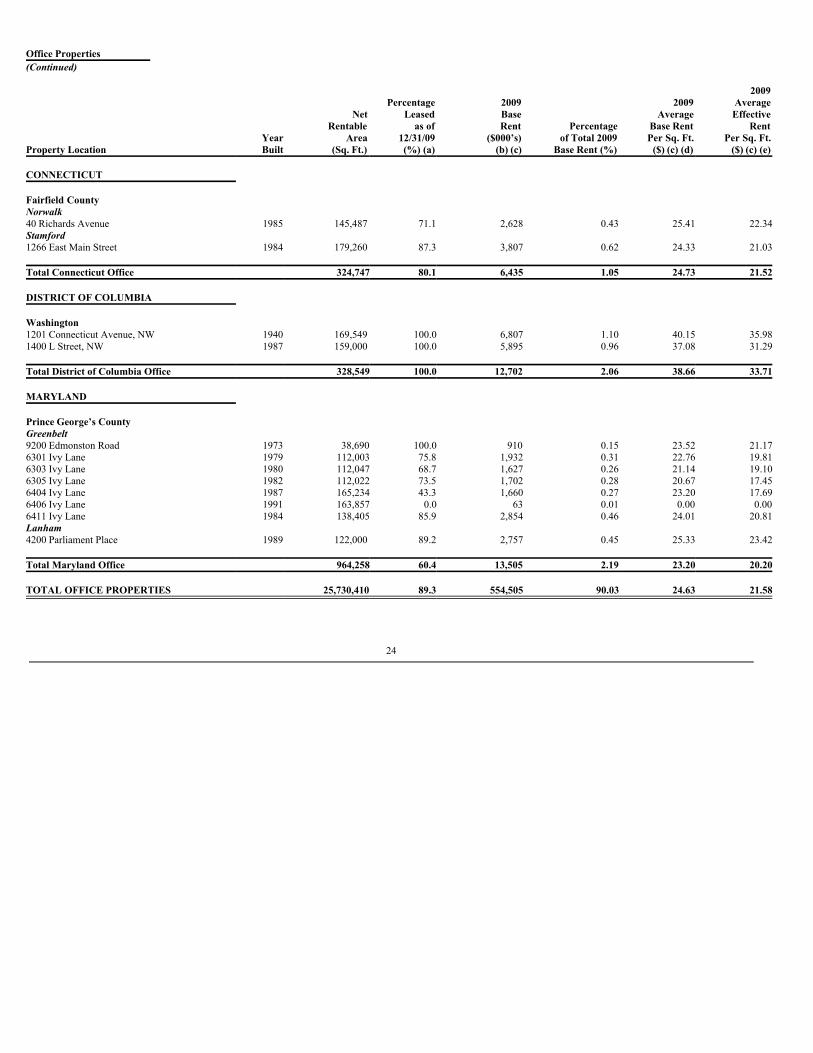
Office Properties (Continued) 2009 Percentage 2009 2009 Average Net Leased Base Average Effective Rentable as of Rent Percentage Base Rent Rent Year Area 12/31/09 ($000’s) of Total 2009 Per Sq. Ft. Per Sq. Ft.Property Location Built (Sq. Ft.) (%) (a) (b) (c) Base Rent (%) ($) (c) (d) ($) (c) (e) CONNECTICUT Fairfield County Norwalk 40 Richards Avenue 1985 145,487 71.1 2,628 0.43 25.41 22.34Stamford 1266 East Main Street 1984 179,260 87.3 3,807 0.62 24.33 21.03 Total Connecticut Office 324,747 80.1 6,435 1.05 24.73 21.52 DISTRICT OF COLUMBIA Washington 1201 Connecticut Avenue, NW 1940 169,549 100.0 6,807 1.10 40.15 35.981400 L Street, NW 1987 159,000 100.0 5,895 0.96 37.08 31.29 Total District of Columbia Office 328,549 100.0 12,702 2.06 38.66 33.71 MARYLAND Prince George’s County Greenbelt 9200 Edmonston Road 1973 38,690 100.0 910 0.15 23.52 21.176301 Ivy Lane 1979 112,003 75.8 1,932 0.31 22.76 19.816303 Ivy Lane 1980 112,047 68.7 1,627 0.26 21.14 19.106305 Ivy Lane 1982 112,022 73.5 1,702 0.28 20.67 17.456404 Ivy Lane 1987 165,234 43.3 1,660 0.27 23.20 17.696406 Ivy Lane 1991 163,857 0.0 63 0.01 0.00 0.006411 Ivy Lane 1984 138,405 85.9 2,854 0.46 24.01 20.81Lanham 4200 Parliament Place 1989 122,000 89.2 2,757 0.45 25.33 23.42 Total Maryland Office 964,258 60.4 13,505 2.19 23.20 20.20 TOTAL OFFICE PROPERTIES 25,730,410 89.3 554,505 90.03 24.63 21.58
24
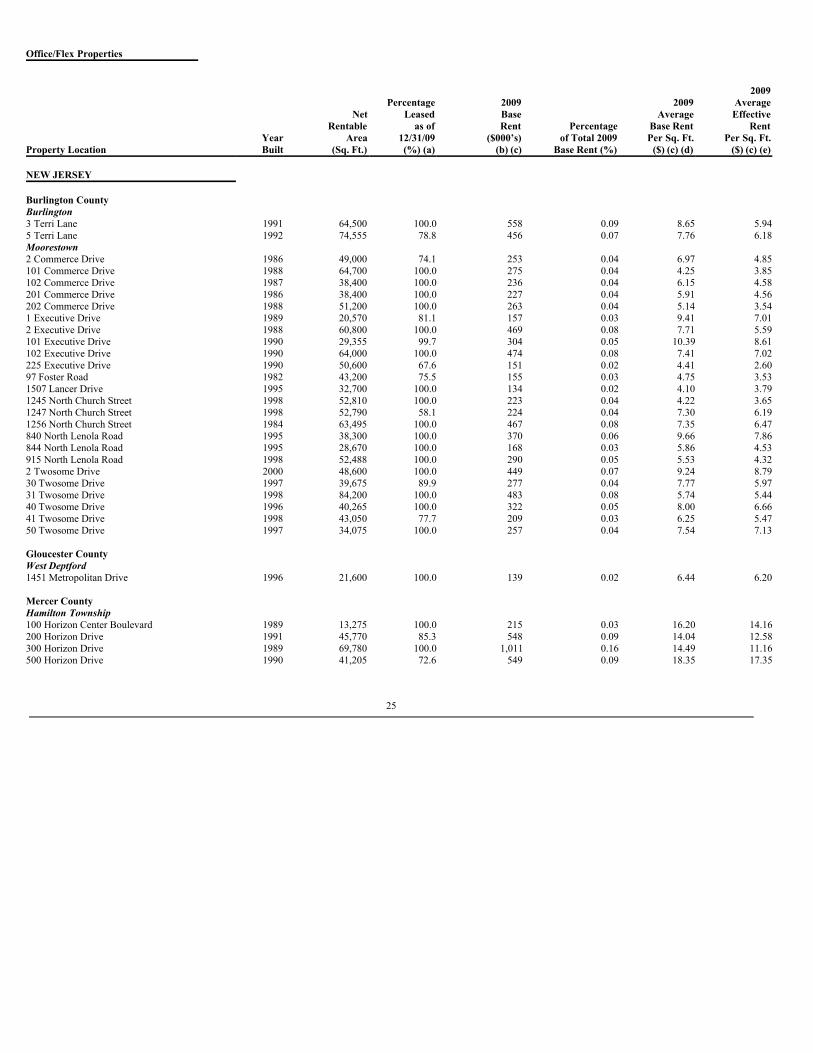
Office/Flex Properties 2009 Percentage 2009 2009 Average Net Leased Base Average Effective Rentable as of Rent Percentage Base Rent Rent Year Area 12/31/09 ($000’s) of Total 2009 Per Sq. Ft. Per Sq. Ft.Property Location Built (Sq. Ft.) (%) (a) (b) (c) Base Rent (%) ($) (c) (d) ($) (c) (e) NEW JERSEY Burlington County Burlington 3 Terri Lane 1991 64,500 100.0 558 0.09 8.65 5.945 Terri Lane 1992 74,555 78.8 456 0.07 7.76 6.18Moorestown 2 Commerce Drive 1986 49,000 74.1 253 0.04 6.97 4.85101 Commerce Drive 1988 64,700 100.0 275 0.04 4.25 3.85102 Commerce Drive 1987 38,400 100.0 236 0.04 6.15 4.58201 Commerce Drive 1986 38,400 100.0 227 0.04 5.91 4.56202 Commerce Drive 1988 51,200 100.0 263 0.04 5.14 3.541 Executive Drive 1989 20,570 81.1 157 0.03 9.41 7.012 Executive Drive 1988 60,800 100.0 469 0.08 7.71 5.59101 Executive Drive 1990 29,355 99.7 304 0.05 10.39 8.61102 Executive Drive 1990 64,000 100.0 474 0.08 7.41 7.02225 Executive Drive 1990 50,600 67.6 151 0.02 4.41 2.6097 Foster Road 1982 43,200 75.5 155 0.03 4.75 3.531507 Lancer Drive 1995 32,700 100.0 134 0.02 4.10 3.791245 North Church Street 1998 52,810 100.0 223 0.04 4.22 3.651247 North Church Street 1998 52,790 58.1 224 0.04 7.30 6.191256 North Church Street 1984 63,495 100.0 467 0.08 7.35 6.47840 North Lenola Road 1995 38,300 100.0 370 0.06 9.66 7.86844 North Lenola Road 1995 28,670 100.0 168 0.03 5.86 4.53915 North Lenola Road 1998 52,488 100.0 290 0.05 5.53 4.322 Twosome Drive 2000 48,600 100.0 449 0.07 9.24 8.7930 Twosome Drive 1997 39,675 89.9 277 0.04 7.77 5.9731 Twosome Drive 1998 84,200 100.0 483 0.08 5.74 5.4440 Twosome Drive 1996 40,265 100.0 322 0.05 8.00 6.6641 Twosome Drive 1998 43,050 77.7 209 0.03 6.25 5.4750 Twosome Drive 1997 34,075 100.0 257 0.04 7.54 7.13 Gloucester County West Deptford 1451 Metropolitan Drive 1996 21,600 100.0 139 0.02 6.44 6.20 Mercer County Hamilton Township 100 Horizon Center Boulevard 1989 13,275 100.0 215 0.03 16.20 14.16200 Horizon Drive 1991 45,770 85.3 548 0.09 14.04 12.58300 Horizon Drive 1989 69,780 100.0 1,011 0.16 14.49 11.16500 Horizon Drive 1990 41,205 72.6 549 0.09 18.35 17.35
25
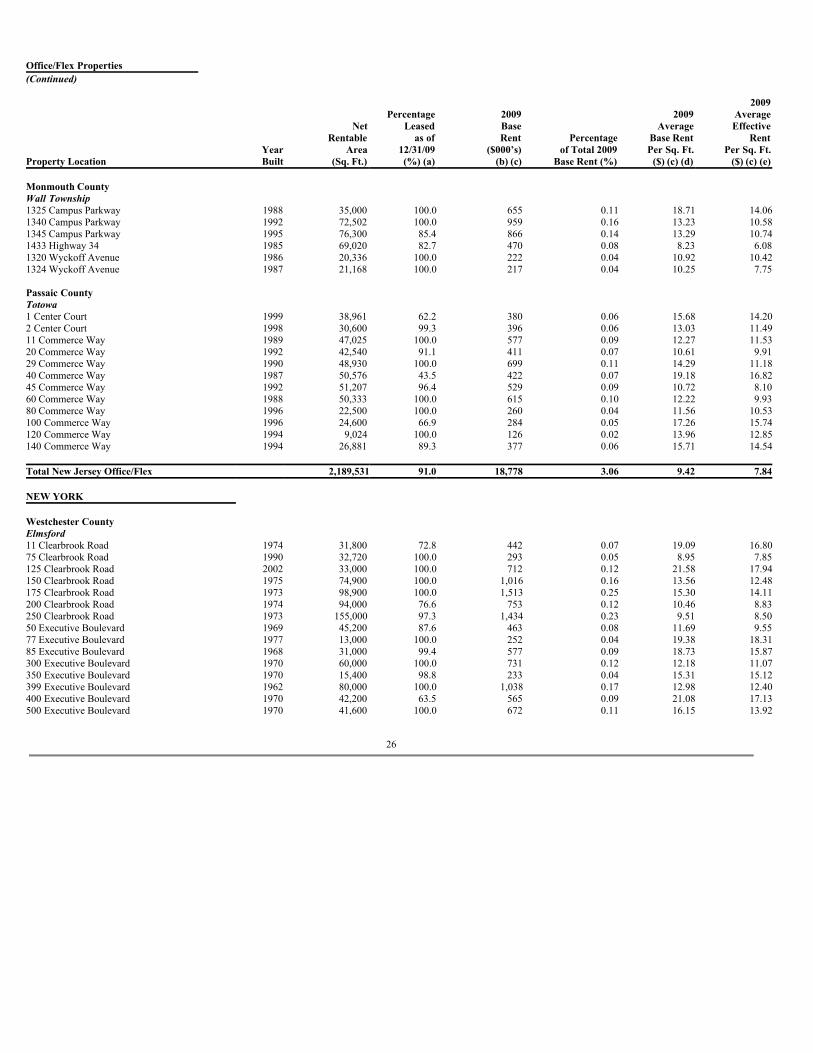
Office/Flex Properties (Continued) 2009 Percentage 2009 2009 Average Net Leased Base Average Effective Rentable as of Rent Percentage Base Rent Rent Year Area 12/31/09 ($000’s) of Total 2009 Per Sq. Ft. Per Sq. Ft.Property Location Built (Sq. Ft.) (%) (a) (b) (c) Base Rent (%) ($) (c) (d) ($) (c) (e) Monmouth County Wall Township 1325 Campus Parkway 1988 35,000 100.0 655 0.11 18.71 14.061340 Campus Parkway 1992 72,502 100.0 959 0.16 13.23 10.581345 Campus Parkway 1995 76,300 85.4 866 0.14 13.29 10.741433 Highway 34 1985 69,020 82.7 470 0.08 8.23 6.081320 Wyckoff Avenue 1986 20,336 100.0 222 0.04 10.92 10.421324 Wyckoff Avenue 1987 21,168 100.0 217 0.04 10.25 7.75 Passaic County Totowa 1 Center Court 1999 38,961 62.2 380 0.06 15.68 14.202 Center Court 1998 30,600 99.3 396 0.06 13.03 11.4911 Commerce Way 1989 47,025 100.0 577 0.09 12.27 11.5320 Commerce Way 1992 42,540 91.1 411 0.07 10.61 9.9129 Commerce Way 1990 48,930 100.0 699 0.11 14.29 11.1840 Commerce Way 1987 50,576 43.5 422 0.07 19.18 16.8245 Commerce Way 1992 51,207 96.4 529 0.09 10.72 8.1060 Commerce Way 1988 50,333 100.0 615 0.10 12.22 9.9380 Commerce Way 1996 22,500 100.0 260 0.04 11.56 10.53100 Commerce Way 1996 24,600 66.9 284 0.05 17.26 15.74120 Commerce Way 1994 9,024 100.0 126 0.02 13.96 12.85140 Commerce Way 1994 26,881 89.3 377 0.06 15.71 14.54 Total New Jersey Office/Flex 2,189,531 91.0 18,778 3.06 9.42 7.84 NEW YORK Westchester County Elmsford 11 Clearbrook Road 1974 31,800 72.8 442 0.07 19.09 16.8075 Clearbrook Road 1990 32,720 100.0 293 0.05 8.95 7.85125 Clearbrook Road 2002 33,000 100.0 712 0.12 21.58 17.94150 Clearbrook Road 1975 74,900 100.0 1,016 0.16 13.56 12.48175 Clearbrook Road 1973 98,900 100.0 1,513 0.25 15.30 14.11200 Clearbrook Road 1974 94,000 76.6 753 0.12 10.46 8.83250 Clearbrook Road 1973 155,000 97.3 1,434 0.23 9.51 8.5050 Executive Boulevard 1969 45,200 87.6 463 0.08 11.69 9.5577 Executive Boulevard 1977 13,000 100.0 252 0.04 19.38 18.3185 Executive Boulevard 1968 31,000 99.4 577 0.09 18.73 15.87300 Executive Boulevard 1970 60,000 100.0 731 0.12 12.18 11.07350 Executive Boulevard 1970 15,400 98.8 233 0.04 15.31 15.12399 Executive Boulevard 1962 80,000 100.0 1,038 0.17 12.98 12.40400 Executive Boulevard 1970 42,200 63.5 565 0.09 21.08 17.13500 Executive Boulevard 1970 41,600 100.0 672 0.11 16.15 13.92
26
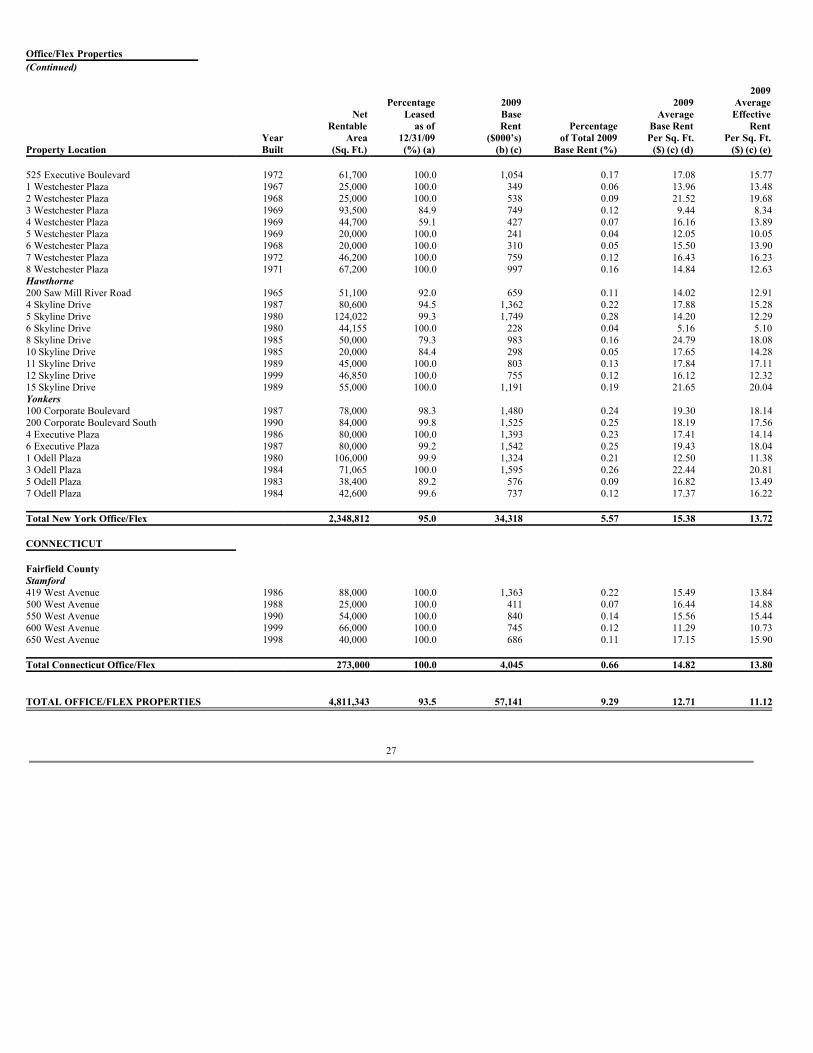
Office/Flex Properties (Continued) 2009 Percentage 2009 2009 Average Net Leased Base Average Effective Rentable as of Rent Percentage Base Rent Rent Year Area 12/31/09 ($000’s) of Total 2009 Per Sq. Ft. Per Sq. Ft.Property Location Built (Sq. Ft.) (%) (a) (b) (c) Base Rent (%) ($) (c) (d) ($) (c) (e) 525 Executive Boulevard 1972 61,700 100.0 1,054 0.17 17.08 15.771 Westchester Plaza 1967 25,000 100.0 349 0.06 13.96 13.482 Westchester Plaza 1968 25,000 100.0 538 0.09 21.52 19.683 Westchester Plaza 1969 93,500 84.9 749 0.12 9.44 8.344 Westchester Plaza 1969 44,700 59.1 427 0.07 16.16 13.895 Westchester Plaza 1969 20,000 100.0 241 0.04 12.05 10.056 Westchester Plaza 1968 20,000 100.0 310 0.05 15.50 13.907 Westchester Plaza 1972 46,200 100.0 759 0.12 16.43 16.238 Westchester Plaza 1971 67,200 100.0 997 0.16 14.84 12.63Hawthorne 200 Saw Mill River Road 1965 51,100 92.0 659 0.11 14.02 12.914 Skyline Drive 1987 80,600 94.5 1,362 0.22 17.88 15.285 Skyline Drive 1980 124,022 99.3 1,749 0.28 14.20 12.296 Skyline Drive 1980 44,155 100.0 228 0.04 5.16 5.108 Skyline Drive 1985 50,000 79.3 983 0.16 24.79 18.0810 Skyline Drive 1985 20,000 84.4 298 0.05 17.65 14.2811 Skyline Drive 1989 45,000 100.0 803 0.13 17.84 17.1112 Skyline Drive 1999 46,850 100.0 755 0.12 16.12 12.3215 Skyline Drive 1989 55,000 100.0 1,191 0.19 21.65 20.04Yonkers 100 Corporate Boulevard 1987 78,000 98.3 1,480 0.24 19.30 18.14200 Corporate Boulevard South 1990 84,000 99.8 1,525 0.25 18.19 17.564 Executive Plaza 1986 80,000 100.0 1,393 0.23 17.41 14.146 Executive Plaza 1987 80,000 99.2 1,542 0.25 19.43 18.041 Odell Plaza 1980 106,000 99.9 1,324 0.21 12.50 11.383 Odell Plaza 1984 71,065 100.0 1,595 0.26 22.44 20.815 Odell Plaza 1983 38,400 89.2 576 0.09 16.82 13.497 Odell Plaza 1984 42,600 99.6 737 0.12 17.37 16.22 Total New York Office/Flex 2,348,812 95.0 34,318 5.57 15.38 13.72 CONNECTICUT Fairfield County Stamford 419 West Avenue 1986 88,000 100.0 1,363 0.22 15.49 13.84500 West Avenue 1988 25,000 100.0 411 0.07 16.44 14.88550 West Avenue 1990 54,000 100.0 840 0.14 15.56 15.44600 West Avenue 1999 66,000 100.0 745 0.12 11.29 10.73650 West Avenue 1998 40,000 100.0 686 0.11 17.15 15.90 Total Connecticut Office/Flex 273,000 100.0 4,045 0.66 14.82 13.80 TOTAL OFFICE/FLEX PROPERTIES 4,811,343 93.5 57,141 9.29 12.71 11.12
27
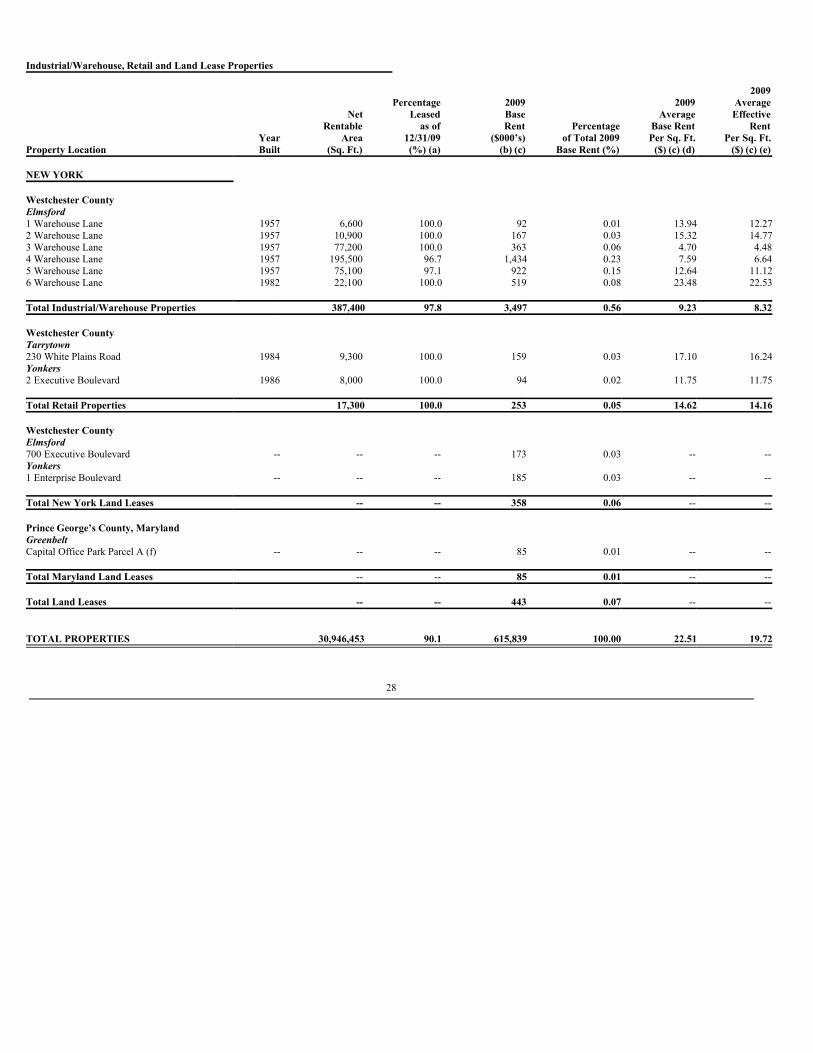
Industrial/Warehouse, Retail and Land Lease Properties 2009 Percentage 2009 2009 Average Net Leased Base Average Effective Rentable as of Rent Percentage Base Rent Rent Year Area 12/31/09 ($000’s) of Total 2009 Per Sq. Ft. Per Sq. Ft.Property Location Built (Sq. Ft.) (%) (a) (b) (c) Base Rent (%) ($) (c) (d) ($) (c) (e) NEW YORK Westchester County Elmsford 1 Warehouse Lane 1957 6,600 100.0 92 0.01 13.94 12.272 Warehouse Lane 1957 10,900 100.0 167 0.03 15.32 14.773 Warehouse Lane 1957 77,200 100.0 363 0.06 4.70 4.484 Warehouse Lane 1957 195,500 96.7 1,434 0.23 7.59 6.645 Warehouse Lane 1957 75,100 97.1 922 0.15 12.64 11.126 Warehouse Lane 1982 22,100 100.0 519 0.08 23.48 22.53 Total Industrial/Warehouse Properties 387,400 97.8 3,497 0.56 9.23 8.32 Westchester County Tarrytown 230 White Plains Road 1984 9,300 100.0 159 0.03 17.10 16.24Yonkers 2 Executive Boulevard 1986 8,000 100.0 94 0.02 11.75 11.75 Total Retail Properties 17,300 100.0 253 0.05 14.62 14.16 Westchester County Elmsford 700 Executive Boulevard -- -- -- 173 0.03 -- --Yonkers 1 Enterprise Boulevard -- -- -- 185 0.03 -- -- Total New York Land Leases -- -- 358 0.06 -- -- Prince George’s County, Maryland Greenbelt Capital Office Park Parcel A (f) -- -- -- 85 0.01 -- -- Total Maryland Land Leases -- -- 85 0.01 -- -- Total Land Leases -- -- 443 0.07 -- -- TOTAL PROPERTIES 30,946,453 90.1 615,839 100.00 22.51 19.72
28
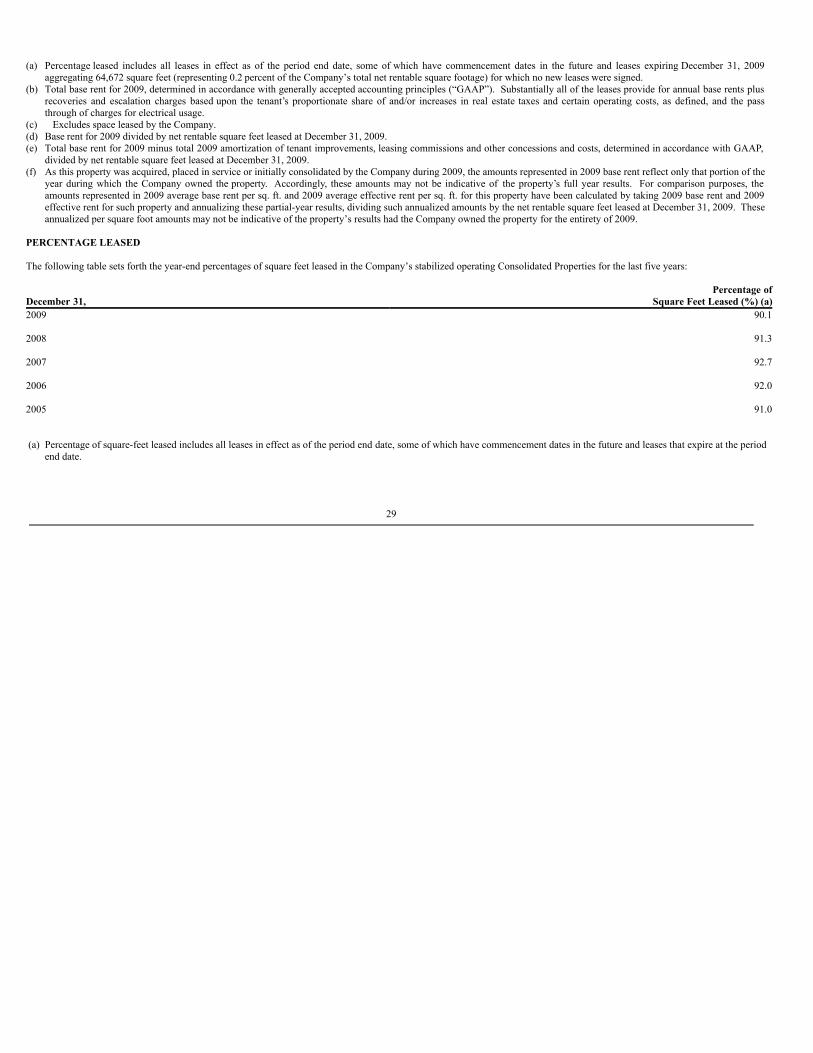
(a) Percentage leased includes all leases in effect as of the period end date, some of which have commencement dates in the future and leases expiring December 31, 2009aggregating 64,672 square feet (representing 0.2 percent of the Company’s total net rentable square footage) for which no new leases were signed.
(b) Total base rent for 2009, determined in accordance with generally accepted accounting principles (“GAAP”). Substantially all of the leases provide for annual base rents plusrecoveries and escalation charges based upon the tenant’s proportionate share of and/or increases in real estate taxes and certain operating costs, as defined, and the passthrough of charges for electrical usage.
(c) Excludes space leased by the Company.(d) Base rent for 2009 divided by net rentable square feet leased at December 31, 2009.(e) Total base rent for 2009 minus total 2009 amortization of tenant improvements, leasing commissions and other concessions and costs, determined in accordance with GAAP,
divided by net rentable square feet leased at December 31, 2009.(f) As this property was acquired, placed in service or initially consolidated by the Company during 2009, the amounts represented in 2009 base rent reflect only that portion of the
year during which the Company owned the property. Accordingly, these amounts may not be indicative of the property’s full year results. For comparison purposes, theamounts represented in 2009 average base rent per sq. ft. and 2009 average effective rent per sq. ft. for this property have been calculated by taking 2009 base rent and 2009effective rent for such property and annualizing these partial-year results, dividing such annualized amounts by the net rentable square feet leased at December 31, 2009. Theseannualized per square foot amounts may not be indicative of the property’s results had the Company owned the property for the entirety of 2009.
PERCENTAGE LEASED
The following table sets forth the year-end percentages of square feet leased in the Company’s stabilized operating Consolidated Properties for the last five years:
Percentage ofDecember 31, Square Feet Leased (%) (a)2009 90.1 2008 91.3 2007 92.7 2006 92.0 2005 91.0
(a) Percentage of square-feet leased includes all leases in effect as of the period end date, some of which have commencement dates in the future and leases that expire at the periodend date.
29
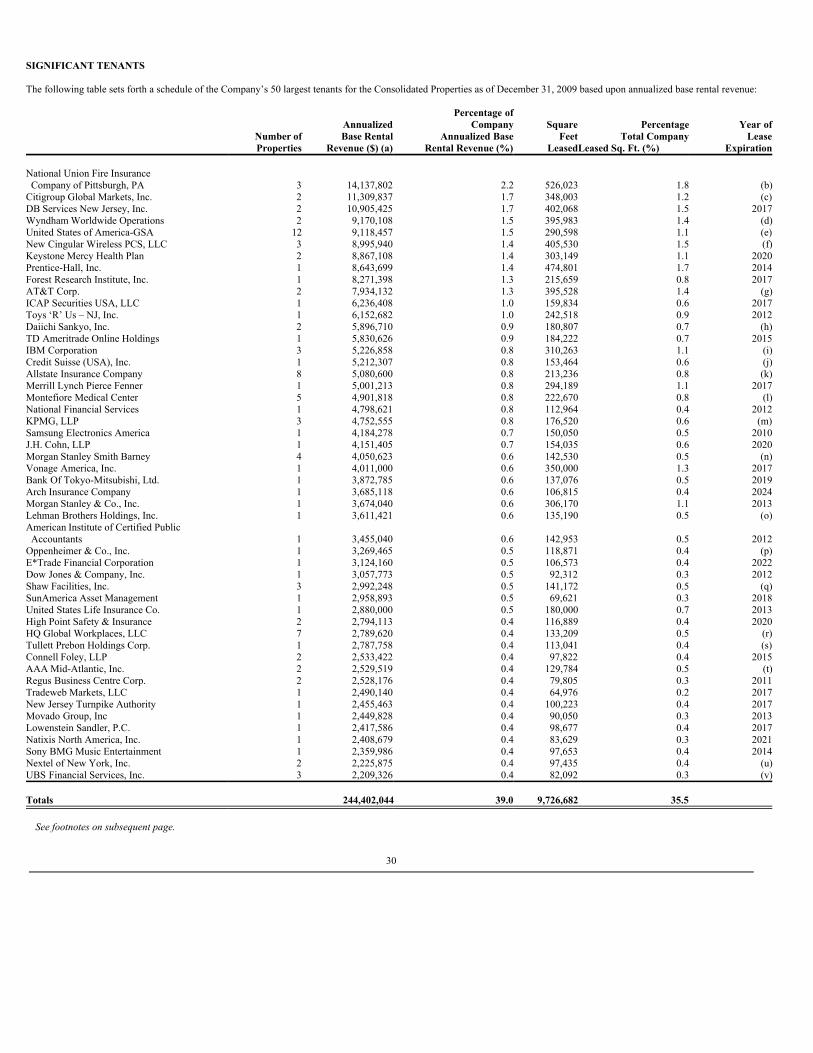
SIGNIFICANT TENANTS
The following table sets forth a schedule of the Company’s 50 largest tenants for the Consolidated Properties as of December 31, 2009 based upon annualized base rental revenue:
Percentage of Annualized Company Square Percentage Year of Number of Base Rental Annualized Base Feet Total Company Lease Properties Revenue ($) (a) Rental Revenue (%) LeasedLeased Sq. Ft. (%) Expiration National Union Fire Insurance Company of Pittsburgh, PA 3 14,137,802 2.2 526,023 1.8 (b)Citigroup Global Markets, Inc. 2 11,309,837 1.7 348,003 1.2 (c)DB Services New Jersey, Inc. 2 10,905,425 1.7 402,068 1.5 2017Wyndham Worldwide Operations 2 9,170,108 1.5 395,983 1.4 (d)United States of America-GSA 12 9,118,457 1.5 290,598 1.1 (e)New Cingular Wireless PCS, LLC 3 8,995,940 1.4 405,530 1.5 (f)Keystone Mercy Health Plan 2 8,867,108 1.4 303,149 1.1 2020Prentice-Hall, Inc. 1 8,643,699 1.4 474,801 1.7 2014Forest Research Institute, Inc. 1 8,271,398 1.3 215,659 0.8 2017AT&T Corp. 2 7,934,132 1.3 395,528 1.4 (g)ICAP Securities USA, LLC 1 6,236,408 1.0 159,834 0.6 2017Toys ‘R’ Us – NJ, Inc. 1 6,152,682 1.0 242,518 0.9 2012Daiichi Sankyo, Inc. 2 5,896,710 0.9 180,807 0.7 (h)TD Ameritrade Online Holdings 1 5,830,626 0.9 184,222 0.7 2015IBM Corporation 3 5,226,858 0.8 310,263 1.1 (i)Credit Suisse (USA), Inc. 1 5,212,307 0.8 153,464 0.6 (j)Allstate Insurance Company 8 5,080,600 0.8 213,236 0.8 (k)Merrill Lynch Pierce Fenner 1 5,001,213 0.8 294,189 1.1 2017Montefiore Medical Center 5 4,901,818 0.8 222,670 0.8 (l)National Financial Services 1 4,798,621 0.8 112,964 0.4 2012KPMG, LLP 3 4,752,555 0.8 176,520 0.6 (m)Samsung Electronics America 1 4,184,278 0.7 150,050 0.5 2010J.H. Cohn, LLP 1 4,151,405 0.7 154,035 0.6 2020Morgan Stanley Smith Barney 4 4,050,623 0.6 142,530 0.5 (n)Vonage America, Inc. 1 4,011,000 0.6 350,000 1.3 2017Bank Of Tokyo-Mitsubishi, Ltd. 1 3,872,785 0.6 137,076 0.5 2019Arch Insurance Company 1 3,685,118 0.6 106,815 0.4 2024Morgan Stanley & Co., Inc. 1 3,674,040 0.6 306,170 1.1 2013Lehman Brothers Holdings, Inc. 1 3,611,421 0.6 135,190 0.5 (o)American Institute of Certified Public Accountants 1 3,455,040 0.6 142,953 0.5 2012Oppenheimer & Co., Inc. 1 3,269,465 0.5 118,871 0.4 (p)E*Trade Financial Corporation 1 3,124,160 0.5 106,573 0.4 2022Dow Jones & Company, Inc. 1 3,057,773 0.5 92,312 0.3 2012Shaw Facilities, Inc. 3 2,992,248 0.5 141,172 0.5 (q)SunAmerica Asset Management 1 2,958,893 0.5 69,621 0.3 2018United States Life Insurance Co. 1 2,880,000 0.5 180,000 0.7 2013High Point Safety & Insurance 2 2,794,113 0.4 116,889 0.4 2020HQ Global Workplaces, LLC 7 2,789,620 0.4 133,209 0.5 (r)Tullett Prebon Holdings Corp. 1 2,787,758 0.4 113,041 0.4 (s)Connell Foley, LLP 2 2,533,422 0.4 97,822 0.4 2015AAA Mid-Atlantic, Inc. 2 2,529,519 0.4 129,784 0.5 (t)Regus Business Centre Corp. 2 2,528,176 0.4 79,805 0.3 2011Tradeweb Markets, LLC 1 2,490,140 0.4 64,976 0.2 2017New Jersey Turnpike Authority 1 2,455,463 0.4 100,223 0.4 2017Movado Group, Inc 1 2,449,828 0.4 90,050 0.3 2013Lowenstein Sandler, P.C. 1 2,417,586 0.4 98,677 0.4 2017Natixis North America, Inc. 1 2,408,679 0.4 83,629 0.3 2021Sony BMG Music Entertainment 1 2,359,986 0.4 97,653 0.4 2014Nextel of New York, Inc. 2 2,225,875 0.4 97,435 0.4 (u)UBS Financial Services, Inc. 3 2,209,326 0.4 82,092 0.3 (v) Totals 244,402,044 39.0 9,726,682 35.5
See footnotes on subsequent page.
30
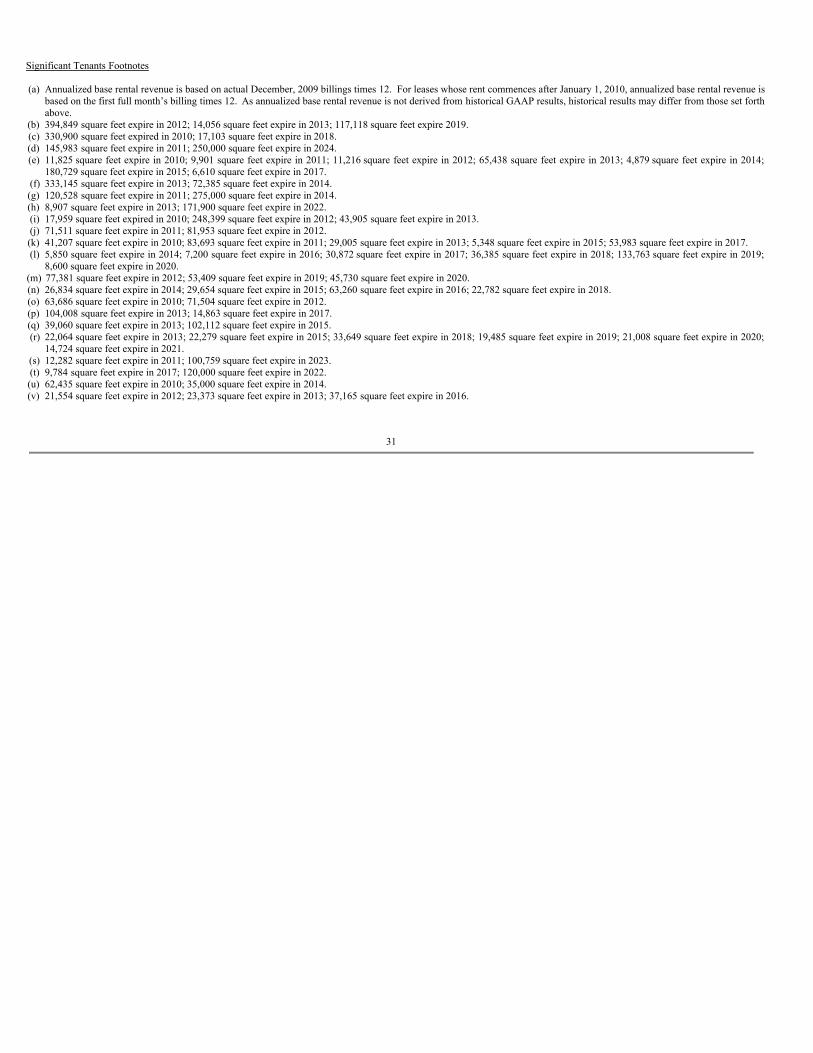
Significant Tenants Footnotes
(a) Annualized base rental revenue is based on actual December, 2009 billings times 12. For leases whose rent commences after January 1, 2010, annualized base rental revenue isbased on the first full month’s billing times 12. As annualized base rental revenue is not derived from historical GAAP results, historical results may differ from those set forthabove.
(b) 394,849 square feet expire in 2012; 14,056 square feet expire in 2013; 117,118 square feet expire 2019.(c) 330,900 square feet expired in 2010; 17,103 square feet expire in 2018.(d) 145,983 square feet expire in 2011; 250,000 square feet expire in 2024.(e) 11,825 square feet expire in 2010; 9,901 square feet expire in 2011; 11,216 square feet expire in 2012; 65,438 square feet expire in 2013; 4,879 square feet expire in 2014;
180,729 square feet expire in 2015; 6,610 square feet expire in 2017.(f) 333,145 square feet expire in 2013; 72,385 square feet expire in 2014.(g) 120,528 square feet expire in 2011; 275,000 square feet expire in 2014.(h) 8,907 square feet expire in 2013; 171,900 square feet expire in 2022.(i) 17,959 square feet expired in 2010; 248,399 square feet expire in 2012; 43,905 square feet expire in 2013.(j) 71,511 square feet expire in 2011; 81,953 square feet expire in 2012.(k) 41,207 square feet expire in 2010; 83,693 square feet expire in 2011; 29,005 square feet expire in 2013; 5,348 square feet expire in 2015; 53,983 square feet expire in 2017.(l) 5,850 square feet expire in 2014; 7,200 square feet expire in 2016; 30,872 square feet expire in 2017; 36,385 square feet expire in 2018; 133,763 square feet expire in 2019;
8,600 square feet expire in 2020.(m) 77,381 square feet expire in 2012; 53,409 square feet expire in 2019; 45,730 square feet expire in 2020.(n) 26,834 square feet expire in 2014; 29,654 square feet expire in 2015; 63,260 square feet expire in 2016; 22,782 square feet expire in 2018.(o) 63,686 square feet expire in 2010; 71,504 square feet expire in 2012.(p) 104,008 square feet expire in 2013; 14,863 square feet expire in 2017.(q) 39,060 square feet expire in 2013; 102,112 square feet expire in 2015.(r) 22,064 square feet expire in 2013; 22,279 square feet expire in 2015; 33,649 square feet expire in 2018; 19,485 square feet expire in 2019; 21,008 square feet expire in 2020;
14,724 square feet expire in 2021.(s) 12,282 square feet expire in 2011; 100,759 square feet expire in 2023.(t) 9,784 square feet expire in 2017; 120,000 square feet expire in 2022.(u) 62,435 square feet expire in 2010; 35,000 square feet expire in 2014.(v) 21,554 square feet expire in 2012; 23,373 square feet expire in 2013; 37,165 square feet expire in 2016.
31
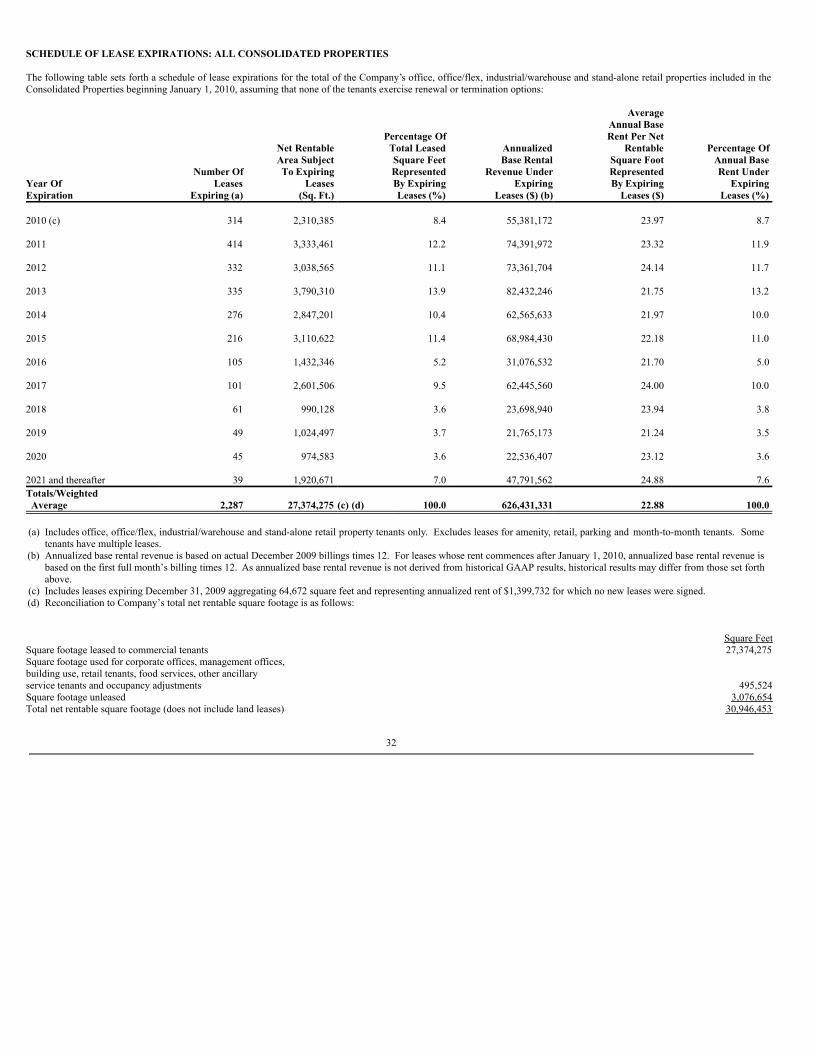
SCHEDULE OF LEASE EXPIRATIONS: ALL CONSOLIDATED PROPERTIES
The following table sets forth a schedule of lease expirations for the total of the Company’s office, office/flex, industrial/warehouse and stand-alone retail properties included in theConsolidated Properties beginning January 1, 2010, assuming that none of the tenants exercise renewal or termination options:
Average Annual Base Percentage Of Rent Per Net Net Rentable Total Leased Annualized Rentable Percentage Of Area Subject Square Feet Base Rental Square Foot Annual Base Number Of To Expiring Represented Revenue Under Represented Rent UnderYear Of Leases Leases By Expiring Expiring By Expiring ExpiringExpiration Expiring (a) (Sq. Ft.) Leases (%) Leases ($) (b) Leases ($) Leases (%) 2010 (c) 314 2,310,385 8.4 55,381,172 23.97 8.7 2011 414 3,333,461 12.2 74,391,972 23.32 11.9 2012 332 3,038,565 11.1 73,361,704 24.14 11.7 2013 335 3,790,310 13.9 82,432,246 21.75 13.2 2014 276 2,847,201 10.4 62,565,633 21.97 10.0 2015 216 3,110,622 11.4 68,984,430 22.18 11.0 2016 105 1,432,346 5.2 31,076,532 21.70 5.0 2017 101 2,601,506 9.5 62,445,560 24.00 10.0 2018 61 990,128 3.6 23,698,940 23.94 3.8 2019 49 1,024,497 3.7 21,765,173 21.24 3.5 2020 45 974,583 3.6 22,536,407 23.12 3.6 2021 and thereafter 39 1,920,671 7.0 47,791,562 24.88 7.6Totals/Weighted Average 2,287 27,374,275 (c) (d) 100.0 626,431,331 22.88 100.0
(a) Includes office, office/flex, industrial/warehouse and stand-alone retail property tenants only. Excludes leases for amenity, retail, parking and month-to-month tenants. Sometenants have multiple leases.
(b) Annualized base rental revenue is based on actual December 2009 billings times 12. For leases whose rent commences after January 1, 2010, annualized base rental revenue isbased on the first full month’s billing times 12. As annualized base rental revenue is not derived from historical GAAP results, historical results may differ from those set forthabove.
(c) Includes leases expiring December 31, 2009 aggregating 64,672 square feet and representing annualized rent of $1,399,732 for which no new leases were signed.(d) Reconciliation to Company’s total net rentable square footage is as follows:
Square FeetSquare footage leased to commercial tenants 27,374,275Square footage used for corporate offices, management offices, building use, retail tenants, food services, other ancillary service tenants and occupancy adjustments 495,524Square footage unleased 3,076,654Total net rentable square footage (does not include land leases) 30,946,453
32
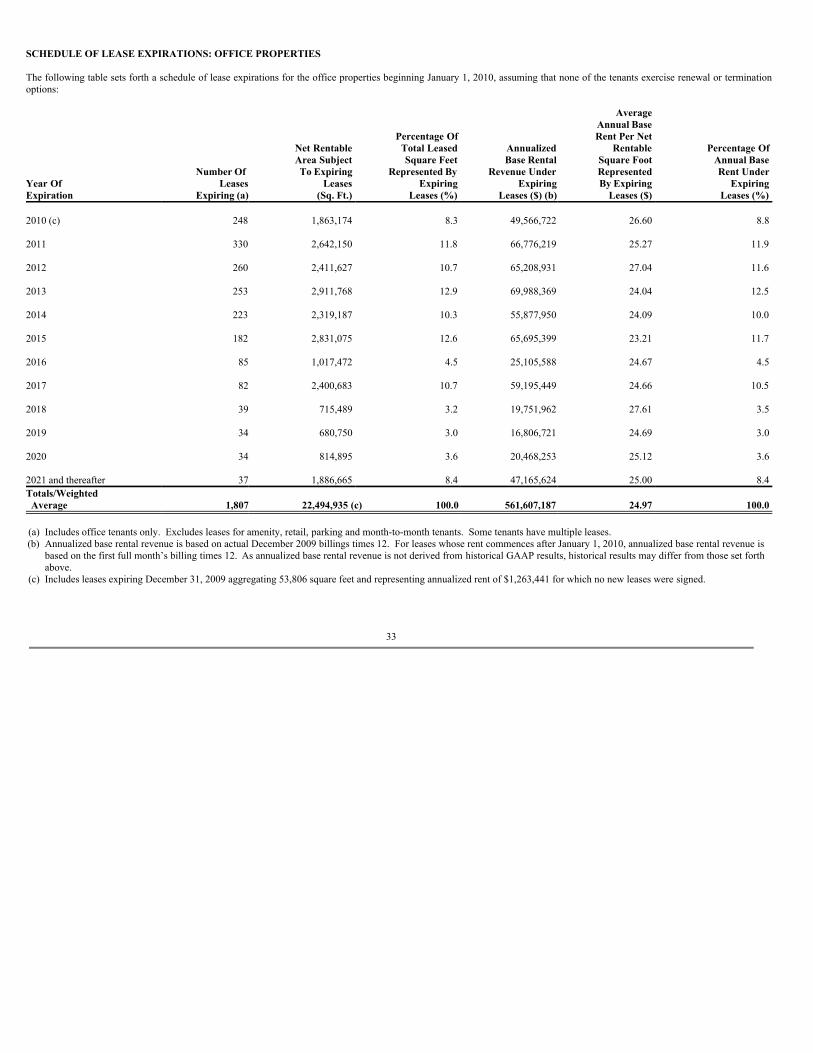
SCHEDULE OF LEASE EXPIRATIONS: OFFICE PROPERTIES
The following table sets forth a schedule of lease expirations for the office properties beginning January 1, 2010, assuming that none of the tenants exercise renewal or terminationoptions:
Average Annual Base Percentage Of Rent Per Net Net Rentable Total Leased Annualized Rentable Percentage Of Area Subject Square Feet Base Rental Square Foot Annual Base Number Of To Expiring Represented By Revenue Under Represented Rent UnderYear Of Leases Leases Expiring Expiring By Expiring ExpiringExpiration Expiring (a) (Sq. Ft.) Leases (%) Leases ($) (b) Leases ($) Leases (%) 2010 (c) 248 1,863,174 8.3 49,566,722 26.60 8.8 2011 330 2,642,150 11.8 66,776,219 25.27 11.9 2012 260 2,411,627 10.7 65,208,931 27.04 11.6 2013 253 2,911,768 12.9 69,988,369 24.04 12.5 2014 223 2,319,187 10.3 55,877,950 24.09 10.0 2015 182 2,831,075 12.6 65,695,399 23.21 11.7 2016 85 1,017,472 4.5 25,105,588 24.67 4.5 2017 82 2,400,683 10.7 59,195,449 24.66 10.5 2018 39 715,489 3.2 19,751,962 27.61 3.5 2019 34 680,750 3.0 16,806,721 24.69 3.0 2020 34 814,895 3.6 20,468,253 25.12 3.6 2021 and thereafter 37 1,886,665 8.4 47,165,624 25.00 8.4Totals/Weighted Average 1,807 22,494,935 (c) 100.0 561,607,187 24.97 100.0
(a) Includes office tenants only. Excludes leases for amenity, retail, parking and month-to-month tenants. Some tenants have multiple leases.(b) Annualized base rental revenue is based on actual December 2009 billings times 12. For leases whose rent commences after January 1, 2010, annualized base rental revenue is
based on the first full month’s billing times 12. As annualized base rental revenue is not derived from historical GAAP results, historical results may differ from those set forthabove.
(c) Includes leases expiring December 31, 2009 aggregating 53,806 square feet and representing annualized rent of $1,263,441 for which no new leases were signed.
33
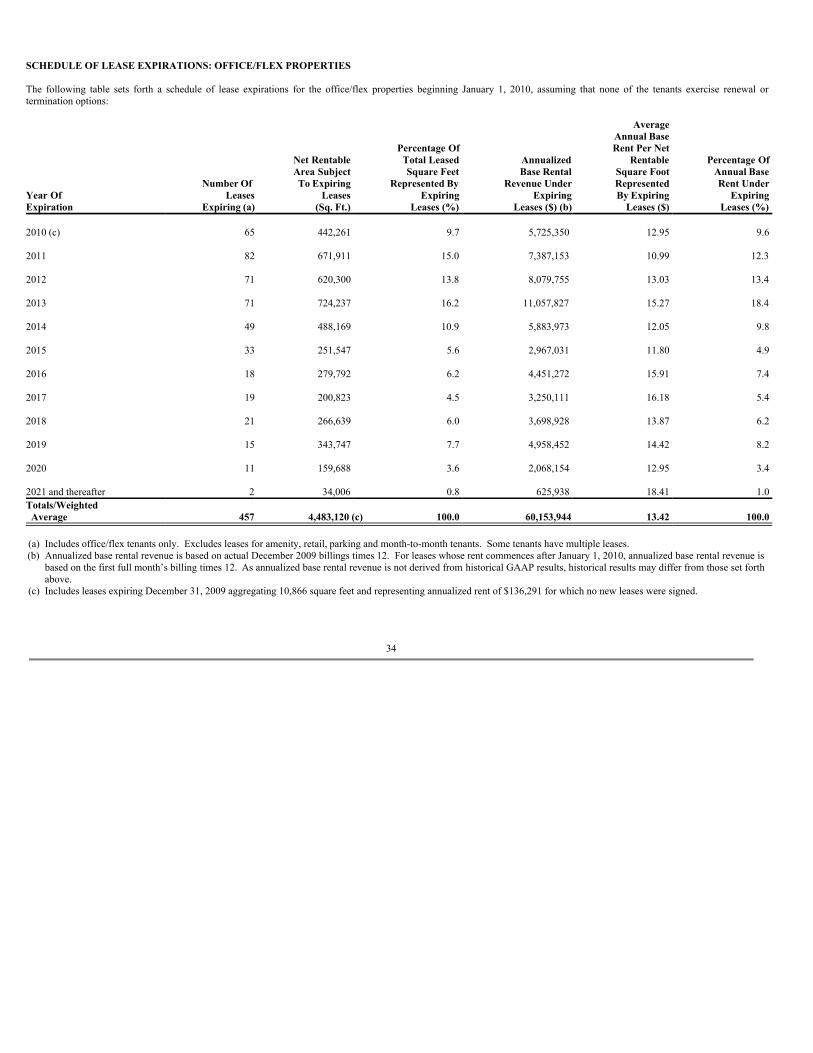
SCHEDULE OF LEASE EXPIRATIONS: OFFICE/FLEX PROPERTIES
The following table sets forth a schedule of lease expirations for the office/flex properties beginning January 1, 2010, assuming that none of the tenants exercise renewal ortermination options:
Average Annual Base Percentage Of Rent Per Net Net Rentable Total Leased Annualized Rentable Percentage Of Area Subject Square Feet Base Rental Square Foot Annual Base Number Of To Expiring Represented By Revenue Under Represented Rent UnderYear Of Leases Leases Expiring Expiring By Expiring ExpiringExpiration Expiring (a) (Sq. Ft.) Leases (%) Leases ($) (b) Leases ($) Leases (%) 2010 (c) 65 442,261 9.7 5,725,350 12.95 9.6 2011 82 671,911 15.0 7,387,153 10.99 12.3 2012 71 620,300 13.8 8,079,755 13.03 13.4 2013 71 724,237 16.2 11,057,827 15.27 18.4 2014 49 488,169 10.9 5,883,973 12.05 9.8 2015 33 251,547 5.6 2,967,031 11.80 4.9 2016 18 279,792 6.2 4,451,272 15.91 7.4 2017 19 200,823 4.5 3,250,111 16.18 5.4 2018 21 266,639 6.0 3,698,928 13.87 6.2 2019 15 343,747 7.7 4,958,452 14.42 8.2 2020 11 159,688 3.6 2,068,154 12.95 3.4 2021 and thereafter 2 34,006 0.8 625,938 18.41 1.0Totals/Weighted Average 457 4,483,120 (c) 100.0 60,153,944 13.42 100.0
(a) Includes office/flex tenants only. Excludes leases for amenity, retail, parking and month-to-month tenants. Some tenants have multiple leases.(b) Annualized base rental revenue is based on actual December 2009 billings times 12. For leases whose rent commences after January 1, 2010, annualized base rental revenue is
based on the first full month’s billing times 12. As annualized base rental revenue is not derived from historical GAAP results, historical results may differ from those set forthabove.
(c) Includes leases expiring December 31, 2009 aggregating 10,866 square feet and representing annualized rent of $136,291 for which no new leases were signed.
34
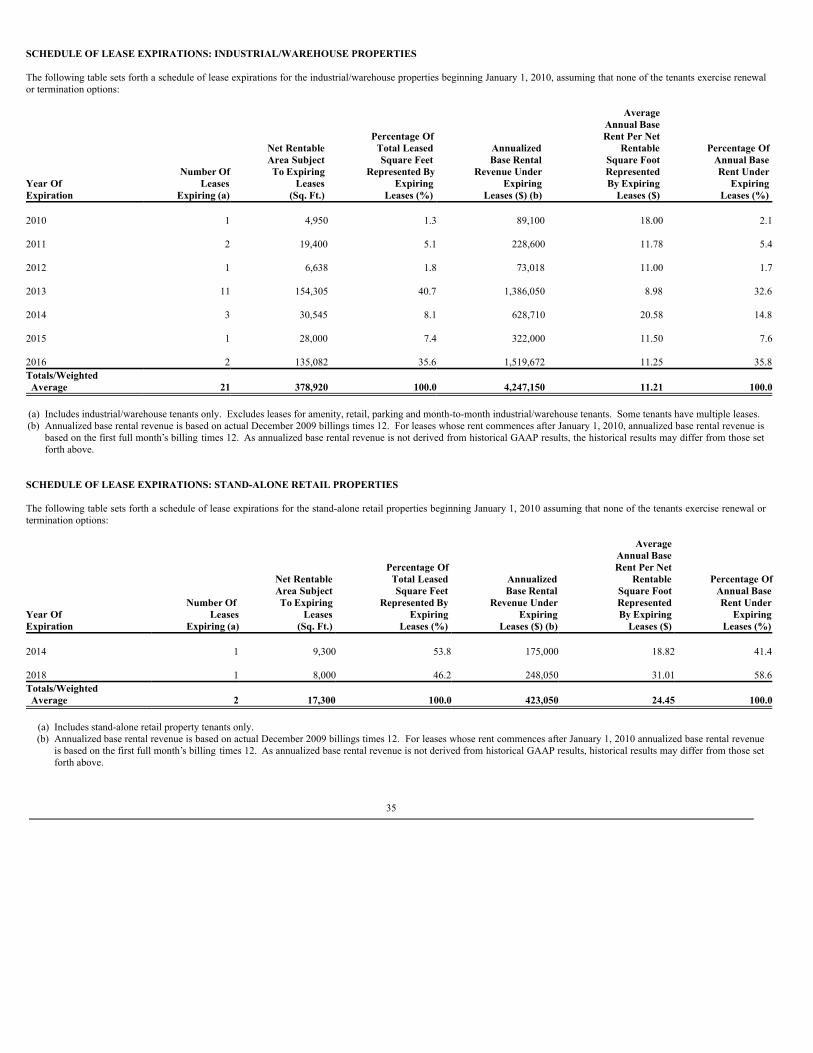
SCHEDULE OF LEASE EXPIRATIONS: INDUSTRIAL/WAREHOUSE PROPERTIES
The following table sets forth a schedule of lease expirations for the industrial/warehouse properties beginning January 1, 2010, assuming that none of the tenants exercise renewalor termination options:
Average Annual Base Percentage Of Rent Per Net Net Rentable Total Leased Annualized Rentable Percentage Of Area Subject Square Feet Base Rental Square Foot Annual Base Number Of To Expiring Represented By Revenue Under Represented Rent UnderYear Of Leases Leases Expiring Expiring By Expiring ExpiringExpiration Expiring (a) (Sq. Ft.) Leases (%) Leases ($) (b) Leases ($) Leases (%) 2010 1 4,950 1.3 89,100 18.00 2.1 2011 2 19,400 5.1 228,600 11.78 5.4 2012 1 6,638 1.8 73,018 11.00 1.7 2013 11 154,305 40.7 1,386,050 8.98 32.6 2014 3 30,545 8.1 628,710 20.58 14.8 2015 1 28,000 7.4 322,000 11.50 7.6 2016 2 135,082 35.6 1,519,672 11.25 35.8Totals/Weighted Average 21 378,920 100.0 4,247,150 11.21 100.0
(a) Includes industrial/warehouse tenants only. Excludes leases for amenity, retail, parking and month-to-month industrial/warehouse tenants. Some tenants have multiple leases.(b) Annualized base rental revenue is based on actual December 2009 billings times 12. For leases whose rent commences after January 1, 2010, annualized base rental revenue is
based on the first full month’s billing times 12. As annualized base rental revenue is not derived from historical GAAP results, the historical results may differ from those setforth above.
SCHEDULE OF LEASE EXPIRATIONS: STAND-ALONE RETAIL PROPERTIES
The following table sets forth a schedule of lease expirations for the stand-alone retail properties beginning January 1, 2010 assuming that none of the tenants exercise renewal ortermination options:
Average Annual Base Percentage Of Rent Per Net Net Rentable Total Leased Annualized Rentable Percentage Of Area Subject Square Feet Base Rental Square Foot Annual Base Number Of To Expiring Represented By Revenue Under Represented Rent UnderYear Of Leases Leases Expiring Expiring By Expiring ExpiringExpiration Expiring (a) (Sq. Ft.) Leases (%) Leases ($) (b) Leases ($) Leases (%) 2014 1 9,300 53.8 175,000 18.82 41.4 2018 1 8,000 46.2 248,050 31.01 58.6Totals/Weighted Average 2 17,300 100.0 423,050 24.45 100.0
(a) Includes stand-alone retail property tenants only.(b) Annualized base rental revenue is based on actual December 2009 billings times 12. For leases whose rent commences after January 1, 2010 annualized base rental revenue
is based on the first full month’s billing times 12. As annualized base rental revenue is not derived from historical GAAP results, historical results may differ from those setforth above.
35
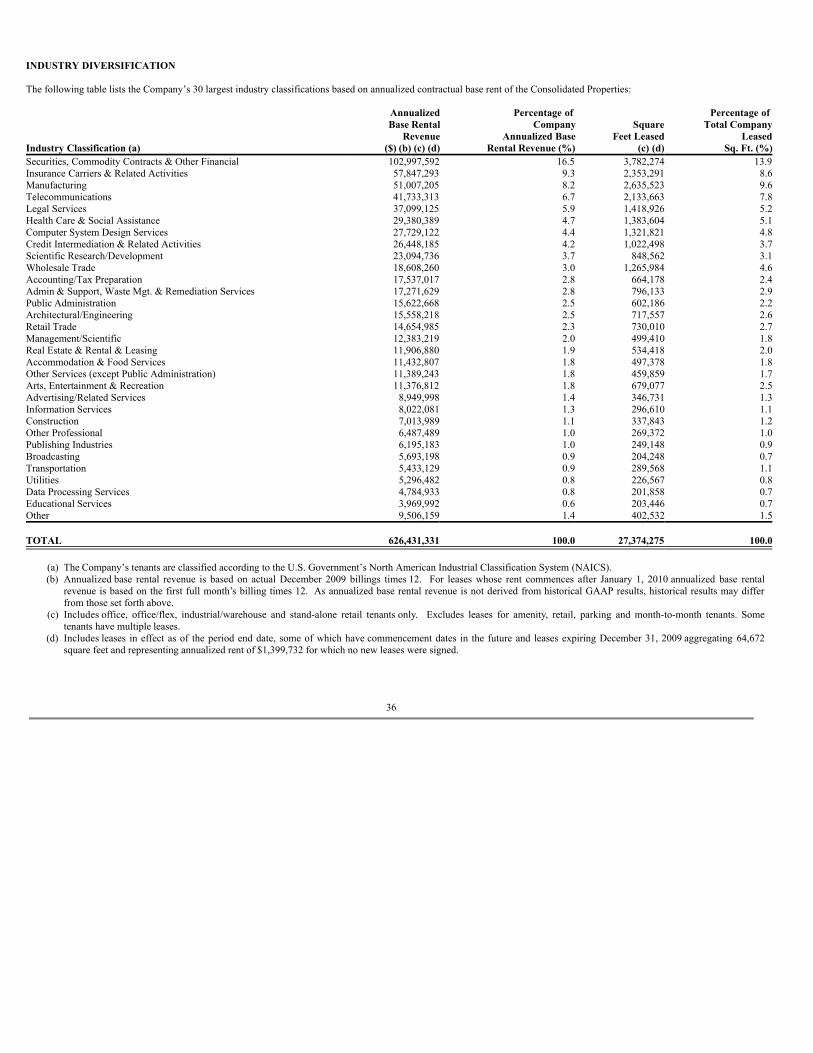
INDUSTRY DIVERSIFICATION
The following table lists the Company’s 30 largest industry classifications based on annualized contractual base rent of the Consolidated Properties:
Industry Classification (a)
AnnualizedBase Rental
Revenue($) (b) (c) (d)
Percentage of Company
Annualized BaseRental Revenue (%)
SquareFeet Leased
(c) (d)
Percentage of Total Company
LeasedSq. Ft. (%)
Securities, Commodity Contracts & Other Financial 102,997,592 16.5 3,782,274 13.9Insurance Carriers & Related Activities 57,847,293 9.3 2,353,291 8.6Manufacturing 51,007,205 8.2 2,635,523 9.6Telecommunications 41,733,313 6.7 2,133,663 7.8Legal Services 37,099,125 5.9 1,418,926 5.2Health Care & Social Assistance 29,380,389 4.7 1,383,604 5.1Computer System Design Services 27,729,122 4.4 1,321,821 4.8Credit Intermediation & Related Activities 26,448,185 4.2 1,022,498 3.7Scientific Research/Development 23,094,736 3.7 848,562 3.1Wholesale Trade 18,608,260 3.0 1,265,984 4.6Accounting/Tax Preparation 17,537,017 2.8 664,178 2.4Admin & Support, Waste Mgt. & Remediation Services 17,271,629 2.8 796,133 2.9Public Administration 15,622,668 2.5 602,186 2.2Architectural/Engineering 15,558,218 2.5 717,557 2.6Retail Trade 14,654,985 2.3 730,010 2.7Management/Scientific 12,383,219 2.0 499,410 1.8Real Estate & Rental & Leasing 11,906,880 1.9 534,418 2.0Accommodation & Food Services 11,432,807 1.8 497,378 1.8Other Services (except Public Administration) 11,389,243 1.8 459,859 1.7Arts, Entertainment & Recreation 11,376,812 1.8 679,077 2.5Advertising/Related Services 8,949,998 1.4 346,731 1.3Information Services 8,022,081 1.3 296,610 1.1Construction 7,013,989 1.1 337,843 1.2Other Professional 6,487,489 1.0 269,372 1.0Publishing Industries 6,195,183 1.0 249,148 0.9Broadcasting 5,693,198 0.9 204,248 0.7Transportation 5,433,129 0.9 289,568 1.1Utilities 5,296,482 0.8 226,567 0.8Data Processing Services 4,784,933 0.8 201,858 0.7Educational Services 3,969,992 0.6 203,446 0.7Other 9,506,159 1.4 402,532 1.5 TOTAL 626,431,331 100.0 27,374,275 100.0
(a) The Company’s tenants are classified according to the U.S. Government’s North American Industrial Classification System (NAICS).(b) Annualized base rental revenue is based on actual December 2009 billings times 12. For leases whose rent commences after January 1, 2010 annualized base rental
revenue is based on the first full month’s billing times 12. As annualized base rental revenue is not derived from historical GAAP results, historical results may differfrom those set forth above.
(c) Includes office, office/flex, industrial/warehouse and stand-alone retail tenants only. Excludes leases for amenity, retail, parking and month-to-month tenants. Sometenants have multiple leases.
(d) Includes leases in effect as of the period end date, some of which have commencement dates in the future and leases expiring December 31, 2009 aggregating 64,672square feet and representing annualized rent of $1,399,732 for which no new leases were signed.
36
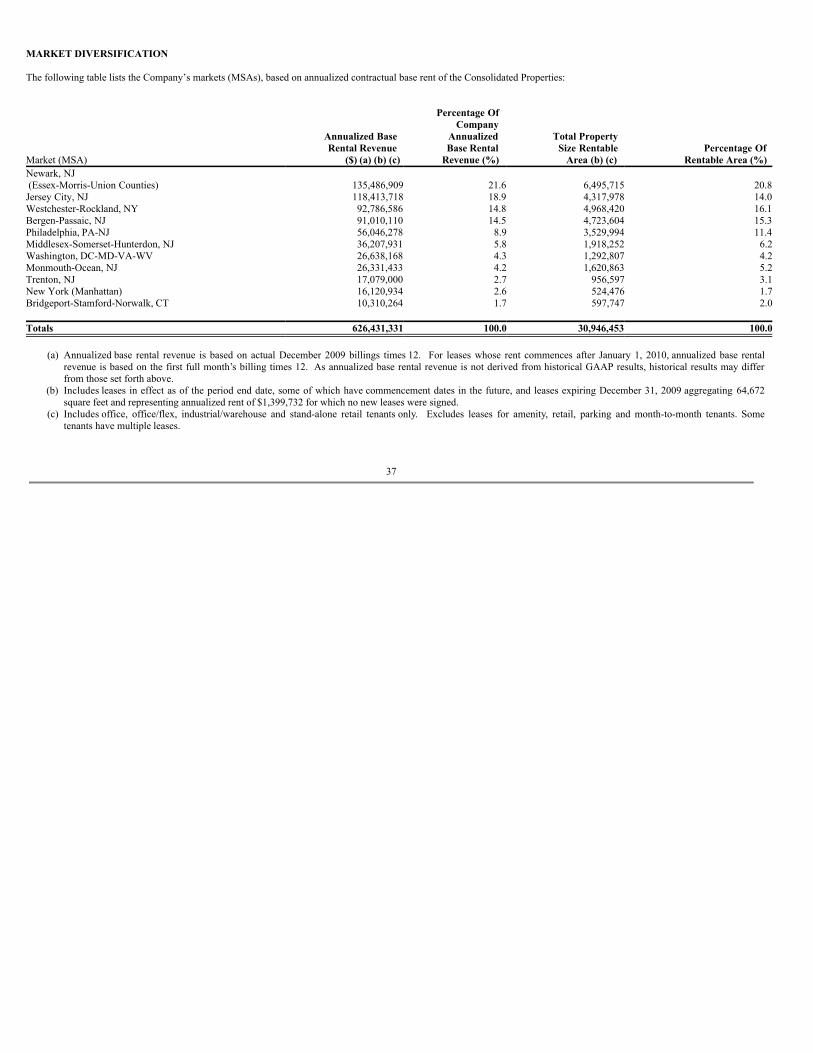
MARKET DIVERSIFICATION
The following table lists the Company’s markets (MSAs), based on annualized contractual base rent of the Consolidated Properties:
Percentage Of Company Annualized Base Annualized Total Property Rental Revenue Base Rental Size Rentable Percentage OfMarket (MSA) ($) (a) (b) (c) Revenue (%) Area (b) (c) Rentable Area (%) Newark, NJ (Essex-Morris-Union Counties) 135,486,909 21.6 6,495,715 20.8Jersey City, NJ 118,413,718 18.9 4,317,978 14.0Westchester-Rockland, NY 92,786,586 14.8 4,968,420 16.1Bergen-Passaic, NJ 91,010,110 14.5 4,723,604 15.3Philadelphia, PA-NJ 56,046,278 8.9 3,529,994 11.4Middlesex-Somerset-Hunterdon, NJ 36,207,931 5.8 1,918,252 6.2Washington, DC-MD-VA-WV 26,638,168 4.3 1,292,807 4.2Monmouth-Ocean, NJ 26,331,433 4.2 1,620,863 5.2Trenton, NJ 17,079,000 2.7 956,597 3.1New York (Manhattan) 16,120,934 2.6 524,476 1.7Bridgeport-Stamford-Norwalk, CT 10,310,264 1.7 597,747 2.0 Totals 626,431,331 100.0 30,946,453 100.0
(a) Annualized base rental revenue is based on actual December 2009 billings times 12. For leases whose rent commences after January 1, 2010, annualized base rentalrevenue is based on the first full month’s billing times 12. As annualized base rental revenue is not derived from historical GAAP results, historical results may differfrom those set forth above.
(b) Includes leases in effect as of the period end date, some of which have commencement dates in the future, and leases expiring December 31, 2009 aggregating 64,672square feet and representing annualized rent of $1,399,732 for which no new leases were signed.
(c) Includes office, office/flex, industrial/warehouse and stand-alone retail tenants only. Excludes leases for amenity, retail, parking and month-to-month tenants. Sometenants have multiple leases.
37

ITEM 3. LEGAL PROCEEDINGS
There are no material pending legal proceedings, other than ordinary routine litigation incidental to its business, to which the Company is a party or to which any of the Properties issubject.
ITEM 4. SUBMISSION OF MATTERS TO A VOTE OF SECURITY HOLDERS
Not Applicable.
38
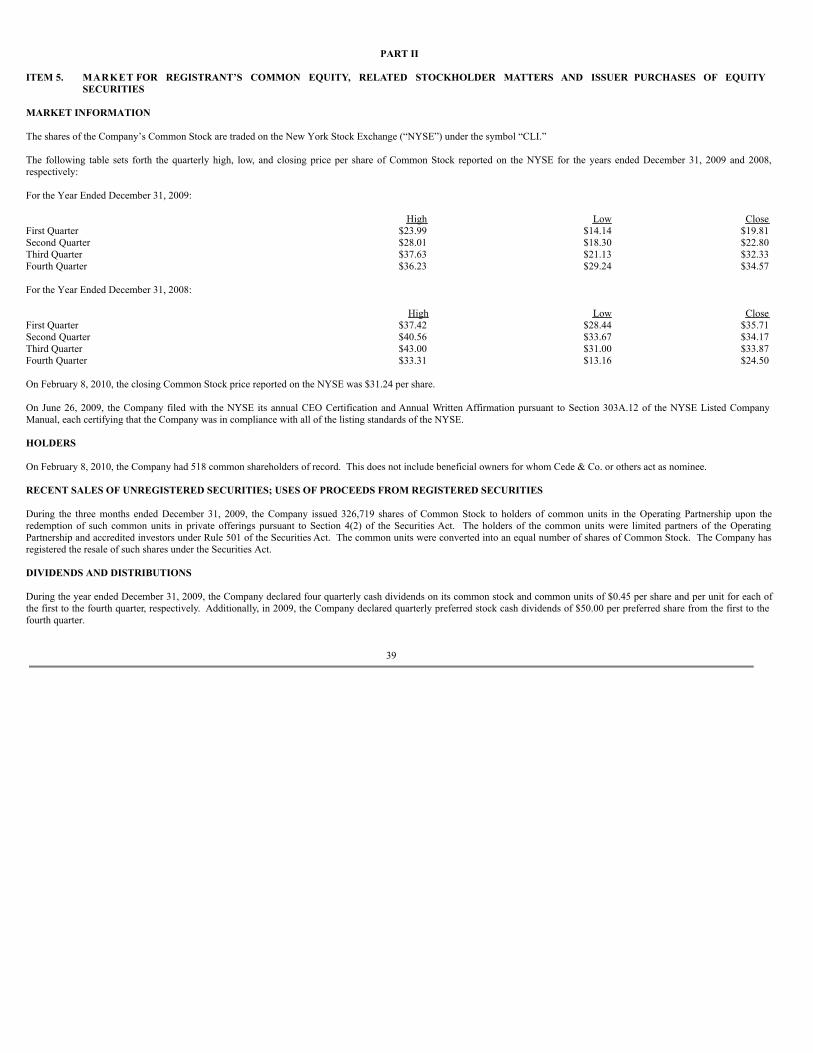
PART II
ITEM 5. MARKET FOR REGISTRANT’S COMMON EQUITY, RELATED STOCKHOLDER MATTERS AND ISSUER PURCHASES OF EQUITYSECURITIES
MARKET INFORMATION
The shares of the Company’s Common Stock are traded on the New York Stock Exchange (“NYSE”) under the symbol “CLI.”
The following table sets forth the quarterly high, low, and closing price per share of Common Stock reported on the NYSE for the years ended December 31, 2009 and 2008,respectively:
For the Year Ended December 31, 2009: High Low CloseFirst Quarter $23.99 $14.14 $19.81Second Quarter $28.01 $18.30 $22.80Third Quarter $37.63 $21.13 $32.33Fourth Quarter $36.23 $29.24 $34.57 For the Year Ended December 31, 2008: High Low CloseFirst Quarter $37.42 $28.44 $35.71Second Quarter $40.56 $33.67 $34.17Third Quarter $43.00 $31.00 $33.87Fourth Quarter $33.31 $13.16 $24.50
On February 8, 2010, the closing Common Stock price reported on the NYSE was $31.24 per share.
On June 26, 2009, the Company filed with the NYSE its annual CEO Certification and Annual Written Affirmation pursuant to Section 303A.12 of the NYSE Listed CompanyManual, each certifying that the Company was in compliance with all of the listing standards of the NYSE.
HOLDERS
On February 8, 2010, the Company had 518 common shareholders of record. This does not include beneficial owners for whom Cede & Co. or others act as nominee.
RECENT SALES OF UNREGISTERED SECURITIES; USES OF PROCEEDS FROM REGISTERED SECURITIES
During the three months ended December 31, 2009, the Company issued 326,719 shares of Common Stock to holders of common units in the Operating Partnership upon theredemption of such common units in private offerings pursuant to Section 4(2) of the Securities Act. The holders of the common units were limited partners of the OperatingPartnership and accredited investors under Rule 501 of the Securities Act. The common units were converted into an equal number of shares of Common Stock. The Company hasregistered the resale of such shares under the Securities Act.
DIVIDENDS AND DISTRIBUTIONS
During the year ended December 31, 2009, the Company declared four quarterly cash dividends on its common stock and common units of $0.45 per share and per unit for each ofthe first to the fourth quarter, respectively. Additionally, in 2009, the Company declared quarterly preferred stock cash dividends of $50.00 per preferred share from the first to thefourth quarter.
39
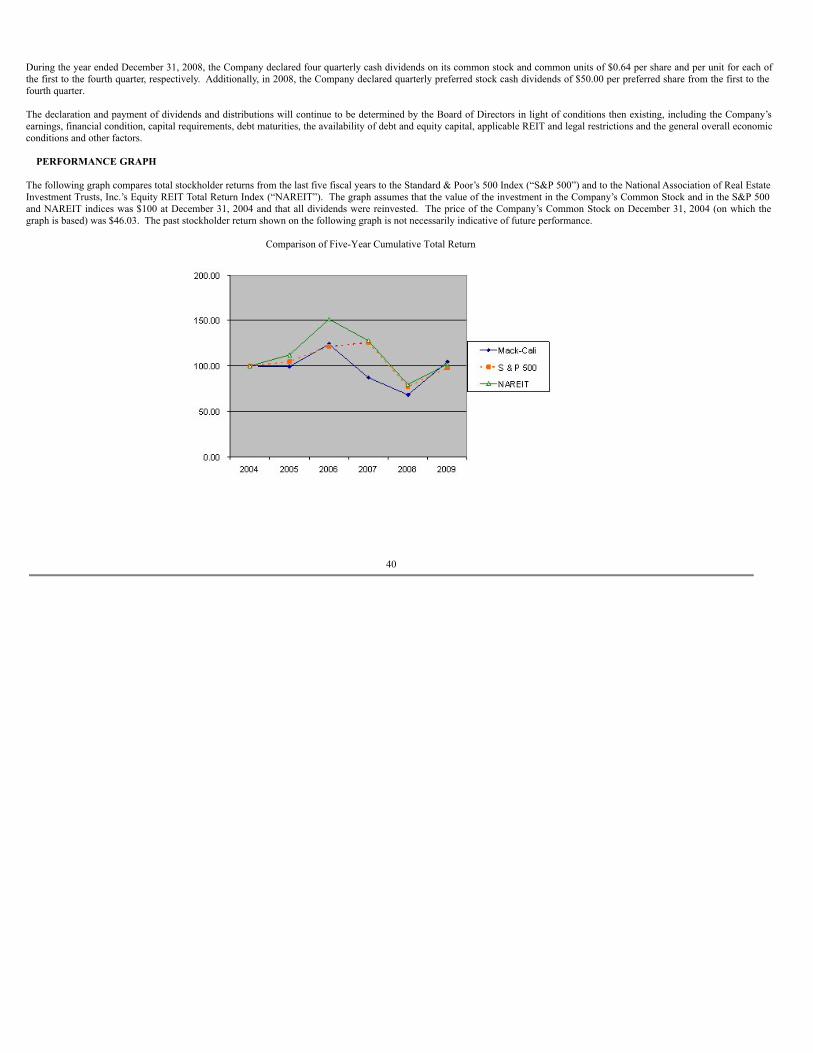
During the year ended December 31, 2008, the Company declared four quarterly cash dividends on its common stock and common units of $0.64 per share and per unit for each ofthe first to the fourth quarter, respectively. Additionally, in 2008, the Company declared quarterly preferred stock cash dividends of $50.00 per preferred share from the first to thefourth quarter.
The declaration and payment of dividends and distributions will continue to be determined by the Board of Directors in light of conditions then existing, including the Company’searnings, financial condition, capital requirements, debt maturities, the availability of debt and equity capital, applicable REIT and legal restrictions and the general overall economicconditions and other factors.
PERFORMANCE GRAPH
The following graph compares total stockholder returns from the last five fiscal years to the Standard & Poor’s 500 Index (“S&P 500”) and to the National Association of Real EstateInvestment Trusts, Inc.’s Equity REIT Total Return Index (“NAREIT”). The graph assumes that the value of the investment in the Company’s Common Stock and in the S&P 500and NAREIT indices was $100 at December 31, 2004 and that all dividends were reinvested. The price of the Company’s Common Stock on December 31, 2004 (on which thegraph is based) was $46.03. The past stockholder return shown on the following graph is not necessarily indicative of future performance.
Comparison of Five-Year Cumulative Total Return
40
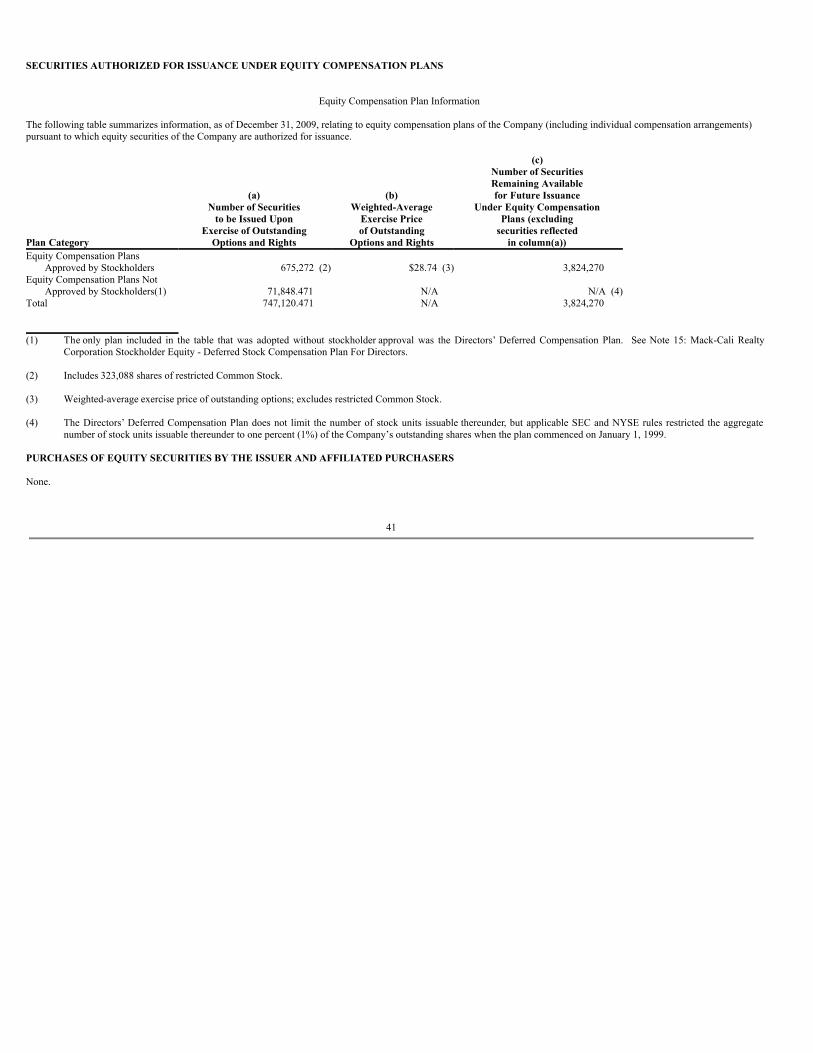
SECURITIES AUTHORIZED FOR ISSUANCE UNDER EQUITY COMPENSATION PLANS
Equity Compensation Plan Information The following table summarizes information, as of December 31, 2009, relating to equity compensation plans of the Company (including individual compensation arrangements)pursuant to which equity securities of the Company are authorized for issuance.
Plan Category
(a)Number of Securities
to be Issued UponExercise of Outstanding
Options and Rights
(b)Weighted-Average
Exercise Priceof Outstanding
Options and Rights
(c)Number of SecuritiesRemaining Availablefor Future Issuance
Under Equity CompensationPlans (excluding
securities reflectedin column(a))
Equity Compensation PlansApproved by Stockholders 675,272 (2) $28.74 (3) 3,824,270
Equity Compensation Plans NotApproved by Stockholders(1) 71,848.471 N/A N/A (4)
Total 747,120.471 N/A 3,824,270 (1) The only plan included in the table that was adopted without stockholder approval was the Directors’ Deferred Compensation Plan. See Note 15: Mack-Cali Realty
Corporation Stockholder Equity - Deferred Stock Compensation Plan For Directors. (2) Includes 323,088 shares of restricted Common Stock. (3) Weighted-average exercise price of outstanding options; excludes restricted Common Stock. (4) The Directors’ Deferred Compensation Plan does not limit the number of stock units issuable thereunder, but applicable SEC and NYSE rules restricted the aggregate
number of stock units issuable thereunder to one percent (1%) of the Company’s outstanding shares when the plan commenced on January 1, 1999. PURCHASES OF EQUITY SECURITIES BY THE ISSUER AND AFFILIATED PURCHASERS
None.
41
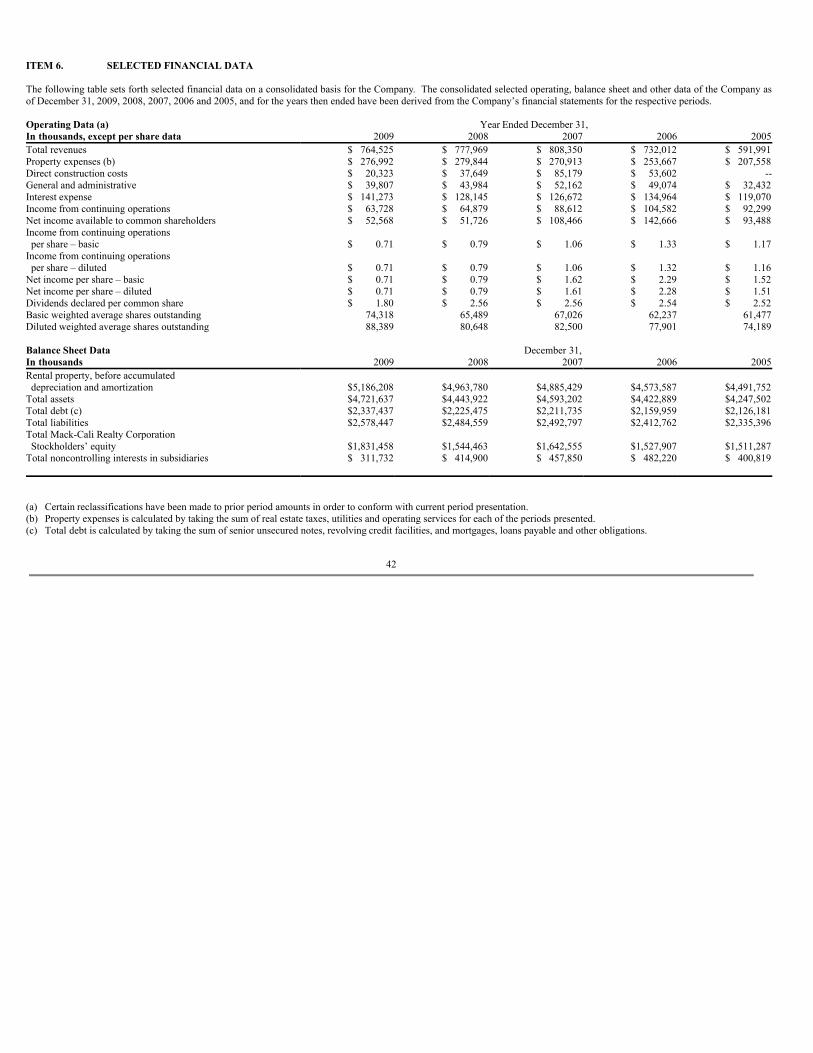
ITEM 6. SELECTED FINANCIAL DATA
The following table sets forth selected financial data on a consolidated basis for the Company. The consolidated selected operating, balance sheet and other data of the Company asof December 31, 2009, 2008, 2007, 2006 and 2005, and for the years then ended have been derived from the Company’s financial statements for the respective periods.
Operating Data (a) Year Ended December 31,In thousands, except per share data 2009 2008 2007 2006 2005Total revenues $ 764,525 $ 777,969 $ 808,350 $ 732,012 $ 591,991Property expenses (b) $ 276,992 $ 279,844 $ 270,913 $ 253,667 $ 207,558Direct construction costs $ 20,323 $ 37,649 $ 85,179 $ 53,602 --General and administrative $ 39,807 $ 43,984 $ 52,162 $ 49,074 $ 32,432Interest expense $ 141,273 $ 128,145 $ 126,672 $ 134,964 $ 119,070Income from continuing operations $ 63,728 $ 64,879 $ 88,612 $ 104,582 $ 92,299Net income available to common shareholders $ 52,568 $ 51,726 $ 108,466 $ 142,666 $ 93,488Income from continuing operations per share – basic $ 0.71 $ 0.79 $ 1.06 $ 1.33 $ 1.17Income from continuing operations per share – diluted $ 0.71 $ 0.79 $ 1.06 $ 1.32 $ 1.16Net income per share – basic $ 0.71 $ 0.79 $ 1.62 $ 2.29 $ 1.52Net income per share – diluted $ 0.71 $ 0.79 $ 1.61 $ 2.28 $ 1.51Dividends declared per common share $ 1.80 $ 2.56 $ 2.56 $ 2.54 $ 2.52Basic weighted average shares outstanding 74,318 65,489 67,026 62,237 61,477Diluted weighted average shares outstanding 88,389 80,648 82,500 77,901 74,189
Balance Sheet Data December 31,In thousands 2009 2008 2007 2006 2005Rental property, before accumulated depreciation and amortization $5,186,208 $4,963,780 $4,885,429 $4,573,587 $4,491,752Total assets $4,721,637 $4,443,922 $4,593,202 $4,422,889 $4,247,502Total debt (c) $2,337,437 $2,225,475 $2,211,735 $2,159,959 $2,126,181Total liabilities $2,578,447 $2,484,559 $2,492,797 $2,412,762 $2,335,396Total Mack-Cali Realty Corporation Stockholders’ equity $1,831,458 $1,544,463 $1,642,555 $1,527,907 $1,511,287Total noncontrolling interests in subsidiaries $ 311,732 $ 414,900 $ 457,850 $ 482,220 $ 400,819
(a) Certain reclassifications have been made to prior period amounts in order to conform with current period presentation.(b) Property expenses is calculated by taking the sum of real estate taxes, utilities and operating services for each of the periods presented.(c) Total debt is calculated by taking the sum of senior unsecured notes, revolving credit facilities, and mortgages, loans payable and other obligations.
42
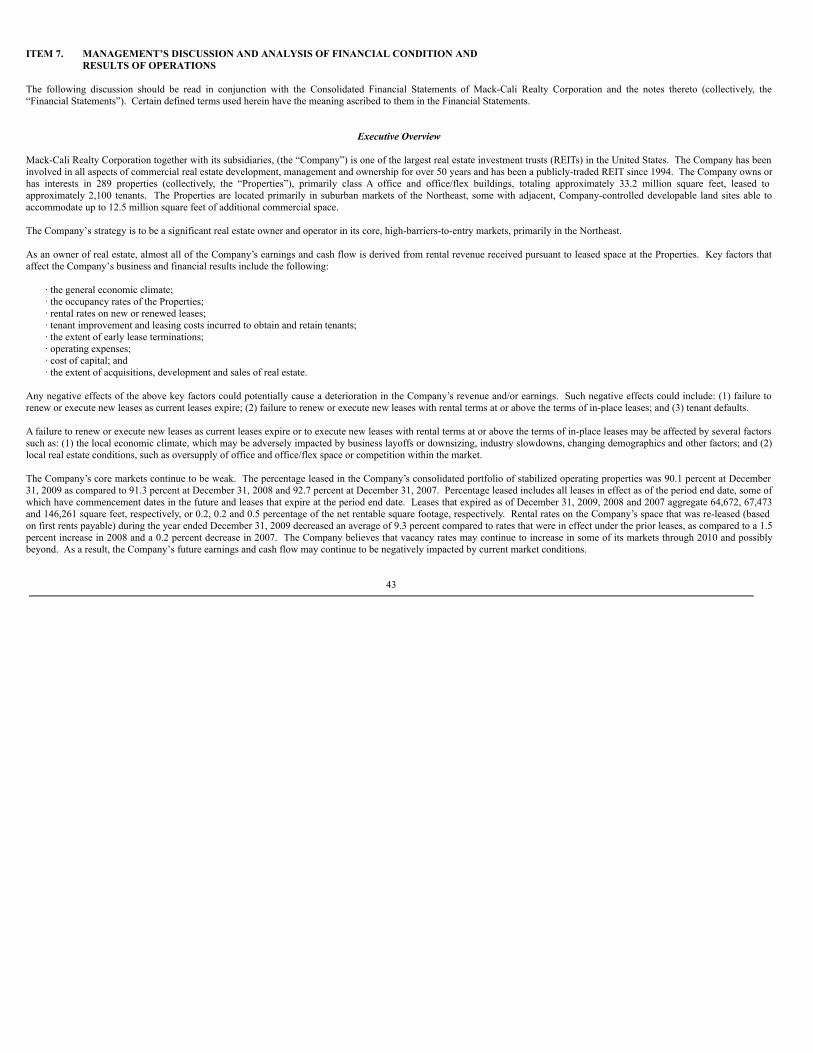
ITEM 7. MANAGEMENT’S DISCUSSION AND ANALYSIS OF FINANCIAL CONDITION ANDRESULTS OF OPERATIONS
The following discussion should be read in conjunction with the Consolidated Financial Statements of Mack-Cali Realty Corporation and the notes thereto (collectively, the“Financial Statements”). Certain defined terms used herein have the meaning ascribed to them in the Financial Statements.
Executive Overview
Mack-Cali Realty Corporation together with its subsidiaries, (the “Company”) is one of the largest real estate investment trusts (REITs) in the United States. The Company has beeninvolved in all aspects of commercial real estate development, management and ownership for over 50 years and has been a publicly-traded REIT since 1994. The Company owns orhas interests in 289 properties (collectively, the “Properties”), primarily class A office and office/flex buildings, totaling approximately 33.2 million square feet, leased toapproximately 2,100 tenants. The Properties are located primarily in suburban markets of the Northeast, some with adjacent, Company-controlled developable land sites able toaccommodate up to 12.5 million square feet of additional commercial space.
The Company’s strategy is to be a significant real estate owner and operator in its core, high-barriers-to-entry markets, primarily in the Northeast.
As an owner of real estate, almost all of the Company’s earnings and cash flow is derived from rental revenue received pursuant to leased space at the Properties. Key factors thataffect the Company’s business and financial results include the following:
· the general economic climate;· the occupancy rates of the Properties;· rental rates on new or renewed leases;· tenant improvement and leasing costs incurred to obtain and retain tenants;· the extent of early lease terminations;· operating expenses;· cost of capital; and· the extent of acquisitions, development and sales of real estate.
Any negative effects of the above key factors could potentially cause a deterioration in the Company’s revenue and/or earnings. Such negative effects could include: (1) failure torenew or execute new leases as current leases expire; (2) failure to renew or execute new leases with rental terms at or above the terms of in-place leases; and (3) tenant defaults.
A failure to renew or execute new leases as current leases expire or to execute new leases with rental terms at or above the terms of in-place leases may be affected by several factorssuch as: (1) the local economic climate, which may be adversely impacted by business layoffs or downsizing, industry slowdowns, changing demographics and other factors; and (2)local real estate conditions, such as oversupply of office and office/flex space or competition within the market.
The Company’s core markets continue to be weak. The percentage leased in the Company’s consolidated portfolio of stabilized operating properties was 90.1 percent at December31, 2009 as compared to 91.3 percent at December 31, 2008 and 92.7 percent at December 31, 2007. Percentage leased includes all leases in effect as of the period end date, some ofwhich have commencement dates in the future and leases that expire at the period end date. Leases that expired as of December 31, 2009, 2008 and 2007 aggregate 64,672, 67,473and 146,261 square feet, respectively, or 0.2, 0.2 and 0.5 percentage of the net rentable square footage, respectively. Rental rates on the Company’s space that was re-leased (basedon first rents payable) during the year ended December 31, 2009 decreased an average of 9.3 percent compared to rates that were in effect under the prior leases, as compared to a 1.5percent increase in 2008 and a 0.2 percent decrease in 2007. The Company believes that vacancy rates may continue to increase in some of its markets through 2010 and possiblybeyond. As a result, the Company’s future earnings and cash flow may continue to be negatively impacted by current market conditions.
43
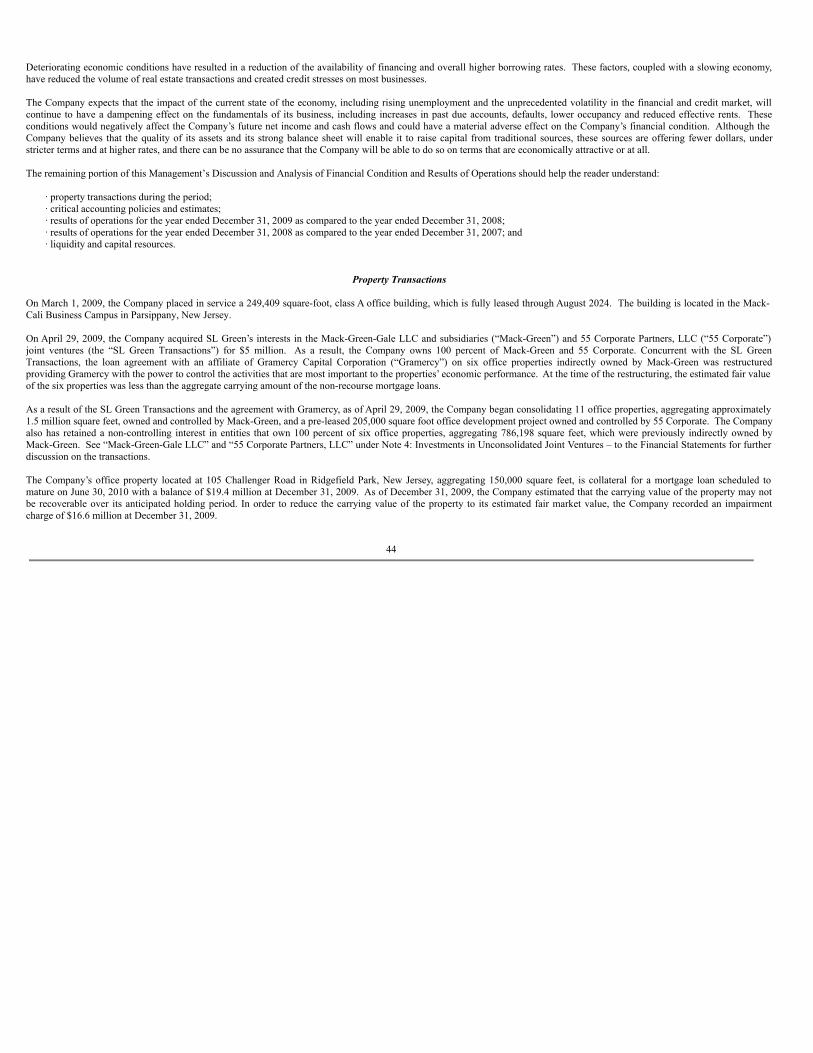
Deteriorating economic conditions have resulted in a reduction of the availability of financing and overall higher borrowing rates. These factors, coupled with a slowing economy,have reduced the volume of real estate transactions and created credit stresses on most businesses.
The Company expects that the impact of the current state of the economy, including rising unemployment and the unprecedented volatility in the financial and credit market, willcontinue to have a dampening effect on the fundamentals of its business, including increases in past due accounts, defaults, lower occupancy and reduced effective rents. Theseconditions would negatively affect the Company’s future net income and cash flows and could have a material adverse effect on the Company’s financial condition. Although theCompany believes that the quality of its assets and its strong balance sheet will enable it to raise capital from traditional sources, these sources are offering fewer dollars, understricter terms and at higher rates, and there can be no assurance that the Company will be able to do so on terms that are economically attractive or at all.
The remaining portion of this Management’s Discussion and Analysis of Financial Condition and Results of Operations should help the reader understand:
· property transactions during the period;· critical accounting policies and estimates;· results of operations for the year ended December 31, 2009 as compared to the year ended December 31, 2008;· results of operations for the year ended December 31, 2008 as compared to the year ended December 31, 2007; and· liquidity and capital resources.
Property Transactions
On March 1, 2009, the Company placed in service a 249,409 square-foot, class A office building, which is fully leased through August 2024. The building is located in the Mack-Cali Business Campus in Parsippany, New Jersey.
On April 29, 2009, the Company acquired SL Green’s interests in the Mack-Green-Gale LLC and subsidiaries (“Mack-Green”) and 55 Corporate Partners, LLC (“55 Corporate”)joint ventures (the “SL Green Transactions”) for $5 million. As a result, the Company owns 100 percent of Mack-Green and 55 Corporate. Concurrent with the SL GreenTransactions, the loan agreement with an affiliate of Gramercy Capital Corporation (“Gramercy”) on six office properties indirectly owned by Mack-Green was restructuredproviding Gramercy with the power to control the activities that are most important to the properties’ economic performance. At the time of the restructuring, the estimated fair valueof the six properties was less than the aggregate carrying amount of the non-recourse mortgage loans.
As a result of the SL Green Transactions and the agreement with Gramercy, as of April 29, 2009, the Company began consolidating 11 office properties, aggregating approximately1.5 million square feet, owned and controlled by Mack-Green, and a pre-leased 205,000 square foot office development project owned and controlled by 55 Corporate. The Companyalso has retained a non-controlling interest in entities that own 100 percent of six office properties, aggregating 786,198 square feet, which were previously indirectly owned byMack-Green. See “Mack-Green-Gale LLC” and “55 Corporate Partners, LLC” under Note 4: Investments in Unconsolidated Joint Ventures – to the Financial Statements for furtherdiscussion on the transactions.
The Company’s office property located at 105 Challenger Road in Ridgefield Park, New Jersey, aggregating 150,000 square feet, is collateral for a mortgage loan scheduled tomature on June 30, 2010 with a balance of $19.4 million at December 31, 2009. As of December 31, 2009, the Company estimated that the carrying value of the property may notbe recoverable over its anticipated holding period. In order to reduce the carrying value of the property to its estimated fair market value, the Company recorded an impairmentcharge of $16.6 million at December 31, 2009.
44
Critical Accounting Policies and Estimates
The Financial Statements have been prepared in conformity with generally accepted accounting principles. The preparation of the Financial Statements requires management to makeestimates and assumptions that affect the reported amounts of assets and liabilities and disclosure of contingent assets and liabilities at the date of the Financial Statements, and thereported amounts of revenues and expenses during the reported period. These estimates and assumptions are based on management’s historical experience that are believed to bereasonable at the time. However, because future events and their effects cannot be determined with certainty, the determination of estimates requires the exercise of judgment. TheCompany’s critical accounting policies are those which require assumptions to be made about matters that are highly uncertain. Different estimates could have a material effect onthe Company’s financial results. Judgments and uncertainties affecting the application of these policies and estimates may result in materially different amounts being reported underdifferent conditions and circumstances.
Rental Property:Rental properties are stated at cost less accumulated depreciation and amortization. Costs directly related to the acquisition, development and construction of rental properties arecapitalized. Capitalized development and construction costs include pre-construction costs essential to the development of the property, development and construction costs, interest,property taxes, insurance, salaries and other project costs incurred during the period of development. Interest capitalized by the Company for the years ended December 31, 2009,2008 and 2007 was $1.4 million, $5.8 million and $5.1 million, respectively. Ordinary repairs and maintenance are expensed as incurred; major replacements and betterments, whichimprove or extend the life of the asset, are capitalized and depreciated over their estimated useful lives. Fully-depreciated assets are removed from the accounts.
The Company considers a construction project as substantially completed and held available for occupancy upon the completion of tenant improvements, but no later than one yearfrom cessation of major construction activity (as distinguished from activities such as routine maintenance and cleanup). If portions of a rental project are substantially completed andoccupied by tenants, or held available for occupancy, and other portions have not yet reached that stage, the substantially completed portions are accounted for as a separateproject. The Company allocates costs incurred between the portions under construction and the portions substantially completed and held available for occupancy and capitalizesonly those costs associated with the portion under construction.
Properties are depreciated using the straight-line method over the estimated useful lives of the assets. The estimated useful lives are as follows:
Leasehold interests Remaining lease termBuildings and improvements 5 to 40 yearsTenant improvements The shorter of the term of the related lease or useful lifeFurniture, fixtures and equipment 5 to 10 years
Upon acquisition of rental property, the Company estimates the fair value of acquired tangible assets, consisting of land, building and improvements, and identified intangible assetsand liabilities generally consisting of the fair value of (i) above and below market leases, (ii) in-place leases and (iii) tenant relationships. The Company allocates the purchase priceto the assets acquired and liabilities assumed based on their fair values. The Company records goodwill or a gain on bargain purchase (if any) if the net assets acquired/liabilitiesassumed exceed the purchase consideration of a transaction. In estimating the fair value of the tangible and intangible assets acquired, the Company considers information obtainedabout each property as a result of its due diligence and marketing and leasing activities, and utilizes various valuation methods, such as estimated cash flow projections utilizingappropriate discount and capitalization rates, estimates of replacement costs net of depreciation, and available market information. The fair value of the tangible assets of an acquiredproperty considers the value of the property as if it were vacant.
Above-market and below-market lease values for acquired properties are initially recorded based on the present value (using a discount rate which reflects the risks associated withthe leases acquired) of the difference between (i) the contractual amounts to be paid pursuant to each in-place lease and (ii) management’s estimate of fair market lease rates for eachcorresponding in-place lease, measured over a period equal to the remaining term of the lease for above-market leases and the remaining initial term plus the term of any below-market fixed rate renewal options for below-market leases. The capitalized above-market lease values are amortized as a reduction of base rental revenue over the remaining term ofthe respective leases, and the capitalized below-market lease values are amortized as an increase to base rental revenue over the remaining initial terms plus the terms of any below-market fixed rate renewal options of the respective leases.
45
Other intangible assets acquired include amounts for in-place lease values and tenant relationship values which are based on management’s evaluation of the specific characteristicsof each tenant’s lease and the Company’s overall relationship with the respective tenant. Factors to be considered by management in its analysis of in-place lease values include anestimate of carrying costs during hypothetical expected lease-up periods considering current market conditions, and costs to execute similar leases. In estimating carrying costs,management includes real estate taxes, insurance and other operating expenses and estimates of lost rentals at market rates during the expected lease-up periods, depending on localmarket conditions. In estimating costs to execute similar leases, management considers leasing commissions, legal and other related expenses. Characteristics considered bymanagement in valuing tenant relationships include the nature and extent of the Company’s existing business relationships with the tenant, growth prospects for developing newbusiness with the tenant, the tenant’s credit quality and expectations of lease renewals. The value of in-place leases are amortized to expense over the remaining initial terms of therespective leases. The value of tenant relationship intangibles will be amortized to expense over the anticipated life of the relationships.
On a periodic basis, management assesses whether there are any indicators that the value of the Company’s rental properties may be impaired. A property’s value is impaired only ifmanagement’s estimate of the aggregate future cash flows (undiscounted and without interest charges) to be generated by the property is less than the carrying value of theproperty. To the extent impairment has occurred, the loss shall be measured as the excess of the carrying amount of the property over the fair value of the property. The Company’sestimates of aggregate future cash flows expected to be generated by each property are based on a number of assumptions that are subject to economic and market uncertaintiesincluding, among others, demand for space, competition for tenants, changes in market rental rates, and costs to operate each property. As these factors are difficult to predict and aresubject to future events that may alter management’s assumptions, the future cash flows estimated by management in its impairment analyses may not be achieved.
Rental Property Held for Sale and Discontinued Operations:When assets are identified by management as held for sale, the Company discontinues depreciating the assets and estimates the sales price, net of selling costs, of such assets. If, inmanagement’s opinion, the net sales price of the assets which have been identified as held for sale is less than the net book value of the assets, a valuation allowance isestablished. Properties identified as held for sale and/or sold are presented in discontinued operations for all periods presented.
If circumstances arise that previously were considered unlikely and, as a result, the Company decides not to sell a property previously classified as held for sale, the property isreclassified as held and used. A property that is reclassified is measured and recorded individually at the lower of (a) its carrying amount before the property was classified as heldfor sale, adjusted for any depreciation (amortization) expense that would have been recognized had the property been continuously classified as held and used, or (b) the fair value atthe date of the subsequent decision not to sell.
Investments in Unconsolidated Joint Ventures:The Company accounts for its investments in unconsolidated joint ventures under the equity method of accounting. The Company applies the equity method by initially recordingthese investments at cost, as Investments in Unconsolidated Joint Ventures, subsequently adjusted for equity in earnings and cash contributions and distributions.
Accounting Standards Codification (“ASC”) 810, Consolidation, provides guidance on the identification of entities for which control is achieved through means other than votingrights (“variable interest entities” or “VIEs”) and the determination of which business enterprise, if any, should consolidate the VIE (the “primary beneficiary”). Generally, theconsideration of whether an entity is a VIE applies when either (1) the equity investors (if any) lack one or more of the essential characteristics of a controlling financial interest, (2)the equity investment at risk is insufficient to finance that entity’s activities without additional subordinated financial support or (3) the equity investors have voting rights that are notproportionate to their economic interests and the activities of the entity involve or are conducted on behalf of an investor with a disproportionately small voting interest.
46
On a periodic basis, management assesses whether there are any indicators that the value of the Company’s investments in unconsolidated joint ventures may be impaired. Aninvestment is impaired only if management’s estimate of the value of the investment is less than the carrying value of the investment, and such decline in value is deemed to be otherthan temporary. To the extent impairment has occurred, the loss shall be measured as the excess of the carrying amount of the investment over the value of the investment. TheCompany’s estimates of value for each investment (particularly in commercial real estate joint ventures) are based on a number of assumptions that are subject to economic andmarket uncertainties including, among others, demand for space, competition for tenants, changes in market rental rates, and operating costs. As these factors are difficult to predictand are subject to future events that may alter management’s assumptions, the values estimated by management in its impairment analyses may not be realized.
Revenue Recognition:Base rental revenue is recognized on a straight-line basis over the terms of the respective leases. Unbilled rents receivable represents the amount by which straight-line rental revenueexceeds rents currently billed in accordance with the lease agreements. Above-market and below-market lease values for acquired properties are initially recorded based on thepresent value (using a discount rate which reflects the risks associated with the leases acquired) of the difference between (i) the contractual amounts to be paid pursuant to each in-place lease and (ii) management’s estimate of fair market lease rates for each corresponding in-place lease, measured over a period equal to the remaining term of the lease for above-market leases and the initial term plus the term of any below-market fixed-rate renewal options for below-market leases. The capitalized above-market lease values for acquiredproperties are amortized as a reduction of base rental revenue over the remaining term of the respective leases, and the capitalized below-market lease values are amortized as anincrease to base rental revenue over the remaining initial terms plus the terms of any below-market fixed-rate renewal options of the respective leases. Escalations and recoveriesfrom tenants are received from tenants for certain costs as provided in the lease agreements. These costs generally include real estate taxes, utilities, insurance, common areamaintenance and other recoverable costs.
Construction services revenue includes fees earned and reimbursements received by the Company for providing construction management and general contractor services toclients. Construction services revenue is recognized on the percentage of completion method. Using this method, profits are recorded on the basis of our estimates of the overallprofit and percentage of completion of individual contracts. A portion of the estimated profits is accrued based upon estimates of the percentage of completion of the constructioncontract. This revenue recognition method involves inherent risks relating to profit and cost estimates. Real estate services revenue includes property management, facilitiesmanagement, leasing commission fees and other services, and payroll and related costs reimbursed from clients. Other income includes income from parking spaces leased totenants, income from tenants for additional services arranged for the Company and income from tenants for early lease terminations.
Allowance for Doubtful Accounts:Management periodically performs a detailed review of amounts due from tenants to determine if accounts receivable balances are impaired based on factors affecting thecollectability of those balances. Management’s estimate of the allowance for doubtful accounts requires management to exercise significant judgment about the timing, frequencyand severity of collection losses, which affects the allowance and net income.
47

Results From Operations
The following comparisons for the year ended December 31, 2009 (“2009”), as compared to the year ended December 31, 2008 (“2008”), and for 2008, as compared to the yearended December 31, 2007 (“2007”), make reference to the following: (i) the effect of the “Same-Store Properties,” which represent all in-service properties owned by the Companyat December 31, 2007, (for the 2009 versus 2008 comparison) and which represent all in-service properties owned by the Company at December 31, 2006, (for the 2008 versus 2007comparison), excluding properties sold or held for sale through December 31, 2008; and (ii) the effect of the “Acquired Properties,” which represent all properties acquired by theCompany, commencing initial operations or initially consolidated by the Company from January 1, 2008 through December 31, 2009 (for the 2009 versus 2008 comparison) andwhich represent all properties acquired by the Company or commencing initial operation from January 1, 2007 through December 31, 2008 (for the 2008 versus 2007 comparison).
48
Year Ended December 31, 2009 Compared to Year Ended December 31, 2008
Year Ended December 31, Dollar Percent (dollars in thousands) 2009 2008 Change Change Revenue from rental operations and other: Base rents $ 615,839 $ 593,898 $ 21,941 3.7%Escalations and recoveries from tenants 103,887 109,690 (5,803) (5.3)Other income 13,530 20,214 (6,684) (33.1)Total revenues from rental operations 733,256 723,802 9,454 1.3 Property expenses: Real estate taxes 93,998 88,001 5,997 6.8 Utilities 71,545 84,227 (12,682) (15.1)Operating services 111,449 107,616 3,833 3.6 Total property expenses 276,992 279,844 (2,852) (1.0) Non-property revenues: Construction services 21,910 40,680 (18,770) (46.1)Real estate services 9,359 13,487 (4,128) (30.6)Total non-property revenues 31,269 54,167 (22,898) (42.3) Non-property expenses: Direct construction costs 20,323 37,649 (17,326) (46.0)General and administrative 39,807 43,984 (4,177) (9.5)Depreciation and amortization 202,543 194,635 7,908 4.1 Impairment charge on rental property 16,563 -- 16,563 100.0 Total non-property expenses 279,236 276,268 2,968 1.1 Operating income 208,297 221,857 (13,560) (6.1)Other (expense) income: Interest expense (141,273) (128,145) (13,128) (10.2)Interest and other investment income 571 1,385 (814) (58.8)Equity in earnings (loss) of unconsolidated joint ventures (5,560) (39,752) 34,192 86.0 Gain on sale of investment in marketable securities -- 471 (471) (100.0)Gain on reduction of other obligations 1,693 9,063 (7,370) (81.3)Total other (expense) income (144,569) (156,978) 12,409 7.9 Income from continuing operations 63,728 64,879 (1,151) (1.8)Net income 63,728 64,879 (1,151) (1.8)
Noncontrolling interest in consolidated joint ventures 943 664 279 42.0
Noncontrolling interest in Operating Partnership (10,103) (11,817) 1,714 14.5 Preferred stock dividends (2,000) (2,000) -- --
Net income available to common shareholders $ 52,568 $ 51,726 $ 842 1.6%
49
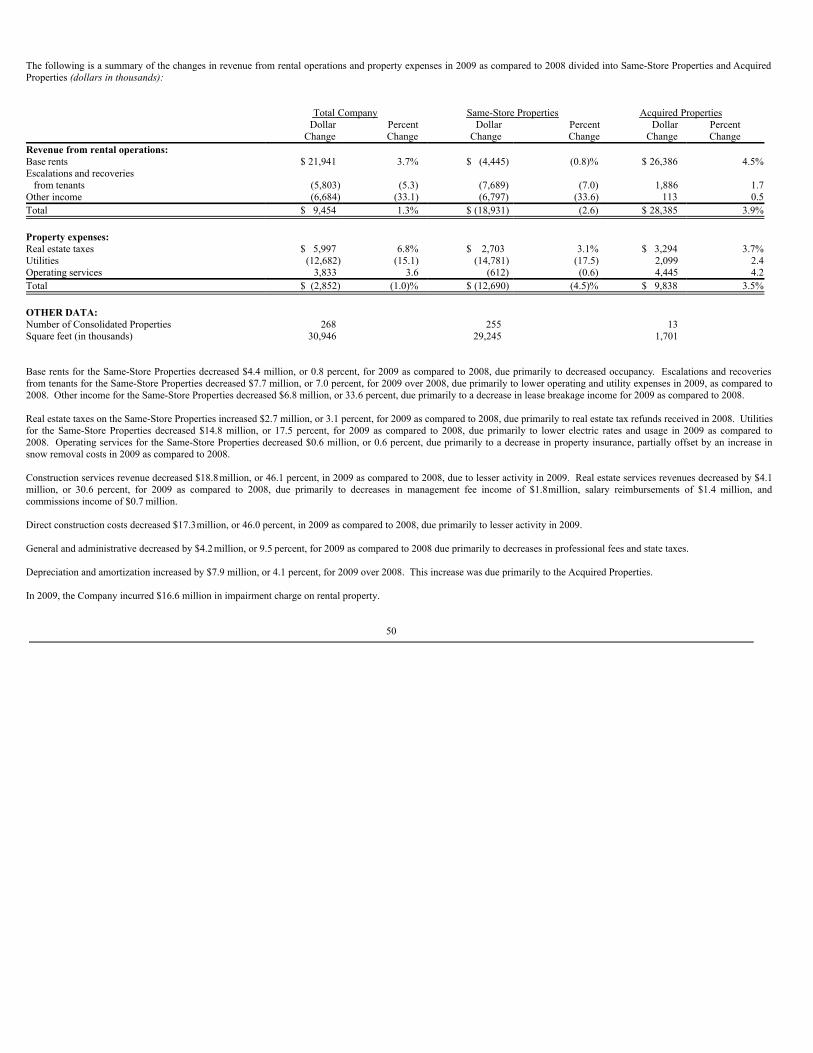
The following is a summary of the changes in revenue from rental operations and property expenses in 2009 as compared to 2008 divided into Same-Store Properties and AcquiredProperties (dollars in thousands):
Total Company Same-Store Properties Acquired Properties Dollar Percent Dollar Percent Dollar Percent Change Change Change Change Change ChangeRevenue from rental operations: Base rents $ 21,941 3.7% $ (4,445) (0.8)% $ 26,386 4.5%Escalations and recoveries from tenants (5,803) (5.3) (7,689) (7.0) 1,886 1.7Other income (6,684) (33.1) (6,797) (33.6) 113 0.5Total $ 9,454 1.3% $ (18,931) (2.6) $ 28,385 3.9% Property expenses: Real estate taxes $ 5,997 6.8% $ 2,703 3.1% $ 3,294 3.7%Utilities (12,682) (15.1) (14,781) (17.5) 2,099 2.4Operating services 3,833 3.6 (612) (0.6) 4,445 4.2Total $ (2,852) (1.0)% $ (12,690) (4.5)% $ 9,838 3.5% OTHER DATA: Number of Consolidated Properties 268 255 13 Square feet (in thousands) 30,946 29,245 1,701
Base rents for the Same-Store Properties decreased $4.4 million, or 0.8 percent, for 2009 as compared to 2008, due primarily to decreased occupancy. Escalations and recoveriesfrom tenants for the Same-Store Properties decreased $7.7 million, or 7.0 percent, for 2009 over 2008, due primarily to lower operating and utility expenses in 2009, as compared to2008. Other income for the Same-Store Properties decreased $6.8 million, or 33.6 percent, due primarily to a decrease in lease breakage income for 2009 as compared to 2008.
Real estate taxes on the Same-Store Properties increased $2.7 million, or 3.1 percent, for 2009 as compared to 2008, due primarily to real estate tax refunds received in 2008. Utilitiesfor the Same-Store Properties decreased $14.8 million, or 17.5 percent, for 2009 as compared to 2008, due primarily to lower electric rates and usage in 2009 as compared to2008. Operating services for the Same-Store Properties decreased $0.6 million, or 0.6 percent, due primarily to a decrease in property insurance, partially offset by an increase insnow removal costs in 2009 as compared to 2008.
Construction services revenue decreased $18.8 million, or 46.1 percent, in 2009 as compared to 2008, due to lesser activity in 2009. Real estate services revenues decreased by $4.1million, or 30.6 percent, for 2009 as compared to 2008, due primarily to decreases in management fee income of $1.8 million, salary reimbursements of $1.4 million, andcommissions income of $0.7 million.
Direct construction costs decreased $17.3 million, or 46.0 percent, in 2009 as compared to 2008, due primarily to lesser activity in 2009.
General and administrative decreased by $4.2 million, or 9.5 percent, for 2009 as compared to 2008 due primarily to decreases in professional fees and state taxes.
Depreciation and amortization increased by $7.9 million, or 4.1 percent, for 2009 over 2008. This increase was due primarily to the Acquired Properties.
In 2009, the Company incurred $16.6 million in impairment charge on rental property.
50
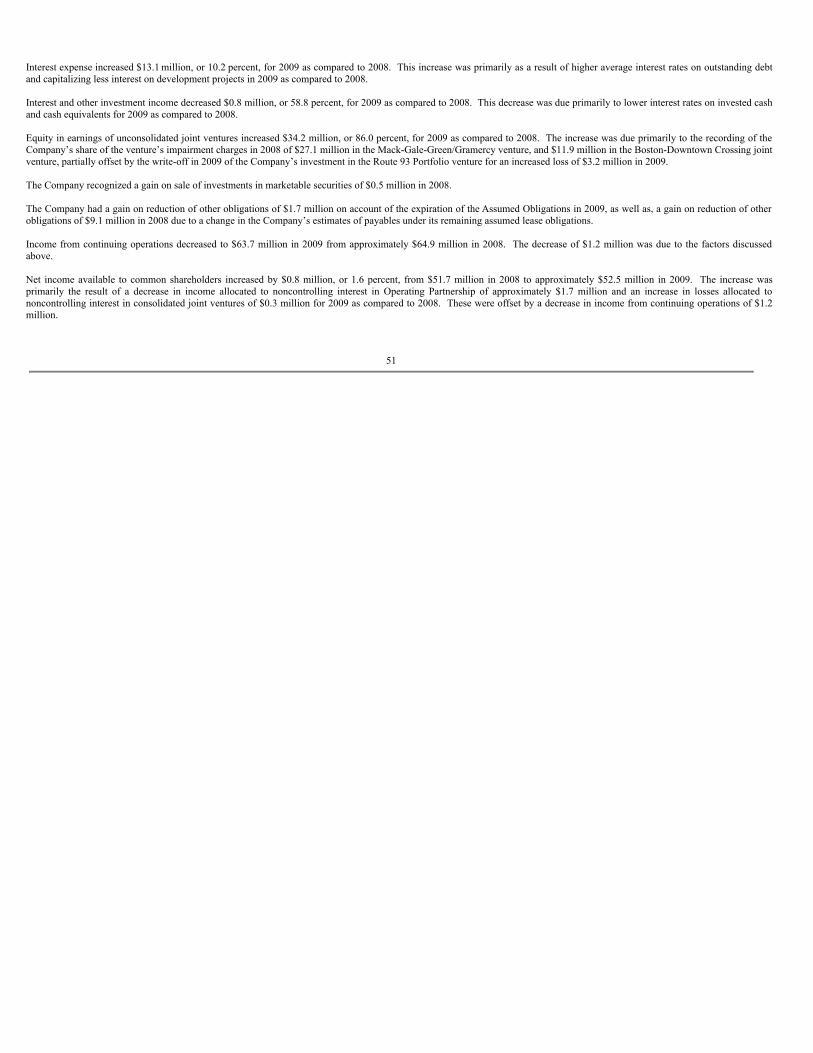
Interest expense increased $13.1 million, or 10.2 percent, for 2009 as compared to 2008. This increase was primarily as a result of higher average interest rates on outstanding debtand capitalizing less interest on development projects in 2009 as compared to 2008.
Interest and other investment income decreased $0.8 million, or 58.8 percent, for 2009 as compared to 2008. This decrease was due primarily to lower interest rates on invested cashand cash equivalents for 2009 as compared to 2008.
Equity in earnings of unconsolidated joint ventures increased $34.2 million, or 86.0 percent, for 2009 as compared to 2008. The increase was due primarily to the recording of theCompany’s share of the venture’s impairment charges in 2008 of $27.1 million in the Mack-Gale-Green/Gramercy venture, and $11.9 million in the Boston-Downtown Crossing jointventure, partially offset by the write-off in 2009 of the Company’s investment in the Route 93 Portfolio venture for an increased loss of $3.2 million in 2009.
The Company recognized a gain on sale of investments in marketable securities of $0.5 million in 2008.
The Company had a gain on reduction of other obligations of $1.7 million on account of the expiration of the Assumed Obligations in 2009, as well as, a gain on reduction of otherobligations of $9.1 million in 2008 due to a change in the Company’s estimates of payables under its remaining assumed lease obligations.
Income from continuing operations decreased to $63.7 million in 2009 from approximately $64.9 million in 2008. The decrease of $1.2 million was due to the factors discussedabove.
Net income available to common shareholders increased by $0.8 million, or 1.6 percent, from $51.7 million in 2008 to approximately $52.5 million in 2009. The increase wasprimarily the result of a decrease in income allocated to noncontrolling interest in Operating Partnership of approximately $1.7 million and an increase in losses allocated tononcontrolling interest in consolidated joint ventures of $0.3 million for 2009 as compared to 2008. These were offset by a decrease in income from continuing operations of $1.2million.
51
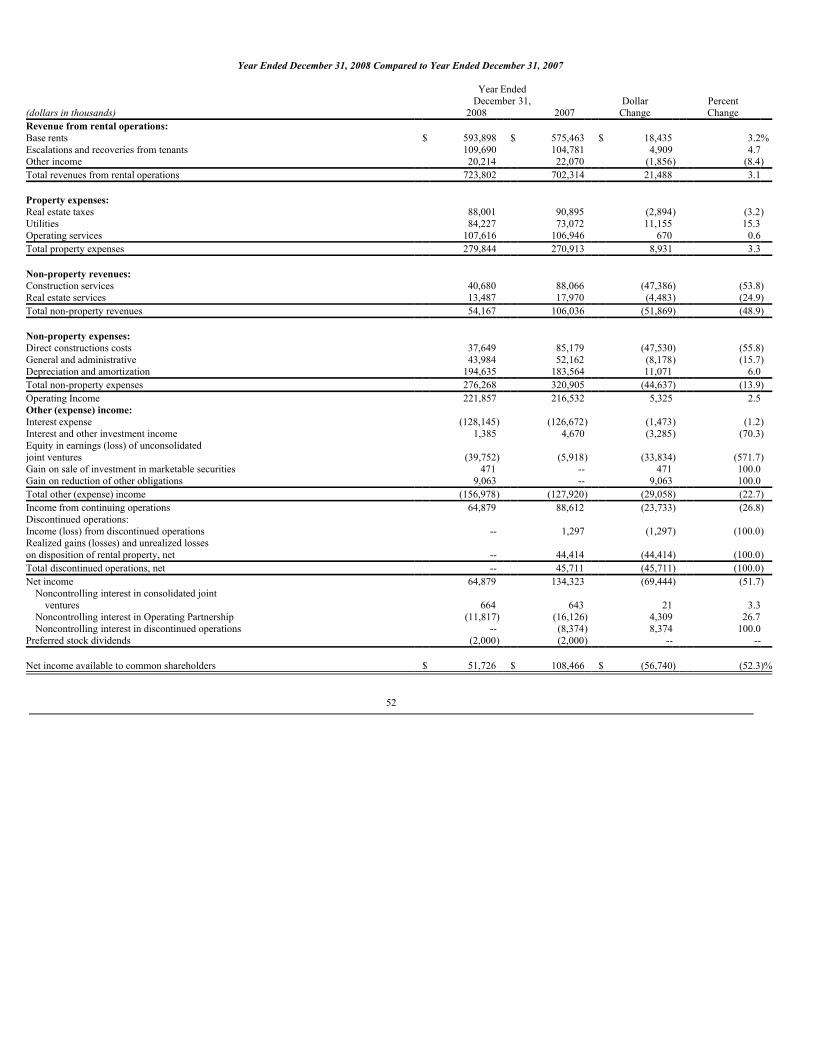
Year Ended December 31, 2008 Compared to Year Ended December 31, 2007
Year Ended December 31, Dollar Percent (dollars in thousands) 2008 2007 Change Change Revenue from rental operations: Base rents $ 593,898 $ 575,463 $ 18,435 3.2%Escalations and recoveries from tenants 109,690 104,781 4,909 4.7 Other income 20,214 22,070 (1,856) (8.4)Total revenues from rental operations 723,802 702,314 21,488 3.1 Property expenses: Real estate taxes 88,001 90,895 (2,894) (3.2)Utilities 84,227 73,072 11,155 15.3 Operating services 107,616 106,946 670 0.6 Total property expenses 279,844 270,913 8,931 3.3 Non-property revenues: Construction services 40,680 88,066 (47,386) (53.8)Real estate services 13,487 17,970 (4,483) (24.9)Total non-property revenues 54,167 106,036 (51,869) (48.9) Non-property expenses: Direct constructions costs 37,649 85,179 (47,530) (55.8)General and administrative 43,984 52,162 (8,178) (15.7)Depreciation and amortization 194,635 183,564 11,071 6.0 Total non-property expenses 276,268 320,905 (44,637) (13.9)Operating Income 221,857 216,532 5,325 2.5 Other (expense) income: Interest expense (128,145) (126,672) (1,473) (1.2)Interest and other investment income 1,385 4,670 (3,285) (70.3)Equity in earnings (loss) of unconsolidated joint ventures (39,752) (5,918) (33,834) (571.7)Gain on sale of investment in marketable securities 471 -- 471 100.0 Gain on reduction of other obligations 9,063 -- 9,063 100.0 Total other (expense) income (156,978) (127,920) (29,058) (22.7)Income from continuing operations 64,879 88,612 (23,733) (26.8)Discontinued operations: Income (loss) from discontinued operations -- 1,297 (1,297) (100.0)Realized gains (losses) and unrealized losses on disposition of rental property, net -- 44,414 (44,414) (100.0)Total discontinued operations, net -- 45,711 (45,711) (100.0)Net income 64,879 134,323 (69,444) (51.7)
Noncontrolling interest in consolidated joint ventures 664 643 21 3.3
Noncontrolling interest in Operating Partnership (11,817) (16,126) 4,309 26.7 Noncontrolling interest in discontinued operations -- (8,374) 8,374 100.0
Preferred stock dividends (2,000) (2,000) -- -- Net income available to common shareholders $ 51,726 $ 108,466 $ (56,740) (52.3)%
52
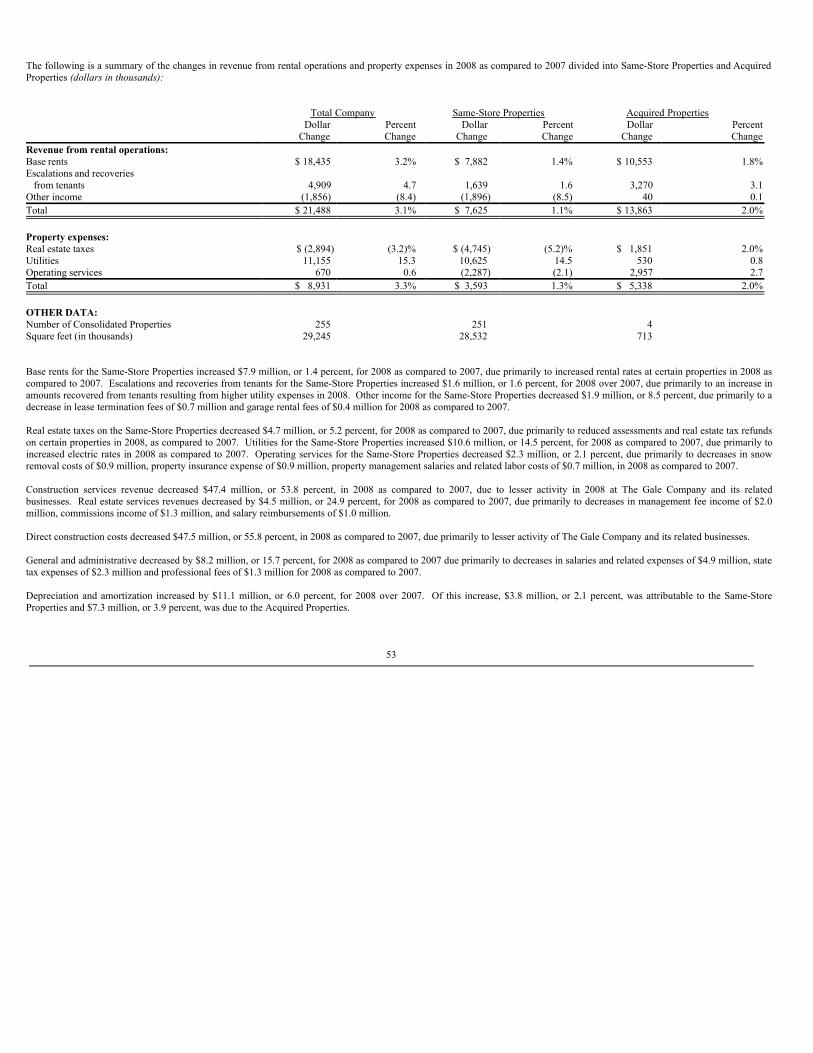
The following is a summary of the changes in revenue from rental operations and property expenses in 2008 as compared to 2007 divided into Same-Store Properties and AcquiredProperties (dollars in thousands):
Total Company Same-Store Properties Acquired Properties Dollar Percent Dollar Percent Dollar Percent Change Change Change Change Change ChangeRevenue from rental operations: Base rents $ 18,435 3.2% $ 7,882 1.4% $ 10,553 1.8%Escalations and recoveries from tenants 4,909 4.7 1,639 1.6 3,270 3.1Other income (1,856) (8.4) (1,896) (8.5) 40 0.1Total $ 21,488 3.1% $ 7,625 1.1% $ 13,863 2.0% Property expenses: Real estate taxes $ (2,894) (3.2)% $ (4,745) (5.2)% $ 1,851 2.0%Utilities 11,155 15.3 10,625 14.5 530 0.8Operating services 670 0.6 (2,287) (2.1) 2,957 2.7Total $ 8,931 3.3% $ 3,593 1.3% $ 5,338 2.0% OTHER DATA: Number of Consolidated Properties 255 251 4 Square feet (in thousands) 29,245 28,532 713
Base rents for the Same-Store Properties increased $7.9 million, or 1.4 percent, for 2008 as compared to 2007, due primarily to increased rental rates at certain properties in 2008 ascompared to 2007. Escalations and recoveries from tenants for the Same-Store Properties increased $1.6 million, or 1.6 percent, for 2008 over 2007, due primarily to an increase inamounts recovered from tenants resulting from higher utility expenses in 2008. Other income for the Same-Store Properties decreased $1.9 million, or 8.5 percent, due primarily to adecrease in lease termination fees of $0.7 million and garage rental fees of $0.4 million for 2008 as compared to 2007.
Real estate taxes on the Same-Store Properties decreased $4.7 million, or 5.2 percent, for 2008 as compared to 2007, due primarily to reduced assessments and real estate tax refundson certain properties in 2008, as compared to 2007. Utilities for the Same-Store Properties increased $10.6 million, or 14.5 percent, for 2008 as compared to 2007, due primarily toincreased electric rates in 2008 as compared to 2007. Operating services for the Same-Store Properties decreased $2.3 million, or 2.1 percent, due primarily to decreases in snowremoval costs of $0.9 million, property insurance expense of $0.9 million, property management salaries and related labor costs of $0.7 million, in 2008 as compared to 2007.
Construction services revenue decreased $47.4 million, or 53.8 percent, in 2008 as compared to 2007, due to lesser activity in 2008 at The Gale Company and its relatedbusinesses. Real estate services revenues decreased by $4.5 million, or 24.9 percent, for 2008 as compared to 2007, due primarily to decreases in management fee income of $2.0million, commissions income of $1.3 million, and salary reimbursements of $1.0 million.
Direct construction costs decreased $47.5 million, or 55.8 percent, in 2008 as compared to 2007, due primarily to lesser activity of The Gale Company and its related businesses.
General and administrative decreased by $8.2 million, or 15.7 percent, for 2008 as compared to 2007 due primarily to decreases in salaries and related expenses of $4.9 million, statetax expenses of $2.3 million and professional fees of $1.3 million for 2008 as compared to 2007.
Depreciation and amortization increased by $11.1 million, or 6.0 percent, for 2008 over 2007. Of this increase, $3.8 million, or 2.1 percent, was attributable to the Same-StoreProperties and $7.3 million, or 3.9 percent, was due to the Acquired Properties.
53
Interest expense increased $1.5 million, or 1.2 percent, for 2008 as compared to 2007. This increase was primarily as a result of higher average debt balances in 2008 as compared to2007, partially offset by lower interest rates in 2008 as compared to 2007.
Interest and other investment income decreased $3.3 million, or 70.3 percent, for 2008 as compared to 2007. This decrease was due primarily to lower cash balances invested in2008.
Equity in earnings of unconsolidated joint ventures decreased $33.8 million, or 571.7 percent, for 2008 as compared to 2007. The decrease was due primarily to the Company’s shareof the venture’s recording of impairment charges of $27.1 million in the Mack-Green joint venture, and $11.9 million in the Boston-Downtown Crossing’s joint venture. These werepartially offset by increased income in 2008 of $1.6 million in the Harborside South Pier joint venture, a decreased operating loss of $1.4 million in the Mack-Green joint venture, adecreased loss of $1.1 million in the Route 93 joint venture, increased income of $0.6 million in the Gale Kimball joint venture, and a decreased loss of $0.5 million in the RamlandRealty joint venture in 2008 as compared to 2007.
The Company recognized a gain on sale of investments in marketable securities of $0.5 million in 2008.
The Company recognized a gain on reduction of other obligations of $9.1 million in 2008 due to a change in the Company’s current estimates of payables under its remainingassumed lease obligations.
Income from continuing operations decreased to $64.9 million in 2008 from approximately $88.6 million in 2007. The decrease of $23.7 million was due to the factors discussedabove.
Net income available to common shareholders decreased by $56.7 million, or 52.3 percent, from approximately $108.4 million in 2007 to $51.7 million in 2008. This decrease wasprimarily the result of realized gains on disposition of rental property of $44.4 million in 2007, a decrease in income from continuing operations before noncontrolling interest inOperating Partnership of $23.7 million and a decrease in income from discontinued operations of approximately $1.3 million as compared to 2007. These were partially offset by anoncontrolling interest in discontinued operations of $8.4 million in 2007 and a decrease in income allocated to noncontrolling interest in Operating Partnership of $4.3 million for2008 as compared to 2007.
54
LIQUIDITY AND CAPITAL RESOURCES
Liquidity
Overview:Historically, rental revenue has been the Company’s principal source of funds to pay operating expenses, debt service, capital expenditures and dividends, excluding non-recurringcapital expenditures. To the extent that the Company’s cash flow from operating activities is insufficient to finance its non-recurring capital expenditures such as propertyacquisitions, development and construction costs and other capital expenditures, the Company has and expects to continue to finance such activities through borrowings under itsrevolving credit facility and other debt and equity financings.
The Company believes that with the general downturn in the Company’s markets in recent years, it is reasonably likely that vacancy rates may continue to increase, effective rentalrates on new and renewed leases may continue to decrease and tenant installation costs, including concessions, may continue to increase in most or all of its markets in 2010 andpossibly beyond. As a result of the potential negative effects on the Company’s revenue from the overall reduced demand for office space, the Company’s cash flow could beinsufficient to cover increased tenant installation costs over the short-term. If this situation were to occur, the Company expects that it would finance any shortfalls throughborrowings under its revolving credit facility and other debt and equity financings.
The Company expects to meet its short-term liquidity requirements generally through its working capital, net cash provided by operating activities and from its revolving creditfacility. The Company frequently examines potential property acquisitions and development projects and, at any given time, one or more of such acquisitions or development projectsmay be under consideration. Accordingly, the ability to fund property acquisitions and development projects is a major part of the Company’s financing requirements. The Companyexpects to meet its financing requirements through funds generated from operating activities, proceeds from property sales, long-term and short-term borrowings (including draws onthe Company’s revolving credit facility) and the issuance of additional debt and/or equity securities.
Financial markets have recently experienced unusual volatility and uncertainty. Liquidity has tightened in all financial markets, including the debt and equity markets. TheCompany’s ability to fund property acquisitions or development projects, as well as its ability to repay or refinance debt maturities could be adversely affected by an inability tosecure financing at reasonable terms, if at all. While the Company currently does not expect any difficulties, it is possible, in these unusual and uncertain times, that one or morelenders in the Company’s revolving credit facility could fail to fund a borrowing request. Such an event could adversely affect the ability of the Company to access funds from itsrevolving credit facility when needed.
If current economic conditions persist or deteriorate, the Company may experience increases in past due accounts, defaults, lower occupancy rates and reduced effective rents. Thiscondition would negatively affect the Company’s future net income and cash flows and could have a material adverse effect on the Company’s financial condition.
Construction Projects:Sanofi-Aventis U.S. Inc. (“Sanofi”), which occupies neighboring buildings in Bridgewater, New Jersey, exercised its option to cause 55 Corporate Drive II LLC, to construct abuilding on its vacant, developable land and has signed a lease for the building. The lease has a term of fifteen years, subject to three five-year extension options. The construction ofthe 205,000 square foot building commenced in 2009 and is expected to be delivered to the tenant in January 2011. The total estimated costs of the project are expected to beapproximately $50.9 million (of which the Company has incurred $19.7 million through December 31, 2009). As of April 29, 2009, the Company owns 100 percent of 55 CorporatePartners L.L.C. after acquiring the remaining 50 percent interest from SLG Gale 55 Corporate LLC.
The Company is obligated to acquire from an entity (the “Florham Entity”) whose beneficial owners include Stanley C. Gale and Mark Yeager, an executive officer of the Company,a 50 percent interest in a venture which owns a developable land parcel in Florham Park, New Jersey (the “Florham Park Land”) for a maximum purchase price of up to $10.5 million,subject to reduction based on developable square feet approved and other conditions, with the completion of such acquisition subject to the Florham Entity obtaining finaldevelopment permits and approvals and related conditions necessary to allow for office development expected to be 600,000 square feet. In the event the acquisition of the FlorhamPark Land does not close by May 9, 2010, subject to certain conditions, the Florham Entity will be obligated to pay certain deferred costs and an additional $1 million to theCompany at that time.
55
REIT Restrictions:To maintain its qualification as a REIT under the Code, the Company must make annual distributions to its stockholders of at least 90 percent of its REIT taxable income, determinedwithout regard to the dividends paid deduction and by excluding net capital gains. Moreover, the Company intends to continue to make regular quarterly distributions to its commonstockholders. Based upon the most recently paid quarterly common stock dividend of $0.45 per common share, in the aggregate, such distributions would equal approximately$142.1 million on an annualized basis. However, any such distribution, whether for federal income tax purposes or otherwise, would be paid out of (a) available cash, includingborrowings and other sources, after meeting operating requirements, preferred stock dividends and distributions, and scheduled debt service on the Company’s debt, and (b) fordistributions declared on or before December 31, 2012 with respect to a taxable year ending on or before December 31, 2011, our stock, as permitted pursuant to Internal RevenueService Revenue Procedure 2010-12, 2010-3 I.R.B. Under this Revenue Procedure, we are permitted to make taxable distributions of our stock (in lieu of cash) if (x) any suchdistribution is declared on or before December 31, 2012 with respect to a taxable year ending on or before December 31, 2011, and (y) each of our stockholders is permitted to electto receive its entire entitlement under such declaration in either cash or shares of equivalent value subject to a limitation in the amount of cash to be distributed in the aggregate;provided that (i) the amount of cash that we set aside for distribution is not less than 10 percent of the aggregate distribution so declared, and (ii) if too many of our stockholders electto receive cash, a pro rata amount of cash will be distributed to each such stockholder electing to receive cash, but in no event will any such stockholder receive less than its entireentitlement under such declaration.
Property Lock-Ups:The Company may not dispose of or distribute certain of its properties, currently comprising 11 properties with an aggregate net book value of approximately $199.8 million, whichwere originally contributed by certain unrelated common unitholders of the Operating Partnership, without the express written consent of such common unitholders, as applicable,except in a manner which does not result in recognition of any built-in-gain (which may result in an income tax liability) or which reimburses the appropriate specific commonunitholders for the tax consequences of the recognition of such built-in-gains (collectively, the “Property Lock-Ups”). The aforementioned restrictions do not apply in the event thatthe Company sells all of its properties or in connection with a sale transaction which the Company’s Board of Directors determines is reasonably necessary to satisfy a materialmonetary default on any unsecured debt, judgment or liability of the Company or to cure any material monetary default on any mortgage secured by a property. The Property Lock-Ups expire periodically through 2016. Upon the expiration of the Property Lock-Ups, the Company is generally required to use commercially reasonable efforts to prevent any sale,transfer or other disposition of the subject properties from resulting in the recognition of built-in gain to the specific common unitholders, which include members of the Mack Group(which includes William L. Mack, Chairman of the Company’s Board of Directors; David S. Mack, director; Earle I. Mack, a former director; and Mitchell E. Hersh, president, chiefexecutive officer and director), the Robert Martin Group (which includes Martin S. Berger, director; Robert F. Weinberg, a former director; and Timothy M. Jones, former president),the Cali Group (which includes John R. Cali, director, and John J. Cali, a former director). As of December 31, 2009, 126 of the Company’s properties, with an aggregate net bookvalue of approximately $1.8 billion, have lapsed restrictions and are subject to these conditions.
Unencumbered Properties:As of December 31, 2009, the Company had 236 unencumbered properties, totaling 24.3 million square feet, representing 78.6 percent of the Company’s total portfolio on a squarefootage basis.
Credit Ratings:The Company has three investment grade credit ratings. Standard & Poor’s Rating Services (“S&P”) and Fitch, Inc. (“Fitch”) have each assigned their BBB rating to existing andprospective senior unsecured debt of the Operating Partnership and their BB+ rating to existing and prospective preferred stock offerings of the Company. Moody’s Investors Service(“Moody’s”) has assigned its Baa2 rating to existing and prospective senior unsecured debt of the Operating Partnership and its Baa3 rating to existing and prospective preferredstock offerings of the Company.
56
Cash Flows
Cash and cash equivalents increased by $269.4 million to $291.0 million at December 31, 2009, compared to $21.6 million at December 31, 2008. This increase is comprised of thefollowing net cash flow items:
(1) $294.7 million provided by operating activities.
(2) $80.1 million used in investing activities, consisting primarily of the following:
(a) $77.8 million used for additions to rental property; minus(b) $6.3 million used for investments in unconsolidated joint ventures; minus(c) $11.4 million received from repayments of notes receivable; plus(d) $8.0 million received from restricted cash.
(3) $54.8 million provided by financing activities, consisting primarily of the following:
(a) $337.0 million from borrowings under the revolving credit facility; plus(b) $274.8 million from proceeds received from a Common Stock offering; plus(c) $246.2 million from proceeds received from senior unsecured notes; minus(d) $498.0 million used for repayments of borrowings under the Company’s unsecured credit facility; minus(e) $199.7 million used for repayment of senior unsecured notes; minus(f) $173.3 million used for payments of dividends and distributions; minus(g) $11.5 million used for repayments of mortgages, loans payable and other obligations.
Debt Financing
Summary of Debt:The following is a breakdown of the Company’s debt consisting of all fixed rate financing as of December 31, 2009:
Balance Weighted Average Weighted Average Maturity ($000’s) % of Total Interest Rate (a) in YearsFixed Rate Unsecured Debt and Other Obligations $1,582,434 67.70% 6.37% 4.10Fixed Rate Secured Debt 755,003 32.30% 7.09% 5.98 Totals/Weighted Average: $2,337,437 100.00% 6.61% 4.70
(a) No variable-rate borrowings as of December 31, 2009.
57
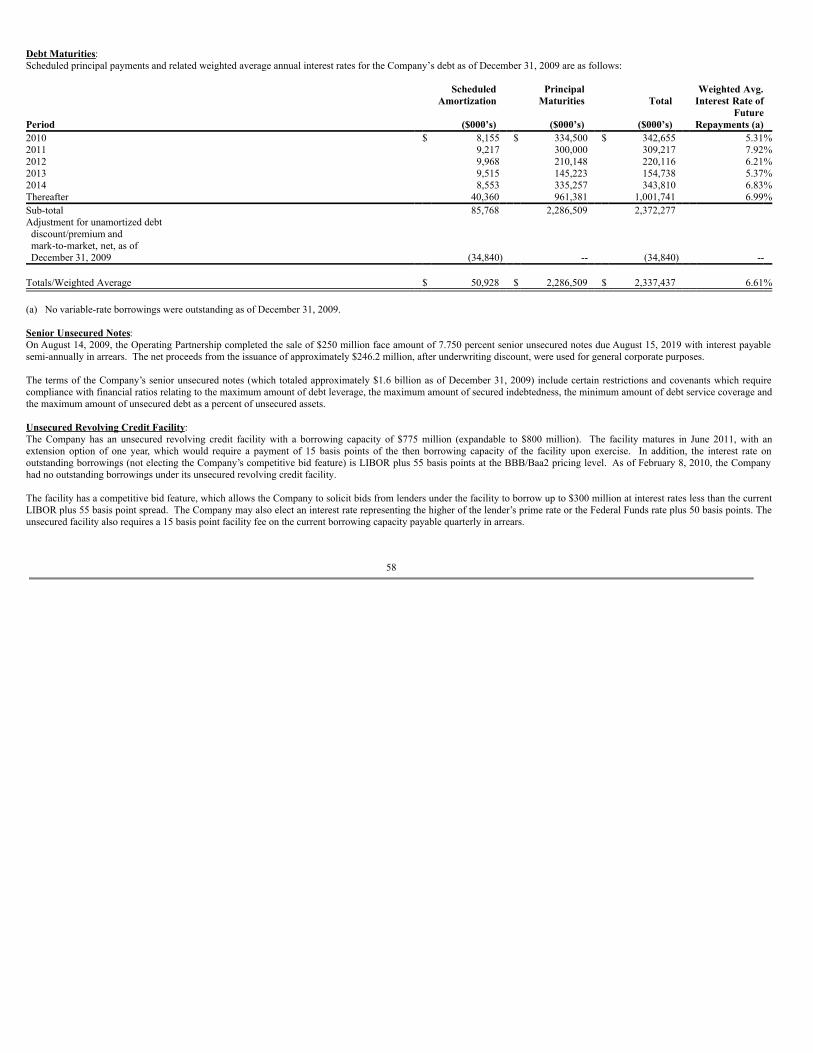
Debt Maturities:Scheduled principal payments and related weighted average annual interest rates for the Company’s debt as of December 31, 2009 are as follows:
Scheduled Principal Weighted Avg. Amortization Maturities Total Interest Rate of
Period ($000’s) ($000’s) ($000’s) Future
Repayments (a) 2010 $ 8,155 $ 334,500 $ 342,655 5.31%2011 9,217 300,000 309,217 7.92%2012 9,968 210,148 220,116 6.21%2013 9,515 145,223 154,738 5.37%2014 8,553 335,257 343,810 6.83%Thereafter 40,360 961,381 1,001,741 6.99%Sub-total 85,768 2,286,509 2,372,277 Adjustment for unamortized debt discount/premium and mark-to-market, net, as of December 31, 2009 (34,840) -- (34,840) -- Totals/Weighted Average $ 50,928 $ 2,286,509 $ 2,337,437 6.61% (a) No variable-rate borrowings were outstanding as of December 31, 2009.
Senior Unsecured Notes:On August 14, 2009, the Operating Partnership completed the sale of $250 million face amount of 7.750 percent senior unsecured notes due August 15, 2019 with interest payablesemi-annually in arrears. The net proceeds from the issuance of approximately $246.2 million, after underwriting discount, were used for general corporate purposes.
The terms of the Company’s senior unsecured notes (which totaled approximately $1.6 billion as of December 31, 2009) include certain restrictions and covenants which requirecompliance with financial ratios relating to the maximum amount of debt leverage, the maximum amount of secured indebtedness, the minimum amount of debt service coverage andthe maximum amount of unsecured debt as a percent of unsecured assets.
Unsecured Revolving Credit Facility:The Company has an unsecured revolving credit facility with a borrowing capacity of $775 million (expandable to $800 million). The facility matures in June 2011, with anextension option of one year, which would require a payment of 15 basis points of the then borrowing capacity of the facility upon exercise. In addition, the interest rate onoutstanding borrowings (not electing the Company’s competitive bid feature) is LIBOR plus 55 basis points at the BBB/Baa2 pricing level. As of February 8, 2010, the Companyhad no outstanding borrowings under its unsecured revolving credit facility.
The facility has a competitive bid feature, which allows the Company to solicit bids from lenders under the facility to borrow up to $300 million at interest rates less than the currentLIBOR plus 55 basis point spread. The Company may also elect an interest rate representing the higher of the lender’s prime rate or the Federal Funds rate plus 50 basis points. Theunsecured facility also requires a 15 basis point facility fee on the current borrowing capacity payable quarterly in arrears.
58
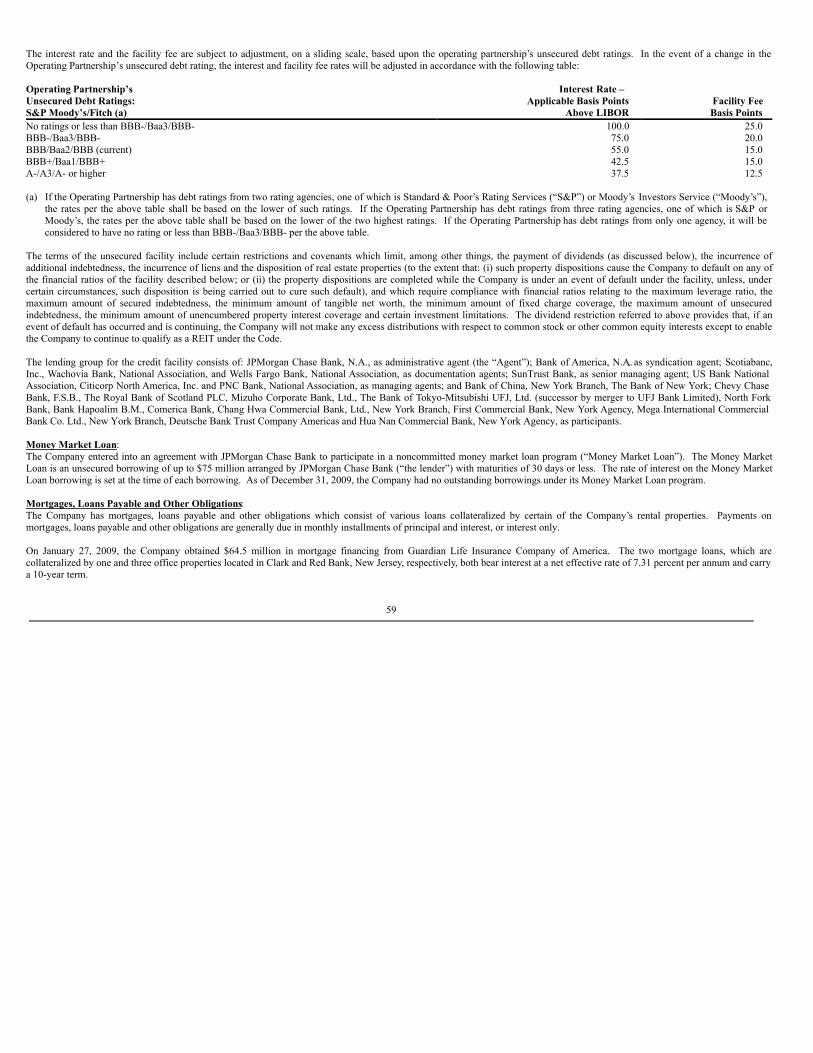
The interest rate and the facility fee are subject to adjustment, on a sliding scale, based upon the operating partnership’s unsecured debt ratings. In the event of a change in theOperating Partnership’s unsecured debt rating, the interest and facility fee rates will be adjusted in accordance with the following table:
Operating Partnership’s Interest Rate – Unsecured Debt Ratings: Applicable Basis Points Facility FeeS&P Moody’s/Fitch (a) Above LIBOR Basis PointsNo ratings or less than BBB-/Baa3/BBB- 100.0 25.0BBB-/Baa3/BBB- 75.0 20.0BBB/Baa2/BBB (current) 55.0 15.0BBB+/Baa1/BBB+ 42.5 15.0A-/A3/A- or higher 37.5 12.5 (a) If the Operating Partnership has debt ratings from two rating agencies, one of which is Standard & Poor’s Rating Services (“S&P”) or Moody’s Investors Service (“Moody’s”),
the rates per the above table shall be based on the lower of such ratings. If the Operating Partnership has debt ratings from three rating agencies, one of which is S&P orMoody’s, the rates per the above table shall be based on the lower of the two highest ratings. If the Operating Partnership has debt ratings from only one agency, it will beconsidered to have no rating or less than BBB-/Baa3/BBB- per the above table.
The terms of the unsecured facility include certain restrictions and covenants which limit, among other things, the payment of dividends (as discussed below), the incurrence ofadditional indebtedness, the incurrence of liens and the disposition of real estate properties (to the extent that: (i) such property dispositions cause the Company to default on any ofthe financial ratios of the facility described below; or (ii) the property dispositions are completed while the Company is under an event of default under the facility, unless, undercertain circumstances, such disposition is being carried out to cure such default), and which require compliance with financial ratios relating to the maximum leverage ratio, themaximum amount of secured indebtedness, the minimum amount of tangible net worth, the minimum amount of fixed charge coverage, the maximum amount of unsecuredindebtedness, the minimum amount of unencumbered property interest coverage and certain investment limitations. The dividend restriction referred to above provides that, if anevent of default has occurred and is continuing, the Company will not make any excess distributions with respect to common stock or other common equity interests except to enablethe Company to continue to qualify as a REIT under the Code.
The lending group for the credit facility consists of: JPMorgan Chase Bank, N.A., as administrative agent (the “Agent”); Bank of America, N.A., as syndication agent; Scotiabanc,Inc., Wachovia Bank, National Association, and Wells Fargo Bank, National Association, as documentation agents; SunTrust Bank, as senior managing agent; US Bank NationalAssociation, Citicorp North America, Inc. and PNC Bank, National Association, as managing agents; and Bank of China, New York Branch, The Bank of New York; Chevy ChaseBank, F.S.B., The Royal Bank of Scotland PLC, Mizuho Corporate Bank, Ltd., The Bank of Tokyo-Mitsubishi UFJ, Ltd. (successor by merger to UFJ Bank Limited), North ForkBank, Bank Hapoalim B.M., Comerica Bank, Chang Hwa Commercial Bank, Ltd., New York Branch, First Commercial Bank, New York Agency, Mega International CommercialBank Co. Ltd., New York Branch, Deutsche Bank Trust Company Americas and Hua Nan Commercial Bank, New York Agency, as participants.
Money Market Loan:The Company entered into an agreement with JPMorgan Chase Bank to participate in a noncommitted money market loan program (“Money Market Loan”). The Money MarketLoan is an unsecured borrowing of up to $75 million arranged by JPMorgan Chase Bank (“the lender”) with maturities of 30 days or less. The rate of interest on the Money MarketLoan borrowing is set at the time of each borrowing. As of December 31, 2009, the Company had no outstanding borrowings under its Money Market Loan program.
Mortgages, Loans Payable and Other Obligations:The Company has mortgages, loans payable and other obligations which consist of various loans collateralized by certain of the Company’s rental properties. Payments onmortgages, loans payable and other obligations are generally due in monthly installments of principal and interest, or interest only.
On January 27, 2009, the Company obtained $64.5 million in mortgage financing from Guardian Life Insurance Company of America. The two mortgage loans, which arecollateralized by one and three office properties located in Clark and Red Bank, New Jersey, respectively, both bear interest at a net effective rate of 7.31 percent per annum and carrya 10-year term.
59
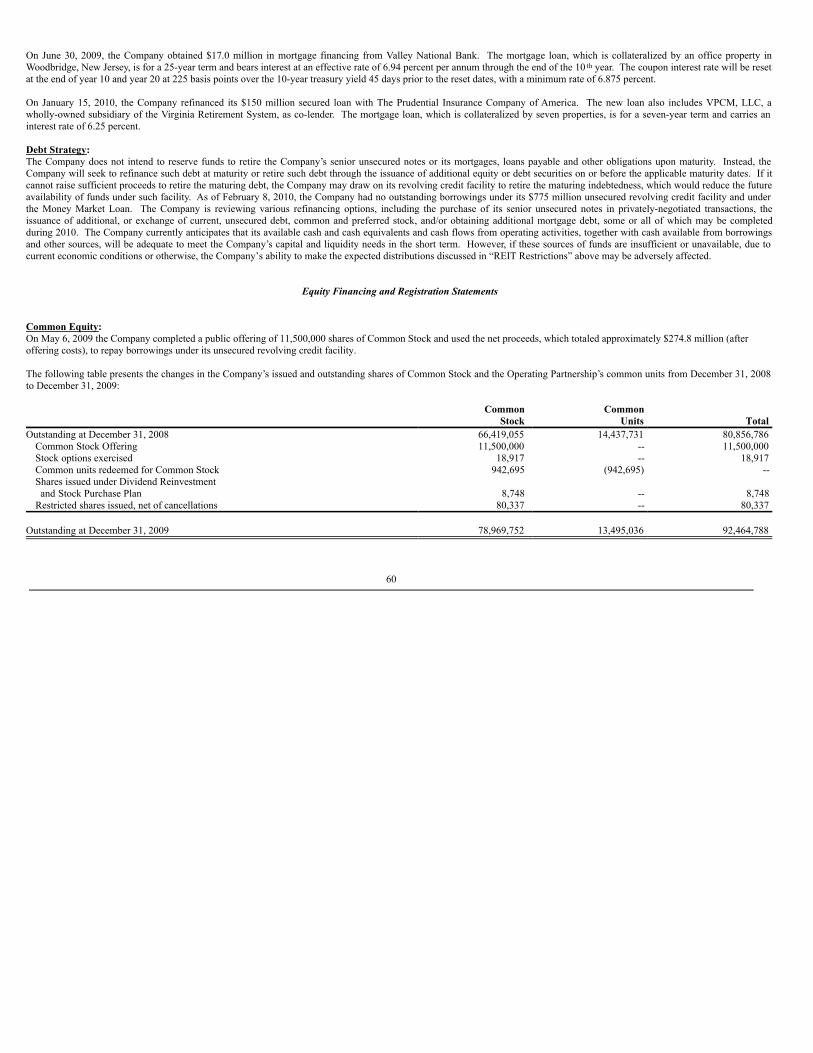
On June 30, 2009, the Company obtained $17.0 million in mortgage financing from Valley National Bank. The mortgage loan, which is collateralized by an office property inWoodbridge, New Jersey, is for a 25-year term and bears interest at an effective rate of 6.94 percent per annum through the end of the 10 th year. The coupon interest rate will be resetat the end of year 10 and year 20 at 225 basis points over the 10-year treasury yield 45 days prior to the reset dates, with a minimum rate of 6.875 percent.
On January 15, 2010, the Company refinanced its $150 million secured loan with The Prudential Insurance Company of America. The new loan also includes VPCM, LLC, awholly-owned subsidiary of the Virginia Retirement System, as co-lender. The mortgage loan, which is collateralized by seven properties, is for a seven-year term and carries aninterest rate of 6.25 percent.
Debt Strategy:The Company does not intend to reserve funds to retire the Company’s senior unsecured notes or its mortgages, loans payable and other obligations upon maturity. Instead, theCompany will seek to refinance such debt at maturity or retire such debt through the issuance of additional equity or debt securities on or before the applicable maturity dates. If itcannot raise sufficient proceeds to retire the maturing debt, the Company may draw on its revolving credit facility to retire the maturing indebtedness, which would reduce the futureavailability of funds under such facility. As of February 8, 2010, the Company had no outstanding borrowings under its $775 million unsecured revolving credit facility and underthe Money Market Loan. The Company is reviewing various refinancing options, including the purchase of its senior unsecured notes in privately-negotiated transactions, theissuance of additional, or exchange of current, unsecured debt, common and preferred stock, and/or obtaining additional mortgage debt, some or all of which may be completedduring 2010. The Company currently anticipates that its available cash and cash equivalents and cash flows from operating activities, together with cash available from borrowingsand other sources, will be adequate to meet the Company’s capital and liquidity needs in the short term. However, if these sources of funds are insufficient or unavailable, due tocurrent economic conditions or otherwise, the Company’s ability to make the expected distributions discussed in “REIT Restrictions” above may be adversely affected.
Equity Financing and Registration Statements
Common Equity:On May 6, 2009 the Company completed a public offering of 11,500,000 shares of Common Stock and used the net proceeds, which totaled approximately $274.8 million (afteroffering costs), to repay borrowings under its unsecured revolving credit facility.
The following table presents the changes in the Company’s issued and outstanding shares of Common Stock and the Operating Partnership’s common units from December 31, 2008to December 31, 2009:
Common Common Stock Units TotalOutstanding at December 31, 2008 66,419,055 14,437,731 80,856,786
Common Stock Offering 11,500,000 -- 11,500,000Stock options exercised 18,917 -- 18,917Common units redeemed for Common Stock 942,695 (942,695) --Shares issued under Dividend Reinvestment and Stock Purchase Plan 8,748 -- 8,748Restricted shares issued, net of cancellations 80,337 -- 80,337
Outstanding at December 31, 2009 78,969,752 13,495,036 92,464,788
60
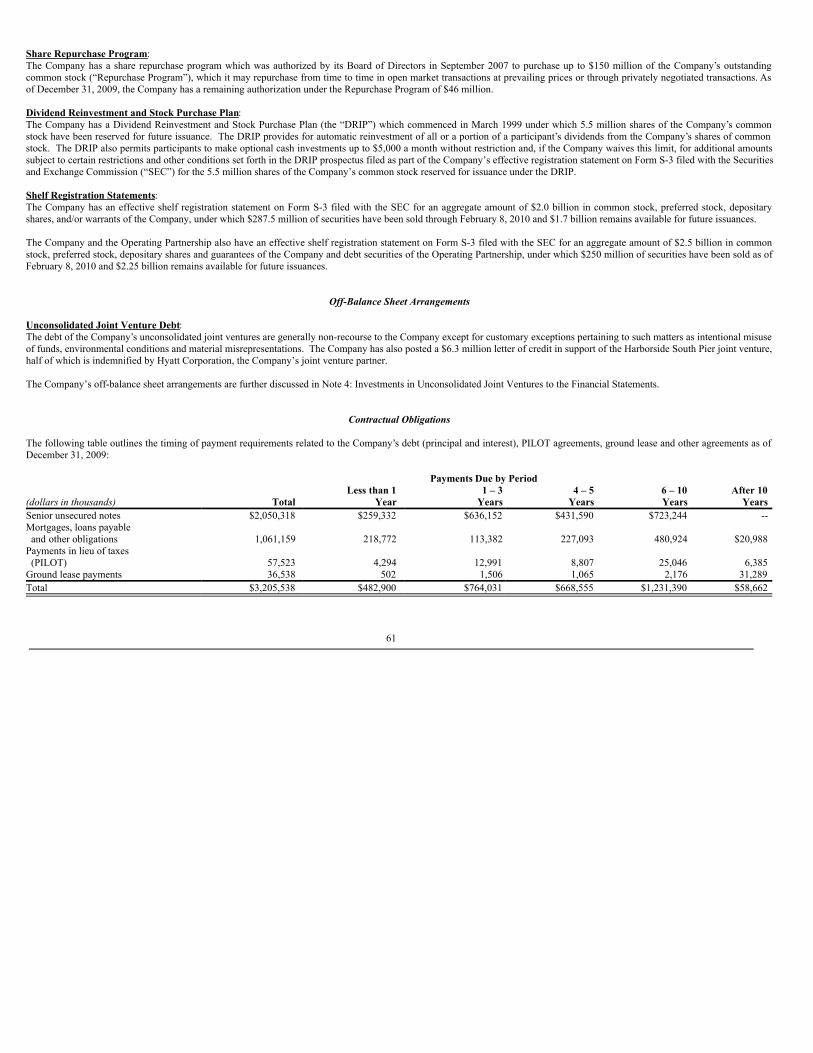
Share Repurchase Program:The Company has a share repurchase program which was authorized by its Board of Directors in September 2007 to purchase up to $150 million of the Company’s outstandingcommon stock (“Repurchase Program”), which it may repurchase from time to time in open market transactions at prevailing prices or through privately negotiated transactions. Asof December 31, 2009, the Company has a remaining authorization under the Repurchase Program of $46 million.
Dividend Reinvestment and Stock Purchase Plan:The Company has a Dividend Reinvestment and Stock Purchase Plan (the “DRIP”) which commenced in March 1999 under which 5.5 million shares of the Company’s commonstock have been reserved for future issuance. The DRIP provides for automatic reinvestment of all or a portion of a participant’s dividends from the Company’s shares of commonstock. The DRIP also permits participants to make optional cash investments up to $5,000 a month without restriction and, if the Company waives this limit, for additional amountssubject to certain restrictions and other conditions set forth in the DRIP prospectus filed as part of the Company’s effective registration statement on Form S-3 filed with the Securitiesand Exchange Commission (“SEC”) for the 5.5 million shares of the Company’s common stock reserved for issuance under the DRIP.
Shelf Registration Statements:The Company has an effective shelf registration statement on Form S-3 filed with the SEC for an aggregate amount of $2.0 billion in common stock, preferred stock, depositaryshares, and/or warrants of the Company, under which $287.5 million of securities have been sold through February 8, 2010 and $1.7 billion remains available for future issuances. The Company and the Operating Partnership also have an effective shelf registration statement on Form S-3 filed with the SEC for an aggregate amount of $2.5 billion in commonstock, preferred stock, depositary shares and guarantees of the Company and debt securities of the Operating Partnership, under which $250 million of securities have been sold as ofFebruary 8, 2010 and $2.25 billion remains available for future issuances.
Off-Balance Sheet Arrangements
Unconsolidated Joint Venture Debt:The debt of the Company’s unconsolidated joint ventures are generally non-recourse to the Company except for customary exceptions pertaining to such matters as intentional misuseof funds, environmental conditions and material misrepresentations. The Company has also posted a $6.3 million letter of credit in support of the Harborside South Pier joint venture,half of which is indemnified by Hyatt Corporation, the Company’s joint venture partner.
The Company’s off-balance sheet arrangements are further discussed in Note 4: Investments in Unconsolidated Joint Ventures to the Financial Statements.
Contractual Obligations
The following table outlines the timing of payment requirements related to the Company’s debt (principal and interest), PILOT agreements, ground lease and other agreements as ofDecember 31, 2009:
Payments Due by Period Less than 1 1 – 3 4 – 5 6 – 10 After 10(dollars in thousands) Total Year Years Years Years YearsSenior unsecured notes $2,050,318 $259,332 $636,152 $431,590 $723,244 --Mortgages, loans payable and other obligations 1,061,159 218,772 113,382 227,093 480,924 $20,988Payments in lieu of taxes (PILOT) 57,523 4,294 12,991 8,807 25,046 6,385Ground lease payments 36,538 502 1,506 1,065 2,176 31,289Total $3,205,538 $482,900 $764,031 $668,555 $1,231,390 $58,662
61
Inflation
The Company’s leases with the majority of its tenants provide for recoveries and escalation charges based upon the tenant’s proportionate share of, and/or increases in, real estatetaxes and certain operating costs, which reduce the Company’s exposure to increases in operating costs resulting from inflation.
DISCLOSURE REGARDING FORWARD-LOOKING STATEMENTS
We consider portions of this information, including the documents incorporated by reference, to be forward-looking statements within the meaning of Section 21E of the SecuritiesExchange Act of 1934, as amended. We intend such forward-looking statements to be covered by the safe harbor provisions for forward-looking statements contained in Section 21Eof such act. Such forward-looking statements relate to, without limitation, our future economic performance, plans and objectives for future operations and projections of revenueand other financial items. Forward-looking statements can be identified by the use of words such as “may,” “will,” “plan,” “should,” “expect,” “anticipate,” “estimate,” “continue” orcomparable terminology. Forward-looking statements are inherently subject to risks and uncertainties, many of which we cannot predict with accuracy and some of which we mightnot even anticipate. Although we believe that the expectations reflected in such forward-looking statements are based upon reasonable assumptions at the time made, we can give noassurance that such expectations will be achieved. Future events and actual results, financial and otherwise, may differ materially from the results discussed in the forward-lookingstatements. Readers are cautioned not to place undue reliance on these forward-looking statements.
Among the factors about which we have made assumptions are:
· risks and uncertainties affecting the general economic climate and conditions, including the impact of the general economic recession as it impacts the national and localeconomies, which in turn may have a negative effect on the fundamentals of our business and the financial condition of our tenants;
· the value of our real estate assets, which may limit our ability to dispose of assets at attractive prices or obtain or maintain debt financing secured by our properties or onan unsecured basis;
· the extent of any tenant bankruptcies or of any early lease terminations;· our ability to lease or re-lease space at current or anticipated rents;· changes in the supply of and demand for office, office/flex and industrial/warehouse properties;· changes in interest rate levels and volatility in the security markets;· changes in operating costs;· our ability to obtain adequate insurance, including coverage for terrorist acts;· the availability of financing on attractive terms or at all, which may adversely impact our ability to pursue acquisition and development opportunities and refinance
existing debt and our future interest expense;· changes in governmental regulation, tax rates and similar matters; and· other risks associated with the development and acquisition of properties, including risks that the development may not be completed on schedule, that the tenants will not
take occupancy or pay rent, or that development or operating costs may be greater than anticipated.
For further information on factors which could impact us and the statements contained herein, see Item 1A: Risk Factors. We assume no obligation to update and supplementforward-looking statements that become untrue because of subsequent events, new information or otherwise.
ITEM 7A.QUANTITATIVE AND QUALITATIVE DISCLOSURES ABOUT MARKET RISK
Market risk is the exposure to loss resulting from changes in interest rates, foreign currency exchange rates, commodity prices and equity prices. In pursuing its business plan, theprimary market risk to which the Company is exposed is interest rate risk. Changes in the general level of interest rates prevailing in the financial markets may affect the spreadbetween the Company’s yield on invested assets and cost of funds and, in turn, its ability to make distributions or payments to its investors.
62
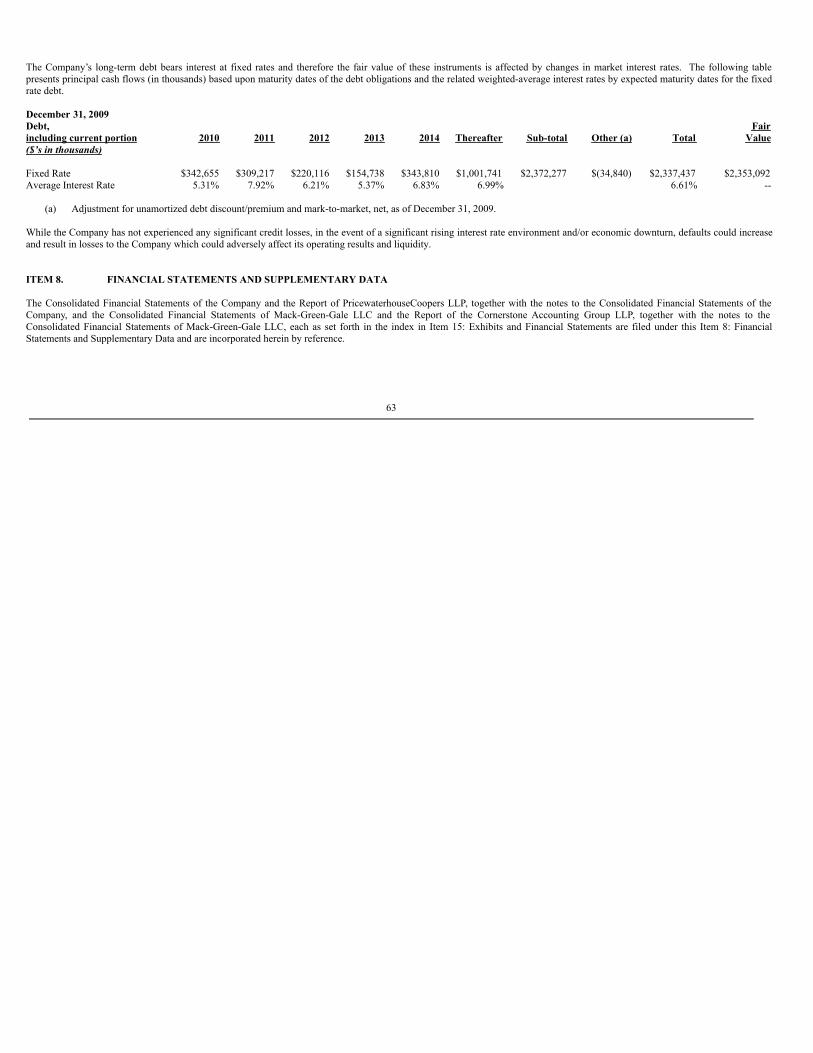
The Company’s long-term debt bears interest at fixed rates and therefore the fair value of these instruments is affected by changes in market interest rates. The following tablepresents principal cash flows (in thousands) based upon maturity dates of the debt obligations and the related weighted-average interest rates by expected maturity dates for the fixedrate debt.
December 31, 2009 Debt, Fairincluding current portion($’s in thousands)
2010 2011 2012 2013 2014 Thereafter Sub-total Other (a) Total Value
Fixed Rate $342,655 $309,217 $220,116 $154,738 $343,810 $1,001,741 $2,372,277 $(34,840) $2,337,437 $2,353,092Average Interest Rate 5.31% 7.92% 6.21% 5.37% 6.83% 6.99% 6.61% --
(a) Adjustment for unamortized debt discount/premium and mark-to-market, net, as of December 31, 2009.
While the Company has not experienced any significant credit losses, in the event of a significant rising interest rate environment and/or economic downturn, defaults could increaseand result in losses to the Company which could adversely affect its operating results and liquidity.
ITEM 8. FINANCIAL STATEMENTS AND SUPPLEMENTARY DATA
The Consolidated Financial Statements of the Company and the Report of PricewaterhouseCoopers LLP, together with the notes to the Consolidated Financial Statements of theCompany, and the Consolidated Financial Statements of Mack-Green-Gale LLC and the Report of the Cornerstone Accounting Group LLP, together with the notes to theConsolidated Financial Statements of Mack-Green-Gale LLC, each as set forth in the index in Item 15: Exhibits and Financial Statements are filed under this Item 8: FinancialStatements and Supplementary Data and are incorporated herein by reference.
63
ITEM 9. CHANGES IN AND DISAGREEMENTS WITH ACCOUNTANTS ON ACCOUNTINGAND FINANCIAL DISCLOSURE
None.
ITEM 9A. CONTROLS AND PROCEDURES
Disclosure Controls and Procedures. The Company’s management, with the participation of the Company’s chief executive officer and chief financial officer, has evaluated theeffectiveness of the Company’s disclosure controls and procedures (as such term is defined in Rules 13a-15(e) and 15d-15(e) under the Securities Exchange Act of 1934, as amended(the “Exchange Act”)) as of the end of the period covered by this report. Based on such evaluation, the Company’s chief executive officer and chief financial officer have concludedthat, as of the end of such period, the Company’s disclosure controls and procedures were effective in recording, processing, summarizing and reporting, on a timely basis,information required to be disclosed by the Company in the reports that it files or submits under the Exchange Act.
Management’s Report on Internal Control Over Financial Reporting. Internal control over financial reporting, as such term is defined in Rules 13a-15(f) and 15d-15(f) under theExchange Act, is a process designed by, or under the supervision of, the Company’s chief executive officer and chief financial officer, or persons performing similar functions, andeffected by the Company’s board of directors, management and other personnel, to provide reasonable assurance regarding the reliability of financial reporting and the preparation offinancial statements for external purposes in accordance with generally accepted accounting principles. The Company’s management, with the participation of the Company’s chiefexecutive officer and chief financial officer, has established and maintained policies and procedures designed to maintain the adequacy of the Company’s internal control overfinancial reporting, and includes those policies and procedures that:
(1) Pertain to the maintenance of records that in reasonable detail accurately and fairly reflect the transactions and dispositions of the assets of the Company; (2) Provide reasonable assurance that transactions are recorded as necessary to permit preparation of financial statements in accordance with generally accepted
accounting principles, and that receipts and expenditures of the Company are being made only in accordance with authorizations of management and directors of theCompany; and
(3) Provide reasonable assurance regarding prevention or timely detection of unauthorized acquisition, use or disposition of the Company’s assets that could have amaterial effect on the financial statements.
The Company’s management has evaluated the effectiveness of the Company’s internal control over financial reporting as of December 31, 2009 based on the criteria established in areport entitled Internal Control—Integrated Framework, issued by the Committee of Sponsoring Organizations of the Treadway Commission (COSO). Based on our assessment andthose criteria, the Company’s management has concluded that the Company’s internal control over financial reporting was effective as of December 31, 2009.
Because of its inherent limitations, internal control over financial reporting may not prevent or detect misstatements. Also, projections of any evaluation of effectiveness to futureperiods are subject to the risk that controls may become inadequate because of changes in conditions, or that the degree or compliance with the policies or procedures may deteriorate.
The effectiveness of the Company’s internal control over financial reporting as of December 31, 2009 has been audited by PricewaterhouseCoopers LLP, an independent registeredpublic accounting firm, as stated in their report which appears herein.
Changes In Internal Control Over Financial Reporting. There have not been any changes in the Company’s internal control over financial reporting (as such term is defined in Rules13a-15(f) and 15d-15(f) under the Exchange Act) during the fourth fiscal quarter to which this report relates that have materially affected, or are reasonably likely to materially affect,the Company’s internal control over financial reporting.
64
ITEM 9B. OTHER INFORMATION
Not Applicable.
PART III
ITEM 10. DIRECTORS, EXECUTIVE OFFICERS AND CORPORATE GOVERNANCE
The information required by Item 10 will be set forth in the Company’s definitive proxy statement for its annual meeting of shareholders expected to be held on May 25, 2010, and isincorporated herein by reference.
ITEM 11. EXECUTIVE COMPENSATION
The information required by Item 11 will be set forth in the Company’s definitive proxy statement for its annual meeting of shareholders expected to be held on May 25, 2010, and isincorporated herein by reference.
ITEM 12. SECURITY OWNERSHIP OF CERTAIN BENEFICIAL OWNERS AND MANAGEMENT AND RELATED STOCKHOLDER MATTERS
The information required by Item 12 will be set forth in the Company’s definitive proxy statement for its annual meeting of shareholders expected to be held on May 25, 2010, and isincorporated herein by reference.
ITEM 13. CERTAIN RELATIONSHIPS AND RELATED TRANSACTIONS, AND DIRECTOR INDEPENDENCE
The information required by Item 13 will be set forth in the Company’s definitive proxy statement for its annual meeting of shareholders expected to be held on May 25, 2010, and isincorporated herein by reference.
ITEM 14. PRINCIPAL ACCOUNTING FEES AND SERVICES
The information required by Item 14 will be set forth in the Company’s definitive proxy statement for its annual meeting of shareholders expected to be held on May 25, 2010, and isincorporated herein by reference.
65
PART IV
ITEM 15. EXHIBITS AND FINANCIAL STATEMENT SCHEDULES
(a) 1. All Financial Statements
Report of Independent Registered Public Accounting Firm
Consolidated Balance Sheets as of December 31, 2009 and 2008
Consolidated Statements of Operations for the Years Ended December 31, 2009, 2008 and 2007
Consolidated Statements of Changes in Equity for the Years Ended December 31, 2009, 2008 and 2007
Consolidated Statements of Cash Flows for the Years Ended December 31, 2009, 2008 and 2007
Notes to Consolidated Financial Statements (a) 2. Financial Statement Schedules
(i) Mack-Cali Realty Corporation:
Schedule III – Real Estate Investments and Accumulated Depreciation as of December 31, 2009
All other schedules are omitted because they are not required or the required information is shown in the financial statements or notes thereto.
(ii) Mack-Green-Gale LLC:
Mack-Green-Gale LLC met the conditions of a significant subsidiary under Rule 1-02(w) of Regulation S-X for the fiscal year ended December 31, 2008 and wasconsolidated by the Company as of April 29, 2009. The following financial statements of Mack-Green-Gale LLC for the periods indicated are being filed pursuant toRule 3-09 of Regulation S-X.
Mack-Green-Gale LLC and Subsidiaries Consolidated Balance Sheets at December 31, 2008 and 2007 and Consolidated Statements of Operations, Changes inMembers' Capital and Cash Flows for the years ended December 31, 2008 and 2007 and for the period from May 9, 2006 (Commencement of Operations) throughDecember 31, 2006, including the report of independent registered public accounting firm (filed as Exhibit 99.1 to this Annual Report on Form 10-K)
Mack-Green-Gale LLC and Subsidiaries Consolidated Balance Sheet at April 28, 2009 and Consolidated Statements of Operations, Changes in Members' Capital andCash Flows for the period January 1, 2009 through April 28, 2009 (Date of Consolidation) (unaudited) (filed as Exhibit 99.2 to this Annual Report on Form 10-K)
All other schedules are omitted because they are not required or the required information is shown in the financial statements or notes thereto.
(a) 3. ExhibitsThe exhibits required by this item are set forth on the Exhibit Index attached hereto.
66
REPORT OF INDEPENDENT REGISTERED PUBLIC ACCOUNTING FIRM
To Board of Directors and Shareholdersof Mack-Cali Realty Corporation:
In our opinion, the consolidated financial statements listed in the index appearing under Item 15(a)(1) present fairly, in all material respects, the financial position of Mack-CaliRealty Corporation and its subsidiaries (collectively, the "Company") at December 31, 2009 and 2008, and the results of their operations and their cash flows for each of the threeyears in the period ended December 31, 2009 in conformity with accounting principles generally accepted in the United States of America. In addition, in our opinion, the financialstatement schedule listed in the index appearing under Item 15(a)(2) presents fairly, in all material respects, the information set forth therein when read in conjunction with the relatedconsolidated financial statements. Also in our opinion, the Company maintained, in all material respects, effective internal control over financial reporting as of December 31, 2009,based on criteria established in Internal Control - Integrated Framework issued by the Committee of Sponsoring Organizations of the Treadway Commission (COSO). TheCompany's management is responsible for these financial statements and financial statement schedule, for maintaining effective internal control over financial reporting and for itsassessment of the effectiveness of internal control over financial reporting, included in Management's Report on Internal Controls Over Financial Reporting appearing under Item9A. Our responsibility is to express opinions on these financial statements, on the financial statement schedule, and on the Company's internal control over financial reporting basedon our integrated audits. We conducted our audits in accordance with the standards of the Public Company Accounting Oversight Board (United States). Those standards require thatwe plan and perform the audits to obtain reasonable assurance about whether the financial statements are free of material misstatement and whether effective internal control overfinancial reporting was maintained in all material respects. Our audits of the financial statements included examining, on a test basis, evidence supporting the amounts and disclosuresin the financial statements, assessing the accounting principles used and significant estimates made by management, and evaluating the overall financial statement presentation. Ouraudit of internal control over financial reporting included obtaining an understanding of internal control over financial reporting, assessing the risk that a material weakness exists,and testing and evaluating the design and operating effectiveness of internal control based on the assessed risk. Our audits also included performing such other procedures as weconsidered necessary in the circumstances. We believe that our audits provide a reasonable basis for our opinions.
As discussed in Note 16 to the consolidated financial statements, the Company changed the manner in which it accounts for noncontrolling interests in subsidiaries in 2009.
A company’s internal control over financial reporting is a process designed to provide reasonable assurance regarding the reliability of financial reporting and the preparation offinancial statements for external purposes in accordance with generally accepted accounting principles. A company’s internal control over financial reporting includes those policiesand procedures that (i) pertain to the maintenance of records that, in reasonable detail, accurately and fairly reflect the transactions and dispositions of the assets of the company;(ii) provide reasonable assurance that transactions are recorded as necessary to permit preparation of financial statements in accordance with generally accepted accounting principles,and that receipts and expenditures of the company are being made only in accordance with authorizations of management and directors of the company; and (iii) provide reasonableassurance regarding prevention or timely detection of unauthorized acquisition, use, or disposition of the company’s assets that could have a material effect on the financialstatements.
Because of its inherent limitations, internal control over financial reporting may not prevent or detect misstatements. Also, projections of any evaluation of effectiveness to futureperiods are subject to the risk that controls may become inadequate because of changes in conditions, or that the degree of compliance with the policies or procedures may deteriorate.
/s/ PricewaterhouseCoopers LLPNew York, New YorkFebruary 10, 2010
67
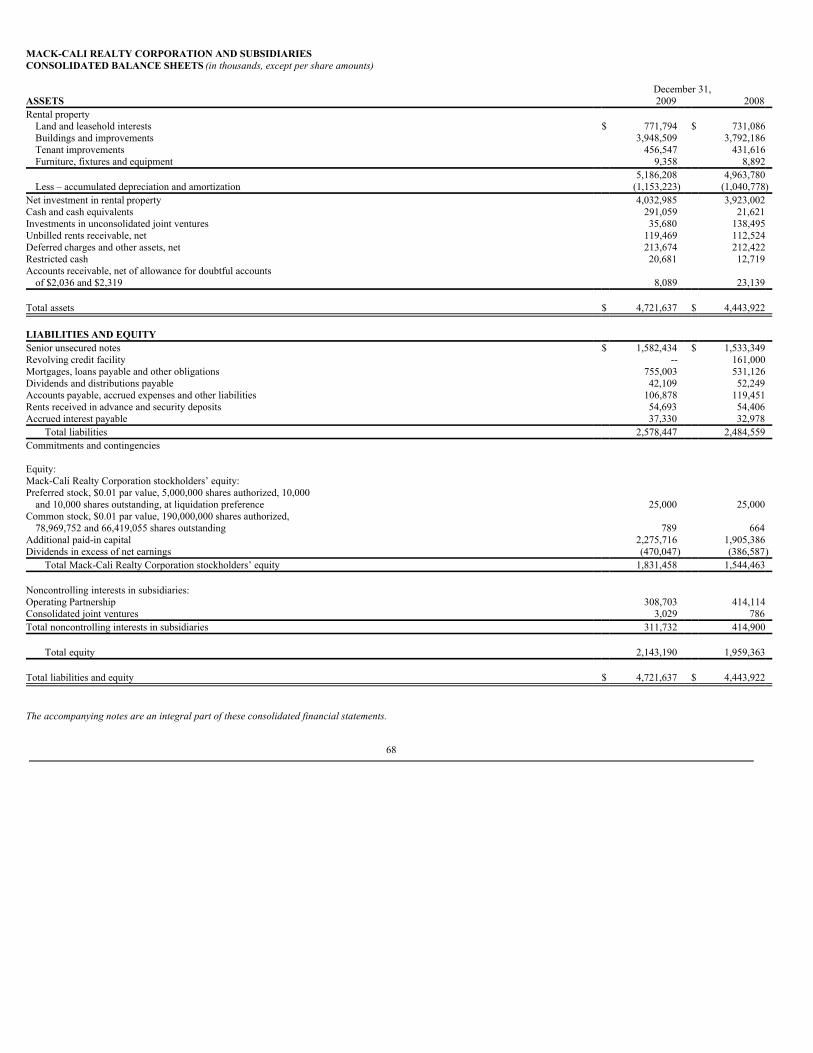
MACK-CALI REALTY CORPORATION AND SUBSIDIARIESCONSOLIDATED BALANCE SHEETS (in thousands, except per share amounts)
December 31, ASSETS 2009 2008 Rental property
Land and leasehold interests $ 771,794 $ 731,086 Buildings and improvements 3,948,509 3,792,186 Tenant improvements 456,547 431,616 Furniture, fixtures and equipment 9,358 8,892
5,186,208 4,963,780 Less – accumulated depreciation and amortization (1,153,223) (1,040,778)
Net investment in rental property 4,032,985 3,923,002 Cash and cash equivalents 291,059 21,621 Investments in unconsolidated joint ventures 35,680 138,495 Unbilled rents receivable, net 119,469 112,524 Deferred charges and other assets, net 213,674 212,422 Restricted cash 20,681 12,719 Accounts receivable, net of allowance for doubtful accounts
of $2,036 and $2,319 8,089 23,139 Total assets $ 4,721,637 $ 4,443,922 LIABILITIES AND EQUITY Senior unsecured notes $ 1,582,434 $ 1,533,349 Revolving credit facility -- 161,000 Mortgages, loans payable and other obligations 755,003 531,126 Dividends and distributions payable 42,109 52,249 Accounts payable, accrued expenses and other liabilities 106,878 119,451 Rents received in advance and security deposits 54,693 54,406 Accrued interest payable 37,330 32,978
Total liabilities 2,578,447 2,484,559 Commitments and contingencies Equity: Mack-Cali Realty Corporation stockholders’ equity: Preferred stock, $0.01 par value, 5,000,000 shares authorized, 10,000
and 10,000 shares outstanding, at liquidation preference 25,000 25,000 Common stock, $0.01 par value, 190,000,000 shares authorized,
78,969,752 and 66,419,055 shares outstanding 789 664 Additional paid-in capital 2,275,716 1,905,386 Dividends in excess of net earnings (470,047) (386,587)
Total Mack-Cali Realty Corporation stockholders’ equity 1,831,458 1,544,463 Noncontrolling interests in subsidiaries: Operating Partnership 308,703 414,114 Consolidated joint ventures 3,029 786 Total noncontrolling interests in subsidiaries 311,732 414,900
Total equity 2,143,190 1,959,363 Total liabilities and equity $ 4,721,637 $ 4,443,922 The accompanying notes are an integral part of these consolidated financial statements.
68
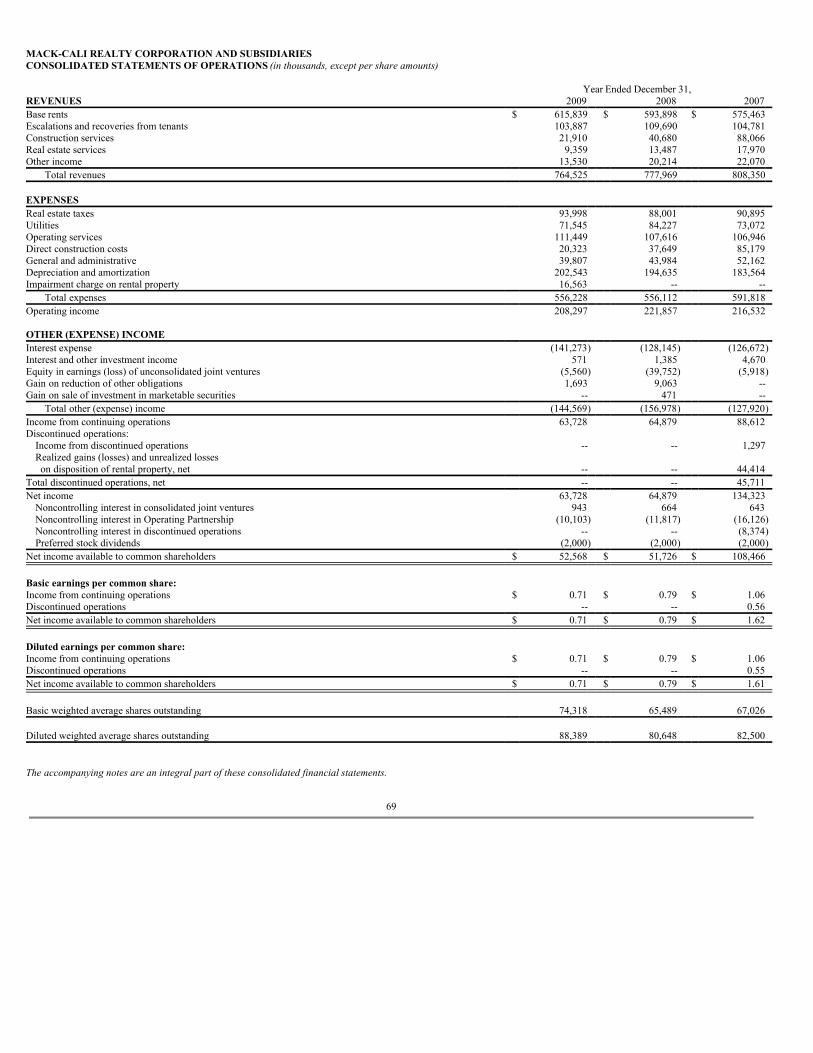
MACK-CALI REALTY CORPORATION AND SUBSIDIARIESCONSOLIDATED STATEMENTS OF OPERATIONS (in thousands, except per share amounts)
Year Ended December 31, REVENUES 2009 2008 2007 Base rents $ 615,839 $ 593,898 $ 575,463 Escalations and recoveries from tenants 103,887 109,690 104,781 Construction services 21,910 40,680 88,066 Real estate services 9,359 13,487 17,970 Other income 13,530 20,214 22,070
Total revenues 764,525 777,969 808,350 EXPENSES Real estate taxes 93,998 88,001 90,895 Utilities 71,545 84,227 73,072 Operating services 111,449 107,616 106,946 Direct construction costs 20,323 37,649 85,179 General and administrative 39,807 43,984 52,162 Depreciation and amortization 202,543 194,635 183,564 Impairment charge on rental property 16,563 -- --
Total expenses 556,228 556,112 591,818 Operating income 208,297 221,857 216,532 OTHER (EXPENSE) INCOME Interest expense (141,273) (128,145) (126,672)Interest and other investment income 571 1,385 4,670 Equity in earnings (loss) of unconsolidated joint ventures (5,560) (39,752) (5,918)Gain on reduction of other obligations 1,693 9,063 -- Gain on sale of investment in marketable securities -- 471 --
Total other (expense) income (144,569) (156,978) (127,920)Income from continuing operations 63,728 64,879 88,612 Discontinued operations:
Income from discontinued operations -- -- 1,297 Realized gains (losses) and unrealized losses on disposition of rental property, net -- -- 44,414
Total discontinued operations, net -- -- 45,711 Net income 63,728 64,879 134,323
Noncontrolling interest in consolidated joint ventures 943 664 643 Noncontrolling interest in Operating Partnership (10,103) (11,817) (16,126)Noncontrolling interest in discontinued operations -- -- (8,374)Preferred stock dividends (2,000) (2,000) (2,000)
Net income available to common shareholders $ 52,568 $ 51,726 $ 108,466 Basic earnings per common share: Income from continuing operations $ 0.71 $ 0.79 $ 1.06 Discontinued operations -- -- 0.56 Net income available to common shareholders $ 0.71 $ 0.79 $ 1.62 Diluted earnings per common share: Income from continuing operations $ 0.71 $ 0.79 $ 1.06 Discontinued operations -- -- 0.55 Net income available to common shareholders $ 0.71 $ 0.79 $ 1.61 Basic weighted average shares outstanding 74,318 65,489 67,026 Diluted weighted average shares outstanding 88,389 80,648 82,500 The accompanying notes are an integral part of these consolidated financial statements.
69
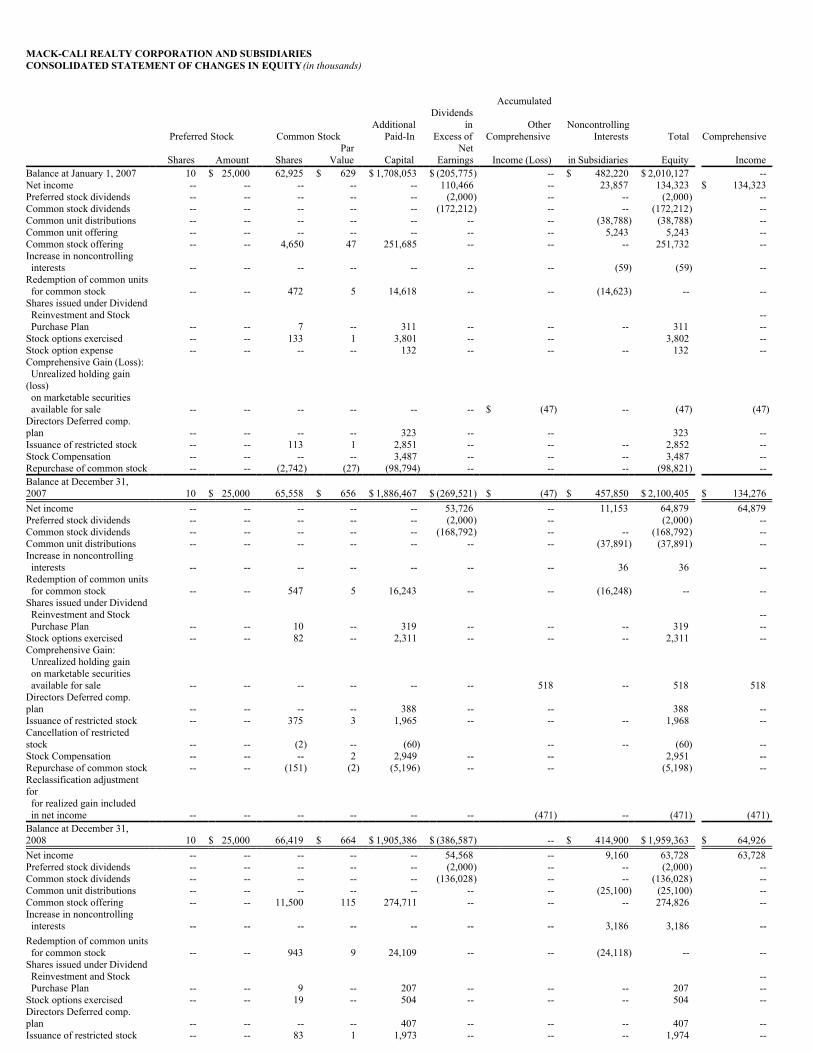
MACK-CALI REALTY CORPORATION AND SUBSIDIARIESCONSOLIDATED STATEMENT OF CHANGES IN EQUITY (in thousands)
Accumulated
Additional Dividends
in Other Noncontrolling Preferred Stock Common Stock Paid-In Excess of Comprehensive Interests Total Comprehensive
Shares Amount Shares Par
Value Capital Net
Earnings Income (Loss) in Subsidiaries Equity Income Balance at January 1, 2007 10 $ 25,000 62,925 $ 629 $ 1,708,053 $ (205,775) -- $ 482,220 $ 2,010,127 -- Net income -- -- -- -- -- 110,466 -- 23,857 134,323 $ 134,323 Preferred stock dividends -- -- -- -- -- (2,000) -- -- (2,000) -- Common stock dividends -- -- -- -- -- (172,212) -- -- (172,212) -- Common unit distributions -- -- -- -- -- -- -- (38,788) (38,788) -- Common unit offering -- -- -- -- -- -- -- 5,243 5,243 -- Common stock offering -- -- 4,650 47 251,685 -- -- -- 251,732 -- Increase in noncontrolling interests -- -- -- -- -- -- -- (59) (59) -- Redemption of common units for common stock -- -- 472 5 14,618 -- -- (14,623) -- -- Shares issued under Dividend Reinvestment and Stock -- Purchase Plan -- -- 7 -- 311 -- -- -- 311 -- Stock options exercised -- -- 133 1 3,801 -- -- 3,802 -- Stock option expense -- -- -- -- 132 -- -- -- 132 -- Comprehensive Gain (Loss): Unrealized holding gain(loss) on marketable securities available for sale -- -- -- -- -- -- $ (47) -- (47) (47)Directors Deferred comp.plan -- -- -- -- 323 -- -- 323 -- Issuance of restricted stock -- -- 113 1 2,851 -- -- -- 2,852 -- Stock Compensation -- -- -- -- 3,487 -- -- -- 3,487 -- Repurchase of common stock -- -- (2,742) (27) (98,794) -- -- -- (98,821) -- Balance at December 31,2007 10 $ 25,000 65,558 $ 656 $ 1,886,467 $ (269,521) $ (47) $ 457,850 $ 2,100,405 $ 134,276 Net income -- -- -- -- -- 53,726 -- 11,153 64,879 64,879 Preferred stock dividends -- -- -- -- -- (2,000) -- (2,000) -- Common stock dividends -- -- -- -- -- (168,792) -- -- (168,792) -- Common unit distributions -- -- -- -- -- -- -- (37,891) (37,891) -- Increase in noncontrolling interests -- -- -- -- -- -- -- 36 36 -- Redemption of common units for common stock -- -- 547 5 16,243 -- -- (16,248) -- -- Shares issued under Dividend Reinvestment and Stock -- Purchase Plan -- -- 10 -- 319 -- -- -- 319 -- Stock options exercised -- -- 82 -- 2,311 -- -- -- 2,311 -- Comprehensive Gain: Unrealized holding gain on marketable securities available for sale -- -- -- -- -- -- 518 -- 518 518 Directors Deferred comp.plan -- -- -- -- 388 -- -- 388 -- Issuance of restricted stock -- -- 375 3 1,965 -- -- -- 1,968 -- Cancellation of restrictedstock -- -- (2) -- (60) -- -- (60) -- Stock Compensation -- -- -- 2 2,949 -- -- 2,951 -- Repurchase of common stock -- -- (151) (2) (5,196) -- -- (5,198) -- Reclassification adjustmentfor for realized gain included in net income -- -- -- -- -- -- (471) -- (471) (471)Balance at December 31,2008 10 $ 25,000 66,419 $ 664 $ 1,905,386 $ (386,587) -- $ 414,900 $ 1,959,363 $ 64,926 Net income -- -- -- -- -- 54,568 -- 9,160 63,728 63,728 Preferred stock dividends -- -- -- -- -- (2,000) -- -- (2,000) -- Common stock dividends -- -- -- -- -- (136,028) -- -- (136,028) -- Common unit distributions -- -- -- -- -- -- -- (25,100) (25,100) -- Common stock offering -- -- 11,500 115 274,711 -- -- -- 274,826 -- Increase in noncontrolling interests -- -- -- -- -- -- -- 3,186 3,186 -- Redemption of common units for common stock -- -- 943 9 24,109 -- -- (24,118) -- -- Shares issued under Dividend Reinvestment and Stock -- Purchase Plan -- -- 9 -- 207 -- -- -- 207 -- Stock options exercised -- -- 19 -- 504 -- -- -- 504 -- Directors Deferred comp.plan -- -- -- -- 407 -- -- -- 407 -- Issuance of restricted stock -- -- 83 1 1,973 -- -- -- 1,974 --

Cancellation of restrictedstock -- -- (3) -- (149) -- -- -- (149) Stock Compensation -- -- -- -- 2,272 -- -- -- 2,272 -- Rebalancing of ownership percent between parent and subsidiaries -- -- -- -- 66,296 -- -- (66,296) -- Balance at December 31,2009 10 $ 25,000 78,970 $ 789 $ 2,275,716 $ (470,047) -- $ 311,732 $ 2,143,190 $ 63,728
The accompanying notes are an integral part of these consolidated financial statements.
70
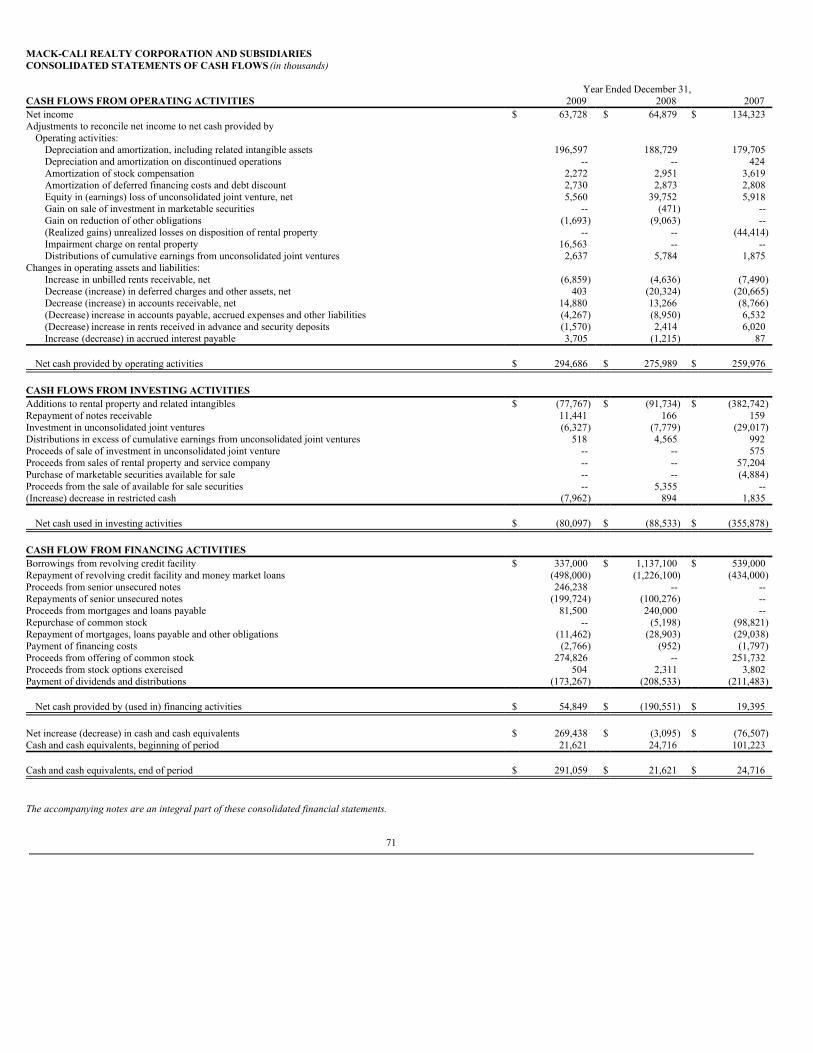
MACK-CALI REALTY CORPORATION AND SUBSIDIARIESCONSOLIDATED STATEMENTS OF CASH FLOWS (in thousands)
Year Ended December 31, CASH FLOWS FROM OPERATING ACTIVITIES 2009 2008 2007 Net income $ 63,728 $ 64,879 $ 134,323 Adjustments to reconcile net income to net cash provided by
Operating activities: Depreciation and amortization, including related intangible assets 196,597 188,729 179,705 Depreciation and amortization on discontinued operations -- -- 424 Amortization of stock compensation 2,272 2,951 3,619 Amortization of deferred financing costs and debt discount 2,730 2,873 2,808 Equity in (earnings) loss of unconsolidated joint venture, net 5,560 39,752 5,918 Gain on sale of investment in marketable securities -- (471) -- Gain on reduction of other obligations (1,693) (9,063) -- (Realized gains) unrealized losses on disposition of rental property -- -- (44,414)Impairment charge on rental property 16,563 -- -- Distributions of cumulative earnings from unconsolidated joint ventures 2,637 5,784 1,875
Changes in operating assets and liabilities: Increase in unbilled rents receivable, net (6,859) (4,636) (7,490)Decrease (increase) in deferred charges and other assets, net 403 (20,324) (20,665)Decrease (increase) in accounts receivable, net 14,880 13,266 (8,766)(Decrease) increase in accounts payable, accrued expenses and other liabilities (4,267) (8,950) 6,532 (Decrease) increase in rents received in advance and security deposits (1,570) 2,414 6,020 Increase (decrease) in accrued interest payable 3,705 (1,215) 87
Net cash provided by operating activities $ 294,686 $ 275,989 $ 259,976
CASH FLOWS FROM INVESTING ACTIVITIES Additions to rental property and related intangibles $ (77,767) $ (91,734) $ (382,742)Repayment of notes receivable 11,441 166 159 Investment in unconsolidated joint ventures (6,327) (7,779) (29,017)Distributions in excess of cumulative earnings from unconsolidated joint ventures 518 4,565 992 Proceeds of sale of investment in unconsolidated joint venture -- -- 575 Proceeds from sales of rental property and service company -- -- 57,204 Purchase of marketable securities available for sale -- -- (4,884)Proceeds from the sale of available for sale securities -- 5,355 -- (Increase) decrease in restricted cash (7,962) 894 1,835
Net cash used in investing activities $ (80,097) $ (88,533) $ (355,878) CASH FLOW FROM FINANCING ACTIVITIES Borrowings from revolving credit facility $ 337,000 $ 1,137,100 $ 539,000 Repayment of revolving credit facility and money market loans (498,000) (1,226,100) (434,000)Proceeds from senior unsecured notes 246,238 -- -- Repayments of senior unsecured notes (199,724) (100,276) -- Proceeds from mortgages and loans payable 81,500 240,000 -- Repurchase of common stock -- (5,198) (98,821)Repayment of mortgages, loans payable and other obligations (11,462) (28,903) (29,038)Payment of financing costs (2,766) (952) (1,797)Proceeds from offering of common stock 274,826 -- 251,732 Proceeds from stock options exercised 504 2,311 3,802 Payment of dividends and distributions (173,267) (208,533) (211,483)
Net cash provided by (used in) financing activities $ 54,849 $ (190,551) $ 19,395 Net increase (decrease) in cash and cash equivalents $ 269,438 $ (3,095) $ (76,507)Cash and cash equivalents, beginning of period 21,621 24,716 101,223 Cash and cash equivalents, end of period $ 291,059 $ 21,621 $ 24,716 The accompanying notes are an integral part of these consolidated financial statements.
71
MACK-CALI REALTY CORPORATION AND SUBSIDIARIESNOTES TO CONSOLIDATED FINANCIAL STATEMENTS
1. ORGANIZATION AND BASIS OF PRESENTATION
ORGANIZATIONMack-Cali Realty Corporation, a Maryland corporation, together with its subsidiaries (collectively, the “Company”), is a fully-integrated, self-administered, self-managed real estateinvestment trust (“REIT”) providing leasing, management, acquisition, development, construction and tenant-related services for its properties and third parties. As of December 31,2009, the Company owned or had interests in 289 properties plus developable land (collectively, the “Properties”). The Properties aggregate approximately 33.2 million square feet,which are comprised of 277 buildings, primarily office and office/flex buildings totaling approximately 32.8 million square feet (which include 20 buildings, primarily officebuildings aggregating approximately 2.2 million square feet owned by unconsolidated joint ventures in which the Company has investment interests), six industrial/warehousebuildings totaling approximately 387,400 square feet, two retail properties totaling approximately 17,300 square feet, one hotel (which is owned by an unconsolidated joint venture inwhich the Company has an investment interest) and three parcels of land leased to others. The Properties are located in five states, primarily in the Northeast, plus the District ofColumbia.
BASIS OF PRESENTATIONThe accompanying consolidated financial statements include all accounts of the Company, its majority-owned and/or controlled subsidiaries, which consist principally of Mack-CaliRealty, L.P. (the “Operating Partnership”), and variable interest entities for which the Company has determined itself to be the primary beneficiary, if any. See Note 2: SignificantAccounting Policies – Investments in Unconsolidated Joint Ventures for the Company’s treatment of unconsolidated joint venture interests. Intercompany accounts and transactionshave been eliminated.
The preparation of financial statements in conformity with generally accepted accounting principles (“GAAP”) requires management to make estimates and assumptions that affectthe reported amounts of assets and liabilities and disclosure of contingent assets and liabilities at the date of the financial statements and the reported amounts of revenues andexpenses during the reporting period. Actual results could differ from those estimates. The Company evaluated subsequent events through February 10, 2010, the date thesefinancial statements were available to be issued. Certain reclassifications have been made to prior period amounts in order to conform with current period presentation.
On July 1, 2009, the Financial Accounting Standards Board (“FASB”) issued the FASB Accounting Standards Codification and the Hierarchy of Generally Accepted AccountingPrinciples, also known as FASB Accounting Standards Codification (“ASC”) 105-10, General Accepted Accounting Principles, (“ASC 105-10”). ASC 105-10 establishes the FASBAccounting Standards Codification (“Codification”) as the single source of authoritative U.S. GAAP recognized by the FASB to be applied by nongovernmental entities. Rules andinterpretive releases of the Securities and Exchange Commission (“SEC”) under authority of federal securities laws are also sources of authoritative GAAP for SEC registrants. TheCodification supersedes all existing non-SEC accounting and reporting standards. All other nongrandfathered, non-SEC accounting literature not included in the Codification willbecome nonauthoritative. Following the Codification, the FASB will not issue new standards in the form of Statements, FASB Staff Positions or Emerging Issues Task ForceAbstracts. Instead, it will issue Accounting Standards Updates, which will serve to update the Codification, provide background information about the guidance and provide the basisfor conclusions on the changes to the Codification. GAAP was not intended to be changed as a result of the FASB’s Codification project, but it will change the way the guidance isorganized and presented. The Company has implemented the Codification in this annual report by providing references to the Codification topics, as appropriate.
72
2. SIGNIFICANT ACCOUNTING POLICIES
RentalProperty Rental properties are stated at cost less accumulated depreciation and amortization. Costs directly related to the acquisition, development and construction of
rental properties are capitalized. Pursuant to the Company’s adoption of the authoritative guidance on business combinations, effective January 1, 2009,acquisition-related costs are expensed as incurred. Capitalized development and construction costs include pre-construction costs essential to thedevelopment of the property, development and construction costs, interest, property taxes, insurance, salaries and other project costs incurred during theperiod of development. Included in total rental property is construction, tenant improvement and development in-progress of $107,226,000 and$143,010,000 (including land of $69,438,000 and $70,709,000) as of December 31, 2009 and 2008, respectively. Ordinary repairs and maintenance areexpensed as incurred; major replacements and betterments, which improve or extend the life of the asset, are capitalized and depreciated over their estimateduseful lives. Fully-depreciated assets are removed from the accounts.
The Company considers a construction project as substantially completed and held available for occupancy upon the completion of tenant improvements, but nolater than one year from cessation of major construction activity (as distinguished from activities such as routine maintenance and cleanup). If portions of arental project are substantially completed and occupied by tenants, or held available for occupancy, and other portions have not yet reached that stage, thesubstantially completed portions are accounted for as a separate project. The Company allocates costs incurred between the portions under construction and theportions substantially completed and held available for occupancy, and capitalizes only those costs associated with the portion under construction.
Properties are depreciated using the straight-line method over the estimated useful lives of the assets. The estimated useful lives are as follows:
Leasehold interests Remaining lease termBuildings and improvements 5 to 40 yearsTenant improvements The shorter of the term of the related lease or useful lifeFurniture, fixtures and equipment 5 to 10 years
Upon acquisition of rental property, the Company estimates the fair value of acquired tangible assets, consisting of land, building and improvements, andidentified intangible assets and liabilities assumed, generally consisting of the fair value of (i) above and below market leases, (ii) in-place leases and (iii) tenantrelationships. The Company allocates the purchase price to the assets acquired and liabilities assumed based on their fair values. The Company records goodwillor a gain on bargain purchase (if any) if the net assets acquired/liabilities assumed exceed the purchase consideration of a transaction. In estimating the fair valueof the tangible and intangible assets acquired, the Company considers information obtained about each property as a result of its due diligence and marketing andleasing activities, and utilizes various valuation methods, such as estimated cash flow projections utilizing appropriate discount and capitalization rates,estimates of replacement costs net of depreciation, and available market information. The fair value of the tangible assets of an acquired property considers thevalue of the property as if it were vacant.
Above-market and below-market lease values for acquired properties are initially recorded based on the present value, (using a discount rate which reflects therisks associated with the leases acquired) of the difference between (i) the contractual amounts to be paid pursuant to each in-place lease and (ii) management’sestimate of fair market lease rates for each corresponding in-place lease, measured over a period equal to the remaining term of the lease for above-market leasesand the initial term plus the term of any below-market fixed rate renewal options for below-market leases. The capitalized above-market lease values areamortized as a reduction of base rental revenue over the remaining term of the respective leases, and the capitalized below-market lease values are amortized asan increase to base rental revenue over the remaining initial terms plus the terms of any below-market fixed rate renewal options of the respective leases.
73

Other intangible assets acquired include amounts for in-place lease values and tenant relationship values, which are based on management’s evaluation of thespecific characteristics of each tenant’s lease and the Company’s overall relationship with the respective tenant. Factors to be considered by management in itsanalysis of in-place lease values include an estimate of carrying costs during hypothetical expected lease-up periods considering current market conditions, andcosts to execute similar leases. In estimating carrying costs, management includes real estate taxes, insurance and other operating expenses and estimates of lostrentals at market rates during the expected lease-up periods, depending on local market conditions. In estimating costs to execute similar leases, managementconsiders leasing commissions, legal and other related expenses. Characteristics considered by management in valuing tenant relationships include the natureand extent of the Company’s existing business relationships with the tenant, growth prospects for developing new business with the tenant, the tenant’s creditquality and expectations of lease renewals. The value of in-place leases are amortized to expense over the remaining initial terms of the respective leases. Thevalue of tenant relationship intangibles are amortized to expense over the anticipated life of the relationships.
On a periodic basis, management assesses whether there are any indicators that the value of the Company’s real estate properties held for use may beimpaired. A property’s value is impaired only if management’s estimate of the aggregate future cash flows (undiscounted and without interest charges) to begenerated by the property is less than the carrying value of the property. To the extent impairment has occurred, the loss shall be measured as the excess of thecarrying amount of the property over the fair value of the property. The Company’s estimates of aggregate future cash flows expected to be generated by eachproperty are based on a number of assumptions that are subject to economic and market uncertainties including, among others, demand for space, competition fortenants, changes in market rental rates, and costs to operate each property. As these factors are difficult to predict and are subject to future events that may altermanagement’s assumptions, the future cash flows estimated by management in its impairment analyses may not be achieved.
Rental Property Held for Sale and Discontinued Operations When assets are identified by management as held for sale, the Company discontinues depreciating the assets and estimates the sales price, net of selling
costs, of such assets. If, in management’s opinion, the estimated net sales price of the assets which have been identified as held for sale is less than the netbook value of the assets, a valuation allowance is established. Properties identified as held for sale and/or sold are presented in discontinued operations for allperiods presented. See Note 7: Discontinued Operations.
If circumstances arise that previously were considered unlikely and, as a result, the Company decides not to sell a property previously classified as held for sale,the property is reclassified as held and used. A property that is reclassified is measured and recorded individually at the lower of (a) its carrying amount beforethe property was classified as held for sale, adjusted for any depreciation (amortization) expense that would have been recognized had the property beencontinuously classified as held and used, or (b) the fair value at the date of the subsequent decision not to sell.
74
Investments inUnconsolidatedJoint Ventures The Company accounts for its investments in unconsolidated joint ventures under the equity method of accounting. The Company applies the equity method
by initially recording these investments at cost, as Investments in Unconsolidated Joint Ventures, subsequently adjusted for equity in earnings and cashcontributions and distributions.
ASC 810, Consolidation, provides guidance on the identification of entities for which control is achieved through means other than voting rights (“variableinterest entities” or “VIEs”) and the determination of which business enterprise, if any, should consolidate the VIE (the “primary beneficiary”). Generally,the consideration of whether an entity is a VIE applies when either (1) the equity investors (if any) lack one or more of the essential characteristics of acontrolling financial interest, (2) the equity investment at risk is insufficient to finance that entity’s activities without additional subordinated financial supportor (3) the equity investors have voting rights that are not proportionate to their economic interests and the activities of the entity involve or are conducted onbehalf of an investor with a disproportionately small voting interest.
On a periodic basis, management assesses whether there are any indicators that the value of the Company’s investments in unconsolidated joint ventures may beimpaired. An investment is impaired only if management’s estimate of the value of the investment is less than the carrying value of the investment, and suchdecline in value is deemed to be other than temporary. To the extent impairment has occurred, the loss shall be measured as the excess of the carrying amount ofthe investment over the value of the investment. The Company’s estimates of value for each investment (particularly in commercial real estate joint ventures) arebased on a number of assumptions that are subject to economic and market uncertainties including, among others, demand for space, competition for tenants,changes in market rental rates, and operating costs. As these factors are difficult to predict and are subject to future events that may alter management’sassumptions, the values estimated by management in its impairment analyses may not be realized. See Note 4: Investments in Unconsolidated Joint Ventures.
Cash and Cash Equivalents All highly liquid investments with a maturity of three months or less when purchased are considered to be cash equivalents.
Marketable Securities The Company classifies its marketable securities among three categories: held-to-maturity, trading and available-for-sale. Unrealized holding gains and
losses relating to available-for-sale securities are excluded from earnings and reported as other comprehensive income (loss) in equity until realized. Adecline in the market value of any held-to-maturity marketable security below cost that is deemed to be other than temporary results in a reduction in thecarrying amount to fair value. Any impairment would be charged to earnings and a new cost basis for the security established.
The fair value of the marketable securities is determined using level I inputs under ASC 820, Fair Value Measurements and Disclosures. Level I inputs representquoted prices available in an active market for identical investments as of the reporting date
The Company received approximately $65,000 in dividend income from its holdings in marketable securities during the year ended December 31, 2008. Duringthe year ended December 31, 2008, the Company disposed of its marketable securities for aggregate net proceeds of $5.4 million and realized a gain of$471,000.
DeferredFinancing Costs Costs incurred in obtaining financing are capitalized and amortized over the term of the related indebtedness. Amortization of such costs is included in
interest expense and was $2,730,000, $2,873,000 and $2,808,000 for the years ended December 31, 2009, 2008 and 2007, respectively.
75
DeferredLeasing Costs Costs incurred in connection with leases are capitalized and amortized on a straight-line basis over the terms of the related leases and included in depreciation
and amortization. Unamortized deferred leasing costs are charged to amortization expense upon early termination of the lease. Certain employees of theCompany are compensated for providing leasing services to the Properties. The portion of such compensation, which is capitalized and amortized,approximated $3,725,000, $3,690,000 and $4,132,000 for the years ended December 31, 2009, 2008 and 2007, respectively.
DerivativeInstruments The Company measures derivative instruments, including certain derivative instruments embedded in other contracts, at fair value and records them as an
asset or liability, depending on the Company’s rights or obligations under the applicable derivative contract. For derivatives designated and qualifying as fairvalue hedges, the changes in the fair value of both the derivative instrument and the hedged item are recorded in earnings. For derivatives designated as cashflow hedges, the effective portions of the derivative are reported in other comprehensive income (“OCI”) and are subsequently reclassified into earningswhen the hedged item affects earnings. Changes in fair value of derivative instruments not designated as hedging and ineffective portions of hedges arerecognized in earnings in the affected period.
RevenueRecognition Base rental revenue is recognized on a straight-line basis over the terms of the respective leases. Unbilled rents receivable represents the amount by which
straight-line rental revenue exceeds rents currently billed in accordance with the lease agreements. Above-market and below-market lease values for acquiredproperties are initially recorded based on the present value (using a discount rate which reflects the risks associated with the leases acquired) of the differencebetween (i) the contractual amounts to be paid pursuant to each in-place lease and (ii) management’s estimate of fair market lease rates for eachcorresponding in-place lease, measured over a period equal to the remaining term of the lease for above-market leases and the initial term plus the term of anybelow-market fixed-rate renewal options for below-market leases. The capitalized above-market lease values for acquired properties are amortized as areduction of base rental revenue over the remaining term of the respective leases, and the capitalized below-market lease values are amortized as an increaseto base rental revenue over the remaining initial terms plus the terms of any below-market fixed-rate renewal options of the respective leases. Escalations andrecoveries from tenants are received from tenants for certain costs as provided in the lease agreements. These costs generally include real estate taxes,utilities, insurance, common area maintenance and other recoverable costs. See Note 14: Tenant Leases. Construction services revenue includes fees earnedand reimbursements received by the Company for providing construction management and general contractor services to clients. Construction servicesrevenue is recognized on the percentage of completion method. Using this method, profits are recorded on the basis of estimates of the overall profit andpercentage of completion of individual contracts. A portion of the estimated profits is accrued based upon estimates of the percentage of completion of theconstruction contract. This revenue recognition method involves inherent risks relating to profit and cost estimates. Real estate services revenue includesproperty management, facilities management, leasing commission fees and other services, and payroll and related costs reimbursed from clients. Otherincome includes income from parking spaces leased to tenants, income from tenants for additional services arranged for by the Company and income fromtenants for early lease terminations.
Allowance forDoubtfulAccounts
Management periodically performs a detailed review of amounts due from tenants to determine if accounts receivable balances are impaired based on factorsaffecting the collectability of those balances. Management’s estimate of the allowance for doubtful accounts requires management to exercise significant judgmentabout the timing, frequency and severity of collection losses, which affects the allowance and net income.
76
Income andOther Taxes The Company has elected to be taxed as a REIT under Sections 856 through 860 of the Internal Revenue Code of 1986, as amended (the “Code”). As a
REIT, the Company generally will not be subject to corporate federal income tax (including alternative minimum tax) on net income that it currentlydistributes to its shareholders, provided that the Company satisfies certain organizational and operational requirements including the requirement to distributeat least 90 percent of its REIT taxable income to its shareholders. The Company has elected to treat certain of its corporate subsidiaries as taxable REITsubsidiaries (each a “TRS”). In general, a TRS of the Company may perform additional services for tenants of the Company and generally may engage inany real estate or non-real estate related business (except for the operation or management of health care facilities or lodging facilities or the providing to anyperson, under a franchise, license or otherwise, rights to any brand name under which any lodging facility or health care facility is operated). A TRS issubject to corporate federal income tax. If the Company fails to qualify as a REIT in any taxable year, the Company will be subject to federal income tax(including any applicable alternative minimum tax) on its taxable income at regular corporate tax rates. The Company is subject to certain state and localtaxes.
The Company adopted the amended provisions related to uncertain tax provisions of ASC 740, Income Taxes, on January 1, 2007. As a result of theimplementation of the guidance, the Company recognized no material adjustments regarding its tax accounting treatment. The Company expects to recognizeinterest and penalties related to uncertain tax positions, if any, as income tax expense, which is included in general and administrative expense.
In the normal course of business, the Company or one of its subsidiaries is subject to examination by federal, state and local jurisdictions in which it operates,where applicable. As of December 31, 2009, the tax years that remain subject to examination by the major tax jurisdictions under the statute of limitations isfrom the year 2005 forward.
Earnings Per Share The Company presents both basic and diluted earnings per share (“EPS”). Basic EPS excludes dilution and is computed by dividing net income available to
common shareholders by the weighted average number of shares outstanding for the period. Diluted EPS reflects the potential dilution that could occur ifsecurities or other contracts to issue common stock were exercised or converted into common stock, where such exercise or conversion would result in alower EPS amount.
Dividends and DistributionsPayable The dividends and distributions payable at December 31, 2009 represents dividends payable to preferred shareholders (10,000 shares) and common
shareholders (78,969,858 shares), and distributions payable to noncontrolling interest common unitholders of the Operating Partnership (13,495,036 commonunits) for all such holders of record as of January 6, 2010 with respect to the fourth quarter 2009. The fourth quarter 2009 preferred stock dividends of$50.00 per share, common stock dividends and common unit distributions of $0.45 per common share and unit were approved by the Board of Directors onDecember 8, 2009. The common stock dividends, common unit distributions and preferred stock dividends payable were paid on January 15, 2010.
The dividends and distributions payable at December 31, 2008 represents dividends payable to preferred shareholders (10,000 shares) and common shareholders(66,419,764 shares), and distributions payable to noncontrolling interest common unitholders of the Operating Partnership (14,437,731 common units) for allsuch holders of record as of January 6, 2009 with respect to the fourth quarter 2008. The fourth quarter 2008 preferred stock dividends of $50.00 per share,common stock dividends and common unit distributions of $0.64 per common share and unit were approved by the Board of Directors on December 9,2008. The common stock dividends and common unit distributions payable were paid on January 12, 2009. The preferred stock dividends payable were paid onJanuary 15, 2009.
77
The Company has determined that the $1.99 dividend per common share paid during the year ended December 31, 2009 represented approximately 93 percentordinary income and approximately 7 percent return of capital to its stockholders; the $2.56 dividend per common share paid during the year ended December31, 2008 represented approximately 81 percent ordinary income, approximately 18 percent return of capital and approximately one percent capital gain to itsstockholders; and the $2.56 dividend per common share paid during the year ended December 31, 2007 represented approximately 80 percent ordinary incomeand approximately 20 percent capital gain to its stockholders.
Costs Incurred For Stock Issuances Costs incurred in connection with the Company’s stock issuances are reflected as a reduction of additional paid-in capital.
Stock Compensation The Company accounts for stock options and restricted stock awards granted prior to 2002 using the intrinsic value method prescribed in the previously
existing accounting guidance on accounting for stock issued to employees. Under this guidance, compensation cost for stock options is measured as theexcess, if any, of the quoted market price of the Company’s stock at the date of grant over the exercise price of the option granted. Compensation cost forstock options is recognized ratably over the vesting period. The Company’s policy is to grant options with an exercise price equal to the quoted closingmarket price of the Company’s stock on the business day preceding the grant date. Accordingly, no compensation cost has been recognized under theCompany’s stock option plans for the granting of stock options made prior to 2002. Restricted stock awards granted prior to 2002 are valued at the vestingdates of such awards with compensation cost for such awards recognized ratably over the vesting period.
In 2002, the Company adopted the provisions of ASC 718, Compensation-Stock Compensation. In 2006, the Company adopted the amended guidance, whichdid not have a material effect on the Company’s financial position and results of operations. These provisions require that the estimated fair value of restrictedstock (“Restricted Stock Awards”) and stock options at the grant date be amortized ratably into expense over the appropriate vesting period. The Companyrecorded stock expense of $4,097,000, $4,870,000 and $6,470,000 for the years ended December 31, 2009, 2008 and 2007, respectively.
Other Comprehensive Income Other comprehensive income (loss) includes items that are recorded in equity, such as unrealized holding gains or losses on marketable securities available
for sale.
3. REAL ESTATE TRANSACTIONS
On March 1, 2009, the Company placed in service a 249,409 square-foot, class A office building, which is fully leased through August 2024. The building is located in the Mack-Cali Business Campus in Parsippany, New Jersey.
On April 29, 2009, the Company acquired SL Green’s interests in the Mack-Green-Gale LLC and subsidiaries (“Mack-Green”) and 55 Corporate Partners, LLC (“55 Corporate”)joint ventures (the “SL Green Transactions”) for $5 million. As a result, the Company owns 100 percent of Mack-Green and 55 Corporate. Concurrent with the SL GreenTransactions, the loan agreement with an affiliate of Gramercy Capital Corporation (“Gramercy”) on six office properties indirectly owned by Mack-Green was restructuredproviding Gramercy with the power to control the activities that are most important to the properties’ economic performance. At the time of the restructuring, the estimated fair valueof the six properties was less than the aggregate carrying amount of the non-recourse mortgage loans.
78
As a result of the SL Green Transactions and the agreement with Gramercy, as of April 29, 2009, the Company began consolidating 11 office properties, aggregating approximately1.5 million square feet, owned and controlled by Mack- Green, and a pre-leased 205,000 square foot office development project owned and controlled by 55 Corporate. TheCompany also has retained a non-controlling interest in entities that own 100 percent of six office properties, aggregating 786,198 square feet, which were previously indirectlyowned by Mack-Green. The consolidated properties’ aggregate acquisition amounts were allocated as follows: $43.0 million to land and leasehold interests, $150.1 million tobuildings and improvements, $14.3 million to tenant improvements, $43.7 million to deferred lease costs and other lease intangibles, net, $13.1 million to other assets acquired(including cash and accounts receivable) and $156.8 million to liabilities (including mortgage debt with a fair market value of approximately $151.1 million), as well as an allocationto noncontrolling interests in consolidated joint ventures of $3.2 million. There was no contingent consideration associated with the acquisition. See “Mack-Green-Gale LLC” and“55 Corporate Partners, LLC” under Note 4: Investments in Unconsolidated Joint Ventures for further discussion on the transactions.
The Company’s office property located at 105 Challenger Road in Ridgefield Park, New Jersey, aggregating 150,000 square feet, is collateral for a mortgage loan scheduled tomature on June 30, 2010 with a balance of $19.4 million at December 31, 2009. As of December 31, 2009, the Company estimated that the carrying value of the property may notbe recoverable over its anticipated holding period. In order to reduce the carrying value of the property to its estimated fair market value, the Company recorded an impairmentcharge of $16.6 million at December 31, 2009.
4. INVESTMENTS IN UNCONSOLIDATED JOINT VENTURES
The debt of the Company’s unconsolidated joint ventures generally is non-recourse to the Company, except for customary exceptions pertaining to such matters as intentional misuseof funds, environmental conditions and material misrepresentations, and except as otherwise indicated below.
PLAZA VIII AND IX ASSOCIATES, L.L.C.Plaza VIII and IX Associates, L.L.C. is a joint venture between the Company and Columbia Development Company, L.L.C. (“Columbia”). The venture was formed to acquire landfor future development, located on the Hudson River waterfront in Jersey City, New Jersey, adjacent to the Company’s Harborside Financial Center office complex. The Companyand Columbia each hold a 50 percent interest in the venture. Among other things, the partnership agreement provides for a preferred return on the Company’s invested capital in theventure, in addition to the Company’s proportionate share of the venture’s profit, as defined in the agreement. The venture owns undeveloped land currently used as a parkingfacility.
RAMLAND REALTY ASSOCIATES L.L.C. (One Ramland Road)On August 20, 1998, the Company entered into a 50/50 joint venture with S.B. New York Realty Corp. to form Ramland Realty Associates L.L.C. The venture was formed to own,manage and operate One Ramland Road, a 232,000 square foot office/flex building and adjacent developable land, located in Orangeburg, New York. In August 1999, the jointventure completed redevelopment of the property and placed the office/flex building in service. The venture recorded an impairment loss of approximately $4.3 million on its rentalproperty as of December 31, 2007. On December 31, 2008, the venture transferred the deed to the lender in satisfaction of its obligations, including its mortgage with a balance of$14.7 million, and recorded a gain on the disposal of its office property of $7.5 million.
The Company performed management, leasing and other services for the property when owned by the joint venture and recognized $57,000 and $63,000 in fees for such services forthe years ended December 31, 2008 and 2007, respectively.
79
SOUTH PIER AT HARBORSIDE – HOTEL DEVELOPMENTOn November 17, 1999, the Company entered into a joint venture with Hyatt Corporation (“Hyatt”) to develop a 350-room hotel on the South Pier at Harborside Financial Center,Jersey City, New Jersey, which was completed and commenced initial operations in July 2002. The Company owns a 50 percent interest in the venture.
The venture has a mortgage loan with a balance as of December 31, 2009 of $67.2 million collateralized by the hotel property. The loan carries an interest rate of 6.15 percent andmatures in November 2016. The venture has a loan with a balance as of December 31, 2009 of $6.3 million with the City of Jersey City, provided by the U.S. Department of Housingand Urban Development. The loan currently bears interest at fixed rates ranging from 6.09 percent to 6.62 percent and matures in August 2020. The Company has posted a $6.3million letter of credit in support of this loan, half of which is indemnified by Hyatt.
RED BANK CORPORATE PLAZA L.L.C./RED BANK CORPORATE PLAZA II, L.L.C.On March 23, 2006, the Company entered into a joint venture with The PRC Group (“PRC”) to form Red Bank Corporate Plaza L.L.C. The venture was formed to develop Red BankCorporate Plaza, a 92,878 square foot office building located in Red Bank, New Jersey. The property is fully leased to Hovnanian Enterprises, Inc. through September 30, 2017. TheCompany holds a 50 percent interest in the venture. PRC contributed the vacant land for the development of the office building as its initial capital in the venture. The Companyfunded the costs of development up to the value of the land contributed by PRC of $3.5 million as its initial capital.
On October 20, 2006, the venture entered into a $22.0 million construction loan with a commercial bank collateralized by the land and development project. The loan (with a balanceas of December 31, 2009 of $20.8 million), carried an interest rate of LIBOR plus 130 basis points through March 2008. In April 2008, the interest rate was reduced to LIBOR plus125 basis points and the maturity was extended to April 2010. The loan currently has a one-year extension option subject to certain conditions, which requires payment of a fee.
In September 2007, the joint venture completed development of the property and placed the office building in service. The Company performs management, leasing and otherservices for the property owned by the joint venture and recognized $92,600, $128,000 and $678,000 in fees for such services during the years ended December 31, 2009, 2008 and2007, respectively.
On July 20, 2006, the Company entered into a second joint venture agreement with PRC to form Red Bank Corporate Plaza II L.L.C. The venture was formed to hold land able toaccommodate an 18,561 square foot office building located in Red Bank, New Jersey. The Company holds a 50 percent interest in the venture. The terms of the venture are similar toRed Bank Corporate Plaza L.L.C. PRC contributed the vacant land as its initial capital in the venture. On January 26, 2010, the venture sold its vacant land for approximately $1.7million.
MACK-GREEN-GALE LLC/GRAMERCY AGREEMENTOn May 9, 2006, the Company entered into a joint venture, Mack-Green-Gale LLC and subsidiaries (“Mack-Green”), with SL Green, pursuant to which Mack-Green held anapproximate 96 percent interest in and acted as general partner of Gale SLG NJ Operating Partnership, L.P. (the “OPLP”). The Company’s acquisition cost for its interest in Mack-Green was approximately $125 million, which was funded primarily through borrowing under the Company’s revolving credit facility. At the time, the OPLP owned 100 percent ofentities (“Property Entities”) which owned 25 office properties (the “OPLP Properties”) which aggregated 3.5 million square feet (consisting of 17 office properties aggregating 2.3million square feet located in New Jersey and eight properties aggregating 1.2 million square feet located in Troy, Michigan). In December 2007, the OPLP sold its eight propertieslocated in Troy, Michigan for $83.5 million. The venture recognized a loss of approximately $22.3 million from the sale.
As defined in the Mack-Green operating agreement, the Company shared decision-making equally with SL Green regarding: (i) all major decisions involving the operations of Mack-Green; and (ii) overall general partner responsibilities in operating the OPLP.
The Mack-Green operating agreement generally provided for profits and losses to be allocated as follows:
(i) 99 percent of Mack-Green’s share of the profits and losses from 10 specific OPLP Properties allocable to the Company and one percent allocable to SL Green; (ii) one percent of Mack-Green’s share of the profits and losses from eight specific OPLP Properties and its minor interest in four office properties allocable to the Company
and 99 percent allocable to SL Green; and (iii) 50 percent of all other profits and losses allocable to the Company and 50 percent allocable to SL Green.
80
Substantially all of the OPLP Properties were encumbered by mortgage loans with an aggregate outstanding principal balance of $276.3 million at March 31, 2009. $185.0 million ofthe mortgage loans bore interest at a weighted average fixed interest rate of 6.26 percent per annum and matured at various times through May 2016.
Six of the OPLP Properties (the “Portfolio Properties”) were encumbered by $90.3 million of mortgage loans which bore interest at a floating rate of LIBOR plus 275 basis points perannum and were scheduled to mature in May 2009. The floating rate mortgage loans were provided to the six entities which owned the Portfolio Properties (collectively, the “PortfolioEntities”) by Gramercy, which was a related party of SL Green. Based on the venture’s anticipated holding period pertaining to the Portfolio Properties, the venture believed that thecarrying amounts of these properties may not have been recoverable at December 31, 2008. Accordingly, as the venture determined that its carrying value of these propertiesexceeded the estimated fair value, it recorded an impairment charge of approximately $32.3 million as of December 31, 2008.
On April 29, 2009, the Company acquired the remaining interests in Mack-Green from SL Green. As a result, the Company owns 100 percent of Mack-Green. Additionally, onApril 29, the mortgage loans with Gramercy on the Portfolio Properties (the “Gramercy Agreement”) were modified to provide for, among other things, interest to accrue at thecurrent rate of LIBOR plus 275 basis point per annum, with the interest pay rate capped at 3.15 percent per annum. Under the Gramercy Agreement, the payment of debt service issubordinate to the payment of operating expenses. Interest at the pay rate is payable only out of funds generated by the Portfolio Properties and only to the extent that the PortfolioProperties’ operating expenses have been paid, with any accrued unpaid interest above the pay rate serving to increase the balance of the amounts due at the termination of theagreement. Any excess funds after payment of debt service generally will be escrowed and available for future capital and leasing costs, as well as to cover future cash flowshortfalls, as appropriate. The Gramercy Agreement terminates on May 9, 2011. Approximately six months in advance of the end of the term of the Gramercy Agreement, thePortfolio Entities are to provide estimates of each property’s fair market value (“FMV”). Gramercy has the right to accept or reject the FMV. If Gramercy rejects the FMV,Gramercy must market the property for sale in cooperation with the Portfolio Entities and must approve the ultimate sale. However, Gramercy has no obligation to market a PortfolioProperty if the FMV is less than the allocated amount due, including accrued, unpaid interest. If any Portfolio Property is not sold, the Portfolio Entities have agreed to give a deed inlieu of foreclosure, unless the FMV was equal to or greater than the allocated amount due for such Portfolio Property, in which case they can elect to have that Portfolio Propertyreleased by paying the FMV. If Gramercy accepts the FMV, the Portfolio Property will be released from the Gramercy Agreement upon payment of the FMV. Under the direction ofGramercy, the Company continues to perform management, leasing, and construction services for the Portfolio Properties at market terms. The Portfolio Entities have a participationinterest which provides for sharing 50 percent of any amount realized in excess of the allocated amounts due for each Portfolio Property.
As the Company acquired SL Green’s interests in Mack-Green, the Company owns 100 percent of Mack-Green and is consolidating Mack-Green as of the closing date. Mack-Green,in turn, has been and will continue consolidating the OPLP as Mack-Green’s approximate 96 percent, general partner ownership interest in the OPLP remained unchanged as of theclosing date. Additionally, as of the closing date, the OPLP continues to consolidate its Property Entities which own 11 office properties aggregating 1.5 million square feet as its100-percent ownership and rights regarding these entities were unchanged in the transaction. The OPLP will not be consolidating the Portfolio Entities that own six office properties,aggregating 786,198 square feet, as the Gramercy Agreement is considered a reconsideration event under the provisions of the authoritative guidance on consolidation andaccordingly, the Portfolio Entities were deemed to be variable interest entities for which the OPLP was not considered the primary beneficiary based on the Gramercy Agreement asdescribed above. As a result of the SLG Transactions, the Company has an unconsolidated joint venture interest in the Portfolio Properties.
In connection with these transactions, at the closing date, the Company also acquired the remaining 50 percent interest in 55 Corporate Partners L.L.C. from an affiliate of SL Green(see “55 Corporate Partners, LLC” below).
81
The Company performs management, leasing, and construction services for properties owned by the unconsolidated joint ventures and recognized $2.3 million, $5.2 million and $5.2million in income (net of $1.1 million, $3.5 million and $3.3 million in direct costs) for such services in the years ended December 31, 2009, 2008 and 2007, respectively.
GE/GALE FUNDING LLC (PFV)The Gale agreement signed as part of the Gale/Green transactions in May 2006 provides for the Company to acquire certain ownership interests in real estate projects (the “Non-Portfolio Properties”), subject to obtaining certain third party consents and the satisfaction of various project-related and/or other conditions. Each of the Company’s acquiredinterests in the Non-Portfolio Properties provide for the initial distributions of net cash flow solely to the Company, and thereafter an affiliate of Mr. Gale (“Gale Affiliate”) hasparticipation rights (“Gale Participation Rights”) in 50 percent of the excess net cash flow remaining after the distribution to the Company of the aggregate amount equal to the sumof: (a) the Company’s capital contributions, plus (b) an internal rate of return (“IRR”) of 10 percent per annum, accruing on the date or dates of the Company’s investments.
On May 9, 2006, as part of the Gale/Green transactions, the Company acquired from a Gale Affiliate for $1.8 million a 50 percent controlling interest in GMW Village Associates,LLC (“GMW Village”). GMW Village holds a 20 percent interest in GE/Gale Funding LLC (“GE Gale”). GE Gale owns a 100 percent interest in the entity owning PrincetonForrestal Village, a mixed-use, office/retail complex aggregating 527,015 square feet and located in Plainsboro, New Jersey (“Princeton Forrestal Village” or “PFV”).
In addition to the cash consideration paid to acquire the interest, the Company provided a Gale affiliate with the Gale Participation Rights.
The operating agreement of GE Gale, which is owned 80 percent by GEBAM, Inc., provides for, among other things, distributions of net cash flow, initially, in proportion to eachmember’s interest and subject to adjustment upon achievement of certain financial goals, as defined in the operating agreement.
GE Gale has a mortgage loan with a balance of $51.2 million at December 31, 2009. The loan bears interest at a rate of LIBOR plus 275 basis points and matures on January 9,2011.
The Company performs management, leasing, and other services for PFV and recognized $1.1 million, $881,000 and $1.1 million in income (net of $0, $288,000 and $1.6 million indirect costs) for such services in the years ended December 31, 2009, 2008 and 2007, respectively.
ROUTE 93 MASTER LLC (“Route 93 Participant”)/ROUTE 93 BEDFORD MASTER LLC (with the Route 93 Participant, collectively, the “Route 93 Venture”)On June 1, 2006, the Route 93 Venture was formed between the Route 93 Participant, a majority-owned subsidiary of the Company, having a 30 percent interest and the CommingledPension Trust Fund (Special Situation Property) of JPMorgan Chase Bank having a 70 percent interest, for the purpose of acquiring seven office buildings, aggregating 666,697square feet, located in the towns of Andover, Bedford and Billerica, Massachusetts. Profits and losses were shared by the partners in proportion to their respective interests until theinvestment yielded an 11 percent IRR, then sharing shifted to 40/60, and when the IRR reached 15 percent, then sharing shifted to 50/50.
The Route 93 Participant is a joint venture between the Company and a Gale affiliate. Profits and losses were shared by the partners under this venture in proportion to theirrespective interests (83.3/16.7) until the investment yielded an 11 percent IRR, then sharing shifted to 50/50.
On March 31, 2009, on account of the recent deterioration in the commercial real estate markets in the Boston area, the Company wrote off its investment in the venture and recordedan impairment charge in equity in earnings (loss) of $4.0 million (of which $0.6 million was attributable to noncontrolling interest in consolidated joint ventures) during the period.
82
The Route 93 Ventures had a mortgage loan with a $44.2 million balance at September 1, 2009 collateralized by its office properties. The loan bore interest at a rate of LIBOR plus220 basis points and was scheduled to mature on July 11, 2009. On September 2, 2009, the venture transferred the deeds to the lender in satisfaction of its obligations.
Through September 30, 2008, the Company had performed services for Route 93 Master LLC and Route 93 Bedford Master LLC and recognized $45,000 and zero in fees for suchservices for the years ended December 31, 2008 and 2007, respectively.
GALE KIMBALL, L.L.C.On June 15, 2006, the Company entered into a joint venture with a Gale Affiliate to form M-C Kimball, LLC (“M-C Kimball”). M-C Kimball was formed for the sole purpose ofacquiring a Gale Affiliate’s 33.33 percent membership interest in Gale Kimball, L.L.C. (“Gale Kimball”), an entity holding a 25 percent interest in 100 Kimball Drive LLC (“100Kimball”), which developed and placed in service a 175,000 square foot office property that is leased to a single tenant, located at 100 Kimball Drive, Parsippany, New Jersey (the“Kimball Property”).
The operating agreement of M-C Kimball provides, among other things, for the Gale Participation Rights (of which Mark Yeager, an Executive Vice President of the Company, has adirect 26 percent interest).
Gale Kimball is owned 33.33 percent by M-C Kimball and 66.67 percent by the Hampshire Generational Fund, L.L.C. (“Hampshire”). The operating agreement of Gale Kimballprovides, among other things, for the distribution of net cash flow, initially, in accordance with its members’ respective membership interests and, upon achievement of certainfinancial conditions, 50 percent to each of the Company and Hampshire.
100 Kimball is owned 25 percent by Gale Kimball and 75 percent by 100 Kimball Drive Realty Member LLC, an affiliate of JPMorgan (“JPM”). The operating agreement of 100Kimball provides, among other things, for the distributions to be made in the following order:
(i) first, to JPM, such that JPM is provided with an annual 12 percent compound preferred return on Preferred Equity Capital Contributions (as such term is defined in theoperating agreement of 100 Kimball and largely comprised of development and construction costs);
(ii) second, to JPM, as return of Preferred Equity Capital Contributions until complete repayment of such Preferred Equity Capital Contributions;(iii) third, to each of JPM and Gale Kimball in proportion to their respective membership interests until each member is provided, as a result of such distributions, with an
annual twelve percent compound return on the Member’s Capital Contributions (as defined in the operating agreement of 100 Kimball, and excluding Preferred EquityCapital Contributions, if any); and
(iv) fourth, 50 percent to each of JPM and Gale Kimball.
On September 21, 2007, 100 Kimball obtained a $47 million mortgage loan which bore interest at a rate of 5.95 percent and was scheduled to mature in September 2012. OnDecember 30, 2009 the venture paid the lender $40 million to satisfy the debt and recorded a gain of $7.0 million (of which the Company’s share of $579,000 is included in equity inearnings for the year ended December 31, 2009). Concurrently, 100 Kimball obtained a $32 million mortgage loan that bears interest at a rate of LIBOR plus 400 basis points andmatures on January 10, 2013 with two one-year extension options, subject to certain conditions and payment of a fee. LIBOR is defined as the greater of (i) 1.50%, and (ii) the rate ofinterest per annum reported as the thirty day London Interbank Offered Rate.
The Company performs management, leasing, and other services for the property owned by 100 Kimball for which it recognized $234,000, $377,000 and $1.7 million in income (netof $0, $1.0 million and $9.4 million in direct costs) for the years ended December 31, 2009, 2008 and 2007, respectively.
55 CORPORATE PARTNERS, LLCOn June 9, 2006, the Company entered into a joint venture with a Gale Affiliate to form 55 Corporate Partners L.L.C. (“55 Corporate”). 55 Corporate was formed for the sole purposeof acquiring from a Gale Affiliate a 50 percent interest in SLG 55 Corporate Drive II LLC (“SLG 55”), an entity presently holding a 100 percent indirect condominium interest in avacant land parcel located in Bridgewater, New Jersey, which can accommodate development of an approximately 205,000 square foot office building (the “55 CorporateProperty”). The remaining 50 percent in SLG 55 was owned by SLG Gale 55 Corporate LLC, an affiliate of SL Green Realty Corp. (“SLG Gale 55”).
83
In November 2007, Sanofi-Aventis U.S. Inc. (“Sanofi”), which occupied neighboring buildings, exercised its option to cause the venture to construct a building on the Property andhas signed a lease thereof. The lease has a term of fifteen years, subject to three five-year extension options. The construction of the building commenced in 2009 and is expected tobe delivered to the tenant in January 2011. The total estimated costs of the project are expected to be approximately $50.9 million.
The operating agreement of 55 Corporate provides, among other things, for the Gale Participation Rights (of which Mr. Yeager has a direct 26 percent interest). If Mr. Gale receivesany commission payments with respect to the Sanofi lease on the development property, Mr. Gale has agreed to pay to Mr. Yeager 26 percent of such payments.
The operating agreement of SLG 55 provided, among other things, for the distribution of the available net cash flow to each of 55 Corporate and SLG Gale 55 in proportion to theirrespective membership interests in SLG 55 (50 percent each).
On April 29, 2009, the Company acquired the remaining 50 percent interest in 55 Corporate from SLG Gale 55 Corporate LLC, an affiliate of SL Green. As of the closing date, theCompany owns 100 percent of and is consolidating the venture, 50 percent of which remains subject to the Gale Participation Rights. In connection with this transaction, theCompany also acquired the remaining interest in Mack-Green from an affiliate of SLG Gale 55 Corporate LLC.
12 VREELAND ASSOCIATES, L.L.C.On September 8, 2006, the Company entered into a joint venture with a Gale Affiliate to form M-C Vreeland, LLC (“M-C Vreeland”). M-C Vreeland was formed for the solepurpose of acquiring a Gale Affiliate’s 50 percent membership interest in 12 Vreeland Associates, L.L.C., an entity owning an office property located at 12 Vreeland Road, FlorhamPark, New Jersey.
The operating agreement of M-C Vreeland provides, among other things, for the Gale Participation Rights (of which Mr. Yeager has a direct 15 percent interest).
The office property at 12 Vreeland is a 139,750 square foot office building. The property is subject to a fully-amortizing mortgage loan, which matures on July 1, 2012, and bearsinterest at 6.9 percent per annum. As of December 31, 2009 the outstanding balance on the mortgage note was $5.0 million.
Under the operating agreement of 12 Vreeland Associates, L.L.C., M-C Vreeland has a 50 percent interest, with S/K Florham Park Associates, L.L.C. (the managing member) and itsaffiliate holding the other 50 percent.
BOSTON-DOWNTOWN CROSSINGOn October 20, 2006, the Company formed a joint venture (the “MC/Gale JV LLC”) with Gale International/426 Washington St. LLC (“Gale/426”), which, in turn, entered into ajoint venture (the “Vornado JV LLC”) with VNO 426 Washington Street JV LLC (“Vornado”), an affiliate of Vornado Realty LP, which was formed to acquire and redevelop theFilenes property located in the Downtown Crossing district of Boston, Massachusetts (the “Filenes Property”).
On January 25, 2007, (i) each of M-C/Gale JV LLC, Gale and Washington Street Realty Member LLC (“JPM”) formed a joint venture (“JPM JV LLC”), (ii) M-C/Gale JV LLCassigned its entire 50 percent ownership interest in the Vornado JV LLC to JPM JV LLC, (iii) the Limited Liability Company Agreement of Vornado JV LLC was amended to reflect,among other things, the change in the ownership structure described in subsection (ii) above, and (iv) the Limited Liability Company Agreement of MC/Gale JV LLC was amendedand restated to reflect, among other things, the change in the ownership structure described in subsection (ii) above. The Vornado JV LLC acquired the Filenes Property on January29, 2007, for approximately $100 million.
On or about September 16, 2008, Vornado JV LLC was reorganized in contemplation of developing and converting the Filenes property into a condominium consisting of a retailunit, an office unit, a parking unit, a hotel unit and a residential unit. Pursuant to this reorganization, (i) the Company and Gale/426 formed a new joint venture (“M-C/Gale JV IILLC”) and (ii) M-C/Gale JV II LLC and Washington Street Realty Member II LLC (“JPM II”) formed a new joint venture (“JPM JV II LLC”) to invest in a new joint venture(“Vornado JV II LLC”) with Vornado RTR DC LLC, an affiliate of Vornado Realty, LP (“Vornado II”). Following this reorganization, Vornado JV LLC owns the interests in theretail unit and the office unit (the “Filenes Office/Retail Component”) and Vornado JV II LLC owns the interests in the parking unit, the hotel unit and the residential unit (“the“Filenes Hotel/Residential/Parking Component”). In connection with the foregoing, (a) the Limited Liability Company Agreement of Vornado JV LLC, as amended, was amendedand restated to reflect, among other things, the change in the ownership structure described above, (b) the Limited Liability Company Agreement of JPM JV LLC was amended andrestated to reflect, among other things, the change in the ownership structure described above and (c) the Limited Liability Company Agreement of M-C/Gale JV LLC was amendedand restated to reflect, among other things, the change in the ownership structure described above.
84
As a result of the foregoing transactions, (A) (i) the Filenes Office/Retail Component is owned by Vornado JV LLC, (ii) Vornado JV LLC is owned 50 percent by each of Vornadoand JPM JV LLC, (iii) JPM JV LLC is owned 30 percent by M-C/Gale JV LLC, 70 percent by JPM and managed by Gale/426, which has no ownership interest in JPM JV LLC, and(iv) M-C/Gale JV LLC is owned 99.99 percent by the Company and 0.01 percent by Gale/426 and (B) (i) the Filenes Hotel/Residential/Parking Component is owned by Vornado JVII LLC, (ii) Vornado JV II LLC is owned 50 percent by each of Vornado II and JPM JV II LLC, (iii) JPM JV II LLC is owned 30 percent by M-C/Gale JV II LLC, 70 percent by JPMII and managed by Gale/426, which has no ownership interest in JPM JV II LLC, and (iv) M-C/Gale JV II LLC is owned 99.99 percent by the Company and 0.01 percent byGale/426. Thus, the Company holds approximately a 15 percent indirect ownership interest in each of Vornado JV LLC and Vornado JV II LLC and the Filenes Property.
Distributions are made (i) by Vornado JV LLC in proportion to its members’ respective ownership interests, (ii) by JPM JV LLC (a) initially, in proportion to its members’ respectiveownership interests until JPM’s investment yields an 11 percent IRR, (b) thereafter, 60/40 to JPM and MC/Gale JV LLC, respectively, until JPM’s investment yields a 15 percent IRRand (c) thereafter, 50/50 to JPM and MC/Gale JV LLC, respectively, and (iii) by MC/Gale JV LLC (w) initially, in proportion to its members’ respective ownership interests untileach member has received a 10 percent IRR on its investment, (x) thereafter, 65/35 to the Company and Gale/426, respectively, until the Company’s investment yields a 15 percentIRR, (y) if by the time the Company receives a 15 percent IRR on its investment, Gale/426 has not done so, 100 percent to Gale/426 until Gale/426’s investment yields a 15 percentIRR, and (z) thereafter, 50/50 to each of the Company and Gale/426.
Distributions are made (i) by Vornado JV II LLC in proportion to its members’ respective ownership interests, (ii) by JPM JV II LLC (a) initially, in proportion to its members’respective ownership interests until JPM II’s investment yields an 11 percent IRR, (b) thereafter, 60/40 to JPM II and M-C/Gale JV II LLC, respectively, until JPM II’s investmentyields a 15 percent IRR and (c) thereafter, 50/50 to JPM II and M-C/Gale JV II LLC, respectively, and (iii) by M-C/Gale JV II LLC (w) initially, in proportion to its members’respective ownership interests until each member has received a 10 percent IRR on its investment, (x) thereafter, 65/35 to the Company and Gale/426, respectively, until theCompany’s investment yields a 15 percent IRR, (y) if by the time the Company receives a 15 percent IRR on its investment, Gale/426 has not done so, 100 percent to Gale/426 untilGale/426’s investment yields a 15 percent IRR, and (z) thereafter, 50/50 to each of the Company and Gale/426.
The joint venture has suspended its plans for the development of the Filenes Property which was to include approximately 1.2 million square feet consisting of office, retail,condominium apartments, hotel and a parking garage. The project is subject to governmental approvals. The venture recorded an impairment charge of approximately $69.5 millionon its development project as of December 31, 2008.
GALE JEFFERSON, L.L.C.On August 22, 2007, the Company entered into a joint venture with a Gale Affiliate to form M-C Jefferson, L.L.C. (“M-C Jefferson”). M-C Jefferson was formed for the solepurpose of acquiring a Gale Affiliate’s 33.33 percent membership interest in Gale Jefferson, L.L.C. (“Gale Jefferson”), an entity holding a 25 percent interest in One Jefferson RoadLLC (‘One Jefferson”), which developed a 100,000 square foot office property at One Jefferson Road, Parsippany, New Jersey, (“the Jefferson Property”). The property has beenfully leased to a single tenant through August 2025.
The operating agreement of M-C Jefferson provides, among other things, for the Gale Participation Rights (of which Mark Yeager, an Executive Vice President of the Company, hasa direct 26 percent interest). Gale Jefferson is owned 33.33 percent by M-C Jefferson and 66.67 percent by the Hampshire Generational Fund, L.L.C. (“Hampshire”). The operatingagreements of Gale Jefferson provides, among other things, for the distribution of net cash flow, first, in accordance with its member’s respective interests until each member isprovided, as a result of such distributions, with an annual 12 percent compound return on the Member’s Capital Contributions, as defined in the operating agreement and secondly, 50percent to each of the Company and Hampshire.
85

One Jefferson has a construction loan in an amount not to exceed $21 million (with a balance of $13.9 million at December 31, 2009), bearing interest at a rate of LIBOR plus 160basis points and maturing on October 24, 2010 with a one-year extension option, subject to certain conditions and payment of a fee.
The Company performs management, leasing and other services for Gale Jefferson and recognized $190,000, $286,000 and $102,000 in income (net of $646,000, $9.6 million and$4.0 million in direct costs) for such services for the years ended December 31, 2009, 2008 and 2007, respectively.
86
SUMMARIES OF UNCONSOLIDATED JOINT VENTURESThe following is a summary of the financial position of the unconsolidated joint ventures in which the Company had investment interests as of December 31, 2009 and2008: (dollars in thousands)
December 31, 2009 Plaza Red Bank Princeton Boston- VIII & IX Ramland Harborside Corporate Gramercy Forrestal Route 93 Gale 55 12 Downtown Gale Combined Associates Realty South Pier Plaza I & II Agreement Village Portfolio Kimball Corporate Vreeland Crossing Jefferson TotalAssets: Rental property, net $ 9,560 -- $ 61,836 $ 24,884 $ 73,037 $ 38,722 -- -- -- $ 15,265 -- -- $ 223,304Other assets 997 -- 15,483 4,623 8,631 22,034 -- $ 1,992 -- 1,068 $ 45,884 $ 1,758 102,470Total assets $ 10,557 -- $ 77,319 $ 29,507 $ 81,668 $ 60,756 -- $ 1,992 -- $ 16,333 $ 45,884 $ 1,758 $ 325,774Liabilities and partners’/members’ capital (deficit): Mortgages, loans payable and other obligations -- -- $ 73,553 $ 20,764 $ 90,288 $ 51,186 -- -- -- $ 5,007 -- -- $ 240,798Other liabilities $ 532 -- 4,458 162 2,589 3,928 -- -- -- -- -- -- 11,669Partners’/members’ capital (deficit) 10,025 -- (692) 8,581 (11,209) 5,642 -- $ 1,992 -- 11,326 $ 45,884 $ 1,758 73,307Total liabilities and partners’/members’ capital (deficit) $ 10,557 -- $ 77,319 $ 29,507 $ 81,668 $ 60,756 -- $ 1,992 -- $ 16,333 $ 45,884 $ 1,758 $ 325,774Company’s investment in unconsolidated joint ventures, net $ 4,935 -- $ 860 $ 4,104 -- $ 1,211 -- $ 1,259 -- $ 9,599 $ 12,948 $ 764 $ 35,680
December 31, 2008 Plaza Red Bank Princeton Boston- VIII & IX Ramland Harborside Corporate Forrestal Route 93 Gale 55 12 Downtown Gale Combined Associates Realty South PierPlaza I & II M-G-G Village Portfolio Kimball Corporate Vreeland Crossing Jefferson TotalAssets: Rental property, net $ 10,173 -- $ 62,462 $ 24,507 $ 326,912 $ 41,058 $ 56,771 -- -- $ 14,598 -- -- $ 536,481Other assets 1,008 $ 20 16,979 4,301 45,391 21,680 495 -- $ 17,896 789 $ 43,577 $ 1,838 153,974Total assets $ 11,181 $ 20 $ 79,441 $ 28,808 $ 372,303 $ 62,738 $ 57,266 -- $ 17,896 $ 15,387 $ 43,577 $ 1,838 $ 690,455Liabilities and partners’/members’ capital (deficit): Mortgages, loans payable and other obligations -- -- $ 74,852 $ 20,416 $ 276,752 $ 52,800 $ 43,541 -- -- $ 7,170 -- -- $ 475,531Other liabilities $ 531 -- 3,950 87 23,805 4,156 985 -- -- -- -- -- 33,514Partners’/members’ capital (deficit) 10,650 $ 20 639 8,305 71,746 5,782 12,740 -- $ 17,896 8,217 $ 43,577 $ 1,838 181,410Total liabilities and partners’/members’ capital (deficit) $ 11,181 $ 20 $ 79,441 $ 28,808 $ 372,303 $ 62,738 $ 57,266 -- $ 17,896 $ 15,387 $ 43,577 $ 1,838 $ 690,455Company’s investment in unconsolidated joint ventures, net $ 5,248 -- $ 254 $ 3,929 $ 92,110 $ 1,342 $ 4,024 -- $ 9,068 $ 8,300 $ 13,464 $ 756 $ 138,495
87
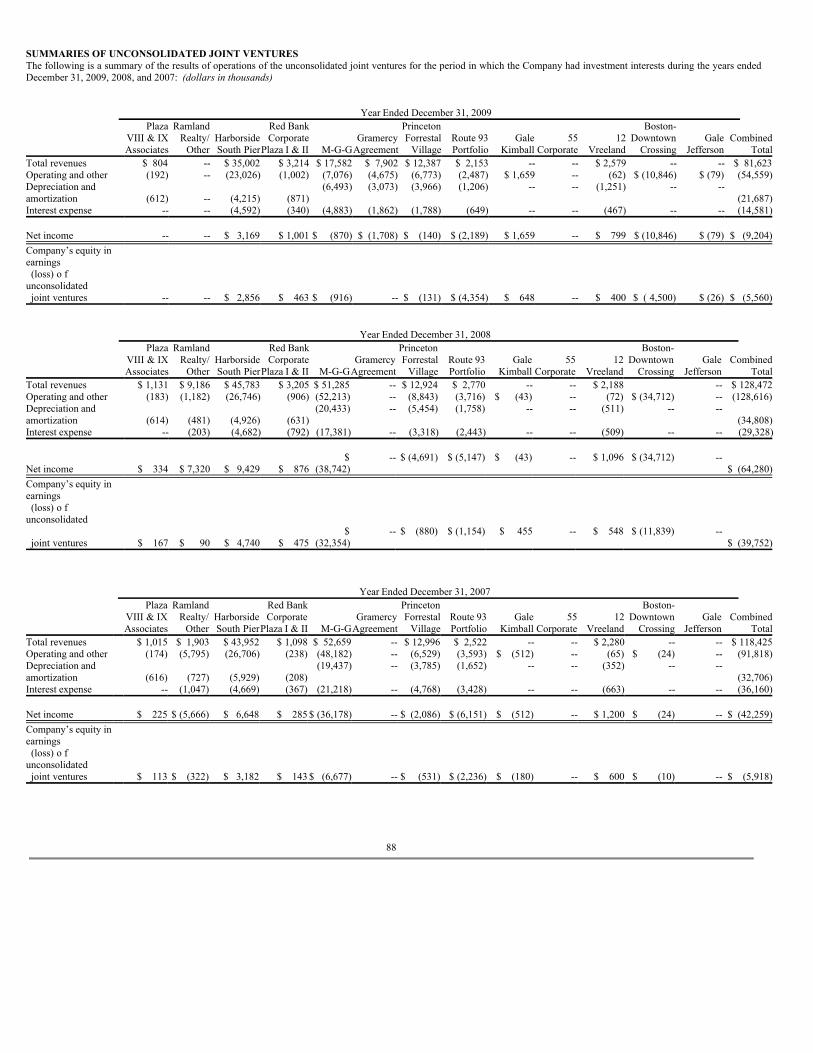
SUMMARIES OF UNCONSOLIDATED JOINT VENTURESThe following is a summary of the results of operations of the unconsolidated joint ventures for the period in which the Company had investment interests during the years endedDecember 31, 2009, 2008, and 2007: (dollars in thousands)
Year Ended December 31, 2009 Plaza Ramland Red Bank Princeton Boston- VIII & IX Realty/ Harborside Corporate Gramercy Forrestal Route 93 Gale 55 12 Downtown Gale Combined Associates Other South PierPlaza I & II M-G-GAgreement Village Portfolio Kimball Corporate Vreeland Crossing Jefferson TotalTotal revenues $ 804 -- $ 35,002 $ 3,214 $ 17,582 $ 7,902 $ 12,387 $ 2,153 -- -- $ 2,579 -- -- $ 81,623Operating and other (192) -- (23,026) (1,002) (7,076) (4,675) (6,773) (2,487) $ 1,659 -- (62) $ (10,846) $ (79) (54,559)Depreciation andamortization (612) -- (4,215) (871)
(6,493) (3,073) (3,966) (1,206) -- -- (1,251) -- --(21,687)
Interest expense -- -- (4,592) (340) (4,883) (1,862) (1,788) (649) -- -- (467) -- -- (14,581) Net income -- -- $ 3,169 $ 1,001 $ (870) $ (1,708) $ (140) $ (2,189) $ 1,659 -- $ 799 $ (10,846) $ (79) $ (9,204)Company’s equity inearnings
(loss) o funconsolidated
joint ventures -- -- $ 2,856 $ 463 $ (916) -- $ (131) $ (4,354) $ 648 -- $ 400 $ ( 4,500) $ (26) $ (5,560)
Year Ended December 31, 2008 Plaza Ramland Red Bank Princeton Boston- VIII & IX Realty/ Harborside Corporate Gramercy Forrestal Route 93 Gale 55 12 Downtown Gale Combined Associates Other South PierPlaza I & II M-G-GAgreement Village Portfolio Kimball Corporate Vreeland Crossing Jefferson TotalTotal revenues $ 1,131 $ 9,186 $ 45,783 $ 3,205 $ 51,285 -- $ 12,924 $ 2,770 -- -- $ 2,188 -- $ 128,472Operating and other (183) (1,182) (26,746) (906) (52,213) -- (8,843) (3,716) $ (43) -- (72) $ (34,712) -- (128,616)Depreciation andamortization (614) (481) (4,926) (631)
(20,433) -- (5,454) (1,758) -- -- (511) -- --(34,808)
Interest expense -- (203) (4,682) (792) (17,381) -- (3,318) (2,443) -- -- (509) -- -- (29,328)
Net income $ 334 $ 7,320 $ 9,429 $ 876$
(38,742)-- $ (4,691) $ (5,147) $ (43) -- $ 1,096 $ (34,712) --
$ (64,280)Company’s equity inearnings
(loss) o funconsolidated
joint ventures $ 167 $ 90 $ 4,740 $ 475$
(32,354)-- $ (880) $ (1,154) $ 455 -- $ 548 $ (11,839) --
$ (39,752)
Year Ended December 31, 2007 Plaza Ramland Red Bank Princeton Boston- VIII & IX Realty/ Harborside Corporate Gramercy Forrestal Route 93 Gale 55 12 Downtown Gale Combined Associates Other South PierPlaza I & II M-G-GAgreement Village Portfolio Kimball Corporate Vreeland Crossing Jefferson TotalTotal revenues $ 1,015 $ 1,903 $ 43,952 $ 1,098 $ 52,659 -- $ 12,996 $ 2,522 -- -- $ 2,280 -- -- $ 118,425Operating and other (174) (5,795) (26,706) (238) (48,182) -- (6,529) (3,593) $ (512) -- (65) $ (24) -- (91,818)Depreciation andamortization (616) (727) (5,929) (208)
(19,437) -- (3,785) (1,652) -- -- (352) -- --(32,706)
Interest expense -- (1,047) (4,669) (367) (21,218) -- (4,768) (3,428) -- -- (663) -- -- (36,160) Net income $ 225 $ (5,666) $ 6,648 $ 285 $ (36,178) -- $ (2,086) $ (6,151) $ (512) -- $ 1,200 $ (24) -- $ (42,259)Company’s equity inearnings
(loss) o funconsolidated
joint ventures $ 113 $ (322) $ 3,182 $ 143 $ (6,677) -- $ (531) $ (2,236) $ (180) -- $ 600 $ (10) -- $ (5,918)
88
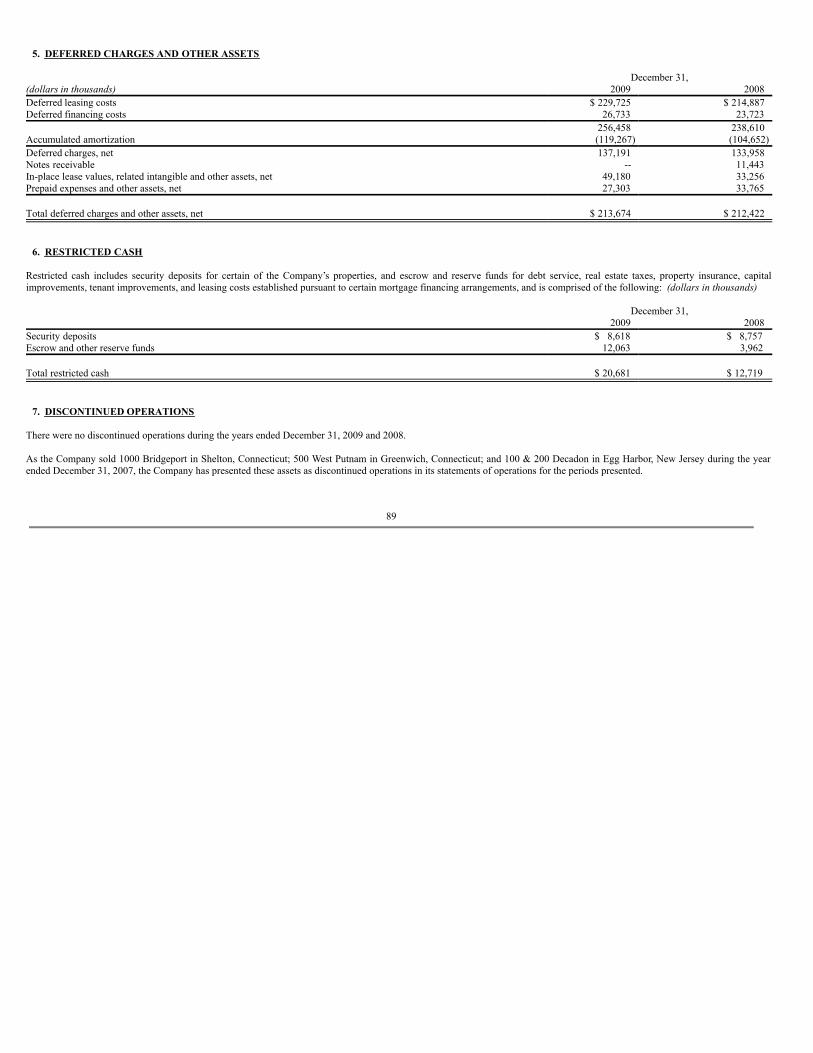
5. DEFERRED CHARGES AND OTHER ASSETS
December 31,(dollars in thousands) 2009 2008Deferred leasing costs $ 229,725 $ 214,887Deferred financing costs 26,733 23,723 256,458 238,610Accumulated amortization (119,267) (104,652)Deferred charges, net 137,191 133,958Notes receivable -- 11,443In-place lease values, related intangible and other assets, net 49,180 33,256Prepaid expenses and other assets, net 27,303 33,765 Total deferred charges and other assets, net $ 213,674 $ 212,422
6. RESTRICTED CASH
Restricted cash includes security deposits for certain of the Company’s properties, and escrow and reserve funds for debt service, real estate taxes, property insurance, capitalimprovements, tenant improvements, and leasing costs established pursuant to certain mortgage financing arrangements, and is comprised of the following: (dollars in thousands)
December 31, 2009 2008Security deposits $ 8,618 $ 8,757Escrow and other reserve funds 12,063 3,962 Total restricted cash $ 20,681 $ 12,719
7. DISCONTINUED OPERATIONS
There were no discontinued operations during the years ended December 31, 2009 and 2008.
As the Company sold 1000 Bridgeport in Shelton, Connecticut; 500 West Putnam in Greenwich, Connecticut; and 100 & 200 Decadon in Egg Harbor, New Jersey during the yearended December 31, 2007, the Company has presented these assets as discontinued operations in its statements of operations for the periods presented.
89
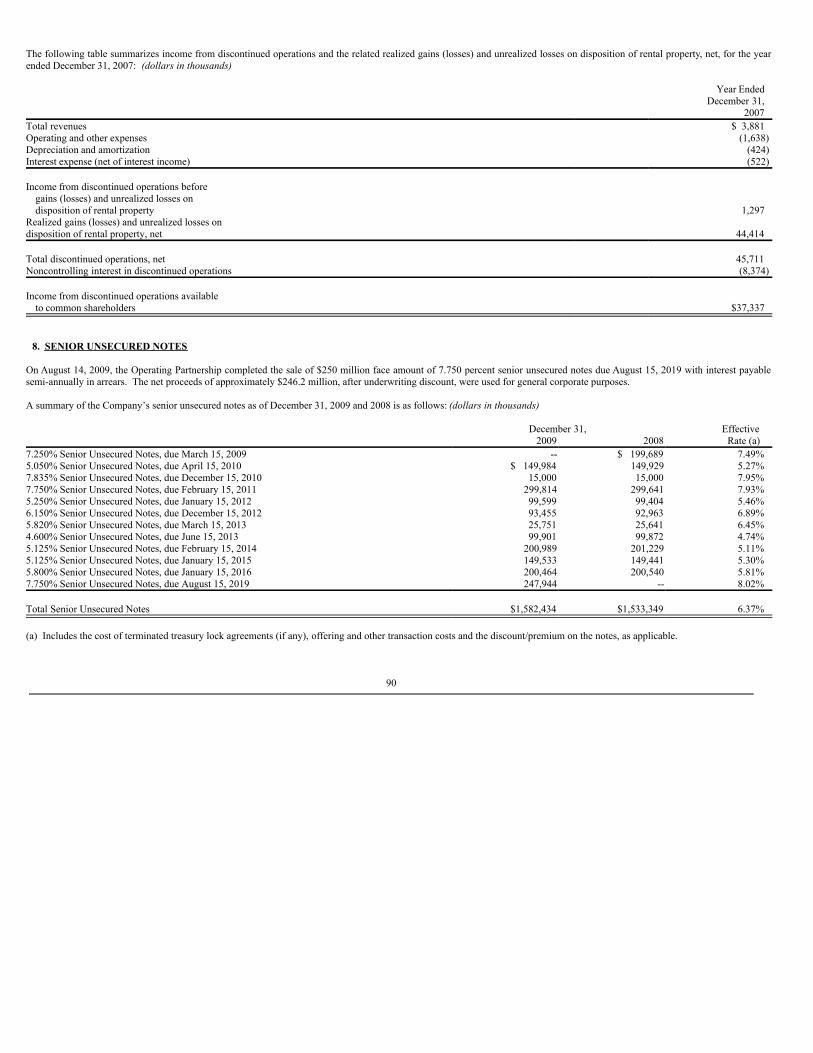
The following table summarizes income from discontinued operations and the related realized gains (losses) and unrealized losses on disposition of rental property, net, for the yearended December 31, 2007: (dollars in thousands)
Year Ended December 31, 2007Total revenues $ 3,881Operating and other expenses (1,638)Depreciation and amortization (424)Interest expense (net of interest income) (522) Income from discontinued operations before
gains (losses) and unrealized losses on disposition of rental property 1,297
Realized gains (losses) and unrealized losses on disposition of rental property, net 44,414 Total discontinued operations, net 45,711Noncontrolling interest in discontinued operations (8,374) Income from discontinued operations available
to common shareholders $37,337
8. SENIOR UNSECURED NOTES
On August 14, 2009, the Operating Partnership completed the sale of $250 million face amount of 7.750 percent senior unsecured notes due August 15, 2019 with interest payablesemi-annually in arrears. The net proceeds of approximately $246.2 million, after underwriting discount, were used for general corporate purposes.
A summary of the Company’s senior unsecured notes as of December 31, 2009 and 2008 is as follows: (dollars in thousands)
December 31, Effective 2009 2008 Rate (a)7.250% Senior Unsecured Notes, due March 15, 2009 -- $ 199,689 7.49%5.050% Senior Unsecured Notes, due April 15, 2010 $ 149,984 149,929 5.27%7.835% Senior Unsecured Notes, due December 15, 2010 15,000 15,000 7.95%7.750% Senior Unsecured Notes, due February 15, 2011 299,814 299,641 7.93%5.250% Senior Unsecured Notes, due January 15, 2012 99,599 99,404 5.46%6.150% Senior Unsecured Notes, due December 15, 2012 93,455 92,963 6.89%5.820% Senior Unsecured Notes, due March 15, 2013 25,751 25,641 6.45%4.600% Senior Unsecured Notes, due June 15, 2013 99,901 99,872 4.74%5.125% Senior Unsecured Notes, due February 15, 2014 200,989 201,229 5.11%5.125% Senior Unsecured Notes, due January 15, 2015 149,533 149,441 5.30%5.800% Senior Unsecured Notes, due January 15, 2016 200,464 200,540 5.81%7.750% Senior Unsecured Notes, due August 15, 2019 247,944 -- 8.02% Total Senior Unsecured Notes $1,582,434 $1,533,349 6.37% (a) Includes the cost of terminated treasury lock agreements (if any), offering and other transaction costs and the discount/premium on the notes, as applicable.
90
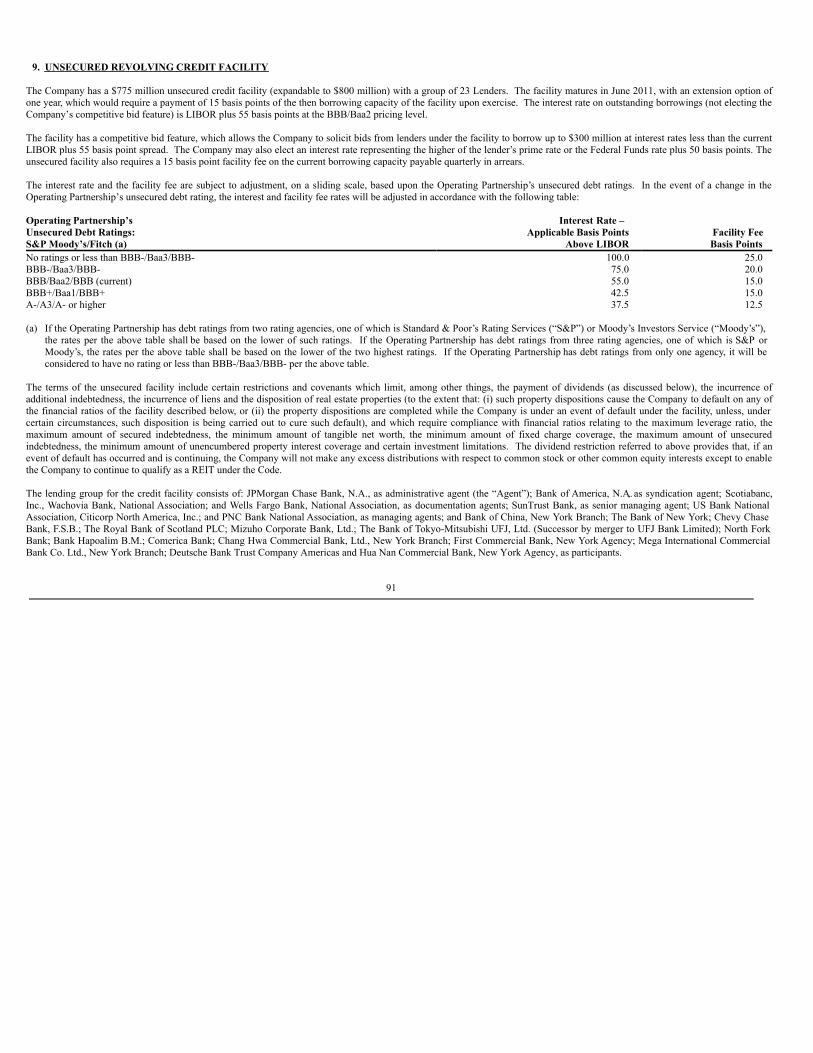
9. UNSECURED REVOLVING CREDIT FACILITY
The Company has a $775 million unsecured credit facility (expandable to $800 million) with a group of 23 Lenders. The facility matures in June 2011, with an extension option ofone year, which would require a payment of 15 basis points of the then borrowing capacity of the facility upon exercise. The interest rate on outstanding borrowings (not electing theCompany’s competitive bid feature) is LIBOR plus 55 basis points at the BBB/Baa2 pricing level.
The facility has a competitive bid feature, which allows the Company to solicit bids from lenders under the facility to borrow up to $300 million at interest rates less than the currentLIBOR plus 55 basis point spread. The Company may also elect an interest rate representing the higher of the lender’s prime rate or the Federal Funds rate plus 50 basis points. Theunsecured facility also requires a 15 basis point facility fee on the current borrowing capacity payable quarterly in arrears.
The interest rate and the facility fee are subject to adjustment, on a sliding scale, based upon the Operating Partnership’s unsecured debt ratings. In the event of a change in theOperating Partnership’s unsecured debt rating, the interest and facility fee rates will be adjusted in accordance with the following table:
Operating Partnership’s Interest Rate – Unsecured Debt Ratings: Applicable Basis Points Facility FeeS&P Moody’s/Fitch (a) Above LIBOR Basis PointsNo ratings or less than BBB-/Baa3/BBB- 100.0 25.0BBB-/Baa3/BBB- 75.0 20.0BBB/Baa2/BBB (current) 55.0 15.0BBB+/Baa1/BBB+ 42.5 15.0A-/A3/A- or higher 37.5 12.5 (a) If the Operating Partnership has debt ratings from two rating agencies, one of which is Standard & Poor’s Rating Services (“S&P”) or Moody’s Investors Service (“Moody’s”),
the rates per the above table shall be based on the lower of such ratings. If the Operating Partnership has debt ratings from three rating agencies, one of which is S&P orMoody’s, the rates per the above table shall be based on the lower of the two highest ratings. If the Operating Partnership has debt ratings from only one agency, it will beconsidered to have no rating or less than BBB-/Baa3/BBB- per the above table.
The terms of the unsecured facility include certain restrictions and covenants which limit, among other things, the payment of dividends (as discussed below), the incurrence ofadditional indebtedness, the incurrence of liens and the disposition of real estate properties (to the extent that: (i) such property dispositions cause the Company to default on any ofthe financial ratios of the facility described below, or (ii) the property dispositions are completed while the Company is under an event of default under the facility, unless, undercertain circumstances, such disposition is being carried out to cure such default), and which require compliance with financial ratios relating to the maximum leverage ratio, themaximum amount of secured indebtedness, the minimum amount of tangible net worth, the minimum amount of fixed charge coverage, the maximum amount of unsecuredindebtedness, the minimum amount of unencumbered property interest coverage and certain investment limitations. The dividend restriction referred to above provides that, if anevent of default has occurred and is continuing, the Company will not make any excess distributions with respect to common stock or other common equity interests except to enablethe Company to continue to qualify as a REIT under the Code.
The lending group for the credit facility consists of: JPMorgan Chase Bank, N.A., as administrative agent (the “Agent”); Bank of America, N.A., as syndication agent; Scotiabanc,Inc., Wachovia Bank, National Association; and Wells Fargo Bank, National Association, as documentation agents; SunTrust Bank, as senior managing agent; US Bank NationalAssociation, Citicorp North America, Inc.; and PNC Bank National Association, as managing agents; and Bank of China, New York Branch; The Bank of New York; Chevy ChaseBank, F.S.B.; The Royal Bank of Scotland PLC; Mizuho Corporate Bank, Ltd.; The Bank of Tokyo-Mitsubishi UFJ, Ltd. (Successor by merger to UFJ Bank Limited); North ForkBank; Bank Hapoalim B.M.; Comerica Bank; Chang Hwa Commercial Bank, Ltd., New York Branch; First Commercial Bank, New York Agency; Mega International CommercialBank Co. Ltd., New York Branch; Deutsche Bank Trust Company Americas and Hua Nan Commercial Bank, New York Agency, as participants.
91

As of December 31, 2009 and 2008, the Company had outstanding borrowings of zero and $161 million, respectively, under its unsecured revolving credit facility.
MONEY MARKET LOANThe Company has an agreement with JPMorgan Chase Bank to participate in a noncommitted money market loan program (“Money Market Loan”). The Money Market Loan is anunsecured borrowing of up to $75 million arranged by JPMorgan Chase Bank with maturities of 30 days or less. The rate of interest on the Money Market Loan borrowing is set atthe time of each borrowing. As of December 31, 2009 and 2008, the Company had no outstanding borrowings under the Money Market Loan.
92
10. MORTGAGES, LOANS PAYABLE AND OTHER OBLIGATIONS
The Company has mortgages, loans payable and other obligations which primarily consist of various loans collateralized by certain of the Company’s rental properties. As ofDecember 31, 2009, 32 of the Company’s properties, with a total book value of approximately $1,019,786,000, are encumbered by the Company’s mortgages and loanspayable. Payments on mortgages, loans payable and other obligations are generally due in monthly installments of principal and interest, or interest only.
On January 27, 2009, the Company obtained $64.5 million in mortgage financing from Guardian Life Insurance Company of America. The two mortgage loans, which arecollateralized by one and three office properties located in Clark and Red Bank, New Jersey, respectively, both carry an effective rate of 7.31 percent per annum and carry a 10-yearterm.
On April 29, 2009, in connection with the SL Green Transactions, the Company consolidated 11 office properties, which are encumbered by mortgage loans with Wachovia CMBS aslender which were recorded at an aggregate amount of approximately $151.1 million at the closing date. The mortgage loans carry an average effective interest rate of 10.66 percentper annum and mature through May 2016.
On June 30, 2009, the Company obtained $17.0 million in mortgage financing from Valley National Bank. The mortgage loan, which is collateralized by an office property inWoodbridge, New Jersey, is for a 25-year term and bears interest at an effective rate of 6.94 percent per annum through the end of the 10 th year. The coupon interest rate will be resetat the end of year 10 and year 20 at 225 basis points over the 10-year treasury yield 45 days prior to the reset dates, with a minimum rate of 6.875 percent.
As a result of the recent expirations of the remainder of the Company’s acquired lease obligations incurred as part of the consideration for certain properties acquired in 2004(“Assumed Obligations”) included in mortgages, loans payable and other obligations, the Company recorded a gain on retirement of other obligations of approximately $1.7 millionduring the year ended December 31, 2009 on account of the remaining unused balance of the obligations at expiration.
93
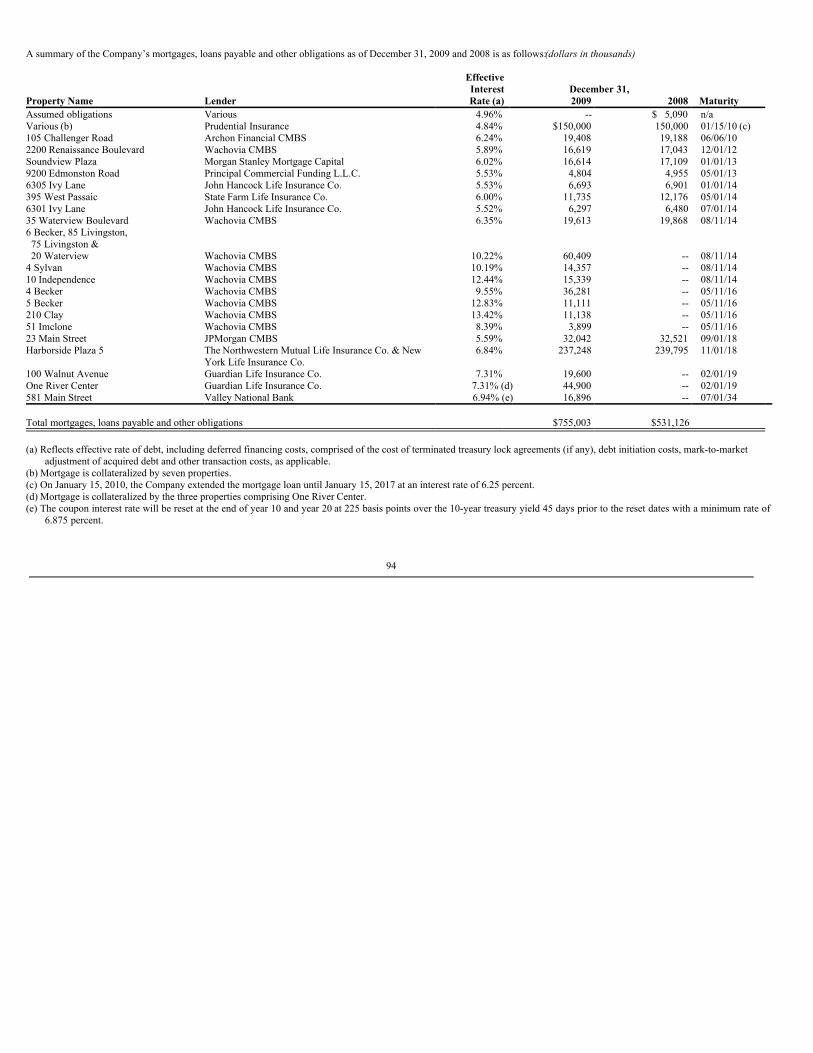
A summary of the Company’s mortgages, loans payable and other obligations as of December 31, 2009 and 2008 is as follows: (dollars in thousands)
Effective Interest December 31, Property Name Lender Rate (a) 2009 2008 Maturity Assumed obligations Various 4.96% -- $ 5,090 n/a Various (b) Prudential Insurance 4.84% $150,000 150,000 01/15/10 (c)105 Challenger Road Archon Financial CMBS 6.24% 19,408 19,188 06/06/10 2200 Renaissance Boulevard Wachovia CMBS 5.89% 16,619 17,043 12/01/12 Soundview Plaza Morgan Stanley Mortgage Capital 6.02% 16,614 17,109 01/01/13 9200 Edmonston Road Principal Commercial Funding L.L.C. 5.53% 4,804 4,955 05/01/13 6305 Ivy Lane John Hancock Life Insurance Co. 5.53% 6,693 6,901 01/01/14 395 West Passaic State Farm Life Insurance Co. 6.00% 11,735 12,176 05/01/14 6301 Ivy Lane John Hancock Life Insurance Co. 5.52% 6,297 6,480 07/01/14 35 Waterview Boulevard Wachovia CMBS 6.35% 19,613 19,868 08/11/14 6 Becker, 85 Livingston, 75 Livingston & 20 Waterview Wachovia CMBS 10.22% 60,409 -- 08/11/14
4 Sylvan Wachovia CMBS 10.19% 14,357 -- 08/11/14 10 Independence Wachovia CMBS 12.44% 15,339 -- 08/11/14 4 Becker Wachovia CMBS 9.55% 36,281 -- 05/11/16 5 Becker Wachovia CMBS 12.83% 11,111 -- 05/11/16 210 Clay Wachovia CMBS 13.42% 11,138 -- 05/11/16 51 Imclone Wachovia CMBS 8.39% 3,899 -- 05/11/16 23 Main Street JPMorgan CMBS 5.59% 32,042 32,521 09/01/18 Harborside Plaza 5 The Northwestern Mutual Life Insurance Co. & New
York Life Insurance Co.6.84% 237,248 239,795 11/01/18
100 Walnut Avenue Guardian Life Insurance Co. 7.31% 19,600 -- 02/01/19 One River Center Guardian Life Insurance Co. 7.31% (d) 44,900 -- 02/01/19 581 Main Street Valley National Bank 6.94% (e) 16,896 -- 07/01/34 Total mortgages, loans payable and other obligations $755,003 $531,126
(a) Reflects effective rate of debt, including deferred financing costs, comprised of the cost of terminated treasury lock agreements (if any), debt initiation costs, mark-to-marketadjustment of acquired debt and other transaction costs, as applicable.
(b) Mortgage is collateralized by seven properties.(c) On January 15, 2010, the Company extended the mortgage loan until January 15, 2017 at an interest rate of 6.25 percent.(d) Mortgage is collateralized by the three properties comprising One River Center.(e) The coupon interest rate will be reset at the end of year 10 and year 20 at 225 basis points over the 10-year treasury yield 45 days prior to the reset dates with a minimum rate of
6.875 percent.
94
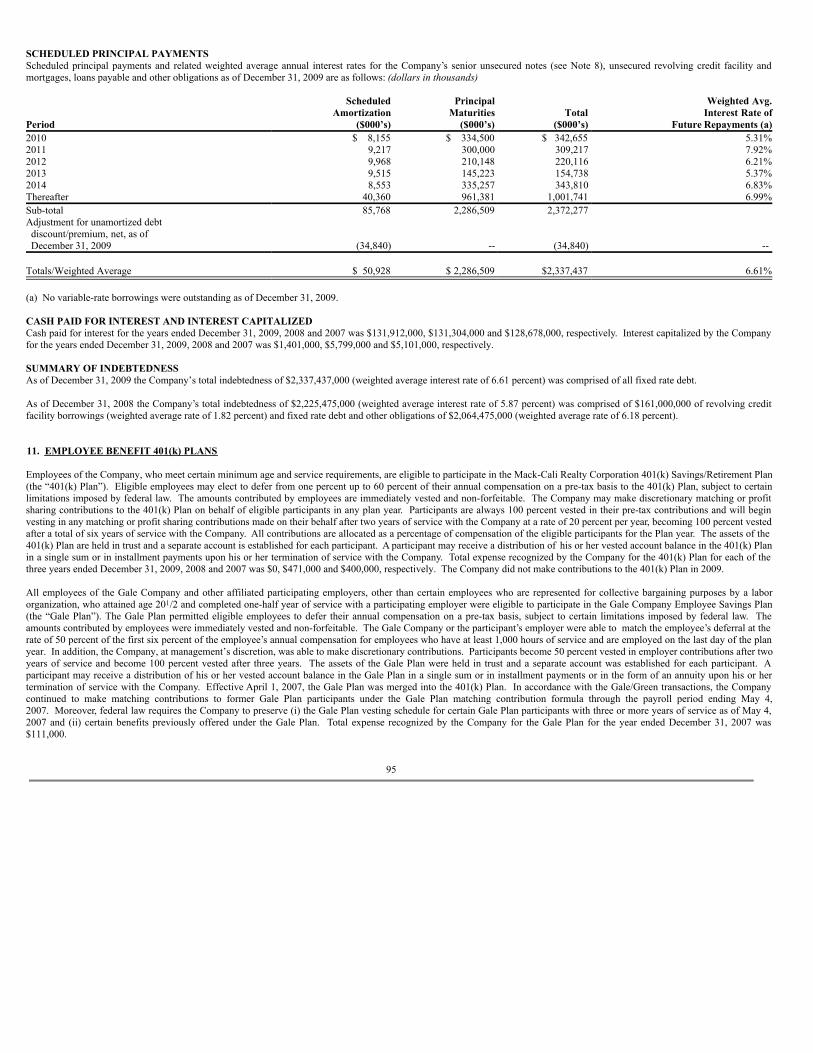
SCHEDULED PRINCIPAL PAYMENTSScheduled principal payments and related weighted average annual interest rates for the Company’s senior unsecured notes (see Note 8), unsecured revolving credit facility andmortgages, loans payable and other obligations as of December 31, 2009 are as follows: (dollars in thousands)
Scheduled Principal Weighted Avg. Amortization Maturities Total Interest Rate ofPeriod ($000’s) ($000’s) ($000’s) Future Repayments (a)2010 $ 8,155 $ 334,500 $ 342,655 5.31%2011 9,217 300,000 309,217 7.92%2012 9,968 210,148 220,116 6.21%2013 9,515 145,223 154,738 5.37%2014 8,553 335,257 343,810 6.83%Thereafter 40,360 961,381 1,001,741 6.99%Sub-total 85,768 2,286,509 2,372,277 Adjustment for unamortized debt discount/premium, net, as of December 31, 2009 (34,840) -- (34,840) -- Totals/Weighted Average $ 50,928 $ 2,286,509 $2,337,437 6.61% (a) No variable-rate borrowings were outstanding as of December 31, 2009.
CASH PAID FOR INTEREST AND INTEREST CAPITALIZEDCash paid for interest for the years ended December 31, 2009, 2008 and 2007 was $131,912,000, $131,304,000 and $128,678,000, respectively. Interest capitalized by the Companyfor the years ended December 31, 2009, 2008 and 2007 was $1,401,000, $5,799,000 and $5,101,000, respectively.
SUMMARY OF INDEBTEDNESSAs of December 31, 2009 the Company’s total indebtedness of $2,337,437,000 (weighted average interest rate of 6.61 percent) was comprised of all fixed rate debt.
As of December 31, 2008 the Company’s total indebtedness of $2,225,475,000 (weighted average interest rate of 5.87 percent) was comprised of $161,000,000 of revolving creditfacility borrowings (weighted average rate of 1.82 percent) and fixed rate debt and other obligations of $2,064,475,000 (weighted average rate of 6.18 percent).
11. EMPLOYEE BENEFIT 401(k) PLANS
Employees of the Company, who meet certain minimum age and service requirements, are eligible to participate in the Mack-Cali Realty Corporation 401(k) Savings/Retirement Plan(the “401(k) Plan”). Eligible employees may elect to defer from one percent up to 60 percent of their annual compensation on a pre-tax basis to the 401(k) Plan, subject to certainlimitations imposed by federal law. The amounts contributed by employees are immediately vested and non-forfeitable. The Company may make discretionary matching or profitsharing contributions to the 401(k) Plan on behalf of eligible participants in any plan year. Participants are always 100 percent vested in their pre-tax contributions and will beginvesting in any matching or profit sharing contributions made on their behalf after two years of service with the Company at a rate of 20 percent per year, becoming 100 percent vestedafter a total of six years of service with the Company. All contributions are allocated as a percentage of compensation of the eligible participants for the Plan year. The assets of the401(k) Plan are held in trust and a separate account is established for each participant. A participant may receive a distribution of his or her vested account balance in the 401(k) Planin a single sum or in installment payments upon his or her termination of service with the Company. Total expense recognized by the Company for the 401(k) Plan for each of thethree years ended December 31, 2009, 2008 and 2007 was $0, $471,000 and $400,000, respectively. The Company did not make contributions to the 401(k) Plan in 2009.
All employees of the Gale Company and other affiliated participating employers, other than certain employees who are represented for collective bargaining purposes by a labororganization, who attained age 201/2 and completed one-half year of service with a participating employer were eligible to participate in the Gale Company Employee Savings Plan(the “Gale Plan”). The Gale Plan permitted eligible employees to defer their annual compensation on a pre-tax basis, subject to certain limitations imposed by federal law. Theamounts contributed by employees were immediately vested and non-forfeitable. The Gale Company or the participant’s employer were able to match the employee’s deferral at therate of 50 percent of the first six percent of the employee’s annual compensation for employees who have at least 1,000 hours of service and are employed on the last day of the planyear. In addition, the Company, at management’s discretion, was able to make discretionary contributions. Participants become 50 percent vested in employer contributions after twoyears of service and become 100 percent vested after three years. The assets of the Gale Plan were held in trust and a separate account was established for each participant. Aparticipant may receive a distribution of his or her vested account balance in the Gale Plan in a single sum or in installment payments or in the form of an annuity upon his or hertermination of service with the Company. Effective April 1, 2007, the Gale Plan was merged into the 401(k) Plan. In accordance with the Gale/Green transactions, the Companycontinued to make matching contributions to former Gale Plan participants under the Gale Plan matching contribution formula through the payroll period ending May 4,2007. Moreover, federal law requires the Company to preserve (i) the Gale Plan vesting schedule for certain Gale Plan participants with three or more years of service as of May 4,2007 and (ii) certain benefits previously offered under the Gale Plan. Total expense recognized by the Company for the Gale Plan for the year ended December 31, 2007 was$111,000.
95
12. DISCLOSURE OF FAIR VALUE OF FINANCIAL INSTRUMENTS
The following disclosure of estimated fair value was determined by management using available market information and appropriate valuation methodologies. However,considerable judgment is necessary to interpret market data and develop estimated fair value. Accordingly, the estimates presented herein are not necessarily indicative of theamounts the Company could realize on disposition of the financial instruments at December 31, 2009 and 2008. The use of different market assumptions and/or estimationmethodologies may have a material effect on the estimated fair value amounts.
Cash equivalents, marketable securities, receivables, accounts payable, and accrued expenses and other liabilities are carried at amounts which reasonably approximate their fairvalues as of December 31, 2009 and 2008.
The fair value of the Company’s long-term debt, consisting of senior unsecured notes, an unsecured revolving credit facility and mortgages, loans payable and other obligationsaggregate approximately $2.4 billion and $1.8 billion as compared to the book value of approximately $2.3 billion and $2.2 billion as of December 31, 2009 and 2008,respectively. The fair value of the Company’s long-term debt is estimated on a level 2 basis (as provided by ASC 820, Fair Value Measurements and Disclosures), using a discountedcash flow analysis based on the borrowing rates currently available to the Company for loans with similar terms and maturities. The fair value of the mortgage debt and the unsecurednotes was determined by discounting the future contractual interest and principal payments by a market rate.
Disclosure about fair value of financial instruments is based on pertinent information available to management as of December 31, 2009 and 2008. Although management is notaware of any factors that would significantly affect the fair value amounts, such amounts have not been comprehensively revalued for purposes of these financial statements sinceDecember 31, 2009 and current estimates of fair value may differ significantly from the amounts presented herein.
13. COMMITMENTS AND CONTINGENCIES
TAX ABATEMENT AGREEMENTSHarborside Financial CenterPursuant to agreements with the City of Jersey City, New Jersey, the Company is required to make payments in lieu of property taxes (“PILOT”) on certain of its properties located inJersey City, as follows:
The Harborside Plaza 4-A agreement, which commenced in 2000, is for a term of 20 years. The PILOT is equal to two percent of Total Project costs, as defined, and increases by10 percent in years 7, 10 and 13 and by 50 percent in year 16. Total Project costs, as defined, are $45.5 million. The PILOT totaled $1,001,000 for each of the years endedDecember 31, 2009, 2008 and 2007, respectively.
96
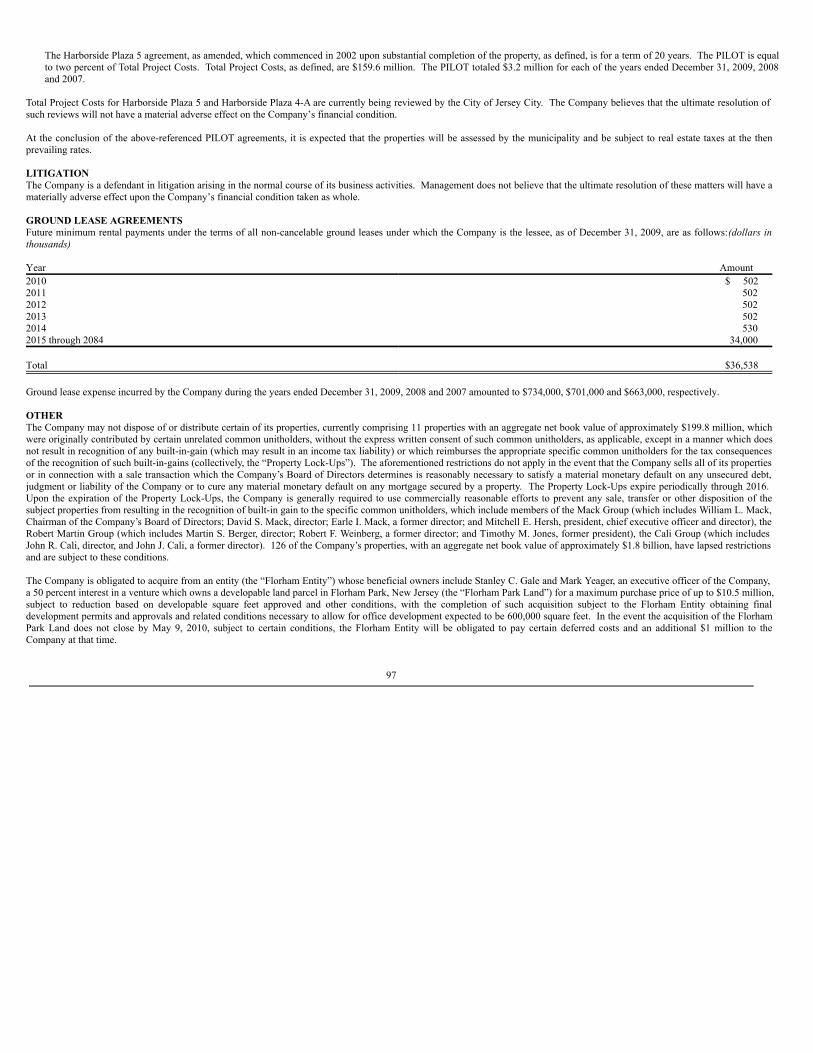
The Harborside Plaza 5 agreement, as amended, which commenced in 2002 upon substantial completion of the property, as defined, is for a term of 20 years. The PILOT is equalto two percent of Total Project Costs. Total Project Costs, as defined, are $159.6 million. The PILOT totaled $3.2 million for each of the years ended December 31, 2009, 2008and 2007.
Total Project Costs for Harborside Plaza 5 and Harborside Plaza 4-A are currently being reviewed by the City of Jersey City. The Company believes that the ultimate resolution ofsuch reviews will not have a material adverse effect on the Company’s financial condition.
At the conclusion of the above-referenced PILOT agreements, it is expected that the properties will be assessed by the municipality and be subject to real estate taxes at the thenprevailing rates.
LITIGATIONThe Company is a defendant in litigation arising in the normal course of its business activities. Management does not believe that the ultimate resolution of these matters will have amaterially adverse effect upon the Company’s financial condition taken as whole.
GROUND LEASE AGREEMENTSFuture minimum rental payments under the terms of all non-cancelable ground leases under which the Company is the lessee, as of December 31, 2009, are as follows: (dollars inthousands)
Year Amount2010 $ 5022011 5022012 5022013 5022014 5302015 through 2084 34,000 Total $36,538
Ground lease expense incurred by the Company during the years ended December 31, 2009, 2008 and 2007 amounted to $734,000, $701,000 and $663,000, respectively.
OTHERThe Company may not dispose of or distribute certain of its properties, currently comprising 11 properties with an aggregate net book value of approximately $199.8 million, whichwere originally contributed by certain unrelated common unitholders, without the express written consent of such common unitholders, as applicable, except in a manner which doesnot result in recognition of any built-in-gain (which may result in an income tax liability) or which reimburses the appropriate specific common unitholders for the tax consequencesof the recognition of such built-in-gains (collectively, the “Property Lock-Ups”). The aforementioned restrictions do not apply in the event that the Company sells all of its propertiesor in connection with a sale transaction which the Company’s Board of Directors determines is reasonably necessary to satisfy a material monetary default on any unsecured debt,judgment or liability of the Company or to cure any material monetary default on any mortgage secured by a property. The Property Lock-Ups expire periodically through 2016. Upon the expiration of the Property Lock-Ups, the Company is generally required to use commercially reasonable efforts to prevent any sale, transfer or other disposition of thesubject properties from resulting in the recognition of built-in gain to the specific common unitholders, which include members of the Mack Group (which includes William L. Mack,Chairman of the Company’s Board of Directors; David S. Mack, director; Earle I. Mack, a former director; and Mitchell E. Hersh, president, chief executive officer and director), theRobert Martin Group (which includes Martin S. Berger, director; Robert F. Weinberg, a former director; and Timothy M. Jones, former president), the Cali Group (which includesJohn R. Cali, director, and John J. Cali, a former director). 126 of the Company’s properties, with an aggregate net book value of approximately $1.8 billion, have lapsed restrictionsand are subject to these conditions.
The Company is obligated to acquire from an entity (the “Florham Entity”) whose beneficial owners include Stanley C. Gale and Mark Yeager, an executive officer of the Company,a 50 percent interest in a venture which owns a developable land parcel in Florham Park, New Jersey (the “Florham Park Land”) for a maximum purchase price of up to $10.5 million,subject to reduction based on developable square feet approved and other conditions, with the completion of such acquisition subject to the Florham Entity obtaining finaldevelopment permits and approvals and related conditions necessary to allow for office development expected to be 600,000 square feet. In the event the acquisition of the FlorhamPark Land does not close by May 9, 2010, subject to certain conditions, the Florham Entity will be obligated to pay certain deferred costs and an additional $1 million to theCompany at that time.
97
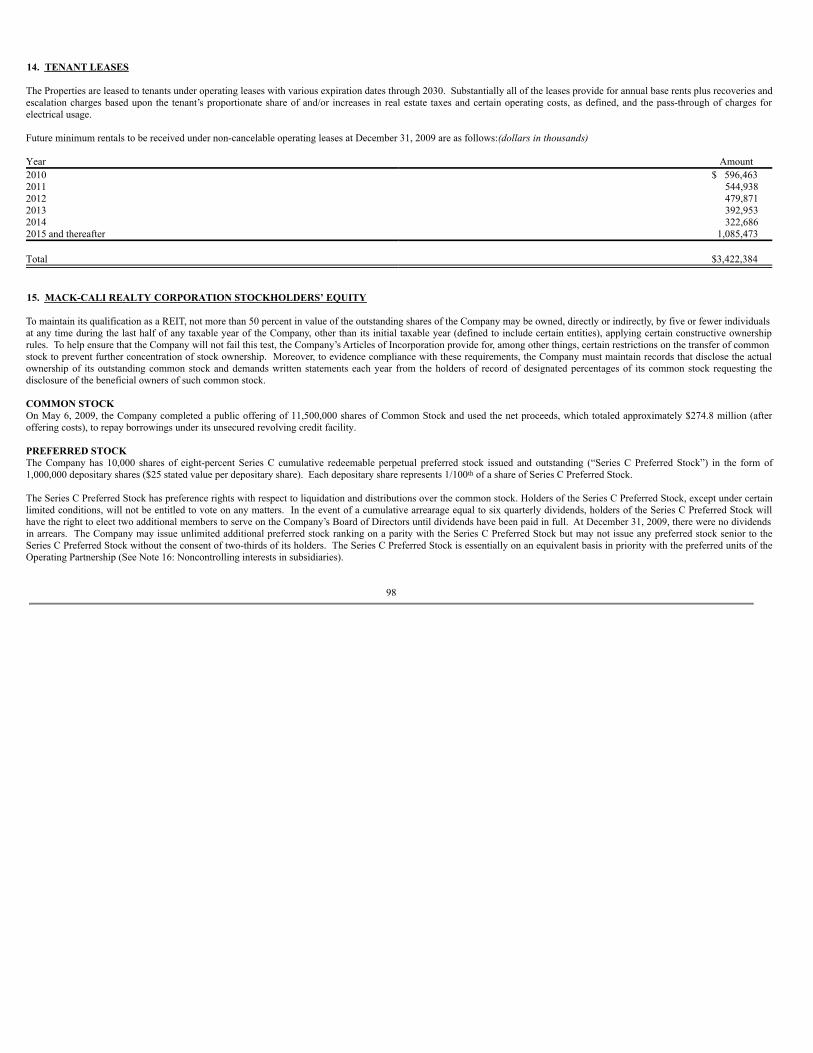
14. TENANT LEASES
The Properties are leased to tenants under operating leases with various expiration dates through 2030. Substantially all of the leases provide for annual base rents plus recoveries andescalation charges based upon the tenant’s proportionate share of and/or increases in real estate taxes and certain operating costs, as defined, and the pass-through of charges forelectrical usage.
Future minimum rentals to be received under non-cancelable operating leases at December 31, 2009 are as follows: (dollars in thousands)
Year Amount 2010 $ 596,4632011 544,9382012 479,8712013 392,9532014 322,6862015 and thereafter 1,085,473 Total $3,422,384
15. MACK-CALI REALTY CORPORATION STOCKHOLDERS’ EQUITY
To maintain its qualification as a REIT, not more than 50 percent in value of the outstanding shares of the Company may be owned, directly or indirectly, by five or fewer individualsat any time during the last half of any taxable year of the Company, other than its initial taxable year (defined to include certain entities), applying certain constructive ownershiprules. To help ensure that the Company will not fail this test, the Company’s Articles of Incorporation provide for, among other things, certain restrictions on the transfer of commonstock to prevent further concentration of stock ownership. Moreover, to evidence compliance with these requirements, the Company must maintain records that disclose the actualownership of its outstanding common stock and demands written statements each year from the holders of record of designated percentages of its common stock requesting thedisclosure of the beneficial owners of such common stock.
COMMON STOCKOn May 6, 2009, the Company completed a public offering of 11,500,000 shares of Common Stock and used the net proceeds, which totaled approximately $274.8 million (afteroffering costs), to repay borrowings under its unsecured revolving credit facility.
PREFERRED STOCKThe Company has 10,000 shares of eight-percent Series C cumulative redeemable perpetual preferred stock issued and outstanding (“Series C Preferred Stock”) in the form of1,000,000 depositary shares ($25 stated value per depositary share). Each depositary share represents 1/100th of a share of Series C Preferred Stock.
The Series C Preferred Stock has preference rights with respect to liquidation and distributions over the common stock. Holders of the Series C Preferred Stock, except under certainlimited conditions, will not be entitled to vote on any matters. In the event of a cumulative arrearage equal to six quarterly dividends, holders of the Series C Preferred Stock willhave the right to elect two additional members to serve on the Company’s Board of Directors until dividends have been paid in full. At December 31, 2009, there were no dividendsin arrears. The Company may issue unlimited additional preferred stock ranking on a parity with the Series C Preferred Stock but may not issue any preferred stock senior to theSeries C Preferred Stock without the consent of two-thirds of its holders. The Series C Preferred Stock is essentially on an equivalent basis in priority with the preferred units of theOperating Partnership (See Note 16: Noncontrolling interests in subsidiaries).
98
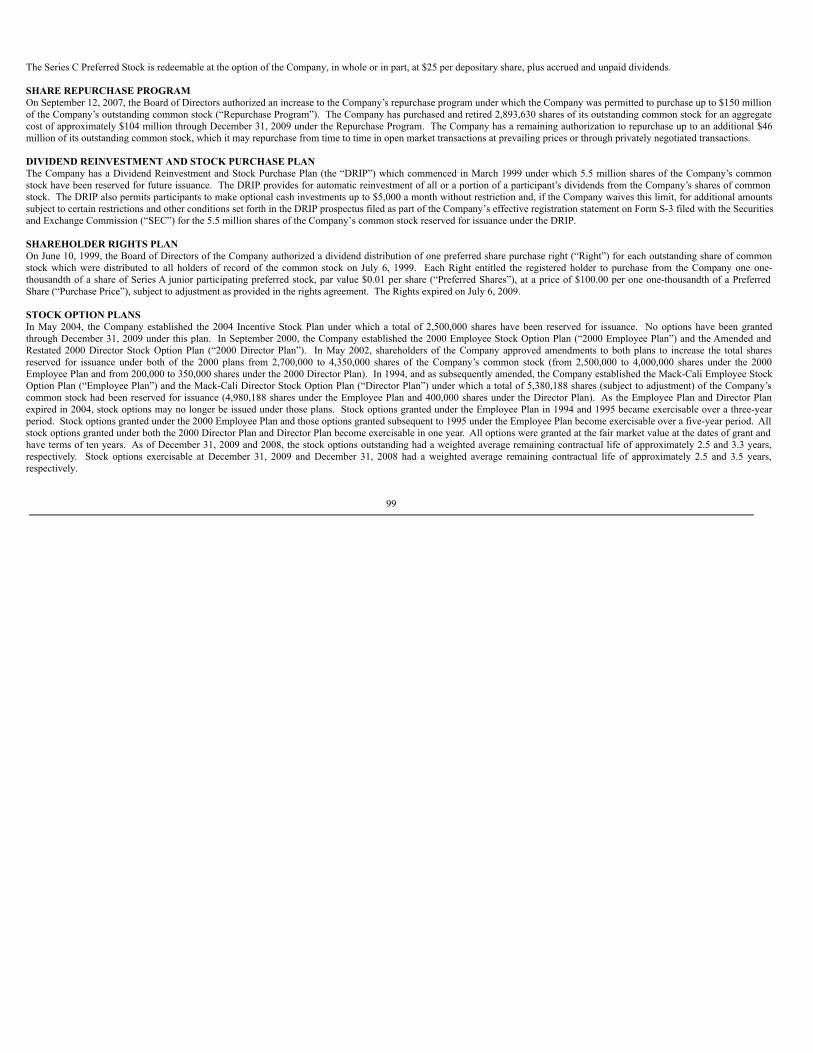
The Series C Preferred Stock is redeemable at the option of the Company, in whole or in part, at $25 per depositary share, plus accrued and unpaid dividends.
SHARE REPURCHASE PROGRAMOn September 12, 2007, the Board of Directors authorized an increase to the Company’s repurchase program under which the Company was permitted to purchase up to $150 millionof the Company’s outstanding common stock (“Repurchase Program”). The Company has purchased and retired 2,893,630 shares of its outstanding common stock for an aggregatecost of approximately $104 million through December 31, 2009 under the Repurchase Program. The Company has a remaining authorization to repurchase up to an additional $46million of its outstanding common stock, which it may repurchase from time to time in open market transactions at prevailing prices or through privately negotiated transactions.
DIVIDEND REINVESTMENT AND STOCK PURCHASE PLANThe Company has a Dividend Reinvestment and Stock Purchase Plan (the “DRIP”) which commenced in March 1999 under which 5.5 million shares of the Company’s commonstock have been reserved for future issuance. The DRIP provides for automatic reinvestment of all or a portion of a participant’s dividends from the Company’s shares of commonstock. The DRIP also permits participants to make optional cash investments up to $5,000 a month without restriction and, if the Company waives this limit, for additional amountssubject to certain restrictions and other conditions set forth in the DRIP prospectus filed as part of the Company’s effective registration statement on Form S-3 filed with the Securitiesand Exchange Commission (“SEC”) for the 5.5 million shares of the Company’s common stock reserved for issuance under the DRIP.
SHAREHOLDER RIGHTS PLANOn June 10, 1999, the Board of Directors of the Company authorized a dividend distribution of one preferred share purchase right (“Right”) for each outstanding share of commonstock which were distributed to all holders of record of the common stock on July 6, 1999. Each Right entitled the registered holder to purchase from the Company one one-thousandth of a share of Series A junior participating preferred stock, par value $0.01 per share (“Preferred Shares”), at a price of $100.00 per one one-thousandth of a PreferredShare (“Purchase Price”), subject to adjustment as provided in the rights agreement. The Rights expired on July 6, 2009.
STOCK OPTION PLANSIn May 2004, the Company established the 2004 Incentive Stock Plan under which a total of 2,500,000 shares have been reserved for issuance. No options have been grantedthrough December 31, 2009 under this plan. In September 2000, the Company established the 2000 Employee Stock Option Plan (“2000 Employee Plan”) and the Amended andRestated 2000 Director Stock Option Plan (“2000 Director Plan”). In May 2002, shareholders of the Company approved amendments to both plans to increase the total sharesreserved for issuance under both of the 2000 plans from 2,700,000 to 4,350,000 shares of the Company’s common stock (from 2,500,000 to 4,000,000 shares under the 2000Employee Plan and from 200,000 to 350,000 shares under the 2000 Director Plan). In 1994, and as subsequently amended, the Company established the Mack-Cali Employee StockOption Plan (“Employee Plan”) and the Mack-Cali Director Stock Option Plan (“Director Plan”) under which a total of 5,380,188 shares (subject to adjustment) of the Company’scommon stock had been reserved for issuance (4,980,188 shares under the Employee Plan and 400,000 shares under the Director Plan). As the Employee Plan and Director Planexpired in 2004, stock options may no longer be issued under those plans. Stock options granted under the Employee Plan in 1994 and 1995 became exercisable over a three-yearperiod. Stock options granted under the 2000 Employee Plan and those options granted subsequent to 1995 under the Employee Plan become exercisable over a five-year period. Allstock options granted under both the 2000 Director Plan and Director Plan become exercisable in one year. All options were granted at the fair market value at the dates of grant andhave terms of ten years. As of December 31, 2009 and 2008, the stock options outstanding had a weighted average remaining contractual life of approximately 2.5 and 3.3 years,respectively. Stock options exercisable at December 31, 2009 and December 31, 2008 had a weighted average remaining contractual life of approximately 2.5 and 3.5 years,respectively.
99
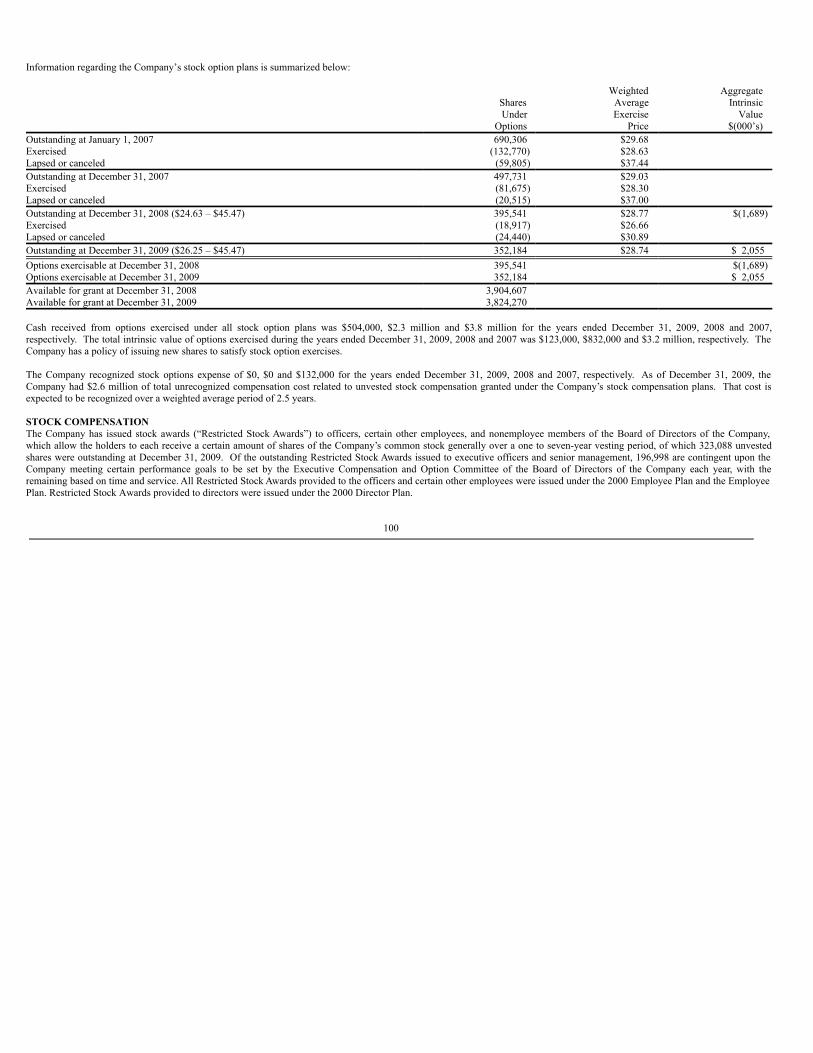
Information regarding the Company’s stock option plans is summarized below:
Weighted Aggregate Shares Average Intrinsic Under Exercise Value Options Price $(000’s)Outstanding at January 1, 2007 690,306 $29.68 Exercised (132,770) $28.63 Lapsed or canceled (59,805) $37.44 Outstanding at December 31, 2007 497,731 $29.03 Exercised (81,675) $28.30 Lapsed or canceled (20,515) $37.00 Outstanding at December 31, 2008 ($24.63 – $45.47) 395,541 $28.77 $(1,689)Exercised (18,917) $26.66 Lapsed or canceled (24,440) $30.89 Outstanding at December 31, 2009 ($26.25 – $45.47) 352,184 $28.74 $ 2,055Options exercisable at December 31, 2008 395,541 $(1,689)Options exercisable at December 31, 2009 352,184 $ 2,055Available for grant at December 31, 2008 3,904,607 Available for grant at December 31, 2009 3,824,270
Cash received from options exercised under all stock option plans was $504,000, $2.3 million and $3.8 million for the years ended December 31, 2009, 2008 and 2007,respectively. The total intrinsic value of options exercised during the years ended December 31, 2009, 2008 and 2007 was $123,000, $832,000 and $3.2 million, respectively. TheCompany has a policy of issuing new shares to satisfy stock option exercises.
The Company recognized stock options expense of $0, $0 and $132,000 for the years ended December 31, 2009, 2008 and 2007, respectively. As of December 31, 2009, theCompany had $2.6 million of total unrecognized compensation cost related to unvested stock compensation granted under the Company’s stock compensation plans. That cost isexpected to be recognized over a weighted average period of 2.5 years.
STOCK COMPENSATIONThe Company has issued stock awards (“Restricted Stock Awards”) to officers, certain other employees, and nonemployee members of the Board of Directors of the Company,which allow the holders to each receive a certain amount of shares of the Company’s common stock generally over a one to seven-year vesting period, of which 323,088 unvestedshares were outstanding at December 31, 2009. Of the outstanding Restricted Stock Awards issued to executive officers and senior management, 196,998 are contingent upon theCompany meeting certain performance goals to be set by the Executive Compensation and Option Committee of the Board of Directors of the Company each year, with theremaining based on time and service. All Restricted Stock Awards provided to the officers and certain other employees were issued under the 2000 Employee Plan and the EmployeePlan. Restricted Stock Awards provided to directors were issued under the 2000 Director Plan.
100
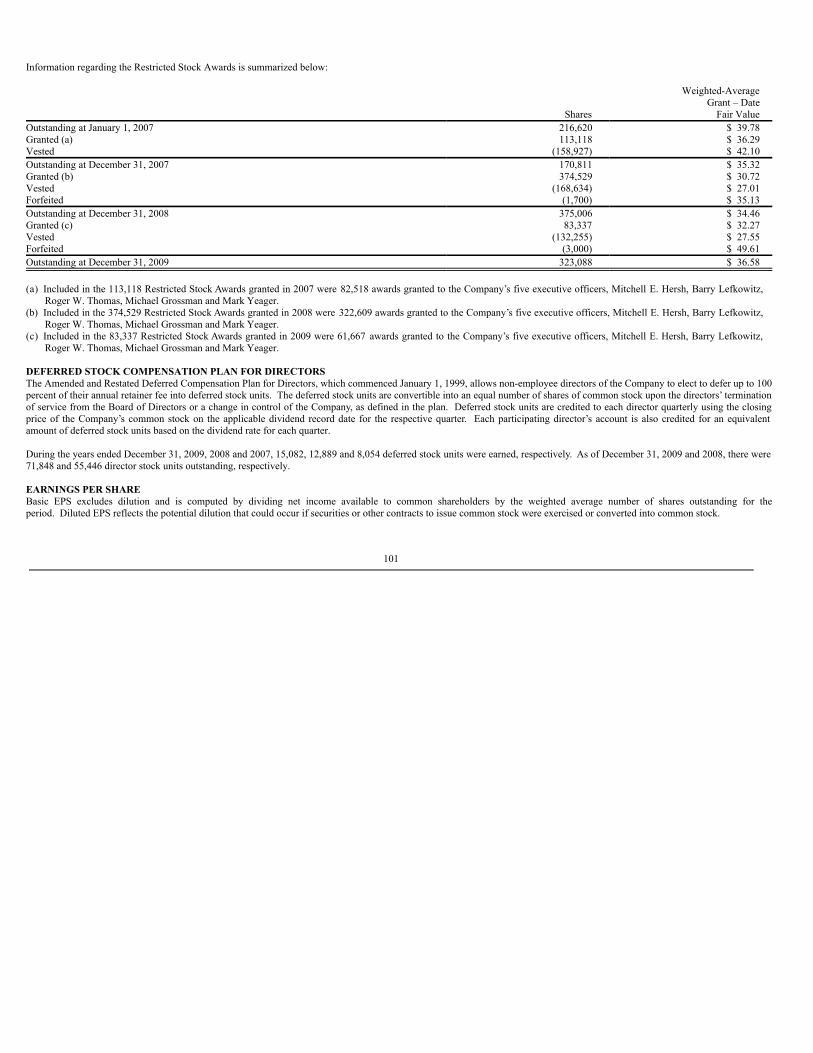
Information regarding the Restricted Stock Awards is summarized below:
Weighted-Average Grant – Date Shares Fair ValueOutstanding at January 1, 2007 216,620 $ 39.78Granted (a) 113,118 $ 36.29Vested (158,927) $ 42.10Outstanding at December 31, 2007 170,811 $ 35.32Granted (b) 374,529 $ 30.72Vested (168,634) $ 27.01Forfeited (1,700) $ 35.13Outstanding at December 31, 2008 375,006 $ 34.46Granted (c) 83,337 $ 32.27Vested (132,255) $ 27.55Forfeited (3,000) $ 49.61Outstanding at December 31, 2009 323,088 $ 36.58 (a) Included in the 113,118 Restricted Stock Awards granted in 2007 were 82,518 awards granted to the Company’s five executive officers, Mitchell E. Hersh, Barry Lefkowitz,
Roger W. Thomas, Michael Grossman and Mark Yeager.(b) Included in the 374,529 Restricted Stock Awards granted in 2008 were 322,609 awards granted to the Company’s five executive officers, Mitchell E. Hersh, Barry Lefkowitz,
Roger W. Thomas, Michael Grossman and Mark Yeager.(c) Included in the 83,337 Restricted Stock Awards granted in 2009 were 61,667 awards granted to the Company’s five executive officers, Mitchell E. Hersh, Barry Lefkowitz,
Roger W. Thomas, Michael Grossman and Mark Yeager.
DEFERRED STOCK COMPENSATION PLAN FOR DIRECTORSThe Amended and Restated Deferred Compensation Plan for Directors, which commenced January 1, 1999, allows non-employee directors of the Company to elect to defer up to 100percent of their annual retainer fee into deferred stock units. The deferred stock units are convertible into an equal number of shares of common stock upon the directors’ terminationof service from the Board of Directors or a change in control of the Company, as defined in the plan. Deferred stock units are credited to each director quarterly using the closingprice of the Company’s common stock on the applicable dividend record date for the respective quarter. Each participating director’s account is also credited for an equivalentamount of deferred stock units based on the dividend rate for each quarter.
During the years ended December 31, 2009, 2008 and 2007, 15,082, 12,889 and 8,054 deferred stock units were earned, respectively. As of December 31, 2009 and 2008, there were71,848 and 55,446 director stock units outstanding, respectively.
EARNINGS PER SHAREBasic EPS excludes dilution and is computed by dividing net income available to common shareholders by the weighted average number of shares outstanding for theperiod. Diluted EPS reflects the potential dilution that could occur if securities or other contracts to issue common stock were exercised or converted into common stock.
101
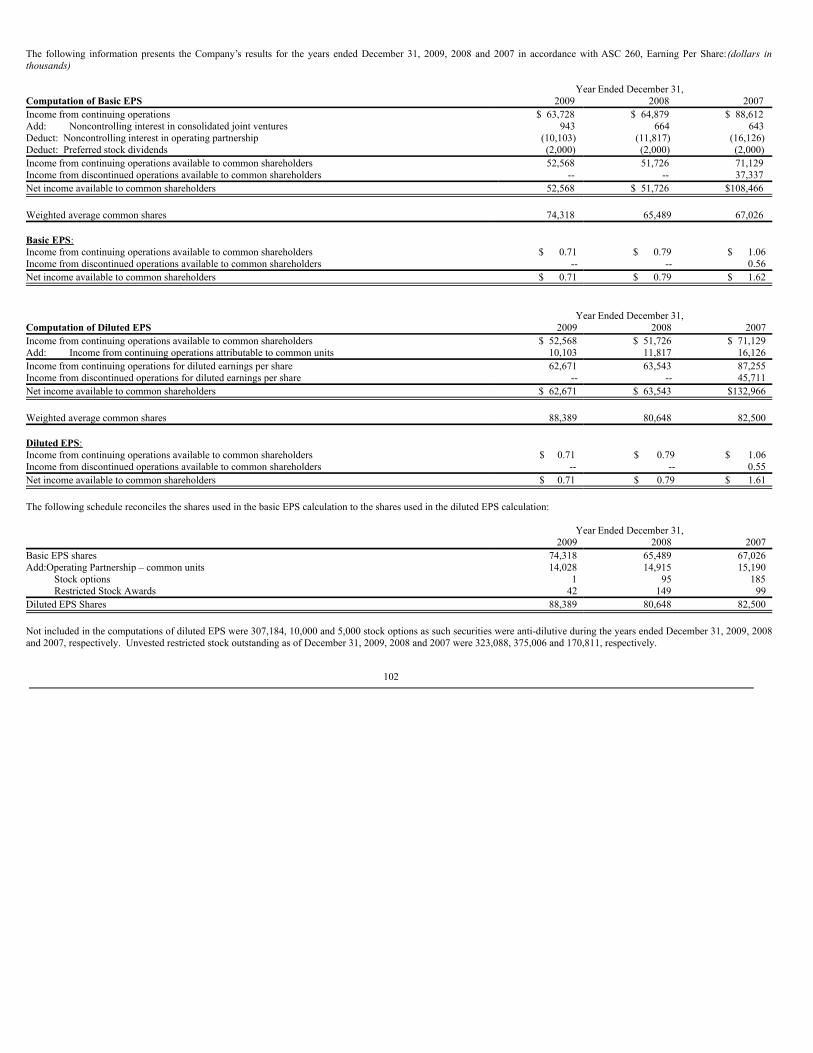
The following information presents the Company’s results for the years ended December 31, 2009, 2008 and 2007 in accordance with ASC 260, Earning Per Share: (dollars inthousands)
Year Ended December 31,Computation of Basic EPS 2009 2008 2007 Income from continuing operations $ 63,728 $ 64,879 $ 88,612 Add: Noncontrolling interest in consolidated joint ventures 943 664 643Deduct: Noncontrolling interest in operating partnership (10,103) (11,817) (16,126)Deduct: Preferred stock dividends (2,000) (2,000) (2,000)Income from continuing operations available to common shareholders 52,568 51,726 71,129 Income from discontinued operations available to common shareholders -- -- 37,337 Net income available to common shareholders 52,568 $ 51,726 $108,466 Weighted average common shares 74,318 65,489 67,026 Basic EPS: Income from continuing operations available to common shareholders $ 0.71 $ 0.79 $ 1.06Income from discontinued operations available to common shareholders -- -- 0.56Net income available to common shareholders $ 0.71 $ 0.79 $ 1.62
Year Ended December 31,Computation of Diluted EPS 2009 2008 2007Income from continuing operations available to common shareholders $ 52,568 $ 51,726 $ 71,129Add: Income from continuing operations attributable to common units 10,103 11,817 16,126Income from continuing operations for diluted earnings per share 62,671 63,543 87,255Income from discontinued operations for diluted earnings per share -- -- 45,711Net income available to common shareholders $ 62,671 $ 63,543 $132,966 Weighted average common shares 88,389 80,648 82,500 Diluted EPS: Income from continuing operations available to common shareholders $ 0.71 $ 0.79 $ 1.06Income from discontinued operations available to common shareholders -- -- 0.55Net income available to common shareholders $ 0.71 $ 0.79 $ 1.61
The following schedule reconciles the shares used in the basic EPS calculation to the shares used in the diluted EPS calculation:
Year Ended December 31, 2009 2008 2007Basic EPS shares 74,318 65,489 67,026Add:Operating Partnership – common units 14,028 14,915 15,190
Stock options 1 95 185Restricted Stock Awards 42 149 99
Diluted EPS Shares 88,389 80,648 82,500
Not included in the computations of diluted EPS were 307,184, 10,000 and 5,000 stock options as such securities were anti-dilutive during the years ended December 31, 2009, 2008and 2007, respectively. Unvested restricted stock outstanding as of December 31, 2009, 2008 and 2007 were 323,088, 375,006 and 170,811, respectively.
102
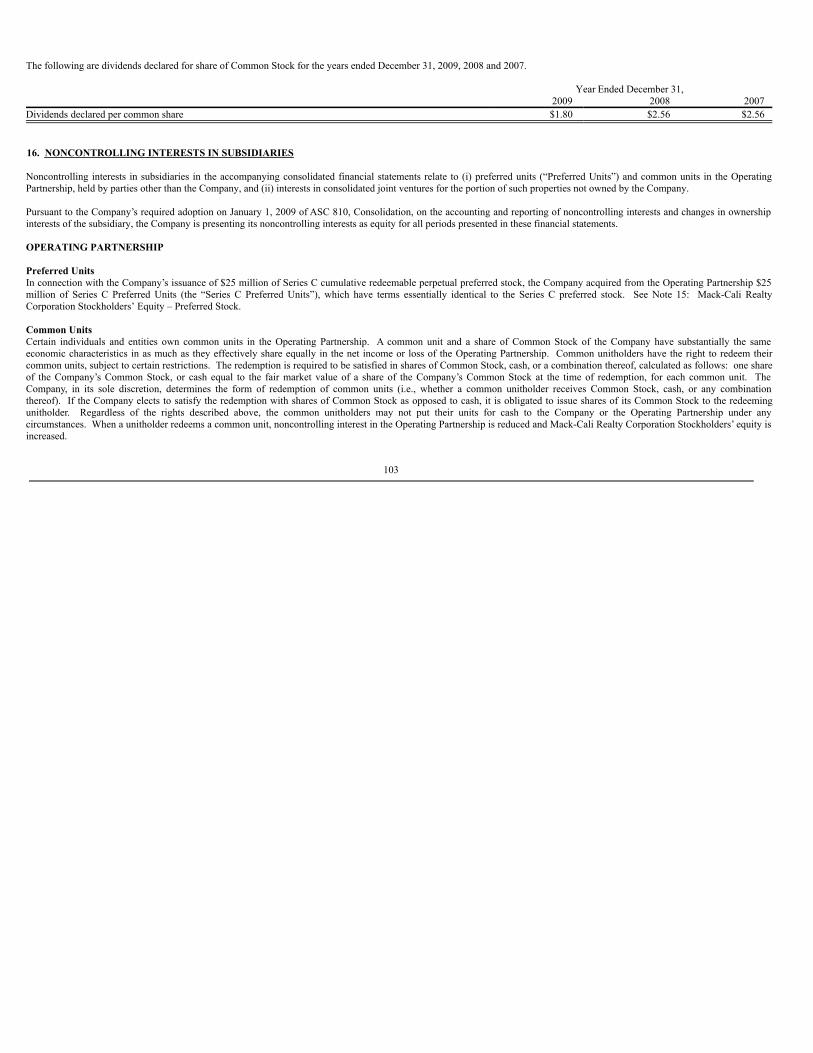
The following are dividends declared for share of Common Stock for the years ended December 31, 2009, 2008 and 2007.
Year Ended December 31, 2009 2008 2007Dividends declared per common share $1.80 $2.56 $2.56
16. NONCONTROLLING INTERESTS IN SUBSIDIARIES
Noncontrolling interests in subsidiaries in the accompanying consolidated financial statements relate to (i) preferred units (“Preferred Units”) and common units in the OperatingPartnership, held by parties other than the Company, and (ii) interests in consolidated joint ventures for the portion of such properties not owned by the Company.
Pursuant to the Company’s required adoption on January 1, 2009 of ASC 810, Consolidation, on the accounting and reporting of noncontrolling interests and changes in ownershipinterests of the subsidiary, the Company is presenting its noncontrolling interests as equity for all periods presented in these financial statements.
OPERATING PARTNERSHIP
Preferred UnitsIn connection with the Company’s issuance of $25 million of Series C cumulative redeemable perpetual preferred stock, the Company acquired from the Operating Partnership $25million of Series C Preferred Units (the “Series C Preferred Units”), which have terms essentially identical to the Series C preferred stock. See Note 15: Mack-Cali RealtyCorporation Stockholders’ Equity – Preferred Stock.
Common UnitsCertain individuals and entities own common units in the Operating Partnership. A common unit and a share of Common Stock of the Company have substantially the sameeconomic characteristics in as much as they effectively share equally in the net income or loss of the Operating Partnership. Common unitholders have the right to redeem theircommon units, subject to certain restrictions. The redemption is required to be satisfied in shares of Common Stock, cash, or a combination thereof, calculated as follows: one shareof the Company’s Common Stock, or cash equal to the fair market value of a share of the Company’s Common Stock at the time of redemption, for each common unit. TheCompany, in its sole discretion, determines the form of redemption of common units (i.e., whether a common unitholder receives Common Stock, cash, or any combinationthereof). If the Company elects to satisfy the redemption with shares of Common Stock as opposed to cash, it is obligated to issue shares of its Common Stock to the redeemingunitholder. Regardless of the rights described above, the common unitholders may not put their units for cash to the Company or the Operating Partnership under anycircumstances. When a unitholder redeems a common unit, noncontrolling interest in the Operating Partnership is reduced and Mack-Cali Realty Corporation Stockholders’ equity isincreased.
103
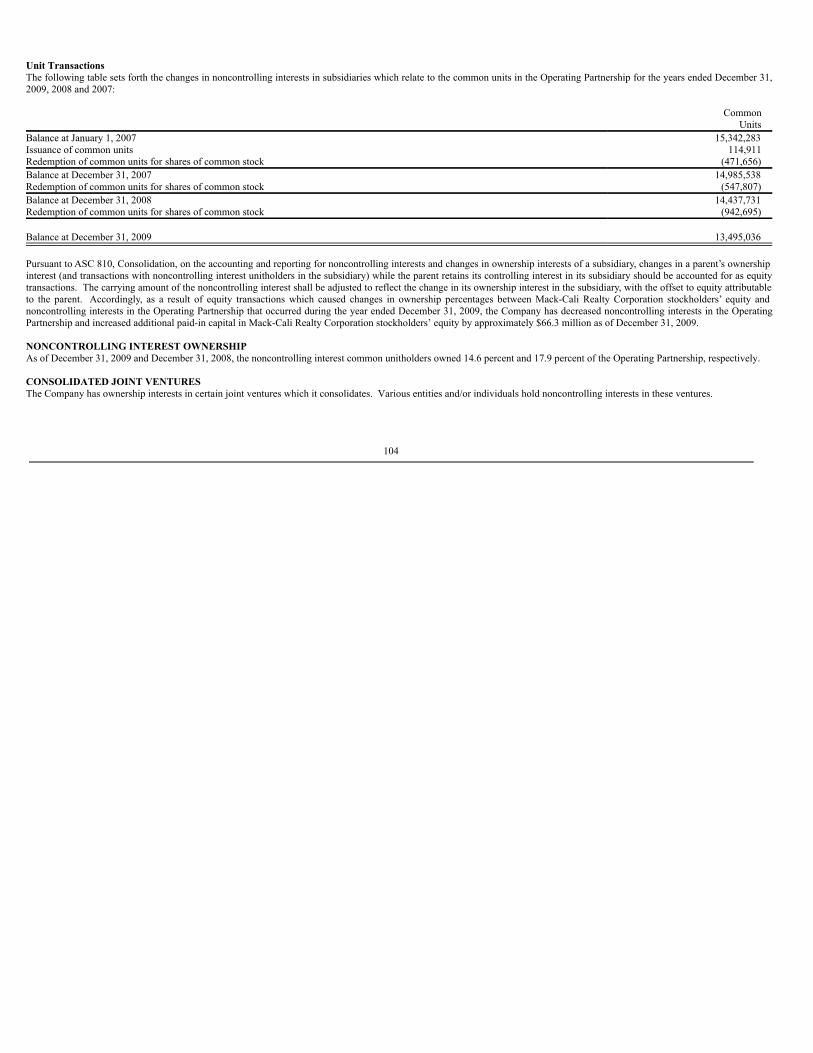
Unit TransactionsThe following table sets forth the changes in noncontrolling interests in subsidiaries which relate to the common units in the Operating Partnership for the years ended December 31,2009, 2008 and 2007:
Common UnitsBalance at January 1, 2007 15,342,283Issuance of common units 114,911Redemption of common units for shares of common stock (471,656)Balance at December 31, 2007 14,985,538Redemption of common units for shares of common stock (547,807)Balance at December 31, 2008 14,437,731Redemption of common units for shares of common stock (942,695) Balance at December 31, 2009 13,495,036
Pursuant to ASC 810, Consolidation, on the accounting and reporting for noncontrolling interests and changes in ownership interests of a subsidiary, changes in a parent’s ownershipinterest (and transactions with noncontrolling interest unitholders in the subsidiary) while the parent retains its controlling interest in its subsidiary should be accounted for as equitytransactions. The carrying amount of the noncontrolling interest shall be adjusted to reflect the change in its ownership interest in the subsidiary, with the offset to equity attributableto the parent. Accordingly, as a result of equity transactions which caused changes in ownership percentages between Mack-Cali Realty Corporation stockholders’ equity andnoncontrolling interests in the Operating Partnership that occurred during the year ended December 31, 2009, the Company has decreased noncontrolling interests in the OperatingPartnership and increased additional paid-in capital in Mack-Cali Realty Corporation stockholders’ equity by approximately $66.3 million as of December 31, 2009.
NONCONTROLLING INTEREST OWNERSHIPAs of December 31, 2009 and December 31, 2008, the noncontrolling interest common unitholders owned 14.6 percent and 17.9 percent of the Operating Partnership, respectively.
CONSOLIDATED JOINT VENTURESThe Company has ownership interests in certain joint ventures which it consolidates. Various entities and/or individuals hold noncontrolling interests in these ventures.
104

17. SEGMENT REPORTING
The Company operates in two business segments: (i) real estate and (ii) construction services. The Company provides leasing, property and facilities management, acquisition,development, construction and tenant-related services for its portfolio. In May 2006, in conjunction with the Company’s acquisition of the Gale Company and related businesses, theCompany acquired a business specializing solely in construction and related services whose operations comprise the Company’s construction services segment. The Company had norevenues from foreign countries recorded for the years ended December 31, 2009, 2008 and 2007. The Company had no long lived assets in foreign locations as of December 31,2009, 2008 and 2007. The accounting policies of the segments are the same as those described in Note 2: Significant Accounting Policies, excluding depreciation and amortization.
The Company evaluates performance based upon net operating income from the combined properties in the real estate segment and net operating income from its constructionservices segment.
105
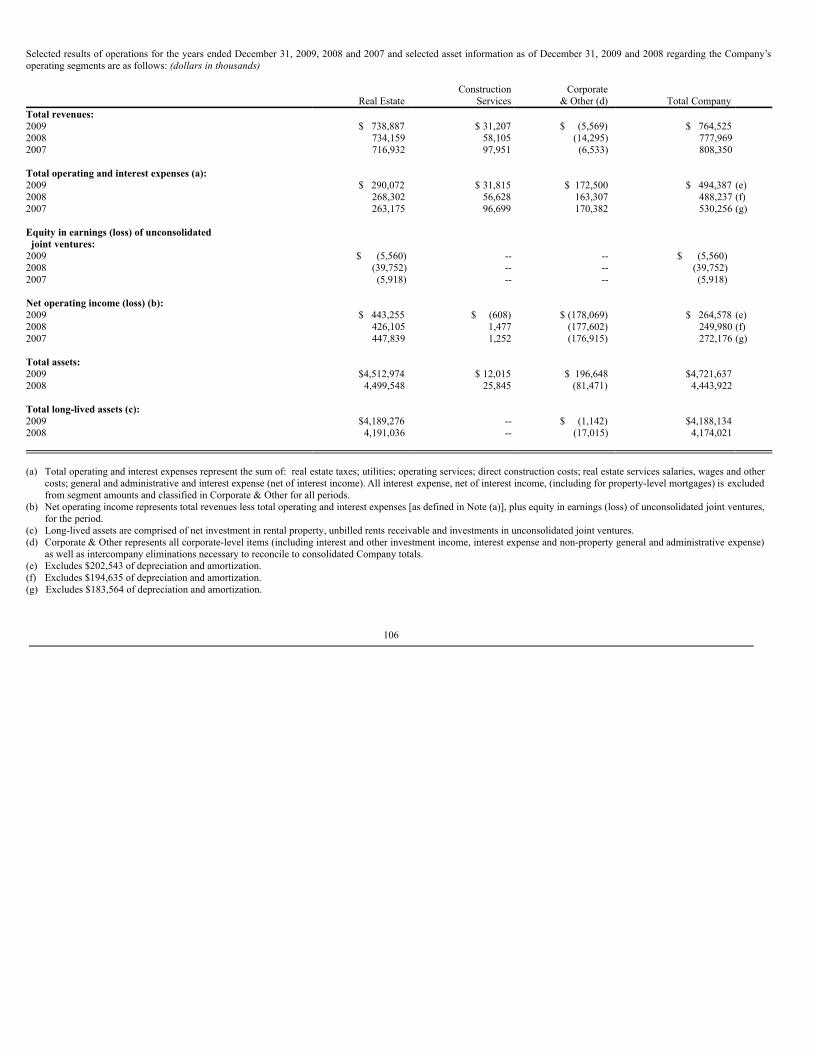
Selected results of operations for the years ended December 31, 2009, 2008 and 2007 and selected asset information as of December 31, 2009 and 2008 regarding the Company’soperating segments are as follows: (dollars in thousands)
Real Estate
ConstructionServices
Corporate& Other (d)
Total Company
Total revenues: 2009 $ 738,887 $ 31,207 $ (5,569) $ 764,525 2008 734,159 58,105 (14,295) 777,969 2007 716,932 97,951 (6,533) 808,350 Total operating and interest expenses (a): 2009 $ 290,072 $ 31,815 $ 172,500 $ 494,387 (e)2008 268,302 56,628 163,307 488,237 (f)2007 263,175 96,699 170,382 530,256 (g) Equity in earnings (loss) of unconsolidated joint ventures: 2009 $ (5,560) -- -- $ (5,560) 2008 (39,752) -- -- (39,752) 2007 (5,918) -- -- (5,918) Net operating income (loss) (b): 2009 $ 443,255 $ (608) $ (178,069) $ 264,578 (e)2008 426,105 1,477 (177,602) 249,980 (f)2007 447,839 1,252 (176,915) 272,176 (g) Total assets: 2009 $4,512,974 $ 12,015 $ 196,648 $4,721,637 2008 4,499,548 25,845 (81,471) 4,443,922 Total long-lived assets (c): 2009 $4,189,276 -- $ (1,142) $4,188,134 2008 4,191,036 -- (17,015) 4,174,021
(a) Total operating and interest expenses represent the sum of: real estate taxes; utilities; operating services; direct construction costs; real estate services salaries, wages and othercosts; general and administrative and interest expense (net of interest income). All interest expense, net of interest income, (including for property-level mortgages) is excludedfrom segment amounts and classified in Corporate & Other for all periods.
(b) Net operating income represents total revenues less total operating and interest expenses [as defined in Note (a)], plus equity in earnings (loss) of unconsolidated joint ventures,for the period.
(c) Long-lived assets are comprised of net investment in rental property, unbilled rents receivable and investments in unconsolidated joint ventures.(d) Corporate & Other represents all corporate-level items (including interest and other investment income, interest expense and non-property general and administrative expense)
as well as intercompany eliminations necessary to reconcile to consolidated Company totals.(e) Excludes $202,543 of depreciation and amortization.(f) Excludes $194,635 of depreciation and amortization.(g) Excludes $183,564 of depreciation and amortization.
106
18. RELATED PARTY TRANSACTIONS
William L. Mack, Chairman of the Board of Directors of the Company (“W. Mack”), David S. Mack, a director of the Company, and Earle I. Mack, a former director of theCompany (“E. Mack”), are the executive officers, directors and stockholders of a corporation that leases approximately 7,801 square feet at one of the Company’s office properties,which is scheduled to expire in November 2011. The Company has recognized $255,000, $258,000 and $233,000 in revenue under this lease for the years ended December 31, 2009,2008 and 2007, respectively, and had zero accounts receivable from the corporation as of December 31, 2009 and 2008.
The Company has conducted business with certain entities (“RMC Entity” or “RMC Entities”), whose principals include Timothy M. Jones, Martin S. Berger and Robert F.Weinberg, each of whom are affiliated with the Company as the former president of the Company, a current member of the Board of Directors and a former member of the Board ofDirectors of the Company, respectively. In connection with the Company’s acquisition of 65 Class A properties from The Robert Martin Company (“Robert Martin”) on January 31,1997, as subsequently modified, the Company granted Robert Martin the right to designate one seat on the Company’s Board of Directors (“RM Board Seat”), which right has sinceexpired. The RM Board Seat had historically been shared between Robert F. Weinberg and Martin S. Berger, each of whom had agreed that, for so long as either of them serves onthe Board of Directors, that such board seat would be rotated among Mr. Berger and Mr. Weinberg annually at the time of each annual meeting of stockholders. At the Company’s2003 annual meeting of stockholders, Mr. Berger was elected to the Board of Directors and he continued to share his board seat with Mr. Weinberg. At the Company’s 2006 annualmeeting of stockholders, Mr. Weinberg was elected to the Board of Directors and he continued to share his board seat with Mr. Berger. At the Company’s 2009 annual meeting ofstockholders, Mr. Berger was elected to the Board of Directors and he continues to share his board seat with Mr. Weinberg. The business that the Company has conducted with RMCEntities was as follows:
(1) The Company provides management, leasing and construction-related services to properties in which RMC Entities have an ownership interest. The Company recognizedapproximately $1.6 million, $2.5 million and $2 million in revenue from RMC Entities for the years ended December 31, 2009, 2008 and 2007, respectively. As ofDecember 31, 2009 and 2008, respectively, the Company had zero and $161,000 accounts receivable from RMC Entities.
(2) An RMC Entity leased space at one of the Company’s office properties for approximately 4,860 square feet, which, after a one-year renewal signed in October 2009, isscheduled to expire in October 2010. The Company has recognized $140,000, $133,000 and $132,000, in revenue under this lease for the years ended December 31, 2009,2008 and 2007, respectively, and had $500 accounts receivable due from the RMC Entity, as of December 31, 2009 and 2008, respectively.
Through June 2007, Mr. Berger held a 24 percent interest, acted as chairman and chief executive officer, Mr. Weinberg also held a 24 percent interest and was a director, and W.Mack held a nine percent interest and was a director of City and Suburban Federal Savings Bank and/or one of its affiliates, which leases 12,842 square feet of space at one of theCompany’s office properties, which was scheduled to expire in April 2013. In July 2007, Mssrs. Berger, Weinberg and Mack sold their interests and no longer are directors of Cityand Suburban Federal Savings Bank and/or its affiliates. The Company recognized $190,000 and $404,000 in revenue under the leases for the years ended December 31, 2007 and2006, respectively, and had no accounts receivable from the company as of December 31, 2007.
The Company provides administrative support and related services to John J. Cali, who served as the Chairman Emeritus and a Board member of the Company, for which it wasreimbursed $115,000, $153,000 and $192,000 from Mr. Cali for the years ended December 31, 2009, 2008 and 2007, respectively. On June 27, 2005, an affiliate of Mr. Cali enteredinto a three-year lease for 1,825 square feet of space at one of the Company’s office properties, which is scheduled to expire at the end of 2011. On September 18, 2006, an affiliateof Mr. Cali entered into another lease agreement for 806 additional square feet, in the same building, commencing on December 29, 2006, which is scheduled to expire at the end of2011. The Company recognized approximately $68,000, $67,000 and $68,000 in total revenue under the leases for the years ended December 31, 2009, 2008 and 2007, respectively,and had zero accounts receivable from the affiliate as of December 31, 2009 and 2008.
107
19. IMPACT OF RECENTLY-ISSUED ACCOUNTING STANDARDS
Statement of Financial Accounting Standards No. 167, Amendments to FASB Interpretation No. 46(R) (“FASB No. 167”) FASB No. 167 amends, among other items, for FIN 46(R) to require an enterprise to perform an analysis to determine whether the enterprise’s variable interest or interests give it acontrolling financial interest in a variable interest entity. This analysis identifies the primary beneficiary of a variable interest entity as the enterprise that has both of the followingcharacteristics:
a. The power to direct the activities of a variable interest entity that most significantly impact the entity’s economic performance
b. The obligation to absorb losses of the entity that could potentially be significant to the variable interest entity or the right to receive benefits from the entity that couldpotentially be significant to the variable interest entity.
Additionally, an enterprise is required to assess whether it has an implicit financial responsibility to ensure that a variable interest entity operates as designed when determiningwhether it has the power to direct the activities of the variable interest entity that most significantly impact the entity’s economic performance. FASB No. 167 also amends FIN 46(R) to require ongoing reassessments of whether an enterprise is the primary beneficiary of a variable interest entity. Additionally, FASB No.167 amends FIN 46(R) to eliminate the quantitative approach previously required for determining the primary beneficiary of a variable interest entity, which was based ondetermining which enterprise absorbs the majority of the entity’s expected losses, receives a majority of the entity’s expected residual returns, or both. FASB No. 167 amendscertain guidance in Interpretation 46(R) for determining whether an entity is a variable interest entity. Also, FASB No. 167 amends FIN 46(R) to require enhanced disclosures thatwill provide users of financial statements with more transparent information about an enterprise’s involvement in a variable interest entity. The enhanced disclosures are requiredfor any enterprise that holds a variable interest in a variable interest entity. As FASB No. 167 will be effective as of the beginning of the first annual reporting period that beginsafter November 15, 2009, the Company is currently assessing the potential impact that the Company’s adoption of FASB No. 167 on January 1, 2010 will have on its financialposition and results of operation.
108
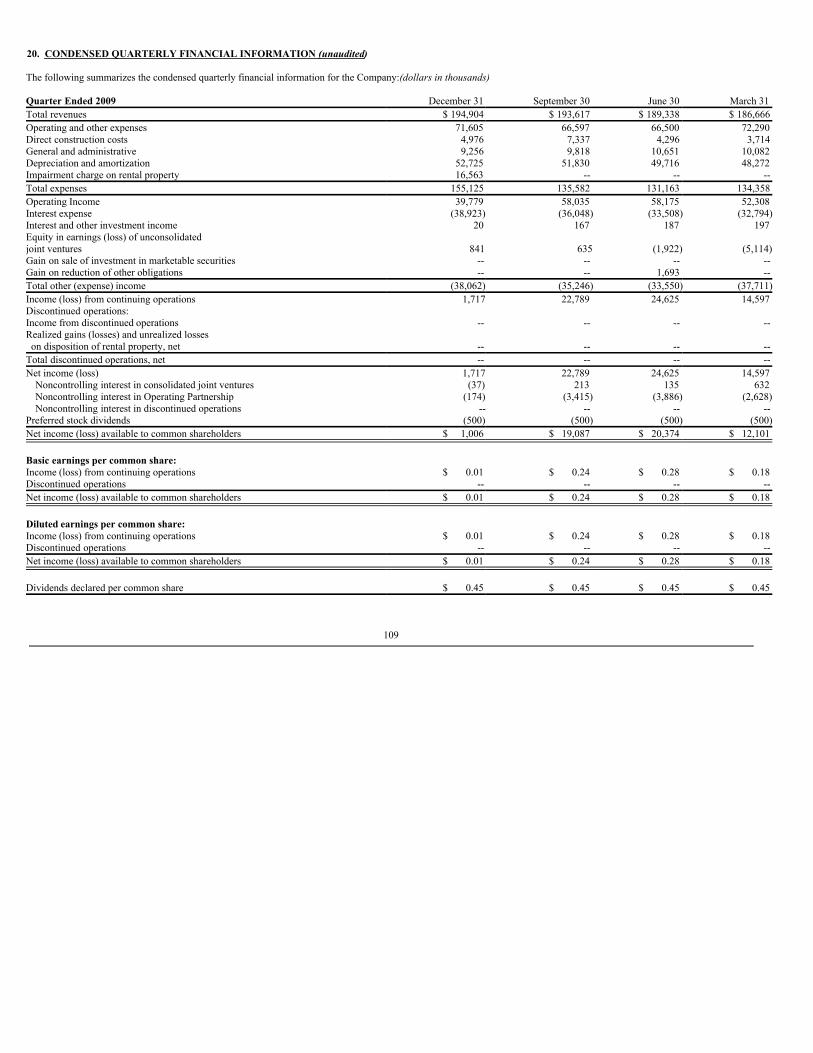
20. CONDENSED QUARTERLY FINANCIAL INFORMATION (unaudited)
The following summarizes the condensed quarterly financial information for the Company: (dollars in thousands)
Quarter Ended 2009 December 31 September 30 June 30 March 31Total revenues $ 194,904 $ 193,617 $ 189,338 $ 186,666Operating and other expenses 71,605 66,597 66,500 72,290Direct construction costs 4,976 7,337 4,296 3,714General and administrative 9,256 9,818 10,651 10,082Depreciation and amortization 52,725 51,830 49,716 48,272Impairment charge on rental property 16,563 -- -- --Total expenses 155,125 135,582 131,163 134,358Operating Income 39,779 58,035 58,175 52,308Interest expense (38,923) (36,048) (33,508) (32,794)Interest and other investment income 20 167 187 197Equity in earnings (loss) of unconsolidated joint ventures 841 635 (1,922) (5,114)Gain on sale of investment in marketable securities -- -- -- --Gain on reduction of other obligations -- -- 1,693 --Total other (expense) income (38,062) (35,246) (33,550) (37,711)Income (loss) from continuing operations 1,717 22,789 24,625 14,597Discontinued operations: Income from discontinued operations -- -- -- --Realized gains (losses) and unrealized losses on disposition of rental property, net -- -- -- --Total discontinued operations, net -- -- -- --Net income (loss) 1,717 22,789 24,625 14,597
Noncontrolling interest in consolidated joint ventures (37) 213 135 632Noncontrolling interest in Operating Partnership (174) (3,415) (3,886) (2,628)Noncontrolling interest in discontinued operations -- -- -- --
Preferred stock dividends (500) (500) (500) (500)Net income (loss) available to common shareholders $ 1,006 $ 19,087 $ 20,374 $ 12,101 Basic earnings per common share: Income (loss) from continuing operations $ 0.01 $ 0.24 $ 0.28 $ 0.18Discontinued operations -- -- -- --Net income (loss) available to common shareholders $ 0.01 $ 0.24 $ 0.28 $ 0.18 Diluted earnings per common share: Income (loss) from continuing operations $ 0.01 $ 0.24 $ 0.28 $ 0.18Discontinued operations -- -- -- --Net income (loss) available to common shareholders $ 0.01 $ 0.24 $ 0.28 $ 0.18 Dividends declared per common share $ 0.45 $ 0.45 $ 0.45 $ 0.45
109
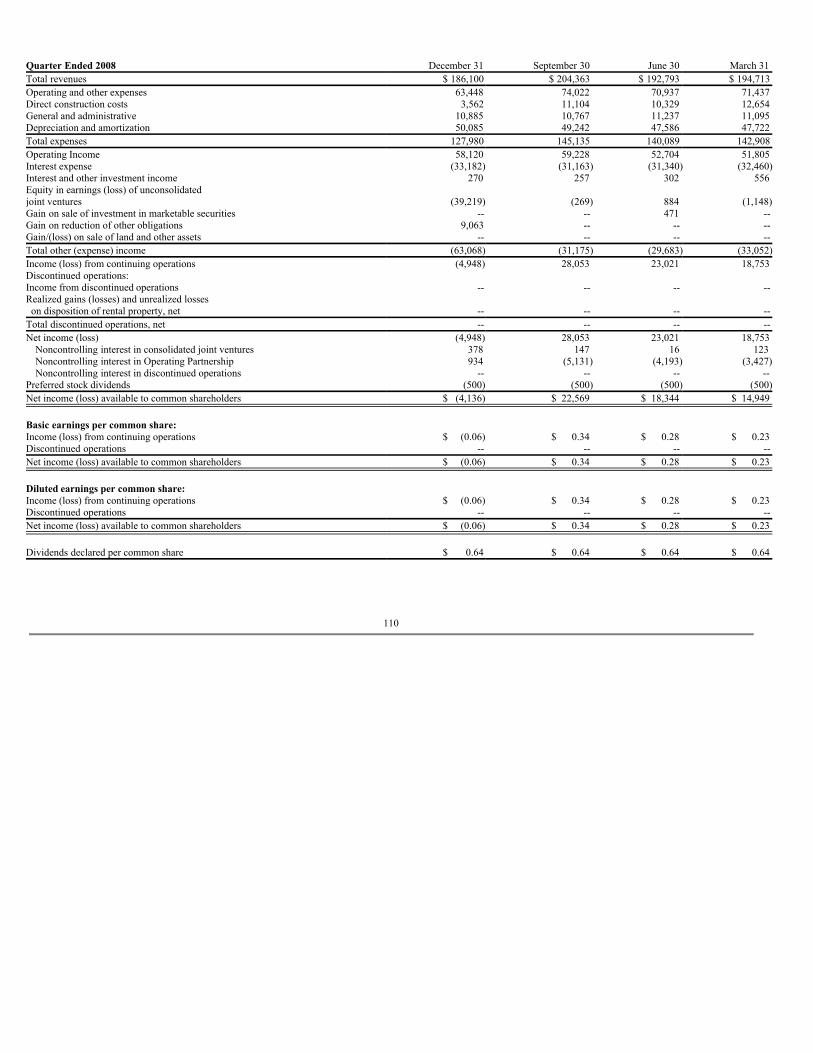
Quarter Ended 2008 December 31 September 30 June 30 March 31Total revenues $ 186,100 $ 204,363 $ 192,793 $ 194,713Operating and other expenses 63,448 74,022 70,937 71,437Direct construction costs 3,562 11,104 10,329 12,654General and administrative 10,885 10,767 11,237 11,095Depreciation and amortization 50,085 49,242 47,586 47,722Total expenses 127,980 145,135 140,089 142,908Operating Income 58,120 59,228 52,704 51,805Interest expense (33,182) (31,163) (31,340) (32,460)Interest and other investment income 270 257 302 556Equity in earnings (loss) of unconsolidated joint ventures (39,219) (269) 884 (1,148)Gain on sale of investment in marketable securities -- -- 471 --Gain on reduction of other obligations 9,063 -- -- --Gain/(loss) on sale of land and other assets -- -- -- --Total other (expense) income (63,068) (31,175) (29,683) (33,052)Income (loss) from continuing operations (4,948) 28,053 23,021 18,753Discontinued operations: Income from discontinued operations -- -- -- --Realized gains (losses) and unrealized losses on disposition of rental property, net -- -- -- --Total discontinued operations, net -- -- -- --Net income (loss) (4,948) 28,053 23,021 18,753
Noncontrolling interest in consolidated joint ventures 378 147 16 123Noncontrolling interest in Operating Partnership 934 (5,131) (4,193) (3,427)Noncontrolling interest in discontinued operations -- -- -- --
Preferred stock dividends (500) (500) (500) (500)Net income (loss) available to common shareholders $ (4,136) $ 22,569 $ 18,344 $ 14,949 Basic earnings per common share: Income (loss) from continuing operations $ (0.06) $ 0.34 $ 0.28 $ 0.23Discontinued operations -- -- -- --Net income (loss) available to common shareholders $ (0.06) $ 0.34 $ 0.28 $ 0.23 Diluted earnings per common share: Income (loss) from continuing operations $ (0.06) $ 0.34 $ 0.28 $ 0.23Discontinued operations -- -- -- --Net income (loss) available to common shareholders $ (0.06) $ 0.34 $ 0.28 $ 0.23 Dividends declared per common share $ 0.64 $ 0.64 $ 0.64 $ 0.64
110
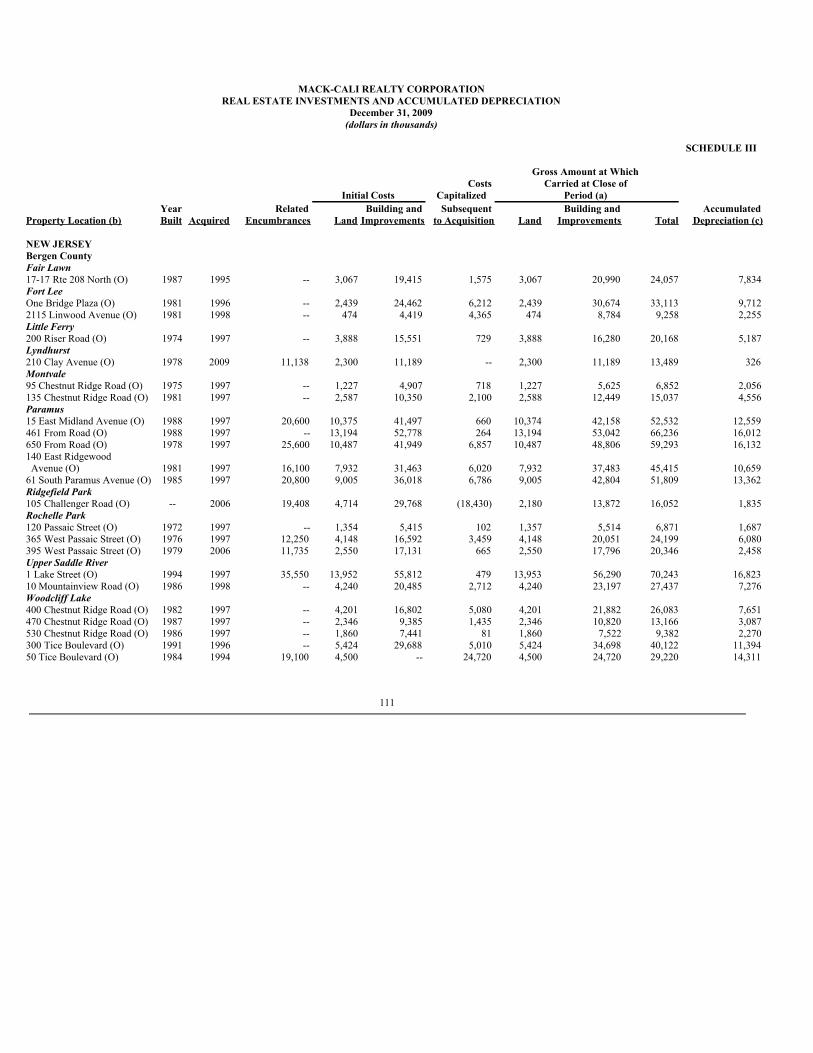
MACK-CALI REALTY CORPORATIONREAL ESTATE INVESTMENTS AND ACCUMULATED DEPRECIATION
December 31, 2009(dollars in thousands)
SCHEDULE III Gross Amount at Which Costs Carried at Close of Initial Costs Capitalized Period (a) Year Related Building and Subsequent Building and AccumulatedProperty Location (b) Built Acquired Encumbrances Land Improvements to Acquisition Land Improvements Total Depreciation (c) NEW JERSEY Bergen County Fair Lawn 17-17 Rte 208 North (O) 1987 1995 -- 3,067 19,415 1,575 3,067 20,990 24,057 7,834Fort Lee One Bridge Plaza (O) 1981 1996 -- 2,439 24,462 6,212 2,439 30,674 33,113 9,7122115 Linwood Avenue (O) 1981 1998 -- 474 4,419 4,365 474 8,784 9,258 2,255Little Ferry 200 Riser Road (O) 1974 1997 -- 3,888 15,551 729 3,888 16,280 20,168 5,187Lyndhurst 210 Clay Avenue (O) 1978 2009 11,138 2,300 11,189 -- 2,300 11,189 13,489 326Montvale 95 Chestnut Ridge Road (O) 1975 1997 -- 1,227 4,907 718 1,227 5,625 6,852 2,056135 Chestnut Ridge Road (O) 1981 1997 -- 2,587 10,350 2,100 2,588 12,449 15,037 4,556Paramus 15 East Midland Avenue (O) 1988 1997 20,600 10,375 41,497 660 10,374 42,158 52,532 12,559461 From Road (O) 1988 1997 -- 13,194 52,778 264 13,194 53,042 66,236 16,012650 From Road (O) 1978 1997 25,600 10,487 41,949 6,857 10,487 48,806 59,293 16,132140 East Ridgewood Avenue (O) 1981 1997 16,100 7,932 31,463 6,020 7,932 37,483 45,415 10,65961 South Paramus Avenue (O) 1985 1997 20,800 9,005 36,018 6,786 9,005 42,804 51,809 13,362Ridgefield Park 105 Challenger Road (O) -- 2006 19,408 4,714 29,768 (18,430) 2,180 13,872 16,052 1,835Rochelle Park 120 Passaic Street (O) 1972 1997 -- 1,354 5,415 102 1,357 5,514 6,871 1,687365 West Passaic Street (O) 1976 1997 12,250 4,148 16,592 3,459 4,148 20,051 24,199 6,080395 West Passaic Street (O) 1979 2006 11,735 2,550 17,131 665 2,550 17,796 20,346 2,458Upper Saddle River 1 Lake Street (O) 1994 1997 35,550 13,952 55,812 479 13,953 56,290 70,243 16,82310 Mountainview Road (O) 1986 1998 -- 4,240 20,485 2,712 4,240 23,197 27,437 7,276Woodcliff Lake 400 Chestnut Ridge Road (O) 1982 1997 -- 4,201 16,802 5,080 4,201 21,882 26,083 7,651470 Chestnut Ridge Road (O) 1987 1997 -- 2,346 9,385 1,435 2,346 10,820 13,166 3,087530 Chestnut Ridge Road (O) 1986 1997 -- 1,860 7,441 81 1,860 7,522 9,382 2,270300 Tice Boulevard (O) 1991 1996 -- 5,424 29,688 5,010 5,424 34,698 40,122 11,39450 Tice Boulevard (O) 1984 1994 19,100 4,500 -- 24,720 4,500 24,720 29,220 14,311
111
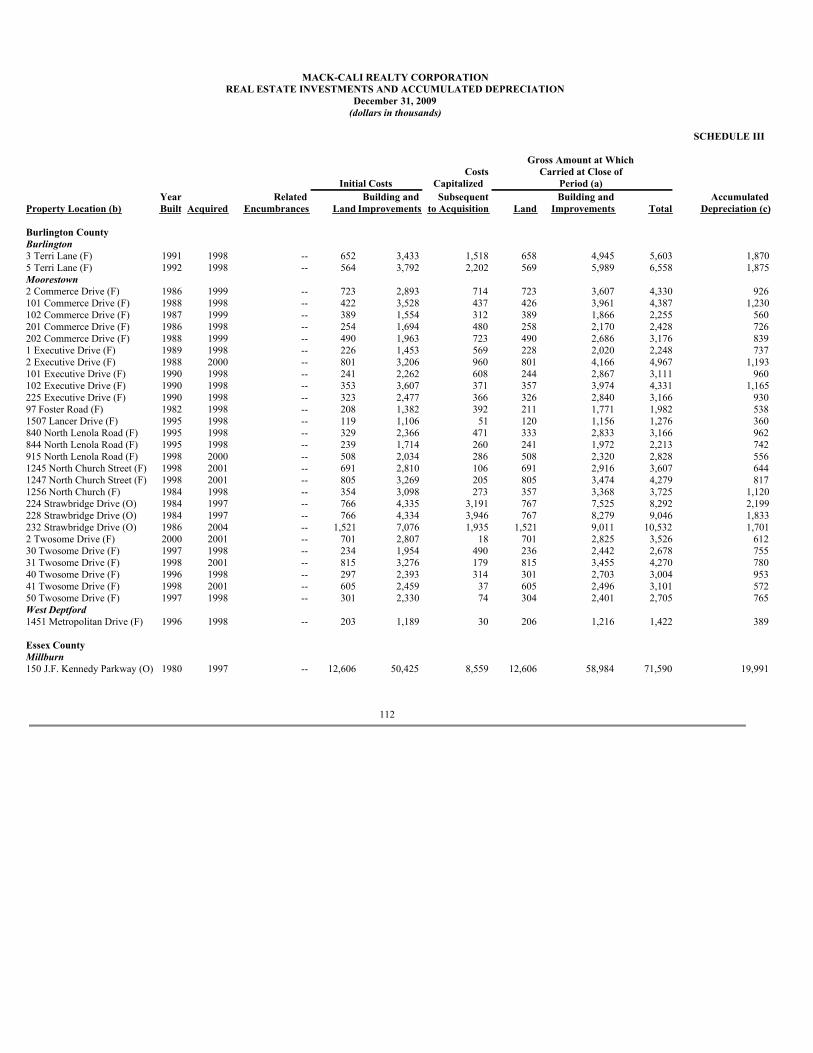
MACK-CALI REALTY CORPORATION
REAL ESTATE INVESTMENTS AND ACCUMULATED DEPRECIATIONDecember 31, 2009
(dollars in thousands) SCHEDULE III Gross Amount at Which Costs Carried at Close of Initial Costs Capitalized Period (a) Year Related Building and Subsequent Building and AccumulatedProperty Location (b) Built Acquired Encumbrances Land Improvements to Acquisition Land Improvements Total Depreciation (c) Burlington County Burlington 3 Terri Lane (F) 1991 1998 -- 652 3,433 1,518 658 4,945 5,603 1,8705 Terri Lane (F) 1992 1998 -- 564 3,792 2,202 569 5,989 6,558 1,875Moorestown 2 Commerce Drive (F) 1986 1999 -- 723 2,893 714 723 3,607 4,330 926101 Commerce Drive (F) 1988 1998 -- 422 3,528 437 426 3,961 4,387 1,230102 Commerce Drive (F) 1987 1999 -- 389 1,554 312 389 1,866 2,255 560201 Commerce Drive (F) 1986 1998 -- 254 1,694 480 258 2,170 2,428 726202 Commerce Drive (F) 1988 1999 -- 490 1,963 723 490 2,686 3,176 8391 Executive Drive (F) 1989 1998 -- 226 1,453 569 228 2,020 2,248 7372 Executive Drive (F) 1988 2000 -- 801 3,206 960 801 4,166 4,967 1,193101 Executive Drive (F) 1990 1998 -- 241 2,262 608 244 2,867 3,111 960102 Executive Drive (F) 1990 1998 -- 353 3,607 371 357 3,974 4,331 1,165225 Executive Drive (F) 1990 1998 -- 323 2,477 366 326 2,840 3,166 93097 Foster Road (F) 1982 1998 -- 208 1,382 392 211 1,771 1,982 5381507 Lancer Drive (F) 1995 1998 -- 119 1,106 51 120 1,156 1,276 360840 North Lenola Road (F) 1995 1998 -- 329 2,366 471 333 2,833 3,166 962844 North Lenola Road (F) 1995 1998 -- 239 1,714 260 241 1,972 2,213 742915 North Lenola Road (F) 1998 2000 -- 508 2,034 286 508 2,320 2,828 5561245 North Church Street (F) 1998 2001 -- 691 2,810 106 691 2,916 3,607 6441247 North Church Street (F) 1998 2001 -- 805 3,269 205 805 3,474 4,279 8171256 North Church (F) 1984 1998 -- 354 3,098 273 357 3,368 3,725 1,120224 Strawbridge Drive (O) 1984 1997 -- 766 4,335 3,191 767 7,525 8,292 2,199228 Strawbridge Drive (O) 1984 1997 -- 766 4,334 3,946 767 8,279 9,046 1,833232 Strawbridge Drive (O) 1986 2004 -- 1,521 7,076 1,935 1,521 9,011 10,532 1,7012 Twosome Drive (F) 2000 2001 -- 701 2,807 18 701 2,825 3,526 61230 Twosome Drive (F) 1997 1998 -- 234 1,954 490 236 2,442 2,678 75531 Twosome Drive (F) 1998 2001 -- 815 3,276 179 815 3,455 4,270 78040 Twosome Drive (F) 1996 1998 -- 297 2,393 314 301 2,703 3,004 95341 Twosome Drive (F) 1998 2001 -- 605 2,459 37 605 2,496 3,101 57250 Twosome Drive (F) 1997 1998 -- 301 2,330 74 304 2,401 2,705 765West Deptford 1451 Metropolitan Drive (F) 1996 1998 -- 203 1,189 30 206 1,216 1,422 389 Essex County Millburn 150 J.F. Kennedy Parkway (O) 1980 1997 -- 12,606 50,425 8,559 12,606 58,984 71,590 19,991
112
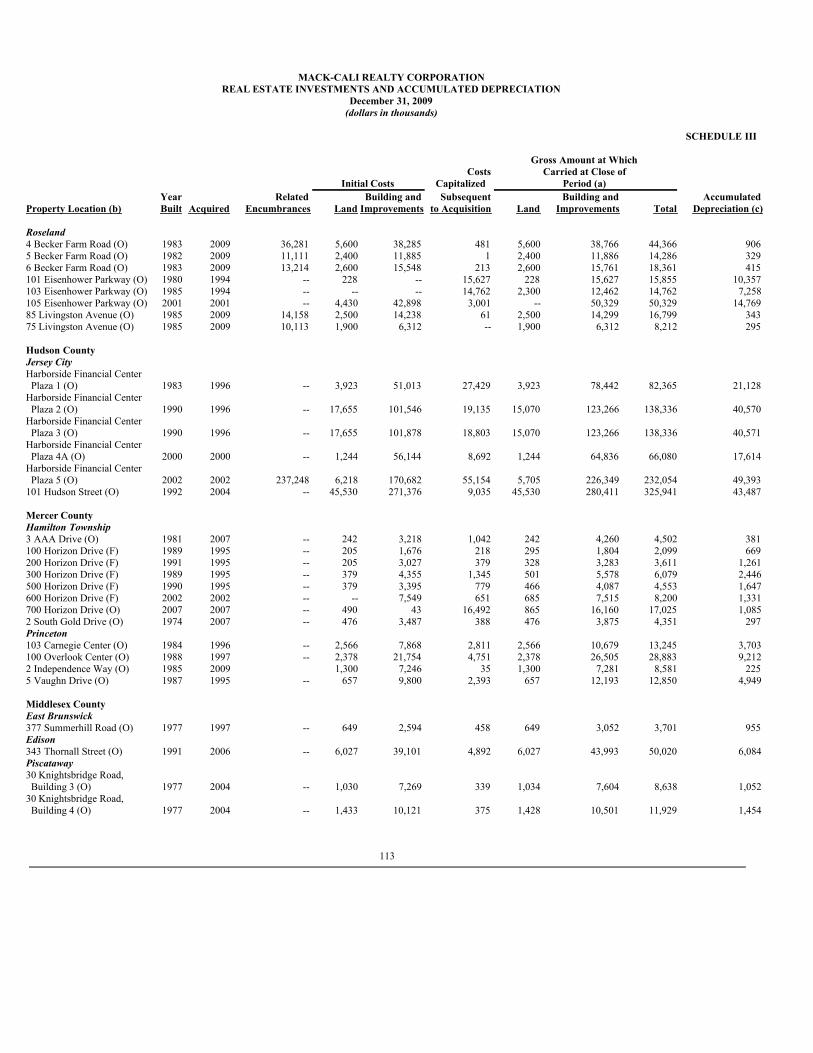
MACK-CALI REALTY CORPORATION
REAL ESTATE INVESTMENTS AND ACCUMULATED DEPRECIATIONDecember 31, 2009
(dollars in thousands) SCHEDULE III Gross Amount at Which Costs Carried at Close of Initial Costs Capitalized Period (a) Year Related Building and Subsequent Building and AccumulatedProperty Location (b) Built Acquired Encumbrances Land Improvements to Acquisition Land Improvements Total Depreciation (c) Roseland 4 Becker Farm Road (O) 1983 2009 36,281 5,600 38,285 481 5,600 38,766 44,366 9065 Becker Farm Road (O) 1982 2009 11,111 2,400 11,885 1 2,400 11,886 14,286 3296 Becker Farm Road (O) 1983 2009 13,214 2,600 15,548 213 2,600 15,761 18,361 415101 Eisenhower Parkway (O) 1980 1994 -- 228 -- 15,627 228 15,627 15,855 10,357103 Eisenhower Parkway (O) 1985 1994 -- -- -- 14,762 2,300 12,462 14,762 7,258105 Eisenhower Parkway (O) 2001 2001 -- 4,430 42,898 3,001 -- 50,329 50,329 14,76985 Livingston Avenue (O) 1985 2009 14,158 2,500 14,238 61 2,500 14,299 16,799 34375 Livingston Avenue (O) 1985 2009 10,113 1,900 6,312 -- 1,900 6,312 8,212 295 Hudson County Jersey City Harborside Financial Center Plaza 1 (O) 1983 1996 -- 3,923 51,013 27,429 3,923 78,442 82,365 21,128Harborside Financial Center Plaza 2 (O) 1990 1996 -- 17,655 101,546 19,135 15,070 123,266 138,336 40,570Harborside Financial Center Plaza 3 (O) 1990 1996 -- 17,655 101,878 18,803 15,070 123,266 138,336 40,571Harborside Financial Center Plaza 4A (O) 2000 2000 -- 1,244 56,144 8,692 1,244 64,836 66,080 17,614Harborside Financial Center Plaza 5 (O) 2002 2002 237,248 6,218 170,682 55,154 5,705 226,349 232,054 49,393101 Hudson Street (O) 1992 2004 -- 45,530 271,376 9,035 45,530 280,411 325,941 43,487 Mercer County Hamilton Township 3 AAA Drive (O) 1981 2007 -- 242 3,218 1,042 242 4,260 4,502 381100 Horizon Drive (F) 1989 1995 -- 205 1,676 218 295 1,804 2,099 669200 Horizon Drive (F) 1991 1995 -- 205 3,027 379 328 3,283 3,611 1,261300 Horizon Drive (F) 1989 1995 -- 379 4,355 1,345 501 5,578 6,079 2,446500 Horizon Drive (F) 1990 1995 -- 379 3,395 779 466 4,087 4,553 1,647600 Horizon Drive (F) 2002 2002 -- -- 7,549 651 685 7,515 8,200 1,331700 Horizon Drive (O) 2007 2007 -- 490 43 16,492 865 16,160 17,025 1,0852 South Gold Drive (O) 1974 2007 -- 476 3,487 388 476 3,875 4,351 297Princeton 103 Carnegie Center (O) 1984 1996 -- 2,566 7,868 2,811 2,566 10,679 13,245 3,703100 Overlook Center (O) 1988 1997 -- 2,378 21,754 4,751 2,378 26,505 28,883 9,2122 Independence Way (O) 1985 2009 1,300 7,246 35 1,300 7,281 8,581 2255 Vaughn Drive (O) 1987 1995 -- 657 9,800 2,393 657 12,193 12,850 4,949 Middlesex County East Brunswick 377 Summerhill Road (O) 1977 1997 -- 649 2,594 458 649 3,052 3,701 955Edison 343 Thornall Street (O) 1991 2006 -- 6,027 39,101 4,892 6,027 43,993 50,020 6,084Piscataway 30 Knightsbridge Road, Building 3 (O) 1977 2004 -- 1,030 7,269 339 1,034 7,604 8,638 1,05230 Knightsbridge Road, Building 4 (O) 1977 2004 -- 1,433 10,121 375 1,428 10,501 11,929 1,454
113
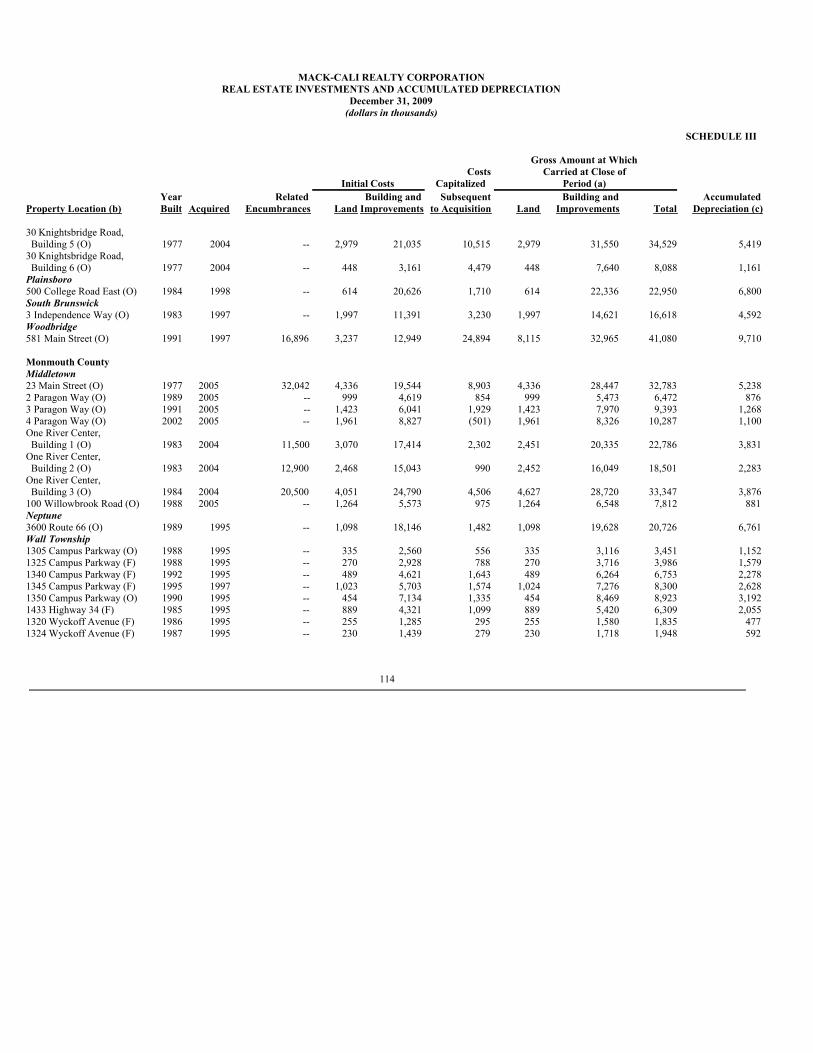
MACK-CALI REALTY CORPORATION
REAL ESTATE INVESTMENTS AND ACCUMULATED DEPRECIATIONDecember 31, 2009
(dollars in thousands) SCHEDULE III Gross Amount at Which Costs Carried at Close of Initial Costs Capitalized Period (a) Year Related Building and Subsequent Building and AccumulatedProperty Location (b) Built Acquired Encumbrances Land Improvements to Acquisition Land Improvements Total Depreciation (c) 30 Knightsbridge Road, Building 5 (O) 1977 2004 -- 2,979 21,035 10,515 2,979 31,550 34,529 5,41930 Knightsbridge Road, Building 6 (O) 1977 2004 -- 448 3,161 4,479 448 7,640 8,088 1,161Plainsboro 500 College Road East (O) 1984 1998 -- 614 20,626 1,710 614 22,336 22,950 6,800South Brunswick 3 Independence Way (O) 1983 1997 -- 1,997 11,391 3,230 1,997 14,621 16,618 4,592Woodbridge 581 Main Street (O) 1991 1997 16,896 3,237 12,949 24,894 8,115 32,965 41,080 9,710 Monmouth County Middletown 23 Main Street (O) 1977 2005 32,042 4,336 19,544 8,903 4,336 28,447 32,783 5,2382 Paragon Way (O) 1989 2005 -- 999 4,619 854 999 5,473 6,472 8763 Paragon Way (O) 1991 2005 -- 1,423 6,041 1,929 1,423 7,970 9,393 1,2684 Paragon Way (O) 2002 2005 -- 1,961 8,827 (501) 1,961 8,326 10,287 1,100One River Center, Building 1 (O) 1983 2004 11,500 3,070 17,414 2,302 2,451 20,335 22,786 3,831One River Center, Building 2 (O) 1983 2004 12,900 2,468 15,043 990 2,452 16,049 18,501 2,283One River Center, Building 3 (O) 1984 2004 20,500 4,051 24,790 4,506 4,627 28,720 33,347 3,876100 Willowbrook Road (O) 1988 2005 -- 1,264 5,573 975 1,264 6,548 7,812 881Neptune 3600 Route 66 (O) 1989 1995 -- 1,098 18,146 1,482 1,098 19,628 20,726 6,761Wall Township 1305 Campus Parkway (O) 1988 1995 -- 335 2,560 556 335 3,116 3,451 1,1521325 Campus Parkway (F) 1988 1995 -- 270 2,928 788 270 3,716 3,986 1,5791340 Campus Parkway (F) 1992 1995 -- 489 4,621 1,643 489 6,264 6,753 2,2781345 Campus Parkway (F) 1995 1997 -- 1,023 5,703 1,574 1,024 7,276 8,300 2,6281350 Campus Parkway (O) 1990 1995 -- 454 7,134 1,335 454 8,469 8,923 3,1921433 Highway 34 (F) 1985 1995 -- 889 4,321 1,099 889 5,420 6,309 2,0551320 Wyckoff Avenue (F) 1986 1995 -- 255 1,285 295 255 1,580 1,835 4771324 Wyckoff Avenue (F) 1987 1995 -- 230 1,439 279 230 1,718 1,948 592
114
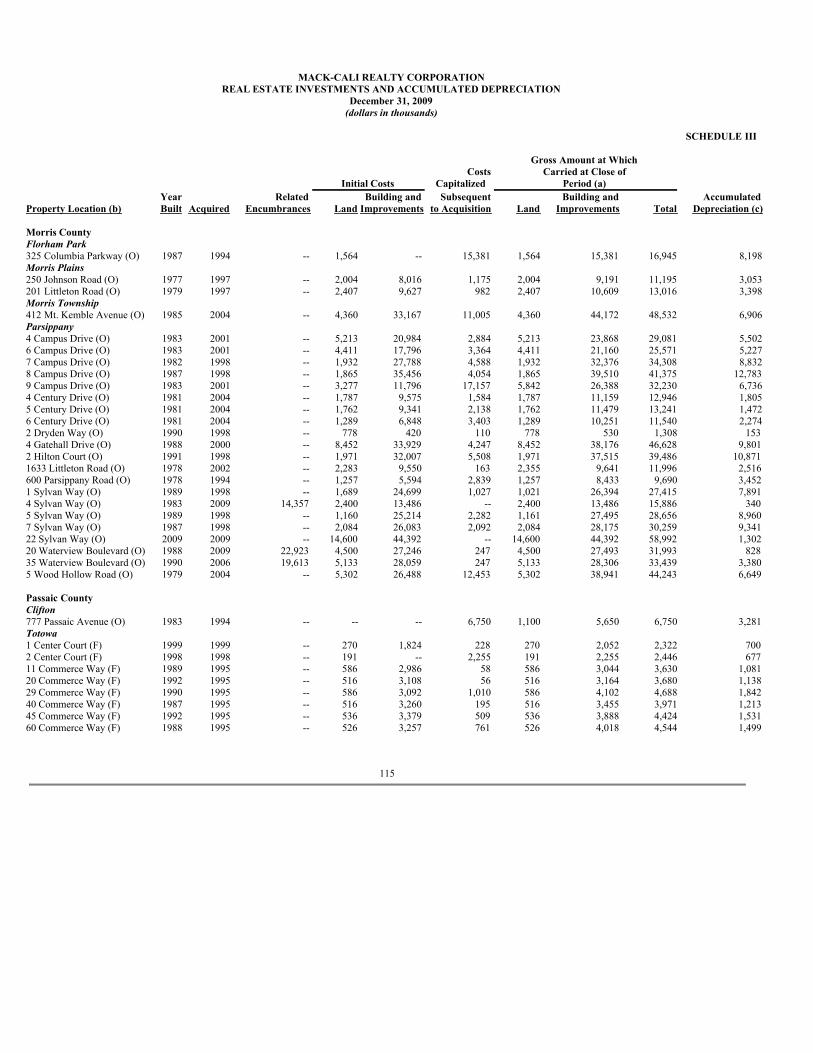
MACK-CALI REALTY CORPORATION
REAL ESTATE INVESTMENTS AND ACCUMULATED DEPRECIATIONDecember 31, 2009
(dollars in thousands) SCHEDULE III Gross Amount at Which Costs Carried at Close of Initial Costs Capitalized Period (a) Year Related Building and Subsequent Building and AccumulatedProperty Location (b) Built Acquired Encumbrances Land Improvements to Acquisition Land Improvements Total Depreciation (c) Morris County Florham Park 325 Columbia Parkway (O) 1987 1994 -- 1,564 -- 15,381 1,564 15,381 16,945 8,198Morris Plains 250 Johnson Road (O) 1977 1997 -- 2,004 8,016 1,175 2,004 9,191 11,195 3,053201 Littleton Road (O) 1979 1997 -- 2,407 9,627 982 2,407 10,609 13,016 3,398Morris Township 412 Mt. Kemble Avenue (O) 1985 2004 -- 4,360 33,167 11,005 4,360 44,172 48,532 6,906Parsippany 4 Campus Drive (O) 1983 2001 -- 5,213 20,984 2,884 5,213 23,868 29,081 5,5026 Campus Drive (O) 1983 2001 -- 4,411 17,796 3,364 4,411 21,160 25,571 5,2277 Campus Drive (O) 1982 1998 -- 1,932 27,788 4,588 1,932 32,376 34,308 8,8328 Campus Drive (O) 1987 1998 -- 1,865 35,456 4,054 1,865 39,510 41,375 12,7839 Campus Drive (O) 1983 2001 -- 3,277 11,796 17,157 5,842 26,388 32,230 6,7364 Century Drive (O) 1981 2004 -- 1,787 9,575 1,584 1,787 11,159 12,946 1,8055 Century Drive (O) 1981 2004 -- 1,762 9,341 2,138 1,762 11,479 13,241 1,4726 Century Drive (O) 1981 2004 -- 1,289 6,848 3,403 1,289 10,251 11,540 2,2742 Dryden Way (O) 1990 1998 -- 778 420 110 778 530 1,308 1534 Gatehall Drive (O) 1988 2000 -- 8,452 33,929 4,247 8,452 38,176 46,628 9,8012 Hilton Court (O) 1991 1998 -- 1,971 32,007 5,508 1,971 37,515 39,486 10,8711633 Littleton Road (O) 1978 2002 -- 2,283 9,550 163 2,355 9,641 11,996 2,516600 Parsippany Road (O) 1978 1994 -- 1,257 5,594 2,839 1,257 8,433 9,690 3,4521 Sylvan Way (O) 1989 1998 -- 1,689 24,699 1,027 1,021 26,394 27,415 7,8914 Sylvan Way (O) 1983 2009 14,357 2,400 13,486 -- 2,400 13,486 15,886 3405 Sylvan Way (O) 1989 1998 -- 1,160 25,214 2,282 1,161 27,495 28,656 8,9607 Sylvan Way (O) 1987 1998 -- 2,084 26,083 2,092 2,084 28,175 30,259 9,34122 Sylvan Way (O) 2009 2009 -- 14,600 44,392 -- 14,600 44,392 58,992 1,30220 Waterview Boulevard (O) 1988 2009 22,923 4,500 27,246 247 4,500 27,493 31,993 82835 Waterview Boulevard (O) 1990 2006 19,613 5,133 28,059 247 5,133 28,306 33,439 3,3805 Wood Hollow Road (O) 1979 2004 -- 5,302 26,488 12,453 5,302 38,941 44,243 6,649 Passaic County Clifton 777 Passaic Avenue (O) 1983 1994 -- -- -- 6,750 1,100 5,650 6,750 3,281Totowa 1 Center Court (F) 1999 1999 -- 270 1,824 228 270 2,052 2,322 7002 Center Court (F) 1998 1998 -- 191 -- 2,255 191 2,255 2,446 67711 Commerce Way (F) 1989 1995 -- 586 2,986 58 586 3,044 3,630 1,08120 Commerce Way (F) 1992 1995 -- 516 3,108 56 516 3,164 3,680 1,13829 Commerce Way (F) 1990 1995 -- 586 3,092 1,010 586 4,102 4,688 1,84240 Commerce Way (F) 1987 1995 -- 516 3,260 195 516 3,455 3,971 1,21345 Commerce Way (F) 1992 1995 -- 536 3,379 509 536 3,888 4,424 1,53160 Commerce Way (F) 1988 1995 -- 526 3,257 761 526 4,018 4,544 1,499
115
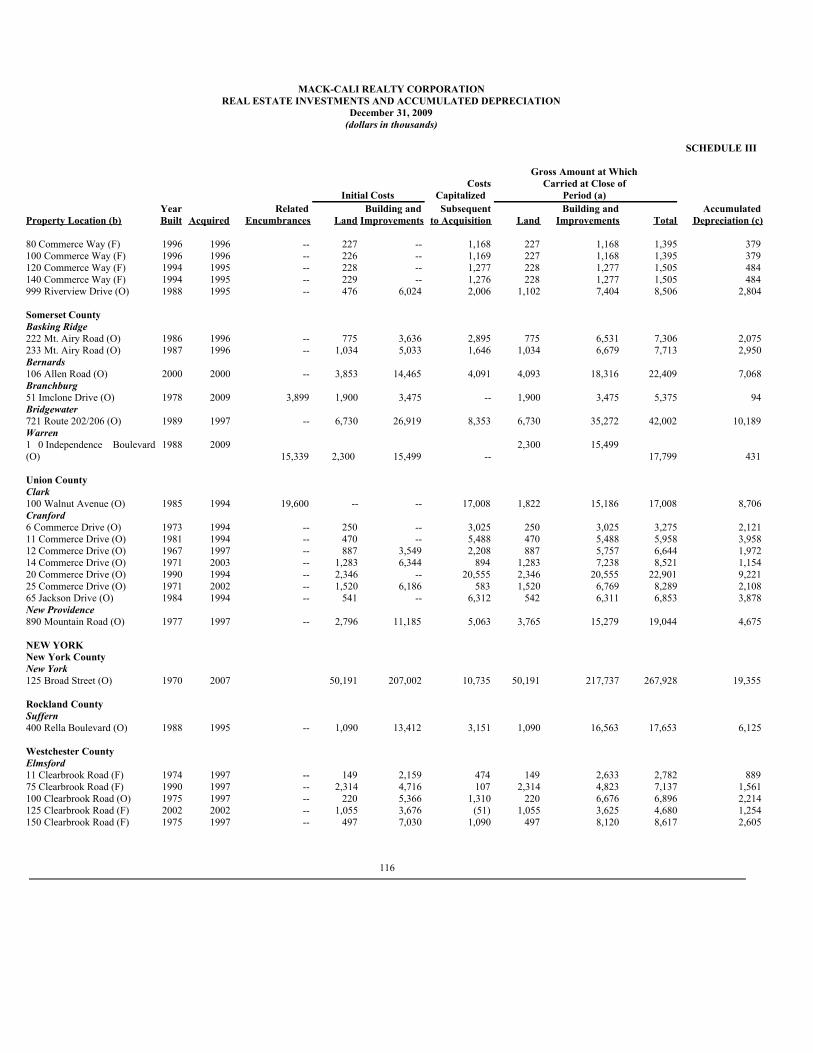
MACK-CALI REALTY CORPORATIONREAL ESTATE INVESTMENTS AND ACCUMULATED DEPRECIATION
December 31, 2009(dollars in thousands)
SCHEDULE III Gross Amount at Which Costs Carried at Close of Initial Costs Capitalized Period (a) Year Related Building and Subsequent Building and AccumulatedProperty Location (b) Built Acquired Encumbrances Land Improvements to Acquisition Land Improvements Total Depreciation (c) 80 Commerce Way (F) 1996 1996 -- 227 -- 1,168 227 1,168 1,395 379100 Commerce Way (F) 1996 1996 -- 226 -- 1,169 227 1,168 1,395 379120 Commerce Way (F) 1994 1995 -- 228 -- 1,277 228 1,277 1,505 484140 Commerce Way (F) 1994 1995 -- 229 -- 1,276 228 1,277 1,505 484999 Riverview Drive (O) 1988 1995 -- 476 6,024 2,006 1,102 7,404 8,506 2,804 Somerset County Basking Ridge 222 Mt. Airy Road (O) 1986 1996 -- 775 3,636 2,895 775 6,531 7,306 2,075233 Mt. Airy Road (O) 1987 1996 -- 1,034 5,033 1,646 1,034 6,679 7,713 2,950Bernards 106 Allen Road (O) 2000 2000 -- 3,853 14,465 4,091 4,093 18,316 22,409 7,068Branchburg 51 Imclone Drive (O) 1978 2009 3,899 1,900 3,475 -- 1,900 3,475 5,375 94Bridgewater 721 Route 202/206 (O) 1989 1997 -- 6,730 26,919 8,353 6,730 35,272 42,002 10,189Warren 1 0 Independence Boulevard(O)
1988 200915,339 2,300 15,499 --
2,300 15,49917,799 431
Union County Clark 100 Walnut Avenue (O) 1985 1994 19,600 -- -- 17,008 1,822 15,186 17,008 8,706Cranford 6 Commerce Drive (O) 1973 1994 -- 250 -- 3,025 250 3,025 3,275 2,12111 Commerce Drive (O) 1981 1994 -- 470 -- 5,488 470 5,488 5,958 3,95812 Commerce Drive (O) 1967 1997 -- 887 3,549 2,208 887 5,757 6,644 1,97214 Commerce Drive (O) 1971 2003 -- 1,283 6,344 894 1,283 7,238 8,521 1,15420 Commerce Drive (O) 1990 1994 -- 2,346 -- 20,555 2,346 20,555 22,901 9,22125 Commerce Drive (O) 1971 2002 -- 1,520 6,186 583 1,520 6,769 8,289 2,10865 Jackson Drive (O) 1984 1994 -- 541 -- 6,312 542 6,311 6,853 3,878New Providence 890 Mountain Road (O) 1977 1997 -- 2,796 11,185 5,063 3,765 15,279 19,044 4,675 NEW YORK New York County New York 125 Broad Street (O) 1970 2007 50,191 207,002 10,735 50,191 217,737 267,928 19,355 Rockland County Suffern 400 Rella Boulevard (O) 1988 1995 -- 1,090 13,412 3,151 1,090 16,563 17,653 6,125 Westchester County Elmsford 11 Clearbrook Road (F) 1974 1997 -- 149 2,159 474 149 2,633 2,782 88975 Clearbrook Road (F) 1990 1997 -- 2,314 4,716 107 2,314 4,823 7,137 1,561100 Clearbrook Road (O) 1975 1997 -- 220 5,366 1,310 220 6,676 6,896 2,214125 Clearbrook Road (F) 2002 2002 -- 1,055 3,676 (51) 1,055 3,625 4,680 1,254150 Clearbrook Road (F) 1975 1997 -- 497 7,030 1,090 497 8,120 8,617 2,605
116
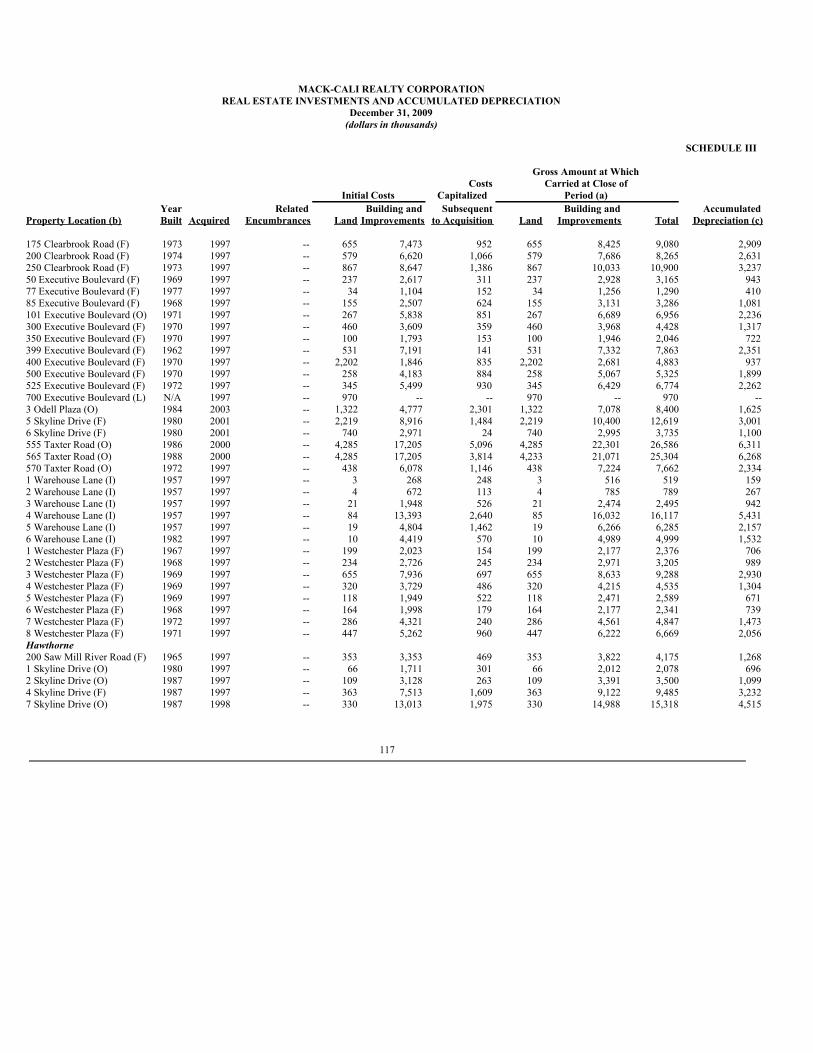
MACK-CALI REALTY CORPORATIONREAL ESTATE INVESTMENTS AND ACCUMULATED DEPRECIATION
December 31, 2009(dollars in thousands)
SCHEDULE III Gross Amount at Which Costs Carried at Close of Initial Costs Capitalized Period (a) Year Related Building and Subsequent Building and AccumulatedProperty Location (b) Built Acquired Encumbrances Land Improvements to Acquisition Land Improvements Total Depreciation (c) 175 Clearbrook Road (F) 1973 1997 -- 655 7,473 952 655 8,425 9,080 2,909200 Clearbrook Road (F) 1974 1997 -- 579 6,620 1,066 579 7,686 8,265 2,631250 Clearbrook Road (F) 1973 1997 -- 867 8,647 1,386 867 10,033 10,900 3,23750 Executive Boulevard (F) 1969 1997 -- 237 2,617 311 237 2,928 3,165 94377 Executive Boulevard (F) 1977 1997 -- 34 1,104 152 34 1,256 1,290 41085 Executive Boulevard (F) 1968 1997 -- 155 2,507 624 155 3,131 3,286 1,081101 Executive Boulevard (O) 1971 1997 -- 267 5,838 851 267 6,689 6,956 2,236300 Executive Boulevard (F) 1970 1997 -- 460 3,609 359 460 3,968 4,428 1,317350 Executive Boulevard (F) 1970 1997 -- 100 1,793 153 100 1,946 2,046 722399 Executive Boulevard (F) 1962 1997 -- 531 7,191 141 531 7,332 7,863 2,351400 Executive Boulevard (F) 1970 1997 -- 2,202 1,846 835 2,202 2,681 4,883 937500 Executive Boulevard (F) 1970 1997 -- 258 4,183 884 258 5,067 5,325 1,899525 Executive Boulevard (F) 1972 1997 -- 345 5,499 930 345 6,429 6,774 2,262700 Executive Boulevard (L) N/A 1997 -- 970 -- -- 970 -- 970 --3 Odell Plaza (O) 1984 2003 -- 1,322 4,777 2,301 1,322 7,078 8,400 1,6255 Skyline Drive (F) 1980 2001 -- 2,219 8,916 1,484 2,219 10,400 12,619 3,0016 Skyline Drive (F) 1980 2001 -- 740 2,971 24 740 2,995 3,735 1,100555 Taxter Road (O) 1986 2000 -- 4,285 17,205 5,096 4,285 22,301 26,586 6,311565 Taxter Road (O) 1988 2000 -- 4,285 17,205 3,814 4,233 21,071 25,304 6,268570 Taxter Road (O) 1972 1997 -- 438 6,078 1,146 438 7,224 7,662 2,3341 Warehouse Lane (I) 1957 1997 -- 3 268 248 3 516 519 1592 Warehouse Lane (I) 1957 1997 -- 4 672 113 4 785 789 2673 Warehouse Lane (I) 1957 1997 -- 21 1,948 526 21 2,474 2,495 9424 Warehouse Lane (I) 1957 1997 -- 84 13,393 2,640 85 16,032 16,117 5,4315 Warehouse Lane (I) 1957 1997 -- 19 4,804 1,462 19 6,266 6,285 2,1576 Warehouse Lane (I) 1982 1997 -- 10 4,419 570 10 4,989 4,999 1,5321 Westchester Plaza (F) 1967 1997 -- 199 2,023 154 199 2,177 2,376 7062 Westchester Plaza (F) 1968 1997 -- 234 2,726 245 234 2,971 3,205 9893 Westchester Plaza (F) 1969 1997 -- 655 7,936 697 655 8,633 9,288 2,9304 Westchester Plaza (F) 1969 1997 -- 320 3,729 486 320 4,215 4,535 1,3045 Westchester Plaza (F) 1969 1997 -- 118 1,949 522 118 2,471 2,589 6716 Westchester Plaza (F) 1968 1997 -- 164 1,998 179 164 2,177 2,341 7397 Westchester Plaza (F) 1972 1997 -- 286 4,321 240 286 4,561 4,847 1,4738 Westchester Plaza (F) 1971 1997 -- 447 5,262 960 447 6,222 6,669 2,056Hawthorne 200 Saw Mill River Road (F) 1965 1997 -- 353 3,353 469 353 3,822 4,175 1,2681 Skyline Drive (O) 1980 1997 -- 66 1,711 301 66 2,012 2,078 6962 Skyline Drive (O) 1987 1997 -- 109 3,128 263 109 3,391 3,500 1,0994 Skyline Drive (F) 1987 1997 -- 363 7,513 1,609 363 9,122 9,485 3,2327 Skyline Drive (O) 1987 1998 -- 330 13,013 1,975 330 14,988 15,318 4,515
117
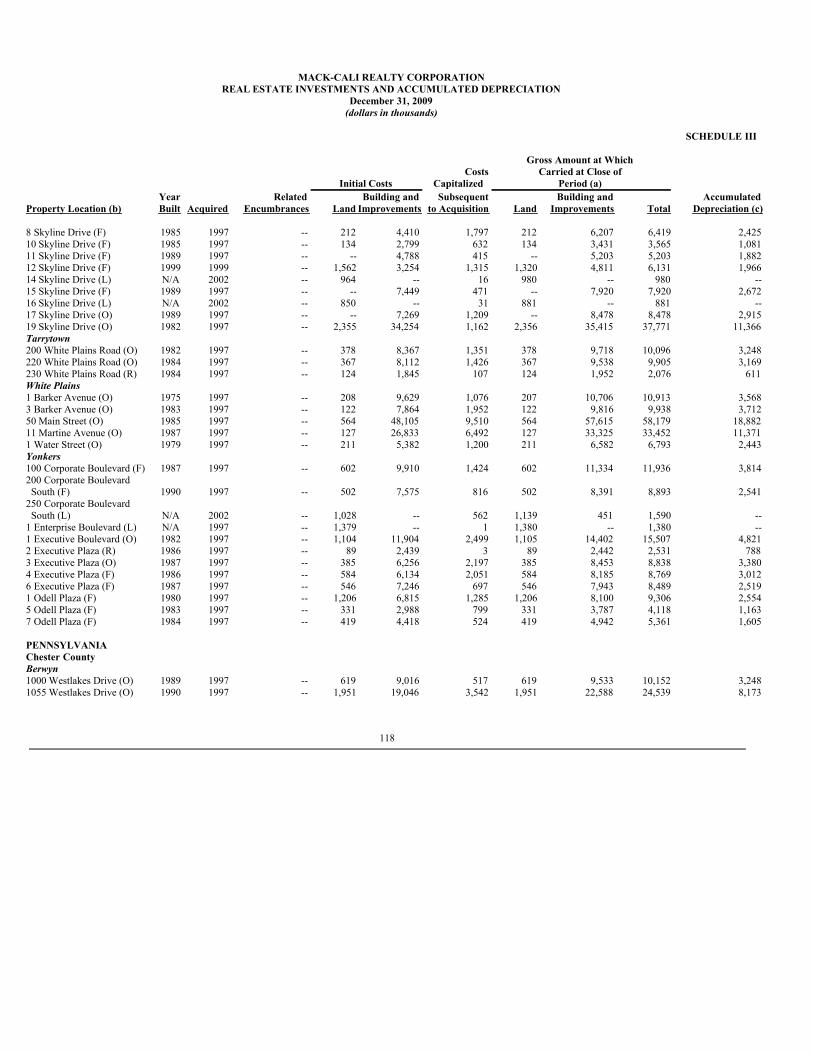
MACK-CALI REALTY CORPORATION
REAL ESTATE INVESTMENTS AND ACCUMULATED DEPRECIATIONDecember 31, 2009
(dollars in thousands) SCHEDULE III Gross Amount at Which Costs Carried at Close of Initial Costs Capitalized Period (a) Year Related Building and Subsequent Building and AccumulatedProperty Location (b) Built Acquired Encumbrances Land Improvements to Acquisition Land Improvements Total Depreciation (c) 8 Skyline Drive (F) 1985 1997 -- 212 4,410 1,797 212 6,207 6,419 2,42510 Skyline Drive (F) 1985 1997 -- 134 2,799 632 134 3,431 3,565 1,08111 Skyline Drive (F) 1989 1997 -- -- 4,788 415 -- 5,203 5,203 1,88212 Skyline Drive (F) 1999 1999 -- 1,562 3,254 1,315 1,320 4,811 6,131 1,96614 Skyline Drive (L) N/A 2002 -- 964 -- 16 980 -- 980 --15 Skyline Drive (F) 1989 1997 -- -- 7,449 471 -- 7,920 7,920 2,67216 Skyline Drive (L) N/A 2002 -- 850 -- 31 881 -- 881 --17 Skyline Drive (O) 1989 1997 -- -- 7,269 1,209 -- 8,478 8,478 2,91519 Skyline Drive (O) 1982 1997 -- 2,355 34,254 1,162 2,356 35,415 37,771 11,366Tarrytown 200 White Plains Road (O) 1982 1997 -- 378 8,367 1,351 378 9,718 10,096 3,248220 White Plains Road (O) 1984 1997 -- 367 8,112 1,426 367 9,538 9,905 3,169230 White Plains Road (R) 1984 1997 -- 124 1,845 107 124 1,952 2,076 611White Plains 1 Barker Avenue (O) 1975 1997 -- 208 9,629 1,076 207 10,706 10,913 3,5683 Barker Avenue (O) 1983 1997 -- 122 7,864 1,952 122 9,816 9,938 3,71250 Main Street (O) 1985 1997 -- 564 48,105 9,510 564 57,615 58,179 18,88211 Martine Avenue (O) 1987 1997 -- 127 26,833 6,492 127 33,325 33,452 11,3711 Water Street (O) 1979 1997 -- 211 5,382 1,200 211 6,582 6,793 2,443Yonkers 100 Corporate Boulevard (F) 1987 1997 -- 602 9,910 1,424 602 11,334 11,936 3,814200 Corporate Boulevard South (F) 1990 1997 -- 502 7,575 816 502 8,391 8,893 2,541250 Corporate Boulevard South (L) N/A 2002 -- 1,028 -- 562 1,139 451 1,590 --1 Enterprise Boulevard (L) N/A 1997 -- 1,379 -- 1 1,380 -- 1,380 --1 Executive Boulevard (O) 1982 1997 -- 1,104 11,904 2,499 1,105 14,402 15,507 4,8212 Executive Plaza (R) 1986 1997 -- 89 2,439 3 89 2,442 2,531 7883 Executive Plaza (O) 1987 1997 -- 385 6,256 2,197 385 8,453 8,838 3,3804 Executive Plaza (F) 1986 1997 -- 584 6,134 2,051 584 8,185 8,769 3,0126 Executive Plaza (F) 1987 1997 -- 546 7,246 697 546 7,943 8,489 2,5191 Odell Plaza (F) 1980 1997 -- 1,206 6,815 1,285 1,206 8,100 9,306 2,5545 Odell Plaza (F) 1983 1997 -- 331 2,988 799 331 3,787 4,118 1,1637 Odell Plaza (F) 1984 1997 -- 419 4,418 524 419 4,942 5,361 1,605 PENNSYLVANIA Chester County Berwyn 1000 Westlakes Drive (O) 1989 1997 -- 619 9,016 517 619 9,533 10,152 3,2481055 Westlakes Drive (O) 1990 1997 -- 1,951 19,046 3,542 1,951 22,588 24,539 8,173
118
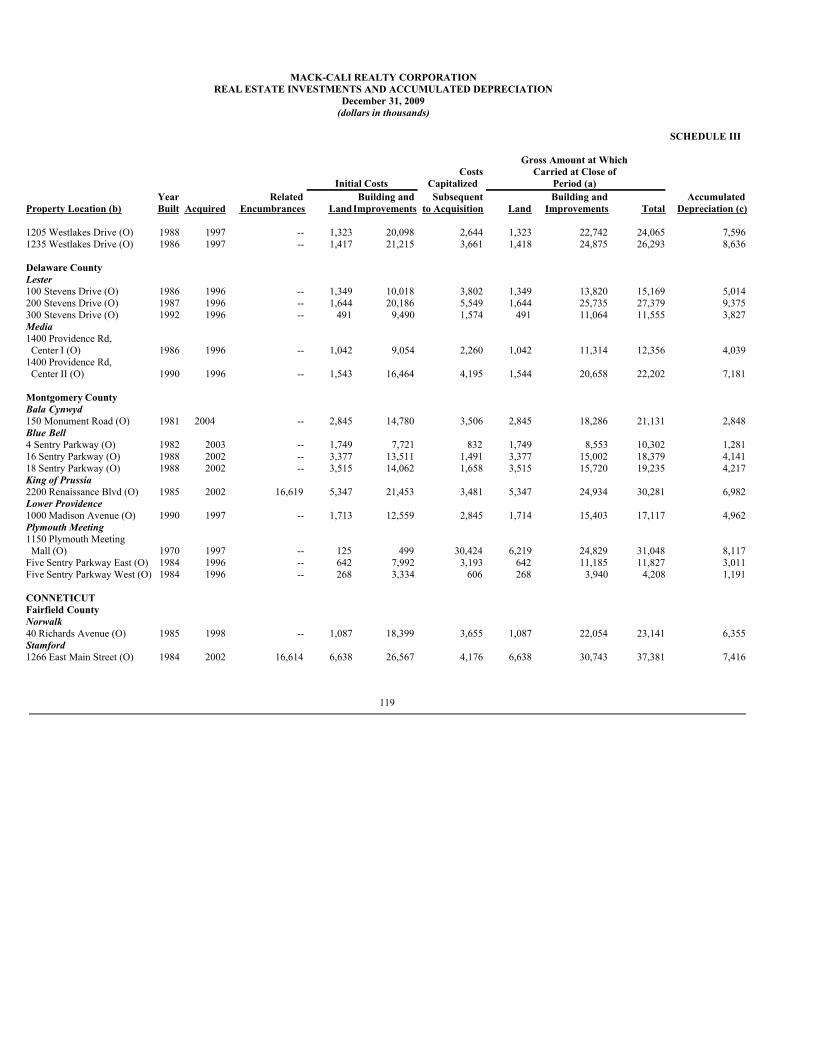
MACK-CALI REALTY CORPORATION
REAL ESTATE INVESTMENTS AND ACCUMULATED DEPRECIATION December 31, 2009
(dollars in thousands) SCHEDULE III Gross Amount at Which Costs Carried at Close of Initial Costs Capitalized Period (a) Year Related Building and Subsequent Building and Accumulated Property Location (b) Built Acquired Encumbrances LandImprovements to Acquisition Land Improvements Total Depreciation (c) 1205 Westlakes Drive (O) 1988 1997 -- 1,323 20,098 2,644 1,323 22,742 24,065 7,596 1235 Westlakes Drive (O) 1986 1997 -- 1,417 21,215 3,661 1,418 24,875 26,293 8,636 Delaware County Lester 100 Stevens Drive (O) 1986 1996 -- 1,349 10,018 3,802 1,349 13,820 15,169 5,014 200 Stevens Drive (O) 1987 1996 -- 1,644 20,186 5,549 1,644 25,735 27,379 9,375 300 Stevens Drive (O) 1992 1996 -- 491 9,490 1,574 491 11,064 11,555 3,827 Media 1400 Providence Rd, Center I (O) 1986 1996 -- 1,042 9,054 2,260 1,042 11,314 12,356 4,039 1400 Providence Rd, Center II (O) 1990 1996 -- 1,543 16,464 4,195 1,544 20,658 22,202 7,181 Montgomery County Bala Cynwyd 150 Monument Road (O) 1981 2004 -- 2,845 14,780 3,506 2,845 18,286 21,131 2,848 Blue Bell 4 Sentry Parkway (O) 1982 2003 -- 1,749 7,721 832 1,749 8,553 10,302 1,281 16 Sentry Parkway (O) 1988 2002 -- 3,377 13,511 1,491 3,377 15,002 18,379 4,141 18 Sentry Parkway (O) 1988 2002 -- 3,515 14,062 1,658 3,515 15,720 19,235 4,217 King of Prussia 2200 Renaissance Blvd (O) 1985 2002 16,619 5,347 21,453 3,481 5,347 24,934 30,281 6,982 Lower Providence 1000 Madison Avenue (O) 1990 1997 -- 1,713 12,559 2,845 1,714 15,403 17,117 4,962 Plymouth Meeting 1150 Plymouth Meeting Mall (O) 1970 1997 -- 125 499 30,424 6,219 24,829 31,048 8,117 Five Sentry Parkway East (O) 1984 1996 -- 642 7,992 3,193 642 11,185 11,827 3,011 Five Sentry Parkway West (O) 1984 1996 -- 268 3,334 606 268 3,940 4,208 1,191 CONNETICUT Fairfield County Norwalk 40 Richards Avenue (O) 1985 1998 -- 1,087 18,399 3,655 1,087 22,054 23,141 6,355 Stamford 1266 East Main Street (O) 1984 2002 16,614 6,638 26,567 4,176 6,638 30,743 37,381 7,416
119
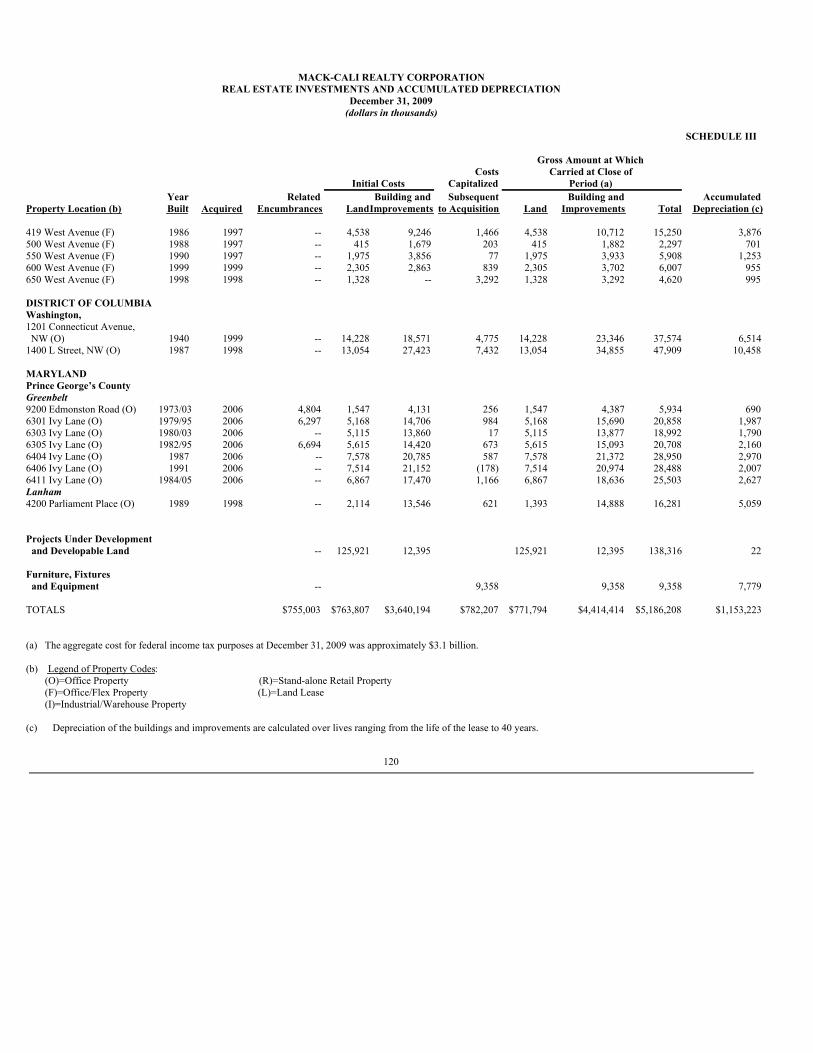
MACK-CALI REALTY CORPORATION
REAL ESTATE INVESTMENTS AND ACCUMULATED DEPRECIATIONDecember 31, 2009
(dollars in thousands) SCHEDULE III Gross Amount at Which Costs Carried at Close of Initial Costs Capitalized Period (a) Year Related Building and Subsequent Building and AccumulatedProperty Location (b) Built Acquired Encumbrances LandImprovements to Acquisition Land Improvements Total Depreciation (c) 419 West Avenue (F) 1986 1997 -- 4,538 9,246 1,466 4,538 10,712 15,250 3,876500 West Avenue (F) 1988 1997 -- 415 1,679 203 415 1,882 2,297 701550 West Avenue (F) 1990 1997 -- 1,975 3,856 77 1,975 3,933 5,908 1,253600 West Avenue (F) 1999 1999 -- 2,305 2,863 839 2,305 3,702 6,007 955650 West Avenue (F) 1998 1998 -- 1,328 -- 3,292 1,328 3,292 4,620 995 DISTRICT OF COLUMBIA Washington, 1201 Connecticut Avenue, NW (O) 1940 1999 -- 14,228 18,571 4,775 14,228 23,346 37,574 6,5141400 L Street, NW (O) 1987 1998 -- 13,054 27,423 7,432 13,054 34,855 47,909 10,458 MARYLAND Prince George’s County Greenbelt 9200 Edmonston Road (O) 1973/03 2006 4,804 1,547 4,131 256 1,547 4,387 5,934 6906301 Ivy Lane (O) 1979/95 2006 6,297 5,168 14,706 984 5,168 15,690 20,858 1,9876303 Ivy Lane (O) 1980/03 2006 -- 5,115 13,860 17 5,115 13,877 18,992 1,7906305 Ivy Lane (O) 1982/95 2006 6,694 5,615 14,420 673 5,615 15,093 20,708 2,1606404 Ivy Lane (O) 1987 2006 -- 7,578 20,785 587 7,578 21,372 28,950 2,9706406 Ivy Lane (O) 1991 2006 -- 7,514 21,152 (178) 7,514 20,974 28,488 2,0076411 Ivy Lane (O) 1984/05 2006 -- 6,867 17,470 1,166 6,867 18,636 25,503 2,627Lanham 4200 Parliament Place (O) 1989 1998 -- 2,114 13,546 621 1,393 14,888 16,281 5,059 Projects Under Development and Developable Land -- 125,921 12,395 125,921 12,395 138,316 22 Furniture, Fixtures and Equipment -- 9,358 9,358 9,358 7,779 TOTALS $755,003 $763,807 $3,640,194 $782,207 $771,794 $4,414,414 $5,186,208 $1,153,223
(a) The aggregate cost for federal income tax purposes at December 31, 2009 was approximately $3.1 billion.
(b) Legend of Property Codes:(O)=Office Property (R)=Stand-alone Retail Property(F)=Office/Flex Property (L)=Land Lease(I)=Industrial/Warehouse Property
(c) Depreciation of the buildings and improvements are calculated over lives ranging from the life of the lease to 40 years.
120
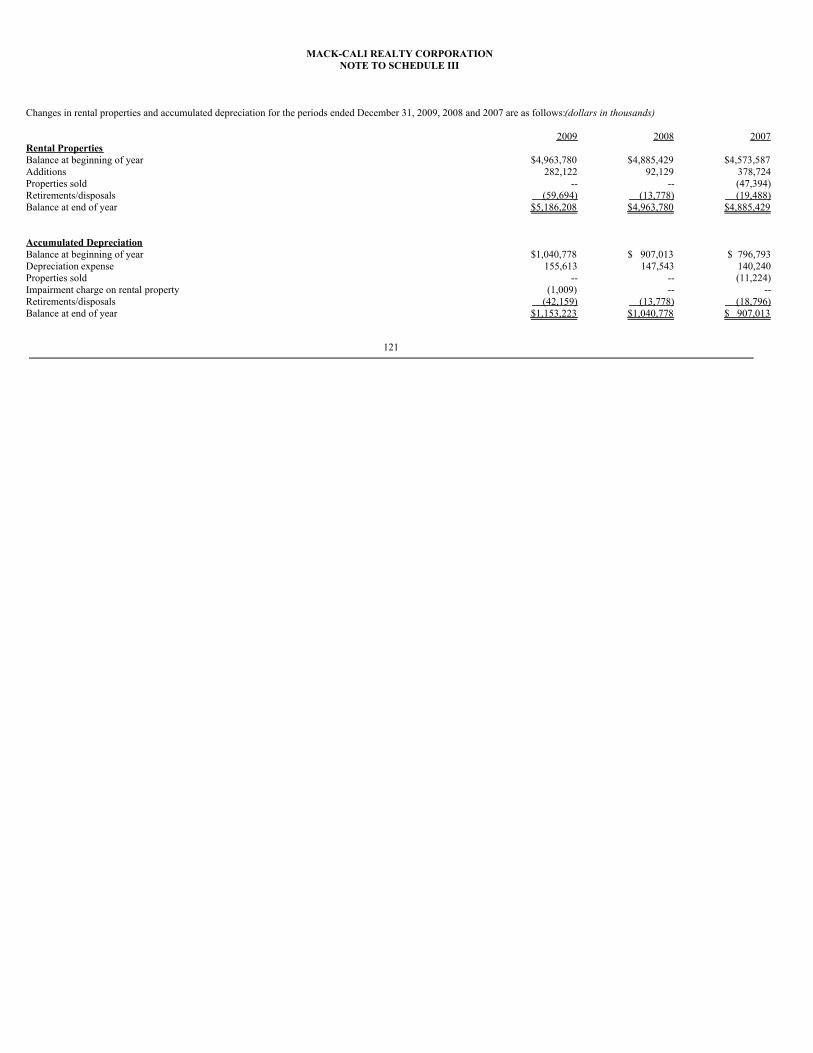
MACK-CALI REALTY CORPORATIONNOTE TO SCHEDULE III
Changes in rental properties and accumulated depreciation for the periods ended December 31, 2009, 2008 and 2007 are as follows: (dollars in thousands)
2009 2008 2007Rental Properties Balance at beginning of year $4,963,780 $4,885,429 $4,573,587Additions 282,122 92,129 378,724Properties sold -- -- (47,394)Retirements/disposals (59,694) (13,778) (19,488)Balance at end of year $5,186,208 $4,963,780 $4,885,429 Accumulated Depreciation Balance at beginning of year $1,040,778 $ 907,013 $ 796,793Depreciation expense 155,613 147,543 140,240Properties sold -- -- (11,224)Impairment charge on rental property (1,009) -- --Retirements/disposals (42,159) (13,778) (18,796)Balance at end of year $1,153,223 $1,040,778 $ 907,013
121
MACK-CALI REALTY CORPORATION
Signatures
Pursuant to the requirements of Section 13 or 15(d) of the Securities Exchange Act of 1934, the Registrant has duly caused this report to be signed on its behalf by the undersignedthereunto duly authorized.
Mack-Cali Realty Corporation(Registrant)
Date: February 10, 2010 /s/ Barry Lefkowitz Barry LefkowitzExecutive Vice President and Chief Financial Officer
Pursuant to the requirements of the Securities Exchange Act of 1934, this report has been signed below by the following persons on behalf of the Registrant and in the capacities andon the dates indicated:
Name Title Date
/s/ William L. Mack Chairman of the Board February 10, 2010 William L. Mack
/s/ Mitchell E. Hersh President and Chief Executive February 10, 2010 Mitchell E. Hersh Officer and Director
/s/ Barry Lefkowitz Executive Vice President and February10, 2010 Barry Lefkowitz Chief Financial Officer
/s/ Martin S. Berger Director February 10, 2010
Martin S. Berger
/s/ Alan S. Bernikow Director February 10, 2010 Alan S. Bernikow
/s/ John R. Cali Director February 10, 2010
John R. Cali
/s/ Kenneth M. Duberstein Director February 10, 2010 Kenneth M. Duberstein
122
Name Title Date
/s/ Nathan Gantcher Director February 10, 2010 Nathan Gantcher
/s/ David S. Mack Director February 10, 2010
David S. Mack
/s/ Alan G. Philibosian Director February 10, 2010 Alan G. Philibosian
/s/ Irvin D. Reid Director February 10, 2010
Irvin D. Reid
/s/ Vincent Tese Director February 10, 2010 Vincent Tese
/s/ Roy J. Zuckerberg Director February 10, 2010
Roy J. Zuckerberg
123
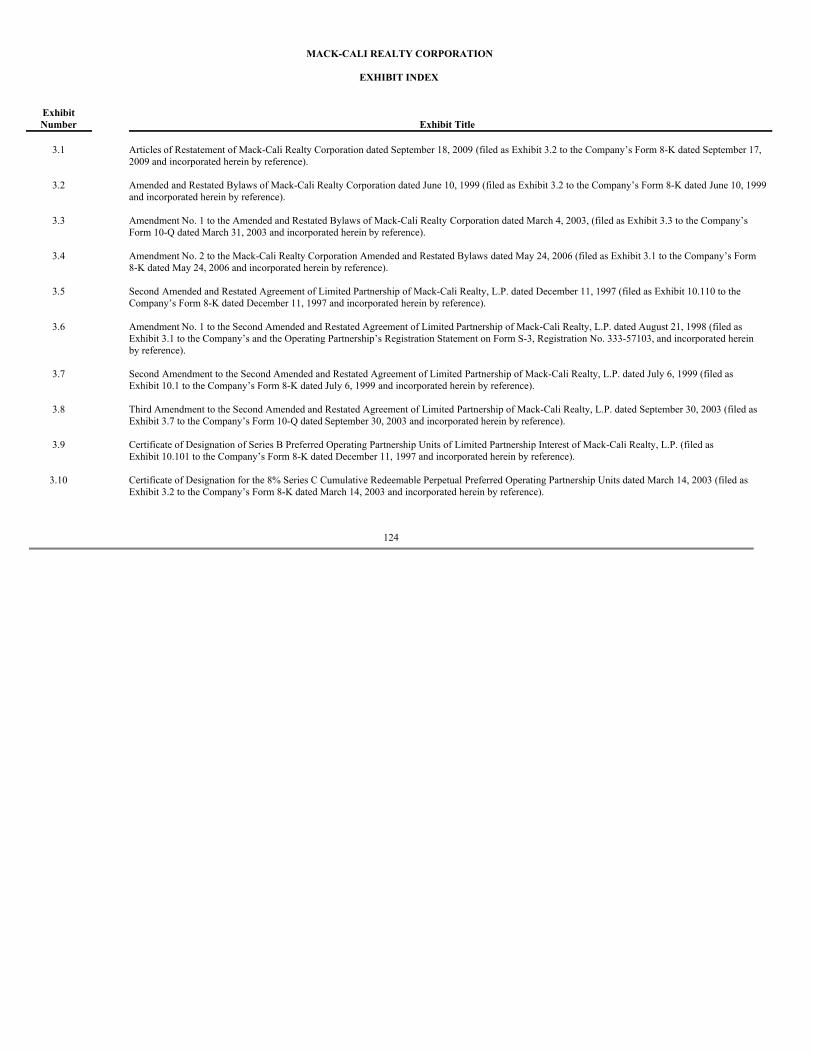
MACK-CALI REALTY CORPORATION
EXHIBIT INDEX
ExhibitNumber Exhibit Title
3.1
Articles of Restatement of Mack-Cali Realty Corporation dated September 18, 2009 (filed as Exhibit 3.2 to the Company’s Form 8-K dated September 17,2009 and incorporated herein by reference).
3.2
Amended and Restated Bylaws of Mack-Cali Realty Corporation dated June 10, 1999 (filed as Exhibit 3.2 to the Company’s Form 8-K dated June 10, 1999and incorporated herein by reference).
3.3
Amendment No. 1 to the Amended and Restated Bylaws of Mack-Cali Realty Corporation dated March 4, 2003, (filed as Exhibit 3.3 to the Company’sForm 10-Q dated March 31, 2003 and incorporated herein by reference).
3.4
Amendment No. 2 to the Mack-Cali Realty Corporation Amended and Restated Bylaws dated May 24, 2006 (filed as Exhibit 3.1 to the Company’s Form8-K dated May 24, 2006 and incorporated herein by reference).
3.5
Second Amended and Restated Agreement of Limited Partnership of Mack-Cali Realty, L.P. dated December 11, 1997 (filed as Exhibit 10.110 to theCompany’s Form 8-K dated December 11, 1997 and incorporated herein by reference).
3.6
Amendment No. 1 to the Second Amended and Restated Agreement of Limited Partnership of Mack-Cali Realty, L.P. dated August 21, 1998 (filed asExhibit 3.1 to the Company’s and the Operating Partnership’s Registration Statement on Form S-3, Registration No. 333-57103, and incorporated hereinby reference).
3.7
Second Amendment to the Second Amended and Restated Agreement of Limited Partnership of Mack-Cali Realty, L.P. dated July 6, 1999 (filed asExhibit 10.1 to the Company’s Form 8-K dated July 6, 1999 and incorporated herein by reference).
3.8
Third Amendment to the Second Amended and Restated Agreement of Limited Partnership of Mack-Cali Realty, L.P. dated September 30, 2003 (filed asExhibit 3.7 to the Company’s Form 10-Q dated September 30, 2003 and incorporated herein by reference).
3.9
Certificate of Designation of Series B Preferred Operating Partnership Units of Limited Partnership Interest of Mack-Cali Realty, L.P. (filed asExhibit 10.101 to the Company’s Form 8-K dated December 11, 1997 and incorporated herein by reference).
3.10
Certificate of Designation for the 8% Series C Cumulative Redeemable Perpetual Preferred Operating Partnership Units dated March 14, 2003 (filed asExhibit 3.2 to the Company’s Form 8-K dated March 14, 2003 and incorporated herein by reference).
124
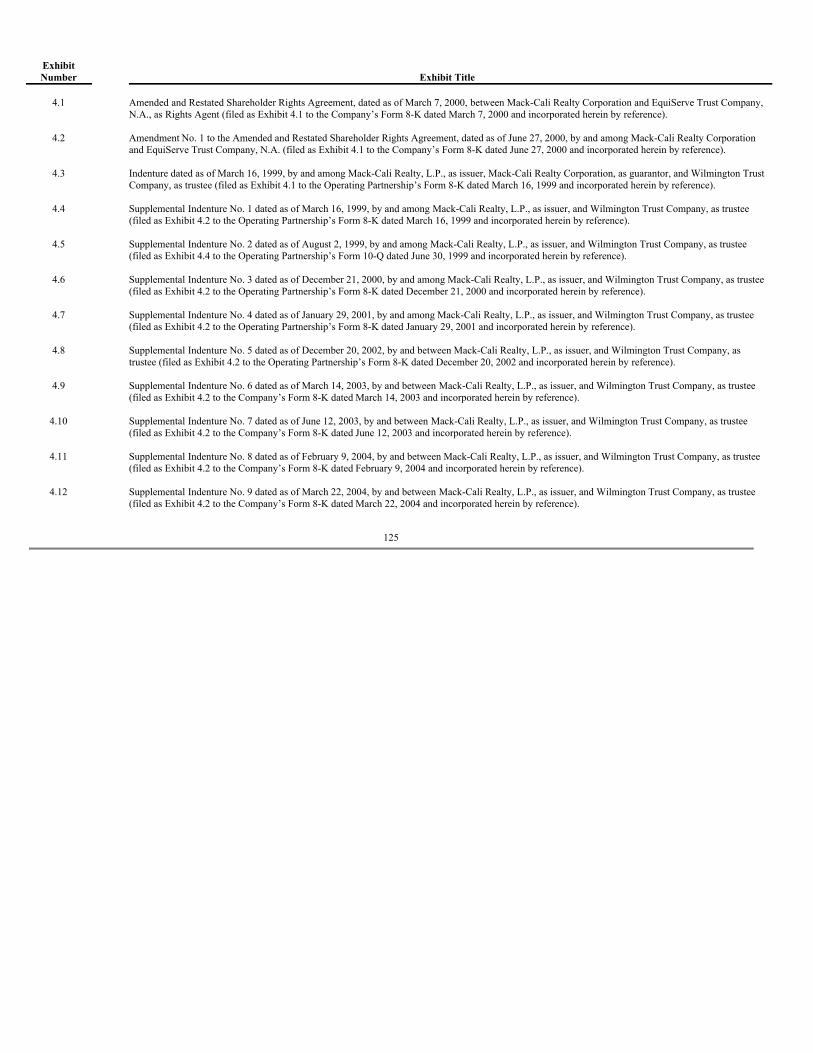
ExhibitNumber Exhibit Title
4.1
Amended and Restated Shareholder Rights Agreement, dated as of March 7, 2000, between Mack-Cali Realty Corporation and EquiServe Trust Company,N.A., as Rights Agent (filed as Exhibit 4.1 to the Company’s Form 8-K dated March 7, 2000 and incorporated herein by reference).
4.2
Amendment No. 1 to the Amended and Restated Shareholder Rights Agreement, dated as of June 27, 2000, by and among Mack-Cali Realty Corporationand EquiServe Trust Company, N.A. (filed as Exhibit 4.1 to the Company’s Form 8-K dated June 27, 2000 and incorporated herein by reference).
4.3
Indenture dated as of March 16, 1999, by and among Mack-Cali Realty, L.P., as issuer, Mack-Cali Realty Corporation, as guarantor, and Wilmington TrustCompany, as trustee (filed as Exhibit 4.1 to the Operating Partnership’s Form 8-K dated March 16, 1999 and incorporated herein by reference).
4.4
Supplemental Indenture No. 1 dated as of March 16, 1999, by and among Mack-Cali Realty, L.P., as issuer, and Wilmington Trust Company, as trustee(filed as Exhibit 4.2 to the Operating Partnership’s Form 8-K dated March 16, 1999 and incorporated herein by reference).
4.5
Supplemental Indenture No. 2 dated as of August 2, 1999, by and among Mack-Cali Realty, L.P., as issuer, and Wilmington Trust Company, as trustee(filed as Exhibit 4.4 to the Operating Partnership’s Form 10-Q dated June 30, 1999 and incorporated herein by reference).
4.6
Supplemental Indenture No. 3 dated as of December 21, 2000, by and among Mack-Cali Realty, L.P., as issuer, and Wilmington Trust Company, as trustee(filed as Exhibit 4.2 to the Operating Partnership’s Form 8-K dated December 21, 2000 and incorporated herein by reference).
4.7
Supplemental Indenture No. 4 dated as of January 29, 2001, by and among Mack-Cali Realty, L.P., as issuer, and Wilmington Trust Company, as trustee(filed as Exhibit 4.2 to the Operating Partnership’s Form 8-K dated January 29, 2001 and incorporated herein by reference).
4.8
Supplemental Indenture No. 5 dated as of December 20, 2002, by and between Mack-Cali Realty, L.P., as issuer, and Wilmington Trust Company, astrustee (filed as Exhibit 4.2 to the Operating Partnership’s Form 8-K dated December 20, 2002 and incorporated herein by reference).
4.9
Supplemental Indenture No. 6 dated as of March 14, 2003, by and between Mack-Cali Realty, L.P., as issuer, and Wilmington Trust Company, as trustee(filed as Exhibit 4.2 to the Company’s Form 8-K dated March 14, 2003 and incorporated herein by reference).
4.10
Supplemental Indenture No. 7 dated as of June 12, 2003, by and between Mack-Cali Realty, L.P., as issuer, and Wilmington Trust Company, as trustee(filed as Exhibit 4.2 to the Company’s Form 8-K dated June 12, 2003 and incorporated herein by reference).
4.11
Supplemental Indenture No. 8 dated as of February 9, 2004, by and between Mack-Cali Realty, L.P., as issuer, and Wilmington Trust Company, as trustee(filed as Exhibit 4.2 to the Company’s Form 8-K dated February 9, 2004 and incorporated herein by reference).
4.12
Supplemental Indenture No. 9 dated as of March 22, 2004, by and between Mack-Cali Realty, L.P., as issuer, and Wilmington Trust Company, as trustee(filed as Exhibit 4.2 to the Company’s Form 8-K dated March 22, 2004 and incorporated herein by reference).
125
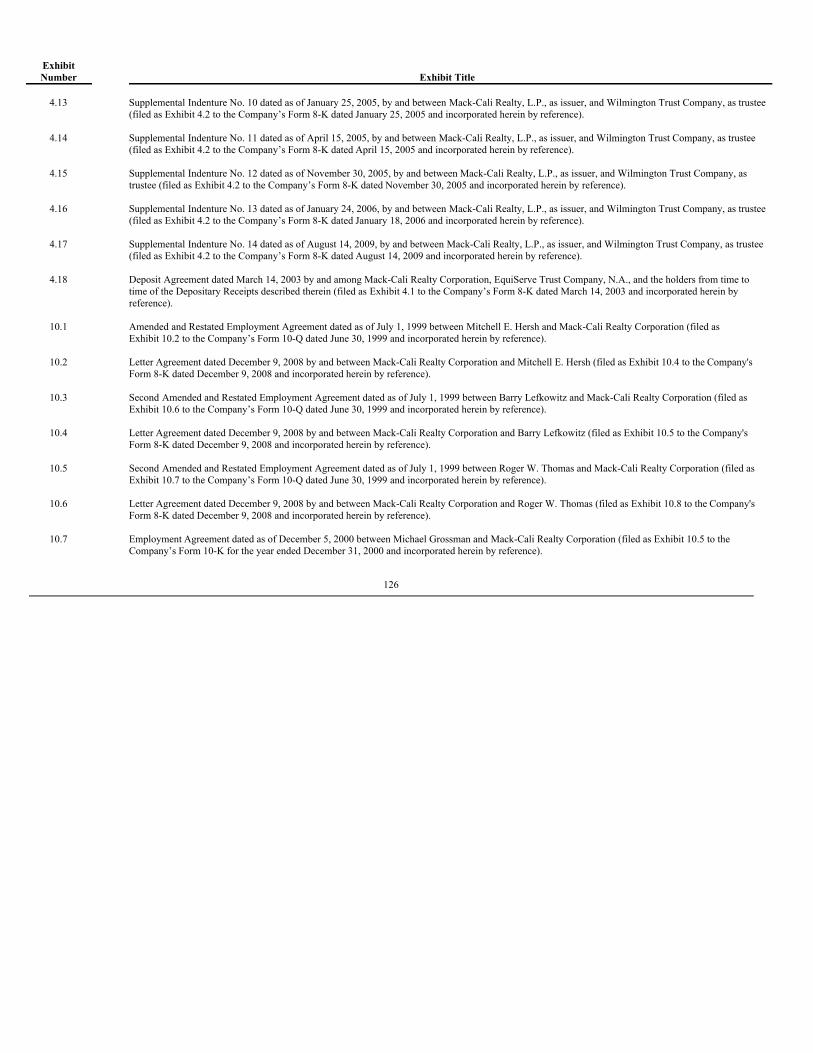
ExhibitNumber Exhibit Title
4.13
Supplemental Indenture No. 10 dated as of January 25, 2005, by and between Mack-Cali Realty, L.P., as issuer, and Wilmington Trust Company, as trustee(filed as Exhibit 4.2 to the Company’s Form 8-K dated January 25, 2005 and incorporated herein by reference).
4.14
Supplemental Indenture No. 11 dated as of April 15, 2005, by and between Mack-Cali Realty, L.P., as issuer, and Wilmington Trust Company, as trustee(filed as Exhibit 4.2 to the Company’s Form 8-K dated April 15, 2005 and incorporated herein by reference).
4.15
Supplemental Indenture No. 12 dated as of November 30, 2005, by and between Mack-Cali Realty, L.P., as issuer, and Wilmington Trust Company, astrustee (filed as Exhibit 4.2 to the Company’s Form 8-K dated November 30, 2005 and incorporated herein by reference).
4.16
Supplemental Indenture No. 13 dated as of January 24, 2006, by and between Mack-Cali Realty, L.P., as issuer, and Wilmington Trust Company, as trustee(filed as Exhibit 4.2 to the Company’s Form 8-K dated January 18, 2006 and incorporated herein by reference).
4.17
Supplemental Indenture No. 14 dated as of August 14, 2009, by and between Mack-Cali Realty, L.P., as issuer, and Wilmington Trust Company, as trustee(filed as Exhibit 4.2 to the Company’s Form 8-K dated August 14, 2009 and incorporated herein by reference).
4.18
Deposit Agreement dated March 14, 2003 by and among Mack-Cali Realty Corporation, EquiServe Trust Company, N.A., and the holders from time totime of the Depositary Receipts described therein (filed as Exhibit 4.1 to the Company’s Form 8-K dated March 14, 2003 and incorporated herein byreference).
10.1
Amended and Restated Employment Agreement dated as of July 1, 1999 between Mitchell E. Hersh and Mack-Cali Realty Corporation (filed asExhibit 10.2 to the Company’s Form 10-Q dated June 30, 1999 and incorporated herein by reference).
10.2
Letter Agreement dated December 9, 2008 by and between Mack-Cali Realty Corporation and Mitchell E. Hersh (filed as Exhibit 10.4 to the Company'sForm 8-K dated December 9, 2008 and incorporated herein by reference).
10.3
Second Amended and Restated Employment Agreement dated as of July 1, 1999 between Barry Lefkowitz and Mack-Cali Realty Corporation (filed asExhibit 10.6 to the Company’s Form 10-Q dated June 30, 1999 and incorporated herein by reference).
10.4
Letter Agreement dated December 9, 2008 by and between Mack-Cali Realty Corporation and Barry Lefkowitz (filed as Exhibit 10.5 to the Company'sForm 8-K dated December 9, 2008 and incorporated herein by reference).
10.5
Second Amended and Restated Employment Agreement dated as of July 1, 1999 between Roger W. Thomas and Mack-Cali Realty Corporation (filed asExhibit 10.7 to the Company’s Form 10-Q dated June 30, 1999 and incorporated herein by reference).
10.6
Letter Agreement dated December 9, 2008 by and between Mack-Cali Realty Corporation and Roger W. Thomas (filed as Exhibit 10.8 to the Company'sForm 8-K dated December 9, 2008 and incorporated herein by reference).
10.7
Employment Agreement dated as of December 5, 2000 between Michael Grossman and Mack-Cali Realty Corporation (filed as Exhibit 10.5 to theCompany’s Form 10-K for the year ended December 31, 2000 and incorporated herein by reference).
126
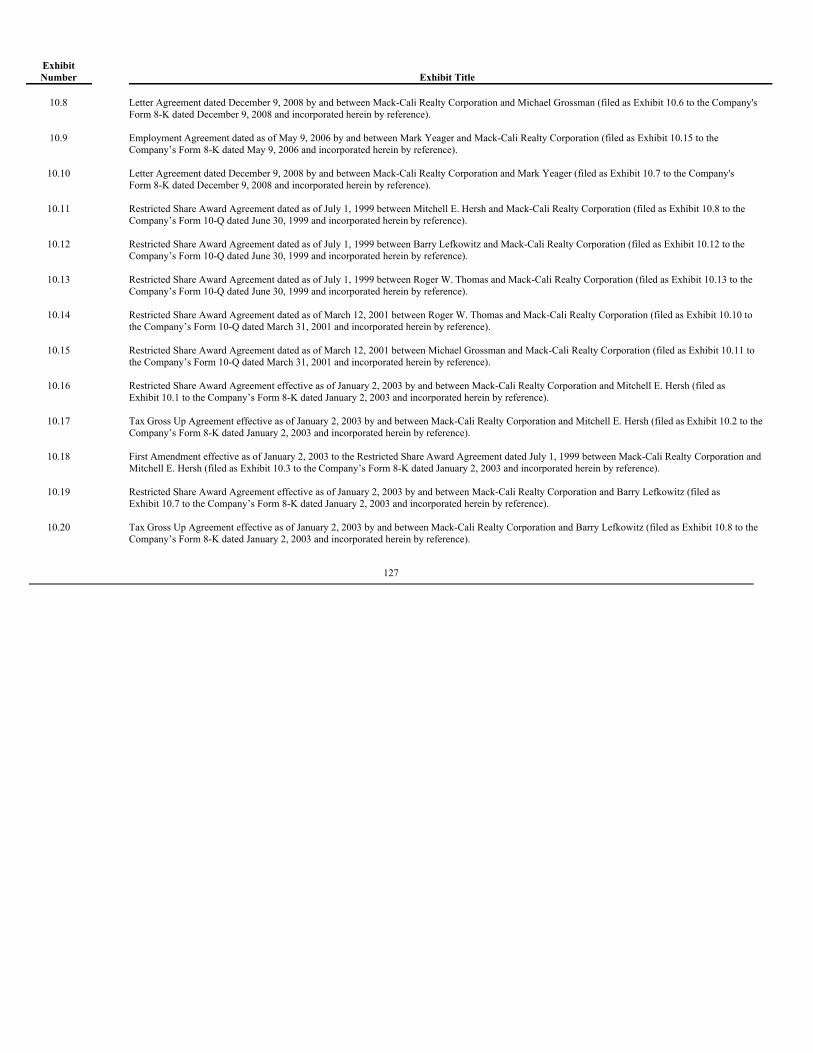
ExhibitNumber Exhibit Title
10.8
Letter Agreement dated December 9, 2008 by and between Mack-Cali Realty Corporation and Michael Grossman (filed as Exhibit 10.6 to the Company'sForm 8-K dated December 9, 2008 and incorporated herein by reference).
10.9
Employment Agreement dated as of May 9, 2006 by and between Mark Yeager and Mack-Cali Realty Corporation (filed as Exhibit 10.15 to theCompany’s Form 8-K dated May 9, 2006 and incorporated herein by reference).
10.10
Letter Agreement dated December 9, 2008 by and between Mack-Cali Realty Corporation and Mark Yeager (filed as Exhibit 10.7 to the Company'sForm 8-K dated December 9, 2008 and incorporated herein by reference).
10.11
Restricted Share Award Agreement dated as of July 1, 1999 between Mitchell E. Hersh and Mack-Cali Realty Corporation (filed as Exhibit 10.8 to theCompany’s Form 10-Q dated June 30, 1999 and incorporated herein by reference).
10.12
Restricted Share Award Agreement dated as of July 1, 1999 between Barry Lefkowitz and Mack-Cali Realty Corporation (filed as Exhibit 10.12 to theCompany’s Form 10-Q dated June 30, 1999 and incorporated herein by reference).
10.13
Restricted Share Award Agreement dated as of July 1, 1999 between Roger W. Thomas and Mack-Cali Realty Corporation (filed as Exhibit 10.13 to theCompany’s Form 10-Q dated June 30, 1999 and incorporated herein by reference).
10.14
Restricted Share Award Agreement dated as of March 12, 2001 between Roger W. Thomas and Mack-Cali Realty Corporation (filed as Exhibit 10.10 tothe Company’s Form 10-Q dated March 31, 2001 and incorporated herein by reference).
10.15
Restricted Share Award Agreement dated as of March 12, 2001 between Michael Grossman and Mack-Cali Realty Corporation (filed as Exhibit 10.11 tothe Company’s Form 10-Q dated March 31, 2001 and incorporated herein by reference).
10.16
Restricted Share Award Agreement effective as of January 2, 2003 by and between Mack-Cali Realty Corporation and Mitchell E. Hersh (filed asExhibit 10.1 to the Company’s Form 8-K dated January 2, 2003 and incorporated herein by reference).
10.17
Tax Gross Up Agreement effective as of January 2, 2003 by and between Mack-Cali Realty Corporation and Mitchell E. Hersh (filed as Exhibit 10.2 to theCompany’s Form 8-K dated January 2, 2003 and incorporated herein by reference).
10.18
First Amendment effective as of January 2, 2003 to the Restricted Share Award Agreement dated July 1, 1999 between Mack-Cali Realty Corporation andMitchell E. Hersh (filed as Exhibit 10.3 to the Company’s Form 8-K dated January 2, 2003 and incorporated herein by reference).
10.19
Restricted Share Award Agreement effective as of January 2, 2003 by and between Mack-Cali Realty Corporation and Barry Lefkowitz (filed asExhibit 10.7 to the Company’s Form 8-K dated January 2, 2003 and incorporated herein by reference).
10.20
Tax Gross Up Agreement effective as of January 2, 2003 by and between Mack-Cali Realty Corporation and Barry Lefkowitz (filed as Exhibit 10.8 to theCompany’s Form 8-K dated January 2, 2003 and incorporated herein by reference).
127
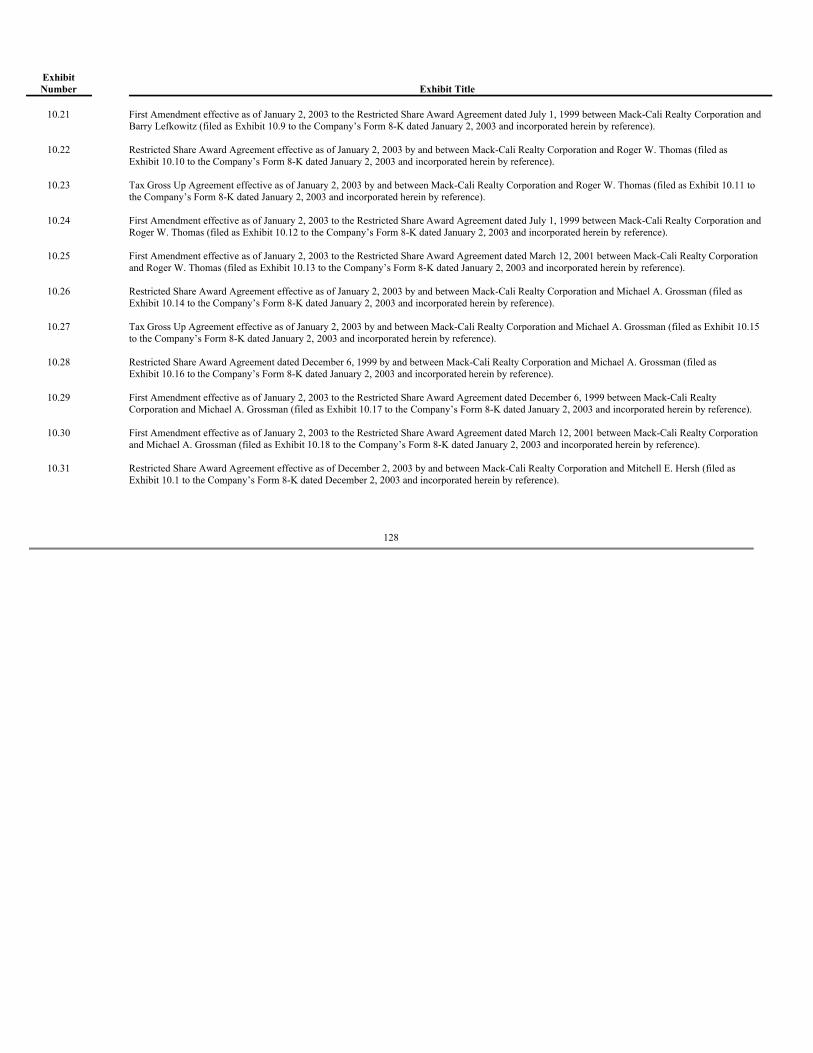
ExhibitNumber Exhibit Title
10.21
First Amendment effective as of January 2, 2003 to the Restricted Share Award Agreement dated July 1, 1999 between Mack-Cali Realty Corporation andBarry Lefkowitz (filed as Exhibit 10.9 to the Company’s Form 8-K dated January 2, 2003 and incorporated herein by reference).
10.22
Restricted Share Award Agreement effective as of January 2, 2003 by and between Mack-Cali Realty Corporation and Roger W. Thomas (filed asExhibit 10.10 to the Company’s Form 8-K dated January 2, 2003 and incorporated herein by reference).
10.23
Tax Gross Up Agreement effective as of January 2, 2003 by and between Mack-Cali Realty Corporation and Roger W. Thomas (filed as Exhibit 10.11 tothe Company’s Form 8-K dated January 2, 2003 and incorporated herein by reference).
10.24
First Amendment effective as of January 2, 2003 to the Restricted Share Award Agreement dated July 1, 1999 between Mack-Cali Realty Corporation andRoger W. Thomas (filed as Exhibit 10.12 to the Company’s Form 8-K dated January 2, 2003 and incorporated herein by reference).
10.25
First Amendment effective as of January 2, 2003 to the Restricted Share Award Agreement dated March 12, 2001 between Mack-Cali Realty Corporationand Roger W. Thomas (filed as Exhibit 10.13 to the Company’s Form 8-K dated January 2, 2003 and incorporated herein by reference).
10.26
Restricted Share Award Agreement effective as of January 2, 2003 by and between Mack-Cali Realty Corporation and Michael A. Grossman (filed asExhibit 10.14 to the Company’s Form 8-K dated January 2, 2003 and incorporated herein by reference).
10.27
Tax Gross Up Agreement effective as of January 2, 2003 by and between Mack-Cali Realty Corporation and Michael A. Grossman (filed as Exhibit 10.15to the Company’s Form 8-K dated January 2, 2003 and incorporated herein by reference).
10.28
Restricted Share Award Agreement dated December 6, 1999 by and between Mack-Cali Realty Corporation and Michael A. Grossman (filed asExhibit 10.16 to the Company’s Form 8-K dated January 2, 2003 and incorporated herein by reference).
10.29
First Amendment effective as of January 2, 2003 to the Restricted Share Award Agreement dated December 6, 1999 between Mack-Cali RealtyCorporation and Michael A. Grossman (filed as Exhibit 10.17 to the Company’s Form 8-K dated January 2, 2003 and incorporated herein by reference).
10.30
First Amendment effective as of January 2, 2003 to the Restricted Share Award Agreement dated March 12, 2001 between Mack-Cali Realty Corporationand Michael A. Grossman (filed as Exhibit 10.18 to the Company’s Form 8-K dated January 2, 2003 and incorporated herein by reference).
10.31
Restricted Share Award Agreement effective as of December 2, 2003 by and between Mack-Cali Realty Corporation and Mitchell E. Hersh (filed asExhibit 10.1 to the Company’s Form 8-K dated December 2, 2003 and incorporated herein by reference).
128
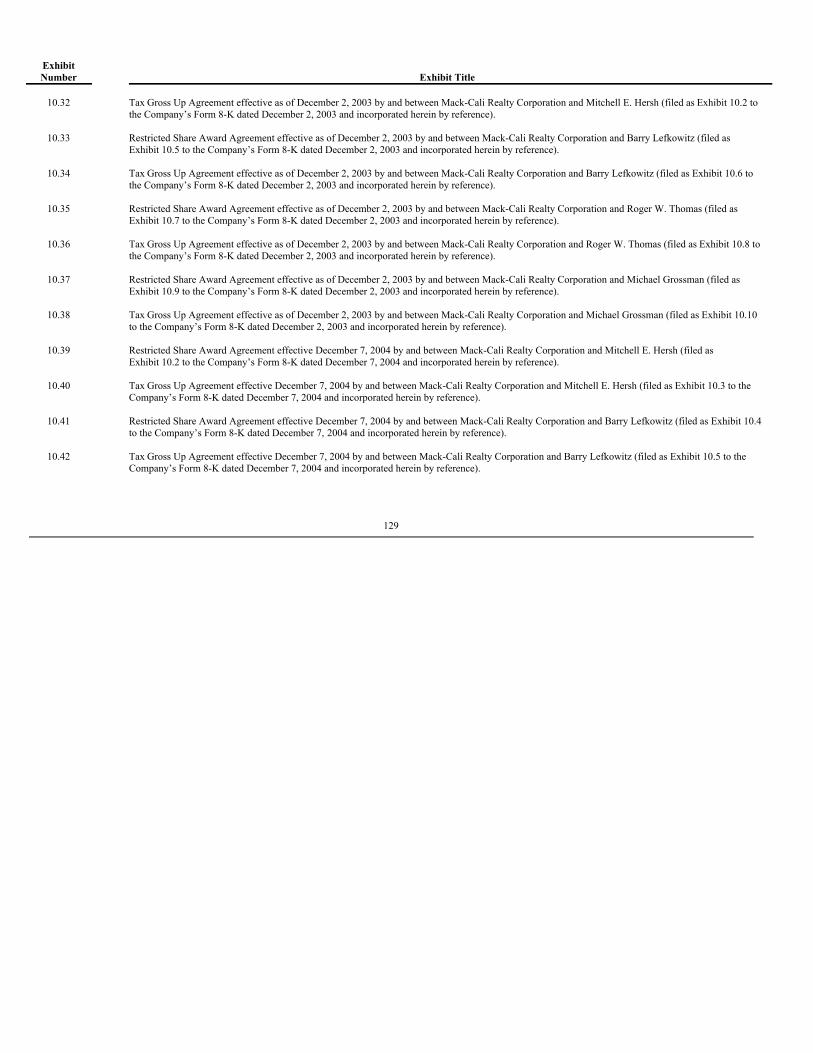
ExhibitNumber Exhibit Title
10.32
Tax Gross Up Agreement effective as of December 2, 2003 by and between Mack-Cali Realty Corporation and Mitchell E. Hersh (filed as Exhibit 10.2 tothe Company’s Form 8-K dated December 2, 2003 and incorporated herein by reference).
10.33
Restricted Share Award Agreement effective as of December 2, 2003 by and between Mack-Cali Realty Corporation and Barry Lefkowitz (filed asExhibit 10.5 to the Company’s Form 8-K dated December 2, 2003 and incorporated herein by reference).
10.34
Tax Gross Up Agreement effective as of December 2, 2003 by and between Mack-Cali Realty Corporation and Barry Lefkowitz (filed as Exhibit 10.6 tothe Company’s Form 8-K dated December 2, 2003 and incorporated herein by reference).
10.35
Restricted Share Award Agreement effective as of December 2, 2003 by and between Mack-Cali Realty Corporation and Roger W. Thomas (filed asExhibit 10.7 to the Company’s Form 8-K dated December 2, 2003 and incorporated herein by reference).
10.36
Tax Gross Up Agreement effective as of December 2, 2003 by and between Mack-Cali Realty Corporation and Roger W. Thomas (filed as Exhibit 10.8 tothe Company’s Form 8-K dated December 2, 2003 and incorporated herein by reference).
10.37
Restricted Share Award Agreement effective as of December 2, 2003 by and between Mack-Cali Realty Corporation and Michael Grossman (filed asExhibit 10.9 to the Company’s Form 8-K dated December 2, 2003 and incorporated herein by reference).
10.38
Tax Gross Up Agreement effective as of December 2, 2003 by and between Mack-Cali Realty Corporation and Michael Grossman (filed as Exhibit 10.10to the Company’s Form 8-K dated December 2, 2003 and incorporated herein by reference).
10.39
Restricted Share Award Agreement effective December 7, 2004 by and between Mack-Cali Realty Corporation and Mitchell E. Hersh (filed asExhibit 10.2 to the Company’s Form 8-K dated December 7, 2004 and incorporated herein by reference).
10.40
Tax Gross Up Agreement effective December 7, 2004 by and between Mack-Cali Realty Corporation and Mitchell E. Hersh (filed as Exhibit 10.3 to theCompany’s Form 8-K dated December 7, 2004 and incorporated herein by reference).
10.41
Restricted Share Award Agreement effective December 7, 2004 by and between Mack-Cali Realty Corporation and Barry Lefkowitz (filed as Exhibit 10.4to the Company’s Form 8-K dated December 7, 2004 and incorporated herein by reference).
10.42
Tax Gross Up Agreement effective December 7, 2004 by and between Mack-Cali Realty Corporation and Barry Lefkowitz (filed as Exhibit 10.5 to theCompany’s Form 8-K dated December 7, 2004 and incorporated herein by reference).
129
ExhibitNumber Exhibit Title
10.43
Restricted Share Award Agreement effective December 7, 2004 by and between Mack-Cali Realty Corporation and Roger W. Thomas (filed asExhibit 10.6 to the Company’s Form 8-K dated December 7, 2004 and incorporated herein by reference).
10.44
Tax Gross Up Agreement effective December 7, 2004 by and between Mack-Cali Realty Corporation and Roger W. Thomas (filed as Exhibit 10.7 to theCompany’s Form 8-K dated December 7, 2004 and incorporated herein by reference).
10.45
Restricted Share Award Agreement effective December 7, 2004 by and between Mack-Cali Realty Corporation and Michael A. Grossman (filed asExhibit 10.8 to the Company’s Form 8-K dated December 7, 2004 and incorporated herein by reference).
10.46
Tax Gross Up Agreement effective December 7, 2004 by and between Mack-Cali Realty Corporation and Michael A. Grossman (filed as Exhibit 10.9 tothe Company’s Form 8-K dated December 7, 2004 and incorporated herein by reference).
10.47
Restricted Share Award Agreement effective December 6, 2005 by and between Mack-Cali Realty Corporation and Mitchell E. Hersh (filed asExhibit 10.2 to the Company’s Form 8-K dated December 6, 2005 and incorporated herein by reference).
10.48
Tax Gross Up Agreement effective December 6, 2005 by and between Mack-Cali Realty Corporation and Mitchell E. Hersh (filed as Exhibit 10.3 to theCompany’s Form 8-K dated December 6, 2005 and incorporated herein by reference).
10.49
Restricted Share Award Agreement effective December 6, 2005 by and between Mack-Cali Realty Corporation and Barry Lefkowitz (filed as Exhibit 10.4to the Company’s Form 8-K dated December 6, 2005 and incorporated herein by reference).
10.50
Tax Gross Up Agreement effective December 6, 2005 by and between Mack-Cali Realty Corporation and Barry Lefkowitz (filed as Exhibit 10.5 to theCompany’s Form 8-K dated December 6, 2005 and incorporated herein by reference).
10.51
Restricted Share Award Agreement effective December 6, 2005 by and between Mack-Cali Realty Corporation and Roger W. Thomas (filed asExhibit 10.6 to the Company’s Form 8-K dated December 6, 2005 and incorporated herein by reference).
10.52
Tax Gross Up Agreement effective December 6, 2005 by and between Mack-Cali Realty Corporation and Roger W. Thomas (filed as Exhibit 10.7 to theCompany’s Form 8-K dated December 6, 2005 and incorporated herein by reference).
10.53
Restricted Share Award Agreement effective December 6, 2005 by and between Mack-Cali Realty Corporation and Michael A. Grossman (filed asExhibit 10.8 to the Company’s Form 8-K dated December 6, 2005 and incorporated herein by reference).
130
ExhibitNumber Exhibit Title
10.54
Tax Gross Up Agreement effective December 6, 2005 by and between Mack-Cali Realty Corporation and Michael A. Grossman (filed as Exhibit 10.9 tothe Company’s Form 8-K dated December 6, 2005 and incorporated herein by reference).
10.55
Restricted Share Award Agreement by and between Mack-Cali Realty Corporation and Mark Yeager (filed as Exhibit 10.16 to the Company’s Form 8-Kdated May 9, 2006 and incorporated herein by reference).
10.56
Restricted Share Award Agreement effective December 5, 2006 by and between Mack-Cali Realty Corporation and Mitchell E. Hersh (filed as Exhibit10.1 to the Company’s Form 8-K dated December 5, 2006 and incorporated herein by reference).
10.57
Tax Gross Up Agreement effective December 5, 2006 by and between Mack-Cali Realty Corporation and Mitchell E. Hersh (filed as Exhibit 10.2 to theCompany’s Form 8-K dated December 5, 2006 and incorporated herein by reference).
10.58
Restricted Share Award Agreement effective December 5, 2006 by and between Mack-Cali Realty Corporation and Mitchell E. Hersh (filed as Exhibit10.3 to the Company’s Form 8-K dated December 5, 2006 and incorporated herein by reference).
10.59
Tax Gross Up Agreement effective December 5, 2006 by and between Mack-Cali Realty Corporation and Mitchell E. Hersh (filed as Exhibit 10.4 to theCompany’s Form 8-K dated December 5, 2006 and incorporated herein by reference).
10.60
Restricted Share Award Agreement effective December 5, 2006 by and between Mack-Cali Realty Corporation and Barry Lefkowitz (filed as Exhibit 10.5to the Company’s Form 8-K dated December 5, 2006 and incorporated herein by reference).
10.61
Tax Gross Up Agreement effective December 5, 2006 by and between Mack-Cali Realty Corporation and Barry Lefkowitz (filed as Exhibit 10.6 to theCompany’s Form 8-K dated December 5, 2006 and incorporated herein by reference).
10.62
Restricted Share Award Agreement effective December 5, 2006 by and between Mack-Cali Realty Corporation and Barry Lefkowitz (filed as Exhibit 10.7to the Company’s Form 8-K dated December 5, 2006 and incorporated herein by reference).
10.63
Tax Gross Up Agreement effective December 5, 2006 by and between Mack-Cali Realty Corporation and Barry Lefkowitz (filed as Exhibit 10.8 to theCompany’s Form 8-K dated December 5, 2006 and incorporated herein by reference).
10.64
Restricted Share Award Agreement effective December 5, 2006 by and between Mack-Cali Realty Corporation and Roger W. Thomas (filed as Exhibit10.9 to the Company’s Form 8-K dated December 5, 2006 and incorporated herein by reference).
10.65
Tax Gross Up Agreement effective December 5, 2006 by and between Mack-Cali Realty Corporation and Roger W. Thomas (filed as Exhibit 10.10 to theCompany’s Form 8-K dated December 5, 2006 and incorporated herein by reference).
131
ExhibitNumber Exhibit Title
10.66
Restricted Share Award Agreement effective December 5, 2006 by and between Mack-Cali Realty Corporation and Roger W. Thomas (filed as Exhibit10.11 to the Company’s Form 8-K dated December 5, 2006 and incorporated herein by reference).
10.67
Tax Gross Up Agreement effective December 5, 2006 by and between Mack-Cali Realty Corporation and Roger W. Thomas (filed as Exhibit 10.12 to theCompany’s Form 8-K dated December 5, 2006 and incorporated herein by reference).
10.68
Restricted Share Award Agreement effective December 5, 2006 by and between Mack-Cali Realty Corporation and Michael A. Grossman (filed as Exhibit10.13 to the Company’s Form 8-K dated December 5, 2006 and incorporated herein by reference).
10.69
Tax Gross Up Agreement effective December 5, 2006 by and between Mack-Cali Realty Corporation and Michael A. Grossman (filed as Exhibit 10.14 tothe Company’s Form 8-K dated December 5, 2006 and incorporated herein by reference).
10.70
Restricted Share Award Agreement effective December 5, 2006 by and between Mack-Cali Realty Corporation and Michael A. Grossman (filed as Exhibit10.15 to the Company’s Form 8-K dated December 5, 2006 and incorporated herein by reference).
10.71
Tax Gross Up Agreement effective December 5, 2006 by and between Mack-Cali Realty Corporation and Michael A. Grossman (filed as Exhibit 10.16 tothe Company’s Form 8-K dated December 5, 2006 and incorporated herein by reference).
10.72
Restricted Share Award Agreement effective December 5, 2006 by and between Mack-Cali Realty Corporation and Mark Yeager (filed as Exhibit 10.17 tothe Company’s Form 8-K dated December 5, 2006 and incorporated herein by reference).
10.73
Tax Gross Up Agreement effective December 5, 2006 by and between Mack-Cali Realty Corporation and Mark Yeager (filed as Exhibit 10.18 to theCompany’s Form 8-K dated December 5, 2006 and incorporated herein by reference).
10.74
Restricted Share Award Agreement effective December 5, 2006 by and between Mack-Cali Realty Corporation and Mark Yeager (filed as Exhibit 10.19 tothe Company’s Form 8-K dated December 5, 2006 and incorporated herein by reference).
10.75
Tax Gross Up Agreement effective December 5, 2006 by and between Mack-Cali Realty Corporation and Mark Yeager (filed as Exhibit 10.20 to theCompany’s Form 8-K dated December 5, 2006 and incorporated herein by reference).
10.76
Form of Multi-Year Restricted Share Award Agreement (filed as Exhibit 10.1 to the Company’s Form 8-K dated September 12, 2007 and incorporatedherein by reference).
10.77 Form of Tax Gross-Up Agreement (filed as Exhibit 10.2 to the Company’s Form 8-K dated September 12, 2007 and incorporated herein by reference).
10.78
Form of Restricted Share Award Agreement effective December 4, 2007 by and between Mack-Cali Realty Corporation and each of Mitchell E. Hersh,Barry Lefkowitz, Michael Grossman, Mark Yeager and Roger W. Thomas (filed as Exhibit 10.1 to the Company’s Form 8-K dated December 4, 2007 andincorporated herein by reference).
132
ExhibitNumber Exhibit Title
10.79
Form of Tax Gross-Up Agreement effective December 4, 2007 by and between Mack-Cali Realty Corporation and each of Mitchell E. Hersh, BarryLefkowitz, Michael Grossman, Mark Yeager and Roger W. Thomas (filed as Exhibit 10.2 to the Company’s Form 8-K dated December 4, 2007 andincorporated herein by reference).
10.80
Form of Restricted Share Award Agreement effective December 4, 2007 by and between Mack-Cali Realty Corporation and each of William L. Mack,Martin S. Berger, Alan S. Bernikow, John R. Cali, Kenneth M. Duberstein, Nathan Gantcher, David S. Mack, Alan G. Philibosian, Dr. Irvin D. Reid,Vincent Tese and Roy J. Zuckerberg (filed as Exhibit 10.3 to the Company's Form 8-K dated December 4, 2007 and incorporated herein by reference).
10.81
Form of Restricted Share Award Agreement effective December 9, 2008 by and between Mack-Cali Realty Corporation and each of Mitchell E. Hersh,Barry Lefkowitz, Michael Grossman, Mark Yeager and Roger W. Thomas (filed as Exhibit 10.1 to the Company's Form 8-K dated December 9, 2008 andincorporated herein by reference).
10.82
Form of Restricted Share Award Agreement effective December 9, 2008 by and between Mack-Cali Realty Corporation and each of William L. Mack,Alan S. Bernikow, John R. Cali, Kenneth M. Duberstein, Nathan Gantcher, David S. Mack, Alan G. Philibosian, Dr. Irvin D. Reid, Vincent Tese, RobertF. Weinberg and Roy J. Zuckerberg (filed as Exhibit 10.2 to the Company's Form 8-K dated December 9, 2008 and incorporated herein by reference).
10.83
Form of Restricted Share Award Agreement effective December 8, 2009 by and between Mack-Cali Realty Corporation and each of Mitchell E. Hersh,Barry Lefkowitz, Michael Grossman, Mark Yeager and Roger W. Thomas (filed as Exhibit 10.1 to the Company's Form 8-K dated December 8, 2009 andincorporated herein by reference).
10.84
Form of Restricted Share Award Agreement effective December 8, 2009 by and between Mack-Cali Realty Corporation and each of William L. Mack,Martin S. Berger, Alan S. Bernikow, John R. Cali, Kenneth M. Duberstein, Nathan Gantcher, David S. Mack, Alan G. Philibosian, Dr. Irvin D. Reid,Vincent Tese and Roy J. Zuckerberg (filed as Exhibit 10.2 to the Company's Form 8-K dated December 8, 2009 and incorporated herein by reference).
10.85
Amended and Restated Revolving Credit Agreement dated as of September 27, 2002, among Mack-Cali Realty, L.P. and JPMorgan Chase Bank, FleetNational Bank and Other Lenders Which May Become Parties Thereto with JPMorgan Chase Bank, as administrative agent, swing lender and frontingbank, Fleet National Bank and Commerzbank AG, New York and Grand Cayman branches as syndication agents, Bank of America, N.A. and Wells FargoBank, National Association, as documentation agents, and J.P. Morgan Securities Inc. and Fleet Securities, Inc, as arrangers (filed as Exhibit 10.1 to theCompany’s Form 8-K dated September 27, 2002 and incorporated herein by reference).
10.86
Second Amended and Restated Revolving Credit Agreement among Mack-Cali Realty, L.P., JPMorgan Chase Bank, N.A., Bank of America, N.A., andother lending institutions that are or may become a party to the Second Amended and Restated Revolving Credit Agreement dated as of November 23,2004 (filed as Exhibit 10.1 to the Company’s Form 8-K dated November 23, 2004 and incorporated herein by reference).
10.87
Extension and Modification Agreement dated as of September 16, 2005 by and among Mack-Cali Realty, L.P., JPMorgan Chase Bank, N.A., asadministrative agent, and the several Lenders party thereto (filed as Exhibit 10.1 to the Company’s Form 8-K dated September 16, 2005 and incorporatedherein by reference).
133
ExhibitNumber Exhibit Title
10.88
Second Modification Agreement dated as of July 14, 2006 by and among Mack-Cali Realty, L.P., JPMorgan Chase Bank, N.A., as administrative agent,and the several Lenders party thereto (filed as Exhibit 10.1 to the Company’s Form 8-K dated July 14, 2006 and incorporated herein by reference).
10.89
Extension and Third Modification Agreement dated as of June 22, 2007 by and among Mack-Cali Realty, L.P., JPMorgan Chase Bank, N.A., asadministrative agent, and the several Lenders party thereto (filed as Exhibit 10.1 to the Company’s Form 8-K dated June 22, 2007 and incorporated hereinby reference).
10.90
Fourth Modification Agreement dated as of September 21, 2007 by and among Mack Cali Realty, L.P., JPMorgan Chase Bank, N.A., as administrativeagent and the several Lenders party thereto (filed as Exhibit 10.1 to the Company’s Form 8-K dated September 21, 2007 and incorporated herein byreference).
10.91
Amended and Restated Master Loan Agreement dated as of November 12, 2004 among Mack-Cali Realty, L.P., and Affiliates of Mack-Cali RealtyCorporation and Mack-Cali Realty, L.P., as Borrowers, Mack-Cali Realty Corporation and Mack-Cali Realty L.P., as Guarantors and The PrudentialInsurance Company of America, as Lender (filed as Exhibit 10.1 to the Company’s Form 8-K dated November 12, 2004 and incorporated herein byreference).
10.92
Contribution and Exchange Agreement among The MK Contributors, The MK Entities, The Patriot Contributors, The Patriot Entities, Patriot AmericanManagement and Leasing Corp., Cali Realty, L.P. and Cali Realty Corporation, dated September 18, 1997 (filed as Exhibit 10.98 to the Company’sForm 8-K dated September 19, 1997 and incorporated herein by reference).
10.93
First Amendment to Contribution and Exchange Agreement, dated as of December 11, 1997, by and among the Company and the Mack Group (filed asExhibit 10.99 to the Company’s Form 8-K dated December 11, 1997 and incorporated herein by reference).
10.94
Employee Stock Option Plan of Mack-Cali Realty Corporation (filed as Exhibit 10.1 to the Company’s Post-Effective Amendment No. 1 to Form S-8,Registration No. 333-44443, and incorporated herein by reference).
10.95
Director Stock Option Plan of Mack-Cali Realty Corporation (filed as Exhibit 10.2 to the Company’s Post-Effective Amendment No. 1 to Form S-8,Registration No. 333-44443, and incorporated herein by reference).
10.96
2000 Employee Stock Option Plan (filed as Exhibit 10.1 to the Company’s Registration Statement on Form S-8, Registration No. 333-52478, andincorporated herein by reference), as amended by the First Amendment to the 2000 Employee Stock Option Plan (filed as Exhibit 10.17 to the Company’sForm 10-Q dated June 30, 2002 and incorporated herein by reference).
10.97
Amended and Restated 2000 Director Stock Option Plan (filed as Exhibit 10.2 to the Company’s Post-Effective Amendment No. 1 to RegistrationStatement on Form S-8, Registration No. 333-100244, and incorporated herein by reference).
10.98
Mack-Cali Realty Corporation 2004 Incentive Stock Plan (filed as Exhibit 10.1 to the Company’s Registration Statement on Form S-8, RegistrationNo. 333-116437, and incorporated herein by reference).
10.99
Deferred Compensation Plan for Directors (filed as Exhibit 10.1 to the Company’s Registration Statement on Form S-8, Registration No. 333-80081, andincorporated herein by reference).
134
ExhibitNumber Exhibit Title
10.100
Amended and Restated Mack-Cali Realty Corporation Deferred Compensation Plan for Directors (filed as Exhibit 10.3 to the Company's Form 8-K datedDecember 9, 2008 and incorporated herein by reference).
10.101
Form of Indemnification Agreement by and between Mack-Cali Realty Corporation and each of William L. Mack, John J. Cali, Mitchell E. Hersh, John R.Cali, David S. Mack, Martin S. Berger, Alan S. Bernikow, Kenneth M. Duberstein, Martin D. Gruss, Nathan Gantcher, Vincent Tese, Roy J. Zuckerberg,Alan G. Philibosian, Irvin D. Reid, Robert F. Weinberg, Barry Lefkowitz, Roger W. Thomas, Michael A. Grossman, Mark Yeager, Anthony Krug, DeanCingolani, Anthony DeCaro Jr., Mark Durno, William Fitzpatrick, John Kropke, Nicholas Mitarotonda, Jr., Michael Nevins, Virginia Sobol, Albert Spring,Daniel Wagner, Deborah Franklin, John Marazzo, Christopher DeLorenzo, Jeffrey Warner, Diane Chayes and James Corrigan (filed as Exhibit 10.28 to theCompany’s Form 10-Q dated September 30, 2002 and incorporated herein by reference).
10.102
Indemnification Agreement dated October 22, 2002 by and between Mack-Cali Realty Corporation and John Crandall (filed as Exhibit 10.29 to theCompany’s Form 10-Q dated September 30, 2002 and incorporated herein by reference).
10.103
Second Amendment to Contribution and Exchange Agreement, dated as of June 27, 2000, between RMC Development Company, LLC f/k/a Robert MartinCompany, LLC, Robert Martin Eastview North Company, L.P., the Company and the Operating Partnership (filed as Exhibit 10.44 to the Company’sForm 10-K dated December 31, 2002 and incorporated herein by reference).
10.104
Limited Partnership Agreement of Meadowlands Mills/Mack-Cali Limited Partnership by and between Meadowlands Mills Limited Partnership, Mack-Cali Meadowlands Entertainment L.L.C. and Mack-Cali Meadowlands Special L.L.C. dated November 25, 2003 (filed as Exhibit 10.1 to the Company’sForm 8-K dated December 3, 2003 and incorporated herein by reference).
10.105
Redevelopment Agreement by and between the New Jersey Sports and Exposition Authority and Meadowlands Mills/Mack-Cali Limited Partnership datedDecember 3, 2003 (filed as Exhibit 10.2 to the Company’s Form 8-K dated December 3, 2003 and incorporated herein by reference).
10.106
First Amendment to Redevelopment Agreement by and between the New Jersey Sports and Exposition Authority and Meadowlands Mills/Mack-CaliLimited Partnership dated October 5, 2004 (filed as Exhibit 10.54 to the Company’s Form 10-Q dated September 30, 2004 and incorporated herein byreference).
10.107
Letter Agreement by and between Mack-Cali Realty Corporation and The Mills Corporation dated October 5, 2004 (filed as Exhibit 10.55 to theCompany’s Form 10-Q dated September 30, 2004 and incorporated herein by reference).
10.108
First Amendment to Limited Partnership Agreement of Meadowlands Mills/Mack-Cali Limited Partnership by and between Meadowlands Mills LimitedPartnership, Mack-Cali Meadowlands Entertainment L.L.C. and Mack-Cali Meadowlands Special L.L.C. dated as of June 30, 2005 (filed as Exhibit 10.66to the Company’s Form 10-Q dated June 30, 2005 and incorporated herein by reference).
135
ExhibitNumber Exhibit Title
10.109
Mack-Cali Rights, Obligations and Option Agreement by and between Meadowlands Developer Limited Partnership, Meadowlands Limited Partnership,Meadowlands Developer Holding Corp., Meadowlands Mack-Cali GP, L.L.C., Mack-Cali Meadowlands Special, L.L.C., Baseball MeadowlandsMills/Mack-Cali Limited Partnership, A-B Office Meadowlands Mack-Cali Limited Partnership, C-D Office Meadowlands Mack-Cali LimitedPartnership, Hotel Meadowlands Mack-Cali Limited Partnership and ERC Meadowlands Mills/Mack-Cali Limited Partnership dated November 22, 2006(filed as Exhibit 10.92 to the Company’s Form 10-K dated December 31, 2006 and incorporated herein by reference).
10.110
Redemption Agreement by and among Meadowlands Developer Limited Partnership, Meadowlands Developer Holding Corp., Mack-Cali Meadowlandsentertainment L.L.C., Mack-Cali Meadowlands Special L.L.C., and Meadowlands Limited Partnership dated November 22, 2006 (filed as Exhibit 10.93 tothe Company’s Form 10-K dated December 31, 2006 and incorporated herein by reference).
10.111
Contribution and Exchange Agreement by and between Mack-Cali Realty, L.P. and Tenth Springhill Lake Associates L.L.L.P., Eleventh Springhill LakeAssociates L.L.L.P., Twelfth Springhill Lake Associates L.L.L.P., Fourteenth Springhill Lake Associates L.L.L.P., each a Maryland limited liabilitylimited partnership, Greenbelt Associates, a Maryland general partnership, and Sixteenth Springhill Lake Associates L.L.L.P., a Maryland limited liabilitylimited partnership, and certain other natural persons, dated as of November 21, 2005 (filed as Exhibit 10.69 to the Company’s Form 10-K dated December31, 2005 and incorporated herein by reference).
10.112
Membership Interest Purchase and Contribution Agreement by and among Mr. Stanley C. Gale, SCG Holding Corp., Mack-Cali Realty Acquisition Corp.and Mack-Cali Realty, L.P. dated as of March 7, 2006 (filed as Exhibit 10.1 to the Company’s Form 8-K dated March 7, 2006 and incorporated herein byreference).
10.113
Amendment No. 1 to Membership Interest Purchase and Contribution Agreement dated as of March 31, 2006 (filed as Exhibit 10.1 to the Company’s Form8-K dated March 28, 2006 and incorporated herein by reference).
10.114
Amendment No. 2 to Membership Interest Purchase and Contribution Agreement dated as of May 9, 2006 (filed as Exhibit 10.1 to the Company’s Form 8-K dated May 9, 2006 and incorporated herein by reference).
10.115
Amendment No. 8 to Membership Interest Purchase and Contribution Agreement by and among Mr. Stanley C. Gale, SCG Holding Corp., Mack-CaliRealty Acquisition Corp. and Mack-Cali Realty, L.P. dated as of May 23, 2007 (filed as Exhibit 10.1 to the Company’s Form 8-K dated May 23, 2007 andincorporated herein by reference).
10.116
Contribution and Sale Agreement by and among Gale SLG NJ LLC, a Delaware limited liability company, Gale SLG NJ MEZZ LLC, a Delaware limitedliability company, and Gale SLG RIDGEFIELD MEZZ LLC, a Delaware limited liability company and Mack-Cali Ventures L.L.C. dated as of March 7,2006 (filed as Exhibit 10.2 to the Company’s Form 8-K dated March 7, 2006 and incorporated herein by reference).
136
ExhibitNumber Exhibit Title
10.117
First Amendment to Contribution and Sale Agreement by and among GALE SLG NJ LLC, a Delaware limited liability company, GALE SLG NJ MEZZLLC, a Delaware limited liability company, and GALE SLG RIDGEFIELD MEZZ LLC, a Delaware limited liability company, and Mack-Cali VenturesL.L.C., a Delaware limited liability company, dated as of May 9, 2006 (filed as Exhibit 10.4 to the Company’s Form 8-K dated May 9, 2006 andincorporated herein by reference).
10.118
Non-Portfolio Property Interest Contribution Agreement by and among Mr. Stanley C. Gale, Mr. Mark Yeager, GCF II Investor LLC, The GaleInvestments Company, LLC, Gale & Wentworth Vreeland, LLC, Gale Urban Solutions LLC, MSGW-ONE Campus Investors, LLC, Mack-Cali RealtyAcquisition Corp. and Mack-Cali Realty, L.P. dated as of May 9, 2006 (filed as Exhibit 10.2 to the Company’s Form 8-K dated May 9, 2006 andincorporated herein by reference).
10.119
Loan Agreement by and among the entities set forth on Exhibit A, collectively, as Borrowers, and Gramercy Warehouse Funding I LLC, as Lender, datedMay 9, 2006 (filed as Exhibit 10.5 to the Company’s Form 8-K dated May 9, 2006 and incorporated herein by reference).
10.120
Promissory Note of One Grande SPE LLC, 1280 Wall SPE LLC, 10 Sylvan SPE LLC, 5 Independence SPE LLC, 1 Independence SPE LLC, and 3 BeckerSPE LLC, as Borrowers, in favor of Gramercy Warehouse Funding I, LLC, as Lender, in the principal amount of $90,286,551 dated May 9, 2006 (filed asExhibit 10.6 to the Company’s Form 8-K dated May 9, 2006 and incorporated herein by reference).
10.121
Mortgage, Security Agreement and Fixture Filing by and between 4 Becker SPE LLC, as Borrower, and Wachovia Bank, National Association, as Lender,dated May 9, 2006 (filed as Exhibit 10.7 to the Company’s Form 8-K dated May 9, 2006 and incorporated herein by reference).
10.122
Promissory Note of 4 Becker SPE LLC, as Borrower, in favor of Wachovia Bank, National Association, as Lender, in the principal amount of $43,000,000dated May 9, 2006 (filed as Exhibit 10.8 to the Company’s Form 8-K dated May 9, 2006 and incorporated herein by reference).
10.123
Mortgage, Security Agreement and Fixture Filing by and between 210 Clay SPE LLC, as Borrower, and Wachovia Bank, National Association, as Lender,dated May 9, 2006 (filed as Exhibit 10.9 to the Company’s Form 8-K dated May 9, 2006 and incorporated herein by reference).
10.124
Promissory Note of 210 Clay SPE LLC, as Borrower, in favor of Wachovia Bank, National Association, as Lender, in the principal amount of $16,000,000dated May 9, 2006 (filed as Exhibit 10.10 to the Company’s Form 8-K dated May 9, 2006 and incorporated herein by reference).
10.125
Mortgage, Security Agreement and Fixture Filing by and between 5 Becker SPE LLC, as Borrower, and Wachovia Bank, National Association, as Lender,dated May 9, 2006 (filed as Exhibit 10.11 to the Company’s Form 8-K dated May 9, 2006 and incorporated herein by reference).
10.126
Promissory Note of 5 Becker SPE LLC, as Borrower, in favor of Wachovia Bank, National Association, as Lender, in the principal amount of $15,500,000dated May 9, 2006 (filed as Exhibit 10.12 to the Company’s Form 8-K dated May 9, 2006 and incorporated herein by reference).
10.127
Mortgage, Security Agreement and Fixture Filing by and between 51 CHUBB SPE LLC, as Borrower, and Wachovia Bank, National Association, asLender, dated May 9, 2006 (filed as Exhibit 10.13 to the Company’s Form 8-K dated May 9, 2006 and incorporated herein by reference).
137
ExhibitNumber Exhibit Title
10.128
Promissory Note of 51 CHUBB SPE LLC, as Borrower, in favor of Wachovia Bank, National Association, as Lender, in the principal amount of$4,500,000 dated May 9, 2006 (filed as Exhibit 10.14 to the Company’s Form 8-K dated May 9, 2006 and incorporated herein by reference).
10.129
Form of Amended and Restated Limited Liability Company Agreement of Mack-Green-Gale LLC dated , 2006 (filed as Exhibit 10.3 to theCompany’s Form 8-K dated March 7, 2006 and incorporated herein by reference).
10.130
Form of Limited Liability Company Operating Agreement (filed as Exhibit 10.3 to the Company’s Form 8-K dated May 9, 2006 and incorporated herein byreference).
10.131
Agreement of Sale and Purchase dated August 9, 2006 by and between Mack-Cali Realty, L.P. and Westcore Properties AC, LLC (filed as Exhibit 10.91 tothe Company’s Form 10-Q dated September 30, 2006 and incorporated herein by reference).
10.132
First Amendment to Agreement of Sale and Purchase dated September 6, 2006 by and between Mack-Cali Realty, L.P. and Westcore Properties AC, LLC(filed as Exhibit 10.92 to the Company’s Form 10-Q dated September 30, 2006 and incorporated herein by reference).
10.133
Second Amendment to Agreement of Sale and Purchase dated September 15, 2006 by and between Mack-Cali Realty, L.P. and Westcore Properties AC,LLC (filed as Exhibit 10.93 to the Company’s Form 10-Q dated September 30, 2006 and incorporated herein by reference).
10.134
Agreement of Sale and Purchase dated September 25, 2006 by and between Phelan Realty Associates L.P., 795 Folsom Realty Associates L.P. andWestcore Properties AC, LLC (filed as Exhibit 10.94 to the Company’s Form 10-Q dated September 30, 2006 and incorporated herein by reference).
10.135
Membership Interest Purchase and Contribution Agreement dated as of December 28, 2006, by and among NKFGMS Owners, LLC, The GaleConstruction Services Company, L.L.C., NKFFM Limited Liability Company, Scott Panzer, Ian Marlow, Newmark & Company Real Estate, Inc. d/b/aNewmark Knight Frank, and Mack-Cali Realty, L.P (filed as Exhibit 10.117 to the Company’s Form 10-K dated December 31, 2006 and incorporatedherein by reference).
10.136
Operating Agreement of NKFGMS Owners, LLC (filed as Exhibit 10.118 to the Company’s Form 10-K dated December 31, 2006 and incorporated hereinby reference).
10.137
Loans, Sale and Services Agreement dated December 28, 2006 by and between Newmark & Company Real Estate, Inc. d/b/a Newmark Knight Frank,Mack-Cali Realty, L.P., and Newmark Knight Frank Global Management Services, LLC (filed as Exhibit 10.119 to the Company’s Form 10-K datedDecember 31, 2006 and incorporated herein by reference).
10.138
Term Loan Agreement among Mack-Cali Realty, L.P. and JPMorgan Chase Bank, N.A. as Administrative Agent, J.P. Morgan Securities Inc. as Arranger,and other lender which may become parties to this Agreement dated November 29, 2006 (filed as Exhibit 10.120 to the Company’s Form 10-K datedDecember 31, 2006 and incorporated herein by reference).
138
ExhibitNumber Exhibit Title
10.139
Agreement of Purchase and Sale among SLG Broad Street A LLC and SLG Broad Street C LLC, as Sellers, and M-C Broad 125 A L.L.C. and M-C Broad125 C L.L.C., as Purchasers, dated as of March 15, 2007 (filed as Exhibit 10.121 to the Company’s Form 10-Q dated March 31, 2007 and incorporatedherein by reference).
10.140
Agreement of Purchase and Sale among 500 West Putnam L.L.C., as Seller, and SLG 500 West Putnam LLC, as Purchaser, dated as of March 15, 2007(filed as Exhibit 10.122 to the Company’s Form 10-Q dated March 31, 2007 and incorporated herein by reference).
10.141
Letter Agreement by and between Mack-Cali Realty, L.P., Mack-Cali Realty Acquisition Corp., Mack-Cali Belmar Realty, LLC, M-C Belmar, LLC, Mr.Stanley C. Gale, SCG Holding Corp., Mr. Mark Yeager, GCF II Investor LLC, The Gale Investments Company, LLC, Gale & Wentworth Vreeland, LLC,Gale Urban Solutions LLC, MSGW-ONE Campus Investors, LLC and Gale/Yeager Investments LLC dated October 31, 2007 (filed as Exhibit 10.128 tothe Company’s Form 10-Q dated September 30, 2007 and incorporated herein by reference).
10.142
Mortgage and Security Agreement and Financing Statement dated October 28, 2008 between M-C Plaza V L.L.C., Cal-Harbor V Urban RenewalAssociates, L.P., Cal-Harbor V Leasing Associates L.L.C., as Mortgagors and The Northwestern Mutual Life Insurance Company and New York LifeInsurance Company as Mortgagees (filed as Exhibit 10.131 to the Company’s Form 10-Q dated September 30, 2008 and incorporated herein by reference).
10.143
Promissory Note of M-C Plaza V L.L.C., Cal-Harbor V Urban Renewal Associates, L.P., Cal-Harbor V Leasing Associates L.L.C., as Borrowers, in favorof The Northwestern Mutual Life Insurance Company, as Lender, in the principal amount of $120,000,000, dated October 28, 2008. (filed as Exhibit10.132 to the Company’s Form 10-Q dated September 30, 2008 and incorporated herein by reference).
10.144
Promissory Note of M-C Plaza V L.L.C., Cal-Harbor V Urban Renewal Associates, L.P., Cal-Harbor V Leasing Associates L.L.C., as Borrowers, in favorof New York Life Insurance Company, as Lender, in the principal amount of $120,000,000, dated October 28, 2008 (filed as Exhibit 10.133 to theCompany’s Form 10-Q dated September 30, 2008 and incorporated herein by reference).
10.145
Guarantee of Recourse Obligations of Mack-Cali Realty, L.P. in favor of The Northwestern Mutual Life Insurance Company and New York Life InsuranceCompany dated October 28, 2008 (filed as Exhibit 10.134 to the Company’s Form 10-Q dated September 30, 2008 and incorporated herein by reference).
10.146
Amended and Restated Loan Agreement by and among One Grande SPE LLC, 1280 Wall SPE LLC, 10 Sylvan SPE LLC, 5 Independence SPE LLC, 1Independence SPE LLC, and 3 Becker SPE LLC, collectively, as Borrowers and Gramercy Warehouse Funding I LLC, as Lender, dated April 29, 2009(filed as Exhibit 10.144 to the Company’s Form 10-Q dated March 31, 2009 and incorporated herein by reference).
10.147
Amended and Restated Promissory Note of One Grande SPE LLC, 1280 Wall SPE LLC, 10 Sylvan SPE LLC, 5 Independence SPE LLC, 1 IndependenceSPE LLC, and 3 Becker SPE LLC, as Borrowers, in favor of Gramercy Warehouse Funding I, LLC, as Lender, dated April 29, 2009 (filed as Exhibit10.145 to the Company’s Form 10-Q dated March 31, 2009 and incorporated herein by reference).
10.148
Limited Liability Company Membership Interest Purchase and Sale Agreement dated April 29, 2009 by and among Gale SLG NJ LLC, Mack-CaliVentures L.L.C., SLG Gale 55 Corporation LLC and 55 Corporate Partners L.L.C. (filed as Exhibit 10.146 to the Company’s Form 10-Q dated March 31,2009 and incorporated herein by reference).
139
ExhibitNumber Exhibit Title
10.149
Amended and Restated Master Loan Agreement dated as of January 15, 2010 among Mack-Cali Realty, L.P., and Affiliates of Mack-Cali RealtyCorporation and Mack-Cali Realty, L.P., as Borrowers, Mack-Cali Realty Corporation and Mack-Cali Realty L.P., as Guarantors and The PrudentialInsurance Company of America and VPCM, LLC, as Lenders (filed as Exhibit 10.1 to the Company’s Form 8-K dated January 15, 2010 and incorporatedherein by reference).
10.150
Partial Recourse Guaranty of Mack-Cali Realty, L.P. dated as of January 15, 2010 to The Prudential Insurance Company of America and VPCM, LLC(filed as Exhibit 10.2 to the Company’s Form 8-K dated January 15, 2010 and incorporated herein by reference).
10.151
Form of Amended, Restated and Consolidated Mortgage and Security Agreement and Financing Statement dated as of January 15, 2010 by Mack-CaliRealty, L.P., as Borrower, to The Prudential Insurance Company of America and VPCM, LLC, as Mortgagees with respect to each of the collateralproperties (filed as Exhibit 10.3 to the Company’s Form 8-K dated January 15, 2010 and incorporated herein by reference).
10.152
Form of Amended, Restated and Consolidated Promissory Note dated January 15, 2010 of Mack-Cali Realty, L.P. in favor of The Prudential InsuranceCompany of America with respect to each of the collateral properties (filed as Exhibit 10.4 to the Company’s Form 8-K dated January 15, 2010 andincorporated herein by reference).
10.153
Form of Amended, Restated and Consolidated Promissory Note dated January 15, 2010 of Mack-Cali Realty, L.P. in favor of VPCM, LLC with respect toeach of the collateral properties (filed as Exhibit 10.5 to the Company’s Form 8-K dated January 15, 2010 and incorporated herein by reference).
10.154
Form of Recourse Liabilities Guaranty dated January 15, 2010 of Mack-Cali Realty Corporation and Mack-Cali Realty, L.P. to The Prudential InsuranceCompany of America and VPCM, LLC with respect to each of the collateral properties (filed as Exhibit 10.6 to the Company’s Form 8-K dated January 15,2010 and incorporated herein by reference).
10.155
Form of Amended and Restated Irrevocable Cross Collateral Guaranty of Payment and Performance dated January 15, 2010 of the owners of the CollateralProperties to The Prudential Insurance Company of America and VPCM, LLC with respect to each of the collateral properties (filed as Exhibit 10.7 to theCompany’s Form 8-K dated January 15, 2010 and incorporated herein by reference).
12.1* Calculation of Ratios of Earnings to Fixed Charges.
12.2* Calculation of Ratios of Earnings to Combined Fixed Charges and Preferred Security Dividends.
21.1* Subsidiaries of the Company.
23.1* Consent of PricewaterhouseCoopers LLP, independent registered public accounting firm.
23.2* Consent of Cornerstone Accounting Group LLP, independent registered public accounting firm.
140
ExhibitNumber Exhibit Title
31.1* Certification of the Company’s President and Chief Executive Officer, Mitchell E. Hersh, pursuant to Section 302 of the Sarbanes-Oxley Act of 2002.
31.2* Certification of the Company’s Chief Financial Officer, Barry Lefkowitz, pursuant to Section 302 of the Sarbanes-Oxley Act of 2002.
32.1*
Certification of the Company’s President and Chief Executive Officer, Mitchell E. Hersh, and the Company’s Chief Financial Officer, Barry Lefkowitz,pursuant to Section 906 of the Sarbanes-Oxley Act of 2002.
99.1*
Mack-Green-Gale LLC and Subsidiaries Consolidated Balance Sheets at December 31, 2008 and 2007 and Consolidated Statements of Operations,Changes in Members' Capital and Cash Flows for the years ended December 31, 2008 and 2007 and for the period from May 9, 2006 (Commencement ofOperations) through December 31, 2006, including the report of independent registered public accounting firm.
99.2*
Mack-Green-Gale LLC and Subsidiaries Consolidated Balance Sheet at April 28, 2009 and Consolidated Statements of Operations, Changes in Members'Capital and Cash Flows for the period January 1, 2009 through April 28, 2009 (Date of Consolidation).
*filed herewith
141


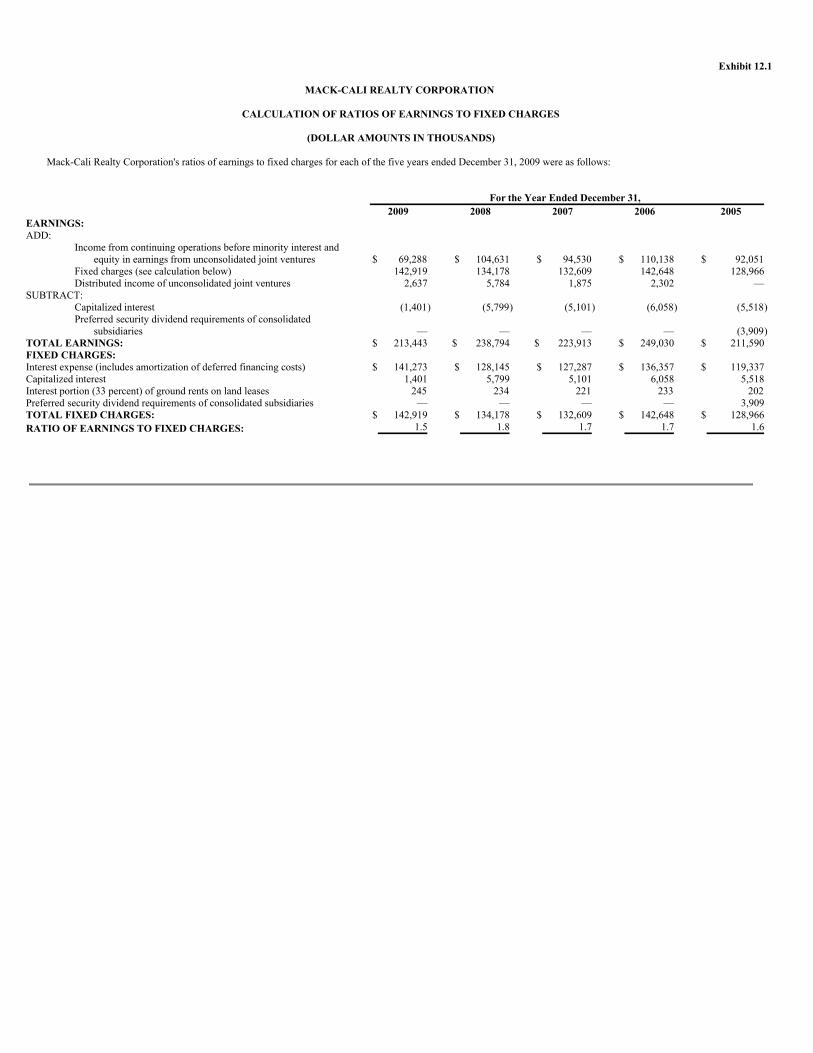
Exhibit 12.1
MACK-CALI REALTY CORPORATION
CALCULATION OF RATIOS OF EARNINGS TO FIXED CHARGES
(DOLLAR AMOUNTS IN THOUSANDS)
Mack-Cali Realty Corporation's ratios of earnings to fixed charges for each of the five years ended December 31, 2009 were as follows:
For the Year Ended December 31, 2009 2008 2007 2006 2005 EARNINGS: ADD:
Income from continuing operations before minority interest and
equity in earnings from unconsolidated joint ventures $
69,288 $
104,631 $
94,530 $
110,138 $
92,051 Fixed charges (see calculation below) 142,919 134,178 132,609 142,648 128,966 Distributed income of unconsolidated joint ventures 2,637 5,784 1,875 2,302 — SUBTRACT: Capitalized interest (1,401) (5,799) (5,101) (6,058) (5,518)
Preferred security dividend requirements of consolidated
subsidiaries — — — — (3,909 )
TOTAL EARNINGS: $ 213,443 $ 238,794 $ 223,913 $ 249,030 $ 211,590 FIXED CHARGES: Interest expense (includes amortization of deferred financing costs) $ 141,273 $ 128,145 $ 127,287 $ 136,357 $ 119,337 Capitalized interest 1,401 5,799 5,101 6,058 5,518 Interest portion (33 percent) of ground rents on land leases 245 234 221 233 202 Preferred security dividend requirements of consolidated subsidiaries — — — — 3,909 TOTAL FIXED CHARGES: $ 142,919 $ 134,178 $ 132,609 $ 142,648 $ 128,966 RATIO OF EARNINGS TO FIXED CHARGES: 1.5 1.8 1.7 1.7 1.6


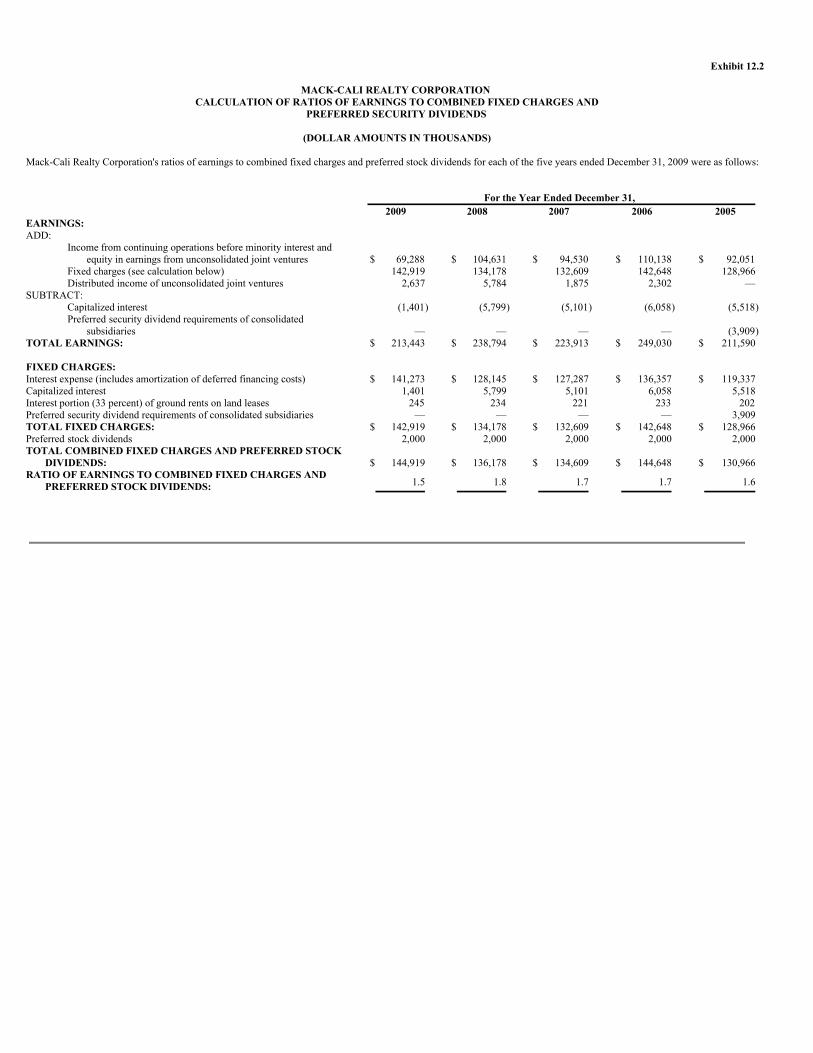
Exhibit 12.2
MACK-CALI REALTY CORPORATION CALCULATION OF RATIOS OF EARNINGS TO COMBINED FIXED CHARGES AND
PREFERRED SECURITY DIVIDENDS
(DOLLAR AMOUNTS IN THOUSANDS)
Mack-Cali Realty Corporation's ratios of earnings to combined fixed charges and preferred stock dividends for each of the five years ended December 31, 2009 were as follows:
For the Year Ended December 31, 2009 2008 2007 2006 2005 EARNINGS: ADD:
Income from continuing operations before minority interest and
equity in earnings from unconsolidated joint ventures $ 69,288 $ 104,631 $ 94,530 $ 110,138 $ 92,051 Fixed charges (see calculation below) 142,919 134,178 132,609 142,648 128,966 Distributed income of unconsolidated joint ventures 2,637 5,784 1,875 2,302 — SUBTRACT: Capitalized interest (1,401) (5,799) (5,101) (6,058) (5,518)
Preferred security dividend requirements of consolidated
subsidiaries — — — — (3,909)TOTAL EARNINGS: $ 213,443 $ 238,794 $ 223,913 $ 249,030 $ 211,590 FIXED CHARGES: Interest expense (includes amortization of deferred financing costs) $ 141,273 $ 128,145 $ 127,287 $ 136,357 $ 119,337 Capitalized interest 1,401 5,799 5,101 6,058 5,518 Interest portion (33 percent) of ground rents on land leases 245 234 221 233 202 Preferred security dividend requirements of consolidated subsidiaries — — — — 3,909 TOTAL FIXED CHARGES: $ 142,919 $ 134,178 $ 132,609 $ 142,648 $ 128,966 Preferred stock dividends 2,000 2,000 2,000 2,000 2,000 TOTAL COMBINED FIXED CHARGES AND PREFERRED STOCK
DIVIDENDS: $ 144,919 $ 136,178 $ 134,609 $ 144,648 $ 130,966 RATIO OF EARNINGS TO COMBINED FIXED CHARGES AND
PREFERRED STOCK DIVIDENDS: 1.5 1.8 1.7 1.7 1.6


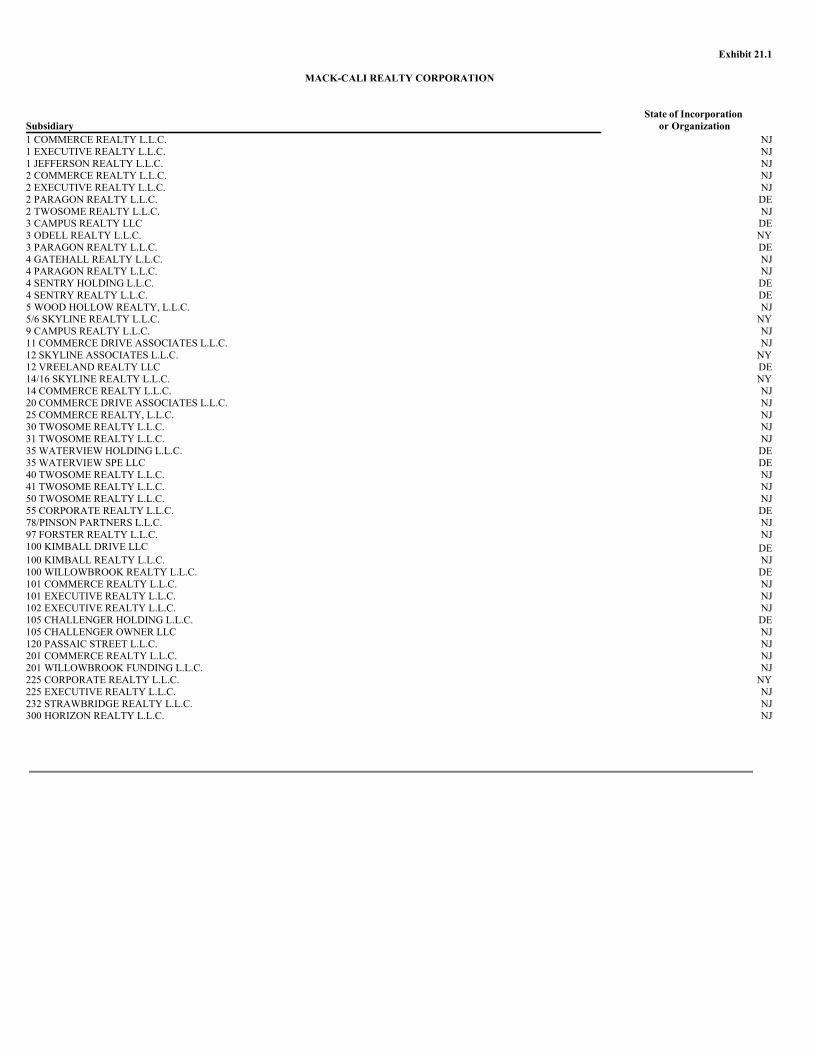
Exhibit 21.1
MACK-CALI REALTY CORPORATION
Subsidiary State of Incorporation
or Organization1 COMMERCE REALTY L.L.C. NJ1 EXECUTIVE REALTY L.L.C. NJ1 JEFFERSON REALTY L.L.C. NJ2 COMMERCE REALTY L.L.C. NJ2 EXECUTIVE REALTY L.L.C. NJ2 PARAGON REALTY L.L.C. DE2 TWOSOME REALTY L.L.C. NJ3 CAMPUS REALTY LLC DE3 ODELL REALTY L.L.C. NY3 PARAGON REALTY L.L.C. DE4 GATEHALL REALTY L.L.C. NJ4 PARAGON REALTY L.L.C. NJ4 SENTRY HOLDING L.L.C. DE4 SENTRY REALTY L.L.C. DE5 WOOD HOLLOW REALTY, L.L.C. NJ5/6 SKYLINE REALTY L.L.C. NY9 CAMPUS REALTY L.L.C. NJ11 COMMERCE DRIVE ASSOCIATES L.L.C. NJ12 SKYLINE ASSOCIATES L.L.C. NY12 VREELAND REALTY LLC DE14/16 SKYLINE REALTY L.L.C. NY14 COMMERCE REALTY L.L.C. NJ20 COMMERCE DRIVE ASSOCIATES L.L.C. NJ25 COMMERCE REALTY, L.L.C. NJ30 TWOSOME REALTY L.L.C. NJ31 TWOSOME REALTY L.L.C. NJ35 WATERVIEW HOLDING L.L.C. DE35 WATERVIEW SPE LLC DE40 TWOSOME REALTY L.L.C. NJ41 TWOSOME REALTY L.L.C. NJ50 TWOSOME REALTY L.L.C. NJ55 CORPORATE REALTY L.L.C. DE78/PINSON PARTNERS L.L.C. NJ97 FORSTER REALTY L.L.C. NJ100 KIMBALL DRIVE LLC DE100 KIMBALL REALTY L.L.C. NJ100 WILLOWBROOK REALTY L.L.C. DE101 COMMERCE REALTY L.L.C. NJ101 EXECUTIVE REALTY L.L.C. NJ102 EXECUTIVE REALTY L.L.C. NJ105 CHALLENGER HOLDING L.L.C. DE105 CHALLENGER OWNER LLC NJ120 PASSAIC STREET L.L.C. NJ201 COMMERCE REALTY L.L.C. NJ201 WILLOWBROOK FUNDING L.L.C. NJ225 CORPORATE REALTY L.L.C. NY225 EXECUTIVE REALTY L.L.C. NJ232 STRAWBRIDGE REALTY L.L.C. NJ300 HORIZON REALTY L.L.C. NJ
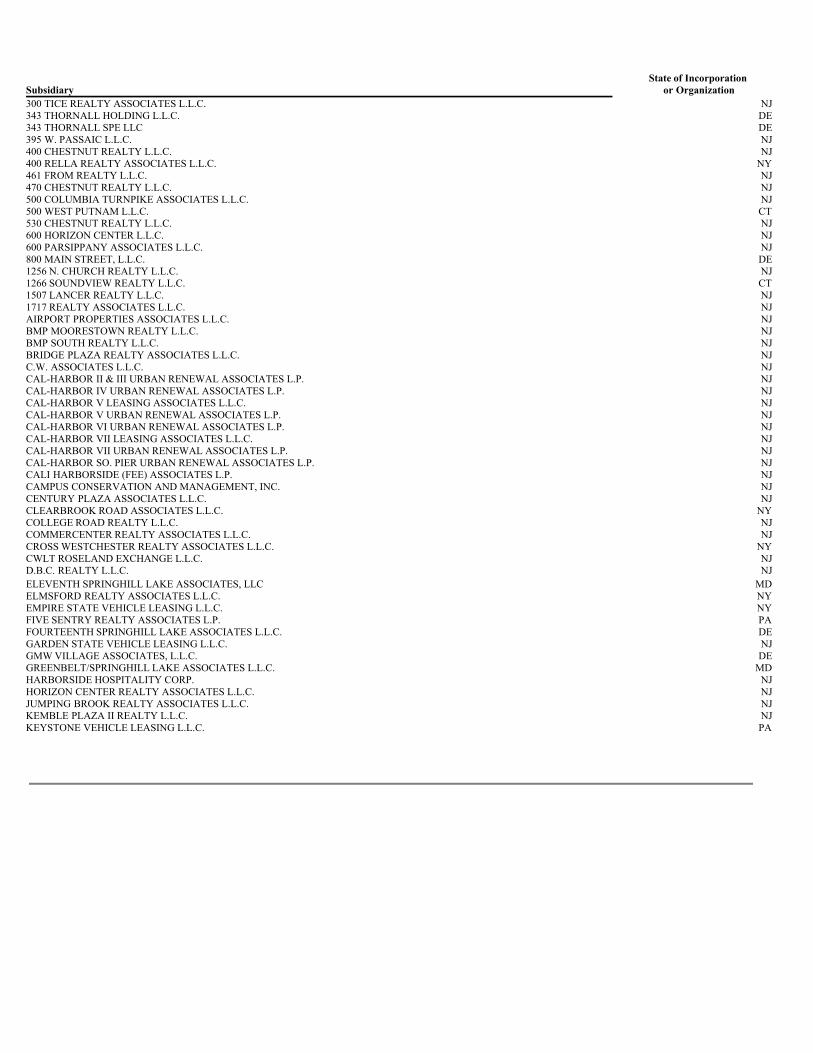
Subsidiary State of Incorporation
or Organization300 TICE REALTY ASSOCIATES L.L.C. NJ343 THORNALL HOLDING L.L.C. DE343 THORNALL SPE LLC DE395 W. PASSAIC L.L.C. NJ400 CHESTNUT REALTY L.L.C. NJ400 RELLA REALTY ASSOCIATES L.L.C. NY461 FROM REALTY L.L.C. NJ470 CHESTNUT REALTY L.L.C. NJ500 COLUMBIA TURNPIKE ASSOCIATES L.L.C. NJ500 WEST PUTNAM L.L.C. CT530 CHESTNUT REALTY L.L.C. NJ600 HORIZON CENTER L.L.C. NJ600 PARSIPPANY ASSOCIATES L.L.C. NJ800 MAIN STREET, L.L.C. DE1256 N. CHURCH REALTY L.L.C. NJ1266 SOUNDVIEW REALTY L.L.C. CT1507 LANCER REALTY L.L.C. NJ1717 REALTY ASSOCIATES L.L.C. NJAIRPORT PROPERTIES ASSOCIATES L.L.C. NJBMP MOORESTOWN REALTY L.L.C. NJBMP SOUTH REALTY L.L.C. NJBRIDGE PLAZA REALTY ASSOCIATES L.L.C. NJC.W. ASSOCIATES L.L.C. NJCAL-HARBOR II & III URBAN RENEWAL ASSOCIATES L.P. NJCAL-HARBOR IV URBAN RENEWAL ASSOCIATES L.P. NJCAL-HARBOR V LEASING ASSOCIATES L.L.C. NJCAL-HARBOR V URBAN RENEWAL ASSOCIATES L.P. NJCAL-HARBOR VI URBAN RENEWAL ASSOCIATES L.P. NJCAL-HARBOR VII LEASING ASSOCIATES L.L.C. NJCAL-HARBOR VII URBAN RENEWAL ASSOCIATES L.P. NJCAL-HARBOR SO. PIER URBAN RENEWAL ASSOCIATES L.P. NJCALI HARBORSIDE (FEE) ASSOCIATES L.P. NJCAMPUS CONSERVATION AND MANAGEMENT, INC. NJCENTURY PLAZA ASSOCIATES L.L.C. NJCLEARBROOK ROAD ASSOCIATES L.L.C. NYCOLLEGE ROAD REALTY L.L.C. NJCOMMERCENTER REALTY ASSOCIATES L.L.C. NJCROSS WESTCHESTER REALTY ASSOCIATES L.L.C. NYCWLT ROSELAND EXCHANGE L.L.C. NJD.B.C. REALTY L.L.C. NJELEVENTH SPRINGHILL LAKE ASSOCIATES, LLC MDELMSFORD REALTY ASSOCIATES L.L.C. NYEMPIRE STATE VEHICLE LEASING L.L.C. NYFIVE SENTRY REALTY ASSOCIATES L.P. PAFOURTEENTH SPRINGHILL LAKE ASSOCIATES L.L.C. DEGARDEN STATE VEHICLE LEASING L.L.C. NJGMW VILLAGE ASSOCIATES, L.L.C. DEGREENBELT/SPRINGHILL LAKE ASSOCIATES L.L.C. MDHARBORSIDE HOSPITALITY CORP. NJHORIZON CENTER REALTY ASSOCIATES L.L.C. NJJUMPING BROOK REALTY ASSOCIATES L.L.C. NJKEMBLE PLAZA II REALTY L.L.C. NJKEYSTONE VEHICLE LEASING L.L.C. PA
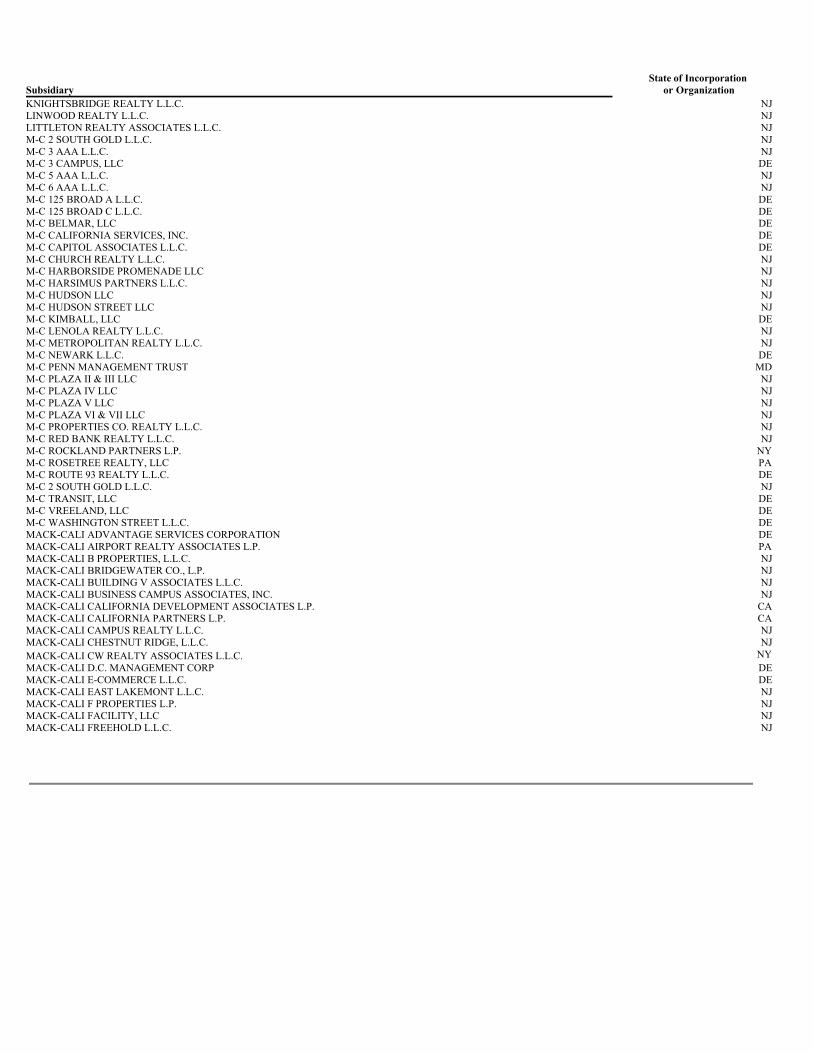
Subsidiary State of Incorporation
or OrganizationKNIGHTSBRIDGE REALTY L.L.C. NJLINWOOD REALTY L.L.C. NJLITTLETON REALTY ASSOCIATES L.L.C. NJM-C 2 SOUTH GOLD L.L.C. NJM-C 3 AAA L.L.C. NJM-C 3 CAMPUS, LLC DEM-C 5 AAA L.L.C. NJM-C 6 AAA L.L.C. NJM-C 125 BROAD A L.L.C. DEM-C 125 BROAD C L.L.C. DEM-C BELMAR, LLC DEM-C CALIFORNIA SERVICES, INC. DEM-C CAPITOL ASSOCIATES L.L.C. DEM-C CHURCH REALTY L.L.C. NJM-C HARBORSIDE PROMENADE LLC NJM-C HARSIMUS PARTNERS L.L.C. NJM-C HUDSON LLC NJM-C HUDSON STREET LLC NJM-C KIMBALL, LLC DEM-C LENOLA REALTY L.L.C. NJM-C METROPOLITAN REALTY L.L.C. NJM-C NEWARK L.L.C. DEM-C PENN MANAGEMENT TRUST MDM-C PLAZA II & III LLC NJM-C PLAZA IV LLC NJM-C PLAZA V LLC NJM-C PLAZA VI & VII LLC NJM-C PROPERTIES CO. REALTY L.L.C. NJM-C RED BANK REALTY L.L.C. NJM-C ROCKLAND PARTNERS L.P. NYM-C ROSETREE REALTY, LLC PAM-C ROUTE 93 REALTY L.L.C. DEM-C 2 SOUTH GOLD L.L.C. NJM-C TRANSIT, LLC DEM-C VREELAND, LLC DEM-C WASHINGTON STREET L.L.C. DEMACK-CALI ADVANTAGE SERVICES CORPORATION DEMACK-CALI AIRPORT REALTY ASSOCIATES L.P. PAMACK-CALI B PROPERTIES, L.L.C. NJMACK-CALI BRIDGEWATER CO., L.P. NJMACK-CALI BUILDING V ASSOCIATES L.L.C. NJMACK-CALI BUSINESS CAMPUS ASSOCIATES, INC. NJMACK-CALI CALIFORNIA DEVELOPMENT ASSOCIATES L.P. CAMACK-CALI CALIFORNIA PARTNERS L.P. CAMACK-CALI CAMPUS REALTY L.L.C. NJMACK-CALI CHESTNUT RIDGE, L.L.C. NJMACK-CALI CW REALTY ASSOCIATES L.L.C. NYMACK-CALI D.C. MANAGEMENT CORP DEMACK-CALI E-COMMERCE L.L.C. DEMACK-CALI EAST LAKEMONT L.L.C. NJMACK-CALI F PROPERTIES L.P. NJMACK-CALI FACILITY, LLC NJMACK-CALI FREEHOLD L.L.C. NJ
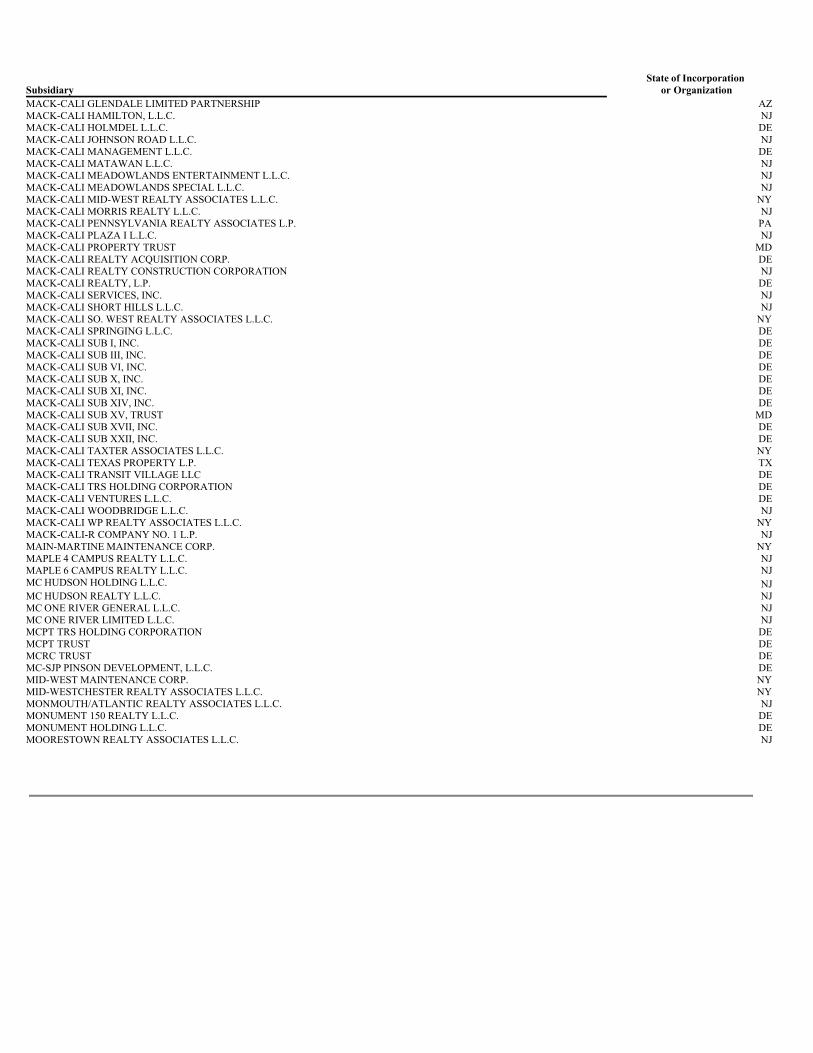
Subsidiary State of Incorporation
or OrganizationMACK-CALI GLENDALE LIMITED PARTNERSHIP AZMACK-CALI HAMILTON, L.L.C. NJMACK-CALI HOLMDEL L.L.C. DEMACK-CALI JOHNSON ROAD L.L.C. NJMACK-CALI MANAGEMENT L.L.C. DEMACK-CALI MATAWAN L.L.C. NJMACK-CALI MEADOWLANDS ENTERTAINMENT L.L.C. NJMACK-CALI MEADOWLANDS SPECIAL L.L.C. NJMACK-CALI MID-WEST REALTY ASSOCIATES L.L.C. NYMACK-CALI MORRIS REALTY L.L.C. NJMACK-CALI PENNSYLVANIA REALTY ASSOCIATES L.P. PAMACK-CALI PLAZA I L.L.C. NJMACK-CALI PROPERTY TRUST MDMACK-CALI REALTY ACQUISITION CORP. DEMACK-CALI REALTY CONSTRUCTION CORPORATION NJMACK-CALI REALTY, L.P. DEMACK-CALI SERVICES, INC. NJMACK-CALI SHORT HILLS L.L.C. NJMACK-CALI SO. WEST REALTY ASSOCIATES L.L.C. NYMACK-CALI SPRINGING L.L.C. DEMACK-CALI SUB I, INC. DEMACK-CALI SUB III, INC. DEMACK-CALI SUB VI, INC. DEMACK-CALI SUB X, INC. DEMACK-CALI SUB XI, INC. DEMACK-CALI SUB XIV, INC. DEMACK-CALI SUB XV, TRUST MDMACK-CALI SUB XVII, INC. DEMACK-CALI SUB XXII, INC. DEMACK-CALI TAXTER ASSOCIATES L.L.C. NYMACK-CALI TEXAS PROPERTY L.P. TXMACK-CALI TRANSIT VILLAGE LLC DEMACK-CALI TRS HOLDING CORPORATION DEMACK-CALI VENTURES L.L.C. DEMACK-CALI WOODBRIDGE L.L.C. NJMACK-CALI WP REALTY ASSOCIATES L.L.C. NYMACK-CALI-R COMPANY NO. 1 L.P. NJMAIN-MARTINE MAINTENANCE CORP. NYMAPLE 4 CAMPUS REALTY L.L.C. NJMAPLE 6 CAMPUS REALTY L.L.C. NJMC HUDSON HOLDING L.L.C. NJMC HUDSON REALTY L.L.C. NJMC ONE RIVER GENERAL L.L.C. NJMC ONE RIVER LIMITED L.L.C. NJMCPT TRS HOLDING CORPORATION DEMCPT TRUST DEMCRC TRUST DEMC-SJP PINSON DEVELOPMENT, L.L.C. DEMID-WEST MAINTENANCE CORP. NYMID-WESTCHESTER REALTY ASSOCIATES L.L.C. NYMONMOUTH/ATLANTIC REALTY ASSOCIATES L.L.C. NJMONUMENT 150 REALTY L.L.C. DEMONUMENT HOLDING L.L.C. DEMOORESTOWN REALTY ASSOCIATES L.L.C. NJ
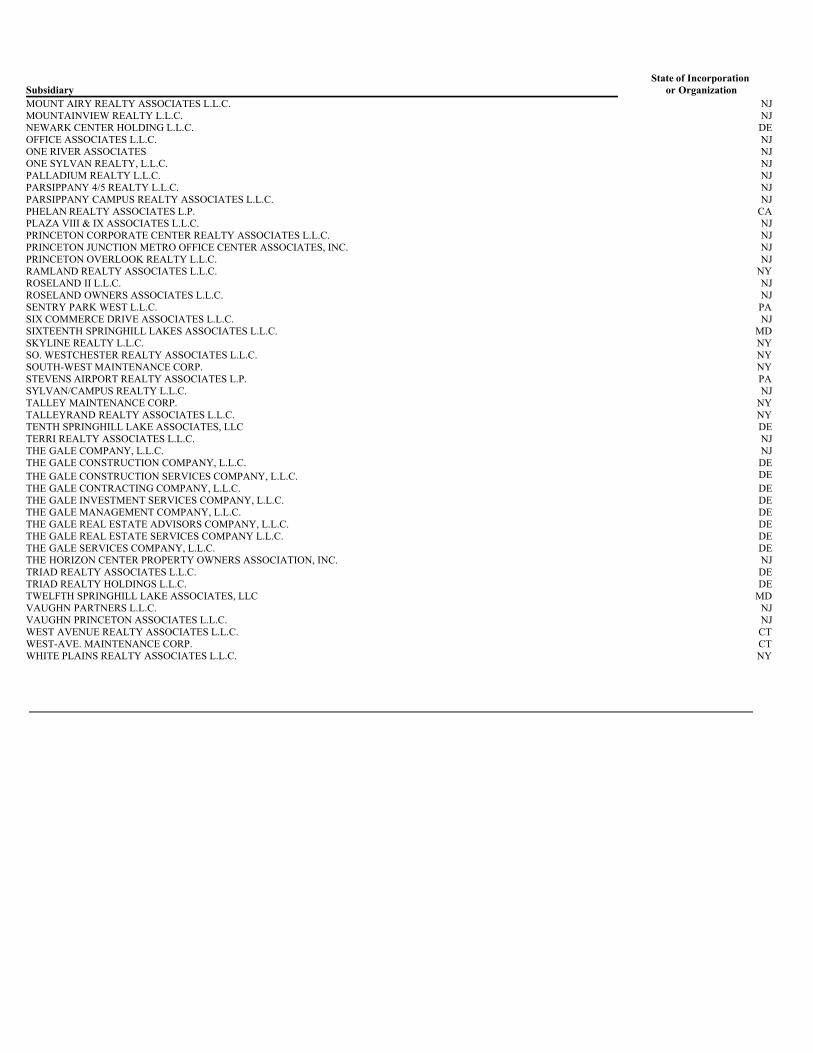
Subsidiary State of Incorporation
or OrganizationMOUNT AIRY REALTY ASSOCIATES L.L.C. NJMOUNTAINVIEW REALTY L.L.C. NJNEWARK CENTER HOLDING L.L.C. DEOFFICE ASSOCIATES L.L.C. NJONE RIVER ASSOCIATES NJONE SYLVAN REALTY, L.L.C. NJPALLADIUM REALTY L.L.C. NJPARSIPPANY 4/5 REALTY L.L.C. NJPARSIPPANY CAMPUS REALTY ASSOCIATES L.L.C. NJPHELAN REALTY ASSOCIATES L.P. CAPLAZA VIII & IX ASSOCIATES L.L.C. NJPRINCETON CORPORATE CENTER REALTY ASSOCIATES L.L.C. NJPRINCETON JUNCTION METRO OFFICE CENTER ASSOCIATES, INC. NJPRINCETON OVERLOOK REALTY L.L.C. NJRAMLAND REALTY ASSOCIATES L.L.C. NYROSELAND II L.L.C. NJROSELAND OWNERS ASSOCIATES L.L.C. NJSENTRY PARK WEST L.L.C. PASIX COMMERCE DRIVE ASSOCIATES L.L.C. NJSIXTEENTH SPRINGHILL LAKES ASSOCIATES L.L.C. MDSKYLINE REALTY L.L.C. NYSO. WESTCHESTER REALTY ASSOCIATES L.L.C. NYSOUTH-WEST MAINTENANCE CORP. NYSTEVENS AIRPORT REALTY ASSOCIATES L.P. PASYLVAN/CAMPUS REALTY L.L.C. NJTALLEY MAINTENANCE CORP. NYTALLEYRAND REALTY ASSOCIATES L.L.C. NYTENTH SPRINGHILL LAKE ASSOCIATES, LLC DETERRI REALTY ASSOCIATES L.L.C. NJTHE GALE COMPANY, L.L.C. NJTHE GALE CONSTRUCTION COMPANY, L.L.C. DETHE GALE CONSTRUCTION SERVICES COMPANY, L.L.C. DETHE GALE CONTRACTING COMPANY, L.L.C. DETHE GALE INVESTMENT SERVICES COMPANY, L.L.C. DETHE GALE MANAGEMENT COMPANY, L.L.C. DETHE GALE REAL ESTATE ADVISORS COMPANY, L.L.C. DETHE GALE REAL ESTATE SERVICES COMPANY L.L.C. DETHE GALE SERVICES COMPANY, L.L.C. DETHE HORIZON CENTER PROPERTY OWNERS ASSOCIATION, INC. NJTRIAD REALTY ASSOCIATES L.L.C. DETRIAD REALTY HOLDINGS L.L.C. DETWELFTH SPRINGHILL LAKE ASSOCIATES, LLC MDVAUGHN PARTNERS L.L.C. NJVAUGHN PRINCETON ASSOCIATES L.L.C. NJWEST AVENUE REALTY ASSOCIATES L.L.C. CTWEST-AVE. MAINTENANCE CORP. CTWHITE PLAINS REALTY ASSOCIATES L.L.C. NY


Exhibit 23.1
CONSENT OF INDEPENDENT REGISTERED PUBLIC ACCOUNTING FIRM
We hereby consent to the incorporation by reference in the Registration Statements on Form S-3 (Nos. 333-141259, 333-151090, 333-155695, 333-155696, 333-155697, 333-57194, 33-96542, 333-09875, 333-25475, 333-44441, 333-69029, and 333-80077) and in the Registration Statements on Form S-8 (Nos. 333-116437, 333-100244, 333-52478,333-80081, 333-18275, 333-19831, 333-32661 and 333-44443) of Mack-Cali Realty Corporation of our report dated February 10, 2010 relating to the financial statements,financial statement schedule and the effectiveness of internal control over financial reporting, which appears in this Form 10-K.
/s/ PricewaterhouseCoopers LLP
New York, New York February 10, 2010


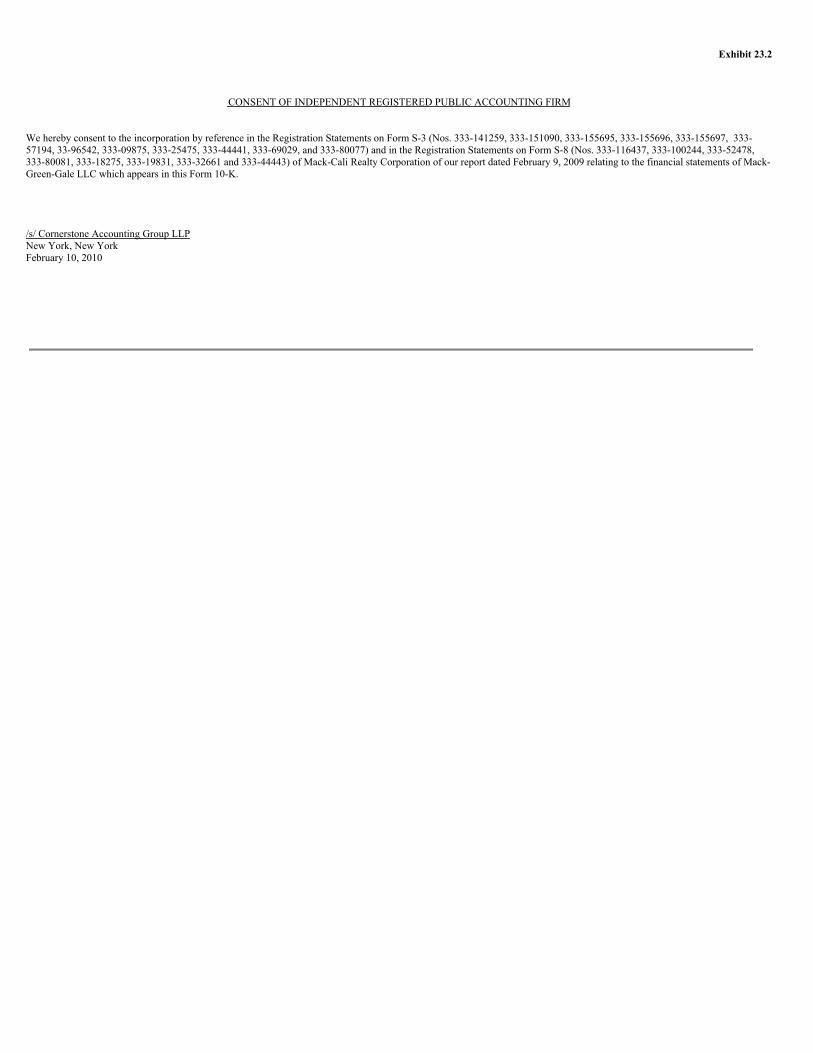
Exhibit 23.2
CONSENT OF INDEPENDENT REGISTERED PUBLIC ACCOUNTING FIRM
We hereby consent to the incorporation by reference in the Registration Statements on Form S-3 (Nos. 333-141259, 333-151090, 333-155695, 333-155696, 333-155697, 333-57194, 33-96542, 333-09875, 333-25475, 333-44441, 333-69029, and 333-80077) and in the Registration Statements on Form S-8 (Nos. 333-116437, 333-100244, 333-52478,333-80081, 333-18275, 333-19831, 333-32661 and 333-44443) of Mack-Cali Realty Corporation of our report dated February 9, 2009 relating to the financial statements of Mack-Green-Gale LLC which appears in this Form 10-K.
/s/ Cornerstone Accounting Group LLPNew York, New YorkFebruary 10, 2010


Exhibit 31.1
MACK-CALI REALTY CORPORATIONCertification
I, Mitchell E. Hersh, certify that:
1. I have reviewed this annual report on Form 10-K of Mack-Cali Realty Corporation;
2. Based on my knowledge, this report does not contain any untrue statement of a material fact or omit to state a material fact necessary to make the statements made, inlight of the circumstances under which such statements were made, not misleading with respect to the period covered by this report;
3. Based on my knowledge, the financial statements, and other financial information included in this report, fairly present in all material respects the financial condition,results of operations and cash flows of the registrant as of, and for, the periods presented in this report;
4. The registrant’s other certifying officer and I are responsible for establishing and maintaining disclosure controls and procedures (as defined in Exchange Act Rules 13a-15(e) and 15d-15(e)) and internal control over financial reporting (as defined in Exchange Act Rules 13a-15(f) and 15d-15(f)) for the registrant and have:
a) Designed such disclosure controls and procedures, or caused such disclosure controls and procedures to be designed under our supervision, to ensure thatmaterial information relating to the registrant, including its consolidated subsidiaries, is made known to us by others within those entities, particularly duringthe period in which this report is being prepared;
b) Designed such internal control over financial reporting, or caused such internal control over financial reporting to be designed under our supervision, toprovide reasonable assurance regarding the reliability of financial reporting and the preparation of financial statements for external purposes in accordance withgenerally accepted accounting principles;
c) Evaluated the effectiveness of the registrant’s disclosure controls and procedures and presented in this report our conclusions about the effectiveness of thedisclosure controls and procedures, as of the end of the period covered by this report based on such evaluation; and
d) Disclosed in this report any change in the registrant’s internal control over financial reporting that occurred during the registrant’s most recent fiscal quarter(the registrant’s fourth fiscal quarter in the case of an annual report) that has materially affected, or is reasonably likely to materially affect, the registrant’sinternal control over financial reporting; and
5. The registrant’s other certifying officer and I have disclosed, based on our most recent evaluation of internal control over financial reporting, to the registrant’s auditorsand the audit committee of the registrant’s board of directors (or persons performing the equivalent functions):
a) All significant deficiencies and material weaknesses in the design or operation of internal control over financial reporting which are reasonably likely toadversely affect the registrant’s ability to record, process, summarize and report financial information; and
b) Any fraud, whether or not material, that involves management or other employees who have a significant role in the registrant’s internal control over financialreporting.
Date: February 10, 2010 By: /s/ Mitchell E. Hersh Mitchell E. Hersh President and Chief Executive Officer


Exhibit 31.2
MACK-CALI REALTY CORPORATIONCertification
I, Barry Lefkowitz, certify that:
1. I have reviewed this annual report on Form 10-K of Mack-Cali Realty Corporation;
2. Based on my knowledge, this report does not contain any untrue statement of a material fact or omit to state a material fact necessary to make the statements made, inlight of the circumstances under which such statements were made, not misleading with respect to the period covered by this report;
3. Based on my knowledge, the financial statements, and other financial information included in this report, fairly present in all material respects the financial condition,results of operations and cash flows of the registrant as of, and for, the periods presented in this report;
4. The registrant’s other certifying officer and I are responsible for establishing and maintaining disclosure controls and procedures (as defined in Exchange Act Rules 13a-15(e) and 15d-15(e)) and internal control over financial reporting (as defined in Exchange Act Rules 13a-15(f) and 15d-15(f)) for the registrant and have:
a) Designed such disclosure controls and procedures, or caused such disclosure controls and procedures to be designed under our supervision, to ensure thatmaterial information relating to the registrant, including its consolidated subsidiaries, is made known to us by others within those entities, particularly duringthe period in which this report is being prepared;
b) Designed such internal control over financial reporting, or caused such internal control over financial reporting to be designed under our supervision, toprovide reasonable assurance regarding the reliability of financial reporting and the preparation of financial statements for external purposes in accordance withgenerally accepted accounting principles;
c) Evaluated the effectiveness of the registrant’s disclosure controls and procedures and presented in this report our conclusions about the effectiveness of thedisclosure controls and procedures, as of the end of the period covered by this report based on such evaluation; and
d) Disclosed in this report any change in the registrant’s internal control over financial reporting that occurred during the registrant’s most recent fiscal quarter(the registrant’s fourth fiscal quarter in the case of an annual report) that has materially affected, or is reasonably likely to materially affect, the registrant’sinternal control over financial reporting; and
5. The registrant’s other certifying officer and I have disclosed, based on our most recent evaluation of internal control over financial reporting, to the registrant’s auditorsand the audit committee of the registrant’s board of directors (or persons performing the equivalent functions):
a) All significant deficiencies and material weaknesses in the design or operation of internal control over financial reporting which are reasonably likely toadversely affect the registrant’s ability to record, process, summarize and report financial information; and
b) Any fraud, whether or not material, that involves management or other employees who have a significant role in the registrant’s internal control over financialreporting.
Date: February 10, 2010 By: /s/ Barry Lefkowitz Barry Lefkowitz Executive Vice President and Chief Financial Officer


EXHIBIT 32.1
CERTIFICATION PURSUANT TO18 U.S.C. SECTION 1350,
AS ADOPTED PURSUANT TOSECTION 906 OF THE SARBANES-OXLEY ACT OF 2002
In connection with the Annual Report on Form 10-K of Mack-Cali Realty Corporation (the “Company”) for the year ended December 31, 2009, as filed with the
Securities and Exchange Commission on the date hereof (the “Report”), Mitchell E. Hersh, as President and Chief Executive Officer of the Company, and Barry Lefkowitz, asChief Financial Officer of the Company, each hereby certifies, pursuant to 18 U.S.C. §1350, as adopted pursuant to §906 of the Sarbanes-Oxley Act of 2002, that:
(1) The Report fully complies with the requirements of §13(a) or 15(d) of the Securities Exchange Act of 1934; and
(2) The information contained in the Report fairly presents, in all material respects, the financial condition and results of operations of the Company.
Date: February 10, 2010 By: /s/ Mitchell E. Hersh Mitchell E. Hersh President and Chief Executive Officer Date: February 10, 2010 By: /s/ Barry Lefkowitz Barry Lefkowitz Executive Vice President and Chief Financial Officer
This certification accompanies each Report pursuant to §906 of the Sarbanes-Oxley Act of 2002 and shall not, except to the extent required by the Sarbanes-Oxley Act of2002, be deemed filed by the Company for purposes of §18 of the Securities Exchange Act of 1934, as amended.
A signed original of this written statement required by §906 has been provided to the Company and will be retained by the Company and furnished to the Securities andExchange Commission or its staff upon request.


Exhibit 99.1
MACK-GREEN-GALE LLC AND SUBSIDIARIESCONSOLIDATED BALANCE SHEETS AT DECEMBER 31, 2008 AND 2007 AND
CONSOLIDATED STATEMENTS OF OPERATIONS,CHANGES IN MEMBERS’ CAPITAL AND
CASH FLOWS FOR THE YEARS ENDED DECEMBER 31, 2008 AND 2007AND FOR THE PERIOD FROM MAY 9, 2006 (COMMENCEMENT OF OPERATIONS) THROUGH DECEMBER 31, 2006
MACK-GREEN-GALE LLC AND SUBSIDIARIESCONSOLIDATED FINANCIAL STATEMENTS
TABLE OF CONTENTS
Page No. Report of Independent Registered Public Accounting Firm 1 Consolidated Balance Sheets 2 Consolidated Statements of Operations 3 Consolidated Statements of Changes in Members’ Capital 4 Consolidated Statements of Cash Flows 5 Notes to Consolidated Financial Statements 6 - 18
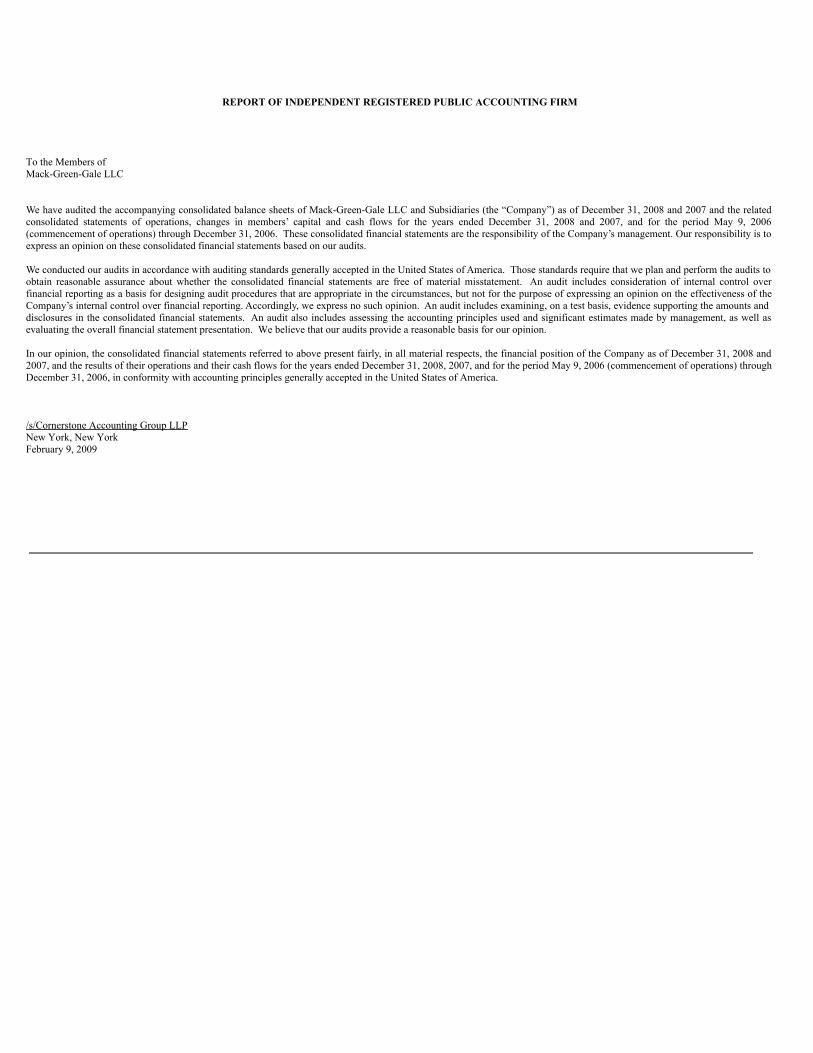
REPORT OF INDEPENDENT REGISTERED PUBLIC ACCOUNTING FIRM
To the Members ofMack-Green-Gale LLC
We have audited the accompanying consolidated balance sheets of Mack-Green-Gale LLC and Subsidiaries (the “Company”) as of December 31, 2008 and 2007 and the relatedconsolidated statements of operations, changes in members’ capital and cash flows for the years ended December 31, 2008 and 2007, and for the period May 9, 2006(commencement of operations) through December 31, 2006. These consolidated financial statements are the responsibility of the Company’s management. Our responsibility is toexpress an opinion on these consolidated financial statements based on our audits.
We conducted our audits in accordance with auditing standards generally accepted in the United States of America. Those standards require that we plan and perform the audits toobtain reasonable assurance about whether the consolidated financial statements are free of material misstatement. An audit includes consideration of internal control overfinancial reporting as a basis for designing audit procedures that are appropriate in the circumstances, but not for the purpose of expressing an opinion on the effectiveness of theCompany’s internal control over financial reporting. Accordingly, we express no such opinion. An audit includes examining, on a test basis, evidence supporting the amounts anddisclosures in the consolidated financial statements. An audit also includes assessing the accounting principles used and significant estimates made by management, as well asevaluating the overall financial statement presentation. We believe that our audits provide a reasonable basis for our opinion.
In our opinion, the consolidated financial statements referred to above present fairly, in all material respects, the financial position of the Company as of December 31, 2008 and2007, and the results of their operations and their cash flows for the years ended December 31, 2008, 2007, and for the period May 9, 2006 (commencement of operations) throughDecember 31, 2006, in conformity with accounting principles generally accepted in the United States of America.
/s/Cornerstone Accounting Group LLPNew York, New YorkFebruary 9, 2009
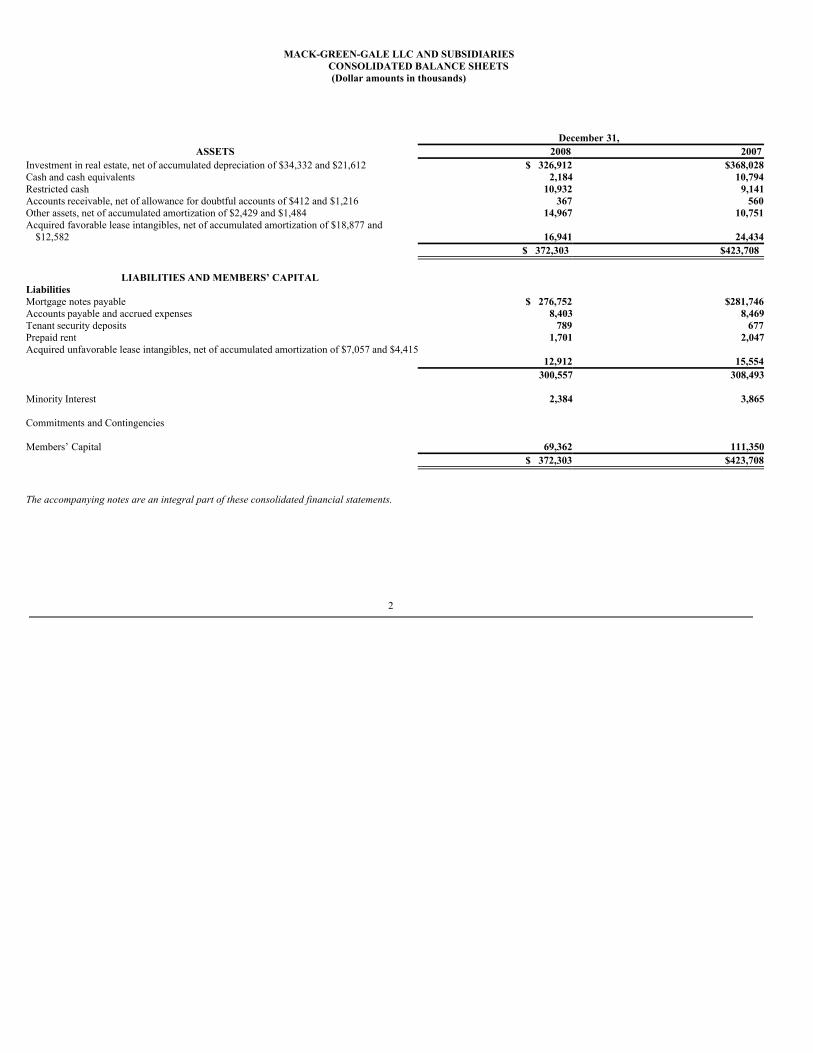
MACK-GREEN-GALE LLC AND SUBSIDIARIESCONSOLIDATED BALANCE SHEETS(Dollar amounts in thousands)
December 31,
ASSETS 2008 2007Investment in real estate, net of accumulated depreciation of $34,332 and $21,612 $ 326,912 $368,028Cash and cash equivalents 2,184 10,794Restricted cash 10,932 9,141Accounts receivable, net of allowance for doubtful accounts of $412 and $1,216 367 560Other assets, net of accumulated amortization of $2,429 and $1,484 14,967 10,751Acquired favorable lease intangibles, net of accumulated amortization of $18,877 and
$12,582
16,941
24,434 $ 372,303 $423,708
LIABILITIES AND MEMBERS’ CAPITAL
Liabilities Mortgage notes payable $ 276,752 $281,746Accounts payable and accrued expenses 8,403 8,469Tenant security deposits 789 677Prepaid rent 1,701 2,047Acquired unfavorable lease intangibles, net of accumulated amortization of $7,057 and $4,415
12,912
15,554 300,557 308,493 Minority Interest 2,384 3,865 Commitments and Contingencies Members’ Capital 69,362 111,350 $ 372,303 $423,708
The accompanying notes are an integral part of these consolidated financial statements.
2
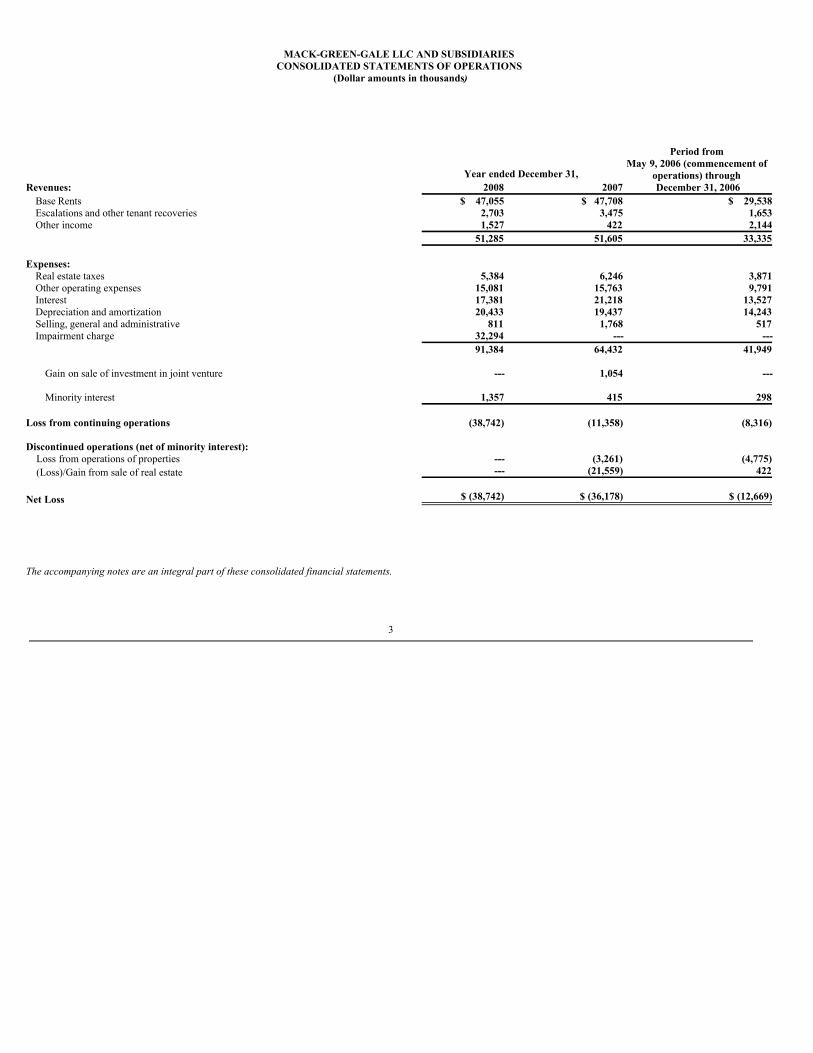
MACK-GREEN-GALE LLC AND SUBSIDIARIESCONSOLIDATED STATEMENTS OF OPERATIONS
(Dollar amounts in thousands)
Year ended December 31,
Period fromMay 9, 2006 (commencement of
operations) throughRevenues: 2008 2007 December 31, 2006
Base Rents $ 47,055 $ 47,708 $ 29,538Escalations and other tenant recoveries 2,703 3,475 1,653Other income 1,527 422 2,144
51,285 51,605 33,335 Expenses:
Real estate taxes 5,384 6,246 3,871Other operating expenses 15,081 15,763 9,791Interest 17,381 21,218 13,527Depreciation and amortization 20,433 19,437 14,243Selling, general and administrative 811 1,768 517Impairment charge 32,294 --- ---
91,384 64,432 41,949
Gain on sale of investment in joint venture --- 1,054 ---
Minority interest 1,357 415 298 Loss from continuing operations (38,742) (11,358) (8,316) Discontinued operations (net of minority interest): Loss from operations of properties --- (3,261) (4,775) (Loss)/Gain from sale of real estate --- (21,559) 422 Net Loss $ (38,742) $ (36,178) $ (12,669)
The accompanying notes are an integral part of these consolidated financial statements.
3
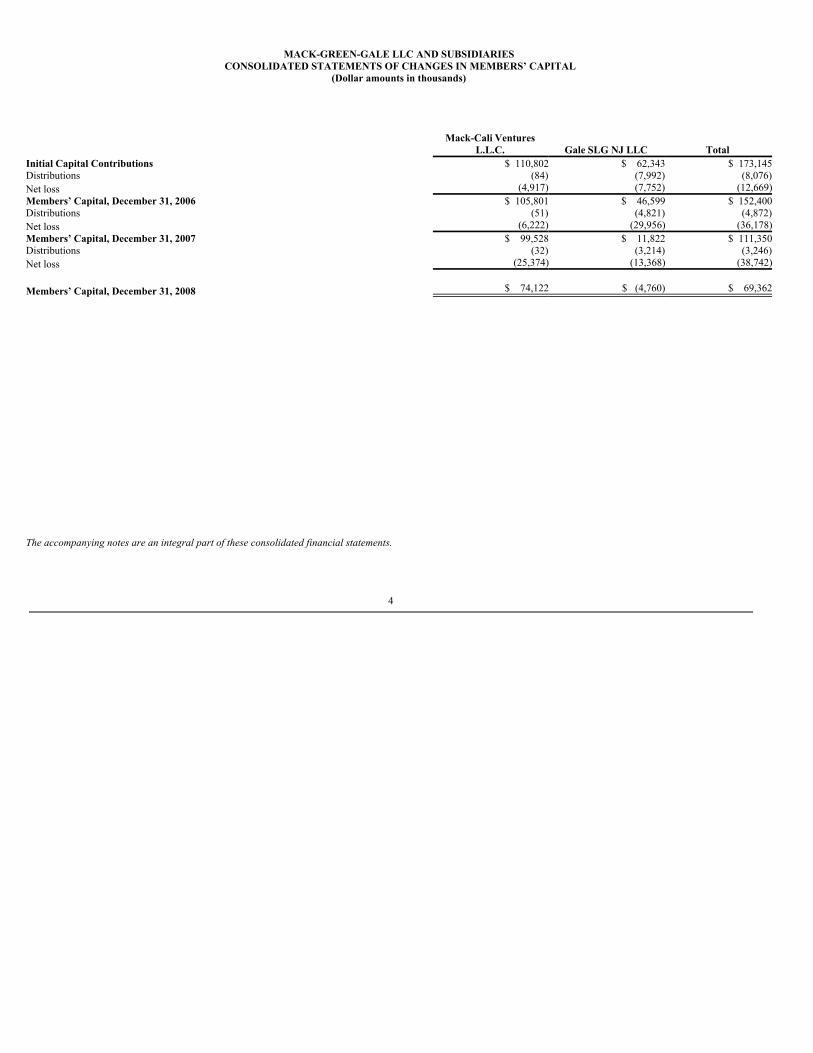
MACK-GREEN-GALE LLC AND SUBSIDIARIESCONSOLIDATED STATEMENTS OF CHANGES IN MEMBERS’ CAPITAL
(Dollar amounts in thousands)
Mack-Cali VenturesL.L.C. Gale SLG NJ LLC Total
Initial Capital Contributions $ 110,802 $ 62,343 $ 173,145Distributions (84) (7,992) (8,076)Net loss (4,917) (7,752) (12,669)Members’ Capital, December 31, 2006 $ 105,801 $ 46,599 $ 152,400Distributions (51) (4,821) (4,872)Net loss (6,222) (29,956) (36,178)Members’ Capital, December 31, 2007 $ 99,528 $ 11,822 $ 111,350Distributions (32) (3,214) (3,246)Net loss (25,374) (13,368) (38,742)
Members’ Capital, December 31, 2008 $ 74,122
$ (4,760) $ 69,362
The accompanying notes are an integral part of these consolidated financial statements.
4
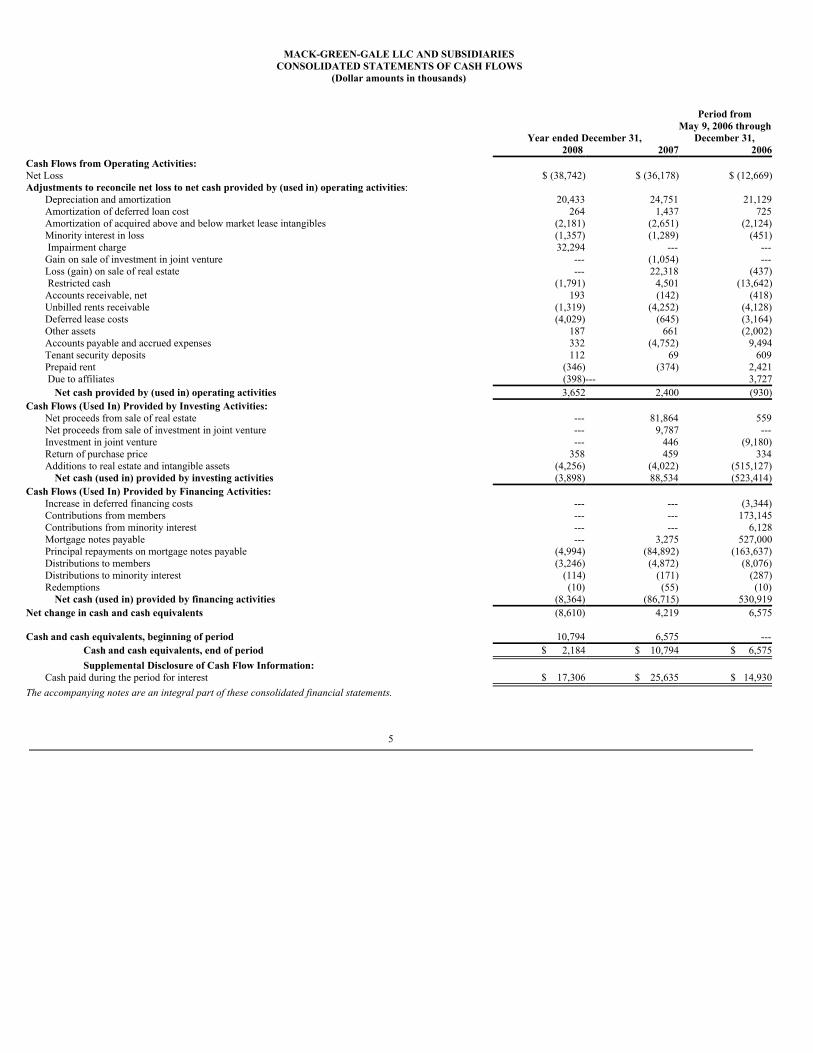
MACK-GREEN-GALE LLC AND SUBSIDIARIESCONSOLIDATED STATEMENTS OF CASH FLOWS
(Dollar amounts in thousands)
Year ended December 31,
Period fromMay 9, 2006 through
December 31, 2008 2007 2006Cash Flows from Operating Activities: Net Loss $ (38,742) $ (36,178) $ (12,669)Adjustments to reconcile net loss to net cash provided by (used in) operating activities:
Depreciation and amortization 20,433 24,751 21,129Amortization of deferred loan cost 264 1,437 725Amortization of acquired above and below market lease intangibles (2,181) (2,651) (2,124)Minority interest in loss (1,357) (1,289) (451) Impairment charge 32,294 --- ---Gain on sale of investment in joint venture --- (1,054) ---Loss (gain) on sale of real estate --- 22,318 (437) Restricted cash (1,791) 4,501 (13,642)Accounts receivable, net 193 (142) (418)Unbilled rents receivable (1,319) (4,252) (4,128)Deferred lease costs (4,029) (645) (3,164)Other assets 187 661 (2,002)Accounts payable and accrued expenses 332 (4,752) 9,494Tenant security deposits 112 69 609Prepaid rent (346) (374) 2,421 Due to affiliates (398)--- 3,727
Net cash provided by (used in) operating activities 3,652 2,400 (930)Cash Flows (Used In) Provided by Investing Activities:
Net proceeds from sale of real estate --- 81,864 559Net proceeds from sale of investment in joint venture --- 9,787 ---Investment in joint venture --- 446 (9,180)Return of purchase price 358 459 334Additions to real estate and intangible assets (4,256) (4,022) (515,127)
Net cash (used in) provided by investing activities (3,898) 88,534 (523,414)Cash Flows (Used In) Provided by Financing Activities:
Increase in deferred financing costs --- --- (3,344)Contributions from members --- --- 173,145Contributions from minority interest --- --- 6,128Mortgage notes payable --- 3,275 527,000Principal repayments on mortgage notes payable (4,994) (84,892) (163,637)Distributions to members (3,246) (4,872) (8,076)Distributions to minority interest (114) (171) (287)Redemptions (10) (55) (10)
Net cash (used in) provided by financing activities (8,364) (86,715) 530,919Net change in cash and cash equivalents (8,610) 4,219 6,575 Cash and cash equivalents, beginning of period 10,794 6,575 ---
Cash and cash equivalents, end of period $ 2,184 $ 10,794 $ 6,575Supplemental Disclosure of Cash Flow Information:
Cash paid during the period for interest
$ 17,306
$ 25,635
$ 14,930The accompanying notes are an integral part of these consolidated financial statements.
5
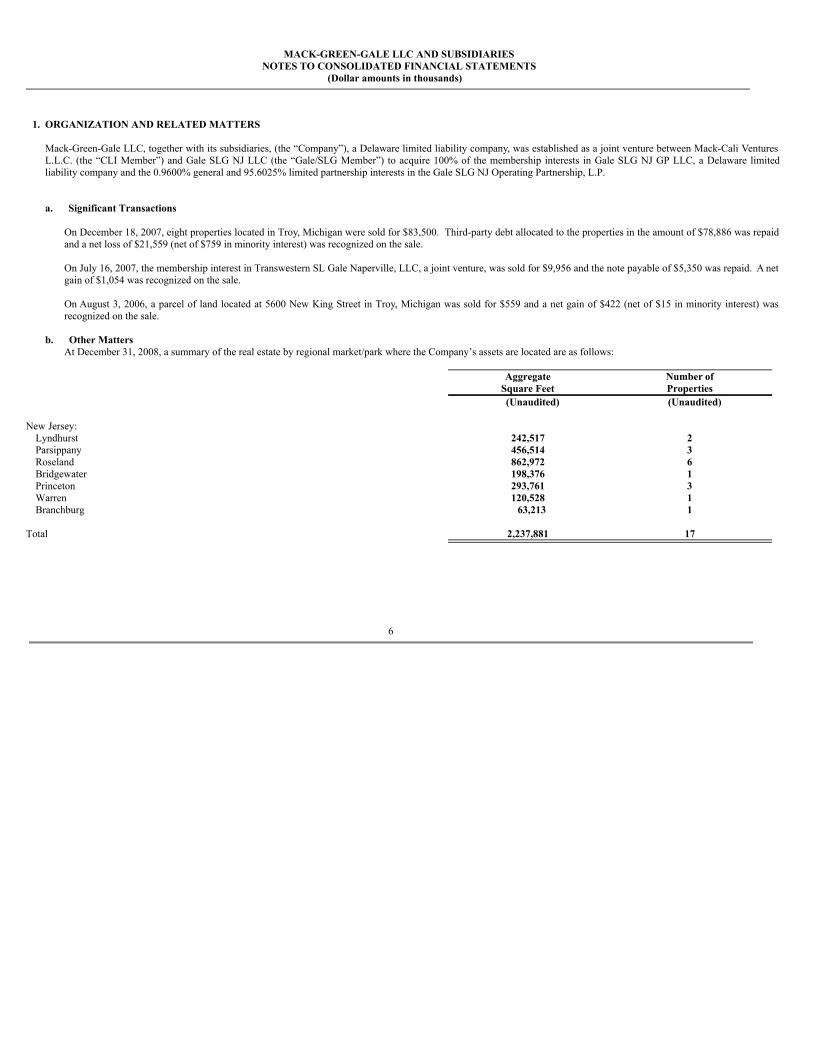
MACK-GREEN-GALE LLC AND SUBSIDIARIESNOTES TO CONSOLIDATED FINANCIAL STATEMENTS
(Dollar amounts in thousands)
1. ORGANIZATION AND RELATED MATTERS
Mack-Green-Gale LLC, together with its subsidiaries, (the “Company”), a Delaware limited liability company, was established as a joint venture between Mack-Cali VenturesL.L.C. (the “CLI Member”) and Gale SLG NJ LLC (the “Gale/SLG Member”) to acquire 100% of the membership interests in Gale SLG NJ GP LLC, a Delaware limitedliability company and the 0.9600% general and 95.6025% limited partnership interests in the Gale SLG NJ Operating Partnership, L.P.
a. Significant Transactions
On December 18, 2007, eight properties located in Troy, Michigan were sold for $83,500. Third-party debt allocated to the properties in the amount of $78,886 was repaidand a net loss of $21,559 (net of $759 in minority interest) was recognized on the sale.
On July 16, 2007, the membership interest in Transwestern SL Gale Naperville, LLC, a joint venture, was sold for $9,956 and the note payable of $5,350 was repaid. A netgain of $1,054 was recognized on the sale.
On August 3, 2006, a parcel of land located at 5600 New King Street in Troy, Michigan was sold for $559 and a net gain of $422 (net of $15 in minority interest) wasrecognized on the sale.
b. Other MattersAt December 31, 2008, a summary of the real estate by regional market/park where the Company’s assets are located are as follows:
AggregateSquare Feet
Number ofProperties
(Unaudited) (Unaudited) New Jersey:
Lyndhurst 242,517 2Parsippany 456,514 3Roseland 862,972 6Bridgewater 198,376 1Princeton 293,761 3Warren 120,528 1Branchburg 63,213 1
Total 2,237,881 17
6
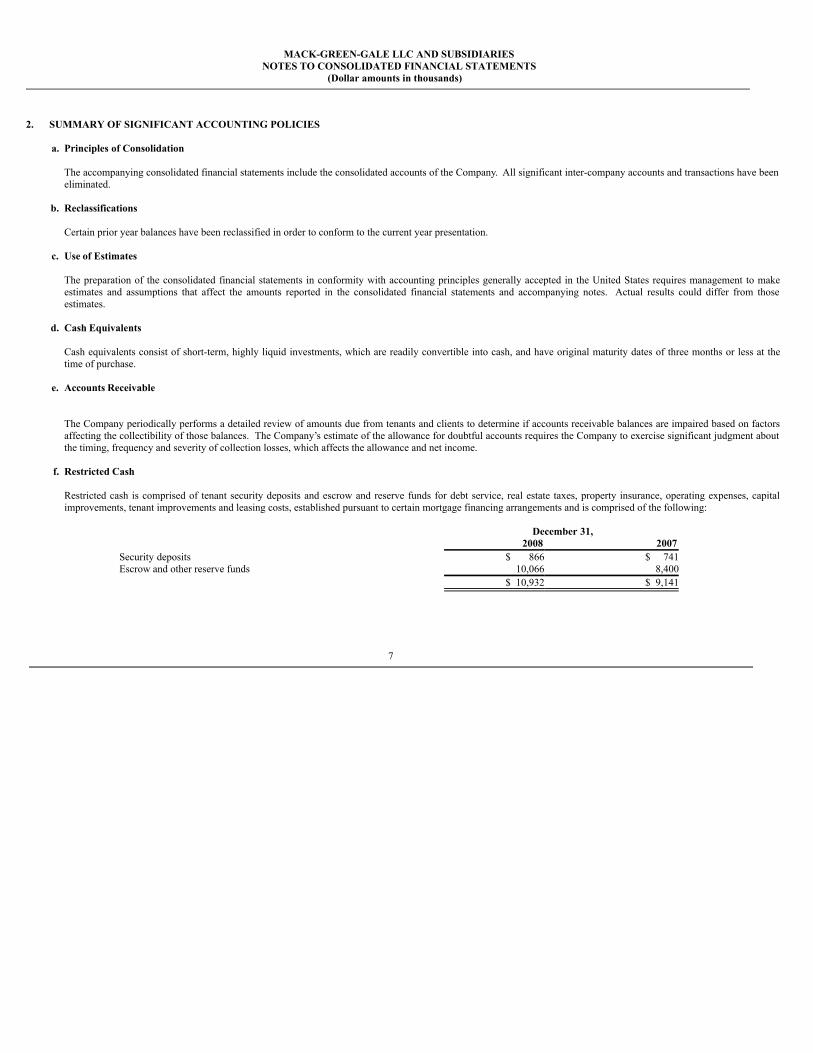
MACK-GREEN-GALE LLC AND SUBSIDIARIESNOTES TO CONSOLIDATED FINANCIAL STATEMENTS
(Dollar amounts in thousands)
2. SUMMARY OF SIGNIFICANT ACCOUNTING POLICIES
a. Principles of Consolidation
The accompanying consolidated financial statements include the consolidated accounts of the Company. All significant inter-company accounts and transactions have beeneliminated.
b. Reclassifications
Certain prior year balances have been reclassified in order to conform to the current year presentation.
c. Use of Estimates
The preparation of the consolidated financial statements in conformity with accounting principles generally accepted in the United States requires management to makeestimates and assumptions that affect the amounts reported in the consolidated financial statements and accompanying notes. Actual results could differ from thoseestimates.
d. Cash Equivalents
Cash equivalents consist of short-term, highly liquid investments, which are readily convertible into cash, and have original maturity dates of three months or less at thetime of purchase.
e. Accounts Receivable
The Company periodically performs a detailed review of amounts due from tenants and clients to determine if accounts receivable balances are impaired based on factorsaffecting the collectibility of those balances. The Company’s estimate of the allowance for doubtful accounts requires the Company to exercise significant judgment aboutthe timing, frequency and severity of collection losses, which affects the allowance and net income.
f. Restricted Cash
Restricted cash is comprised of tenant security deposits and escrow and reserve funds for debt service, real estate taxes, property insurance, operating expenses, capitalimprovements, tenant improvements and leasing costs, established pursuant to certain mortgage financing arrangements and is comprised of the following:
December 31, 2008 2007Security deposits $ 866 $ 741Escrow and other reserve funds 10,066 8,400 $ 10,932 $ 9,141
7
MACK-GREEN-GALE LLC AND SUBSIDIARIESNOTES TO CONSOLIDATED FINANCIAL STATEMENTS
(Dollar amounts in thousands)
2. SUMMARY OF SIGNIFICANT ACCOUNTING POLICIES (Continued)
g. Rental Properties and Intangible Assets
The Company assesses the fair value of acquired assets (including land, buildings and improvements, and identified intangibles such as above and below market leases andacquired in-place leases) and acquired liabilities in accordance with SFAS No. 141: Business Combinations and allocates the purchase price based on theseassessments. The Company assesses fair value based on estimated cash flow projections that utilize appropriate discount and capitalization rates and available marketinformation. Estimates of future cash flows are based on a number of factors including the historical operating results, known trends, and market/economic conditions thatmay affect the property.
The cost of maintenance and repairs is charged to expense as incurred. Depreciation is computed on a straight-line basis over the estimated useful lives of the assets asfollows:
Buildings and improvements 40 yearsLand improvements 15 yearsTenant improvements Lesser of lease term or estimated useful lifeFurniture, fixtures and equipment 5-7 years
Above and below market lease values for acquired properties are recorded based on the present value (using a discount rate which reflects the risks associated with theleases acquired) of the difference between (i) the contractual amounts to be paid pursuant to each in place lease and (ii) management’s estimate of the fair market lease ratesfor each corresponding in-place lease, measured over a period equal to the remaining term of the lease. The capitalized above and below market lease values are amortizedas a reduction or addition to base rental revenue over the remaining term of the respective leases.
Other intangible assets acquired include amounts for the in-place lease values which are based on management’s evaluation of the specific characteristics of each tenant’slease. Factors considered by management in its analysis of in-place lease values include an estimate of carrying costs during the hypothetical expected time it would takemanagement to find a tenant to lease the space for the existing lease term (a “lease-up period”) considering current market conditions, and costs to execute similarleases. Management estimates carrying costs, including such factors as real estate taxes, insurance and other operating expenses during the expected lease-up period,considering current market conditions. In estimating costs to execute similar leases, management considers leasing commissions, legal and other related expenses. Thevalue of in-place leases is amortized to expense over the remaining initial terms of the respective leases.
8

MACK-GREEN-GALE LLC AND SUBSIDIARIESNOTES TO CONSOLIDATED FINANCIAL STATEMENTS
(Dollar amounts in thousands)
2. SUMMARY OF SIGNIFICANT ACCOUNTING POLICIES (Continued)
g. Rental Properties and Intangible Assets (continued)
The Company reviews real estate and the related intangible assets for impairment whenever events or changes in circumstances indicate that the carrying value of assets tobe held and used may not be recoverable. In performing the review for recoverability of carrying value of property held for use, estimates are made of the futureundiscounted cash flows from each of the properties during the period the property will be held and upon its eventual disposition. If the expected future undiscounted cashflows are less than the carrying value of such property, an impairment charge is recognized resulting in a write-down of the carrying value of the property to an amountbased on its fair value.
Property held for sale is reported at the lower of its carrying amount or its estimated fair value less costs to sell. Once property is held for sale, depreciation expense is nolonger recorded. The operations of the property held for sale or property which has been sold are reported in discontinued operations in the accompanying consolidatedstatements of operations and assets and liabilities attributable to property held for sale are classified separately in the consolidated balance sheets for all periods presented.
For property to be disposed of, an impairment charge is recognized when the fair value of the property, less the estimated costs to sell, is less than the carrying amount ofthe property measured at the time the Company makes a commitment to sell the property.
h. Other Assets
Deferred lease costs consist of commissions paid on leases, inducements paid to tenants and other costs directly attributable to acquiring and effectuating lease agreements,all of which are capitalized and amortized using the straight-line method over the lives of the related lease terms.
Deferred financing costs consist of fees and costs incurred to obtain financing and are amortized over the terms of the respective agreement. Unamortized deferred financingcosts are expensed when the associated debt is retired prior to maturity.
i. Revenue and Profit Recognition
Rental revenue is recognized on a straight-line basis over the non-cancelable term of the lease. The excess of rents so recognized over amounts contractually due pursuant tothe underlying leases is included in other assets on the accompanying consolidated balance sheets.
Sales of real estate assets are recognized at closing subject to the receipt of adequate down payment and the meeting of other requirements in accordance with applicableaccounting guidelines.
Gains and losses recognized on sales of real estate in which the Company has no continuing involvement are classified as discontinued operations in the consolidatedstatements of operations.
9
MACK-GREEN-GALE LLC AND SUBSIDIARIESNOTES TO CONSOLIDATED FINANCIAL STATEMENTS
(Dollar amounts in thousands)
2. SUMMARY OF SIGNIFICANT ACCOUNTING POLICIES (Continued)
j. Income Taxes
The Company is organized as limited partnerships and limited liability companies and, accordingly, no provision is made for federal or state income taxes, since income orloss of the Company must be reported by the respective Members on their individual tax returns.
The tax reporting entity’s tax return is subject to examination by federal and state taxing authorities. Because many types of transactions are susceptible to varyinginterpretations under federal and state income tax laws and regulations, the amounts reported in the accompanying consolidated financials statements may be subject tochange at a later date upon final determination by the respective taxing authorities.
In July 2006, the FASB issued FIN 48, ”Accounting for Uncertainty in Income Taxes” - an interpretation of FASB Statement No. 109, “Accounting for IncomeTaxes”. This interpretation addresses the determination of whether tax benefits claimed or expected to be claimed on a tax return should be recorded in the financialstatements. Under FIN 48, the Company may recognize the tax benefit from an uncertain tax position only if it is more likely than not that the tax position will be sustainedon examination by the taxing authorities, based on the technical merits of the position. The tax benefits recognized in the financial statements from such a position shouldbe measured based on the largest benefit that has a greater than 50% likelihood of being realized upon ultimate settlement. FIN 48 also provides guidance on de-recognition, classification, interest and penalties on income taxes, accounting in interim periods and requires increased disclosures.
The adoption of FIN 48 did not have an impact on the Company’s consolidated financial statements.
k. Concentration of Tenant and Credit Risk
Management of the Company performs ongoing evaluations of its tenants and requires certain tenants to provide security deposits. Credit risk is dependent on theeconomic conditions in the respective markets and the financial condition of the tenant.
The Company maintains its cash and cash equivalents in financial institutions. The combined balances at each institution periodically exceed FDIC insurance coveragelimits. The Company believes the risk is not significant.
10
MACK-GREEN-GALE LLC AND SUBSIDIARIESNOTES TO CONSOLIDATED FINANCIAL STATEMENTS
(Dollar amounts in thousands)
2. SUMMARY OF SIGNIFICANT ACCOUNTING POLICIES (Continued)
l. Advertising and Marketing Costs
Advertising and marketing costs were $160, $95 and $53 for the years ended December 31, 2008, 2007 and the period from May 9, 2006 (commencement of operations)through December 31, 2006, respectively, and are included in selling, general and administrative expense. These costs are expensed as incurred.
m. Minority Interest
Minority interest represents investors’ interests of 3.4% at December 31, 2008 and 2007 which, under certain conditions, are redeemable for cash at a redemption pricedetermined by using a formula which is tied to the trading prices of shares of common stock of four leading Real Estate Investment Trusts specializing in the ownership andmanagement of office properties. The amount the Company would be required to pay to redeem the interests at December 31, 2008 and 2007 is $1,958 and $3,331,respectively.
3. IMPACT OF RECENTLY ISSUED ACCOUNTING STANDARDS
Fair Value Measurements – SFAS 157 & The Fair Value Option for Financial Assets and Financial Liabilities – SFAS 159
Effective January 1, 2008, the Company adopted Statement of Financial Accounting Standards (SFAS) No. 157, “Fair Value Measurements” (SFAS 157) and SFAS No. 159“The Fair Value Option for Financial Assets and Financial Liabilities” (SFAS 159). SFAS 157 defines fair value, establishes a framework for measuring fair value underaccounting principles generally accepted in the United States (GAAP) and enhances disclosures about fair value measurements. Fair value is defined under SFAS 157 as theexchange price that would be received for an asset or paid to transfer a liability (an exit price) in the principal or most advantageous market for the asset or liability in an orderlytransaction between market participants on the measurement date. SFAS 159 allows an entity the irrevocable option to elect fair value for the initial and subsequentmeasurement for certain financial assets and liabilities on a contract-by-contract basis. The impact of adopting both SFAS 157 and SFAS 159 was immaterial to the Company.
In February 2008, the FASB deferred the effective date of SFAS 157 for one-year for non-financial assets and non-financial liabilities that are recognized or disclosed at fairvalue on a nonrecurring basis. SFAS 157 is now effective for those assets and liabilities for years beginning after November 15, 2008.
11
MACK-GREEN-GALE LLC AND SUBSIDIARIESNOTES TO CONSOLIDATED FINANCIAL STATEMENTS
(Dollar amounts in thousands)
3. IMPACT OF RECENTLY ISSUED ACCOUNTING STANDARDS (Continued)
FASB Statement No. 160 (“FASB No. 160”), Non-controlling Interests in Consolidated Financial Statements – an Amendment of ARB No. 51
In December 2007, the FASB issued No. 160, which establishes and expands accounting and reporting standards for minority interests, which will be re-characterized as non-controlling interests, in a subsidiary and the deconsolidation of a subsidiary. This statement is effective for fiscal years beginning on or after December 15, 2008. TheCompany is currently assessing the potential impact that the adoption of FASB No. 160 will have on its financial position and results of operations.
4. FAIR VALUE OF FINANCIAL INSTRUMENTS
The techniques used to value financial instruments where quoted market prices are not available are significantly affected by the assumptions used, including the discount ratesand the estimates of future cash flows. In that regard, the derived fair value estimates cannot be substantiated by comparison to independent markets and, in many cases, couldnot be realized in immediate settlement of the instrument.
The methods and assumptions used to estimate the fair value of financial instruments are as follows:
a. The carrying value of cash and cash equivalents, restricted cash, accounts receivable, accounts payable and accrued expenses, and tenant security deposits,approximates their fair value due to the short maturities of these items.
b. At December 31, 2008, the fair values of mortgage notes payable are estimated as the value of the discounted cash flow required to service the loan. The rate usedto discount the cash flow is based upon the yield as of December 31, 2008 for a U.S. Treasury with a similar maturity date as the loan, adjusted for risk factors. The$186,465 carrying value of fixed rate mortgage notes payable have an approximate fair value of $140,405 at December 31, 2008. At December 31, 2008, fairvalues of variable rate mortgage notes payable approximate their carrying values because such mortgages re-price frequently.
12
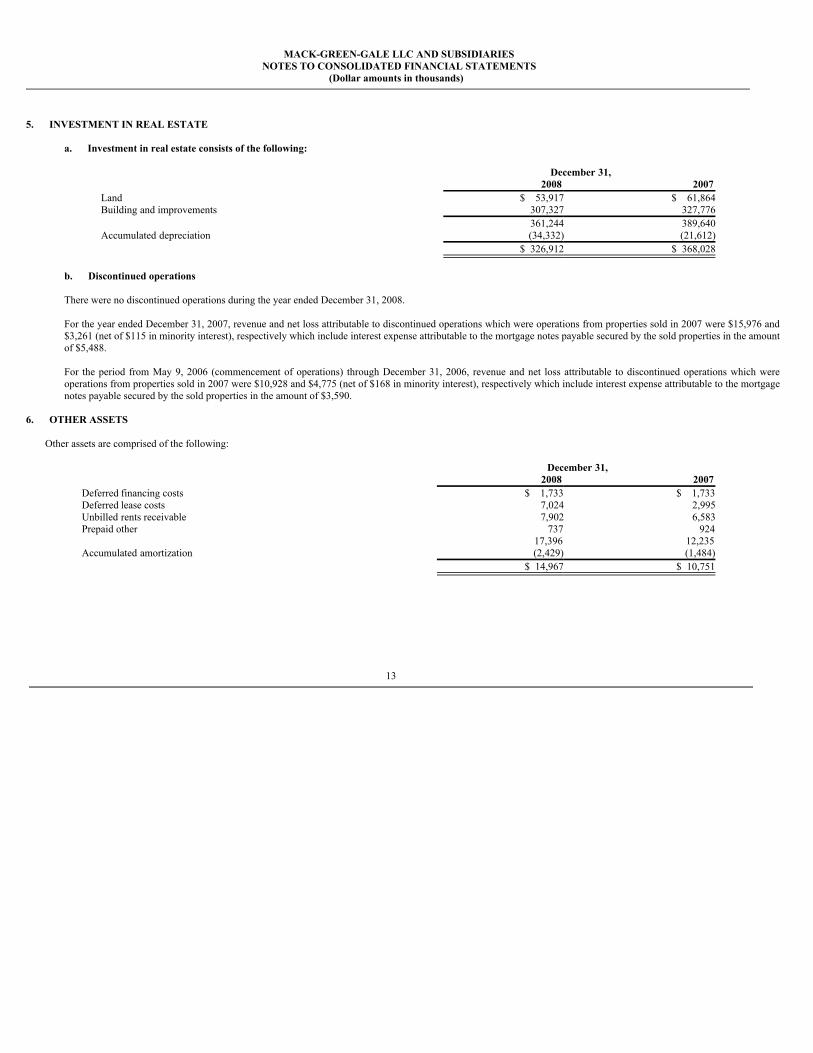
MACK-GREEN-GALE LLC AND SUBSIDIARIESNOTES TO CONSOLIDATED FINANCIAL STATEMENTS
(Dollar amounts in thousands)
5. INVESTMENT IN REAL ESTATE
a. Investment in real estate consists of the following:
December 31, 2008 2007
Land $ 53,917 $ 61,864Building and improvements 307,327 327,776 361,244 389,640Accumulated depreciation (34,332) (21,612)
$ 326,912 $ 368,028
b. Discontinued operations
There were no discontinued operations during the year ended December 31, 2008.
For the year ended December 31, 2007, revenue and net loss attributable to discontinued operations which were operations from properties sold in 2007 were $15,976 and$3,261 (net of $115 in minority interest), respectively which include interest expense attributable to the mortgage notes payable secured by the sold properties in the amountof $5,488.
For the period from May 9, 2006 (commencement of operations) through December 31, 2006, revenue and net loss attributable to discontinued operations which wereoperations from properties sold in 2007 were $10,928 and $4,775 (net of $168 in minority interest), respectively which include interest expense attributable to the mortgagenotes payable secured by the sold properties in the amount of $3,590.
6. OTHER ASSETS
Other assets are comprised of the following:
December 31, 2008 2007Deferred financing costs $ 1,733 $ 1,733Deferred lease costs 7,024 2,995Unbilled rents receivable 7,902 6,583Prepaid other 737 924 17,396 12,235Accumulated amortization (2,429) (1,484) $ 14,967 $ 10,751
13
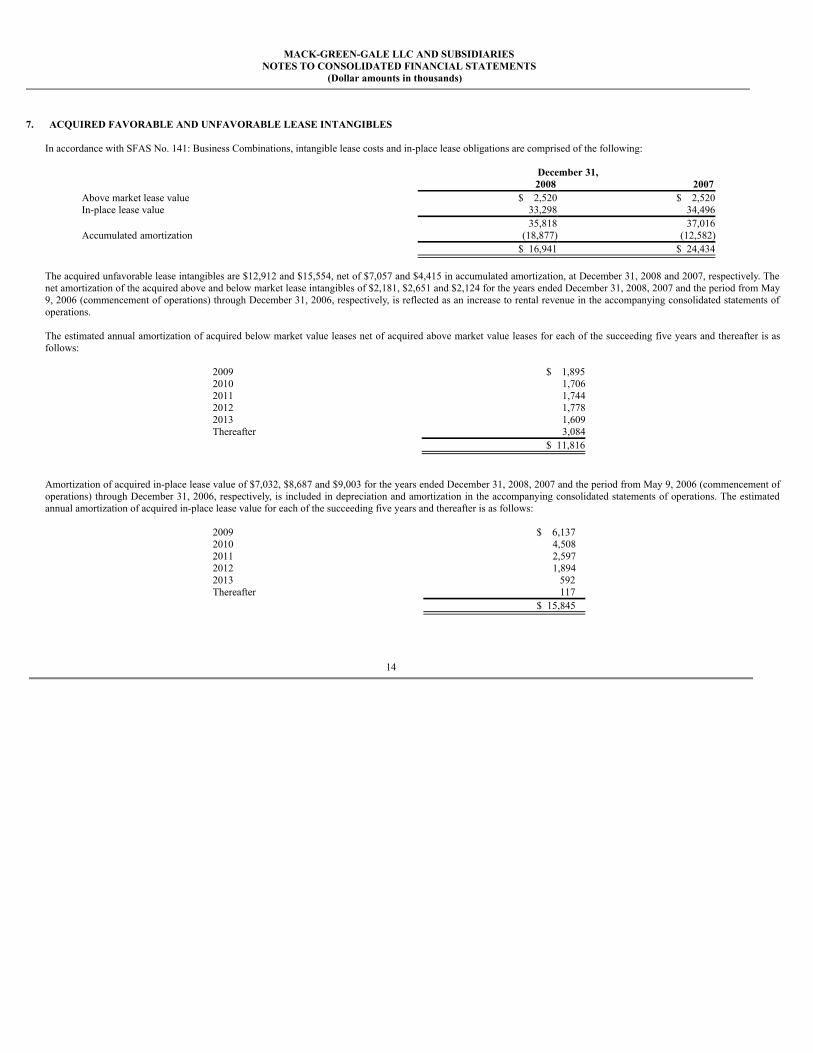
MACK-GREEN-GALE LLC AND SUBSIDIARIESNOTES TO CONSOLIDATED FINANCIAL STATEMENTS
(Dollar amounts in thousands)
7. ACQUIRED FAVORABLE AND UNFAVORABLE LEASE INTANGIBLES
In accordance with SFAS No. 141: Business Combinations, intangible lease costs and in-place lease obligations are comprised of the following:
December 31, 2008 2007Above market lease value $ 2,520 $ 2,520In-place lease value 33,298 34,496 35,818 37,016Accumulated amortization (18,877) (12,582) $ 16,941 $ 24,434
The acquired unfavorable lease intangibles are $12,912 and $15,554, net of $7,057 and $4,415 in accumulated amortization, at December 31, 2008 and 2007, respectively. Thenet amortization of the acquired above and below market lease intangibles of $2,181, $2,651 and $2,124 for the years ended December 31, 2008, 2007 and the period from May9, 2006 (commencement of operations) through December 31, 2006, respectively, is reflected as an increase to rental revenue in the accompanying consolidated statements ofoperations.
The estimated annual amortization of acquired below market value leases net of acquired above market value leases for each of the succeeding five years and thereafter is asfollows:
2009 $ 1,8952010 1,7062011 1,7442012 1,7782013 1,609Thereafter 3,084 $ 11,816
Amortization of acquired in-place lease value of $7,032, $8,687 and $9,003 for the years ended December 31, 2008, 2007 and the period from May 9, 2006 (commencement ofoperations) through December 31, 2006, respectively, is included in depreciation and amortization in the accompanying consolidated statements of operations. The estimatedannual amortization of acquired in-place lease value for each of the succeeding five years and thereafter is as follows:
2009 $ 6,1372010 4,5082011 2,5972012 1,8942013 592Thereafter 117 $ 15,845
14
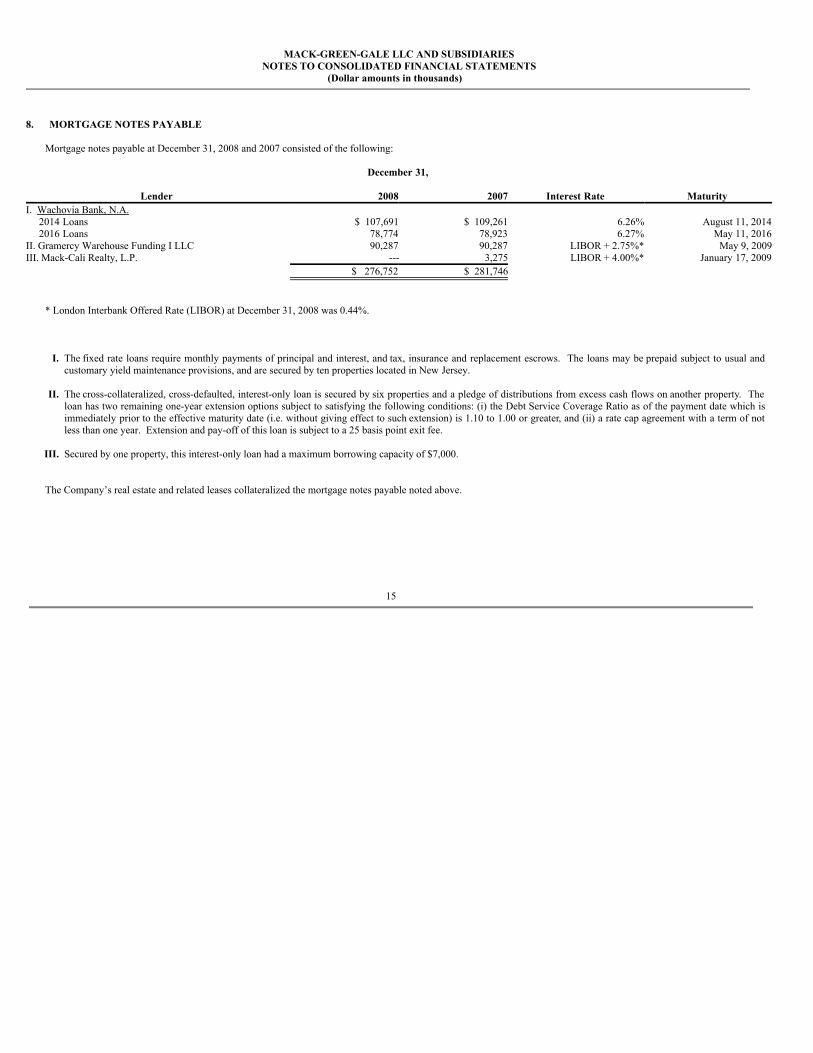
MACK-GREEN-GALE LLC AND SUBSIDIARIESNOTES TO CONSOLIDATED FINANCIAL STATEMENTS
(Dollar amounts in thousands)
8. MORTGAGE NOTES PAYABLE
Mortgage notes payable at December 31, 2008 and 2007 consisted of the following:
December 31,
Lender 2008 2007 Interest Rate Maturity
I. Wachovia Bank, N.A. 2014 Loans $ 107,691 $ 109,261 6.26% August 11, 2014 2016 Loans 78,774 78,923 6.27% May 11, 2016II. Gramercy Warehouse Funding I LLC 90,287 90,287 LIBOR + 2.75%* May 9, 2009III. Mack-Cali Realty, L.P. --- 3,275 LIBOR + 4.00%* January 17, 2009 $ 276,752 $ 281,746
* London Interbank Offered Rate (LIBOR) at December 31, 2008 was 0.44%.
I. The fixed rate loans require monthly payments of principal and interest, and tax, insurance and replacement escrows. The loans may be prepaid subject to usual andcustomary yield maintenance provisions, and are secured by ten properties located in New Jersey.
II. The cross-collateralized, cross-defaulted, interest-only loan is secured by six properties and a pledge of distributions from excess cash flows on another property. Theloan has two remaining one-year extension options subject to satisfying the following conditions: (i) the Debt Service Coverage Ratio as of the payment date which isimmediately prior to the effective maturity date (i.e. without giving effect to such extension) is 1.10 to 1.00 or greater, and (ii) a rate cap agreement with a term of notless than one year. Extension and pay-off of this loan is subject to a 25 basis point exit fee.
III. Secured by one property, this interest-only loan had a maximum borrowing capacity of $7,000.
The Company’s real estate and related leases collateralized the mortgage notes payable noted above.
15
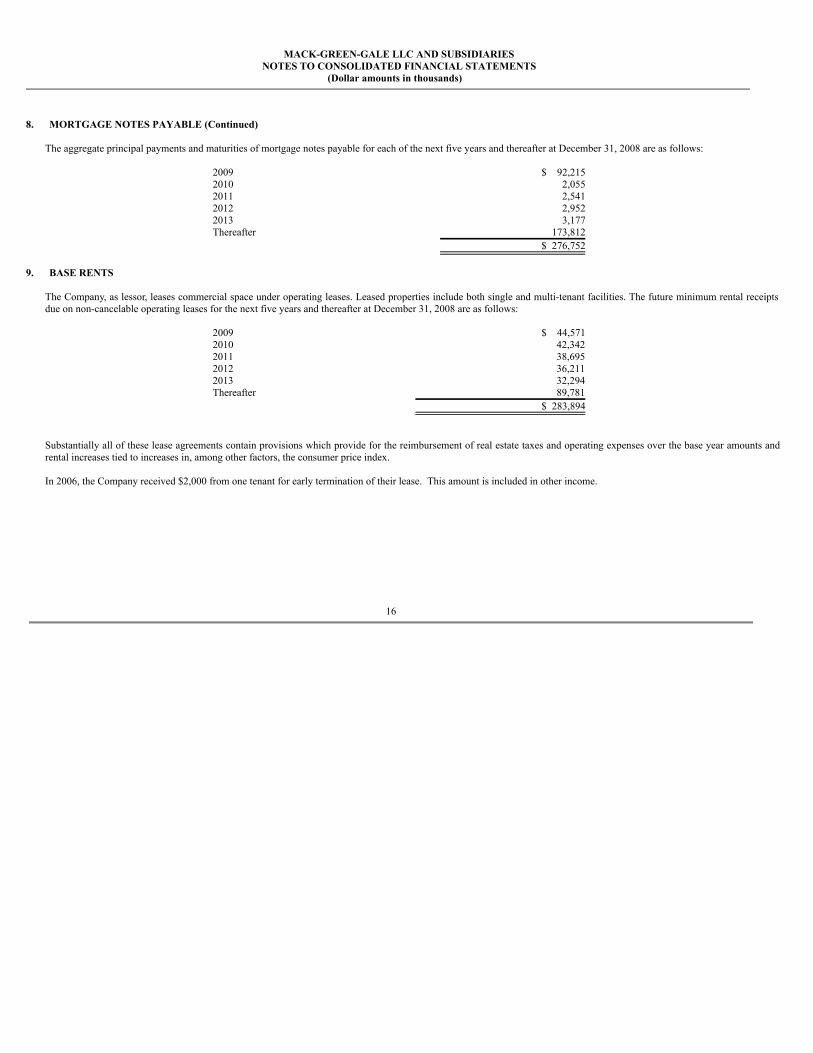
MACK-GREEN-GALE LLC AND SUBSIDIARIESNOTES TO CONSOLIDATED FINANCIAL STATEMENTS
(Dollar amounts in thousands)
8. MORTGAGE NOTES PAYABLE (Continued)
The aggregate principal payments and maturities of mortgage notes payable for each of the next five years and thereafter at December 31, 2008 are as follows:
2009 $ 92,2152010 2,0552011 2,5412012 2,9522013 3,177Thereafter 173,812 $ 276,752
9. BASE RENTS
The Company, as lessor, leases commercial space under operating leases. Leased properties include both single and multi-tenant facilities. The future minimum rental receiptsdue on non-cancelable operating leases for the next five years and thereafter at December 31, 2008 are as follows:
2009 $ 44,5712010 42,3422011 38,6952012 36,2112013 32,294Thereafter 89,781 $ 283,894
Substantially all of these lease agreements contain provisions which provide for the reimbursement of real estate taxes and operating expenses over the base year amounts andrental increases tied to increases in, among other factors, the consumer price index.
In 2006, the Company received $2,000 from one tenant for early termination of their lease. This amount is included in other income.
16
MACK-GREEN-GALE LLC AND SUBSIDIARIESNOTES TO CONSOLIDATED FINANCIAL STATEMENTS
(Dollar amounts in thousands)
10. RELATED PARTY TRANSACTIONS
The Company, which does not employ any personnel, designated The Gale Management Company, L.L.C. (a subsidiary of Mack-Cali Realty, L.P.) and/or its affiliates (“Gale”)to be the administrator of the Company pursuant to a one-year Management Agreement (the “Management Agreement”) which is automatically renewable for successive oneyear periods. Under the Management Agreement, Gale provides the Company’s property management, construction, leasing, accounting and other services as needed.
The Company incurred $8,712, $8,515 and $5,476 for management fees, leasing fees, tenant improvements, other operating costs and direct expenses relating to buildingoperations, and improvements made to the properties for the years ended December 31, 2008, 2007 and the period from May 9, 2006 (commencement of operations) throughDecember 31, 2006, respectively. Included in accounts payable and accrued expenses in the accompanying consolidated balance sheets, are amounts due to Gale at December31, 2008 and 2007 aggregating $520 and $523, respectively, attributable to the above-referenced costs.
Included in accounts payable and accrued expenses at December 31, 2008 and 2007 is $2,318 and $2,939, respectively, due to the members. This amount does not bear interestand is expected to be repaid in the normal course of business.
The Company paid interest expense of $5,308, $7,377 and $4,309 to Gramercy Warehouse Funding I LLC, an affiliate of SL Green Realty Corp, Inc., a related party, and $61,$216 and $0 to Mack-Cali Realty, L.P., a related party, for the years ended December 31, 2008, 2007 and the period from May 9, 2006 (commencement of operations) throughDecember 31, 2006, respectively (see Note 8).
11. COMMITMENTS AND CONTINGENCIES
The Company, as an owner of real estate, is subject to various environmental laws of federal and local governments. Compliance by the Company with existing laws has nothad a material adverse effect on the Company’s financial condition and results of operations, and management does not believe it will have such an impact in the future.However, the Company cannot predict the impact of new or changed laws or regulations on its current properties or on its properties that it may acquire in the future.
The Company is not aware of any litigation threatened against the Company other than routine litigation arising out of the normal course of business, some of which is expectedto be covered by insurance, none of which is expected to have a material adverse effect on the Company’s financial condition.
17
MACK-GREEN-GALE LLC AND SUBSIDIARIESNOTES TO CONSOLIDATED FINANCIAL STATEMENTS
(Dollar amounts in thousands)
11. COMMITMENTS AND CONTINGENCIES (Continued)
The Company has entered into certain commitments to tenants regarding improvements and fix-up allowances. The estimated potential commitment as of December 31, 2008total $6,232.
12. IMPAIRMENT CHARGE
Due to the downturn in the economy and, in particular, the Company’s anticipated holding period pertaining to six properties encumbered under the Gramercy WarehouseFunding I LLC loan that matures on May 9, 2009 (see Note 8), management believes that this is an indicator that these properties’ carrying amounts may not be recoverable atDecember 31, 2008. In accordance with Statement of Financial Accounting Standards No. 144, “Accounting for the Impairment or Disposal of Long-Lived Assets”, theCompany prepared an analysis to estimate the sum of the undiscounted cash flows expected to result from the use and eventual disposition of these properties. Managementdetermined that the estimate of the aggregate future cash flows to be generated by these properties are less than the book values of the total net rental properties. The bookvalues of the total net rental properties exceed its fair values by approximately $32,294, and the Company has recorded this amount on their consolidated financial statements asan impairment charge for the year ended December 31, 2008. Fair values were estimated by using a discounted cash flow technique, which considered the cash flows expectedto result from the use and eventual disposition of the properties discounted at an appropriate rate.
18


MACK-GREEN-GALE LLC AND SUBSIDIARIESUNAUDITED CONSOLIDATED FINANCIAL STATEMENTS
AS OF APRIL 28, 2009 ANDFOR THE PERIOD JANUARY 1, 2009 THROUGH APRIL 28, 2009
MACK-GREEN-GALE LLC AND SUBSIDIARIESUNAUDITED CONSOLIDATED FINANCIAL STATEMENTS
AS OF APRIL 28, 2009 ANDFOR THE PERIOD JANUARY 1, 2009 THROUGH APRIL 28, 2009
TABLE OF CONTENTS
Page No. Unaudited Consolidated Balance Sheet 1 Unaudited Consolidated Statement of Operations 2 Unaudited Consolidated Statement of Changes in Members’ Capital 3 Unaudited Consolidated Statement of Cash Flows 4 Notes to Unaudited Consolidated Financial Statements 5 – 16
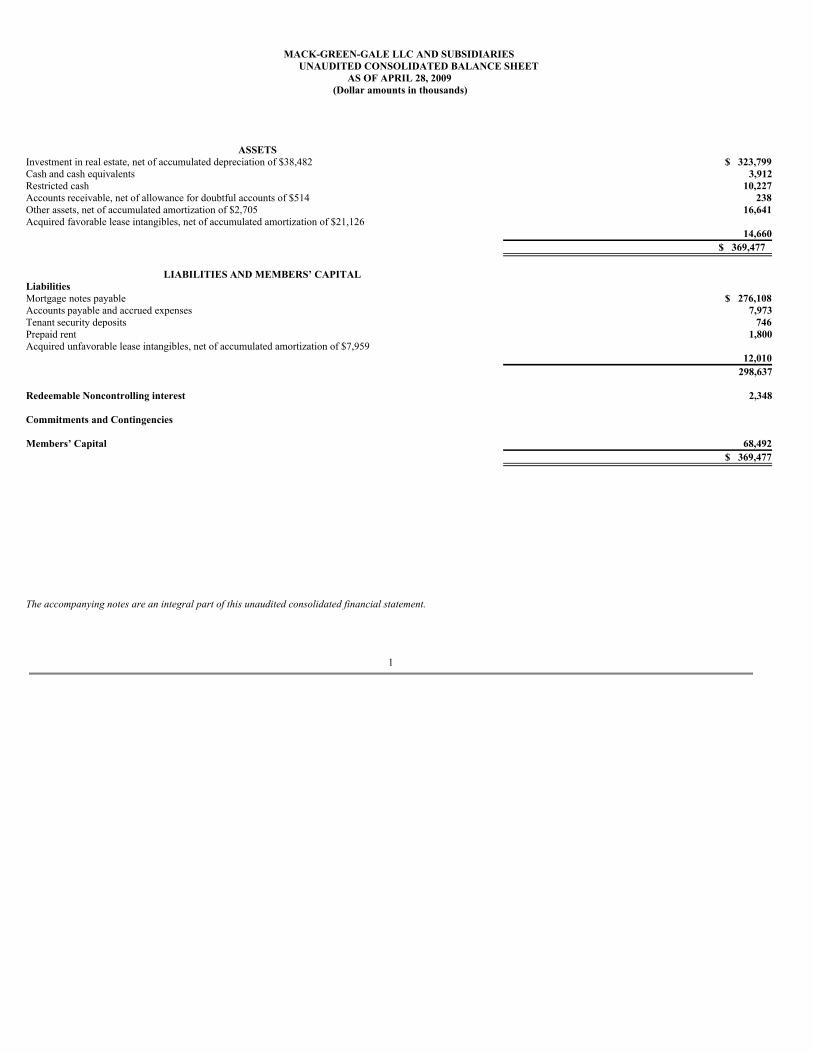
MACK-GREEN-GALE LLC AND SUBSIDIARIESUNAUDITED CONSOLIDATED BALANCE SHEET
AS OF APRIL 28, 2009 (Dollar amounts in thousands)
ASSETS
Investment in real estate, net of accumulated depreciation of $38,482 $ 323,799Cash and cash equivalents 3,912Restricted cash 10,227Accounts receivable, net of allowance for doubtful accounts of $514 238Other assets, net of accumulated amortization of $2,705 16,641Acquired favorable lease intangibles, net of accumulated amortization of $21,126
14,660 $ 369,477
LIABILITIES AND MEMBERS’ CAPITAL
Liabilities Mortgage notes payable $ 276,108Accounts payable and accrued expenses 7,973Tenant security deposits 746Prepaid rent 1,800Acquired unfavorable lease intangibles, net of accumulated amortization of $7,959
12,010 298,637 Redeemable Noncontrolling interest 2,348 Commitments and Contingencies Members’ Capital 68,492 $ 369,477
The accompanying notes are an integral part of this unaudited consolidated financial statement.
1
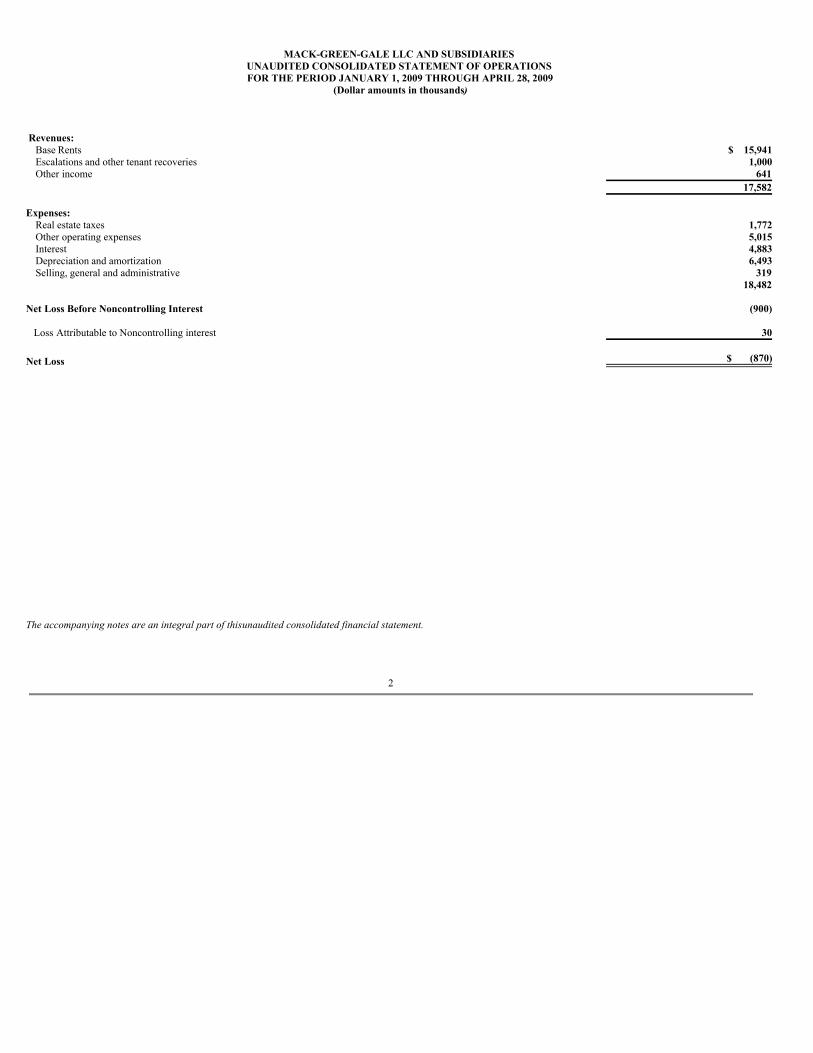
MACK-GREEN-GALE LLC AND SUBSIDIARIESUNAUDITED CONSOLIDATED STATEMENT OF OPERATIONSFOR THE PERIOD JANUARY 1, 2009 THROUGH APRIL 28, 2009
(Dollar amounts in thousands)
Revenues: Base Rents $ 15,941Escalations and other tenant recoveries 1,000Other income 641
17,582 Expenses:
Real estate taxes 1,772Other operating expenses 5,015Interest 4,883Depreciation and amortization 6,493Selling, general and administrative 319
18,482 Net Loss Before Noncontrolling Interest (900) Loss Attributable to Noncontrolling interest 30 Net Loss $ (870)
The accompanying notes are an integral part of this unaudited consolidated financial statement.
2
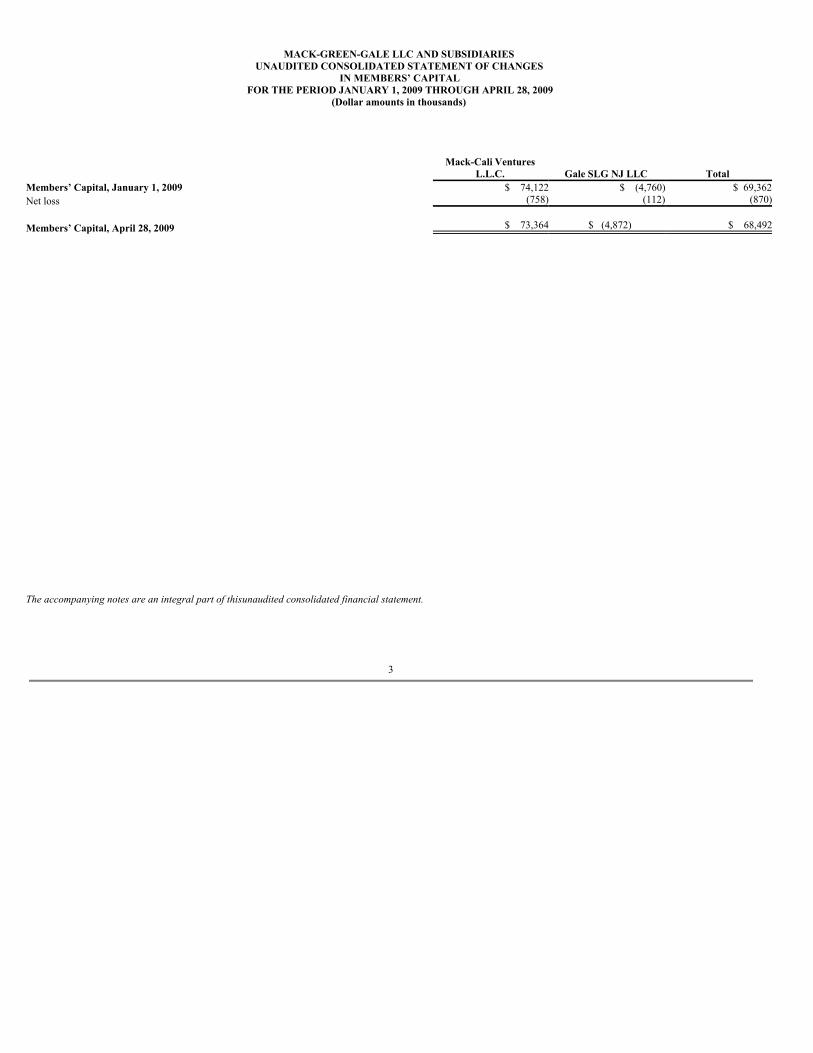
MACK-GREEN-GALE LLC AND SUBSIDIARIESUNAUDITED CONSOLIDATED STATEMENT OF CHANGES
IN MEMBERS’ CAPITALFOR THE PERIOD JANUARY 1, 2009 THROUGH APRIL 28, 2009
(Dollar amounts in thousands)
Mack-Cali VenturesL.L.C. Gale SLG NJ LLC Total
Members’ Capital, January 1, 2009 $ 74,122 $ (4,760) $ 69,362Net loss (758) (112) (870)
Members’ Capital, April 28, 2009 $ 73,364
$ (4,872) $ 68,492
The accompanying notes are an integral part of this unaudited consolidated financial statement.
3
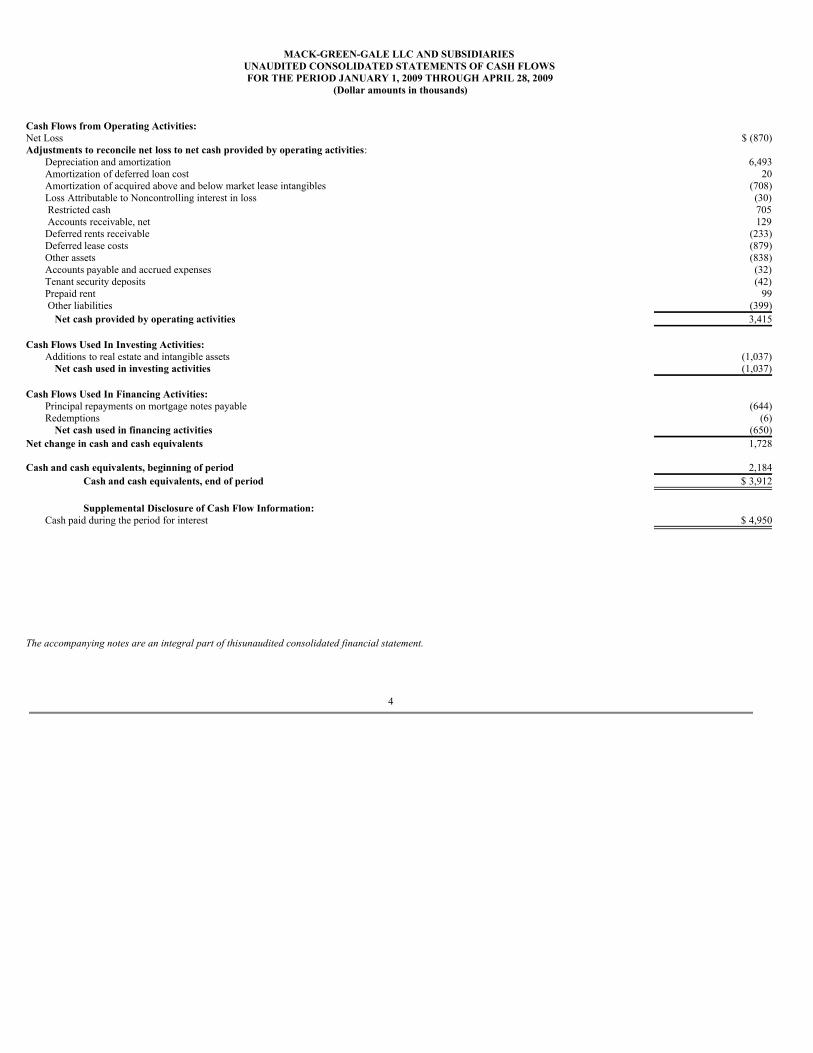
MACK-GREEN-GALE LLC AND SUBSIDIARIESUNAUDITED CONSOLIDATED STATEMENTS OF CASH FLOWSFOR THE PERIOD JANUARY 1, 2009 THROUGH APRIL 28, 2009
(Dollar amounts in thousands)
Cash Flows from Operating Activities: Net Loss $ (870)Adjustments to reconcile net loss to net cash provided by operating activities:
Depreciation and amortization 6,493Amortization of deferred loan cost 20Amortization of acquired above and below market lease intangibles (708)Loss Attributable to Noncontrolling interest in loss (30) Restricted cash 705 Accounts receivable, net 129Deferred rents receivable (233)Deferred lease costs (879)Other assets (838)Accounts payable and accrued expenses (32)Tenant security deposits (42)Prepaid rent 99 Other liabilities (399)
Net cash provided by operating activities 3,415 Cash Flows Used In Investing Activities:
Additions to real estate and intangible assets (1,037)Net cash used in investing activities (1,037)
Cash Flows Used In Financing Activities:
Principal repayments on mortgage notes payable (644)Redemptions (6)
Net cash used in financing activities (650)Net change in cash and cash equivalents 1,728 Cash and cash equivalents, beginning of period 2,184
Cash and cash equivalents, end of period $ 3,912
Supplemental Disclosure of Cash Flow Information:Cash paid during the period for interest
$ 4,950
The accompanying notes are an integral part of this unaudited consolidated financial statement.
4
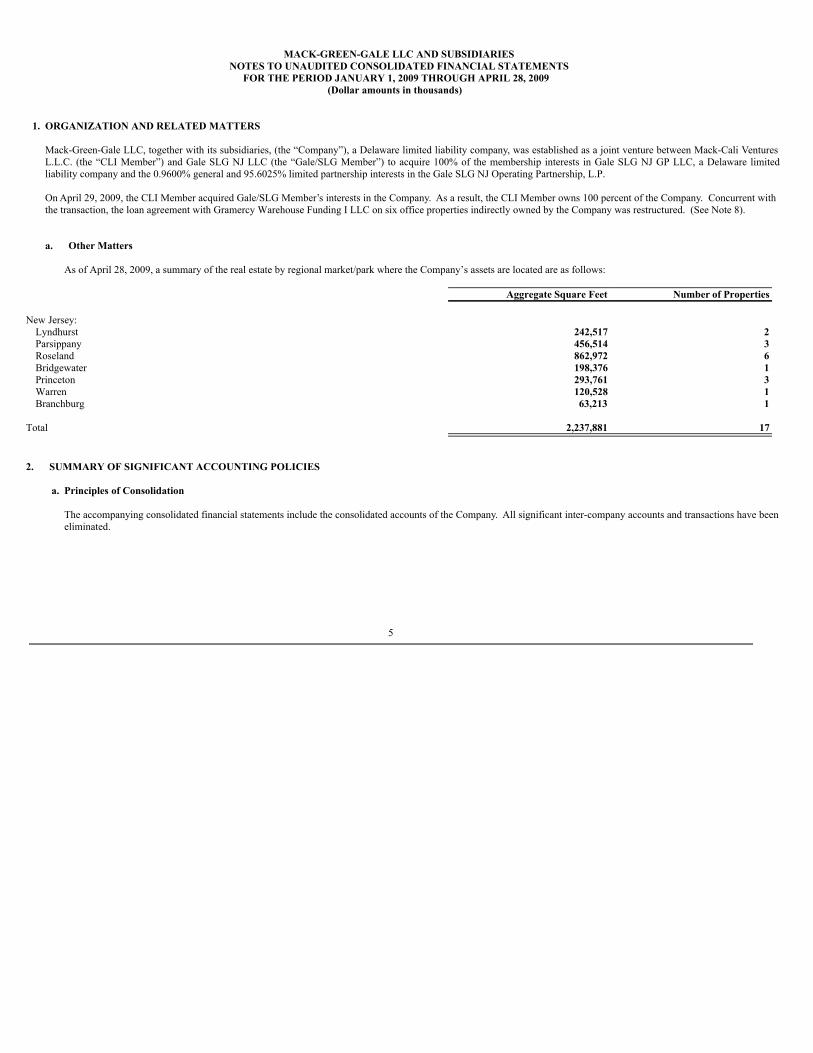
MACK-GREEN-GALE LLC AND SUBSIDIARIESNOTES TO UNAUDITED CONSOLIDATED FINANCIAL STATEMENTS
FOR THE PERIOD JANUARY 1, 2009 THROUGH APRIL 28, 2009(Dollar amounts in thousands)
1. ORGANIZATION AND RELATED MATTERS
Mack-Green-Gale LLC, together with its subsidiaries, (the “Company”), a Delaware limited liability company, was established as a joint venture between Mack-Cali VenturesL.L.C. (the “CLI Member”) and Gale SLG NJ LLC (the “Gale/SLG Member”) to acquire 100% of the membership interests in Gale SLG NJ GP LLC, a Delaware limitedliability company and the 0.9600% general and 95.6025% limited partnership interests in the Gale SLG NJ Operating Partnership, L.P.
On April 29, 2009, the CLI Member acquired Gale/SLG Member’s interests in the Company. As a result, the CLI Member owns 100 percent of the Company. Concurrent withthe transaction, the loan agreement with Gramercy Warehouse Funding I LLC on six office properties indirectly owned by the Company was restructured. (See Note 8).
a. Other Matters
As of April 28, 2009, a summary of the real estate by regional market/park where the Company’s assets are located are as follows:
Aggregate Square Feet Number of Properties New Jersey:
Lyndhurst 242,517 2Parsippany 456,514 3Roseland 862,972 6Bridgewater 198,376 1Princeton 293,761 3Warren 120,528 1Branchburg 63,213 1
Total 2,237,881 17
2. SUMMARY OF SIGNIFICANT ACCOUNTING POLICIES
a. Principles of Consolidation
The accompanying consolidated financial statements include the consolidated accounts of the Company. All significant inter-company accounts and transactions have beeneliminated.
5
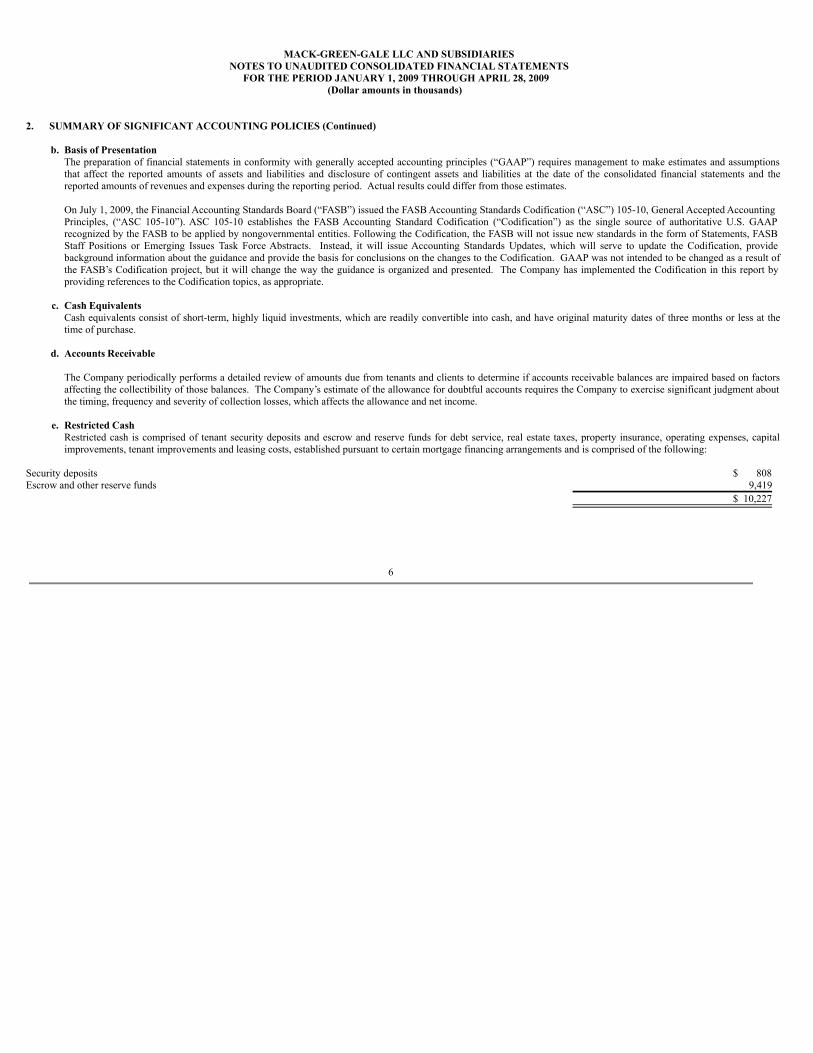
MACK-GREEN-GALE LLC AND SUBSIDIARIESNOTES TO UNAUDITED CONSOLIDATED FINANCIAL STATEMENTS
FOR THE PERIOD JANUARY 1, 2009 THROUGH APRIL 28, 2009(Dollar amounts in thousands)
2. SUMMARY OF SIGNIFICANT ACCOUNTING POLICIES (Continued)
b. Basis of PresentationThe preparation of financial statements in conformity with generally accepted accounting principles (“GAAP”) requires management to make estimates and assumptionsthat affect the reported amounts of assets and liabilities and disclosure of contingent assets and liabilities at the date of the consolidated financial statements and thereported amounts of revenues and expenses during the reporting period. Actual results could differ from those estimates.
On July 1, 2009, the Financial Accounting Standards Board (“FASB”) issued the FASB Accounting Standards Codification (“ASC”) 105-10, General Accepted AccountingPrinciples, (“ASC 105-10”). ASC 105-10 establishes the FASB Accounting Standard Codification (“Codification”) as the single source of authoritative U.S. GAAPrecognized by the FASB to be applied by nongovernmental entities. Following the Codification, the FASB will not issue new standards in the form of Statements, FASBStaff Positions or Emerging Issues Task Force Abstracts. Instead, it will issue Accounting Standards Updates, which will serve to update the Codification, providebackground information about the guidance and provide the basis for conclusions on the changes to the Codification. GAAP was not intended to be changed as a result ofthe FASB’s Codification project, but it will change the way the guidance is organized and presented. The Company has implemented the Codification in this report byproviding references to the Codification topics, as appropriate.
c. Cash EquivalentsCash equivalents consist of short-term, highly liquid investments, which are readily convertible into cash, and have original maturity dates of three months or less at thetime of purchase.
d. Accounts Receivable
The Company periodically performs a detailed review of amounts due from tenants and clients to determine if accounts receivable balances are impaired based on factorsaffecting the collectibility of those balances. The Company’s estimate of the allowance for doubtful accounts requires the Company to exercise significant judgment aboutthe timing, frequency and severity of collection losses, which affects the allowance and net income.
e. Restricted CashRestricted cash is comprised of tenant security deposits and escrow and reserve funds for debt service, real estate taxes, property insurance, operating expenses, capitalimprovements, tenant improvements and leasing costs, established pursuant to certain mortgage financing arrangements and is comprised of the following:
Security deposits $ 808Escrow and other reserve funds 9,419 $ 10,227
6
MACK-GREEN-GALE LLC AND SUBSIDIARIESNOTES TO UNAUDITED CONSOLIDATED FINANCIAL STATEMENTS
FOR THE PERIOD JANUARY 1, 2009 THROUGH APRIL 28, 2009(Dollar amounts in thousands)
2. SUMMARY OF SIGNIFICANT ACCOUNTING POLICIES (Continued)
f. Rental Properties and Intangible Assets
The Company assesses the fair value of acquired assets (including land, buildings and improvements, and identified intangibles such as above and below market leases andacquired in-place leases) and acquired liabilities in accordance with ASC 805, Business Combinations, and allocates the purchase price based on these assessments. TheCompany assesses fair value based on estimated cash flow projections that utilize appropriate discount and capitalization rates and available market information. Estimatesof future cash flows are based on a number of factors including the historical operating results, known trends, and market/economic conditions that may affect the property.
The cost of maintenance and repairs is charged to expense as incurred. Depreciation is computed on a straight-line basis over the estimated useful lives of the assets asfollows:
Buildings and improvements 40 yearsLand improvements 15 yearsTenant improvements Lesser of lease term or estimated useful lifeFurniture, fixtures and equipment 5-7 years
Above and below market lease values for acquired properties are recorded based on the present value (using a discount rate which reflects the risks associated with theleases acquired) of the difference between (i) the contractual amounts to be paid pursuant to each in place lease and (ii) management’s estimate of the fair market lease ratesfor each corresponding in-place lease, measured over a period equal to the remaining term of the lease. The capitalized above and below market lease values are amortizedas a reduction or addition to base rental revenue over the remaining term of the respective leases.
Other intangible assets acquired include amounts for the in-place lease values which are based on management’s evaluation of the specific characteristics of each tenant’slease. Factors considered by management in its analysis of in-place lease values include an estimate of carrying costs during the hypothetical expected time it would takemanagement to find a tenant to lease the space for the existing lease term (a “lease-up period”) considering current market conditions, and costs to execute similarleases. Management estimates carrying costs, including such factors as real estate taxes, insurance and other operating expenses during the expected lease-up period,considering current market conditions. In estimating costs to execute similar leases, management considers leasing commissions, legal and other related expenses. Thevalue of in-place leases is amortized to expense over the remaining initial terms of the respective leases.
7
MACK-GREEN-GALE LLC AND SUBSIDIARIESNOTES TO UNAUDITED CONSOLIDATED FINANCIAL STATEMENTS
FOR THE PERIOD JANUARY 1, 2009 THROUGH APRIL 28, 2009(Dollar amounts in thousands)
2. SUMMARY OF SIGNIFICANT ACCOUNTING POLICIES (Continued)
f. Rental Properties and Intangible Assets (continued)
The Company reviews real estate and the related intangible assets for impairment whenever events or changes in circumstances indicate that the carrying value of assets tobe held and used may not be recoverable. In performing the review for recoverability of carrying value of property held for use, estimates are made of the futureundiscounted cash flows from each of the properties during the period the property will be held and upon its eventual disposition. If the expected future undiscounted cashflows are less than the carrying value of such property, an impairment charge is recognized resulting in a write-down of the carrying value of the property to an amountbased on its fair value.
Property held for sale is reported at the lower of its carrying amount or its estimated fair value less costs to sell. Once property is held for sale, depreciation expense is nolonger recorded. The operations of the property held for sale or property which has been sold are reported in discontinued operations in the accompanying consolidatedstatement of operations and assets and liabilities attributable to property held for sale are classified separately in the consolidated balance sheet.
For property to be disposed of, an impairment charge is recognized when the fair value of the property, less the estimated costs to sell, is less than the carrying amount ofthe property measured at the time the Company makes a commitment to sell the property.
g. Other Assets
Deferred lease costs consist of commissions paid on leases, inducements paid to tenants and other costs directly attributable to acquiring and effectuating lease agreements,all of which are capitalized and amortized using the straight-line method over the lives of the related lease terms.
Deferred financing costs consist of fees and costs incurred to obtain financing and are amortized over the terms of the respective agreement. Unamortized deferred financingcosts are expensed when the associated debt is retired prior to maturity.
h. Revenue and Profit Recognition
Rental revenue is recognized on a straight-line basis over the non-cancelable term of the lease. The excess of rents so recognized over amounts contractually due pursuant tothe underlying leases is included in other assets on the accompanying consolidated balance sheet.
Sales of real estate assets are recognized at closing subject to the receipt of adequate down payment and the meeting of other requirements in accordance with applicableaccounting guidelines.
8
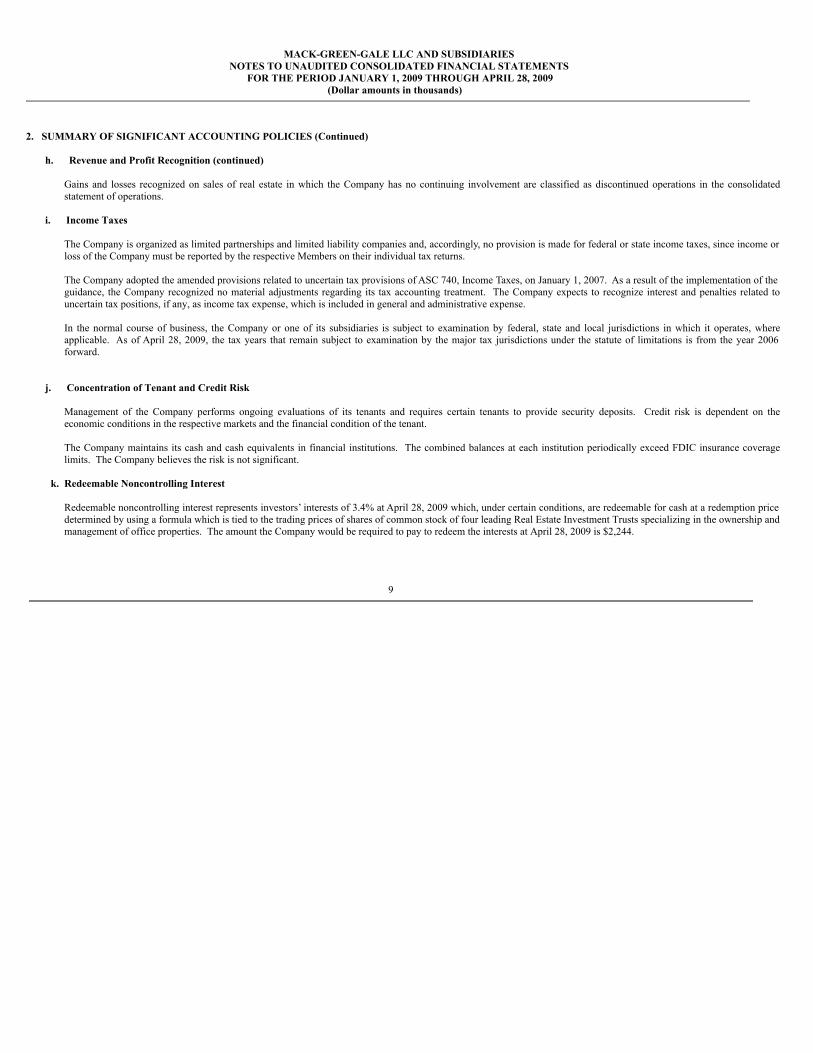
MACK-GREEN-GALE LLC AND SUBSIDIARIESNOTES TO UNAUDITED CONSOLIDATED FINANCIAL STATEMENTS
FOR THE PERIOD JANUARY 1, 2009 THROUGH APRIL 28, 2009(Dollar amounts in thousands)
2. SUMMARY OF SIGNIFICANT ACCOUNTING POLICIES (Continued)
h. Revenue and Profit Recognition (continued)
Gains and losses recognized on sales of real estate in which the Company has no continuing involvement are classified as discontinued operations in the consolidatedstatement of operations.
i. Income Taxes
The Company is organized as limited partnerships and limited liability companies and, accordingly, no provision is made for federal or state income taxes, since income orloss of the Company must be reported by the respective Members on their individual tax returns.
The Company adopted the amended provisions related to uncertain tax provisions of ASC 740, Income Taxes, on January 1, 2007. As a result of the implementation of theguidance, the Company recognized no material adjustments regarding its tax accounting treatment. The Company expects to recognize interest and penalties related touncertain tax positions, if any, as income tax expense, which is included in general and administrative expense.
In the normal course of business, the Company or one of its subsidiaries is subject to examination by federal, state and local jurisdictions in which it operates, whereapplicable. As of April 28, 2009, the tax years that remain subject to examination by the major tax jurisdictions under the statute of limitations is from the year 2006forward.
j. Concentration of Tenant and Credit Risk
Management of the Company performs ongoing evaluations of its tenants and requires certain tenants to provide security deposits. Credit risk is dependent on theeconomic conditions in the respective markets and the financial condition of the tenant.
The Company maintains its cash and cash equivalents in financial institutions. The combined balances at each institution periodically exceed FDIC insurance coveragelimits. The Company believes the risk is not significant.
k. Redeemable Noncontrolling Interest
Redeemable noncontrolling interest represents investors’ interests of 3.4% at April 28, 2009 which, under certain conditions, are redeemable for cash at a redemption pricedetermined by using a formula which is tied to the trading prices of shares of common stock of four leading Real Estate Investment Trusts specializing in the ownership andmanagement of office properties. The amount the Company would be required to pay to redeem the interests at April 28, 2009 is $2,244.
9
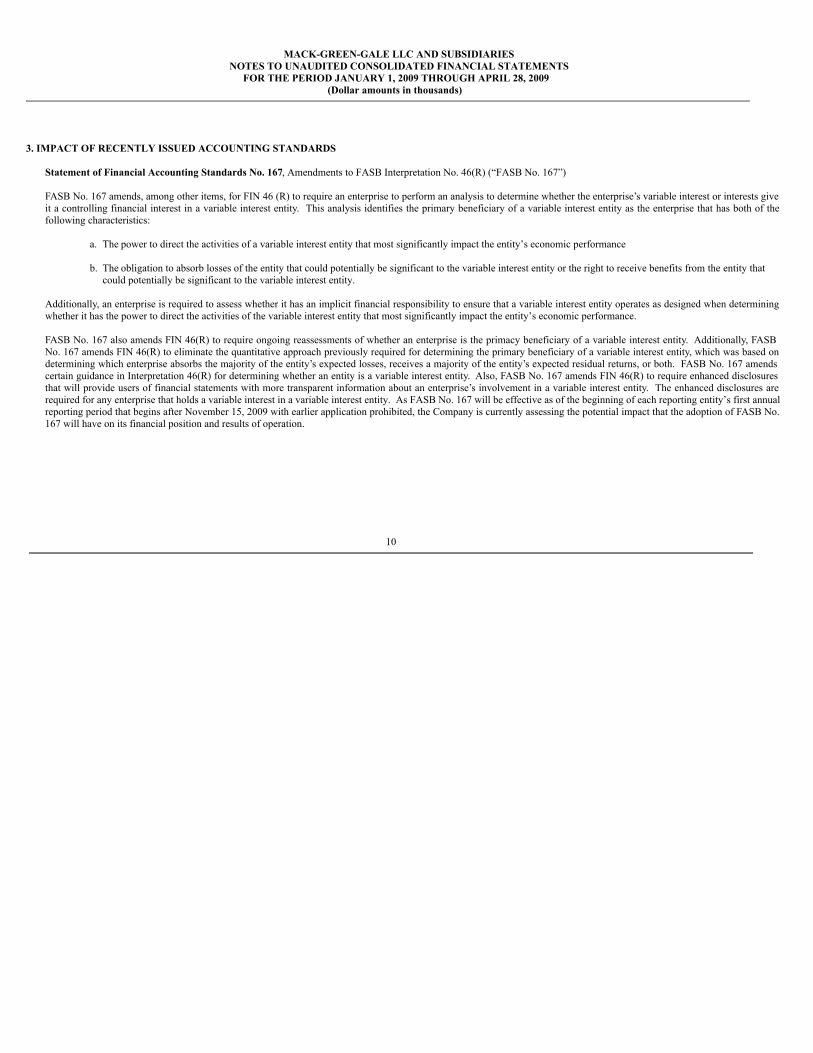
MACK-GREEN-GALE LLC AND SUBSIDIARIESNOTES TO UNAUDITED CONSOLIDATED FINANCIAL STATEMENTS
FOR THE PERIOD JANUARY 1, 2009 THROUGH APRIL 28, 2009(Dollar amounts in thousands)
3. IMPACT OF RECENTLY ISSUED ACCOUNTING STANDARDS
Statement of Financial Accounting Standards No. 167, Amendments to FASB Interpretation No. 46(R) (“FASB No. 167”)
FASB No. 167 amends, among other items, for FIN 46 (R) to require an enterprise to perform an analysis to determine whether the enterprise’s variable interest or interests giveit a controlling financial interest in a variable interest entity. This analysis identifies the primary beneficiary of a variable interest entity as the enterprise that has both of thefollowing characteristics:
a. The power to direct the activities of a variable interest entity that most significantly impact the entity’s economic performance
b. The obligation to absorb losses of the entity that could potentially be significant to the variable interest entity or the right to receive benefits from the entity thatcould potentially be significant to the variable interest entity.
Additionally, an enterprise is required to assess whether it has an implicit financial responsibility to ensure that a variable interest entity operates as designed when determiningwhether it has the power to direct the activities of the variable interest entity that most significantly impact the entity’s economic performance.
FASB No. 167 also amends FIN 46(R) to require ongoing reassessments of whether an enterprise is the primacy beneficiary of a variable interest entity. Additionally, FASBNo. 167 amends FIN 46(R) to eliminate the quantitative approach previously required for determining the primary beneficiary of a variable interest entity, which was based ondetermining which enterprise absorbs the majority of the entity’s expected losses, receives a majority of the entity’s expected residual returns, or both. FASB No. 167 amendscertain guidance in Interpretation 46(R) for determining whether an entity is a variable interest entity. Also, FASB No. 167 amends FIN 46(R) to require enhanced disclosuresthat will provide users of financial statements with more transparent information about an enterprise’s involvement in a variable interest entity. The enhanced disclosures arerequired for any enterprise that holds a variable interest in a variable interest entity. As FASB No. 167 will be effective as of the beginning of each reporting entity’s first annualreporting period that begins after November 15, 2009 with earlier application prohibited, the Company is currently assessing the potential impact that the adoption of FASB No.167 will have on its financial position and results of operation.
10
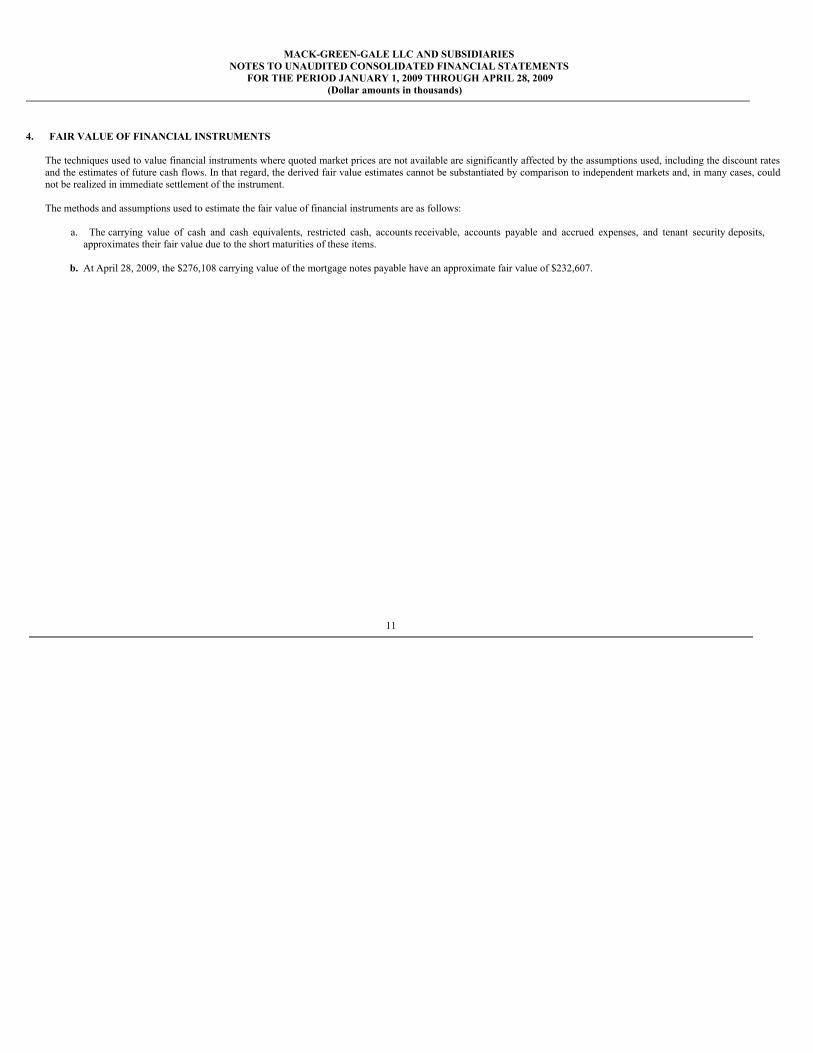
MACK-GREEN-GALE LLC AND SUBSIDIARIESNOTES TO UNAUDITED CONSOLIDATED FINANCIAL STATEMENTS
FOR THE PERIOD JANUARY 1, 2009 THROUGH APRIL 28, 2009(Dollar amounts in thousands)
4. FAIR VALUE OF FINANCIAL INSTRUMENTS
The techniques used to value financial instruments where quoted market prices are not available are significantly affected by the assumptions used, including the discount ratesand the estimates of future cash flows. In that regard, the derived fair value estimates cannot be substantiated by comparison to independent markets and, in many cases, couldnot be realized in immediate settlement of the instrument.
The methods and assumptions used to estimate the fair value of financial instruments are as follows:
a. The carrying value of cash and cash equivalents, restricted cash, accounts receivable, accounts payable and accrued expenses, and tenant security deposits,approximates their fair value due to the short maturities of these items.
b. At April 28, 2009, the $276,108 carrying value of the mortgage notes payable have an approximate fair value of $232,607.
11
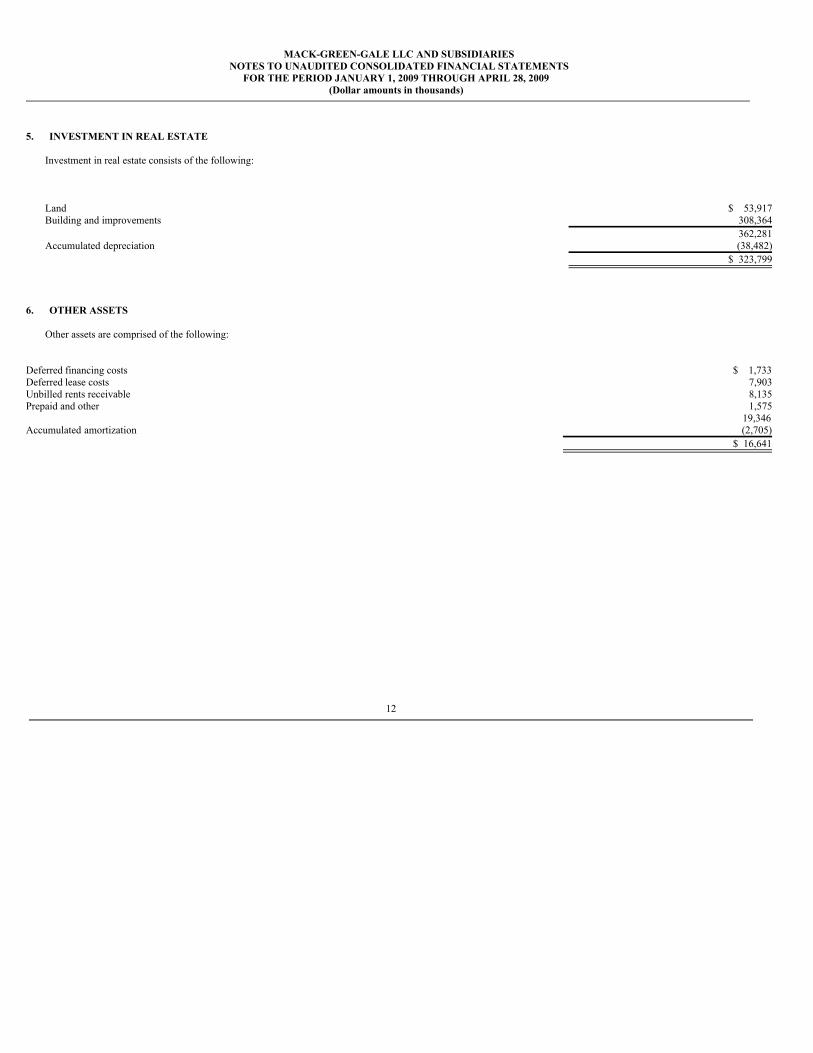
MACK-GREEN-GALE LLC AND SUBSIDIARIESNOTES TO UNAUDITED CONSOLIDATED FINANCIAL STATEMENTS
FOR THE PERIOD JANUARY 1, 2009 THROUGH APRIL 28, 2009 (Dollar amounts in thousands)
5. INVESTMENT IN REAL ESTATE
Investment in real estate consists of the following:
Land $ 53,917Building and improvements 308,364 362,281Accumulated depreciation (38,482)
$ 323,799
6. OTHER ASSETS
Other assets are comprised of the following:
Deferred financing costs $ 1,733Deferred lease costs 7,903Unbilled rents receivable 8,135Prepaid and other 1,575 19,346Accumulated amortization (2,705) $ 16,641
12
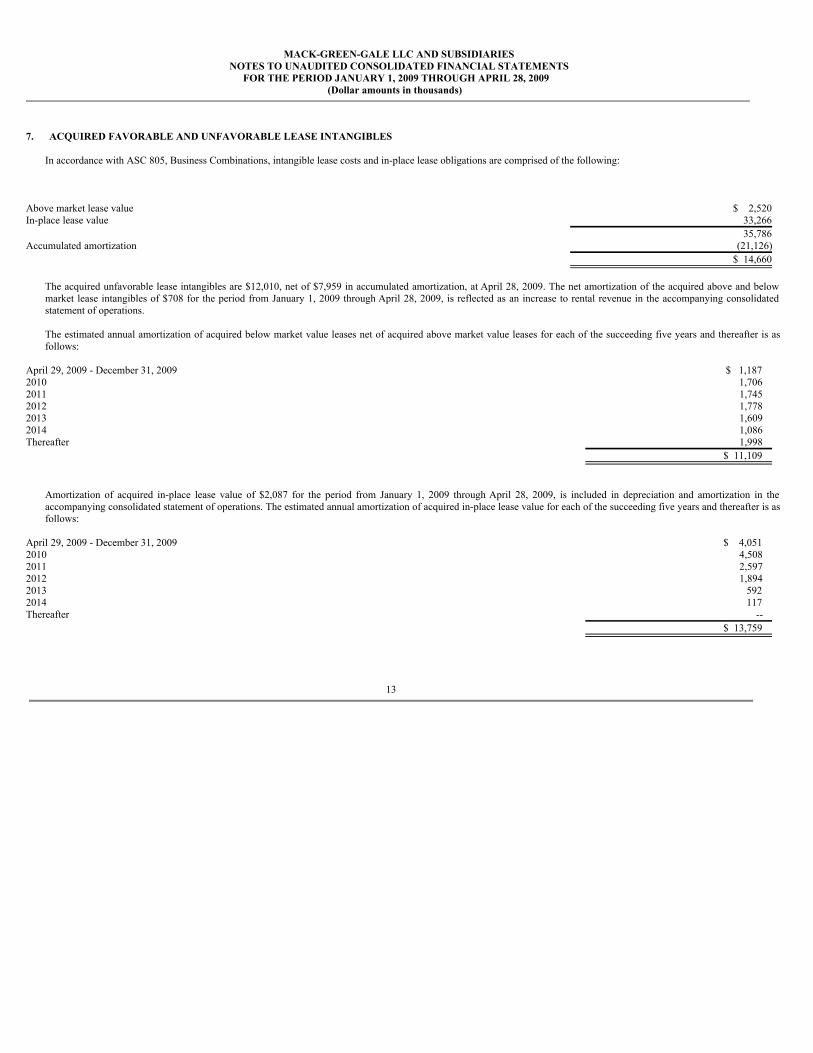
MACK-GREEN-GALE LLC AND SUBSIDIARIESNOTES TO UNAUDITED CONSOLIDATED FINANCIAL STATEMENTS
FOR THE PERIOD JANUARY 1, 2009 THROUGH APRIL 28, 2009(Dollar amounts in thousands)
7. ACQUIRED FAVORABLE AND UNFAVORABLE LEASE INTANGIBLES
In accordance with ASC 805, Business Combinations, intangible lease costs and in-place lease obligations are comprised of the following:
Above market lease value $ 2,520In-place lease value 33,266 35,786Accumulated amortization (21,126) $ 14,660
The acquired unfavorable lease intangibles are $12,010, net of $7,959 in accumulated amortization, at April 28, 2009. The net amortization of the acquired above and belowmarket lease intangibles of $708 for the period from January 1, 2009 through April 28, 2009, is reflected as an increase to rental revenue in the accompanying consolidatedstatement of operations.
The estimated annual amortization of acquired below market value leases net of acquired above market value leases for each of the succeeding five years and thereafter is asfollows:
April 29, 2009 - December 31, 2009 $ 1,1872010 1,7062011 1,7452012 1,7782013 1,6092014 1,086Thereafter 1,998 $ 11,109
Amortization of acquired in-place lease value of $2,087 for the period from January 1, 2009 through April 28, 2009, is included in depreciation and amortization in theaccompanying consolidated statement of operations. The estimated annual amortization of acquired in-place lease value for each of the succeeding five years and thereafter is asfollows:
April 29, 2009 - December 31, 2009 $ 4,0512010 4,5082011 2,5972012 1,8942013 5922014 117Thereafter -- $ 13,759
13
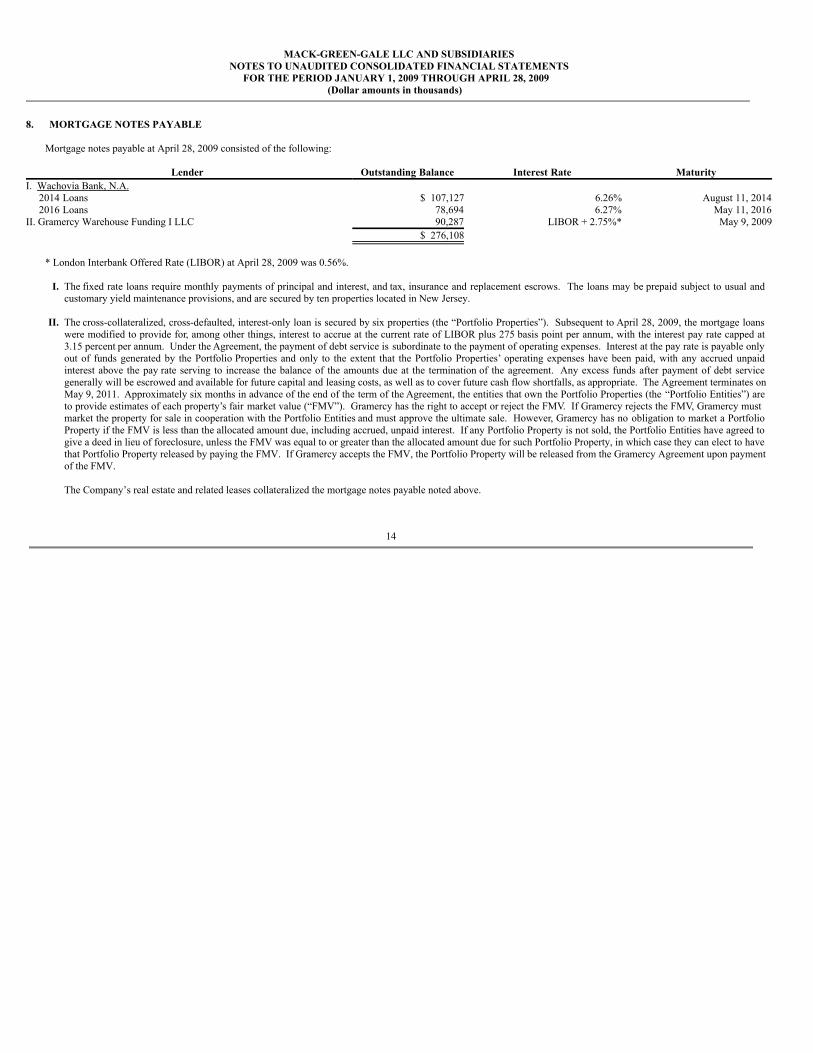
MACK-GREEN-GALE LLC AND SUBSIDIARIESNOTES TO UNAUDITED CONSOLIDATED FINANCIAL STATEMENTS
FOR THE PERIOD JANUARY 1, 2009 THROUGH APRIL 28, 2009(Dollar amounts in thousands)
8. MORTGAGE NOTES PAYABLE
Mortgage notes payable at April 28, 2009 consisted of the following:
Lender Outstanding Balance Interest Rate MaturityI. Wachovia Bank, N.A. 2014 Loans $ 107,127 6.26% August 11, 2014 2016 Loans 78,694 6.27% May 11, 2016II. Gramercy Warehouse Funding I LLC 90,287 LIBOR + 2.75%* May 9, 2009 $ 276,108
* London Interbank Offered Rate (LIBOR) at April 28, 2009 was 0.56%.
I. The fixed rate loans require monthly payments of principal and interest, and tax, insurance and replacement escrows. The loans may be prepaid subject to usual andcustomary yield maintenance provisions, and are secured by ten properties located in New Jersey.
II. The cross-collateralized, cross-defaulted, interest-only loan is secured by six properties (the “Portfolio Properties”). Subsequent to April 28, 2009, the mortgage loanswere modified to provide for, among other things, interest to accrue at the current rate of LIBOR plus 275 basis point per annum, with the interest pay rate capped at3.15 percent per annum. Under the Agreement, the payment of debt service is subordinate to the payment of operating expenses. Interest at the pay rate is payable onlyout of funds generated by the Portfolio Properties and only to the extent that the Portfolio Properties’ operating expenses have been paid, with any accrued unpaidinterest above the pay rate serving to increase the balance of the amounts due at the termination of the agreement. Any excess funds after payment of debt servicegenerally will be escrowed and available for future capital and leasing costs, as well as to cover future cash flow shortfalls, as appropriate. The Agreement terminates onMay 9, 2011. Approximately six months in advance of the end of the term of the Agreement, the entities that own the Portfolio Properties (the “Portfolio Entities”) areto provide estimates of each property’s fair market value (“FMV”). Gramercy has the right to accept or reject the FMV. If Gramercy rejects the FMV, Gramercy mustmarket the property for sale in cooperation with the Portfolio Entities and must approve the ultimate sale. However, Gramercy has no obligation to market a PortfolioProperty if the FMV is less than the allocated amount due, including accrued, unpaid interest. If any Portfolio Property is not sold, the Portfolio Entities have agreed togive a deed in lieu of foreclosure, unless the FMV was equal to or greater than the allocated amount due for such Portfolio Property, in which case they can elect to havethat Portfolio Property released by paying the FMV. If Gramercy accepts the FMV, the Portfolio Property will be released from the Gramercy Agreement upon paymentof the FMV.
The Company’s real estate and related leases collateralized the mortgage notes payable noted above.
14
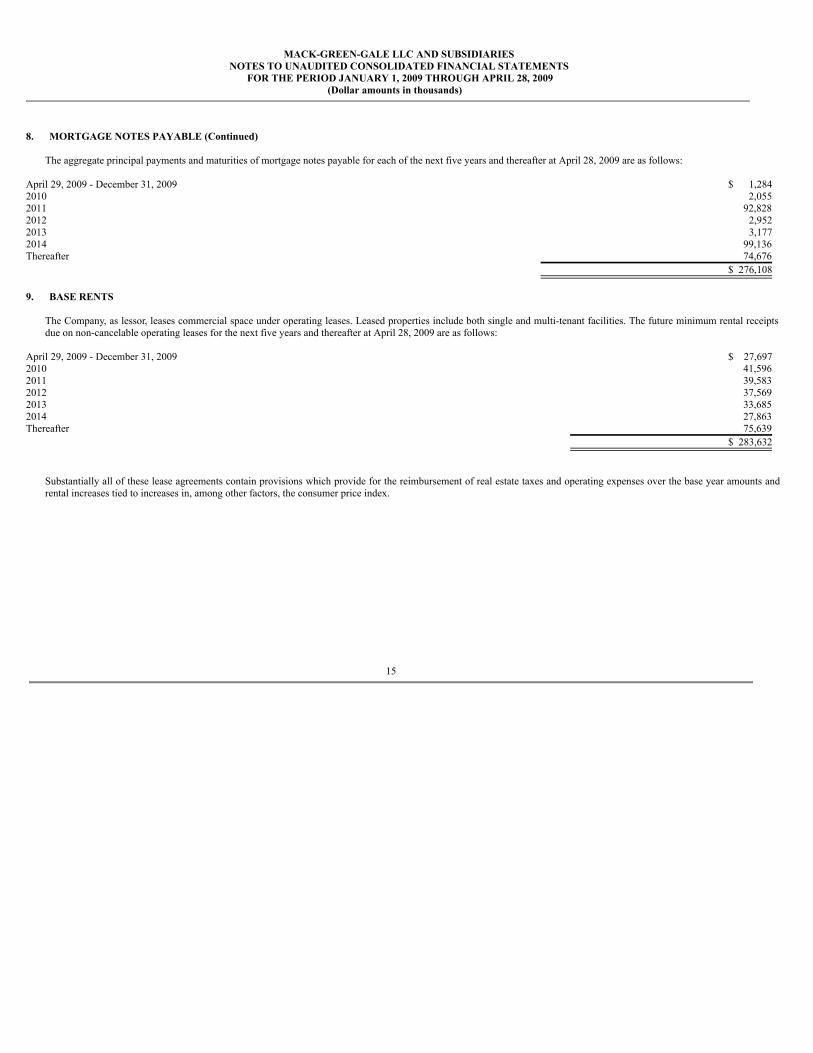
MACK-GREEN-GALE LLC AND SUBSIDIARIESNOTES TO UNAUDITED CONSOLIDATED FINANCIAL STATEMENTS
FOR THE PERIOD JANUARY 1, 2009 THROUGH APRIL 28, 2009(Dollar amounts in thousands)
8. MORTGAGE NOTES PAYABLE (Continued)
The aggregate principal payments and maturities of mortgage notes payable for each of the next five years and thereafter at April 28, 2009 are as follows:
April 29, 2009 - December 31, 2009 $ 1,2842010 2,0552011 92,8282012 2,9522013 3,1772014 99,136Thereafter 74,676 $ 276,108
9. BASE RENTS
The Company, as lessor, leases commercial space under operating leases. Leased properties include both single and multi-tenant facilities. The future minimum rental receiptsdue on non-cancelable operating leases for the next five years and thereafter at April 28, 2009 are as follows:
April 29, 2009 - December 31, 2009 $ 27,6972010 41,5962011 39,5832012 37,5692013 33,6852014 27,863Thereafter 75,639 $ 283,632
Substantially all of these lease agreements contain provisions which provide for the reimbursement of real estate taxes and operating expenses over the base year amounts andrental increases tied to increases in, among other factors, the consumer price index.
15
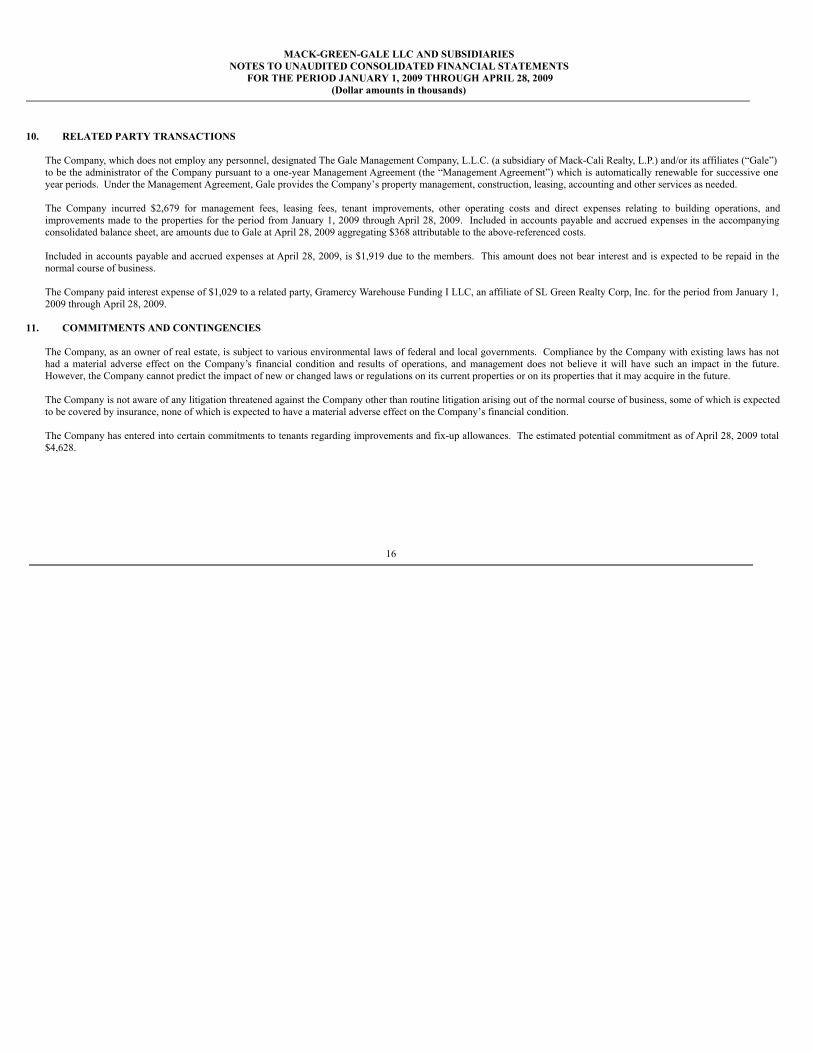
MACK-GREEN-GALE LLC AND SUBSIDIARIESNOTES TO UNAUDITED CONSOLIDATED FINANCIAL STATEMENTS
FOR THE PERIOD JANUARY 1, 2009 THROUGH APRIL 28, 2009(Dollar amounts in thousands)
10. RELATED PARTY TRANSACTIONS
The Company, which does not employ any personnel, designated The Gale Management Company, L.L.C. (a subsidiary of Mack-Cali Realty, L.P.) and/or its affiliates (“Gale”)to be the administrator of the Company pursuant to a one-year Management Agreement (the “Management Agreement”) which is automatically renewable for successive oneyear periods. Under the Management Agreement, Gale provides the Company’s property management, construction, leasing, accounting and other services as needed.
The Company incurred $2,679 for management fees, leasing fees, tenant improvements, other operating costs and direct expenses relating to building operations, andimprovements made to the properties for the period from January 1, 2009 through April 28, 2009. Included in accounts payable and accrued expenses in the accompanyingconsolidated balance sheet, are amounts due to Gale at April 28, 2009 aggregating $368 attributable to the above-referenced costs.
Included in accounts payable and accrued expenses at April 28, 2009, is $1,919 due to the members. This amount does not bear interest and is expected to be repaid in thenormal course of business.
The Company paid interest expense of $1,029 to a related party, Gramercy Warehouse Funding I LLC, an affiliate of SL Green Realty Corp, Inc. for the period from January 1,2009 through April 28, 2009.
11. COMMITMENTS AND CONTINGENCIES
The Company, as an owner of real estate, is subject to various environmental laws of federal and local governments. Compliance by the Company with existing laws has nothad a material adverse effect on the Company’s financial condition and results of operations, and management does not believe it will have such an impact in the future.However, the Company cannot predict the impact of new or changed laws or regulations on its current properties or on its properties that it may acquire in the future.
The Company is not aware of any litigation threatened against the Company other than routine litigation arising out of the normal course of business, some of which is expectedto be covered by insurance, none of which is expected to have a material adverse effect on the Company’s financial condition.
The Company has entered into certain commitments to tenants regarding improvements and fix-up allowances. The estimated potential commitment as of April 28, 2009 total$4,628.
16


