Richard Szabó Óbuda University, Galamb József Special College H-1081 Budapest Népszínház str. 8. HUNGARY [email protected]
Abstract: ThePVGO of the share prices shows the investors future hope, also the trust in the market. If the global trends are changed, then nedd to valuated the theoretical thesis by the practice. Let’s look the BSE blue chips behavior since January 2011.
Keywords: investors behaviors, share, stock market, PVGO, Budapest Stock Exchange
1 Introduction
Following the theories the PVGO (Present Value of Growing Opportunity) of the shares should be described the investors future hope in the stock exchange, what is the nearest model of the total competitive market. The last two year can be described as a turbulent enviroment. Let see, what happened then in the Budapest Stock Exchange, in the A categhory section.
First will be described the basic theory of share valuation. Second will be analysed the actual period. In the third part can be made the conclusions.
2 Theoretical background
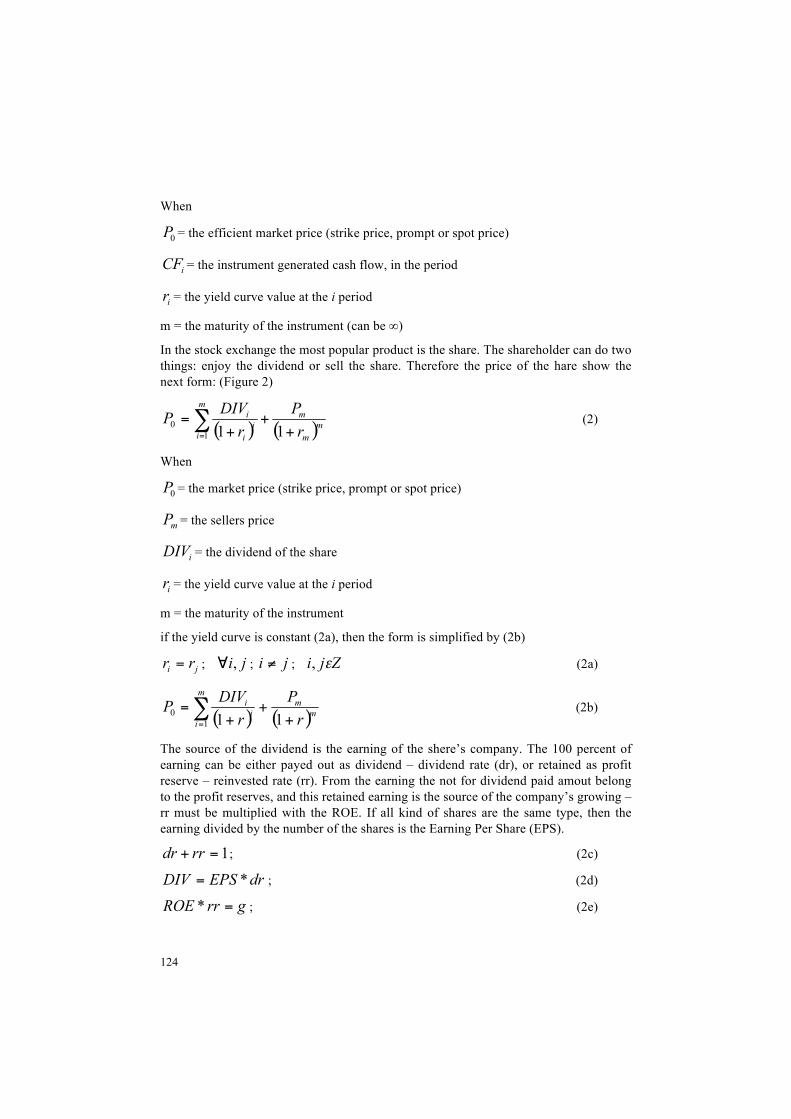
All kind of financial intrumet prices weel be calculeted by the same form: the price is equal by the present value of the generated cash flow (Figure 1.)
= the efficient market price (strike price, prompt or spot price)
= the instrument generated cash flow, in the period
= the yield curve value at the i period
m = the maturity of the instrument (can be ∞)
In the stock exchange the most popular product is the share. The shareholder can do two things: enjoy the dividend or sell the share. Therefore the price of the hare show the next form: (Figure 2)
(2)
When
= the market price (strike price, prompt or spot price)
= the sellers price
= the dividend of the share
= the yield curve value at the i period
m = the maturity of the instrument
if the yield curve is constant (2a), then the form is simplified by (2b)
; ; ; (2a)
(2b)
The source of the dividend is the earning of the shere’s company. The 100 percent of earning can be either payed out as dividend – dividend rate (dr), or retained as profit reserve – reinvested rate (rr). From the earning the not for dividend paid amout belong to the profit reserves, and this retained earning is the source of the company’s growing – rr must be multiplied with the ROE. If all kind of shares are the same type, then the earning divided by the number of the shares is the Earning Per Share (EPS).
; (2c)
; (2d)
; (2e)
125
If all years the dividend are the same, or has a same growing rate (g) then – used the growing perpetuity form – the price of the share can described by the form (3)
(3)
The shares price can be described by one non – growing part and the Present Value of the Growing Opportunity (PVGO)
(4)
These (3) and (4) figures will be used by the following analysis. First step we know the P(0) as the actual market price, the DIV from the annual report, and the g from the form (2e) based also by the annual report. From the form (3) we coul be calculated the r, and this r can be used in the form (4) to discover the PVGO.
2 Practical part: “A category” shares of the BSE
In this part let’s try to look during fourteen shares, what was happened in the Budapest Stock Exchange from 01. January 2010. The selected items belongs to the “A category” shares.
Any Állami Nyomda (State Printing House Plc) Appennin Appeninn Vagyonkezelő Holding NyRT
CIGPANNONIA CIG Pannonia Life Insurance Plc. EGIS EGIS Pharmaceuticals Plc E-STAR E-Star Alternative Energy Service Plc FHB FHB Mortgage Bank Co Plc. MOL MOL Hungarian Oil and Gas Plc Mtelekom Magyar Telekom Telecommunications Plc OTP OTP Bank Plc Panergy PannErgy Rába RÁBA Automotive Group Richter Chemical Works of Gedeon Richter Plc TVK Tisza Chemical Group Plc Zwack Zwack Unicum
Sheet 1 The blue chips of the BSE 2012
126
2.1 Fundamental background of the BSE’s selected shares
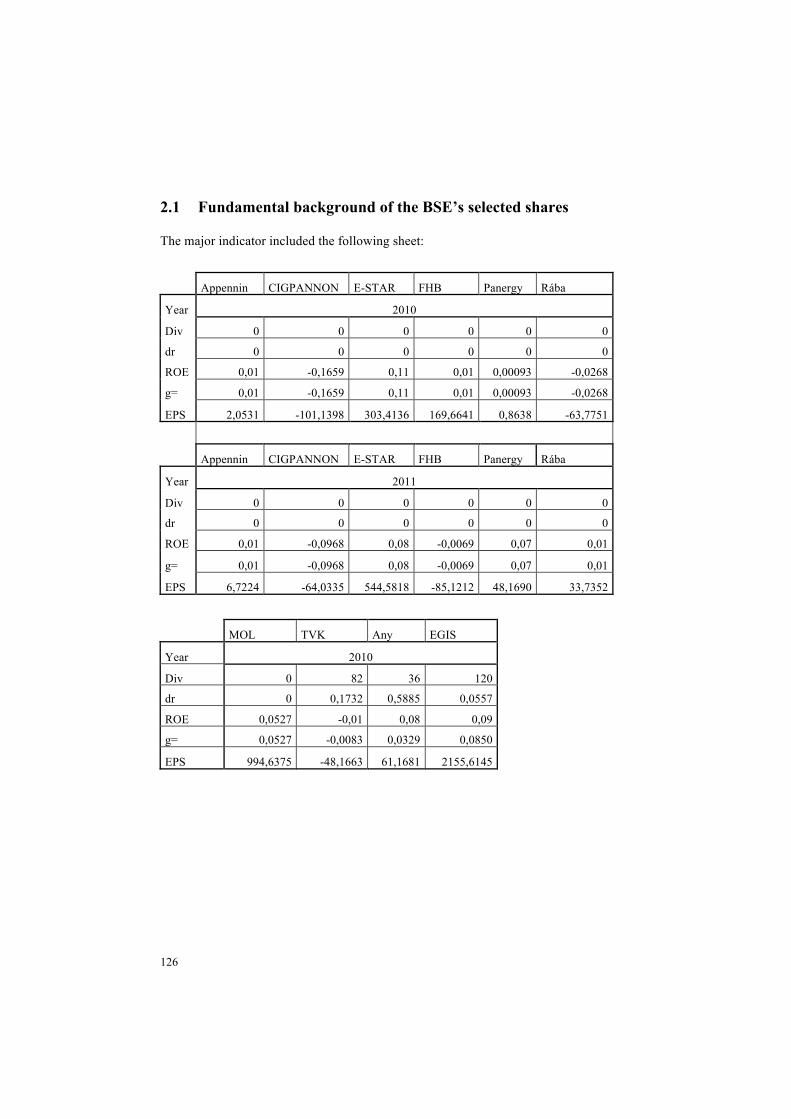
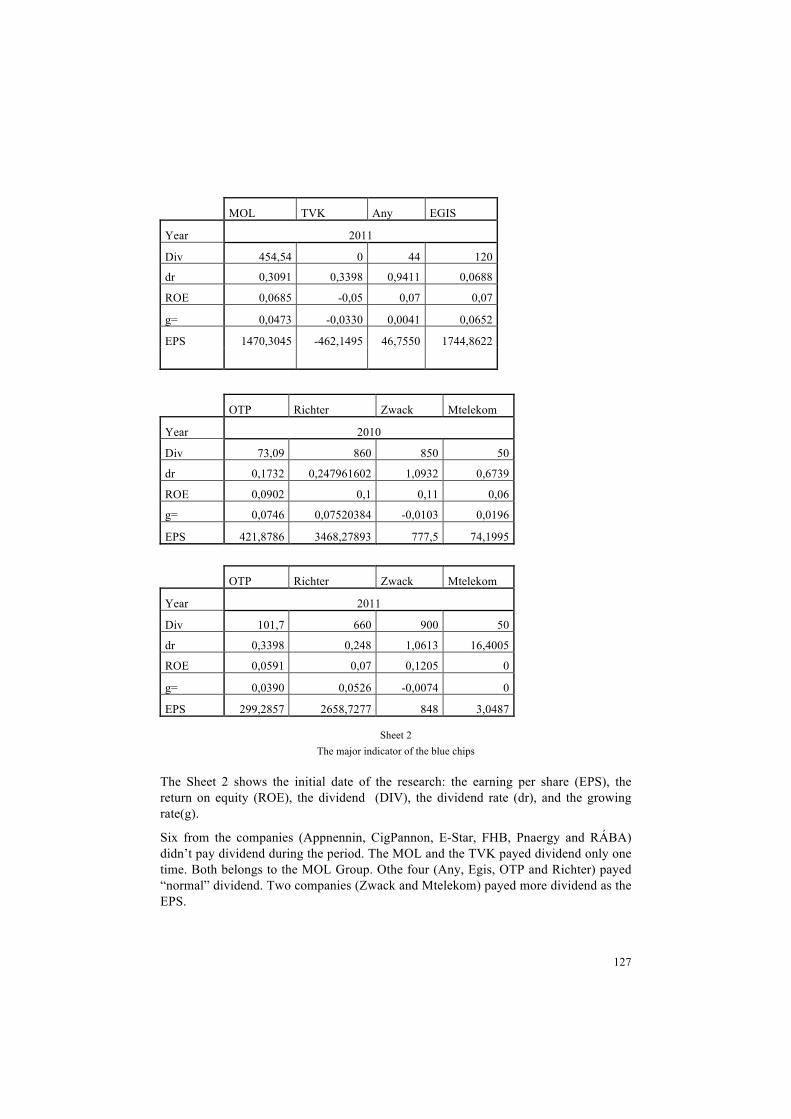
The Sheet 2 shows the initial date of the research: the earning per share (EPS), the return on equity (ROE), the dividend (DIV), the dividend rate (dr), and the growing rate(g).
Six from the companies (Appnennin, CigPannon, E-Star, FHB, Pnaergy and RÁBA) didn’t pay dividend during the period. The MOL and the TVK payed dividend only one time. Both belongs to the MOL Group. Othe four (Any, Egis, OTP and Richter) payed “normal” dividend. Two companies (Zwack and Mtelekom) payed more dividend as the EPS.
128
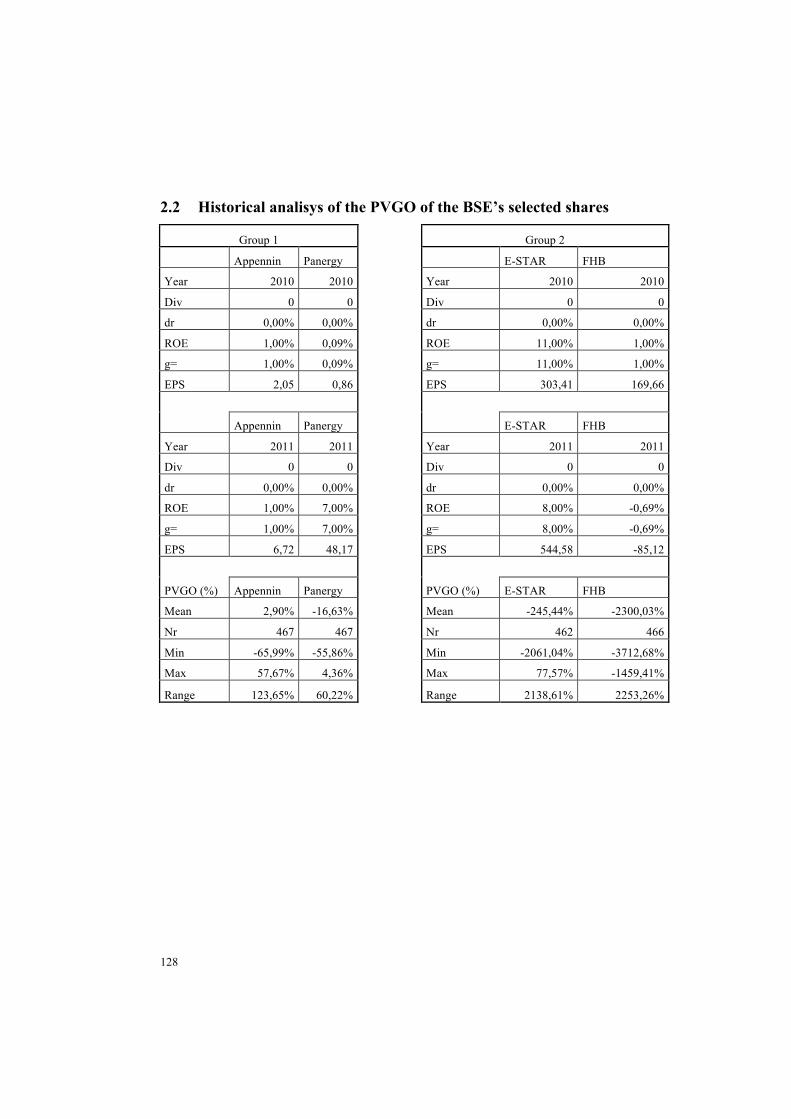
2.2 Historical analisys of the PVGO of the BSE’s selected shares
Group 1 Group 2
Appennin Panergy E-STAR FHB
Year 2010 2010 Year 2010 2010
Div 0 0 Div 0 0
dr 0,00% 0,00% dr 0,00% 0,00%
ROE 1,00% 0,09% ROE 11,00% 1,00%
g= 1,00% 0,09% g= 11,00% 1,00%
EPS 2,05 0,86 EPS 303,41 169,66
Appennin Panergy E-STAR FHB
Year 2011 2011 Year 2011 2011
Div 0 0 Div 0 0
dr 0,00% 0,00% dr 0,00% 0,00%
ROE 1,00% 7,00% ROE 8,00% -0,69%
g= 1,00% 7,00% g= 8,00% -0,69%
EPS 6,72 48,17 EPS 544,58 -85,12
PVGO (%) Appennin Panergy PVGO (%) E-STAR FHB
Mean 2,90% -16,63% Mean -245,44% -2300,03%
Nr 467 467 Nr 462 466
Min -65,99% -55,86% Min -2061,04% -3712,68%
Max 57,67% 4,36% Max 77,57% -1459,41%
Range 123,65% 60,22% Range 2138,61% 2253,26%
129
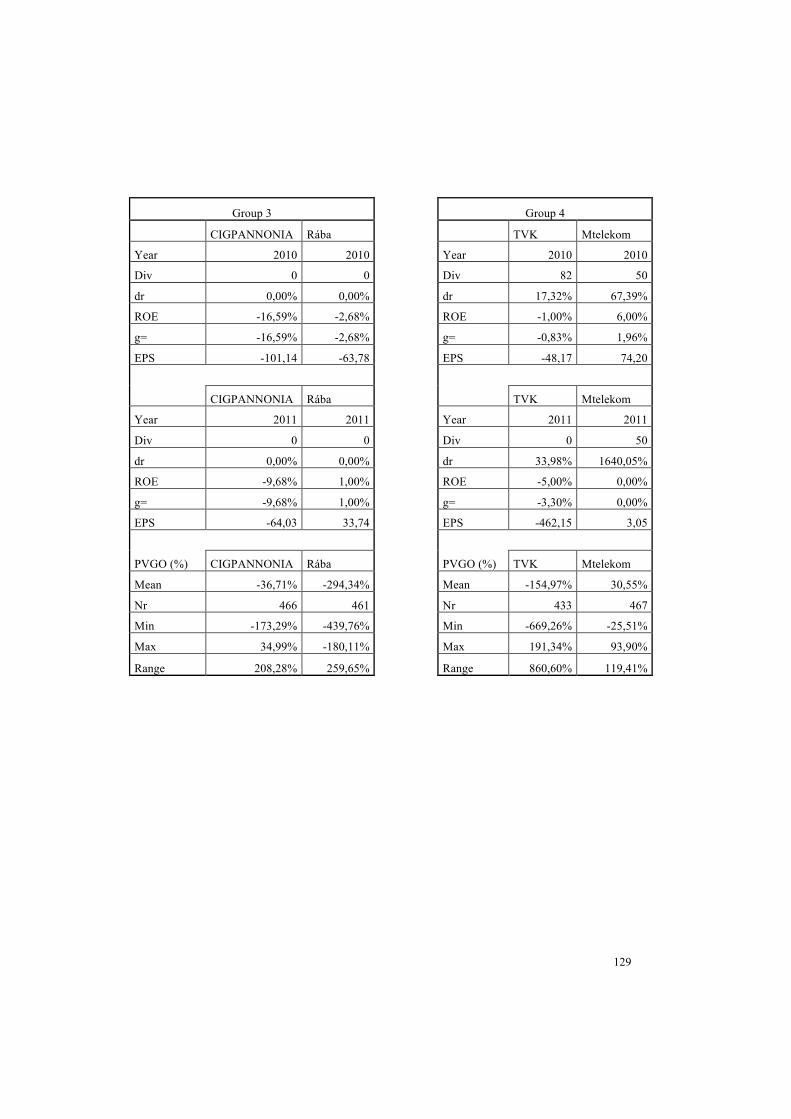
Group 3 Group 4
CIGPANNONIA Rába TVK Mtelekom
Year 2010 2010 Year 2010 2010
Div 0 0 Div 82 50
dr 0,00% 0,00% dr 17,32% 67,39%
ROE -16,59% -2,68% ROE -1,00% 6,00%
g= -16,59% -2,68% g= -0,83% 1,96%
EPS -101,14 -63,78 EPS -48,17 74,20
CIGPANNONIA Rába TVK Mtelekom
Year 2011 2011 Year 2011 2011
Div 0 0 Div 0 50
dr 0,00% 0,00% dr 33,98% 1640,05%
ROE -9,68% 1,00% ROE -5,00% 0,00%
g= -9,68% 1,00% g= -3,30% 0,00%
EPS -64,03 33,74 EPS -462,15 3,05
PVGO (%) CIGPANNONIA Rába PVGO (%) TVK Mtelekom
Mean -36,71% -294,34% Mean -154,97% 30,55%
Nr 466 461 Nr 433 467
Min -173,29% -439,76% Min -669,26% -25,51%
Max 34,99% -180,11% Max 191,34% 93,90%
Range 208,28% 259,65% Range 860,60% 119,41%
130
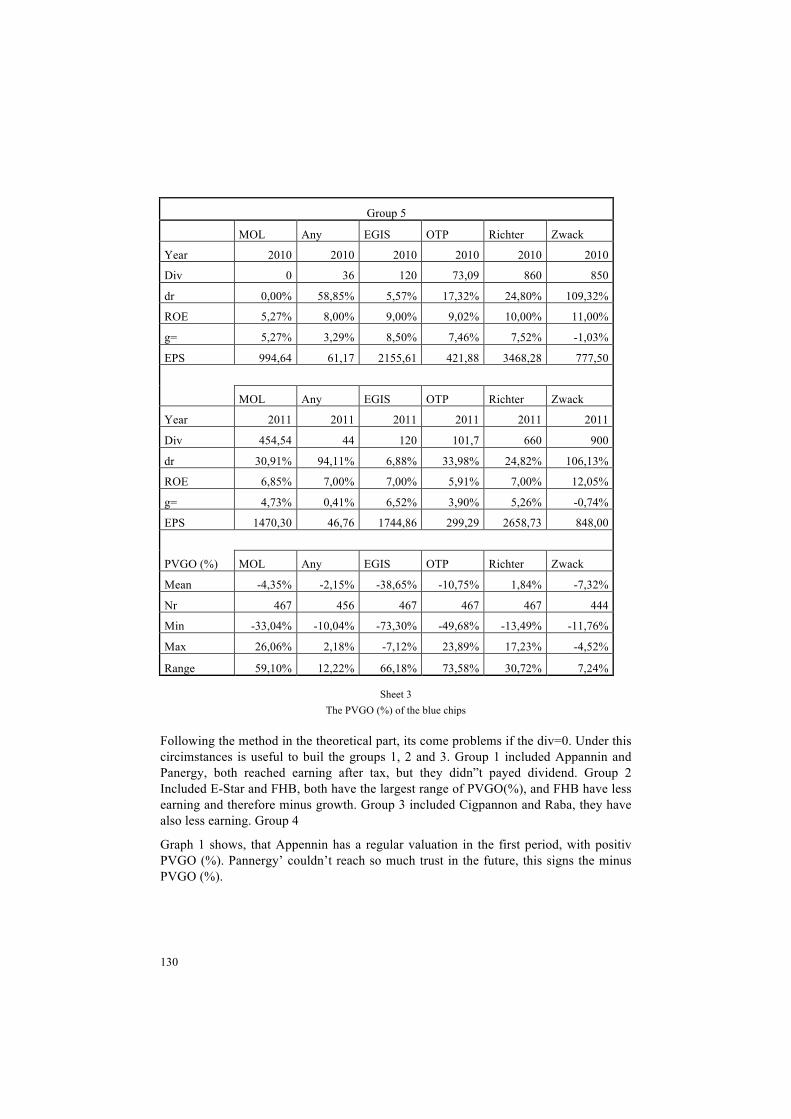
Group 5
MOL Any EGIS OTP Richter Zwack
Year 2010 2010 2010 2010 2010 2010
Div 0 36 120 73,09 860 850
dr 0,00% 58,85% 5,57% 17,32% 24,80% 109,32%
ROE 5,27% 8,00% 9,00% 9,02% 10,00% 11,00%
g= 5,27% 3,29% 8,50% 7,46% 7,52% -1,03%
EPS 994,64 61,17 2155,61 421,88 3468,28 777,50
MOL Any EGIS OTP Richter Zwack
Year 2011 2011 2011 2011 2011 2011
Div 454,54 44 120 101,7 660 900
dr 30,91% 94,11% 6,88% 33,98% 24,82% 106,13%
ROE 6,85% 7,00% 7,00% 5,91% 7,00% 12,05%
g= 4,73% 0,41% 6,52% 3,90% 5,26% -0,74%
EPS 1470,30 46,76 1744,86 299,29 2658,73 848,00
PVGO (%) MOL Any EGIS OTP Richter Zwack
Mean -4,35% -2,15% -38,65% -10,75% 1,84% -7,32%
Nr 467 456 467 467 467 444
Min -33,04% -10,04% -73,30% -49,68% -13,49% -11,76%
Max 26,06% 2,18% -7,12% 23,89% 17,23% -4,52%
Range 59,10% 12,22% 66,18% 73,58% 30,72% 7,24%
Sheet 3 The PVGO (%) of the blue chips
Following the method in the theoretical part, its come problems if the div=0. Under this circimstances is useful to buil the groups 1, 2 and 3. Group 1 included Appannin and Panergy, both reached earning after tax, but they didn”t payed dividend. Group 2 Included E-Star and FHB, both have the largest range of PVGO(%), and FHB have less earning and therefore minus growth. Group 3 included Cigpannon and Raba, they have also less earning. Group 4
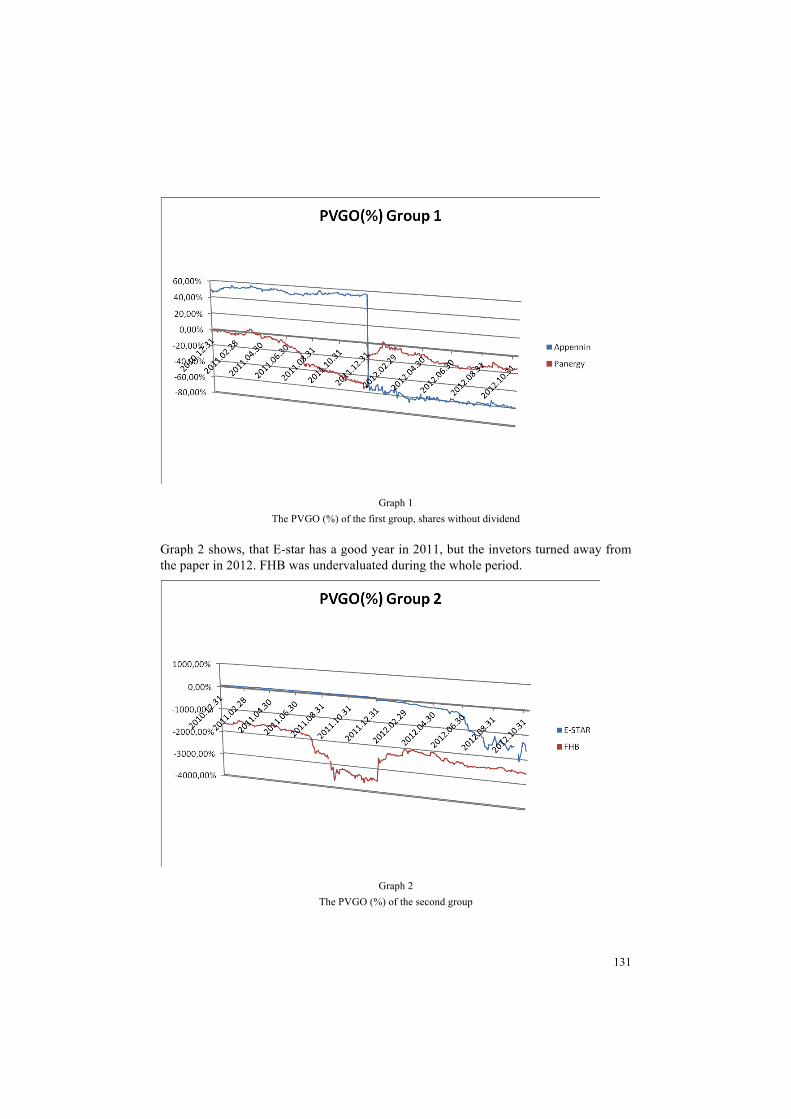
Graph 1 shows, that Appennin has a regular valuation in the first period, with positiv PVGO (%). Pannergy’ couldn’t reach so much trust in the future, this signs the minus PVGO (%).
131
Graph 1 The PVGO (%) of the first group, shares without dividend
Graph 2 shows, that E-star has a good year in 2011, but the invetors turned away from the paper in 2012. FHB was undervaluated during the whole period.
Graph 2 The PVGO (%) of the second group
132
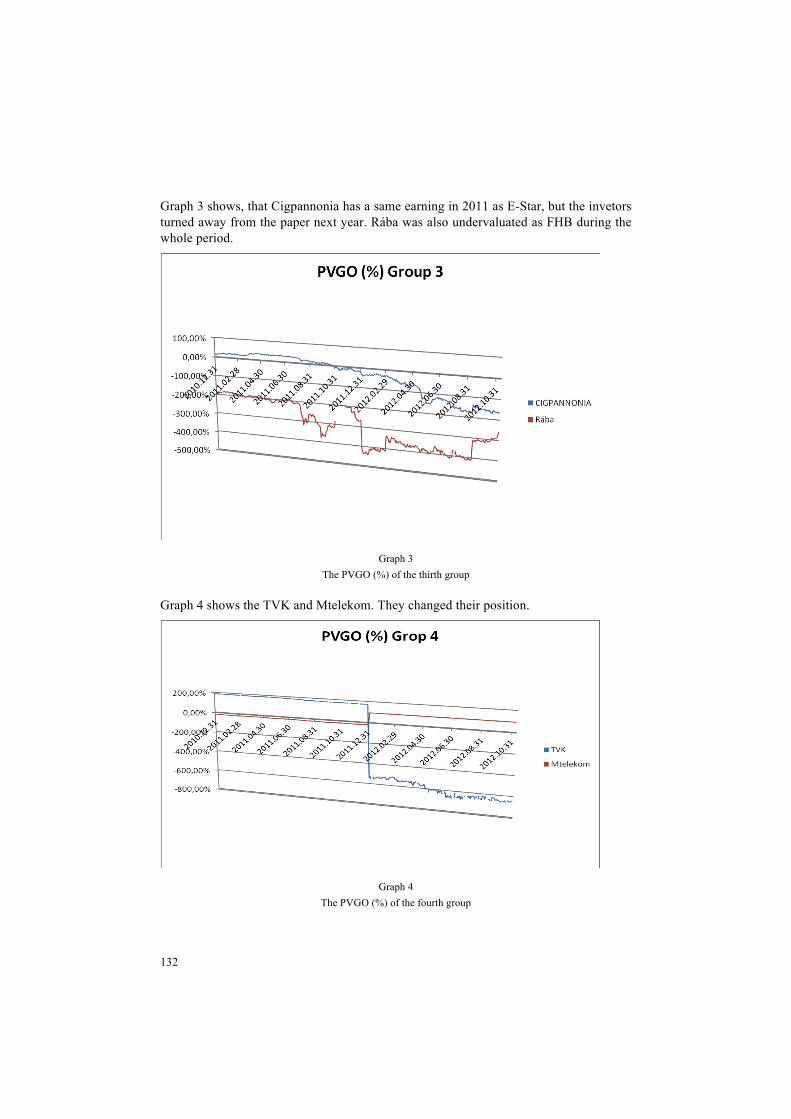
Graph 3 shows, that Cigpannonia has a same earning in 2011 as E-Star, but the invetors turned away from the paper next year. Rába was also undervaluated as FHB during the whole period.
Graph 3 The PVGO (%) of the thirth group
Graph 4 shows the TVK and Mtelekom. They changed their position.
Graph 4 The PVGO (%) of the fourth group
133
In 2011 TVK payed a dividend, under minus earning, they used the profit reserve. TVK has both years minus earning. For Mtelekom was 2011 a regular period, but in 2011 they payed more dividend as the EPS.
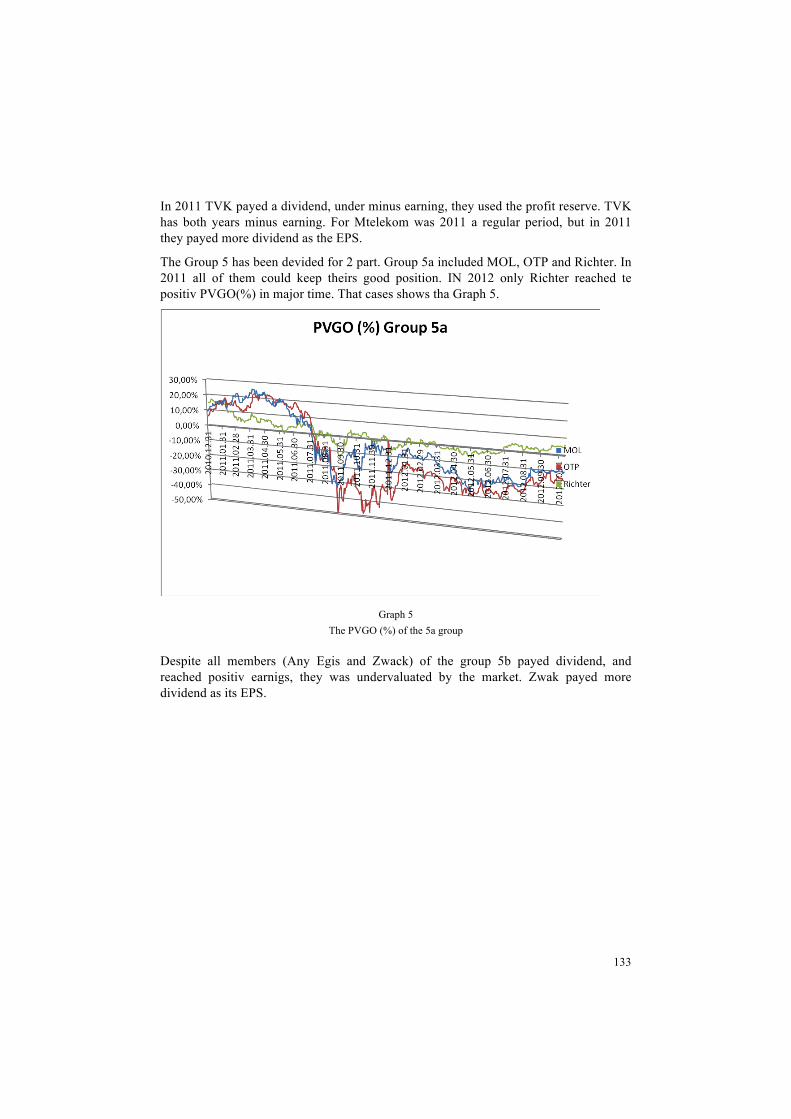
The Group 5 has been devided for 2 part. Group 5a included MOL, OTP and Richter. In 2011 all of them could keep theirs good position. IN 2012 only Richter reached te positiv PVGO(%) in major time. That cases shows tha Graph 5.
Graph 5 The PVGO (%) of the 5a group
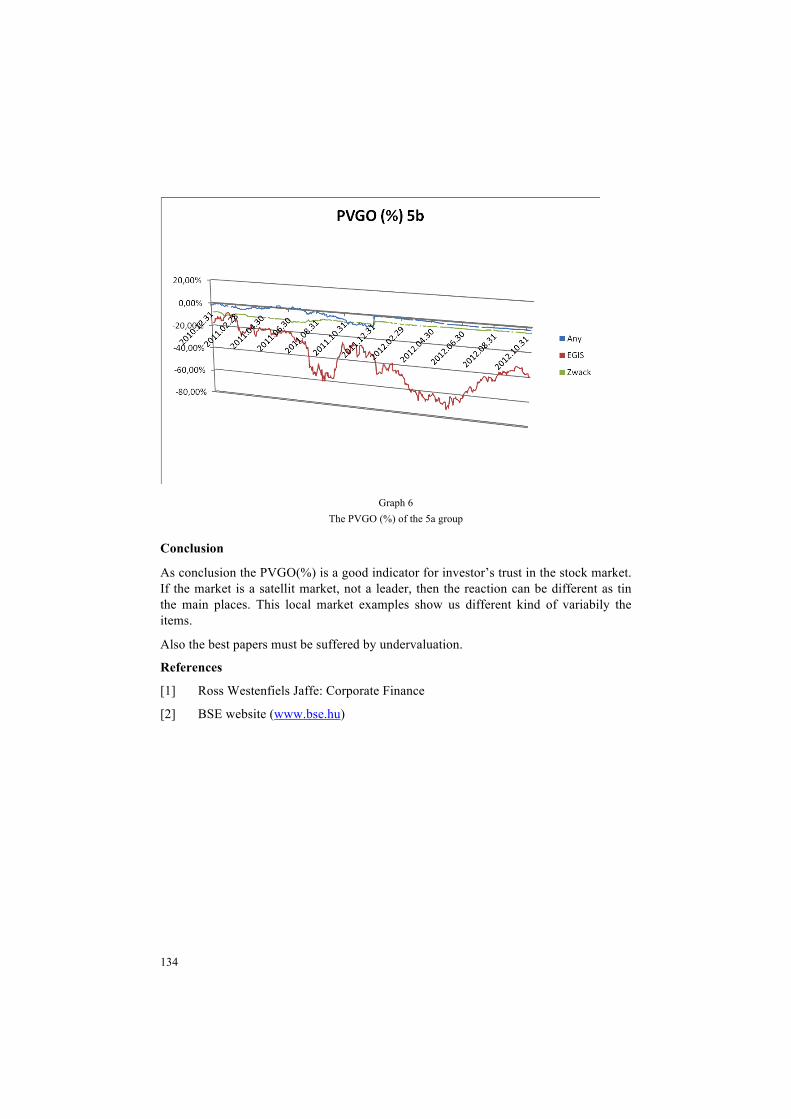
Despite all members (Any Egis and Zwack) of the group 5b payed dividend, and reached positiv earnigs, they was undervaluated by the market. Zwak payed more dividend as its EPS.
134
Graph 6 The PVGO (%) of the 5a group
Conclusion
As conclusion the PVGO(%) is a good indicator for investor’s trust in the stock market. If the market is a satellit market, not a leader, then the reaction can be different as tin the main places. This local market examples show us different kind of variabily the items.
Also the best papers must be suffered by undervaluation.