
1
A CRITERION FOR BRITTLE FAILURE OF ROCKS
USING THE THEORY OF CRITICAL DISTANCES
by
Jorge Castro (1)(*), Sergio Cicero (2) and César Sagaseta (3)
Department of Ground Engineering and Materials Science
University of Cantabria
Avda. de Los Castros, s/n
39005 Santander, Spain
Tel.: +34 942 201813
Fax: +34 942 201821
e-mail: (1)[email protected] (2)[email protected] (3)[email protected]
(*) Corresponding Author
Date: February 2015
Number of words: 6,100
Number of tables: 2
Number of figures: 18
2
ABSTRACT
This paper presents a new analytical criterion for brittle failure of rocks and heavily
overconsolidated soils. Griffith’s model of a randomly oriented defect under a biaxial
stress state is used to keep the criterion simple. The Griffith’s criterion is improved
because the maximum tensile strength is not evaluated at the boundary of the defect but
at a certain distance from the boundary, known as the critical distance. This fracture
criterion is known as the Point Method, and is part of the Theory of Critical Distances,
which is utilized in fracture mechanics. The proposed failure criterion has two
parameters: the inherent tensile strength, σ0, and the ratio of the half-length of the initial
crack/flaw to the critical distance, a/L. These parameters are difficult to measure but
they may be correlated with the uniaxial compressive and tensile strengths, σc and σt.
The proposed criterion is able to reproduce the common range of strength ratios for
rocks and heavily overconsolidated soils (σc/σt=3-50) and the influence of several
microstructural rock properties, such as texture and porosity. Good agreement with
laboratory tests reported in the literature is found for tensile and low confining stresses.
KEYWORDS: Brittle failure; crack; critical distance; failure criterion; rock strength.
3
NOTATION
a,b Major and minor semi-axes of an elliptical flaw
a Half-length of a crack
m Ratio of minor to major axis of an elliptical flaw
mi Parameter of the Hoek-Brown criterion
n Porosity
r Pearson’s correlation coefficient
t Time
w Moisture content
G Grain size
L Critical distance
b Angle between the direction of the major principal stress and x-axis
σ Normal stress
σt Uniaxial tensile strength
σc Unconfined compressive strength
σ0 Inherent tensile stress
τ Shear stress
Subscripts:
avg Average
max Maximum
1,3 Major and minor principal stresses
x,y Cartesian coordinates
4
r, Polar coordinates
Sign convention:
Compressive stresses are assumed as positive throughout the paper.
5
1. INTRODUCTION
The development of failure criteria is of primary importance in engineering practice.
They are used as simple rules to predict failure in brittle materials or yielding in ductile
materials. Rocks behave as ductile materials at high confining compressive stresses,
while at low confining stresses or under tension, they show brittle failure. The
propagation of cracks, which act as stress risers in the material, leads to rock’s brittle
behaviour. Crack propagation and damage are studied by the theory of fracture
mechanics, which was initiated by Griffith (1921; 1924), focusing on brittle failure of
glass. His work also included the development of a failure criterion, which will be
explained in detail in the next section.
The application of fracture mechanics to rocks historically evolved with that of the
practice of rock mechanics and the ground control challenges arising from deep mining
in South Africa. This required the detailed study of brittle rock failure together with the
development of indirect tests to measure tensile strength and triaxial cells for systematic
rock testing (Hoek 1965; Bieniawski 1967; Jaeger 1967). Since then, fracture mechanics
and its application to rocks has progressed with focus on: different types of cracks
(Bobet 2000), mixed modes of fracture (Shen and Stephansson 1993), fluid pressure,
rock anisotropy, three-dimensional effects, friction between the lips of the crack, crack
density, crack propagation (Kemeny 1991) and crack coalescence (Bobet 1998). Intact
rocks share many common features with unreinforced concrete and, therefore, advances
in the modelling of concrete fracturing (e.g. Karihaloo et al. 1993; Elices et al. 2000;
Bažant 2002) are also relevant. In recent years, numerical approaches (e.g. Ingraffea and
6
Heuzé 1980; Wu and Wong 2012) have benefited from the increase in computing
power. Despite this body of research, the most popular failure criterion for rocks is
probably the Hoek-Brown shear criterion (Hoek and Brown 1980), which is based on
empirical fitting of triaxial test results using an algebraic expression related to Griffith’s
formulation (Hoek 1968), as commented in Section 2 below. The Mohr-Coulomb shear
failure criterion, which employs cohesive and frictional strength components, and a
tension cut-off to model the proper uniaxial tensile strength, is another simple
alternative. There are some other empirical criteria, such as Johnston (1985), with
higher degrees of freedom, i.e. more fitting parameters, and consequently, better
agreement but higher uncertainty in the selection of the fitting parameters. Empirical
criteria are generally used to study shear failure but they may also consider lower
confining stresses, including brittle failure. Therefore, in the case of non-linear criteria,
their curvature is partly caused by the brittle-ductile transition of the material under high
confinement (Paterson and Wong 2005).
Following the general idea of the Griffith’s criterion, some authors have also proposed
advanced micromechanical models (e.g. Baud et al. 2014). The analysis of rock
behaviour at the microscale level helps to understand and explain phenomena at the
macroscopic level. One of the most powerful and recent advances in fracture mechanics
is the development of the Theory of Critical Distances, or TCD (Taylor 2007). This
theory allows an analysis of crack initiation using just stress fields, which is more
convenient in rock mechanics than using energy dissipation concepts or stress intensity
factors. A brief review of this theory is presented in Section 3.

7
In this paper, the theory of critical distances and a micromechanical model similar to
that of Griffith are used to develop a simple failure criterion for brittle failure of rocks
under a low confinement biaxial stress state. This model, despite its simplifying
hypotheses, is theoretically based, uses rock parameters with physical meaning, and
captures quite well the ratio between unconfined compressive strength and uniaxial
tensile stress (σc/σt) observed in brittle rock failure.
2. GRIFFITH’S CRITERION
Griffith (1921; 1924) used thermodynamic concepts to study the growth of a thin crack
due to an applied load. A key aspect of his analysis is that some energy is dissipated
through the development of new crack faces as a crack grows. However, the so-called
Griffith’s criterion for brittle failure does not use those thermodynamic concepts and is
purely based on stresses, i.e. the stress field around an elliptical defect or flaw and the
maximum tensile stress at the defect boundary that is necessary for crack initiation.
Jaeger et al. (2007) clearly explained that, although both approaches are due to Griffith,
they are fundamentally different, as the failure criterion assumes a “critical stress” at the
defect boundary for crack initiation, rather than a criterion based on energy release.
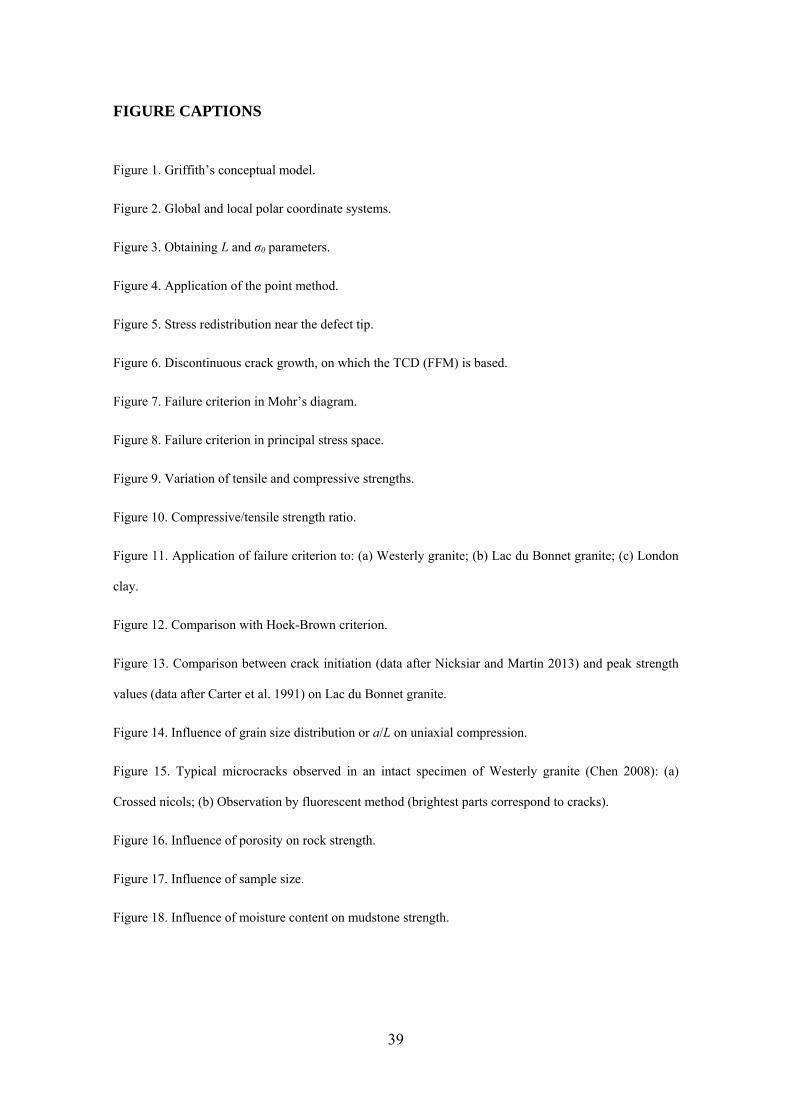
Griffith (1924) used the conceptual model of a material containing a randomly oriented
thin elliptical flaw (Figure 1). This model simplifies the problem to two dimensions,
neglects the interaction between adjacent flaws, and assumes a homogenous elastic
material. It can be shown that very high tensile stresses occur at the boundary of a
suitably oriented thin ellipse, even under compressive stress conditions (e.g. Maugis

8
1992). The selection of an elliptical flaw by Griffith was done to avoid the singularity in
1/√r of the stresses at the tip of an infinitely sharp crack (Sneddon 1946).
The development of the Griffith’s criterion slightly varies depending on the
mathematical treatment of the stresses around the ellipse. For example, Hoek (1968)
follows the original approach and presents the maximum tensile stress as a function of
the normal and shear stresses. A summary of the derivation is given below. Hoek (1968)
uses the local axes of the ellipse (where the x axis is aligned with the major axis; see
Figure 1):
2sin2
2cos2
2cos2
31
3131
3131
xy
y
x
(1)
Using the solution developed by Inglis (1913) for the stresses at the boundary of an
elliptical flaw, assuming that it is very flat, i.e. a very small ratio of the minor to major
axes of the ellipse b/a=m, and neglecting terms of minor importance, the tangential or
hoop stress at the boundary of the elliptical flaw and near its tip is given by the
following approximate expression:
22
2
m
m xyy (2)
where α is the eccentric angle, which is related to the global polar angle, θ’:
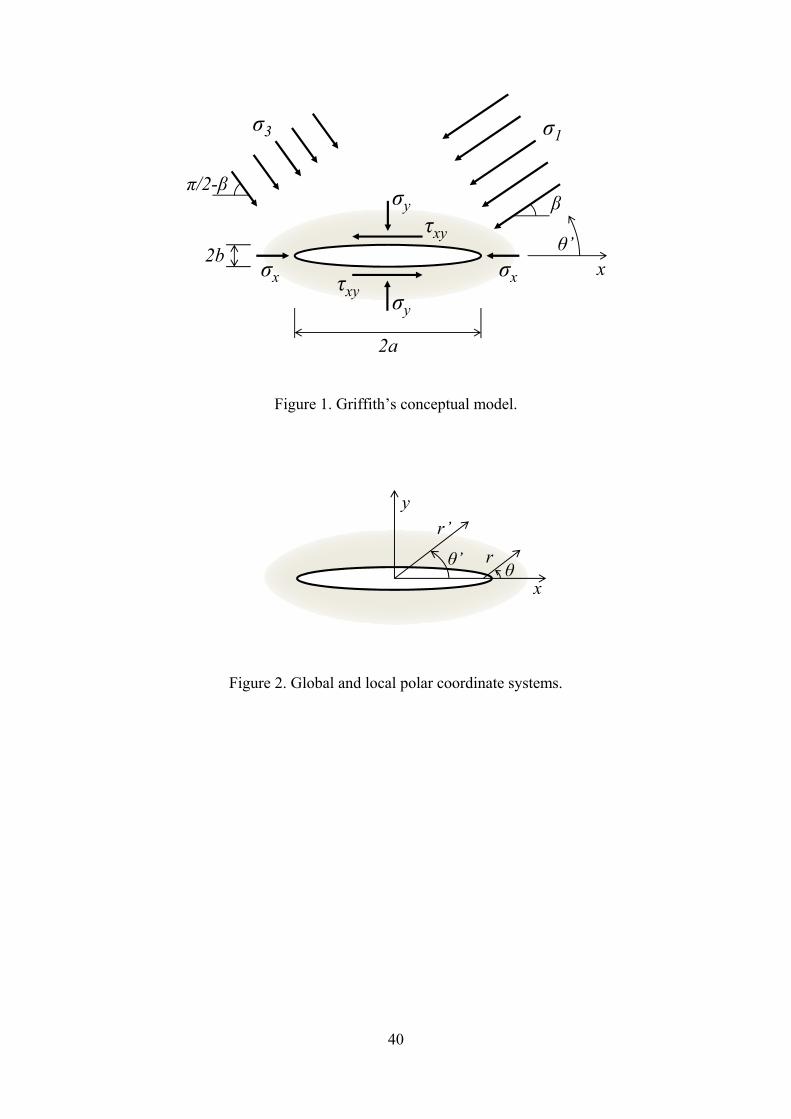
m/'tantan (3)
Note that both a global polar coordinate system, centred at the centre of the elliptical
cavity (r’, θ’), and a local polar coordinate system, centred at the focal point of the
ellipse (r, θ), are used (Figure 2).

9
The value of α, i.e. the coordinate of the point at the cavity boundary and near the tip,
that gives the maximum tensile stress is substituted in Eq. (2):
22max, xyyym (4)
Griffith’s criterion assumes that a crack will initiate from the boundary of the elliptical
flaw when the maximum tensile stress at the boundary (σθ,max, Eq. 4) reaches a limiting
value, which is usually referred to as the local tensile strength of the material
surrounding the elliptical flaw. Furthermore, this crack initiation is identified with
“failure” of the rock. To avoid using the local tensile strength and the axis ratio, m, they
are related to the uniaxial tensile strength, σt, applying Eq. (4) to the case of uniaxial
tension (σy=σt and τxy=0):
tm 2max, (5)
Substituting Eq. (5) into Eq. (4), the equation of the Griffith’s criterion in the Mohr’s
diagram is obtained:
yttxy 42 (6)
Note that, in substituting a numerical value of the uniaxial tensile strength, σt, a negative
sign has to be included in order to satisfy the sign convention adopted in this paper
(compressive stresses are positive).
The Griffith’s criterion may also be expressed in terms of principal stresses:
312
311
31
8,3If
,3If
tt
tt (7)

10
The criterion for crack initiation used in the Griffith’s model has been referred to as the
Maximum Tangential Stress (MTS) criterion and has been used to determine the
direction of crack propagation (Erdogan and Sih 1963). Nevertheless, it has long been
recognised that this criterion requires another length constant to be strictly valid and to
account for “size effects” (e.g. Williams and Ewing 1972; Lajtai 1972; Chang 1981);
i.e. the influence of the absolute size of the defect or elliptical flaw usually called the
critical distance. In the following, the theory of critical distances is briefly presented to
provide the theoretical background of an applicable criterion for fracture initiation based
on the stress field around a defect.
3. THEORY OF CRITICAL DISTANCES
In fracture mechanics, failure criteria may be considered as global or local fracture
criteria (Bao and Jin 1993; Pluvinage 1998). The common example of global criteria is
that used by linear-elastic fracture mechanics (LEFM) for the analysis of cracks, where
failure occurs when the stress intensity factor reaches a critical value, known as fracture
toughness:
ICI KK = (8)
On the contrary, local criteria use the stress value of a single point, line, area or volume
close to the crack tip, but they do not globally consider the stress field through, for
example, KI. Among local criteria, those criteria belonging to the Theory of Critical
Distances (TCD) stand out. The TCD is essentially a group of methodologies, all of
which use a characteristic material length parameter (the critical distance, L) when
performing fracture assessments (Taylor 2007). The origins of the TCD date back to the
middle of the twentieth century with the works of Neuber (1958) and Peterson (1959),
11
but it has been in the last years, driven by the proliferation of finite element stress
analyses, that this theory has been scientifically analysed and applied to: different types
of materials (metals, ceramics, polymers and composites); failure or damage processes
(fracture and fatigue); and conditions (linear-elastic vs. elastoplastic). Examples include
Taylor (2007), Cicero et al. (2012; 2013), Madrazo et al. (2012), Susmel and Taylor
(2010), and Taylor and Wang (2000). Recently, the authors have successfully applied
the TCD to two rock types, namely limestone and granite (Cicero et al. 2014).
The critical distance may be obtained through the following expression:
2
0
1
ICK
L (9)
where KIC is the material fracture toughness and σ0 is a characteristic material strength
parameter named the inherent strength, usually larger than the ultimate tensile strength
(σt), which requires calibration.
Among the different methodologies included within the TCD, two of them are
particularly simple to apply: the Point Method (PM), also known as the Stress Method,
and the Line Method (LM). Both of these are based on the stress field at the defect tip.
Other methodologies, such as Finite Fracture Mechanics (FFM) and the Imaginary
Crack Method are based on the stress intensity factor and their application is not so
straightforward. In any case, as stated by Taylor (2007), the predictions made by all
these methodologies are very similar, so that only the PM and the LM, those with a far
simpler application, will be considered here.
12
The Point Method (PM) is the simplest methodology and it assumes that fracture occurs
when the stress reaches the inherent strength (σ0) at a certain distance (rc) from the crack
tip. Assuming linear-elastic behaviour, then based on the stress field at the crack tip at
failure (Taylor 2007; Anderson 2004) and the definition of L (Eq. (9)), it is
straightforward to demonstrate that rc equals L/2:
22
1
2
2
00
LKr
r
K ICc
c
IC
(10)
The PM failure criterion is therefore:
00;2
Lr (11)
For comparison, the Line Method (LM) assumes that fracture occurs when the average
stress along a line extending a certain distance, d, from the crack tip reaches the inherent
strength, σ0. Again, from the stress field at the crack tip at failure and the definition of L,
it is easy to demonstrate that d is equal to 2L:
LK
dd
Kdr
r
K
dICIC
dIC 2
2
4
2
2
2
12
002/1
0
(12)
Therefore, the LM failure criterion is:
L
drrL
2
0
021 (13)
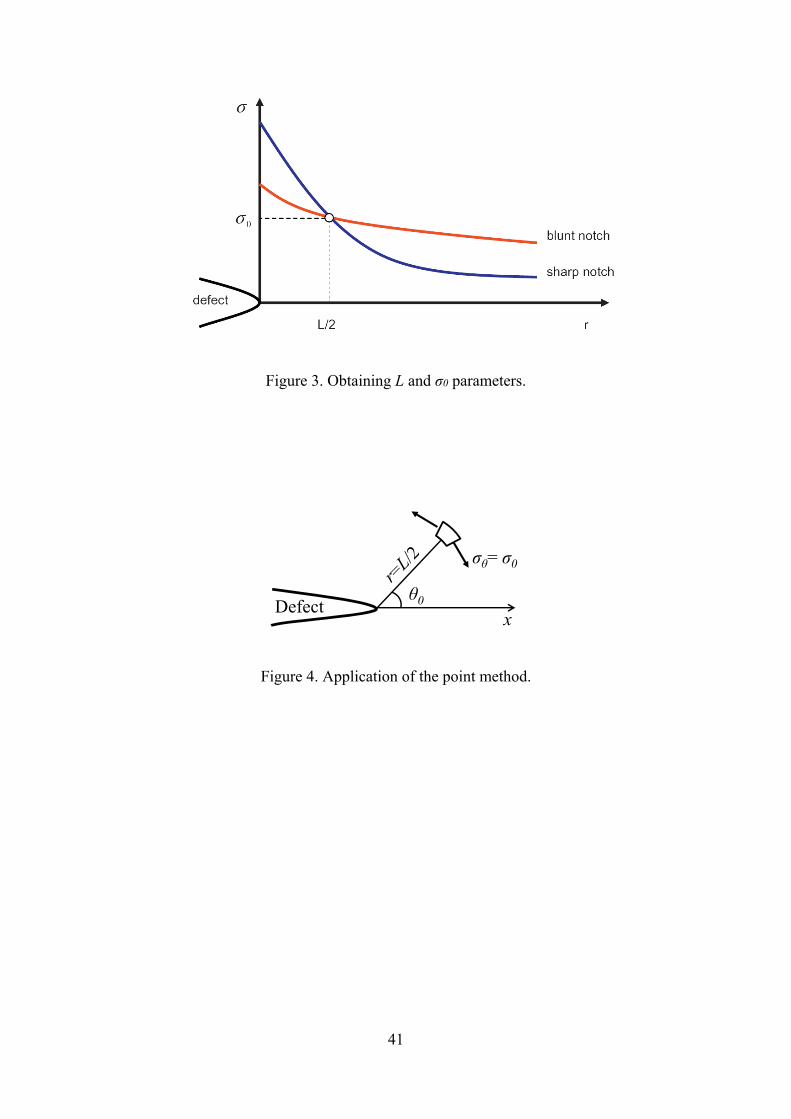
The TCD, applying the PM and the LM, allows the fracture assessment of components
with any kind of stress riser to be performed. As an example, when using the PM it
would be sufficient to perform two fracture tests on two specimens with different types
of defects (e.g. sharp notch and blunt notch). The corresponding stress-distance
13
curves at fracture, which can be determined by using analytical solutions or finite
element methods, cross each other at a point with coordinates (L/2,σ0), as shown in
Figure 3. The prediction of the fracture load of any other component made of the same
material and containing any other kind of defect would require the definition of the
corresponding stress field, the fracture load being that one for which Eq. (11) is
fulfilled. In some cases with linear-elastic behaviour at both the micro and the macro
scales, σ0 coincides with σt and the application of the TCD is even simpler, given that
there is no need to calibrate σ0 and L (directly provided by Eq. (9) once both KIC and σt
are known).
Despite the potential of the TCD for the analysis of fracture processes, to date the
application of this theory to rocks has been limited. To the knowledge of the authors,
Lajtai (1972) was the first author to apply the PM to rocks. He successfully reproduced
rock fracture around a circular defect using the stress gradient at the defect boundary to
calculate the stress at the critical distance. Lajtai (1972) considered the PM as an
approach that accounts for the stress redistribution across a process zone ahead of the
crack tip. Another successful application of the PM has been done by Ito and Hayashi
(1991) and Ito (2008) to study hydraulic fracturing from a wellbore. These applications
involve Mode I fracturing (tension), where the crack propagates along its plane
following a straight path; the TCD was originally developed for Mode I fracturing
(Taylor 2007).
In rocks, compressive and shear stresses are common and lead to mixed modes of
fracture. However, crack initiation is always caused by tensile stresses and crack
14
propagation follows a pure Mode I fracturing path (Cotterell 1965; Cotterell and Rice
1980). Based on this, the PM has been successfully applied to mixed mode fracturing
(Williams and Ewing 1972; Smith et al. 2001), assuming that the maximum tangential
stress is reached along the fracturing path, which forms an angle θ0 with the flaw plane.
The application of the PM to mixed modes of fracture is illustrated in Figure 4. The
method is equivalent to that used in pure mode I (Eq. 10), but now, the direction of the
maximum tangential stress, θ0, has to be found. Smith et al. (2001) called the method
the Generalised Maximum Tangential Stress (GMTS) criterion as an extension of the
MTS criterion (Erdogan and Sih 1963). Recently, the authors of the GMTS and their co-
workers have extensively applied the method to different materials, including Harsin
marble (Aliha et al. 2012) and Guiting limestone (Aliha et al. 2010). It is worth noting
that these authors always assume that the inherent tensile strength (σ0) coincides with σt
and in this paper it will be assumed, as shown later, that the tensile strength at the macro
scale (σt) is lower than the inherent tensile strength (at the micro scale) because σt is
influenced by the small-scale flaws and microfractures present in the intact rock.
The physical meaning of L and σ0 is not fully clear, but it should be somehow related
with the material microstructure (Figure 5). The high tensile stresses near the defect tip
predicted by the mathematical theory of elasticity, which assumes a perfectly
homogenous material, are not realistic. What is more probable is that those stresses are
redistributed over an area near the defect tip; several authors (e.g. Dyskin 1997; Zhou
and Gou 2009) refer to this area as the fracture process zone (FPZ). The redistribution
of stresses near the defect tip may be related to local plasticity and/or microstructural
features, such as the grain size. So, some proportionality between the critical distance
15
and the grain size is expected. Moreover, Figure 6 presents the physical observation on
which the TCD is based: crack propagation is more of an intermittent process than a
continuous phenomenon. That is, it takes place through small crack size increments
whose length is, precisely, two times the critical distance (2L) and constitutes a material
parameter. This is the basis of Finite Fracture Mechanics (FFM), the methodology
belonging to the TCD that provides a more satisfactory physical (mechanistic)
explanation of the fracture process. Details on this may be found in Taylor (2007).
Taylor (2007) also presents a summary of works that have analysed the physical
meaning of the critical distance. The first comment on this is that, depending on the
material being analysed, L may take values that range from the atomic separation
(Pugno and Ruoff 2004) up to meters (Dempsey et al. 1999) for certain specific
situations such as nanomaterials and sea ice, respectively, with typical values from tens
of microns up to a number of centimetres. Taylor (2007) distinguishes here two
situations when trying to relate the critical distance to the material characteristics: small
values of L (e.g. ceramics and steels) are simply related to the microstructure, especially
to the grain size (D), which acts as a barrier to crack propagation and thus generates the
above mentioned discontinuous crack growth; large values of L are associated with a
damage zone (e.g. composites and certain polymers).
Concerning the published relations between the critical distance and the microstructure,
Usami et al. (1986) provided relations on which the critical distance ranges between one
and ten times the grain size (D) in ceramics. The values of L in rocks obtained in
(Cicero et al. 2014; Ito and Hayasi 1991; Dempsey et al. 1999) have the same order of
16
magnitude of the grain size. In the case of metals, simple relations between grain size
and the critical distance have also been found. In Wilshaw et al (1968), L and D are
equal, whereas Yokobori and Konosu (1977) obtained L=1.2D for the same material
subjected to different heat treatments, and then, presenting different grain sizes.
To conclude, the TCD may be considered as an extension of LEFM. Therefore, it shares
some of the advantages of LEFM: it can be used to predict brittle failures that happen
from different micromechanisms. On the other hand, the TCD also has some of the
limitations of LEFM: basically, it is an elastic approach, although its application to the
analysis of ductile fracture in metals has provided good results (Susmel and Taylor
2008).
4. PROPOSED FAILURE CRITERION
The Griffith’s criterion is modified here using a criterion for fracture initiation that
considers the critical distance based on the PM. Therefore, the proposed criterion shares
most of the simplifying assumptions assumed when applying Griffith’s criterion:
- A randomly oriented flaw is considered;
- The problem is simplified to two dimensions and the influence of the
intermediate stress is neglected;
- Fracture initiation is identified with “failure” of the rock;
- Fracture propagation is not assessed;
- Crack closure is not considered;
17
- Dry static conditions are assumed.
The conceptual model by Griffith (Figure 1) is slightly modified because now there is
no need for an elliptical cavity and, to simplify the stress field around the defect, a sharp
crack is considered, which is more damaging for the strength of the material than an
elliptical or circular defect. In any case, the results for fracture initiation of a sharp crack
and a very flat elliptical cavity are the same because notch effects are not visible for
notch radii considerably smaller than the critical distance (Taylor 2007).
Maugis (1992) presents a detailed analysis of the stresses and displacements around
cracks and elliptical cavities. The common approximate solution for the tangential or
circumferential stress in the neighbourhood of the crack tip is:
arfr
axyxyy
22 sin2sin23
2cos
2cos
2 (14)
This relationship is written as a function of the normal and shear stresses on the crack
plane (σy and τxy). Please, note that σy and τxy are far-field stresses. This approximation is
known as the Williams series expansion, and the first term was given by Williams
(1957). Here, for the sake of simplicity, only the two first terms will be used. The
second term does not depend on r, and is usually called the constant term or the T-
stress. Some authors have discussed improved accuracy including that of the third term
(Ayatollahi and Akbardoost 2013) or using an exact solution (Maugis 1992). Eq. (14)
may be expressed using stress intensity factors (SIF)
arfTKKr
III
22 sinsin23
2cos
2cos
21 (15)

18
or principal stresses
arfr
a
ra
231
231
23
21
3
sin2sin2
cos2
sin2sin22
3
cossin2
cos2
(16)
The maximum tangential or hoop stress at the crack tip (Figure 4) and the fracture
initiation angle, θ0, is given when
0 (17)
So, differentiating Eq. (14)
0cos2
sin23
321cos3sin2
cos 00
000
ar
xyxyy (18)
As shown by Maugis (1992), τrθ is not exactly zero in this direction, and consequently,
at a distance r from the crack boundary σθ is no longer a principal stress as it is at the
crack boundary. The stress trajectory starting from the crack tip turns rapidly, and its
tangent at a distance r/a is not exactly directed towards the crack tip. However, Eq. (18)
is a fair approximation to evaluate θ0.
Application of the PM (Eq. 11) to Eq. (14) gives
02
0020
0 sin2sin23
2cos
2cos xyxyyL
a
(19)
where θ0 is implicitly given by Eq. (18) at r=L/2 (Figure 4).
19
Rearranging terms in Eq. (19), the proposed failure criteria may be expressed as
2cossin
23sin2
2cos
000
2
030
LaLa
y
xy
(20)
Following Griffith’s approach, the critical tensile strength, σ0, may be expressed in
terms of the tensile strength, σt, applying Eq. (18) and (19) to that case (σy=σt and τxy=0),
the direction is θ0=0 and
tLa 0 (21)
Note that tensile strengths must be negative as compressions are considered positive
throughout the paper. Combining Eq. (20) and (21), the resulting equation is
2cossin
23sin2
2cos
000
2
03
aL
yt
xy (22)
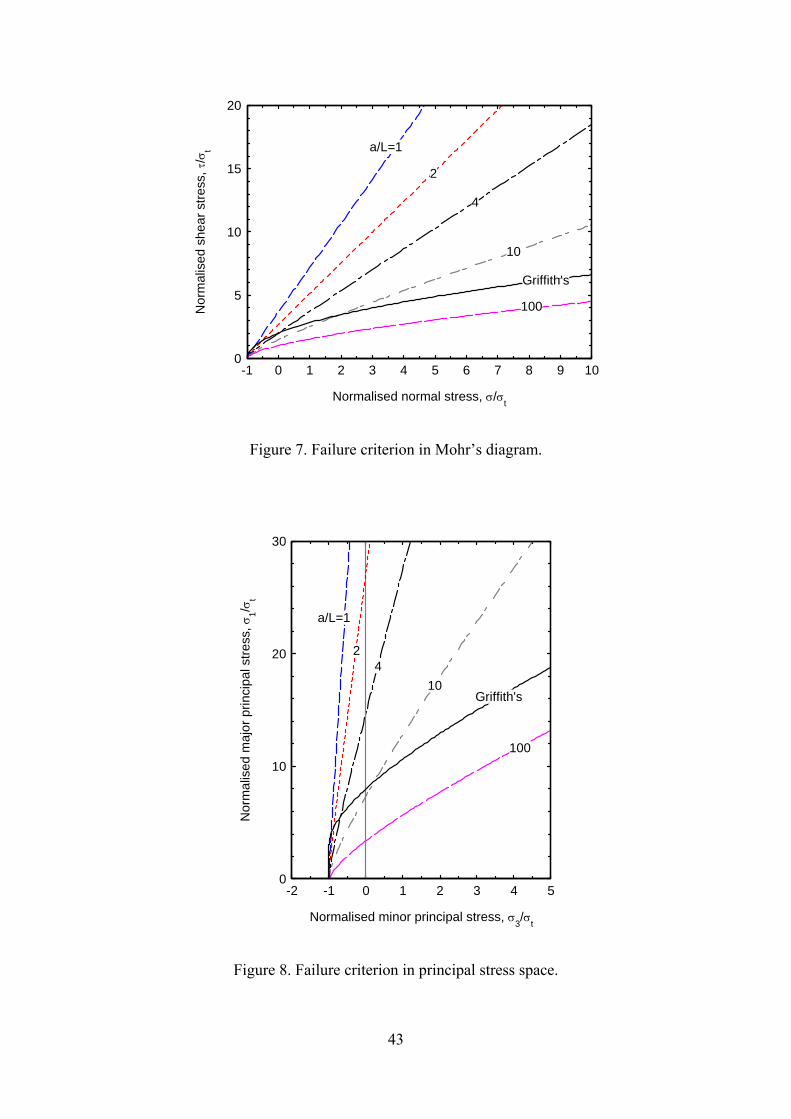
The proposed failure criterion (Eq. 18 and 20 or 22) is compared with the Griffith’s
criterion (Eq. 6) in Figure 7 in a Mohr’s diagram. Similar comparison may be done
using the triaxial stress space (Figure 8). The proposed failure criterion using principal
stresses may be obtained from Eq. (16). Some relevant features of the proposed criterion
are:
The failure envelope depends on the crack length and the critical distance (a/L).
The shape of the failure envelope varies with a/L from a near straight line to a
near parabolic curve (Figure 7).
The slope of the failure envelope in the triaxial stress space is proportional to the

20
strength ratio (σc/σt).
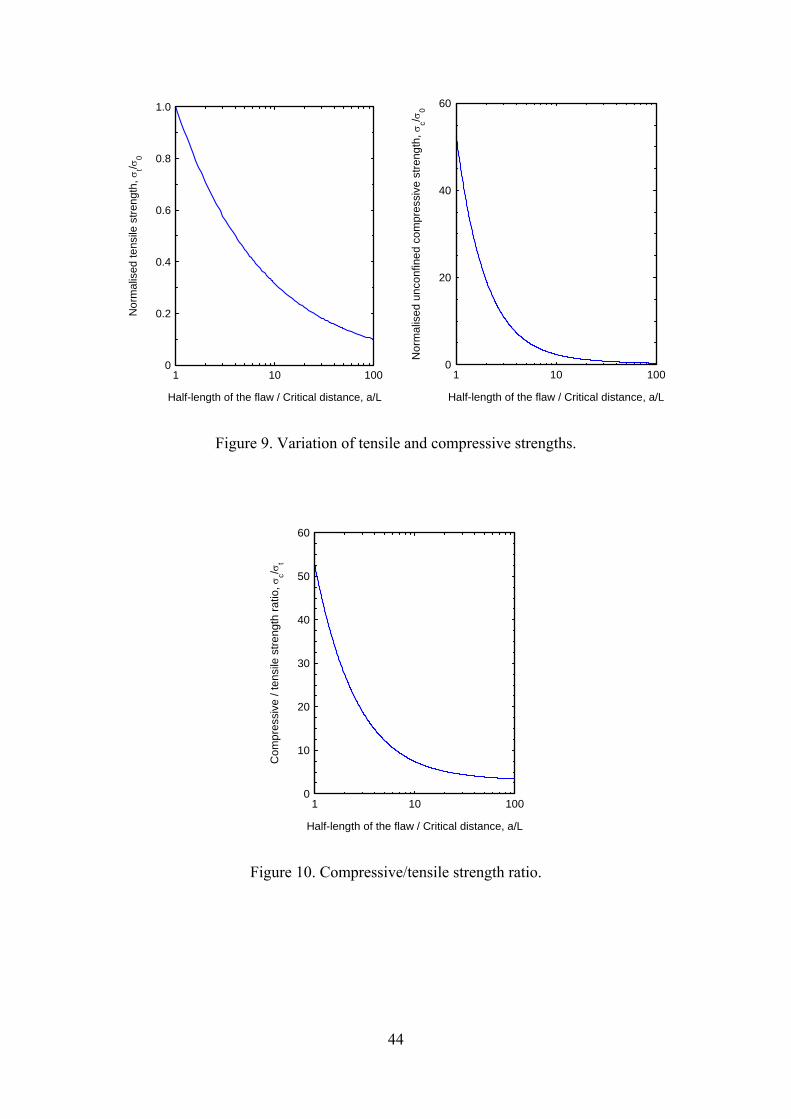
The uniaxial compressive and tensile strengths (Eq. 21) decrease with a/L
(Figure 9).
The strength ratio varies with a/L from less than 3 up to more than 50 (Figure
10).
The proposed criterion depends on microstructural properties, namely σ0 and
a/L, which are difficult to measure, but the failure criterion may also be obtained
from σt and σc.
Similar to Griffith’s criterion, the proposed model is developed under important
simplifying assumptions. However, introducing the critical distance notably
improves the predictive capabilities of the failure criterion. It also accounts, at
least indirectly, for some microstructural rock features, such as grain size and
porosity.
5. COMPARISON AND DISCUSSION
5.1. Input parameters
The input parameters of the proposed criterion (Eq. 18 and 20) are σ0 and a/L. Based on
the TCD, the critical distance, L, may be calibrated using any of the following
approaches:
Perform several fracture toughness tests with different notch radii and get the
value of the critical distance that gives the best fitting of the results (e.g. Cicero
et al. 2014).
21
Perform two fracture toughness tests with two notch radii and get the stress
fields around the defect tip (using either analytical solutions or numerical
methods). The intersection between these two stress fields corresponds to half
the critical distance and the inherent strength (see Figure 3).
Once the value of the critical distance is obtained, the inherent strength, σ0, may be
obtained from Eq. (9) using the material fracture toughness, KIC. Lastly, to get the a/L
ratio, it is necessary to estimate the length of the initial or pre-existing cracks (2a),
which requires the microstructural analysis of the rock sample.
Alternatively, σ0 and a/L may be correlated with σc and σt. The mathematical
relationships are complex and, therefore, for the sake of simplicity they may be
graphically obtained using Figures 9 and 10. For example, a/L may be obtained from
the σc/σt ratio using Figure 10 or the following approximate expression
5.2
49
tcL
a (23)
and once a/L is assessed, σ0 is obtained using Eq. (21) or Figure 9.
In the future, empirical correlations of the critical distance with the type of rock and the
grain size may be developed.
5.2. Brazilian test
Direct tensile tests are difficult to perform, and they are usually engaged with pre-
mature failure due to gripping end effects. Therefore, the tensile strength is usually
22
obtained from indirect tests, such as the Brazilian splitting test. Many of the tensile
strengths cited in literature were obtained using this test. In this test, failure occurs by
tension along the vertical axis, aligned with the opposite line loads, W. Using the theory
of elasticity, the stresses along this vertical diameter are (e.g. Jaeger et al. 2007):
22
223;
yRRyRW
RW
yx
(23)
where R is the radius of the Brazilian disk, and y is the vertical axis centred in the disk.
At the centre of the disk (y=0), the two stresses are the major and minor principal
stresses and equal to
3113 33; RW
RW
yx (24)
So, the results of a Brazilian test in principal stress space are not aligned with the
horizontal axis (σ1 =0), as pointed out, for example, by Johnston (1985). Eq. (24) may
be used as an approximation.
5.3. Failure envelope
The proposed failure criterion is here compared with published laboratory
measurements. It should be clarified that there are many published data, but here the
study limits to high-quality tests and well-documented rocks. Furthermore, the proposed
criterion is based on brittle failure, so only tension or low confinement pressures are
considered. For intermediate and high confinement stresses, shear failure and ductile
behaviour influences rock strength.
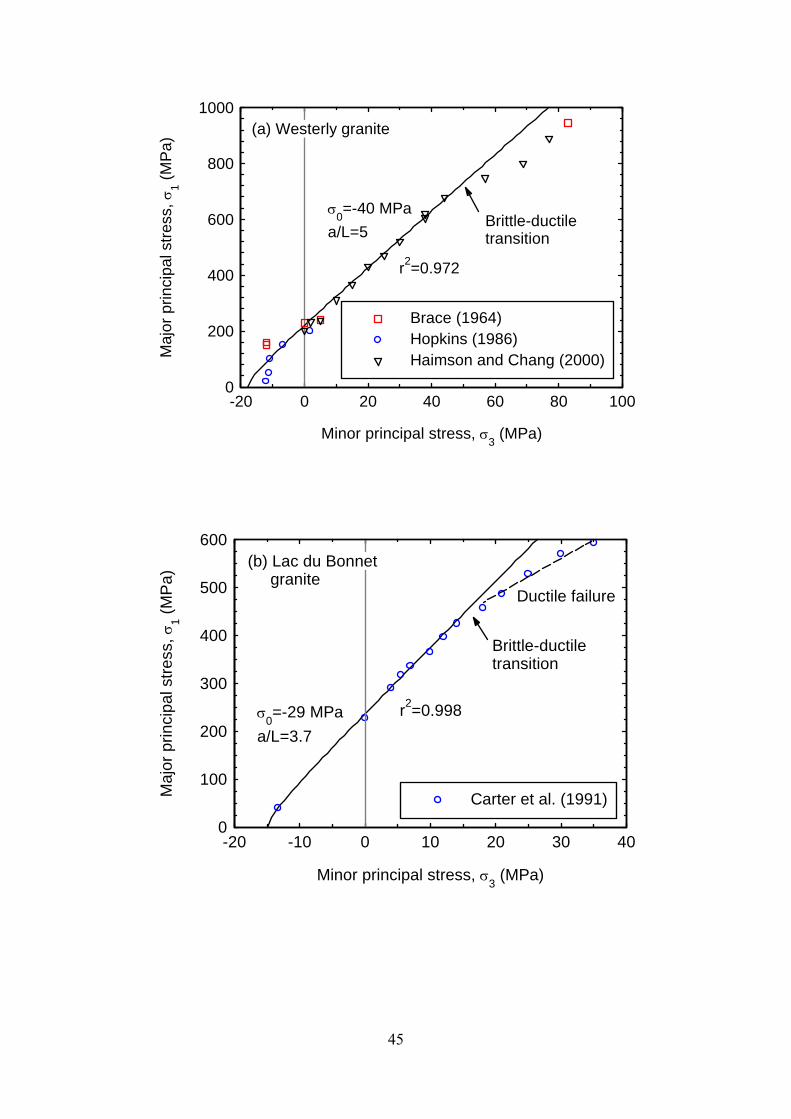
Westerly granite is one of the most investigated rocks, for example, Brace (1964)
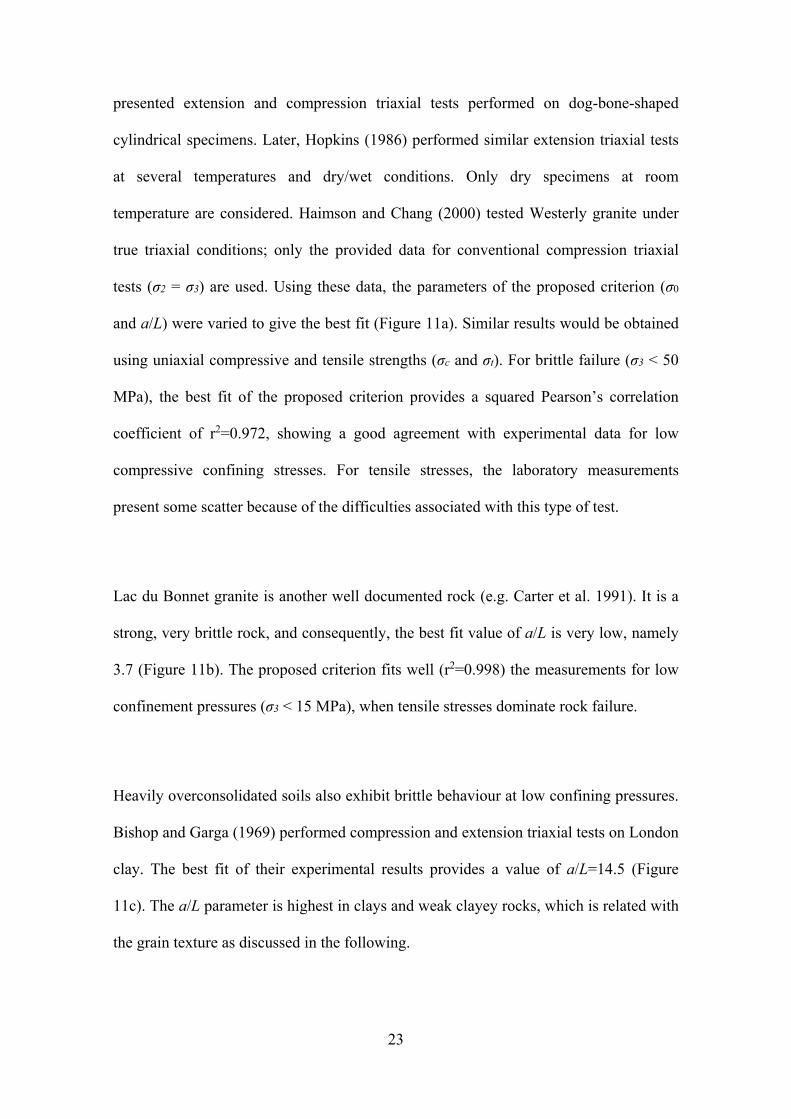
23
presented extension and compression triaxial tests performed on dog-bone-shaped
cylindrical specimens. Later, Hopkins (1986) performed similar extension triaxial tests
at several temperatures and dry/wet conditions. Only dry specimens at room
temperature are considered. Haimson and Chang (2000) tested Westerly granite under
true triaxial conditions; only the provided data for conventional compression triaxial
tests (σ2 = σ3) are used. Using these data, the parameters of the proposed criterion (σ0
and a/L) were varied to give the best fit (Figure 11a). Similar results would be obtained
using uniaxial compressive and tensile strengths (σc and σt). For brittle failure (σ3 < 50
MPa), the best fit of the proposed criterion provides a squared Pearson’s correlation
coefficient of r2=0.972, showing a good agreement with experimental data for low
compressive confining stresses. For tensile stresses, the laboratory measurements
present some scatter because of the difficulties associated with this type of test.
Lac du Bonnet granite is another well documented rock (e.g. Carter et al. 1991). It is a
strong, very brittle rock, and consequently, the best fit value of a/L is very low, namely
3.7 (Figure 11b). The proposed criterion fits well (r2=0.998) the measurements for low
confinement pressures (σ3 < 15 MPa), when tensile stresses dominate rock failure.
Heavily overconsolidated soils also exhibit brittle behaviour at low confining pressures.
Bishop and Garga (1969) performed compression and extension triaxial tests on London
clay. The best fit of their experimental results provides a value of a/L=14.5 (Figure
11c). The a/L parameter is highest in clays and weak clayey rocks, which is related with
the grain texture as discussed in the following.

24
Figure 12 shows the best fits of the experimental data by Carter et al. (1991) on Lac du
Bonnet granite using the proposed analytical criterion for brittle failure and using the
Hoek-Brown empirical criterion. For the proposed criterion, the best fit was done
considering only brittle failure (σ3 < 15 MPa), while the Hoek-Brown criterion allows to
consider shear failure at higher confining stresses. However, the Hoek-Brown criterion
underestimates tensile strengths as discussed, for example, by Cai (2010). The fitting of
the experimental results in Figure 12 with the Mohr-Coulomb shear criterion depends
on the confining stress range considered; similar results to the proposed criterion would
be obtained if only brittle failure points are considered.
In summary, the proposed failure criterion gives a reasonable estimation of laboratory
measurements for tensile fracture, i.e. below the brittle–ductile transition, which is also
called the spalling limit (around σ1/σ3=10). So, the criterion may be applied for those
situations involving brittle failure, such as intact rock brittle failure, spalling or intact
rock bridges or pillars.
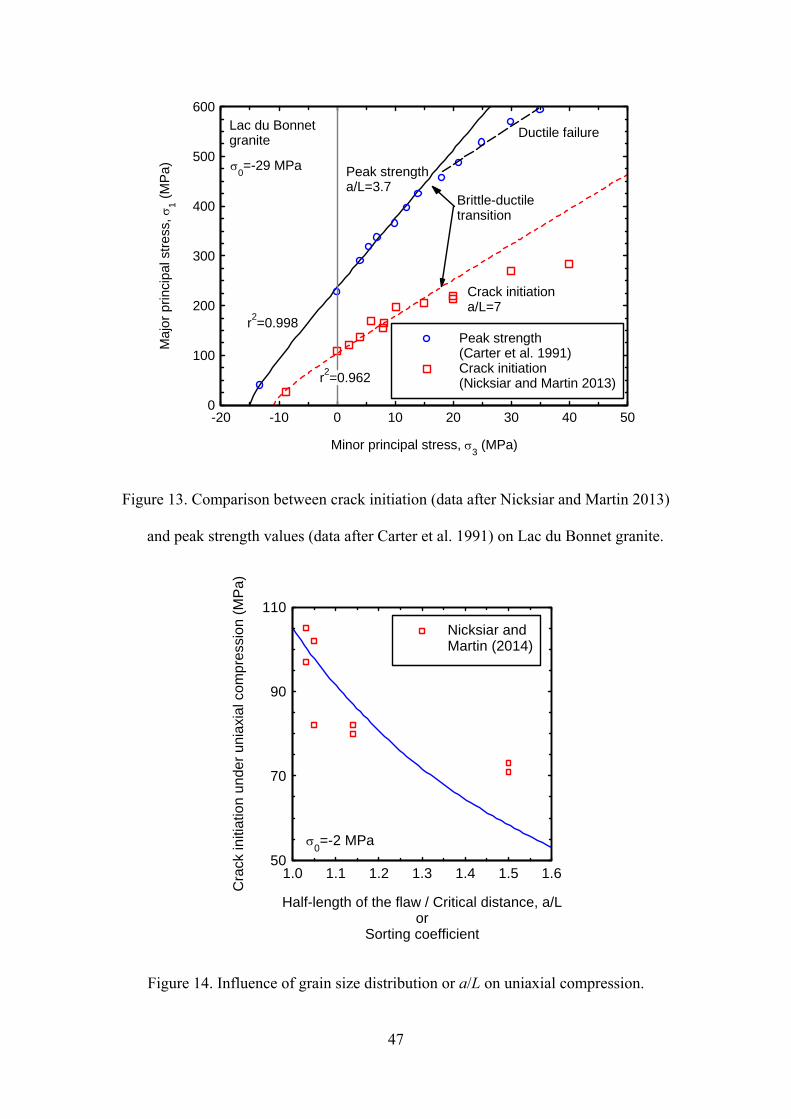
5.4. Crack initiation
The proposed criterion follows the same approach as the Griffith’s criterion and,
therefore, it is technically a crack initiation criterion. There are few data on crack
initiation in the triaxial stress space. The experimental data on Lac du Bonnet granite by
Nicksiar and Martin (2013) are here used to validate the proposed theoretical criterion
(Figure 13). The unconfined compressive strength reported by Nicksiar and Martin
(2013) (σc=220 MPa) agrees well with that of Carter et al. (1991). The differences in
tension are likely to be caused by the scatter of the experimental data because in tension,
25
crack initiation is quickly followed by unstable crack propagation and failure (e.g. Cai
2010).
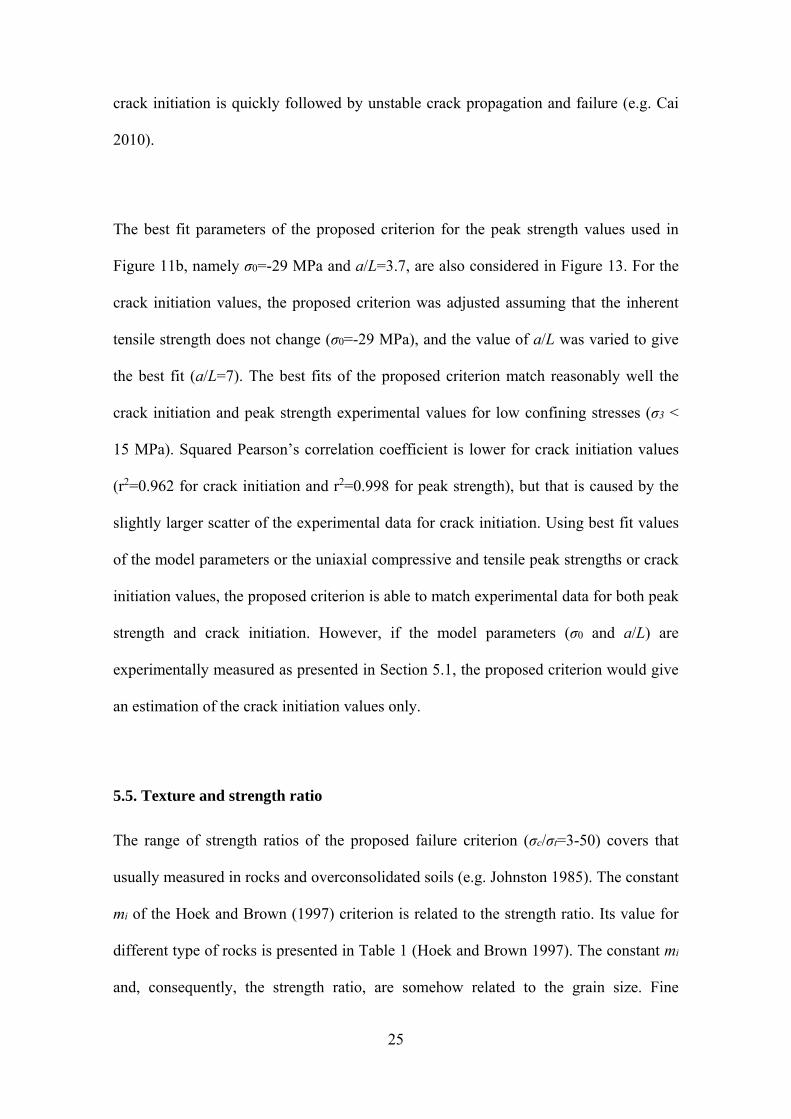
The best fit parameters of the proposed criterion for the peak strength values used in
Figure 11b, namely σ0=-29 MPa and a/L=3.7, are also considered in Figure 13. For the
crack initiation values, the proposed criterion was adjusted assuming that the inherent
tensile strength does not change (σ0=-29 MPa), and the value of a/L was varied to give
the best fit (a/L=7). The best fits of the proposed criterion match reasonably well the
crack initiation and peak strength experimental values for low confining stresses (σ3 <
15 MPa). Squared Pearson’s correlation coefficient is lower for crack initiation values
(r2=0.962 for crack initiation and r2=0.998 for peak strength), but that is caused by the
slightly larger scatter of the experimental data for crack initiation. Using best fit values
of the model parameters or the uniaxial compressive and tensile peak strengths or crack
initiation values, the proposed criterion is able to match experimental data for both peak
strength and crack initiation. However, if the model parameters (σ0 and a/L) are
experimentally measured as presented in Section 5.1, the proposed criterion would give
an estimation of the crack initiation values only.
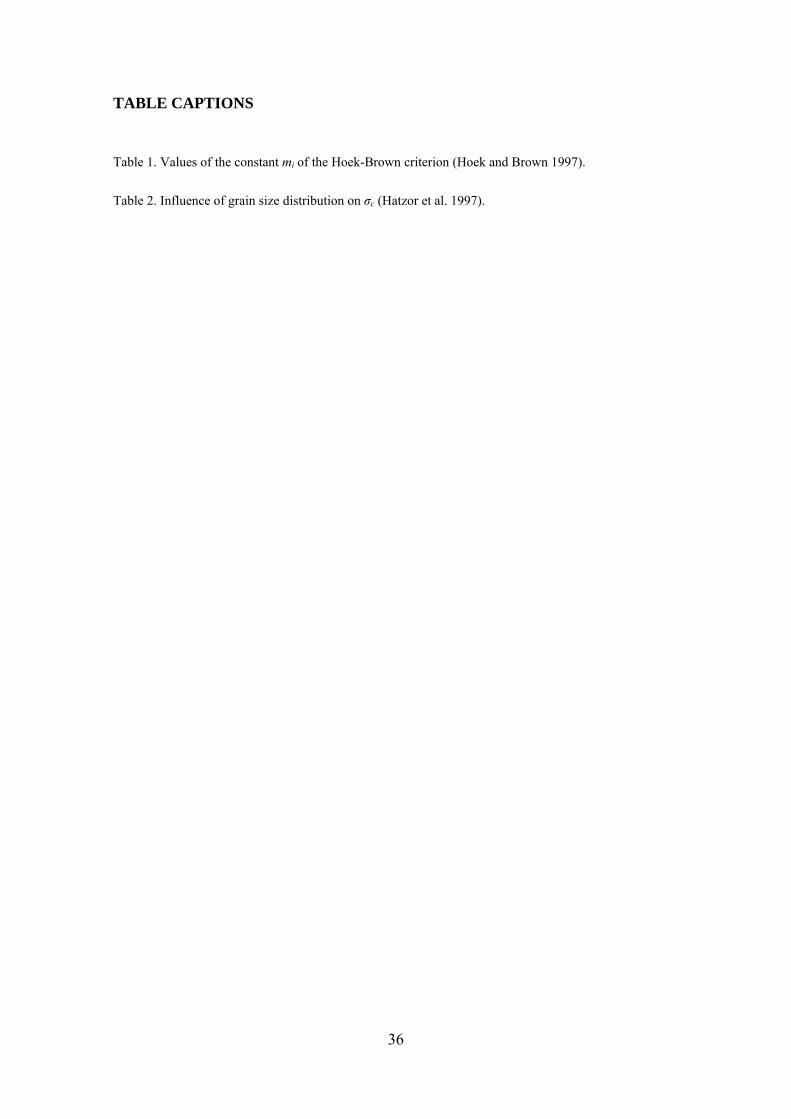
5.5. Texture and strength ratio
The range of strength ratios of the proposed failure criterion (σc/σt=3-50) covers that
usually measured in rocks and overconsolidated soils (e.g. Johnston 1985). The constant
mi of the Hoek and Brown (1997) criterion is related to the strength ratio. Its value for
different type of rocks is presented in Table 1 (Hoek and Brown 1997). The constant mi
and, consequently, the strength ratio, are somehow related to the grain size. Fine
26
textures usually correspond to lower values of mi and lower strength ratios. That trend is
especially evident for sedimentary clastic rocks. In those rocks, the micromechanical
model of Figure 5 seems particularly valid. So, small grain sizes correspond to smaller
critical distances, and consequently, higher a/L ratios. Since a/L is inversely
proportional to the strength ratio in the proposed criterion, the predicted strength ratios
agree with the trend in Table 1. However, the size of existing cracks, 2a, may also vary
with grain size (e.g. Wong et al. 1996) and other factors, such as porosity or stress-
induced microfracture damage during core drilling (i.e., sample disturbance; Eberhardt
et al. 1999).
Using the micromechanical model of Figure 5 and assuming that most cracks are related
to grain boundaries, the critical distance would be related to the minimum grain size and
the crack length to the maximum grain size, because a lower critical distance and a
higher crack length would be prone to fracture at lower stress thresholds. So, the a/L
parameter of the proposed model is proportional to the variance of the grain size
distribution curve. In this way, the proposed model predicts that the rock strength
decreases with a/L (Figure 9), and consequently with the heterogeneity of grain sizes.
The compressive strength (Figure 9b) is more severely affected than the tensile strength
(Figure 9a). Experimental data after Hatzor et al. (1997) are presented in Table 2,
showing the different values of σc of two samples with similar percentage of dolomite
and porosity but different grain size distributions. The sample with the more uniform
grain size distribution (AD43) provides the higher strength. Similar to the grain size
distribution, the aspect ratio of the grains also influences the rock strength (Tandon and
Gupta 2013).
27
The proposed model shows that the rock strength, particularly in compression (Figure
9), depends not on the grain size but on its heterogeneity, i.e. grain size distribution or
a/L ratio. Nicksiar and Martin (2014) have also reached this conclusion using numerical
models. Their results may be correlated with those predicted by the proposed model
(Figure 14). For the purpose of comparison, the sorting coefficient is associated with the
a/L ratio along the x-axis, to demonstrate the general trend that strength decreases with
the grain size heterogeneity.
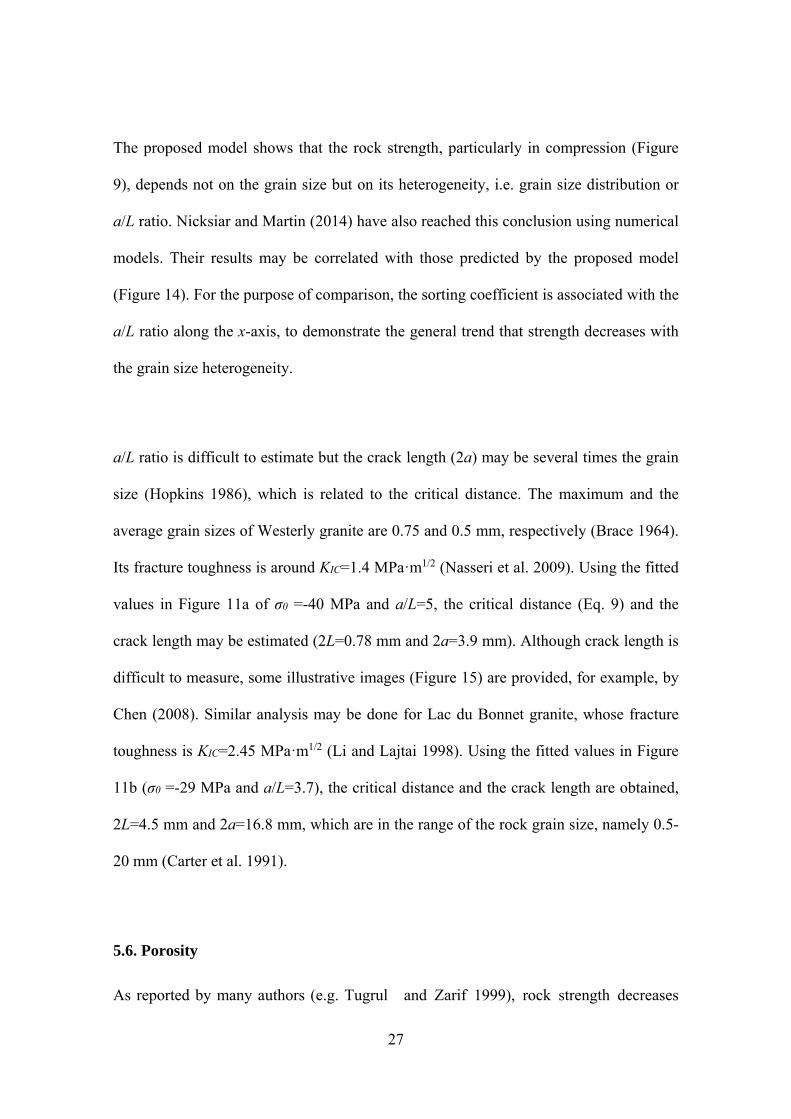
a/L ratio is difficult to estimate but the crack length (2a) may be several times the grain
size (Hopkins 1986), which is related to the critical distance. The maximum and the
average grain sizes of Westerly granite are 0.75 and 0.5 mm, respectively (Brace 1964).
Its fracture toughness is around KIC=1.4 MPa·m1/2 (Nasseri et al. 2009). Using the fitted
values in Figure 11a of σ0 =-40 MPa and a/L=5, the critical distance (Eq. 9) and the
crack length may be estimated (2L=0.78 mm and 2a=3.9 mm). Although crack length is
difficult to measure, some illustrative images (Figure 15) are provided, for example, by
Chen (2008). Similar analysis may be done for Lac du Bonnet granite, whose fracture
toughness is KIC=2.45 MPa·m1/2 (Li and Lajtai 1998). Using the fitted values in Figure
11b (σ0 =-29 MPa and a/L=3.7), the critical distance and the crack length are obtained,
2L=4.5 mm and 2a=16.8 mm, which are in the range of the rock grain size, namely 0.5-
20 mm (Carter et al. 1991).
5.6. Porosity
As reported by many authors (e.g. Tugrul and Zarif 1999), rock strength decreases

28
with its porosity. This effect seems obvious and may be considered in the proposed
model equating pore size to crack length. Rocks with higher porosity are expected to
have longer cracks. The experimental data on arenites for different porosities by Vernik
et al. (1993) are fitted with the proposed criterion assuming different crack lengths
(Figure 16). Although a detailed comparison is not possible because of the lack of data
for tensile stresses, the proposed criterion captures well the decrease of strength with
increasing porosity.
5.7. Sample size and rock weathering
The influence of sample size on rock strength could be explained using the Griffith’s
criterion based on the probability of having a crack critically oriented. With the
proposed criterion, that can be improved using the length of the critically oriented crack.
As the sample diameter increases, the probability of having a longer crack increases,
and consequently, a/L increases. That effect is shown in Figure 17 for an Australian
coal (Medhurst and Brown 1998). As there are few laboratory data, the proposed fitting
by Medhurst and Brown (1998) using the Hoek-Brown (1997) criterion is also shown,
as well as an estimation of rock mass strength. The proposed criterion has been fitted
varying just a/L. A slightly better fitting would be achieved if σ0 were also changed.
Rocks are not perfectly homogeneous, so σ0 varies, and the probability of having a
weaker zone in a bigger specimen is also higher. Ultimately, that value is affected by
rock weathering for rock mass.
A set of well-documented Brazilian and triaxial tests in a weak mudstone from
Melbourne are provided by Johnston and Chiu (1984). Rock strength decreases with the
29
moisture content, as rock weathering increases (Figure 18). Rock weathering is
expected to decrease the internal tensile strength, σ0, and increase crack length, 2a. The
fitting of the proposed criterion captures those trends (Figure 18).
6. CONCLUSIONS
A new criterion for brittle failure has been developed introducing the critical distance in
the Griffith’s model of a randomly oriented crack under a biaxial stress state. The
proposed criterion is analytical and based on intrinsic properties, such as the inherent
tensile strength, σ0, and the half-length of the crack to the critical distance ratio, a/L.
These parameters are difficult to measure but they may be correlated with the uniaxial
compressive and tensile strengths, σc and σt.The proposed criterion accounts for the
influence of the crack length (“size effect”) and is able to reproduce the common range
of strength ratios for rocks and heavily overconsolidated soils (σc/σt=3-50).
For the sake of simplicity, the proposed failure criterion ignores several processes, such
as crack propagation, crack closure, interaction between cracks and influence of the
intermediate principal stress. However, a reasonable agreement with laboratory
measurements reported in literature is found for tensile and low confining stresses.
Furthermore, the model is able to reproduce, by means of its parameters σ0 and a/L, the
influence of several microstructural rock properties, such as texture and porosity. It also
reproduces the influence of sample size and rock weathering.
30
ACKNOWLEDGEMENTS
The work presented was initiated during a research project on “Structural integrity
assessments of notch-type defects", for the Spanish Ministry of Science and Innovation
(Ref.: MAT2010-15721).
REFERENCES
Aliha MRM, Ayatollahi MR, Akbardoost J (2012) Typical upper bound-lower bound mixed mode
fracture resistance envelopes for rock material. Rock Mech Rock Eng 45:65-74
Aliha MRM, Ayatollahi MR, Smith DJ, Pavier MJ (2010) Geometry and size effects on fracture
trajectory in a limestone rock under mixed mode loading, Eng Fract Mech 77:2200-2210
Anderson TL (2004) Fracture mechanics: fundamentals and applications. 3rd edn. CRC Press, Florida
Ayatollahi MR, Akbardoost J (2013) Size effects in mode II brittle fracture of rocks. Eng Fract Mech
112-113: 165-180
Bao Y, Jin Z (1993) Size effects and mean strength criterion for ceramics. Fatigue Fract Eng Materials
Struct 16:829-835
Baud P, Wong T-f, Zhu W (2014) Effects of porosity and crack density on the compressive strength of
rocks. Int J Rock Mech Min Sci 67:202-211
Bažant ZP (2002) Concrete fracture models: testing and practice. Eng Fract Mech 69(2):165-205
Bieniawski ZT (1967) Mechanism of brittle fracture of rock. Part II – Experimental studies. Int J Rock
Mech Min Sci 4(4):407-423
Bishop AW, Garga VK (1969) Drained Tension Tests on London Clay. Geotechnique 19(2):309-313
Bobet A (2000) The initiation of secondary cracks in compression. Eng Fract Mech 66:187-219
Bobet A, Einstein HH (1998) Fracture coalescence in rock-type materials under uniaxial and biaxial
31
compression. Int J Rock Mech Min Sci 35(7):863-888
Brace WF (1961) Dependence of fracture strength of rocks on grain size. Penn State Univ Min Ind Expt
Sta Bull 76:99-103
Brace WF (1964) Brittle fracture of rocks. In: Judd WR (ed) State of stress in the Earth’s crust. Elsevier,
New York, pp 111-174
Cai M (2010) Practical estimates of tensile strength and Hoek-Brown strength parameter mi of brittle
rocks. Rock Mech Rock Eng 43:167-184
Carter BJ, Scott Duncan EJ, Lajtai EZ (1991) Fitting strength criteria to intact rock. Geotech Geol Eng
9:73-81
Chang KJ (1981) Further studies of the maximum stress criterion on the angled crack problem. Eng Fract
Mech 14:125-142
Chen Y (2008) Observation of microcracks patterns in westerly granite specimens stressed immediately
before failure by uniaxial compressive loading. Chinese J Rock Mech Eng 27(12):2240-2248
Cicero S, García T, Castro J, Madrazo V, Andrés D (2014) Analysis of notch effect in the fracture
behaviour of granite and limestone: an approach from the theory of critical distances. Eng Geol
177:1-9
Cicero S, Madrazo V, Carrascal I.A (2012) Analysis of notch effect in PMMA by using the Theory of
Critical Distances. Eng Fract Mech 86:56-72
Cicero S, Madrazo V, García T, Cuervo J, Ruiz E (2013) On the notch effect in load bearing capacity,
apparent fracture toughness and fracture mechanisms of polymer PMMA, aluminium alloy Al7075-
T651 and structural steels S275JR and S355J2. Eng Fail Anal 29:108-121
Cotterell B (1965) On brittle failure paths. Int J Fract Mech 1:96-103
Cotterell B, Rice JR (1980) Slightly curved or kinked cracks. Int J Fract 16:155-169
Dempsey JP, Adamson RM, Mulmule SV (1999) Scale effect on the in-situ tensile strength and failure of
ice. Part II: First-year sea ice at Resolute, N.W.T. Int J Fract 95:347-366
Dyskin AV (1997) Crack growth criteria incorporating non-singular stresses: Size effect in apparent
32
fracture toughness. Int J Fract 83:191-206
Eberhardt E., Stead D, Stimpson B (1999) Effects of sample disturbance on the stress-induced
microfracturing characte-ristics of brittle rock. Can Geotech J 36:239-250.
Elices M, Planas J, Guinea GV (2000) Fracture mechanics applied to concrete. In: Fuentes et al. (eds)
European Structural Integrity Society. Elsevier, Vol 26, pp 183-210
Erdogan F, Sih GC (1963) On the crack extension in plates under plane loading and transverse shear.
ASME, J Basic Eng 85(4):519-527
Griffith AA (1921) The phenomena of rupture and flow in solids. Phil Trans Royal Soc London, Series A
221:163-198
Griffith AA (1924)Theory of rupture. In: Bienzano CB, Burgers JM (eds) Proc. 1st International Congress
on Applied Mechanics, Delft, pp 55-63
Haimson B, Chang C (2000) A new true triaxial cell for testing mechanical properties of rock, and its use
to determine rock strength and deformability of Westerly granite. Int J Rock Mech Min Sci 37:285-
296
Hatzor YH, Zur A, Mimran Y (1997) Microstructure effects on microcracking and brittle failure of
dolomites. Tectonophysics 281:141-161
Hoek E (1965) Rock fracture under static stress conditions. PhD Thesis, University of Cape Town
Hoek E (1968) Brittle failure of rock. In: Stagg KG, Zienkiewicz OC (eds) Rock Mechanics in
Engineering Practice. John Wiley and Sons, pp 99-124
Hoek E, Brown ET (1980) Empirical Strength Criterion for Rock Masses. J Geotech Eng Div, ASCE
106(GT9):1013-1135
Hoek E, Brown ET (1997) Practical estimates of rock mass strength. Int J Rock Mech Min Sci 34:1165-
1186
Hopkins TW (1986) Microfracturing in Westerly granite experimentally extended wet and dry at
temperatures to 800ºC and pressures to 200 MPa. MSc Thesis, Texas A&M University
Inglis CE (1913) Stresses in a plate due to the presence of cracks and sharp corners. Trans Inst Naval

33
Architects 55(Part I): 219-230
Ingraffea AR, Heuzé FE (1980) Finite element models for rock fracture mechanics. Int J Num Anal
Methods Geomech 4:25-43
Ito T (2008) Effect of pore pressure gradient on fracture initiation in fluid saturated porous media: Rock.
Eng Fract Mech 75:1753-1762
Ito T, Hayasi K (1991) Physical background to the breakdown pressure in hydraulic fracturing tectonic
stress measurements. Int J Rock Mech Min Sci 28:285-293
Jaeger JC (1967) Failure of rocks under tensile conditions. Int J Rock Mech Min Sci 4(2):219-227
Jaeger JC, Cook NGW, Zimmerman RW (2007) Fundamentals of Rock Mechanics. 4th edn. Wiley-
Blackwell
Johnston IW (1985) Strength of Intact Geomechanical Materials. J Geotech Eng, ASCE 111(6):730-749
Johnston IW, Chiu HK (1984) Strength of Weathered Melbourne Mudstone. J Geotech Eng, ASCE
110(7):875-898
Karihaloo BL, Carpinteri A, Elices M (1993) Fracture mechanics of cement mortar and plain concrete.
Adv Cem Based Mater 1 (2):92-105
Kemeny JM (1991) A model for non-linear rock deformation under compression due to sub-critical crack
growth. Int J Rock Mech Min Sci 28(6):459-467
Lajtai EZ (1972) Effect of tensile stress gradient on brittle fracture initiation. Int J Rock Mech Min Sci
9(5):569-578
Li S, Lajtai EZ (1998) Modeling the stress-strain diagram for brittle rock loaded in compression. Mech
Materials 30:243-251
Madrazo V, Cicero S, Carrascal IA (2012) On the point method and the line method notch effect
predictions in Al7075-T651. Eng Fract Mech 2012; 79:363-379
Maugis D (1992) Stresses and displacements around cracks and elliptic cavities – exact solutions. Eng
Fract Mech 43:217-255
Medhurst TP, Brown ET (1998) A study of the mechanical behaviour of coal for pillar design. Int J Rock

34
Mech Min Sci 35(8):1087-1105
Nasseri MHB, Tatone BSA, Grasselli G, Young RP (2009) Fracture Toughness and Fracture Roughness
Interrelationship in Thermally treated Westerly Granite. Pure Applied Geophysics 166:801-822
Neuber H (1958) Theory of notch stresses: principles for exact calculation of strength with reference to
structural form and material. Springer Verlag, Berlin
Nicksiar M, Martin CD (2013) Crack initiation stress in low porosity crystalline and sedimentary rocks.
Eng Geol 154:64-76
Nicksiar M, Martin CD (2014) Factors affecting crack initiation in low porosity crystalline rocks. Rock
Mech Rock Eng 47:1165-1181
Paterson MS, Wong T-f (2005) Experimental rock deformation – The brittle field. Springer Verlag, Berlin
Peterson RE (1959) Notch sensitivity. In: Sines G, Waisman JL (eds) Metal fatigue. McGraw Hill, New
York, pp 293-306
Pluvinage G (1998) Fatigue and fracture emanating from notch; the use of the notch stress intensity
factor. Nuclear Eng Design 185:173-184
Pugno N, Ruoff R (2004) Quantized fracture mechanics. Phil Magaz 84:2829-2845
Shen B, Stephansson O (1993) Numerical-analysis of mixed mode-I and mode-II fracture propagation. Int
J Rock Mech Min Sci 30:861-867
Smith DJ, Ayatollahi MR, Pavier MJ (2001) The role of T-stress in brittle fracture for linear elastic
materials under mixed mode loading. Fatigue Fract Eng Materials Struct 24:137-150
Sneddon IN (1946) The distribution of stress in the neighbourhood of a crack in an elastic solid. Proc
Royal Soc, Series A 187(1009):229-260
Susmel L, Taylor D (2008) On the use of the Theory of Critical Distances to predict filures in ductile
metallic materials containing different geometrical features. Eng Fract Mech 75:4410-4421
Susmel L, Taylor D (2010) An elasto-plastic reformulation of the Theory of Critical Distances to estimate
lifetime of notched components failing in the low/medium-cycle fatigue regime. J Eng Materials
Tech, Trans ASME 132:0210021-0210028

35
Tandon RS, Gupta V (2013) The control of mineral constituents and textural characteristics on the
petrophysical & mechanical (PM) properties of different rocks of the Himalaya. Eng Geol 153:125-
143
Taylor D (2007) The Theory of Critical Distances: A New Perspective in Fracture Mechanics. Elsevier
Sci
Taylor D, Wang G (2000) The validation of some methods of notch fatigue analysis. Fatigue Fract Eng
Materials Struct 23:387-394
Tugrul A, Zarif IH (1999) Correlation of mineralogical and textural characteristics with engineering
properties of selected granitic rocks from Turkey. Eng Geol 51(4): 303-317
Usami S, Kimoto H, Takahashi I, Shida S (1986) Strength of ceramic materials containing small flaws.
Eng Fract Mech 23:745-761
Vernik L, Bruno M, Bovberg C (1993) Empirical relations between compressive strength and porosity of
siliciclastic rocks. Int J Rock Mech Min Sci 30(7):677-680
Williams JG, Ewing PD (1972) Fracture under complex stress – the angled crack problems. Int J Fract
8:441-446
Williams ML (1957) On the stress distribution at the base of a stationary crack. J Applied Mech
24(1):109-114
Wilshaw TR, Rau CA, Tetelman AS (1968) A general model to predict the elastic-plastic stress
distribution and fracture strength of notched bars in plane strain bending. Eng Fract Mech 1:191-211
Wong RHC, Chau KT, Wang P (1996) Microcracking and grain size effect in Yuen Long marbles. . Int J
Rock Mech Min Sci 33(5):479-485
Wu Z, Wong LNY (2012) Frictional crack initiation and propagation analysis using the numerical
manifold method. Comput Geotech 39:38-53
Yokobori T, Konosu S (1977) Effects of ferrite grain size, notch acuity and notch length on brittle
fracture stress of notched specimens of low carbon steel. Eng Fract Mech 8:397-409
Zhou S, Guo S (2009) Two-parameter criterion for crack growth under compressive loading. Int J Rock
Mech Min Sci 46:1389-1393
36
TABLE CAPTIONS
Table 1. Values of the constant mi of the Hoek-Brown criterion (Hoek and Brown 1997).
Table 2. Influence of grain size distribution on σc (Hatzor et al. 1997).
37
Table 1. Values of the constant mi of the Hoek-Brown criterion (Hoek and Brown
1997).
Rock type Class Group Texture
Coarse Medium Fine Very fine
Sedimentary
Clastic Conglomerate
(22) Sandstone
19 Siltstone
9 Claystone
4 ------- Geywacke (18) --------
Non-clastic
Organic ------- Chalk 7 -------- ------- Coal (8-21) --------
CarbonateBreccia
(20)
Sparitic Limestone
(10)
Micritic Limestone
8
Chemical Gypstone
16 Anhydrite
13
Metamorphic
Non-foliated Marble
9 Hornfels
(19) Quartzite
(24)
Slightlty foliated Migmatite
(30) Amphibolite
25-31 Mylonites
(6)
Foliated* Gneiss
33 Schists
4-8 Phyllites
(10) Slate
9
Igneous
Light
Granite 33
Rhyolite
(16) Obsidian
(19) Granidiorite
(30)
Dacite (17)
Diorite (28)
Andesite
19
Dark
Gabbro 27
Dolerite (19)
Basalt (17)
Norite 22
Extrusive pyroclastic Agglomerate
(20) Breccia
(18) Tuff (15)
Notes: Values in parenthesis are estimates. *These values are for intact rock specimens tested normal to bedding or foliation.

38
Table 2. Influence of grain size distribution on σc (Hatzor et al. 1997).
Sample Porosity (%)
Mineralogy % dolomite
Dmax
(µm) Davg (µm)
Dmax/Davg σc
(MPa) AD5 5.8 70 450 35 12.9 98 AD43 5.4 75 64.3 24.4 2.6 274
Dmax: Maximum grain size ; Davg: Average grain size.
39
FIGURE CAPTIONS
Figure 1. Griffith’s conceptual model.
Figure 2. Global and local polar coordinate systems.
Figure 3. Obtaining L and σ0 parameters.
Figure 4. Application of the point method.
Figure 5. Stress redistribution near the defect tip.
Figure 6. Discontinuous crack growth, on which the TCD (FFM) is based.
Figure 7. Failure criterion in Mohr’s diagram.
Figure 8. Failure criterion in principal stress space.
Figure 9. Variation of tensile and compressive strengths.
Figure 10. Compressive/tensile strength ratio.
Figure 11. Application of failure criterion to: (a) Westerly granite; (b) Lac du Bonnet granite; (c) London
clay.
Figure 12. Comparison with Hoek-Brown criterion.
Figure 13. Comparison between crack initiation (data after Nicksiar and Martin 2013) and peak strength
values (data after Carter et al. 1991) on Lac du Bonnet granite.
Figure 14. Influence of grain size distribution or a/L on uniaxial compression.
Figure 15. Typical microcracks observed in an intact specimen of Westerly granite (Chen 2008): (a)
Crossed nicols; (b) Observation by fluorescent method (brightest parts correspond to cracks).
Figure 16. Influence of porosity on rock strength.
Figure 17. Influence of sample size.
Figure 18. Influence of moisture content on mudstone strength.
40
x
σ1
β
σ3
π/2-βσy
σx
τxy
2a
2b
σy
σx τxy
θ’
Figure 1. Griffith’s conceptual model.
xθ
y
r
r’
θ’
Figure 2. Global and local polar coordinate systems.
41
Figure 3. Obtaining L and σ0 parameters.
Defectθ0
σθ= σ0
x
Figure 4. Application of the point method.

42
Defectr
σ
Grain
Grain
2L
σ0
L/2Elastic
Matrix
Figure 5. Stress redistribution near the defect tip.
Time, t
Crack length, a
Δa=2L
Figure 6. Discontinuous crack growth, on which the TCD (FFM) is based.
43
0
5
10
15
20
-1 0 1 2 3 4 5 6 7 8 9 10
100
10
Griffith's
4
2
a/L=1
Normalised normal stress, /t
No
rma
lise
d s
he
ar
stre
ss, / t
Figure 7. Failure criterion in Mohr’s diagram.
0
10
20
30
-2 -1 0 1 2 3 4 5
100
Griffith's10
42
a/L=1
Normalised minor principal stress, 3/
t
Nor
mal
ised
maj
or p
rin
cipa
l str
ess,
1/
t
Figure 8. Failure criterion in principal stress space.
44
0
0.2
0.4
0.6
0.8
1.0
1 10 100
Half-length of the flaw / Critical distance, a/L
No
rma
lised
tens
ile s
tren
gth
, t/
0
0
20
40
60
1 10 100
Half-length of the flaw / Critical distance, a/L
Nor
mal
ise
d un
conf
ine
d co
mpr
essi
ve s
tren
gth
, c/
0
Figure 9. Variation of tensile and compressive strengths.
0
10
20
30
40
50
60
1 10 100
Half-length of the flaw / Critical distance, a/L
Com
pre
ssiv
e /
tens
ile s
tre
ngth
ra
tio, c/
t
Figure 10. Compressive/tensile strength ratio.
45
0
200
400
600
800
1000
-20 0 20 40 60 80 100
Brace (1964)Hopkins (1986)Haimson and Chang (2000)
Brittle-ductiletransition
r2=0.972
(a) Westerly granite
0=-40 MPa
a/L=5
Minor principal stress, 3 (MPa)
Maj
or p
rinci
pal s
tres
s,
1 (M
Pa)
0
100
200
300
400
500
600
-20 -10 0 10 20 30 40
Carter et al. (1991)
r2=0.998
Brittle-ductiletransition
Ductile failure
(b) Lac du Bonnet granite
0=-29 MPa
a/L=3.7
Minor principal stress, 3 (MPa)
Maj
or p
rinci
pal s
tres
s,
1 (
MP
a)

46
0
100
200
300
400
-40 -30 -20 -10 0 10 20 30 40
Bishop and Garga (1969)
r2=0.985
0=-125 kPa
a/L=14.5
(c) London clay
Minor principal stress, 3 (kPa)
Maj
or p
rinc
ipal
str
ess,
1 (
kPa
)
Figure 11. Application of failure criterion to: (a) Westerly granite; (b) Lac du Bonnet
granite; (c) London clay.
0
100
200
300
400
500
600
-20 -10 0 10 20 30 40
Carter et al. (1991)
r2=0.992
r2=0.998
Hoek-Brown
c=249 MPa
mi=29
Lac du Bonnetgranite
Proposed criterion
0=-29 MPa
a/L=3.7
Minor principal stress, 3 (MPa)
Ma
jor
pri
nci
pa
l str
ess
, 1 (
MP
a)
Figure 12. Comparison with Hoek-Brown criterion.
47
0
100
200
300
400
500
600
-20 -10 0 10 20 30 40 50
Peak strength(Carter et al. 1991)Crack initiation(Nicksiar and Martin 2013)r2=0.962
Brittle-ductiletransition
r2=0.998
Crack initiationa/L=7
0=-29 MPa
Ductile failureLac du Bonnetgranite
Peak strengtha/L=3.7
Minor principal stress, 3 (MPa)
Ma
jor
prin
cipa
l str
ess,
1 (
MP
a)
Figure 13. Comparison between crack initiation (data after Nicksiar and Martin 2013)
and peak strength values (data after Carter et al. 1991) on Lac du Bonnet granite.
50
70
90
110
1.0 1.1 1.2 1.3 1.4 1.5 1.6
Nicksiar andMartin (2014)
0=-2 MPa
Half-length of the flaw / Critical distance, a/Lor
Sorting coefficient
Cra
ck in
itia
tion
un
der
un
iaxi
al c
om
pre
ssio
n (
MP
a)
Figure 14. Influence of grain size distribution or a/L on uniaxial compression.
48
Figure 15. Typical microcracks observed in an intact specimen of Westerly granite
(Chen 2008): (a) Crossed nicols; (b) Observation by fluorescent method (brightest
parts correspond to cracks).
0
50
100
150
200
-25 0 25 50 75
n < 6%6% < n < 13%13% < n < 20%20 % < n < 26%26 % < n
0=-30 MPa
50
17
10
Arenites(Vernik et al. 1993)
6
a/L=4
Normal stress, (MPa)
She
ar s
tres
s,
(M
Pa
)
Figure 16. Influence of porosity on rock strength.
49
0
20
40
60
80
100
-2 -1 0 1 2 3 4 5 6 7 8 9 10
a/L=5.5a/L=7a/L=8.5a/L=11a/L=18Hoek-BrownTest data
Moura mid-brightness coal(Medhurst and Brown 1998)
Sample diameter = 61 mm
101
146
300
mass
0=6.5 MPa
Minor principal stress, 3 (MPa)
Ma
jor
pri
nci
pa
l str
ess
, 1 (
MP
a)
Figure 17. Influence of sample size.
0
5
10
15
20
25
-1 0 1 2 3 4 5 6 7
11% < w < 13%9% < w < 11%7% < w <9%
0.904=r2
0.8770.929
Johnston and Chiu (1984)
Melbourne mudstone
12.5 / -0.7
11 / -1.2
a/L=10.5
0=-1.6 MPa
Minor principal stress, 3 (MPa)
Ma
jor
prin
cip
al s
tres
s,
1 (M
Pa)
Figure 18. Influence of moisture content on mudstone strength.


