

*Employed by a non-US affiliate of HSBC Securities (USA) Inc, and is not registered/qualified pursuant to FINRA regulations.
En
erg
y in
2050
By Karen Ward, Zoe Knight, Nick Robins, Paul Spedding and Charanjit Singh
Anyone who drives a car, heats a home, or runs a factory has every reason to be concerned
about the strains on global energy resources in the next four decades. Either the world is going
to deplete its supplies at an unacceptably fast rate – and overheat the planet in doing so – or it
is going to have to make massive investments in energy efficiency, renewables and carbon
capture. As things stand, the world simply doesn’t have the luxury of turning its back on
nuclear power, despite the recent disaster in Japan
We follow up our World in 2050 report by arguing that the rise of emerging markets will impose
new strains on energy supply. We conclude the world can grow and without excessive
environmental damage – but it will need a change in human behaviour and massive collective
government foresight
Disclosures and Disclaimer This report must be read with the disclosures and analyst
certifications in the Disclosure appendix, and with the Disclaimer, which forms part of it
Glo
bal E
co
no
mic
s &
Clim
ate
Ch
an
ge
Zoe Knight
Analyst
HSBC Bank plc
+44 20 7991 6715
Zoe Knight joined HSBC in 2010 as a senior analyst. She has been an investment analyst at global financial institutions since 1997,
initially focusing on Pan European small-cap strategy and subsequently moving into socially responsible investing, covering climate
change issues. Throughout her career she has been ranked in Extel and II. She holds a BSc (Hons) Economics from the University
of Bath.
March
2011
Energy in 2050Will fuel constraints thwart our growth projections?
Global Economics & Climate Change
March 2011
Nick Robins
Head of HSBC Climate Change Centre of Excellence
HSBC Bank plc
+44 20 7991 6778
Nick Robins, head of the HSBC Climate Change Centre of Excellence, joined the bank in 2007. He has extensive experience in the
policy, business and investment dimensions of climate change and sustainable development.
Karen Ward
Senior Global Economist
HSBC Bank plc
+44 20 7991 3692
Karen joined HSBC in 2006 as UK economist. In 2010 she was appointed Senior Global Economist with responsibility for monitoring
challenges facing the global economy and their implications for financial markets. Before joining HSBC in 2006 Karen worked at the
Bank of England where she provided supporting analysis for the Monetary Policy Committee. She has an MSc Economics from
University College London.
Paul Spedding*
Global Head of Oil & Gas Research
HSBC Bank plc
+44 20 7991 6787
Paul Spedding is HSBC’s Global Head of Oil & Gas Research. He joined HSBC in early 2005 and has nearly 30 years of experience in
oil research.
Charanjit Singh*
Analyst
HSBC Bank plc
+91 80 3001 3776
Charanjit Singh joined HSBC in 2006 and is a member of the Alternative Energy team and Climate Change Centre of Excellence.
He has been a financial and policy analyst since 2000. Prior to joining HSBC, he worked with an energy major and a top-notch rating
company. Charanjit is a Chevening fellow from the University of Edinburgh. He holds a bachelor’s degree in engineering and a
master’s degree in management.

1
Global Economics & Climate Change Energy in 2050 22 March 2011
abc
Even before the recent upheaval in the Middle East, oil prices were approaching USD100 a barrel.
And now the future of nuclear energy is being questioned following the tragic earthquake and
tsunami in Japan. Energy markets are under stress. So how would they cope with an emerging-market
led trebling in world output as we highlighted in our recent research The World in 2050?
‘If only’ energy resources weren’t a constraint and we could continue using energy the way we use it
today, our World in 2050 would require:
A 110% increase in oil demand to more than 190 million barrels a day to fuel the extra billion
cars that are likely to be on the road as emerging world incomes increase.
A doubling in total energy demand as emerging market growth powers ahead.
A doubling in the amount of carbon in the atmosphere, more than three and a half times the
amount recommended to keep temperatures at a safe level.
This can’t happen. In reality:
Energy resources are scarce. Even if demand doesn’t increase, there could be as little as 49 years
of oil left. Gas is less of a constraint, but transporting it and using it to meet transport demand is a
major issue. Coal is the most abundant with 176 years left, but this is the worst carbon culprit.
Energy security – defined in this instance as domestic energy production per head of population – will
be an increasing concern. Diversifying to natural gas to ease the pressure on the oil market won’t
overcome it since its supply is as geographically dense as oil. The most ‘energy insecure’ regions will
be Europe, LATAM and India. However, LATAM and India are trying to address this issue. Europe’s
situation gets worse. In our original report, Europe was the big loser with many countries falling down
or out of the league table of economic size. They could be losing their influence on the world stage
just at the time when they are most vulnerable.
The threat of global warming is not going away. If we fail to meet this challenge, the impact will fall
disproportionately on the emerging world.
The ‘solution’ requires greater energy efficiency and a switch in the mix of energy as well as using
‘carbon capture’ technology to limit the damage of fossil fuel use.
We have become terribly complacent in the way in which we use energy. We highlight a number of
channels where output could increase with significantly lower energy use. The lowest hanging fruit is in
the transport sector. Smaller, more efficient cars will get you from A to B, just not as quickly. Similarly,
Powering 2050

2
Global Economics & Climate Change Energy in 2050 22 March 2011
abc
buildings can be powered much more efficiently, with the cost of alterations coming down quickly as
technology evolves.
To come anywhere near to meeting the climate change targets, non-fossil fuels must play a significantly
greater role in energy use. Renewables are becoming more cost competitive but need to be even more so to
make a significant contribution to total energy supply. New generation biofuels – using agricultural food
waste – could ease the pressure on oil without passing the problem on to the food chain.
Many governments have been looking to nuclear as a significant alternative, although events in Japan may
alter this course. To meet climate targets, we estimate that nuclear will have to play a bigger role. If
Fukushima results in a two-decade freeze on plans, as we saw following the Chernobyl disaster in 1986,
then renewables will have to play an even larger role, or efficiency improvements would have to accelerate
further. A reduced role for nuclear energy would make meeting carbon limits even more challenging.
We emphasise four key points:
A solution is possible, but further efficiency gains and the deployment of low-carbon energy sources
are unlikely to materialise without further upward pressure on fossil fuel prices.
The lead times we highlight on the measures in ‘the solution’ are often long. Therefore the squeeze
on fossil fuels in the interim could be both persistent and painful as oil prices are so sensitive to
minor imbalances between energy demand and supply.
Meeting growth targets will be easier than meeting climate targets. It remains to be seen whether
growth targets and climate targets can be disentangled.
For the transition to our World in 2050 to be smooth, governments will have to work together and
be pre-emptive in driving change, before the commodity crunch really begins to bite.
We acknowledge the efforts of Jeff Davis, Niels Fehre, Andrew Keen and James Pomeroy (HSBC Bank
plc) in the production of this report

3
Global Economics & Climate Change Energy in 2050 22 March 2011
abc
One billion more cars on the road Temptation will be to move to coal to meet higher energy
demands
0
400
800
1200
1600
2000
Today 2050
0
400
800
1200
1600
2000
million million
0
50
100150
200
250
Europe* North
America
South &
Central
America
Middle
East &
Africa
Asia-
PacificYe
ars
Coal Gas Oil
Source: HSBC estimates Source: BP Energy Review. * Europe and the FSU
Energy security will be a major issue if the way we use energy doesn’t change
0 1000 2000 3000 4000 5000 6000 7000 8000
BelgiumColombia
NetherlandsVenezuela
PolandArgentina
ItalySpain
ThailandAustraliaTurkey
Norw aySouth Africa
Malay siaEgy pt
UKIran
South KoreaFrance
GermanyMex ico
JapanSaudi Arabia
CanadaBrazil
IndonesiaRussia
IndiaUS
China
Today 2050 on the 'if only ' scenario'
Total energy use (Million tonnes of oil equiv alent)
Source: World Bank and HSBC calculations

4
Global Economics & Climate Change Energy in 2050 22 March 2011
abc
Energy needs can be met with a little forward planning
0
5000
10000
15000
20000
25000
2010 2050 'If Only ' 2050 'Solution'
Coal Oil Gas Hy dro & other renew ables Nuclear Biomass and w aste
m
Source: HSBC estimates
Energy mix today Energy mix in 2050 required to meet growth and climate targets
28%
32%
21%
6%
10%3%
Coal OilGas NuclearHy dro & other renew ables Biomass & Waste
Total Primary Energy
Demand (Mtoe)
13%
16%
13%
23%
21% 14%
Coal incl. CCS OilGas incl. CCS NuclearHy dro & other renew ables Biomass and w aste
Total Primary Energy
Demand (Mtoe)
I
Source: IEA Source: HSBC estimates

5
Global Economics & Climate Change Energy in 2050 22 March 2011
abc
With the rapid growth of the emerging markets,
the global economy is experiencing a seismic shift.
In a recent report – The World in 2050:
Quantifying the change in the Global Economy,
we provided a framework for understanding why
this was happening and projecting it forward over
the coming decades. Taking into account both the
productivity and expected growth of the workforce
we compiled a list of the Top 30 economies
ranked by size of GDP in 2050 (Chart 1).
We concluded that world output could treble, as
growth accelerates on the back of the strength of
growth in the emerging economies (Chart 2).
Indeed, by 2050, GDP in the emerging world will
have increased five-fold and will be larger than the
developed world. In this piece we consider the
pressure these forecasts will place on global
energy supply and the environment.
We start in this chapter by mapping our GDP
forecasts into demand for energy, for now
assuming there aren’t any resource constraints. We
call this the ‘if only’ scenario.
In Chapter 2 we examine the constraints both in
terms of physical resources, and the impact on
the environment. This shows our ‘if only’
scenario is a dream. In reality we cannot reach
the world we envisage for 2050 in the way we
are using energy today.
To get around this energy constraint – and it is
possible – we need to start using natural resources
more wisely. This has two elements:
The first is energy efficiency, which we tackle in
Chapter 3. The second is changing the mix of
energy inputs, which we discuss in Chapter 4. This
includes a greater role for renewables and, if
sticking with the old fossil fuels, ‘capturing the
carbon’ to limit its harm.
The methodology in this report differs from many
others which start with the fuel supply or climate
constraint and work backwards to find the energy
solution, imposing an ‘assumed’ energy price. By
beginning with an ‘if only’ scenario we can get a
true sense of the pressure on energy markets.
We demonstrate how, even in a fossil-fuel
constrained world, we can both treble world
output, and meet carbon targets. There are two
ways of facilitating the transition; governments
could play a major role, making it smooth and pre-
emptive. If instead it’s left to market forces, long
lead times in delivering extra fossil fuel supply and
more efficient technology will make the journey
from A to B much more volatile.
1. Energy hungry
Emerging markets will power the global economy in next few
decades
This will lead to an enormous increase in energy demand
There will be intense pressure on oil because of the need to power
an extra billion cars

6
Global Economics & Climate Change Energy in 2050 22 March 2011
abc
1. The Top 30 economies by GDP in 2050
Order in 2050 by size
Size of economy in 2050 (constant 2000
USD in billions)
Rank change between now and 2050
_______Income per capita (Constant 2000 USD)_______
Population (Mn)
2050 2010
1 China 24617 2 17372 2396 1417 2 US 22270 -1 55134 36354 404 3 India 8165 5 5060 790 1614 4 Japan 6429 -2 63244 39435 102 5 Germany 3714 -1 52683 25083 71 6 UK 3576 -1 49412 27646 72 7 Brazil 2960 2 13547 4711 219 8 Mexico 2810 5 21793 6217 129 9 France 2750 -3 40643 23881 68 10 Canada 2287 0 51485 26335 44 11 Italy 2194 -4 38445 18703 57 12 Turkey 2149 6 22063 5088 97 13 S. Korea 2056 -2 46657 16463 44 14 Spain 1954 -2 38111 15699 51 15 Russia 1878 2 16174 2934 116 16 Indonesia 1502 5 5215 1178 288 17 Australia 1480 -3 51523 26244 29 18 Argentina 1477 -2 29001 10517 51 19 Egypt 1165 16 8996 3002 130 20 Malaysia 1160 17 29247 5224 40 21 Saudi Arabia 1128 2 25845 9833 44 22 Thailand 856 7 11674 2744 73 23 Netherlands 798 -8 45839 26376 17 24 Poland 786 0 24547 6563 32 25 Iran 732 9 7547 2138 97 26 Colombia 725 13 11530 3052 63 27 Switzerland 711 -7 83559 38739 9 28 Hong Kong 657 -3 76153 35203 9 29 Venezuela 558 7 13268 5438 42 30 South Africa 529 -2 9308 3710 57
Source World Bank, HSBC estimates
2. Growth in the emerging markets will boost global growth
0.0
1.0
2.0
3.0
4.0
1970s 1980s 1990s 2000s 2010s 2020s 2030s 2040s
0.0
1.0
2.0
3.0
4.0
Dev eloped Markets Emerging markets Globa l
% % Contributions to global growth
Source: World Bank, HSBC calculations

Global E
con
om
ics & C
limate C
han
ge
En
ergy in
2050 22 M
arch 2011
7
ab
c3. The energy system
Source: IEA
38%
24%
29%
9%
Industry TransportBuildings & Agriculture Non Energy Use
Total final consumption28%
32%
21%
6%
10%3%
Coal OilGas NuclearHy dro & other renew ables Biomass & Waste
Total Primary Energy
Demand (Mtoe)
TransformationPowerHeatFuels
Energy inputs Energy outputs
38%
24%
29%
9%
Industry TransportBuildings & Agriculture Non Energy Use
Total final consumption28%
32%
21%
6%
10%3%
Coal OilGas NuclearHy dro & other renew ables Biomass & Waste
Total Primary Energy
Demand (Mtoe)
TransformationPowerHeatFuels
Energy inputs
38%
24%
29%
9%
Industry TransportBuildings & Agriculture Non Energy Use
Total final consumption28%
32%
21%
6%
10%3%
Coal OilGas NuclearHy dro & other renew ables Biomass & Waste
Total Primary Energy
Demand (Mtoe)
TransformationPowerHeatFuels
TransformationPowerHeatFuels
Energy inputs Energy outputs

8
Global Economics & Climate Change Energy in 2050 22 March 2011
abc
Changing needs Let’s start by taking a look at the current energy
system for which Chart 3 provides an illustration.
Fossil fuels account for the majority of the energy
consumed. This is decreasing but extremely
slowly. In 1980 fossil fuels accounted for 85% of
the total energy mix. This has fallen to 81%.
Buildings are the main consumer of energy,
taking up more than a third of energy, and the
transport sector accounts for one quarter.
How will this change through time? Before we get
going it’s worth pointing out that our forecasts for
world energy demand and CO2 are based on our
projections for the 40 countries we considered to
reach our Top 30 in 2050. These countries
represent 93% of world GDP today.
We can’t however take our forecasts for GDP for
each country and map them one-for-one into
energy demand because as economies develop
their energy needs change.
Less industry intensive…
For a start, as economies become wealthier, and
once the basic infrastructure has been built,
additional units of output tend to be more service-
sector orientated as incremental growth is focused
on meeting the needs of an increasingly wealthy
domestic population.
In addition, as each economy become wealthier,
some of its manufacturing will be outsourced to
some of the lower-cost countries further down our
Top 30 list.
And so manufacturing as a share of GDP tends to
decline as economies become wealthier (see Chart
4 as an example for the UK).
Manufacturing production uses much more energy
to produce a unit of GDP, a concept we know as
‘energy intensity’ (Chart 5). So at higher levels of
income, additional units of growth tend not to lead
to such large increases in energy consumption.
In addition, the existing manufacturing base tends to
become more energy efficient. Chart 5 shows that
Switzerland has a manufacturing sector that accounts
for 20% of GDP yet its energy intensity, the amount
of energy it needs to consume to produce its output,
was just 0.09 (900,000 tonnes of oil equivalent to
produce a million dollars of output) in 2007,
considerably lower than that of India (0.84) where
manufacturing is only 15% of GDP.
The result is that as economies become less
manufacturing oriented and as more energy
efficient technologies are adopted, the amount of
energy required to produce an additional unit of
GDP is be reduced.
4. As this UK example shows, as economies develop they tend to be less manufacturing intensive
5. And unsurprisingly, manufacturing production uses more energy than service production
10
15
20
25
30
35
10000 15000 20000 25000 30000
GDP per C apita
% G
DP
Man
ufac
turin
g
Aust ralia
China
Germany
India
ItalyJapan
S. Korea
Poland
SpainTurkey
Indonesia
Brazil
France
M exicoNetherlands
Switzerland
US
0.0
0.2
0.4
0.6
0.8
1.0
10 15 20 25 30 35
% GDP Manufacturing
Ene
rgy
Inte
nsity
Source: World Bank Source: World Bank, HSBC calculations

9
Global Economics & Climate Change Energy in 2050 22 March 2011
abc
…but demand for bigger, comfier homes increases…
However, on the flip side, as economic wealth
increases, so does demand for larger, more
comfortable homes and the appliances to go in them.
Today buildings account for more than a third of
total energy use so this will have a significant
impact on final energy demand.
Chart 6 shows that more than half of China’s
population still live in rural housing. This has fallen
dramatically over the past two decades and will
continue as the process of urbanisation proceeds.
7. Chart of average home size by region
0
50
100
150
200
250
US India
0
50
100
150
200
250
m2 m2Av erage home size (square metres )
Source: World Business Council for Sustainable Development
Chart 7 shows that as countries become larger,
average home size increases.
6. As the Chinese rural population moves to towns, energy demand will rise
Rural population as % of total
0102030405060708090
100
1840 1850 1860 1870 1880 1900 1910 1920 1930 1940 1950 1960 1970 1980 1990 2000 2010f
1950 1960 1970 1980 1990 2000 2010f
US China (upper scale)
%
Source: US Census Bureau, CEIC

10
Global Economics & Climate Change Energy in 2050 22 March 2011
abc
and demand for cars increases 8. Higher per-capita income means more cars
0
100
200
300
400
500
600
700
0 20000 40000
GDP per Capita
Num
ber o
f Car
s pe
r 100
0
Source: World Bank, HSBC calculations
At present in China there are 22 cars per 1,000
people. This compares to 450 in the US which is
the level that appears roughly the peak number
per thousand people. Based on the relationship
between cars and income per capita, our forecasts
for income per capita suggest that the number of
cars in China will increase to 350 per thousand by
2050 (Chart 8). This means that the total number
of cars in China will rise from roughly 30 million
passenger vehicles today to almost 500 million. In
India we estimate there to be fewer than 50 cars
per thousand people today. This is likely to rise to
more than 200. This is an increase in cars on the
road of almost 300mn (Chart 9).
Taking our top 30 countries together, the number of
cars on the roads rises by 1 billion from 700mn cars
to 1.7bn (Chart 10)!
10. The number of cars on the road looks set to rise by 1bn
0
400
800
1200
1600
2000
Today 2050
0
400
800
1200
1600
2000
million million
Source: HSBC estimates
9. The emerging world will see a significant rise in car ownership
0
100
200
300
400
500
Japa
n
US
Eur
ope
Sin
gapo
re
Hon
g
S. K
orea
Aus
tralia
Gre
ece
Isra
el
Pola
nd
Arg
entin
a
Mal
aysi
a
Sau
di
Turk
ey
Mex
ico
Chi
na
Russ
ia
Bra
zil
Egy
pt
Thai
land
Ven
ezue
la
Col
ombi
a
Sou
th
Iran
Indo
nesi
a
Indi
a
0
100
200
300
400
500
Today 2050
millionmillion Number of cars
Source: World Bank, HSBC estimates

11
Global Economics & Climate Change Energy in 2050 22 March 2011
abc
The rise in demand for consumer durables as the
economies develop to some extent offsets the
reduction in energy intensity from the changing
‘structure’ of the economy – but not entirely.
Energy intensity – the amount of energy needed to
deliver an additional increment of GDP – clearly
declines as income levels rise (Chart 11).
But we must also account for the fact that the
changing structure will impact the type of energy
input required. Charts 12 to 14 show how
different types of energy demand are met by the
fuels available. So moving from demand for
industrial use towards transport use can lead to
more oil being required and less coal.
12. The transport sector is still primarily dependent on oil inputs
93%
4% 3%
Oil Gas Biomass & Waste
Transportation (Mtoe)
Source: IEA and HSBC calculations
11. Energy intensity declines as economies develop, despite the extra demand for consumer durables
China
ItalyJapan
M ex icoSpain US
Aus traliaBraz il C anada
FranceGerm any
India
S. Korea
Netherlands
Poland
Sw itzerland
Turkey
U K0.0
0.1
0.2
0.3
0.4
0.5
0.6
0.7
0.8
0.9
1.0
0 5000 10000 15000 20000 25000 30000 35000 40000 45000
GDP per capita
Ener
gy In
tens
ity
Source: World Bank, HSBC calculations
13. Buildings and agriculture use a variety of energy sources…
14. …as does industrial use
19.5%
5.1%3.1%
27.3%
28.4%
16.5%
Coal OilGas Biomas s & WasteOther Renew ables Nuclear
Buildings & Agriculture
(Mtoe)
42%
16%
26%
5%2%9%
Coal OilGas Biomass & WasteOther Renew ables Nuclear
Industry (Mtoe)
Source: IEA, HSBC calculations Source: IEA, HSBC calculations

12
Global Economics & Climate Change Energy in 2050 22 March 2011
abc
Chart 15 shows how our forecasts for economic
development in the Top 30 economies translate into
energy demand in 2050 in this ‘if only’ world.
To be clear, here we assume that countries
improve their efficiency, but no quicker than
those that have developed before them.
The increases in the demands from China and
India are most eye-catching but there are
significant gains in the demand of most the
emerging economies.
15. ‘If only’ energy weren’t a constraint, the emerging markets would dominate energy demand in 2050…
0 1000 2000 3000 4000 5000 6000 7000 8000
BelgiumColombia
NetherlandsVenezuela
PolandArgentina
ItalySpain
ThailandAustraliaTurkey
Norw aySouth Africa
Malay siaEgy pt
UKIran
South KoreaFrance
GermanyMex ico
JapanSaudi Arabia
CanadaBrazil
IndonesiaRussia
IndiaUS
China
Today 2050 on the 'if only ' scenario'
Total energy use (Million tonnes of oil equiv alent)
Source: World Bank, HSBC Calculations

13
Global Economics & Climate Change Energy in 2050 22 March 2011
abc
Chart 16 shows the forecasts for global energy
broken down by sector. The biggest growth is in
transport, as rising incomes lead to many more
vehicles on the road. This explains why the largest
rise in energy type is oil (Chart 17) because this, at
present, is the main power behind cars. To put this
into context, this increase in oil demand is equivalent
to a rise from 90 million barrels a day to more than
190 million barrels a day. Coal demand rises by
72%, and natural gas demand increases by 87%.
Biomass and waste grows by 103% and renewables
and nuclear both grow by just under 90% but from
low levels.
The growth in energy demand is not as large as
the increase in GDP (Chart 18). GDP in real
constant dollars trebles, whereas growth in energy
demand doubles. We should highlight again that
this is the ‘if only’ scenario where we assume
present trends continue, ie there is no significant
shift towards electric vehicles from the
combustion engine. This provides us with a
benchmark for considering, at today’s norms,
what pressure this will place on different energy
sources if change doesn’t materialise.
16. As economies develop, more energy is required to power transport and heat buildings…
17. …which on today’s standard technologies leads to a big pick up in demand for oil
0 50 100 150
Total
Transport
Buildings
Industry
0 50 100 150
%'If only ' grow th in energy demand 2010- 2050
020
40
60
80
100
120
Tota
l
ener
gy u
se Oil
Biom
ass
&
Was
teO
ther
rene
wab
les
Gas
Nuc
lear
Coa
l
020
40
60
80
100
120% % 'If only' growth in energy input 2010-2050
Source: HSBC Source: HSBC
18. In the ‘if only’ scenario, energy demand doubles
0
5000
10000
15000
20000
25000
2010 'If only ' 2050
Coal Oil Gas Renew ables Nuclear
m toe
Source: HSBC

14
Global Economics & Climate Change Energy in 2050 22 March 2011
abc
Back to reality Of course, our ‘if only’ scenario is merely a
fantasy. In reality:
Fossil fuels aren’t abundant.
They aren’t evenly spread across the global
population, which gives rise to issues of
energy security and geopolitical tension.
There are worrying signs of climate change.
In this chapter we consider how binding these
constraints are, before we start to consider ways
around them.
Fossil fuels – what’s left? Estimates differ as to the size of the world’s
remaining resources depending on how confident
authorities are over their existence. ‘Proven reserves’
are just that, ‘resource’ is a high degree of certainty
and potential is little more than a good guess. Table
19 shows all these figures. Most worryingly, we can
only be confident that is 49 years of oil left even if
we don’t demand more through time. The recent
discovery of shale gas has significantly lifted the
estimates of proven gas and again ‘potentially’ there
is much more. Coal, which has seen lower demand
since the arrival of the combustion engine, is now by
far the most abundant resource.
2. The strain on global energy resources
Oil is most scarce and set to see the biggest demand
Gas and coal, which are more abundant than oil, will feel the effects
of the oil market squeeze
Left to market forces, elevated fossil fuel prices seem inevitable
19. Fossil fuels – what’s left?
________________ Reserves _________________ ______ Years left at current production _______ Proven Resource Potential Proven Resource Potential
Oil (bn barrels) Conventional 1333 1351 3322 43 44 108 Unconventional 143 150 6829 5 5 223 Total 1476 1500 10151 48 49 331 Gas (bn barrels of oil equivalent) Conventional 942 942 1759 53 53 98 Unconventional 200 1007 5716 11 56 320 Total 1142 1949 7475 64 109 418 Coal (bn tonnes) 826 176
Source: HSBC estimates based on BP, USGS, Rogner ‘An Assessment of World Hydrocarbon Resources, 1997’

15
Global Economics & Climate Change Energy in 2050 22 March 2011
abc
20. Even as more is taken out of the ground, reserve estimates have been revised up through time
0
500
1000
1500
1989 1999 2009
0
50
100
150
200
Oil (LHS) Gas (RHS)
thousand million barrels tn cubic metresReserv e estimates
Source: BP Statistical Review
These reserve numbers are prone to revision
(Chart 20). However, recently the world has been
failing to deliver sufficient new discoveries to
replace production. The IEA estimates that since
1990, each year new discoveries have only been
sufficient to offset half of production (Chart 21).
Equally worrying, the size of fields discovered
has been falling and is currently around one tenth
of the size of discoveries made in the 1960s. And
of course, considerable doubt remains about the
accuracy of reserve data from the Middle East.
According to BP, the Middle East accounts for
nearly 60% of remaining proven reserves and so
any restatement would have a material impact on
the global estimate.
21. New oil discoveries have been disappointing in size
0
20
40
60
1960-69 1970-79 1980-89 1990-99 2000-09
0
50
100
150
200
250
Disc over ies Production Av g size (mb)
Source: IEA
Getting new supply on stream – pinchpoints and prices
In theory, we simply need to work out the
economic cost of getting this energy out of the
ground to work out how demand pressures will
impinge upon prices. Reality is complicated by
two things: lead times and OPEC.
Let’s deal with the economics first. The economic
cost of satisfying the next couple of decades with
oil are low, much lower than today’s oil price
(Chart 22). As we get beyond this oil is harder to
reach and the cost of extraction is greater. At
more than USD100 dollars per barrel, substitutes
for crude such as tar sands and synthetic liquids
become more viable. Towards USD150/barrel
22. Today’s estimate of the prices required to get new ‘oil’ supply on stream
0
50
100
150
52 103 155 206 258
Produced Middle East
Other
conv
EOR
Deep w ater Heav y Oil
inc tar
sands
Shale Sy nthetic liquids
(GTL, CTL, BTL -
from gas & coal)
Ethano l (biofuels)USD/ barrel
Years of energy left at current demand of $85mn/ day
Source: HSBC estimates based on IEA data, GTL = Gas to liquids, CTL = Coal to liquids, BTL = Biomass to liquids , EOR = Enhanced Oil Recovery

16
Global Economics & Climate Change Energy in 2050 22 March 2011
abc
biofuels come into their own (we’ll discuss in
more detail shortly).
OPEC therefore tries to manage oil prices to
maximise revenue while at the same time keeping
prices below the level that might encourage
investment in long-term, unconventional supplies
of liquid fuels (such as tar sands and biofuels) or
promote efficiency improvements. After all, some
members have many years of reserves left and
need to ensure that oil has a long-term role in the
energy equation.
Chart 22 doesn’t, however, provide us with a
ceiling for oil prices. This is because high prices
might spur the investment but it takes many years
to get the supply on tap. For example, a deepwater
field can take more than five years from discovery
until it starts production. Large complex projects
can take even longer. The huge Kashagan field in
Kazakhstan, one of the largest recent discoveries
in the world, was discovered in 2000 and is due to
start production in late 2012 or early 2013.
The incremental cost increases needed to deliver
additional gas and coal are not as extreme as they
are for oil. Quite simply, they don’t get
progressively harder to find. Most conventional
gas fields are commercial at gas prices over
USD3-5/Mcf. This is the same as the US gas price
in 2010 and half the contracted gas price in
Europe and Asia.
Similarly, coal extraction prices have remained
largely unchanged. Truck and shovel operations
have improved in scale, but the basic technology of
digging, washing, railing and shipping coal is, from
a technology viewpoint, relatively static.
Underground mining via larger long-wall extraction
technology is also a well-established technique.
Therefore despite the fact coal and gas can be
substituted for oil (for power generation if not
transport needs) movements and pressures in the
oil market don’t necessarily translate one for one
into coal and gas prices (Chart 23).
23. There can be significant divergences in gas prices by region and the relationship with oil is not tight but nevertheless evident
0
30
60
90
120
150
1985 1990 1995 2000 2005 2010
0
30
60
90
120
150
Euro gas US Gas UK Gas Coal Brent
USD per barrel USD per barrel
Source: Thomson Reuters Datastream and HSBC calculations.

17
Global Economics & Climate Change Energy in 2050 22 March 2011
abc
Energy security So on aggregate, pressures in the oil market could
be in part relieved by increased use of coal and
gas. However, the supply of these alternatives
isn’t necessarily in the right place.
Clearly the problem with gas is that most of it is in
areas that are remote from market, including Siberia
and the Middle East (Iran, Iraq and Qatar). Getting it
to the final user is restricted by the ability to lay a
pipe, or liquefy it and treat it like oil. Both are
expensive and for this reason there can be marked
differences in gas price across regions (Chart 23).
24. There is a lot more coal left than other fuel types, and it’s spread by region
0
50
100150
200
250
Europe* North
America
South &
Central
America
Middle
East &
Africa
Asia-
Pacific
Year
s
Coal Gas Oil
Source: World Energy Council and HSBC analysis * Europe and the FSU
Moreover, Chart 24 shows that the world’s gas
supplies are almost as densely concentrated in
Russia and the Middle East as oil is. Therefore
substituting gas for oil may give you an
alternative, perhaps cheaper, energy source but
the problem of energy security still exists.
Coal is more widely distributed geographically,
with strong reserve bases and existing production
either close to end-demand or in politically stable
regions. In the medium to longer term, therefore,
coal is likely to be less volatile in price and under
less upward pressure from a changing resource
base in comparison to other hydrocarbons.
Chart 25 shows how much of each energy type is
available today, and how much per head of
population. Looking on an energy production per
person basis, the areas which look to be most
‘energy insecure’ are Europe, LATAM and India
by 2035. However, LATAM and India are making
strides in addressing this shortfall by increasing
their energy production faster than their
populations. Europe by contrast is doing the
opposite; suggesting a large strain on energy
security in the region by 2035. Africa has a
similar problem, but energy demand in the region
is far lower.
At the other end of the spectrum, Australia’s vast
gas and coal reserves, coupled with a relatively
small population, place it alongside Russia and
the Middle East among those who are best placed.
The appendix at the back of this report provides a
more detailed analysis on the energy use of each
individual country.

18
Global Economics & Climate Change Energy in 2050 22 March 2011
abc
25. The fossil fuel producers – numbers in parentheses show amount of energy produced per head of population.
589(1.55)
828(2.61)
COAL (Mtce)
606(1.59)
575(1.81)
GAS (bcm)
7.1(0.019)
7.4(0.023)
OIL (mb/d)
20352009US
589(1.55)
828(2.61)
COAL (Mtce)
606(1.59)
575(1.81)
GAS (bcm)
7.1(0.019)
7.4(0.023)
OIL (mb/d)
20352009US
32(0.19)
55(0.38)
COAL (Mtce)
240(1.41)
223(1.54)GAS (bcm)
7.8(0.046)
6.2(0.043)
OIL (mb/d)
20352009N. America (ex US)
32(0.19)
55(0.38)
COAL (Mtce)
240(1.41)
223(1.54)GAS (bcm)
7.8(0.046)
6.2(0.043)
OIL (mb/d)
20352009N. America (ex US)
226(0.14)
208(0.18)
COAL (Mtce)
435(0.26)
207(0.18)
GAS (bcm)
10.3(0.006)
10(0.009)
OIL (mb/d)
20352009Africa
226(0.14)
208(0.18)
COAL (Mtce)
435(0.26)
207(0.18)
GAS (bcm)
10.3(0.006)
10(0.009)
OIL (mb/d)
20352009Africa
99(0.40)
79(0.40)
COAL (Mtce)
195(0.78)
134(0.68)
GAS (bcm)
5.2(0.021)
4.8(0.024)
OIL (mb/d)
20352009LATAM (ex Brazil)
99(0.40)
79(0.40)
COAL (Mtce)
195(0.78)
134(0.68)
GAS (bcm)
5.2(0.021)
4.8(0.024)
OIL (mb/d)
20352009LATAM (ex Brazil)
--COAL (Mtce)
85(0.39)
14(0.07)
GAS (bcm)
5.2(0.073)
2(0.010)
OIL (mb/d)
20352009Brazil
--COAL (Mtce)
85(0.39)
14(0.07)
GAS (bcm)
5.2(0.073)
2(0.010)
OIL (mb/d)
20352009Brazil
221(0.31)
420(0.57)
COAL (Mtce)
569(0.79)
531(0.72)GAS (bcm)
7.5(0.010)
7.7(0.011)OIL (mb/d)
20352009Europe
221(0.31)
420(0.57)
COAL (Mtce)
569(0.79)
531(0.72)GAS (bcm)
7.5(0.010)
7.7(0.011)OIL (mb/d)
20352009Europe
Source: BP Statistical Review and HSBC

19
Global Economics & Climate Change Energy in 2050 22 March 2011
abc
500(0.33)
332(0.27)
COAL (Mtce)
101(0.07)
32(0.03)
GAS (bcm)
0.8(0.001)
0.8(0.001)
OIL (mb/d)
20352009India
500(0.33)
332(0.27)
COAL (Mtce)
101(0.07)
32(0.03)
GAS (bcm)
0.8(0.001)
0.8(0.001)
OIL (mb/d)
20352009India
393(14.82)
331(15.39)
COAL (Mtce)
134(5.05)
45(2.09)
GAS (bcm)
--OIL (mb/d)
20352009Australia
393(14.82)
331(15.39)
COAL (Mtce)
134(5.05)
45(2.09)
GAS (bcm)
--OIL (mb/d)
20352009Australia
540 (0.26)
310 (0.19)
COAL (Mtce)
369 (0.18)
272 (0.17)
GAS (bcm)
2.3 (0.001)
3.5 (0.002)
OIL (mb/d)
20352009Asia (ex China, India)
540 (0.26)
310 (0.19)
COAL (Mtce)
369 (0.18)
272 (0.17)
GAS (bcm)
2.3 (0.001)
3.5 (0.002)
OIL (mb/d)
20352009Asia (ex China, India)
2825(1.93)
2076(1.53)
COAL (Mtce)
185(0.13)
80(0.06)
GAS (bcm)
2.4(0.002)
3.8(0.003)
OIL (mb/d)
20352009China
2825(1.93)
2076(1.53)
COAL (Mtce)
185(0.13)
80(0.06)
GAS (bcm)
2.4(0.002)
3.8(0.003)
OIL (mb/d)
20352009China
193(1.54)
239(1.70)
COAL (Mtce)
814 (6.49)
662 (4.72)GAS (bcm)
9.1 (0.073)
10.2 (0.073)
OIL (mb/d)
20352009Russia
193(1.54)
239(1.70)
COAL (Mtce)
814 (6.49)
662 (4.72)GAS (bcm)
9.1 (0.073)
10.2 (0.073)
OIL (mb/d)
20352009Russia
2(0.01)
2(0.01)
COAL (Mtce)
801(3.10)
393(2.26)GAS (bcm)
38.1(0.147)
24.8(0.142)
OIL (mb/d)
20352009Middle East
2(0.01)
2(0.01)
COAL (Mtce)
801(3.10)
393(2.26)GAS (bcm)
38.1(0.147)
24.8(0.142)
OIL (mb/d)
20352009Middle East
Source: BP Statistical Review and HSBC

20
Global Economics & Climate Change Energy in 2050 22 March 2011
abc
Carbon constraints So oil is too limited in supply and gas often too
hard to transport, leaving coal as the natural
option to meet all the increased demand. That
takes us nicely to the other constraint we’re up
against – climate change – since coal is by far the
most polluting fuel.
26. Increasing carbon emissions….
0100020003000400050006000700080009000
1800
1810
1820
1830
1840
1850
1860
1870
1880
1890
1900
1910
1920
1930
1940
1950
1960
1970
1980
1990
2000
2010
mt CO2
Source: Boden, T.A., G. Marland, and R.J. Andres, 2010. Global, Regional, and National Fossil-Fuel CO2 Emissions. Carbon Dioxide Information Analysis Center, Oak Ridge National Laboratory, U.S. Department of Energy, Oak Ridge, Tenn., U.S.A. doi 10.3334/CDIAC/00001_V2010
After all, the scarcity of fossil fuels isn’t the only
constraint we’re facing. Significant environmental
damage has already been done. Carbon emissions
have increased the carbon stock in the atmosphere
to 8.4 billion metric tonnes since the first
recordings in 1751.
This has coincided with an alarming increase in
global temperatures. Indeed 2010 was the
warmest year since records began in 1880, with a
global average temperature of 14.6˚C (Chart 27).
27. …are resulting in rising temperatures
13.013.213.413.613.814.014.214.414.6
188
0
189
0
190
0
191
0
192
0
193
0
194
019
50
196
0
197
0
198
0
199
0
200
0
201
0
º C
Global long run av erage temperature
Source: National Oceanic and Atmospheric Administration
The outcome of global climate negotiations in
2010 was that warming should be kept to less than
2°C. Temperature rises above this would result in
a reduction in water availability of 20-30% in
some areas, sharp declines in crop yields in
tropical regions and increased incidence of wind
FoodFood
Atlantic Atlantic circulationcirculation
Greenland /Greenland /AntarcticAntarctic
Sea LevelSea Level
Atlantic thermohaline circulation starts to weaken3
Global temperature change (relative to 1900 baseline)1º C 2º C 5º C4º C3º CSector Observed 0.7º C
Modest increases incereal yields intemperate region11
Sharp declines in crop yield in tropical regions3
EcosystemEcosystem
HealthHealth
PermafrostPermafrost 14-80% increase in thawedpockets of soils7
An excess of 1,13,000 diarrhoea,3,000 Malnutrition and 17,000 incidents of Malaria projected per year by 20306
Severe species loss over central Brazil projected if deforestation and fires are not controlled4
WHO attributes150,000 deaths per year to CC5
Melting of permafrost causes damage to Building & infrastructures3
Rising risk of the collapse of Atlantic thermohaline circulation3
Rising risk of Greenland melting irreversibly & collapseof West Antarctic Ice sheet3
Collapse of Greenland may lead to 7 m sea level riset3Rate of sea level rise increased from 1.8 mm/yr to 3.5 mm/ yr (1993-2008)8
The global surface affected by drought doubled since 19709
Amazon might reach a tipping point10
<400 450 >750650550CO2 –eq. 430
FoodFood
Atlantic Atlantic circulationcirculation
Greenland /Greenland /AntarcticAntarctic
Sea LevelSea Level
Atlantic thermohaline circulation starts to weaken3
Global temperature change (relative to 1900 baseline)1º C 2º C 5º C4º C3º CSector Observed 0.7º C
Modest increases incereal yields intemperate region11
Sharp declines in crop yield in tropical regions3
EcosystemEcosystem
HealthHealth
PermafrostPermafrost 14-80% increase in thawedpockets of soils7
An excess of 1,13,000 diarrhoea,3,000 Malnutrition and 17,000 incidents of Malaria projected per year by 20306
Severe species loss over central Brazil projected if deforestation and fires are not controlled4
WHO attributes150,000 deaths per year to CC5
Melting of permafrost causes damage to Building & infrastructures3
Rising risk of the collapse of Atlantic thermohaline circulation3
Rising risk of Greenland melting irreversibly & collapseof West Antarctic Ice sheet3
Collapse of Greenland may lead to 7 m sea level riset3Rate of sea level rise increased from 1.8 mm/yr to 3.5 mm/ yr (1993-2008)8
The global surface affected by drought doubled since 19709
Amazon might reach a tipping point10
<400 450 >750650550CO2 –eq. 430 Source: HSBC’ Too Close for Comfort’, Nick Robins & Zoe Knight, December 2009

21
Global Economics & Climate Change Energy in 2050 22 March 2011
abc
borne disease such as malaria. Increasing resource
shortages and productivity declines come against
a growing, wealthier population whose changing
demands also put pressure on the agricultural
framework.
We also at this juncture need to consider water
availability because water and energy are so
entwined. The feedback loop of declining water
availability also impacts the energy sector, which
can be water intensive. Water is mainly used in
two stages of the energy value chain process,
during production of energy raw materials, and
during the transformation of the raw source into a
form useable by consumers.
Localised water stress has already resulted in power
cuts. In 2003, Electricité de France had to shut down
a quarter of its 58 nuclear plants due to inadequate
water supplies for cooling caused by a record heat
wave. More recently, in 2010, the Chandrapur
thermal power plant in India was closed for a month
as a result of water stress, and in Pakistan, the
hydroelectic industry is suffering from lower levels
of water in reservoirs; hydro power generation was
6000MW in 2009 and has now reduced to 2000MW.
In addition, new power sources are being built in
areas of resource shortage. In India, 79% of new
capacity plants will be built in areas that are already
water scarce or stressed. The table below shows how
much water is withdrawn during the production and
transformation processes for different energy
sources. Using these withdrawal rates 0.46% of
water was withdrawn for electricity in 2010. This is
forecast to increase to 1.61% by 2050. Currently in
India, c90% of water use is for agriculture. As we
progress through the coming decades we expect
water considerations to play a greater role in
power generation planning.
28. Water and energy are intrinsically entwined
Gas and liquid fuels value chain-water consumption
Raw materials - Litres per GJ Transformation - Litres per GJ
Traditional Oil 3-7 25-65 Enhanced Oil Recovery 50-9,000 25-65 Oil sands* 70-1,800 25-65 Corn 9,000-100,000 47-50 Soy 50,000-270,000 Sugar N/A 14 Coal 5-70 Coal-to-liquids: 140-220 Gas Traditional Gas Minimal Natural gas processing: 7 Shale Gas 36-54 Electricity industry value chain-water consumption – thermoelectric fuels
Raw Materials – litres per MWh
Transformation litres per MWh
Coal 20-270 Thermoelectric generation with closed-loop cooling: 720-2,700 Oil, Natural Gas Wide Variance Uranium (nuclear) 170-570 Hydroelectric Evaporative loss:Averages:17,000 Geothermal 5,300 Solar Concentrating solar: 2,800-3,500
Photovoltaic: Minimal Wind Minimal
Source: World Economic Forum

22
Global Economics & Climate Change Energy in 2050 22 March 2011
abc
An enormous challenge…
On our ‘if only’ forecasts of energy use, CO2
stock in the atmosphere would rise by 100% to
56Gt CO2 by 2050 (Chart 29). However, to
contain global warming to below 2°C by 2050 the
global consensus is that world emissions have to
fall by 50% from 1990 levels, which implies a
carbon stock from energy of just c10GtCO2. On
this basis, we could only use the amount of fossil
fuels that we used in 1969!
…which if we fail to meet will impact the emerging world disproportionately Globally we face a major challenge. If we fail to
meet that challenge the effects will fall
disproportionately on the emerging world.
Chart 30 shows that the parts of the world that we
estimate would be most affected by climate change
in 2020 (whereby a scale of 1 represents most
affected). China, India, South East Asia and Brazil –
some of the economies for which we forecast the
strongest energy demand – would be most affected.
This suggests that as the energy hungry emerging
world builds their economic infrastructure, it has
every incentive to do so in a way which is least
energy intensive, in order to minimise their carbon
footprint. In other words, climate change will act as a
‘threat multiplier’ in reducing carbon damage. Of
course that is not to say that the developed world
should not pull its weight given energy use per
capita is so much higher in the US than China.
Overall, it’s quite clear that on our current way of
producing goods and services, trebling world output
by 2050 would place too much pressure on both the
global energy markets, and the environment.
In what follows we consider how the constraints can
be overcome. These are split into improving energy
efficiency, using less energy to produce the goods
and services (improving energy efficiency) and
moving the mix of energy towards more abundant
and less carbon polluting alternatives.
29. We’re way off target in meeting emissions promises
0
10,000
20,000
30,000
40,000
50,000
60,000
1960
1965
1970
1975
1980
1985
1990
1995
2000
2005
2010
2015
2020
2025
2030
2035
2040
2045
2050
World BAU CO2 Emissions World CO2 @ 50% reduction from 1990
mtCO2
Source: HSBC, CDIAC

Global E
con
om
ics & C
limate C
han
ge
En
ergy in
2050 22 M
arch 2011
23
ab
c30. The economies most vulnerable to the impact of climate change (index where 1 equals most affected)
0.74
0.62
0.18
0.45
0.41
0.310.32
0.34
0.54
0.54
0.69
0.40
0.62
First quartile - Highly vulnerable
Third quartile - Less vulnerable
Second Quartile - Moderately vulnerable
Fourth quartile - Marginally Vulnerable
Not investigated
0.53
0.26
0.16
0.55
0.53
0.70
0.43
0.45
0.74
0.62
0.18
0.45
0.41
0.310.32
0.34
0.54
0.54
0.69
0.40
0.62
First quartile - Highly vulnerable
Third quartile - Less vulnerable
Second Quartile - Moderately vulnerable
Fourth quartile - Marginally Vulnerable
Not investigated
0.53
0.26
0.16
0.55
0.53
0.70
0.43
0.45
Source: HSBC

24
Global Economics & Climate Change Energy in 2050 22 March 2011
abc
Getting more out of energy Our forecasts for economic growth will not
materialise if we continue with the way we use
energy today and will place the energy resources
under too much stress. The best way to bypass
this constraint is to work out how to increase
production without as much energy.
Transport
The lowest hanging fruit are in the transport sector.
This is one of the few areas where the ‘less energy
options’ are actually cheaper and therefore most
likely to happen quickly without disrupting growth.
31. Cars account for more than half the demand for transport energy
Road
passenger
53%
Road
freight
23%
Rail freight
3%
Sea freight
10%
-Air
passenger
9%
Source: HSBC, IEA
Passenger vehicles (which represent more than half
of total transport – Chart 31) could be made
significantly more efficient. For a start, engine sizes
could be smaller. Cars will still get you from A to B
and having less acceleration at the traffic lights is
unlikely to hinder economic growth (Chart 32).
32. Smaller engine sizes would make for a more efficient car fleet
0 10 20 30 40
2.0
3.0
M PG
Engi
ne S
ize
(L)
BMW Z4
Source: BMW
33. Consumers are already moving to smaller engine sizes as oil prices rise
1,500
1,600
1,700
1,800
1,900
2,000
2,100
1996
1998
2000
2002
2004
2006
2008
Gasoline engine Diesel engine
Size of engine (cc)
Source: Global Insight, HSBC calculations
Indeed, Chart 33 shows that as oil prices have
crept up in recent years, consumers are already
3. Solution: Efficiency
When energy was cheap, we were using it inefficiently
There are some easy, cheap ways to reduce energy use
Transport offers greatest opportunity for reducing fuel demand

25
Global Economics & Climate Change Energy in 2050 22 March 2011
abc
moving towards smaller engine sizes in response
to higher oil prices.
And Chart 34 really drives home the point that
energy use in transport is a ‘choice variable’.
Areas of the developed world where the
population is just as widely spread as towns in the
US still use considerable less energy for transport.
Australia provides a clear example. It is entirely
clear why this is the case although the social
‘acceptability’ of public transport probably plays
an important role. It might be a little less
comfortable, but it is absolutely possible.
There is also the possibility of moving away from
the combustion engine and electrifying the car
fleet. Electric vehicles (EVs) themselves are more
energy efficient than traditional cars. Of 100 units
of energy put into a car, only 14 of them are used
to propel the car in motion. For electric vehicles
this doubles to 28.
By using power rather than fuel in cars we could
also switch from oil to other energy sources. So
electrifying the car fleet actually spans our two
solutions of efficiency and energy mix.
We expect EVs to play a major role in decarbonising
the economy but at present there are two major
problems with widespread implementation of EVs –
cost and network infrastructure.
An EV costs twice as much as a car with a
standard internal combustion engine. The cost of
the battery – at 50% of the total cost of the vehicle
– plays a significant role. For a significant drop in
EV costs, manufacturers need to produce larger
batches to benefit from economies of scale.
And the life of the battery still means that the
distance that can be travelled before topping up is
too short for it not to be supported by a charging
station network. Such investment requires a larger
take-up of vehicles.
34. Transport energy consumption is a ‘choice’
Tran
spor
t-rel
ated
ene
rgy
cons
umpt
ion
giga
joul
espe
r cap
ita p
er y
ear
0 25 50 75 100 125 150 200 250 3000
10
20
30
40
50
60
70
Houston
PhoenixDetroitDenver
Los AngelesSan Francisco
BostonWashington
ChicagoNew York
TorontoPerthBrisbaneMelbourneSydney
HamburgStockholm
FrankfurtZurichBrusselsMunichWest BerlinVienna
ParisLondon
CopenhagenAmsterdam
SingaporeTokyo
MoscowHong Kong
Urban density inhabitants per hectare
80
North American cities Australian cities European cities Asian cities
Tran
spor
t-rel
ated
ene
rgy
cons
umpt
ion
giga
joul
espe
r cap
ita p
er y
ear
0 25 50 75 100 125 150 200 250 3000
10
20
30
40
50
60
70
Houston
PhoenixDetroitDenver
Los AngelesSan Francisco
BostonWashington
ChicagoNew York
TorontoPerthBrisbaneMelbourneSydney
HamburgStockholm
FrankfurtZurichBrusselsMunichWest BerlinVienna
ParisLondon
CopenhagenAmsterdam
SingaporeTokyo
MoscowHong Kong
Urban density inhabitants per hectare
80
North American cities Australian cities European cities Asian citiesNorth American cities Australian cities European cities Asian cities Source: Newman et Kenworthy, 1989; Atlas Environnement du Monde Diplomatique 2007.

26
Global Economics & Climate Change Energy in 2050 22 March 2011
abc
As such the electric vehicle is somewhat stuck in
a Catch 22. Governments could play a major role
in resolving this.
In parts of the developed world, governments
don’t have much incentive at present to make a
major push in this direction. For example, in the
UK, consumer incentives to encourage lower
petrol consumption might eliminate GBP7bn of
tax revenue by 2030. Indeed, the UK Treasury
looks to have conceded to postponing fuel duty
increases because of the pressure rising fuel prices
are having on people’s discretionary income. This
shows how difficult it is to push consumers to
change habits.
But as we have already highlighted, the potential
for oil prices and energy security to cause a more
significant political disruption could change this.
Governments have been increasingly
implementing exhaust CO2 legislation. Indeed, the
CO2 emission target for passenger cars in Europe
is 130g/km by 2015 and this will be reduced to
95g/km by 2020. Given the high cost of
implementing further significant emission cuts in
the internal combustion engine (especially for
larger cars); we believe that ongoing electrification
of the car fleet (from micro hybrids to full electric
vehicles) will be the only technology to reduce
carbon emission at the right cost.
The emerging world, where the infrastructure is yet
to be established, is making greater strides making
the switch seem more likely and straight forward.
China, with a lot of coal and therefore potential
electricity on its doorstep, is currently subsidising
electric vehicles to increase the production line to
the levels required to spur R&D and larger take
up. Sales of electric vehicles and hybrids
increased by 30% in the US last year compared to
143% in China.
The Global Fuel Initiative, a consortium of
international government regulators, has a target
of increasing the efficiency of the global car fleet
by 50% by 2050. Interestingly this doesn’t hinge
on a complete roll-out of electric vehicles but on
incremental change to the conventional internal
combustion engines and drive systems, along with
weight reductions and better aerodynamics. The
move to electric vehicles, however, will make it
easier to meet climate targets.
Industry
There are also significant efficiency
improvements that could be made in industry. The
new power plants that are being established in the
emerging world are 8-10% more efficient than the
dinosaurs in the western world.
Significant progress has also been made in
primary industry which is expected to continue. In
the last 20 years steel has posted a 29% reduction
in energy consumption per unit of product,
cement a 23% reduction and paper a 12%
reduction, and the implementation of best
available technologies will accelerate efficiency
gains. For example, in the cement industry alone,
converting a ‘wet process’ cement plant to an ‘air
dry’ process can cut energy use by almost 50%.

27
Global Economics & Climate Change Energy in 2050 22 March 2011
abc
Buildings
Buildings account for 38% of the total energy use
and again there are significant improvements that
can be made here since buildings are also
extremely energy inefficient. It is perfectly feasible
to have zero energy homes, which is the direct
target for homebuilders set by some European
governments (Chart 35). Indeed, a new European
directive1 has set that by 2020 all new buildings
are almost zero-energy.
Again this comes at a cost. UK homebuilders
estimate that meeting these criteria can increase the
cost of building a house by around 12%. But these
costs are falling quickly as builders are finding ways
of meeting the standards more efficiently. Indeed by
2016 they estimate these costs will have roughly
halved. Again this is another example whereby the
solutions are there, it’s just while energy has been
cheap, things haven’t been done.
Improving the existing stock is more of a
challenge. After all, at current building rates it
would take 140 years to replace these with new
energy efficient homes. But the existing stock can
still be made more energy efficient. Thermal
1 Directive 2010/31EU of the European Parliament on the Energy Performance of Buildings (May 2010)
renovation work can save the energy used in
buildings by 78%. This can be quick and in the
case of insulating the loft reasonably cheap.
Governments can make a considerable difference
to moving the system in the right direction. This
might simply involve better regulation to ensure
that consumers make rational choices about energy
consumption. For example, a global shift to energy
efficient lighting (CFLs) will cut global electricity
demand by c409TWh per year equivalent,
equivalent to the combined yearly electricity
consumption of the United Kingdom and Denmark.
The resulting cost saving would be cUSD47bn,
paying back the CFL investment within one year.
But the larger benefit would be the avoided energy
infrastructure investment by cUSD112bn.
The World Business Council for Sustainable
Development has put together a proposal to
achieve the necessary transformation in a way that
is realistic given cost and other economic
pressures. They look for a 60% reduction in
energy use by buildings by 2050.
All in all, energy efficiency is the most effective way
of reducing our dependence on energy. Higher fossil
prices will speed up the transition but government
regulation can and will continue to play a role.
35. Government emissions targets on new builds will make a difference but changing the efficiency of the existing stock is a problem
0
20
40
60
80
100
120
France Belgium Denmark Germany
kWh/
Sq.m
per a
nnum
2007 2010 2012 2014 2015 2016 2020
-50%
-99%
-77%
-67%
-30%
-30%
0
20
40
60
80
100
120
France Belgium Denmark Germany
kWh/
Sq.m
per a
nnum
2007 2010 2012 2014 2015 2016 2020
-50%
-99%
-77%
-67%
-30%
-30%
Source: Company data and HSBC estimates

28
Global Economics & Climate Change Energy in 2050 22 March 2011
abc
This page has been left blank intentionally.

29
Global Economics & Climate Change Energy in 2050 22 March 2011
abc
Changing the mix Efficiency will take us some of the way, but
thinking about the type of energy we use is also
important, particularly if pressures on one source
– oil – become more intense.
36. Carbon culprits (gCO2e/kWh)
0
200
400
600
800
1000
Coal Oil Shale
gas
Nat
Gas
Nat
Gas
(CCS)
IEA
2050*
PV WindNuclear
Indirect emissionsCombistion emissions
Source: IEA, HSBC calculations
We have already talked about how moving to
electric vehicles allows us to use other fuel
sources to power vehicles, reducing our
dependence on oil. However, if we move to the
most abundant source – coal – this will have serious
implications for the environment since coal is by far
the worst polluter (Chart 36).
We’ll start by thinking about the alternatives to fossil
fuels. These are renewables, biomass, and nuclear.
We’ll then turn to fossil fuels and how we can limit
their damage to the environment.
Renewables
Renewables are the ultimate fix. They are almost
endless in supply, remove problems of energy
security, and have a limited impact on the
environment.
Chart 37 shows who, given their geographic
location, are best placed to generate renewable
energy. Unsurprisingly, those nearest the equator
– Africa, South America and Asia, have
significant potential for harnessing solar energy
while Russia and North America can increase
biomass production. As such, renewable energy is
not so contingent on location, but instead ‘free’
land use.
4. Solution: changing the mix
Low carbon sources of energy are more costly but prices of
renewables are falling
Second-generation biofuels will help meet transport demand without
damaging the food chain
If nuclear energy is avoided following recent events in Japan,
meeting climate targets will be even more difficult

30
Global Economics & Climate Change Energy in 2050 22 March 2011
abc
37. Renewable energy potential
31000 TWh
N. America
31000 TWh
N. America
42000 TWh
Africa
42000 TWh
Africa
25000 TWh
South America
25000 TWh
South America
11000 TWh
Europe
11000 TWh
Europe
Source: WWF

31
Global Economics & Climate Change Energy in 2050 22 March 2011
abc
5000 TWh
India
5000 TWh
India
12000 TWh
Pacific
12000 TWh
Pacific
7000 TWh
Rest of Asia
7000 TWh
Rest of Asia
15000 TWh
China
15000 TWh
China
30000 TWh
Russia
30000 TWh
Russia
8000 TWh
Middle East
8000 TWh
Middle East

32
Global Economics & Climate Change Energy in 2050 22 March 2011
abc
38. Oil price requirement (USD/barrel) for cost competitiveness of renewable sources with gas and coal
Technology Breakeven with gas
Breakeven with coal
Wind Turbines on shore 192 136 Wind Turbines offshore 404 358 Solar PV 639 603 Solar Thermal 591 554 Fuel Cell 282 230 Biomass 198 142 Geothermal 73 11 Nuclear 101 41
Source: HSBC
The problem with many of the non-fossil fuel
options is the price. Fossil fuel prices would have
to rise significantly from here for many of these to
be a better option (Chart 38). This would explain
why renewables are currently just 1% of the total
energy inputs at present.
39. Renewable energies have become considerably more cost competitive in recent years
0.0
0.2
0.4
0.6
0.8
1.0
1.2
1.4
1950
1955
1960
1965
1970
1975
1980
1985
1990
1995
2000
2005
2010
$ / kWh
Coal costGas costNuclear costSolar costWind cost
Source: US Energy Information Administration
However, as Chart 39 shows, costs have improved
dramatically in the past decade. Electricity
generated by hydropower will remain an
important part of the renewables mix but there is
limited scope for extra capacity as most feasible
hydro sources are already exploited. We see more
opportunities for the use of wind and solar.
Wind
Onshore wind is now reasonably cost compelling
particularly when one considers the added
benefits of energy security. It is also the most
utility scale renewable technology with 100+MW
wind farms frequently being built onshore and
500+MW wind farms offshore.
So by mid-2020 wind could be a mainstream
power generation technology. It is already the
most popular new power generation choice in
Europe, accounting for almost 40% of new
installations in 2008 and 2009. Similarly, in the
US in 2009, wind accounted for nearly 40% of
new installations, only marginally beaten by gas,
which accounted for 43%. China has quickly
grown into the largest wind market in the world. It
has championed a number of domestic wind
turbine manufacturers, which are now looking to
expand internationally. This is helping to push
down the cost of wind energy. The EU is the
birthplace of the wind industry and is still one of
the most supportive regions. Member states have
specific binding wind installation targets for 2020,
which also give targets for other renewables. But
government intervention has played a key role in
this development.
Solar
Solar is attractive as a decentralised form of
electricity generation on roof-tops, since
distribution and grid connection costs as well as
land-related expenses do not have to be
incorporated into electricity generation costs.
Currently solar requires substantial government
incentives to drive deployment. But prices are
steadily falling. The pivotal point comes when the
delivered cost of solar is the same for the
consumer as conventional alternatives – so-called
‘retail grid parity’. Some regions are already cost
competitive for solar, ie those where there is a
high rate of sun isolation, and where retail prices
for electricity are high. This is already the case in
California and Italy. This offers the potential for a
more decentralised energy system avoiding the
inefficiencies in centralised grid networks which
waste large proportions of energy between
generation and use.

33
Global Economics & Climate Change Energy in 2050 22 March 2011
abc
Biofuels
The first generation of biofuels were primarily
produced from food crops such as grains, sugar,
beets and oilseeds.
But this has two problems. The US drive for bio-
ethanol earlier this decade led to a material increase
in arable land dedicated to corn and a consequent
reduction in wheat. As a result this merely shifted
the ‘shortage’ problem onto the food chain leading
to rising corn prices (Charts 40 and 41).
41. …and putting upward pressure on prices
-100
-50
0
50
100
150
200
96 00 04 08
-100
-50
0
50
100
150
200
Oil Corn
%Yr %Yr
Source: Thomson Reuters Datastream
Moreover, biofuels weren’t even obviously better
for the environment since they fell well below the
minimum Green House Gas (GHG) emissions
reductions required by the new EU biofuel rules.
But as ‘food’ to power cars became a major, not
to mention moral, issue technology has already
started evolving.
Now the second generation of biofuels are
evolving which are produced from agriculture and
forestry residues, essentially the waste products
from agriculture (the husks rather than the corn).
These, in theory, do not affect the food chain.
They do, however, need far more processing and
costs need to be cut for the process to be
economic. However, prototype plants for this new
generation of ‘cellulosic ethanol’ are already in
operation and there are several large scale projects
planned. For example, Novozyme of Denmark, a
manufacturer of the enzymes needed for the
process, believes that the first commercial scale
plant could be in operation in 2013.
40. The first generation of biofuels were sucking resources away from the food market…
0
5
10
15
20
25
30
1980 1982 1984 1986 1988 1990 1992 1994 1996 1998 2000 2002 2004 2006 2008 2010
Shar
e (%
) of G
rain
use
d fo
r fue
l eth
anol
in U
S
Source: US Department of Agriculture

34
Global Economics & Climate Change Energy in 2050 22 March 2011
abc
Nuclear
Currently nuclear energy contributes 6% to total
energy production. For many economies nuclear
energy has been the main way of improving energy
security, and nowhere more so than in France. In
1974, France began an intensive programme to build
nuclear power plants to limit its dependence on
imported oil. It now relies on nuclear power for
more than 75% of total electricity production (Chart
42). The same is also true of South Korea, although
it has also diversified into renewables. Since 1980,
the share of oil in South Korea’s electricity
generation has fallen from c80% to c6% in 2008,
while the share of nuclear power generation has
increased to c40%.
Chart 43, which shows current proposals for new
nuclear reactors, shows that many governments had
been counting on nuclear to play a major role in
meeting future energy needs. Recent events in Japan
will undoubtedly cause a rethink of the role nuclear
can play in the energy mix. The average age of the
operating nuclear fleet is currently more than 25
years old. It’s perhaps no surprise then that many
governments have ordered temporary closures of at
least some of their nuclear plants (US, Switzerland,
the UK, Spain, Germany).
42. Many countries see nuclear energy as a way of securing energy supply
0 20 40 60 80 100
ChinaIndia
BrazilMex ico
Netherlands
South AfricaArgentina
CanadaRussia
UKSpain
US
GermanyJapan
S. Korea
Sw itzerlandFrance
% Energy production from nuclear sources
Source: World Bank
Many are also reconsidering their plans for new
installations. China has announced a suspension of
new plant approvals, which was expected to account
for 40% of new installations over the next decade.
After the Chernobyl disaster, there was a two decade
freeze in nuclear expansion. Given current energy
needs, could the same occur again?
43. Nuclear plants are clearly playing a major role in governments plans to meet energy requirements
0
50
100
150
200
Argentina
Belgium
Brazil
Canada
China
Egypt
France
Germ
any
India
Indonesia
Iran
Italy
Japan
South Korea
Mexico
Poland
Russia
South Africa
Spain
Thailand
Turkey
UK
US
A
World (R
HS)
0
200
400
600
800
1000
Operable Under construction Planned Proposed
No No
Source: World Nuclear Association, 2 March 2011

35
Global Economics & Climate Change Energy in 2050 22 March 2011
abc
It is unclear as yet whether this is merely a
temporary reaction at the height of a crisis. Nuclear
industry experts are quick to highlight that design
and safety standards have come a long way since
1967 when the Fukushima plant was constructed
(Chart 44). In particular, new plants have passive
safety systems that rely on gravity and convection to
cool them down. New designs are therefore
apparently ‘fail safe’ compared to the manual
intervention required at Fukushima.
Even if we could be sure this was the case (it seems
likely that in the 1970s engineers would have
described Fukushima in a similar vein) the public
reaction is likely to be intense, with NIMBYism (not
in my back yard) likely to be a persistent restraint on
development.
Nuclear energy has many other problems. First, how
to dispose of nuclear waste? Spent fuel from reactors
will stay above the radioactive level of natural
uranium for more than 100,000 years. Roughly,
270,000 tonnes of spent fuel are in storage today and
some 10,000-12,000 tonnes are added each year,
3,000 of which are reprocessed. Site selection for
final geological repositories has proved to be a long
process and may pose as a significant risk for
nuclear power plant operations.
Uranium enrichment and reprocessing of spent fuel
can also be used to produce nuclear weapons. While
there are international treaties to monitor and curtail
the trade in nuclear material, proliferation risks exist.
Nuclear plants use water to cool the reactor
equipment. Nuclear plants consume larger amounts
of water per unit of electricity produced than IGCC
(coal) and NGCC (natural gas) based plants (Chart
44). However nuclear plants consume less water per
unit of electricity produced than geothermal and
solar thermal power plants.
44. Now on generation III+ of reactor
Source: Http://www.gen-4.org

36
Global Economics & Climate Change Energy in 2050 22 March 2011
abc
Carbon capture and storage As well as shifting to renewables, fossil fuels can
still be used in 2050 but only with carbon capture
and storage technology (CCS).
In essence, CCS captures the CO2 emissions from
exhaust gases at the power plants and stores it, so
that gases are not released into the atmosphere.
The possible storage options include geological
storage, ocean storage, mineral carbonation or
industrial use of CO2.
Typically, applying CCS to a modern
conventional power plant would reduce CO2
emissions by c80-90% compared to a plant
without CCS.
There are currently around 234 CCS projects
globally, with around 42% of these at an
operational stage and 47% in at initial planning.
However, it is expensive – the latest estimates
from the Global CCS Institute increase capex for
IGCC (coal into gas) by 30%, and for other coal
and gas technologies by 80-100%. Even more
worryingly, as more assessment of CCS options
have been undertaken, costs have risen by an
estimated 15-30% compared with three years ago.
In addition, CCS reduces the energy efficiency of
combustion (ie you need energy to pump the gas
into storage), further increasing the cost.
As with nuclear, water is also a constraint with CCS.
CCS is estimated to be 40-60% more water intensive
(per KWh) than conventional coal and gas.
But if fossil fuels are to remain a significant part of
the mix in 2050, CCS is the only way to deliver
fossil fuel energy and meet carbon targets. Of course
this does raise the possibility that growth targets are
met but without the right regulatory framework and
pricing systems climate targets are not.
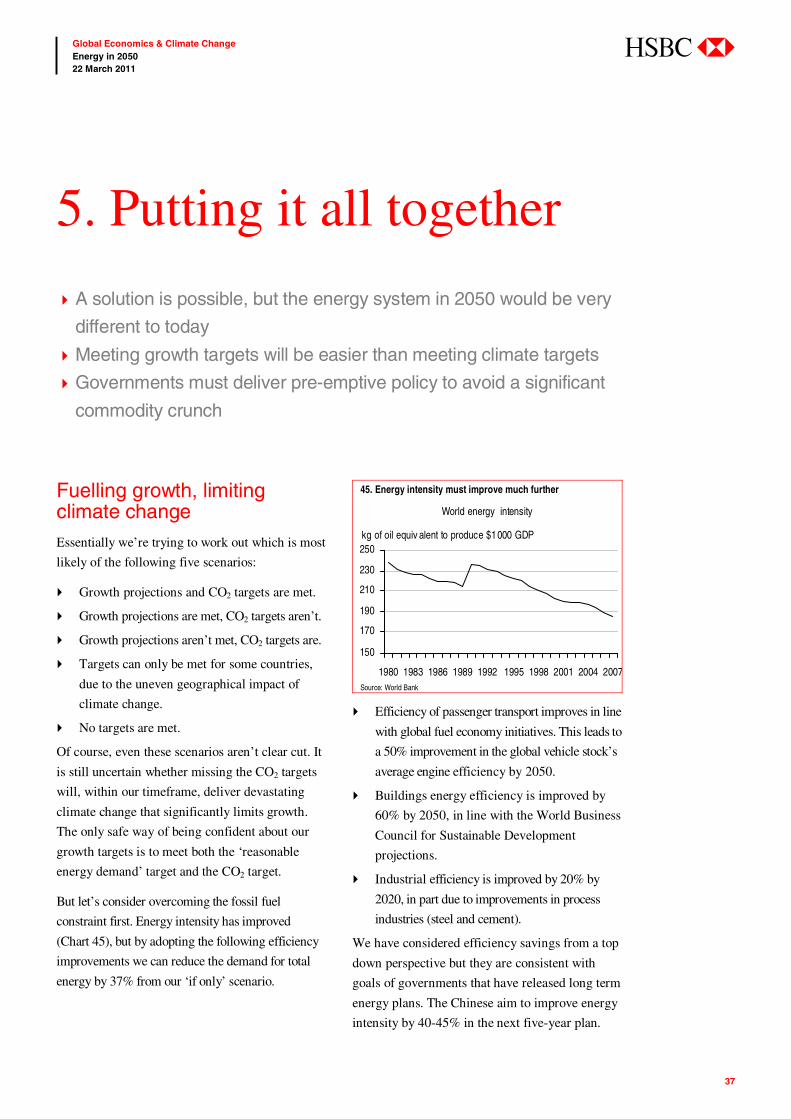
37
Global Economics & Climate Change Energy in 2050 22 March 2011
abc
Fuelling growth, limiting climate change Essentially we’re trying to work out which is most
likely of the following five scenarios:
Growth projections and CO2 targets are met.
Growth projections are met, CO2 targets aren’t.
Growth projections aren’t met, CO2 targets are.
Targets can only be met for some countries,
due to the uneven geographical impact of
climate change.
No targets are met.
Of course, even these scenarios aren’t clear cut. It
is still uncertain whether missing the CO2 targets
will, within our timeframe, deliver devastating
climate change that significantly limits growth.
The only safe way of being confident about our
growth targets is to meet both the ‘reasonable
energy demand’ target and the CO2 target.
But let’s consider overcoming the fossil fuel
constraint first. Energy intensity has improved
(Chart 45), but by adopting the following efficiency
improvements we can reduce the demand for total
energy by 37% from our ‘if only’ scenario.
45. Energy intensity must improve much further
150
170
190
210
230
250
1980 1983 1986 1989 1992 1995 1998 2001 2004 2007
kg of oil equiv alent to produce $1000 GDP
World energy intensity
Source: World Bank
Efficiency of passenger transport improves in line
with global fuel economy initiatives. This leads to
a 50% improvement in the global vehicle stock’s
average engine efficiency by 2050.
Buildings energy efficiency is improved by
60% by 2050, in line with the World Business
Council for Sustainable Development
projections.
Industrial efficiency is improved by 20% by
2020, in part due to improvements in process
industries (steel and cement).
We have considered efficiency savings from a top
down perspective but they are consistent with
goals of governments that have released long term
energy plans. The Chinese aim to improve energy
intensity by 40-45% in the next five-year plan.
5. Putting it all together
A solution is possible, but the energy system in 2050 would be very
different to today
Meeting growth targets will be easier than meeting climate targets
Governments must deliver pre-emptive policy to avoid a significant
commodity crunch

38
Global Economics & Climate Change Energy in 2050 22 March 2011
abc
Chart 46 is a graphical representation of our
solution. The efficiency gains effectively make
the bar smaller.
This demand could be accommodated by fossil
fuels. But if this is the route we take then we will
dramatically miss climate targets; global CO2
emissions will rise rather than fall by the 50%
needed to prevent damaging climate change. As
such, growing global growth is possible with
some concerted efforts to improve intensity.
Meeting the CO2 constraint is a significantly
greater challenge. Chart 48 – a sobering
illustration – describes our estimate of the energy
mix required to meet the carbon constraint and
limit temperature gains.
Fossil fuels represent less than half the total
energy mix, and even here we have a significant
use of carbon capture storage technology with
only 10% of coal use unabated, and 20% of gas.
The share of energy mix met by renewables rises
from 3% to 23%. The fastest growth is seen in
wind and solar. Biomass and waste rises from
10% of the mix to 21%.
Reaching this target is clearly an enormous task
and that assumes that nuclear can play an even
greater role. If events at Fukushima hinder
governments’ desires to build nuclear plants this
will place even greater weight on improving
efficiency or expanding renewables. This will be
difficult to achieve, but greater use of fossil fuels
will make meeting the climate target impossible.
46. Delivering energy in a carbon constrained world
0
5000
10000
15000
20000
25000
2010 2050 'If Only ' 2050 'Solution'
Coal Oil Gas Hy dro & other renew ables Nuclear Biomass and w aste
m toe
Source: HSBC
47. Energy mix today 48. Energy mix in 2050
28%
32%
21%
6%
3%10%
Coal OilGas NuclearHy dro & other renewables Biomass & Waste
Total Primary Energy Demand (Mtoe)
16%23%
13%
14%21%
13%
Coal incl. CCS OilGas incl. CCS NuclearHydro & other renewables Biomass and waste
Total Primary Energy Demand (Mtoe)
Source: IEA Source: HSBC

39
Global Economics & Climate Change Energy in 2050 22 March 2011
abc
Facilitating the change
A bumpy ride if left to market forces
If left to market forces, higher energy prices are
the only way in which efficiency gains or a move
to low-carbon energy sources will occur because
we have demonstrated that many of the alternative
energy sources are not competitive with fossil
fuels prices.
We haven’t given a precise roadmap of how high
oil prices will go and therefore how quickly such
change will occur or how disruptive to growth
along the way, because it is virtually impossible to
forecast. This is because oil prices are extremely
sensitive to small imbalances between supply and
demand. Chart 49 shows that just a one million
barrel shortfall in supply results in a USD20
dollar rise in prices in this simulation. And as we
have discussed, while there is no reason for oil
prices to head materially above USD150 per
barrel before biofuels start making a major
contribution to supply, the length of lead times in
getting new supply on stream could mean very
significant price rises in the meantime.
What we can say is that leaving the change to market
forces could be extremely disruptive, making the
transition to our 2050 world very bumpy.
49. Oil prices are so sensitive to minor fluctuations in supply…
0
20
40
60
80
100
120
140
2005 2007 2009 2011 2013 2015
0
20
40
60
80
100
120
140Lower Pro duction
Feb base
USDUSD World oil price
Source: Oxford Economics

40
Global Economics & Climate Change Energy in 2050 22 March 2011
abc
The role of governments in managing a smooth transition
Governments could play a role in making the
transition significantly smoother. Where institutional
and behavioural barriers prevent consumers making
rational decisions about energy consumption,
product standards enforced through regulation are
also an effective way of raising efficiency levels,
saving consumers money in the process.
There are many ways of making the alternatives
cost compelling starting with pricing the carbon in
fossil fuels or subsidising the non-fossil fuels.
Subsidising
Where do governments get the money from? It is
worth bearing in mind how heavily fossil fuels are
currently subsidised. According to the IEA, in 2009
USD321bn in subsidies were provided for coal, oil,
gas and electricity (Chart 50). Indirect subsidies are
many times greater, for example, through artificially
low royalty payments for the depletion of fossil
fuels. In the US, for example, federal subsidies
estimated at USD2.7bn annually support the oil
industry. There is now growing international
agreement that fossil fuel subsidies should be
removed: the G-20 agreed in 2009 to “rationalize
and phase out over the medium term inefficient
fossil fuel subsidies that encourage wasteful
consumption.” A recent report reveals large gaps in
the reporting of subsidies by G20 countries and no
new action since 2009 have been taken by G20
nations to phase out fossil fuel subsidies.
Compare this USD321bn to the USD45bn that
Bloomberg New Energy Finance currently
estimates as the amount the governments of the
world are providing in support for renewable
energy and biofuels in 2009.
If governments are struggling, public finance
through development banks can also help to
crowd in private capital, for example, through the
provision of loan guarantees, co-lending and
construction guarantees. Equity investments by
multilateral development banks can leverage
about 1:8 to 1:10 times private debt and equity.
This is particularly needed for key pieces of
infrastructure in the clean energy generation
sector (like electric grids for offshore wind) and in
sustainable transport sector (like charging points
for electric vehicles).
Pricing
Getting policymakers to stop doing the wrong thing
is clearly a first step. Addressing market failures is
the next, most notably by reflecting the damage done
by carbon pollution in the price of energy.
50. Fossil fuel subsidies are enormous in the emerging world, accounting for USD321bn
0
10
20
30
40
50
60
70
Iran
Saud
i Ara
bia
Rus
sia
Indi
a
Chi
na
Egy
pt
Vene
zuel
a
Indo
nesi
a
Viet
nam
UAE
Uzb
ekis
tan
Iraq
Kuw
ait
Paki
stan
Arge
ntin
a
Ukr
aine
Alge
ria
Mal
aysi
a
Thai
land
Bang
lade
sh
Mex
ico
Turk
men
ista
n
Sout
h Af
rica
Qat
ar
Kaza
kist
an
Liby
a
Ecua
dor
Taiw
an
Oil subsidy Gas Coal Electricity
Source: IEA Energy Subsidy Database 2009

41
Global Economics & Climate Change Energy in 2050 22 March 2011
abc
The difficulty of applying the carbon price lever
however, is the issue it raises on industrial
competitiveness. Companies argue that if they
have to pay for carbon in one jurisdiction but not
another, companies in the non carbon price
targeted regions are advantaged, resulting in
‘carbon leakage’ so that the net effect is of a shift
of emissions, not a reduction. The carbon leakage
argument can hamper the ability of the mechanism
to function properly. For example, in the first
period of the EU emissions trading scheme, an
over-allocation of allowances in response to the
carbon leakage debate resulted in significant price
declines due to an excess supply of credits.
Of course nobody likes to pay for something that
has historically been free. But experience with
carbon pricing has grown by leaps and bounds
over the past decade. In spite of current political
setbacks in the US and criminal hacking in the EU
system, carbon trading is now an established
feature of the global energy system. Carbon
taxation is also gaining ground (for example in
India and South Africa).
Indeed, carbon pricing has a dual benefit – not
just sending a market signal to curb pollution, but
also raising revenues which could then be used to
cut other taxes, or accelerate clean energy
innovation and deployment. For example, in the
EU, the auctioning of emissions permits could
raise EUR190bn between 2013 and 2020 and in
India, a simple USD1/tonne cess on coal is set to
raise USD700mn a year for clean energy. With
natural capital increasingly the scarce factor of
production and labour in surplus, a tax shift away
from income and onto carbon would serve both
energy and wider job creation goals.
And we have already shown that there are
significant energy improvements that can be made
relatively quickly and relatively simply so higher
prices for corporates and consumers are likely to
speed up the efficiency gains keeping cost
pressure to a minimum.
Regulation
Beyond price, regulation will still be needed. Clean
energy portfolio standards provide investment
certainty, particularly if complemented with feed-in
tariffs or tradeable certificate schemes. To curb
carbon from fossil fuels, emission performance
standards provide a clear signal that fossil fuel
facilities should not emit more than a specified
level. And product standards on the demand-side
(eg fuel efficiency norms for cars, for example)
provide clarity to consumers with positive returns in
terms of fuel savings.
But there are significant challenges in government’s taking pre-emptive action
We do concede that reaching a global consensus
is often challenging, even when the environmental
crisis is so clearly pressing, as the case of global
fish stocks demonstrated only too well. We also
recognise this is a major generational problem.
Will the world’s ageing population concede to
higher ‘green’ taxes to secure the natural
environment for future generations?

42
Global Economics & Climate Change Energy in 2050 22 March 2011
abc
Reasons for optimism Technology will evolve
One reason for optimism is that we are looking at a
40-year time horizon and have found a solution
without having resorted to the ‘technology will
change to find a way’ argument. Our solution is
based on technologies that we know already exist
today even if not yet widely deployed.
But just as the era of stable and cheap energy
prices has made us lazy with efficiency, so too
have we been with energy R&D (Chart 48), but
this changing.
Globally, the relative share of energy in total R&D
has declined significantly, from 12% in 1981 to 4%
in 2008. In absolute terms, the US spends some
USD30bn per year on public sector health care
R&D, while the energy sector only attracts
cUSD5bn per year. The same trend is also evident in
the US corporate sector. For example,
pharmaceutical companies invest 20% of revenues
in RD&D, information technology (15%) and
semiconductors (16%). By contrast, energy firms
invest only 0.23% of revenues in RD&D (National
Science Board, 2010).
And public investment in R&D does make a
difference. The US Department of Energy found that
the investment of USD17.5bn between 1978 and
2000 – primarily in RD&D for energy efficiency and
fossil energy – yielded returns of USD41bn.
Accelerated patent activity is another indicator of the
success of public funding. According to the OECD,
a 10% increase in public R&D spending for
transport efficiency improvements resulted in a 1.8%
increase in high-value patents for hybrid vehicle
technologies and a 0.7% increase for electric
vehicles (OECD, 2010).
Nuclear power R&D has the highest share in
allocations, accounting for c37% in 2008.Getting on
to a low-carbon energy future will mean a 2 to 5
times increase in public R&D spending. But this
would only take energy R&D to 7-16% of 2008
fossil fuel subsidies.
A key feature of China’s 12th Five Year Plan,
launched in March 2011, is a goal to increase the
overall rate of R&D spending as a proportion of
GDP from the current level of 1.7% to 2.2-2.5%,
with a focus on seven Strategic Emerging
Industries, including non-fossil energy, electric
vehicles, new materials, energy efficiency, high
end manufacturing, ICT and biotechnology – all
of which have a low-carbon dimension.
51. Global R&D spending has been abysmally low in recent decades
0
5,000
10,000
15,000
20,000
25,000
1974
1975
1976
1977
1978
1979
1980
1981
1982
1983
1984
1985
1986
1987
1988
1989
1990
1991
1992
1993
1994
1995
1996
1997
1998
1999
2000
2001
2002
2003
2004
2005
2006
2007
2008
2009
0.00%
0.05%
0.10%
0.15%
0.20%
0.25%
0.30%
0.35%
0.40%North America Europe Pacific % GDP (RHS)USDm
Source: IEA RD&D database (*IEA member countries excluding Czech Republic, Poland and the Slovak Republic)

43
Global Economics & Climate Change Energy in 2050 22 March 2011
abc
It has been done before
This solution may seem forbidding, but there are
examples of how it has been achieved without
hindering economic growth.
52. Denmark setting a fine example
0
50
100
150
200
250
1970
1973
1976
1979
1982
1985
1988
1991
1994
1997
2000
2003
2006
2009
GDP Energy Cons. CO2 Emission
Source: Thomson Reuters Datastream, HSBC (Data rebased to 100)
Until the late 1970s Denmark was almost
exclusively dependent on fossil fuels. Since then,
the Danes have managed to sustain consistent
economic growth while keeping energy
consumption broadly flat. Chart 52 shows that
since 1970 the Danish economy has more than
doubled, while energy consumption has barely
increased. In addition, CO2 emissions were
reduced by c30%.
This decoupling has come about through a number
of changes: government incentive schemes,
including both sticks and carrots promoting
renewable energy and cleantech innovations. On
the supply side renewable power has been
promoted since 1980, growing from almost zero to
c30% of total electricity generation by 2009.
On the demand side the Danish society has been
the beneficiary of efficient lighting and better
insulation initiatives, and more importantly
switching to high efficiency district heating. In
2007, 61% of all Danish homes were supplied
with district heating. Energy intensity in Denmark
improved from 0.23 in 1970 to 0.11 in 2006.
Conclusion The era of cheap fuel that has now unambiguously
ended has resulted in a low innovation, somewhat
complacent energy system. Technological and
political inertia often still block the long-term
options that intrinsically cut resource, carbon and
energy risks. Government foresight on a scale not
seen for 40 years will be needed to chart the route
for the next 40 – at a time when the public sector
in the OECD has perhaps the least capacity in
decades to make strategic investments in new
infrastructure. The repeated shocks of economic
turbulence from an unsustainable energy system
may be the only way to push policy in the right
direction.
So as we return to our potential five scenarios:
Growth and CO2 targets are met
Growth targets are met, CO2 aren’t
Growth targets aren’t met, CO2 targets are
Targets can only be met for some countries,
due to the uneven geographical impact of
climate change
No targets are met.
It seems most likely that from an energy
availability perspective growth targets could be
met. Meeting CO2 targets is a more formidable
challenge which requires unprecedented change.

44
Global Economics & Climate Change Energy in 2050 22 March 2011
abc
Country detail

45
Global Economics & Climate Change Energy in 2050 22 March 2011
abc
China Energy input
0%
20%
40%
60%
80%
100%
2000 2001 2002 2003 2004 2005 2006 2007 2008 2009
0%
20%
40%
60%
80%
100%
Oil Gas Coal Nuclear Hydroelectricity
China
Source: BP Statistical Review of World Energy, June 2010
Energy imports Inputs to electricity generation
-4%
-3%
-2%
-1%
0%
1%
1995 2008
-200
-150
-100
-50
0
50
%GDP (LHS) $bn (RHS)
China
0%
20%
40%
60%
80%
100%
1970
1980
1990
2000
Coal Hy dro Nat Gas Nuclear Oil Other
Source: WTO, HSBC calculations Source: World Bank
Carbon emissions and carbon productivity Carbon intensity of energy consumption
0
2,000
4,000
6,000
8,000
1960
1965
1970
1975
1980
1985
1990
1995
2000
2005
0.0
0.1
0.2
0.3
0.4
Emissions USDm GDP per Kt CO2 (RHS)
ktCO2 USDm/ktCO2
1.8
2.3
2.8
3.3
3.8
1970
1975
1980
1985
1990
1995
2000
2005
1.8
2.3
2.8
3.3
3.8
tCO2/toe tCO2/toe
Source: World Bank Source: World Bank

46
Global Economics & Climate Change Energy in 2050 22 March 2011
abc
US Energy input
0%
20%
40%
60%
80%
100%
2000 2001 2002 2003 2004 2005 2006 2007 2008 2009
0%
20%
40%
60%
80%
100%
Oil Gas Coal Nuclear Hydroelectricity
US
Source: BP Statistical Review of World Energy, June 2010
Energy imports Inputs to electricity generation
-3.0%
-2.5%
-2.0%
-1.5%
-1.0%
-0.5%
0.0%
1995 2008
-500
-400
-300
-200
-100
0
%GDP (LHS) $bn (RHS)
US
0%
20%
40%
60%
80%
100%
1970
1980
1990
2000
Coal Hy dro Nat Gas Nuclear Oil Other
Source: WTO, HSBC calculations Source: World Bank
Carbon emissions and carbon productivity Carbon intensity of energy consumption
0
1,000
2,000
3,000
4,000
5,000
6,000
7,000
1960
1965
1970
1975
1980
1985
1990
1995
2000
2005
0.0
0.5
1.0
1.5
2.0
2.5
Emissions USDm GDP per Kt CO2 (RHS)
ktCO2 USDm/ktCO2
2.0
2.2
2.4
2.6
2.8
3.0
1960
1965
1970
1975
1980
1985
1990
1995
2000
2005
2.0
2.2
2.4
2.6
2.8
3.0tCO2/toe tCO2/toe
Source: World Bank Source: World Bank

47
Global Economics & Climate Change Energy in 2050 22 March 2011
abc
India Energy input
0%
20%
40%
60%
80%
100%
2000 2001 2002 2003 2004 2005 2006 2007 2008 2009
0%
20%
40%
60%
80%
100%
Oil Gas Coal Nuclear Hydroelectricity Series6
India
Source: BP Statistical Review of World Energy, June 2010
Energy imports Inputs to electricity generation
-8%
-6%
-4%
-2%
0%
1995 2008
-100
-80
-60
-40
-20
0
%GDP (LHS) $bn (RHS)
India
0%
20%
40%
60%
80%
100%
1970
1980
1990
2000
Coal Hy dro Nat Gas Nuclear Oil Other
Source: WTO, HSBC calculations Source: World Bank
Carbon emissions and carbon productivity Carbon intensity of energy consumption
0
500
1,000
1,500
2,000
1960
1965
1970
1975
1980
1985
1990
1995
2000
2005
0.0
0.1
0.2
0.3
0.4
0.5
0.6
0.7
Emissions U SDm GDP per Kt CO2 (RHS)
ktCO2 USDm/ktCO2
1.0
1.5
2.0
2.5
3.0
1970
1975
1980
1985
1990
1995
2000
2005
1.0
1.5
2.0
2.5
3.0
tCO2/toe tCO2/toe
Source: World Bank Source: World Bank

48
Global Economics & Climate Change Energy in 2050 22 March 2011
abc
Japan Energy input
0%
20%
40%
60%
80%
100%
2000 2001 2002 2003 2004 2005 2006 2007 2008 2009
0%
20%
40%
60%
80%
100%
Oil Gas Coa l Nuclear Hydroelectricity
Japan
Source: BP Statistical Review of World Energy, June 2010
Energy imports Inputs to electricity generation
-6%
-5%
-4%
-3%
-2%
-1%
0%
1995 2008
-300
-250
-200
-150
-100
-50
0
%GDP (LHS) $bn (RHS)
Japan
0%
20%
40%
60%
80%
100%
1970
1980
1990
2000
Coal Hy dro Nat Gas Nuclear Oil Other
Source: WTO, HSBC calculations Source: World Bank
Carbon emissions and carbon productivity Carbon intensity of energy consumption
0
400
800
1,200
1,600
1960
1965
1970
1975
1980
1985
1990
1995
2000
2005
0
1
2
3
4
5
Emissions USDm GDP per Kt CO2 (RHS)
ktCO2 USDm/ktCO
2.0
2.2
2.4
2.6
2.8
3.0
3.2
1960
1965
1970
1975
1980
1985
1990
1995
2000
2005
2.0
2.2
2.4
2.6
2.8
3.0
3.2
tCO2/toe tCO2/toe
Source: World Bank Source: World Bank

49
Global Economics & Climate Change Energy in 2050 22 March 2011
abc
Germany Energy input
0%
20%
40%
60%
80%
100%
2000 2001 2002 2003 2004 2005 2006 2007 2008 2009
0%
20%
40%
60%
80%
100%
Oil Gas Coa l Nuclear Hydroelectricity
Germany
Source: BP Statistical Review of World Energy, June 2010
Energy imports Inputs to electricity generation
-4%
-3%
-2%
-1%
0%
1995 2008
-150
-100
-50
0
%GDP (LHS) $bn (RHS)
Germany
0%
20%
40%
60%
80%
100%
1970
1980
1990
2000
Coal Hy dro Nat Gas Nuclear Oil Other
Source: WTO, HSBC calculations Source: World Bank
Carbon emissions and carbon productivity Carbon intensity of energy consumption
0
200
400600
800
1,000
1,200
1970
1975
1980
1985
1990
1995
2000
2005
0.0
0.5
1.01.5
2.0
2.5
3.0
Emissions USDm GDP per Kt CO2 (RHS)
ktCO2 USDm/ktCO2
2.0
2.2
2.4
2.6
2.8
3.0
3.2
3.4
3.6
1970
1975
1980
1985
1990
1995
2000
2005
2.0
2.2
2.4
2.6
2.8
3.0
3.2
3.4
3.6tCO2/toe tCO2/toe
Source: World Bank Source: World Bank

50
Global Economics & Climate Change Energy in 2050 22 March 2011
abc
UK Energy input
0%
20%
40%
60%
80%
100%
2000 2001 2002 2003 2004 2005 2006 2007 2008 2009
0%
20%
40%
60%
80%
100%
Oil Gas Coal Nuclear Hydroelectricity
UK
Source: BP Statistical Review of World Energy, June 2010
Energy imports Inputs to electricity generation
-1.0%
-0.5%
0.0%
0.5%
1995 2008
-25
-20
-15
-10
-5
0
5
%GDP (LHS) $bn (RHS)
UK
0%
20%
40%
60%
80%
100%
1970
1980
1990
2000
Coal Hy dro Nat Gas Nuclear Oil Other
Source: WTO, HSBC calculations Source: World Bank
Carbon emissions and carbon productivity Carbon intensity of energy consumption
0
100
200
300
400
500
600
700
1960
1965
1970
1975
1980
1985
1990
1995
2000
2005
0.0
0.5
1.0
1.5
2.0
2.5
3.0
3.5
Emissions USDm GDP per Kt CO2 (RHS)
USDm/ktCO2ktCO2
2.0
2.5
3.0
3.5
4.0
1960
1965
1970
1975
1980
1985
1990
1995
2000
2005
2.0
2.5
3.0
3.5
4.0tCO2/toe tCO2/toe
Source: World Bank Source: World Bank

51
Global Economics & Climate Change Energy in 2050 22 March 2011
abc
Brazil Energy input
0%
20%
40%
60%
80%
100%
2000 2001 2002 2003 2004 2005 2006 2007 2008 2009
0%
20%
40%
60%
80%
100%
Oil Gas Coal Nuclear Hydroelectricity
Brazil
Source: BP Statistical Review of World Energy, June 2010
Energy imports Inputs to electricity generation
-1.5%
-1.0%
-0.5%
0.0%
1995 2008
-20
-15
-10
-5
0
%GDP (LHS) $bn (RHS)
Braz il
0%
20%
40%
60%
80%
100%
1970
1980
1990
2000
Coal Hy dro Nat Gas Nuclear Oil Other
Source: WTO, HSBC calculations Source: World Bank
Carbon emissions and carbon productivity Carbon intensity of energy consumption
0
100
200
300
400
1960
1965
1970
1975
1980
1985
1990
1995
2000
2005
0.0
0.5
1.0
1.5
2.0
2.5
3.0
Emissions USDm GDP per Kt CO2 (RHS)
ktCO2 USDm/ktCO2
1.0
1.2
1.4
1.6
1.8
2.0
1970
1975
1980
1985
1990
1995
2000
2005
1.0
1.2
1.4
1.6
1.8
2.0tCO2/toe tCO2/toe
Source: World Bank Source: World Bank

52
Global Economics & Climate Change Energy in 2050 22 March 2011
abc
Mexico Energy input
0%
20%
40%
60%
80%
100%
2000 2001 2002 2003 2004 2005 2006 2007 2008 2009
0%
20%
40%
60%
80%
100%
Oil Gas Coal Nuclear Hydroelectricity
Mexico
Source: BP Statistical Review of World Energy, June 2010
Energy imports Inputs to electricity generation
0.0%
0.5%
1.0%
1.5%
2.0%
2.5%
1995 2008
0
5
10
15
20
%GDP (LHS) $bn (RHS)
Mex ic o
0%
20%
40%
60%
80%
100%
1970
1980
1990
2000
Coal Hy dro Nat Gas Nuclear Oil Other
Source: WTO, HSBC calculations Source: World Bank
Carbon emissions and carbon productivity Carbon intensity of energy consumption
0
100
200
300
400
500
1960
1965
1970
1975
1980
1985
1990
1995
2000
2005
0.0
0.5
1.0
1.5
2.0
Emissions USDm GDP per Kt CO2 (RHS)
ktCO2 USDm/ktCO2
2.4
2.6
2.8
3.0
3.2
3.4
1970
1975
1980
1985
1990
1995
2000
2005
2.4
2.6
2.8
3.0
3.2
3.4tCO2/toe tCO2/toe
Source: World Bank Source: World Bank

53
Global Economics & Climate Change Energy in 2050 22 March 2011
abc
France Energy input
0%
20%
40%
60%
80%
100%
2000 2001 2002 2003 2004 2005 2006 2007 2008 2009
0%
20%
40%
60%
80%
100%
Oil Gas Coal Nuclear Hydroelectricity
France
Source: BP Statistical Review of World Energy, June 2010
Energy imports Inputs to electricity generation
-4.0%
-3.0%
-2.0%
-1.0%
0.0%
1995 2008
-100
-80
-60
-40
-20
0
%GDP (LHS) $bn (RHS)
Franc e
0%
20%
40%
60%
80%
100%
1970
1980
1990
2000
Coal Hy dro Nat Gas Nuclear Oil Other
Source: WTO, HSBC calculations Source: World Bank
Carbon emissions and carbon productivity Carbon intensity of energy consumption
0
100
200
300
400
500
600
1960
1965
1970
1975
1980
1985
1990
1995
2000
2005
0
1
2
3
4
Emissions USDm GDP per Kt CO2 (RHS)
USDm/ktCktCO2
1.0
1.5
2.0
2.5
3.0
3.5
4.0
1960
1965
1970
1975
1980
1985
1990
1995
2000
2005
1.0
1.5
2.0
2.5
3.0
3.5
4.0tCO2/toe tCO2/toe
Source: World Bank Source: World Bank

54
Global Economics & Climate Change Energy in 2050 22 March 2011
abc
Canada Energy input
0%
20%
40%
60%
80%
100%
2000 2001 2002 2003 2004 2005 2006 2007 2008 2009
0%
20%
40%
60%
80%
100%
Oil Gas Coal Nuclear Hydroelectricity
Canada
Source: BP Statistical Review of World Energy, June 2010
Energy imports Inputs to electricity generation
0%
1%
2%
3%
4%
5%
6%
1995 2008
0
20
40
60
80
100
%GDP (LHS) $bn (RHS)
Canada
0%
20%
40%
60%
80%
100%
1970
1980
1990
2000
Coal Hy dro Nat Gas Nuclear Oil Other
Source: WTO, HSBC calculations Source: World Bank
Carbon emissions and carbon productivity Carbon intensity of energy consumption
0
100
200
300
400
500
600
1960
1965
1970
1975
1980
1985
1990
1995
2000
2005
0.0
0.5
1.0
1.5
2.0
Emissions USDm GDP per Kt CO2 (RHS)
ktCO2 USDm/ktCO2
1.8
1.9
2.0
2.1
2.2
2.3
2.4
2.5
2.6
1960
1965
1970
1975
1980
1985
1990
1995
2000
2005
1.8
1.9
2.0
2.1
2.2
2.3
2.4
2.5
2.6
tCO2/toe tCO2/toe
Source: World Bank Source: World Bank

55
Global Economics & Climate Change Energy in 2050 22 March 2011
abc
Italy Energy input
0%
20%
40%
60%
80%
100%
2000 2001 2002 2003 2004 2005 2006 2007 2008 2009
0%
20%
40%
60%
80%
100%
Oil Gas Coal Nuclear Hydroelectricity
Italy
Source: BP Statistical Review of World Energy, June 2010
Energy imports Inputs to electricity generation
-2.5%
-2.0%
-1.5%
-1.0%
-0.5%
0.0%
1995 2008
-60
-50
-40
-30
-20
-10
0
%GDP (LHS) $bn (RHS)
Italy
0%
20%
40%
60%
80%
100%
1970
1980
1990
2000
Coal Hy dro Nat Gas Nuclear Oil Other
Source: WTO, HSBC calculations Source: World Bank
Carbon emissions and carbon productivity Carbon intensity of energy consumption
0
100
200
300
400
500
1960
1965
1970
1975
1980
1985
1990
1995
2000
2005
0.0
0.5
1.0
1.5
2.0
2.5
3.0
Emissions USDm GDP per Kt CO2 (RHS)
ktCO2 USDm/ktCO2
2.5
2.6
2.7
2.8
2.9
3.0
1960
1965
1970
1975
1980
1985
1990
1995
2000
2005
2.5
2.6
2.7
2.8
2.9
3.0tCO2/toe tCO2/toe
Source: World Bank Source: World Bank

56
Global Economics & Climate Change Energy in 2050 22 March 2011
abc
Turkey Energy input
0%
20%
40%
60%
80%
100%
2000 2001 2002 2003 2004 2005 2006 2007 2008 2009
0%
20%
40%
60%
80%
100%
Oil Gas Coal Nuclear Hydroelectricity
Turkey
Source: BP Statistical Review of World Energy, June 2010
Energy imports Inputs to electricity generation
-4%
-3%
-2%
-1%
0%
1995 2008
-30
-25
-20
-15
-10
-5
0
%GDP (LHS) $bn (RHS)
Turkey
0%
20%
40%
60%
80%
100%
1970
1980
1990
2000
Coal Hy dro Nat Gas Nuclear Oil Other
Source: WTO, HSBC calculations Source: World Bank
Carbon emissions and carbon productivity Carbon intensity of energy consumption
0
50
100
150
200
250
300
350
1960
1965
1970
1975
1980
1985
1990
1995
2000
2005
0.0
0.5
1.0
1.5
2.0
2.5
3.0
Emissions USDm GDP per Kt CO2 (RHS)
ktCO2 USDm/ktCO2
1.0
1.5
2.0
2.5
3.0
3.5
1960
1965
1970
1975
1980
1985
1990
1995
2000
2005
1.0
1.5
2.0
2.5
3.0
3.5tCO2/toe tCO2/toe
Source: World Bank Source: World Bank

57
Global Economics & Climate Change Energy in 2050 22 March 2011
abc
South Korea Energy input
0%
20%
40%
60%
80%
100%
2000 2001 2002 2003 2004 2005 2006 2007 2008 2009
0%
20%
40%
60%
80%
100%
Oil Gas Coal Nuclear Hydroelectricity
South Korea
Source: BP Statistical Review of World Energy, June 2010
Energy imports Inputs to electricity generation
-10%
-8%
-6%
-4%
-2%
0%
1995 2008
-100
-80
-60
-40
-20
0
%GDP (LHS) $bn (RHS)
South Korea
0%
20%
40%
60%
80%
100%
1970
1980
1990
2000
Coal Hy dro Nat Gas Nuclear Oil Other
Source: WTO, HSBC calculations Source: World Bank
Carbon emissions and carbon productivity Carbon intensity of energy consumption
0
100
200
300
400
500
600
1960
1965
1970
1975
1980
1985
1990
1995
2000
2005
0.0
0.5
1.0
1.5
2.0
2.5
Emissions USDm GDP per Kt CO2 (RHS)
ktCO2 USDm/ktCO2
2.0
2.4
2.8
3.2
3.6
1970
1975
1980
1985
1990
1995
2000
2005
2.0
2.4
2.8
3.2
3.6
tCO2/toe tCO2/toe
Source: World Bank Source: World Bank

58
Global Economics & Climate Change Energy in 2050 22 March 2011
abc
Spain Energy input
0%
20%
40%
60%
80%
100%
2000 2001 2002 2003 2004 2005 2006 2007 2008 2009
0%
20%
40%
60%
80%
100%
Oil Gas Coal Nuclear Hydroelectricity
Spain
Source: BP Statistical Review of World Energy, June 2010
Energy imports Inputs to electricity generation
-4.0%
-3.0%
-2.0%
-1.0%
0.0%
1995 2008
-50
-40
-30
-20
-10
0
%GDP (LHS) $bn (RHS)
Spain
0%
20%
40%
60%
80%
100%
1970
1980
1990
2000
Coal Hy dro Nat Gas Nuclear Oil Other
Source: WTO, HSBC calculations Source: World Bank
Carbon emissions and carbon productivity Carbon intensity of energy consumption
0
100
200
300
400
1960
1965
1970
1975
1980
1985
1990
1995
2000
2005
0.0
0.5
1.0
1.5
2.0
2.5
Emissions USDm GDP per Kt CO2 (RHS)
ktCO2 USDm/ktCO2
2.0
2.2
2.4
2.6
2.8
3.0
3.2
3.4
1960
1965
1970
1975
1980
1985
1990
1995
2000
2005
2.0
2.2
2.4
2.6
2.8
3.0
3.2
3.4tCO2/toe tCO2/toe
Source: World Bank Source: World Bank

59
Global Economics & Climate Change Energy in 2050 22 March 2011
abc
Russia Energy input
0%
20%
40%
60%
80%
100%
2000 2001 2002 2003 2004 2005 2006 2007 2008 2009
0%
20%
40%
60%
80%
100%
Oil Gas Coal Nuclear Hydroelectricity
Russia
Source: BP Statistical Review of World Energy, June 2010
Energy imports Inputs to electricity generation
0%
5%
10%
15%
20%
1995 2008
0
100
200
300
400
%GDP (LHS) $bn (RHS)
Russ ia
0%
20%
40%
60%
80%
100%
1970
1980
1990
2000
Coal Hy dro Nat Gas Nuclear Oil Other
Source: WTO, HSBC calculations Source: World Bank
Carbon emissions and carbon productivity Carbon intensity of energy consumption
0
500
1,000
1,500
2,000
2,500
1989
1991
1993
1995
1997
1999
2001
2003
2005
0.00
0.05
0.10
0.15
0.20
0.25
0.30
Emissions USDm GDP per Kt CO2 (RHS)
ktCO2 USDm/ktCO2
2.2
2.3
2.4
2.5
2.6
2.7
2.8
1989
1991
1993
1995
1997
1999
2001
2003
2005
2.0
2.1
2.2
2.3
2.4
2.5
2.6
2.7
2.8
tCO2/toe tCO2/toe
Source: World Bank Source: World Bank

60
Global Economics & Climate Change Energy in 2050 22 March 2011
abc
Indonesia Energy input
0%
20%
40%
60%
80%
100%
2000 2001 2002 2003 2004 2005 2006 2007 2008 2009
0%
20%
40%
60%
80%
100%
Oil Gas Coal Nuclear Hydroelectricity
Indonesia
Source: BP Statistical Review of World Energy, June 2010
Energy imports Inputs to electricity generation
0%
1%
2%
3%
4%
5%
1995 2008
0
2
4
6
8
10
12
%GDP (LHS) $bn (RHS)
Indonesia
0%
20%
40%
60%
80%
100%
1970
1980
1990
2000
Coal Hy dro Nat Gas Nuclear Oil Other
Source: WTO, HSBC calculations Source: World Bank
Carbon emissions and carbon productivity Carbon intensity of energy consumption
0
100
200
300
400
500
1960
1965
1970
1975
1980
1985
1990
1995
2000
2005
0.0
0.2
0.4
0.6
0.8
1.0
Emissions USDm GDP per Kt CO2 (RHS)
ktCO2 USDm/ktCO2
1.0
1.2
1.4
1.6
1.8
2.0
2.2
1970
1975
1980
1985
1990
1995
2000
2005
1.0
1.2
1.4
1.6
1.8
2.0
2.2
tCO2/toe tCO2/toe
Source: World Bank Source: World Bank

61
Global Economics & Climate Change Energy in 2050 22 March 2011
abc
Australia Energy input
0%
20%
40%
60%
80%
100%
2000 2001 2002 2003 2004 2005 2006 2007 2008 2009
0%
20%
40%
60%
80%
100%
Oil Gas Coa l Nuclear Hydroelectricity
Australia
Source: BP Statistical Review of World Energy, June 2010
Energy imports Inputs to electricity generation
0.0%
1.0%
2.0%
3.0%
4.0%
1995 2008
0
10
20
30
40
%GDP (LHS) $bn (RHS)
Austra lia
0%
20%
40%
60%
80%
100%
1970
1980
1990
2000
Coal Hy dro Nat Gas Nuclear Oil Other
Source: WTO, HSBC calculations Source: World Bank
Carbon emissions and carbon productivity Carbon intensity of energy consumption
100
150
200
250
300
350
400
1965
1970
1975
1980
1985
1990
1995
2000
2005
0.5
0.7
0.9
1.1
1.3
1.5
Emissions USDm GDP per Kt CO2 (RHS)
ktCO2 USDm/ktCO2
2.5
2.7
2.9
3.1
3.3
3.5
1960
1965
1970
1975
1980
1985
1990
1995
2000
2005
2.5
2.7
2.9
3.1
3.3
3.5tCO2/toe tCO2/to
Source: World Bank Source: World Bank

62
Global Economics & Climate Change Energy in 2050 22 March 2011
abc
Argentina Energy input
0%
20%
40%
60%
80%
100%
2000 2001 2002 2003 2004 2005 2006 2007 2008 2009
0%
20%
40%
60%
80%
100%
Oil Gas Coa l Nuclear Hydroelectricity
A rgentina
Source: BP Statistical Review of World Energy, June 2010
Energy imports Inputs to electricity generation
0.0%
0.2%
0.4%
0.6%
0.8%
1.0%
1995 2008
0.00.5
1.01.52.02.53.03.5
%GDP (LHS) $bn (RHS)
Argentina
0%
20%
40%
60%
80%
100%
1970
1980
1990
2000
Coal Hy dro Nat Gas Nuclear Oil Other
Source: WTO, HSBC calculations Source: World Bank
Carbon emissions and carbon productivity Carbon intensity of energy consumption
0
50
100
150
200
1960
1965
1970
1975
1980
1985
1990
1995
2000
2005
1.5
1.7
1.9
2.1
2.3
2.5
Emissions USDm GDP per Kt CO2 (RHS)
USDm/ktCO2ktCO2
2.2
2.3
2.4
2.5
2.6
2.7
2.8
1970
1975
1980
1985
1990
1995
2000
2005
2.2
2.3
2.4
2.5
2.6
2.7
2.8
tCO2/toe tCO2/toe
Source: World Bank Source: World Bank

63
Global Economics & Climate Change Energy in 2050 22 March 2011
abc
Egypt Energy input
0%
20%
40%
60%
80%
100%
2000 2001 2002 2003 2004 2005 2006 2007 2008 2009
0%
20%
40%
60%
80%
100%
Oil Gas Coal Nuclear Hydroelectricity
Egypt
Source: BP Statistical Review of World Energy, June 2010
Energy imports Inputs to electricity generation
0.0%
1.0%
2.0%
3.0%
4.0%
1995 2008
0
1
2
3
4
5
6
%GDP (LHS) $bn (RHS)
Egy pt
0%
20%
40%
60%
80%
100%
1970
1980
1990
2000
Coal Hy dro Nat Gas Nuclear Oil Other
Source: WTO, HSBC calculations Source: World Bank
Carbon emissions and carbon productivity Carbon intensity of energy consumption
0
50
100
150
200
1960
1965
1970
1975
1980
1985
1990
1995
2000
2005
0.0
0.2
0.4
0.6
0.8
1.0
Emissions USDm GDP per Kt CO2 (RHS)
ktCO2 USDm/ktCO2
2.2
2.4
2.6
2.8
3.0
3.2
3.4
1970
1975
1980
1985
1990
1995
2000
2005
2.2
2.4
2.6
2.8
3.0
3.2
3.4
tCO2/toe tCO2/toe
Source: World Bank Source: World Bank

64
Global Economics & Climate Change Energy in 2050 22 March 2011
abc
Malaysia Energy input
0%
20%
40%
60%
80%
100%
2000 2001 2002 2003 2004 2005 2006 2007 2008 20090%
20%
40%
60%
80%
100%
Oil Gas Coal Nuclear Hydroelectricity
Malaysia
Source: BP Statistical Review of World Energy, June 2010
Energy imports Inputs to electricity generation
0%
2%
4%
6%
8%
10%
1995 2008
0
5
10
15
20
%GDP (LHS) $bn (RHS)
Malay s ia
0%
20%
40%
60%
80%
100%
1970
1980
1990
2000
Coal Hy dro Nat Gas Nuclear Oil Other
Source: WTO, HSBC calculations Source: World Bank
Carbon emissions and carbon productivity Carbon intensity of energy consumption
0
50
100
150
200
250
1969
1974
1979
1984
1989
1994
1999
2004
0.0
0.2
0.4
0.6
0.8
1.0
Emissions USDm GDP per Kt CO2 (RHS)
ktCO2 USDm/ktCO2
2.0
2.2
2.4
2.6
2.8
3.0
3.2
3.4
1970
1975
1980
1985
1990
1995
2000
2005
2.0
2.2
2.4
2.6
2.8
3.0
3.2
3.4tCO2/toe tCO2/toe
Source: World Bank Source: World Bank

65
Global Economics & Climate Change Energy in 2050 22 March 2011
abc
Saudi Arabia Energy input
0%
20%
40%
60%
80%
100%
2000 2001 2002 2003 2004 2005 2006 2007 2008 2009
0%
20%
40%
60%
80%
100%
Oil Gas Coal Nuclear Hydroelectricity
Suadi Arabia
Source: BP Statistical Review of World Energy, June 2010
Energy imports Inputs to electricity generation
0%
20%
40%
60%
80%
1995 2008
0
100
200
300
400
%GDP (LHS) $bn (RHS)
Saudi Arabia
0%
20%
40%
60%
80%
100%
1970
1980
1990
2000
Coal Hy dro Nat Gas Nuclear Oil Other
Source: WTO, HSBC calculations Source: World Bank
Carbon emissions and carbon productivity Carbon intensity of energy consumption
0
100
200
300
400
500
1968
1973
1978
1983
1988
1993
1998
2003
0.0
0.2
0.4
0.6
0.8
1.0
1.2
1.4
Emissions USDm GDP per Kt CO2 (RHS)
ktCO2 USDm/ktCO2
0
2
4
6
8
10
12
14
1970
1975
1980
1985
1990
1995
2000
2005
0
2
4
6
8
10
12
14tCO2/toe tCO2/to
e
Source: World Bank Source: World Bank

66
Global Economics & Climate Change Energy in 2050 22 March 2011
abc
Thailand Energy input
0%
20%
40%
60%
80%
100%
2000 2001 2002 2003 2004 2005 2006 2007 2008 2009
0%
20%
40%
60%
80%
100%
Oil Gas Coal Nuclear Hydroelectricity
Thailand
Source: BP Statistical Review of World Energy, June 2010
Energy imports Inputs to electricity generation
-12%
-10%
-8%
-6%
-4%
-2%
0%
1995 2008
-30
-25
-20
-15
-10
-5
0
%GDP (LHS) $bn (RHS)
Thailand
0%
20%
40%
60%
80%
100%
1970
1980
1990
2000
Coal Hy dro Nat Gas Nuclear Oil Other
Source: WTO, HSBC calculations Source: World Bank
Carbon emissions and carbon productivity Carbon intensity of energy consumption
0
50
100
150
200
250
300
1960
1965
1970
1975
1980
1985
1990
1995
2000
2005
0.0
0.5
1.0
1.5
2.0
2.5
Emissions USDm GDP per Kt CO2 (RHS)
ktCO2 USDm/ktCO2
1.0
1.5
2.0
2.5
3.0
3.5
1970
1975
1980
1985
1990
1995
2000
2005
1.0
1.5
2.0
2.5
3.0
3.5tCO2/toe tCO2/to
e
Source: World Bank Source: World Bank

67
Global Economics & Climate Change Energy in 2050 22 March 2011
abc
Netherlands Energy input
0%
20%
40%
60%
80%
100%
2000 2001 2002 2003 2004 2005 2006 2007 2008 2009
0%
20%
40%
60%
80%
100%
Oil Gas Coal Nuclear Hydroelectricity
Netherlands
Source: BP Statistical Review of World Energy, June 2010
Energy imports Inputs to electricity generation
-2.0%
-1.5%
-1.0%
-0.5%
0.0%
1995 2008
-20
-15
-10
-5
0
%GDP (LHS) $bn (RHS)
Netherlands
0%
20%
40%
60%
80%
100%
1970
1980
1990
2000
Coal Hy dro Nat Gas Nuclear Oil Other
Source: WTO, HSBC calculations Source: World Bank
Carbon emissions and carbon productivity Carbon intensity of energy consumption
0
50
100
150
200
1960
1965
1970
1975
1980
1985
1990
1995
2000
2005
0.0
0.5
1.0
1.5
2.0
2.5
3.0
Emissions USDm GDP per Kt CO2 (RHS)
ktCO2 USDm/ktCO2
2.0
2.2
2.42.6
2.8
3.03.2
3.4
3.6
1960
1965
1970
1975
1980
1985
1990
1995
2000
2005
2.0
2.2
2.42.6
2.8
3.03.2
3.4
3.6
tCO2/toe tCO2/toe
Source: World Bank Source: World Bank

68
Global Economics & Climate Change Energy in 2050 22 March 2011
abc
Poland Energy input
0%
20%
40%
60%
80%
100%
2000 2001 2002 2003 2004 2005 2006 2007 2008 2009
0%
20%
40%
60%
80%
100%
Oil Gas Coal Nuclear Hydroelectricity
Poland
Source: BP Statistical Review of World Energy, June 2010
Energy imports Inputs to electricity generation
-4.0%
-3.0%
-2.0%
-1.0%
0.0%
1995 2008
-20
-15
-10
-5
0
%GDP (LHS) $bn (RHS)
Poland
0%
20%
40%
60%
80%
100%
1970
1980
1990
2000
Coal Hy dro Nat Gas Nuclear Oil Other
Source: WTO, HSBC calculations Source: World Bank
Carbon emissions and carbon productivity Carbon intensity of energy consumption
0
100
200
300
400
1990
1992
1994
1996
1998
2000
2002
2004
2006
0.0
0.2
0.4
0.6
0.8
Emissions USDm GDP per Kt CO2 (RHS)
ktCO2 USDm/ktCO2
3.2
3.3
3.4
3.5
3.6
1990
1992
1994
1996
1998
2000
2002
2004
2006
3.2
3.3
3.4
3.5
3.6
tCO2/toe tCO2/toe
Source: World Bank Source: World Bank

69
Global Economics & Climate Change Energy in 2050 22 March 2011
abc
Iran Energy input
0%
20%
40%
60%
80%
100%
2000 2001 2002 2003 2004 2005 2006 2007 2008 2009
0%
20%
40%
60%
80%
100%
Oil Gas Coal Nuclear Hydroelectricity
Iran
Source: BP Statistical Review of World Energy, June 2010
Energy imports Inputs to electricity generation
0%
5%
10%
15%
20%
25%
30%
1995 2008
0
20
40
60
80
100
%GDP (LHS) $bn (RHS)
Iran
0%
20%
40%
60%
80%
100%
1970
1980
1990
2000
Coal Hy dro Nat Gas Nuclear Oil Other
Source: WTO, HSBC calculations Source: World Bank
Carbon emissions and carbon productivity Carbon intensity of energy consumption
0
100
200
300
400
500
600
1965
1970
1975
1980
1985
1990
1995
2000
2005
0.0
0.1
0.2
0.3
0.4
0.5
0.6
Emissions USDm GDP per Kt CO2 (RHS)
ktCO2 USDm/ktCO
1
2
3
4
5
6
7
1970
1975
1980
1985
1990
1995
2000
2005
1
2
3
4
5
6
7
tCO2/toe tCO2/toe
Source: World Bank Source: World Bank

70
Global Economics & Climate Change Energy in 2050 22 March 2011
abc
Colombia Energy input
0%
20%
40%
60%
80%
100%
2000 2001 2002 2003 2004 2005 2006 2007 2008 2009
0%
20%
40%
60%
80%
100%
Oil Gas Coal Nuclear Hydroelectricity
Colombia
Source: BP Statistical Review of World Energy, June 2010
Energy imports Inputs to electricity generation
0%
2%
4%
6%
8%
1995 2008
0
5
10
15
20
%GDP (LHS) $bn (RHS)
Colom bia
0%
20%
40%
60%
80%
100%
1970
1980
1990
2000
Coal Hy dro Nat Gas Nuclear Oil Other
Source: WTO, HSBC calculations Source: World Bank
Carbon emissions and carbon productivity Carbon intensity of energy consumption
0
20
40
60
80
1960
1965
1970
1975
1980
1985
1990
1995
2000
2005
0.0
0.5
1.0
1.5
2.0
2.5
Emissions USDm GDP per Kt CO2 (RHS)
ktCO2 USDm/ktCO2
1.8
2.0
2.2
2.4
2.6
2.8
1970
1975
1980
1985
1990
1995
2000
2005
1.8
2.0
2.2
2.4
2.6
2.8
tCO2/toe tCO2/toe
Source: World Bank Source: World Bank

71
Global Economics & Climate Change Energy in 2050 22 March 2011
abc
Switzerland Energy input
0%
20%
40%
60%
80%
100%
2000 2001 2002 2003 2004 2005 2006 2007 2008 2009
0%
20%
40%
60%
80%
100%
Oil Gas Coal Nuclear Hydroelectricity
Switzerland
Source: BP Statistical Review of World Energy, June 2010
Energy imports Inputs to electricity generation
-2.5%
-2.0%
-1.5%
-1.0%
-0.5%
0.0%
1995 2008
-12
-10
-8
-6
-4
-2
0
%GDP (LHS) $bn (RHS)
Sw itzerland
0%
20%
40%
60%
80%
100%
1970
1980
1990
2000
Coal Hy dro Nat Gas Nuclear Oil Other
Source: WTO, HSBC calculations Source: World Bank
Carbon emissions and carbon productivity Carbon intensity of energy consumption
0
10
20
30
40
50
1960
1965
1970
1975
1980
1985
1990
1995
2000
2005
0
1
2
3
4
5
6
7
8
Emissions USDm GDP per Kt CO2 (RHS)
ktCO2 USDm/ktC
1.0
1.5
2.0
2.5
3.0
1960
1965
1970
1975
1980
1985
1990
1995
2000
2005
1.0
1.5
2.0
2.5
3.0tCO2/toe tCO2/toe
Source: World Bank Source: World Bank

72
Global Economics & Climate Change Energy in 2050 22 March 2011
abc
Hong Kong Energy input
0%
20%
40%
60%
80%
100%
2000 2001 2002 2003 2004 2005 2006 2007 2008 2009
0%
20%
40%
60%
80%
100%
Oil Gas Coal Nuclear Hydroelectricity
Hong Kong
Source: BP Statistical Review of World Energy, June 2010
Energy imports Inputs to electricity generation
-3.0%
-2.5%
-2.0%
-1.5%
-1.0%
-0.5%
0.0%
1995 2008
-4.8-4.6-4.4-4.2-4.0-3.8-3.6-3.4
%GDP (LHS) $bn (RHS)
Hong Kong
0%
20%
40%
60%
80%
100%
1970
1980
1990
2000
Coal Hy dro Nat Gas Nuclear Oil Other
Source: WTO, HSBC calculations Source: World Bank
Carbon emissions and carbon productivity Carbon intensity of energy consumption
0
10
20
30
40
50
1960
1965
1970
1975
1980
1985
1990
1995
2000
2005
0
1
2
3
4
5
6
Emissions USDm GDP per Kt CO2 (RHS)
ktCO2 USDm/ktCO
2.5
2.7
2.9
3.1
3.3
3.5
3.7
1970
1975
1980
1985
1990
1995
2000
2005
2.5
2.7
2.9
3.1
3.3
3.5
3.7tCO2/toe tCO2/toe
Source: World Bank Source: World Bank

73
Global Economics & Climate Change Energy in 2050 22 March 2011
abc
Venezuela Energy input
0%
20%
40%
60%
80%
100%
2000 2001 2002 2003 2004 2005 2006 2007 2008 2009
0%
20%
40%
60%
80%
100%
Oil Gas Coal Nuclear Hy droelectricity
Venezuela
Source: BP Statistical Review of World Energy, June 2010
Energy imports Inputs to electricity generation
0%
5%
10%
15%
20%
25%
30%
1995 2008
0
20
40
60
80
100
%GDP (LHS) $bn (RHS)
Venezuela
0%
20%
40%
60%
80%
100%
1970
1980
1990
2000
Coal Hy dro Nat Gas Nuclear Oil Other
Source: WTO, HSBC calculations Source: World Bank
Carbon emissions and carbon productivity Carbon intensity of energy consumption
0
50
100
150
200
250
1960
1965
1970
1975
1980
1985
1990
1995
2000
2005
0.0
0.2
0.4
0.6
0.8
1.0
1.2
1.4
1.6
Emissions USDm GDP per Kt CO2 (RHS)
ktCO2 USDm/ktCO2
2.0
2.5
3.0
3.5
4.0
1970
1975
1980
1985
1990
1995
2000
2005
2.0
2.5
3.0
3.5
4.0tCO2/toe tCO2/toe
Source: World Bank Source: World Bank

74
Global Economics & Climate Change Energy in 2050 22 March 2011
abc
South Africa Energy input
0%
20%
40%
60%
80%
100%
2000 2001 2002 2003 2004 2005 2006 2007 2008 2009
0%
20%
40%
60%
80%
100%
Oil Gas Coa l Nuclear Hydroelectricity
South A frica
Source: BP Statistical Review of World Energy, June 2010
Energy imports Inputs to electricity generation
-6%
-5%
-4%
-3%
-2%
-1%
0%
1995 2008
-20
-15
-10
-5
0
%GDP (LHS) $bn (RHS)
South Africa
0%
20%
40%
60%
80%
100%
1970
1980
1990
2000
Coal Hy dro Nat Gas Nuclear Oil Other
Source: WTO, HSBC calculations Source: World Bank
Carbon emissions and carbon productivity Carbon intensity of energy consumption
0
100
200
300
400
500
1960
1965
1970
1975
1980
1985
1990
1995
2000
2005
0.0
0.1
0.2
0.3
0.4
0.5
Emissions USDm GDP per Kt CO2 (RHS)
ktCO2 USDm/ktCO2
3.0
3.1
3.2
3.3
3.4
3.5
3.6
3.7
3.8
1970
1975
1980
1985
1990
1995
2000
2005
3.0
3.1
3.2
3.3
3.4
3.5
3.6
3.7
3.8tCO2/toe tCO2/toe
Source: World Bank Source: World Bank

75
Global Economics & Climate Change Energy in 2050 22 March 2011
abc
Disclosure appendix Analyst Certification The following analyst(s), economist(s), and/or strategist(s) who is(are) primarily responsible for this report, certifies(y) that the opinion(s) on the subject security(ies) or issuer(s) and/or any other views or forecasts expressed herein accurately reflect their personal view(s) and that no part of their compensation was, is or will be directly or indirectly related to the specific recommendation(s) or views contained in this research report: Karen Ward, Zoe Knight, Nick Robins, Paul Spedding and Charanjit Singh.
Important Disclosures This document has been prepared and is being distributed by the Research Department of HSBC and is intended solely for the clients of HSBC and is not for publication to other persons, whether through the press or by other means.
This document is for information purposes only and it should not be regarded as an offer to sell or as a solicitation of an offer to buy the securities or other investment products mentioned in it and/or to participate in any trading strategy. Advice in this document is general and should not be construed as personal advice, given it has been prepared without taking account of the objectives, financial situation or needs of any particular investor. Accordingly, investors should, before acting on the advice, consider the appropriateness of the advice, having regard to their objectives, financial situation and needs. If necessary, seek professional investment and tax advice.
Certain investment products mentioned in this document may not be eligible for sale in some states or countries, and they may not be suitable for all types of investors. Investors should consult with their HSBC representative regarding the suitability of the investment products mentioned in this document and take into account their specific investment objectives, financial situation or particular needs before making a commitment to purchase investment products.
The value of and the income produced by the investment products mentioned in this document may fluctuate, so that an investor may get back less than originally invested. Certain high-volatility investments can be subject to sudden and large falls in value that could equal or exceed the amount invested. Value and income from investment products may be adversely affected by exchange rates, interest rates, or other factors. Past performance of a particular investment product is not indicative of future results.
Analysts, economists, and strategists are paid in part by reference to the profitability of HSBC which includes investment banking revenues.
For disclosures in respect of any company mentioned in this report, please see the most recently published report on that company available at www.hsbcnet.com/research.
* HSBC Legal Entities are listed in the Disclaimer below.
Additional disclosures 1 This report is dated as at 22 March 2011. 2 All market data included in this report are dated as at close 18 March 2011, unless otherwise indicated in the report. 3 HSBC has procedures in place to identify and manage any potential conflicts of interest that arise in connection with its
Research business. HSBC's analysts and its other staff who are involved in the preparation and dissemination of Research operate and have a management reporting line independent of HSBC's Investment Banking business. Information Barrier procedures are in place between the Investment Banking and Research businesses to ensure that any confidential and/or price sensitive information is handled in an appropriate manner.

76
Global Economics & Climate Change Energy in 2050 22 March 2011
abc
Disclaimer * Legal entities as at 31 January 2010 'UAE' HSBC Bank Middle East Limited, Dubai; 'HK' The Hongkong and Shanghai Banking Corporation Limited, Hong Kong; 'TW' HSBC Securities (Taiwan) Corporation Limited; 'CA' HSBC Securities (Canada) Inc, Toronto; HSBC Bank, Paris branch; HSBC France; 'DE' HSBC Trinkaus & Burkhardt AG, Dusseldorf; 000 HSBC Bank (RR), Moscow; 'IN' HSBC Securities and Capital Markets (India) Private Limited, Mumbai; 'JP' HSBC Securities (Japan) Limited, Tokyo; 'EG' HSBC Securities Egypt S.A.E., Cairo; 'CN' HSBC Investment Bank Asia Limited, Beijing Representative Office; The Hongkong and Shanghai Banking Corporation Limited, Singapore branch; The Hongkong and Shanghai Banking Corporation Limited, Seoul Securities Branch; The Hongkong and Shanghai Banking Corporation Limited, Seoul Branch; HSBC Securities (South Africa) (Pty) Ltd, Johannesburg; 'GR' HSBC Pantelakis Securities S.A., Athens; HSBC Bank plc, London, Madrid, Milan, Stockholm, Tel Aviv, 'US' HSBC Securities (USA) Inc, New York; HSBC Yatirim Menkul Degerler A.S., Istanbul; HSBC México, S.A., Institución de Banca Múltiple, Grupo Financiero HSBC, HSBC Bank Brasil S.A. - Banco Múltiplo, HSBC Bank Australia Limited, HSBC Bank Argentina S.A., HSBC Saudi Arabia Limited., The Hongkong and Shanghai Banking Corporation Limited, New Zealand Branch.
Issuer of report HSBC Bank plc 8 Canada Square, London
E14 5HQ, United Kingdom
Telephone: +44 20 7991 8888 Fax: +44 20 7992 4880
Website: www.research.hsbc.com
This document is issued and approved in the United Kingdom by HSBC Bank plc for the information of its Clients (as defined in the Rules of FSA) and those of its affiliates only. If this research is received by a customer of an affiliate of HSBC, its provision to the recipient is subject to the terms of business in place between the recipient and such affiliate. In Australia, this publication has been distributed by The Hongkong and Shanghai Banking Corporation Limited (ABN 65 117 925 970, AFSL 301737) for the general information of its “wholesale” customers (as defined in the Corporations Act 2001). Where distributed to retail customers, this research is distributed by HSBC Bank Australia Limited (AFSL No. 232595). These respective entities make no representations that the products or services mentioned in this document are available to persons in Australia or are necessarily suitable for any particular person or appropriate in accordance with local law. No consideration has been given to the particular investment objectives, financial situation or particular needs of any recipient. The document is distributed in Hong Kong by The Hongkong and Shanghai Banking Corporation Limited and in Japan by HSBC Securities (Japan) Limited. Each of the companies listed above (the “Participating Companies”) is a member of the HSBC Group of Companies, any member of which may trade for its own account as Principal, may have underwritten an issue within the last 36 months or, together with its Directors, officers and employees, may have a long or short position in securities or instruments or in any related instrument mentioned in the document. Brokerage or fees may be earned by the Participating Companies or persons associated with them in respect of any business transacted by them in all or any of the securities or instruments referred to in this document. In Korea, this publication is distributed by either The Hongkong and Shanghai Banking Corporation Limited, Seoul Securities Branch ("HBAP SLS") or The Hongkong and Shanghai Banking Corporation Limited, Seoul Branch ("HBAP SEL") for the general information of professional investors specified in Article 9 of the Financial Investment Services and Capital Markets Act (“FSCMA”). This publication is not a prospectus as defined in the FSCMA. It may not be further distributed in whole or in part for any purpose. Both HBAP SLS and HBAP SEL are regulated by the Financial Services Commission and the Financial Supervisory Service of Korea. This publication is distributed in New Zealand by The Hongkong and Shanghai Banking Corporation Limited, New Zealand Branch. The information in this document is derived from sources the Participating Companies believe to be reliable but which have not been independently verified. The Participating Companies make no guarantee of its accuracy and completeness and are not responsible for errors of transmission of factual or analytical data, nor shall the Participating Companies be liable for damages arising out of any person’s reliance upon this information. All charts and graphs are from publicly available sources or proprietary data. The opinions in this document constitute the present judgement of the Participating Companies, which is subject to change without notice. This document is neither an offer to sell, purchase or subscribe for any investment nor a solicitation of such an offer. HSBC Securities (USA) Inc. accepts responsibility for the content of this research report prepared by its non-US foreign affiliate. All US persons receiving and/or accessing this report and intending to effect transactions in any security discussed herein should do so with HSBC Securities (USA) Inc. in the United States and not with its non-US foreign affiliate, the issuer of this report. In Singapore, this publication is distributed by The Hongkong and Shanghai Banking Corporation Limited, Singapore Branch for the general information of institutional investors or other persons specified in Sections 274 and 304 of the Securities and Futures Act (Chapter 289) (“SFA”) and accredited investors and other persons in accordance with the conditions specified in Sections 275 and 305 of the SFA. This publication is not a prospectus as defined in the SFA. It may not be further distributed in whole or in part for any purpose. The Hongkong and Shanghai Banking Corporation Limited Singapore Branch is regulated by the Monetary Authority of Singapore. Recipients in Singapore should contact a "Hongkong and Shanghai Banking Corporation Limited, Singapore Branch" representative in respect of any matters arising from, or in connection with this report. HSBC México, S.A., Institución de Banca Múltiple, Grupo Financiero HSBC is authorized and regulated by Secretaría de Hacienda y Crédito Público and Comisión Nacional Bancaria y de Valores (CNBV). HSBC Bank (Panama) S.A. is regulated by Superintendencia de Bancos de Panama. Banco HSBC Honduras S.A. is regulated by Comisión Nacional de Bancos y Seguros (CNBS). Banco HSBC Salvadoreño, S.A. is regulated by Superintendencia del Sistema Financiero (SSF). HSBC Colombia S.A. is regulated by Superintendencia Financiera de Colombia. Banco HSBC Costa Rica S.A. is supervised by Superintendencia General de Entidades Financieras (SUGEF). Banistmo Nicaragua, S.A. is authorized and regulated by Superintendencia de Bancos y de Otras Instituciones Financieras (SIBOIF). The document is intended to be distributed in its entirety. Unless governing law permits otherwise, you must contact a HSBC Group member in your home jurisdiction if you wish to use HSBC Group services in effecting a transaction in any investment mentioned in this document. HSBC Bank plc is registered in England No 14259, is authorised and regulated by the Financial Services Authority and is a member of the London Stock Exchange. (070905) © Copyright. HSBC Bank plc 2011, ALL RIGHTS RESERVED. No part of this publication may be reproduced, stored in a retrieval system, or transmitted, on any form or by any means, electronic, mechanical, photocopying, recording, or otherwise, without the prior written permission of HSBC Bank plc. MICA (P) 142/06/2010 and MICA (P) 193/04/2010
[293253]

*Employed by a non-US affiliate of HSBC Securities (USA) Inc, and is not registered/qualified pursuant to FINRA regulations.
En
erg
y in
2050
By Karen Ward, Zoe Knight, Nick Robins, Paul Spedding and Charanjit Singh
Anyone who drives a car, heats a home, or runs a factory has every reason to be concerned
about the strains on global energy resources in the next four decades. Either the world is going
to deplete its supplies at an unacceptably fast rate – and overheat the planet in doing so – or it
is going to have to make massive investments in energy efficiency, renewables and carbon
capture. As things stand, the world simply doesn’t have the luxury of turning its back on
nuclear power, despite the recent disaster in Japan
We follow up our World in 2050 report by arguing that the rise of emerging markets will impose
new strains on energy supply. We conclude the world can grow and without excessive
environmental damage – but it will need a change in human behaviour and massive collective
government foresight
Disclosures and Disclaimer This report must be read with the disclosures and analyst
certifications in the Disclosure appendix, and with the Disclaimer, which forms part of it
Glo
bal E
co
no
mic
s &
Clim
ate
Ch
an
ge
Zoe Knight
Analyst
HSBC Bank plc
+44 20 7991 6715
Zoe Knight joined HSBC in 2010 as a senior analyst. She has been an investment analyst at global financial institutions since 1997,
initially focusing on Pan European small-cap strategy and subsequently moving into socially responsible investing, covering climate
change issues. Throughout her career she has been ranked in Extel and II. She holds a BSc (Hons) Economics from the University
of Bath.
March
2011
Energy in 2050Will fuel constraints thwart our growth projections?
Global Economics & Climate Change
March 2011
Nick Robins
Head of HSBC Climate Change Centre of Excellence
HSBC Bank plc
+44 20 7991 6778
Nick Robins, head of the HSBC Climate Change Centre of Excellence, joined the bank in 2007. He has extensive experience in the
policy, business and investment dimensions of climate change and sustainable development.
Karen Ward
Senior Global Economist
HSBC Bank plc
+44 20 7991 3692
Karen joined HSBC in 2006 as UK economist. In 2010 she was appointed Senior Global Economist with responsibility for monitoring
challenges facing the global economy and their implications for financial markets. Before joining HSBC in 2006 Karen worked at the
Bank of England where she provided supporting analysis for the Monetary Policy Committee. She has an MSc Economics from
University College London.
Paul Spedding*
Global Head of Oil & Gas Research
HSBC Bank plc
+44 20 7991 6787
Paul Spedding is HSBC’s Global Head of Oil & Gas Research. He joined HSBC in early 2005 and has nearly 30 years of experience in
oil research.
Charanjit Singh*
Analyst
HSBC Bank plc
+91 80 3001 3776
Charanjit Singh joined HSBC in 2006 and is a member of the Alternative Energy team and Climate Change Centre of Excellence.
He has been a financial and policy analyst since 2000. Prior to joining HSBC, he worked with an energy major and a top-notch rating
company. Charanjit is a Chevening fellow from the University of Edinburgh. He holds a bachelor’s degree in engineering and a
master’s degree in management.


