

HDC Webinar Series
Introduced by Dwayne Spradlin, CEO, Health Data Consortium
Public Exchanges Go Live:Early Competitive Dynamics and Strategic Implications
David Knott and Erica Hutchins Coe, McKinsey & Company

WORKING DRAFTLast Modified 12/9/2013 10:08 AM Eastern Standard TimePrinted 11/20/2013 10:37 AM Eastern Standard Time
PROPRIETARYAny use of this material without specific permission of McKinsey & Company is strictly prohibited
Exchanges go live: earlytrends in competitor dynamics
Webinar document
McKinsey & Company | 3
McKinsey has conducted extensive research and client work on the impactof big data in health care and other industries
▪ Traditionally, the healthcare industry has lagged behind other industries in the use of bigdata—we believe that healthcare is now at a tipping point:– Demand for better data (driven by ever greater calls for demonstrable value)– Supply of relevant data at scale (claims, clinical data increasingly available)– Enhancements in technical capabilities (ability to combine and mine data sets)– Government catalyzing market change (liberating data sets, interoperability standards)
▪ Increased product, network, formulary, and pricing transparency brought about by publicexchanges will help accelerate the use and impact of big data in healthcare
▪ Public exchanges opened on October 1, 2013—we do not yet have access to broadenrollment data from public exchanges…
▪ …However, we can draw initial insights from rate filing data that is now available for everypublic exchange nationally
▪ Purpose of today’s conversation is to arm you with early insights to inform your strategiesand actions based on analysis of over 21,000 products offered in 50 states and DC
McKinsey & Company | 4
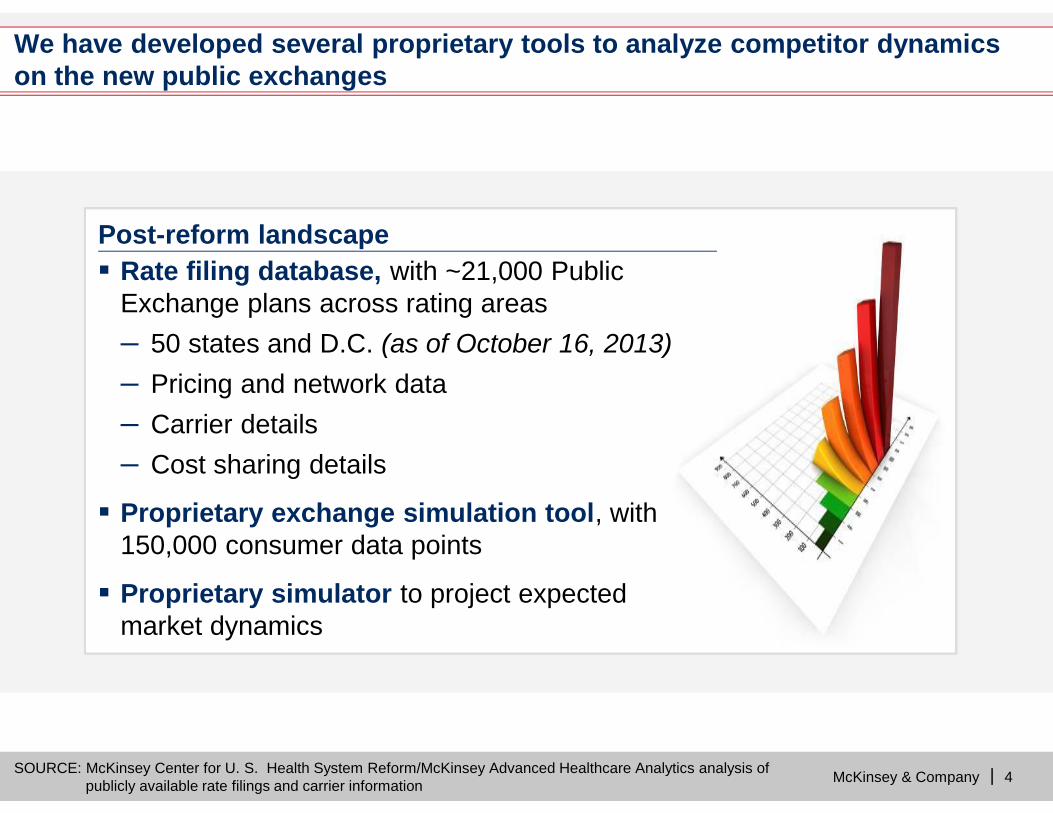
We have developed several proprietary tools to analyze competitor dynamicson the new public exchanges
Post-reform landscape▪ Rate filing database, with ~21,000 Public
Exchange plans across rating areas– 50 states and D.C. (as of October 16, 2013)– Pricing and network data– Carrier details– Cost sharing details
▪ Proprietary exchange simulation tool, with150,000 consumer data points
▪ Proprietary simulator to project expectedmarket dynamics
SOURCE: McKinsey Center for U. S. Health System Reform/McKinsey Advanced Healthcare Analytics analysis ofpublicly available rate filings and carrier information
McKinsey & Company | 5
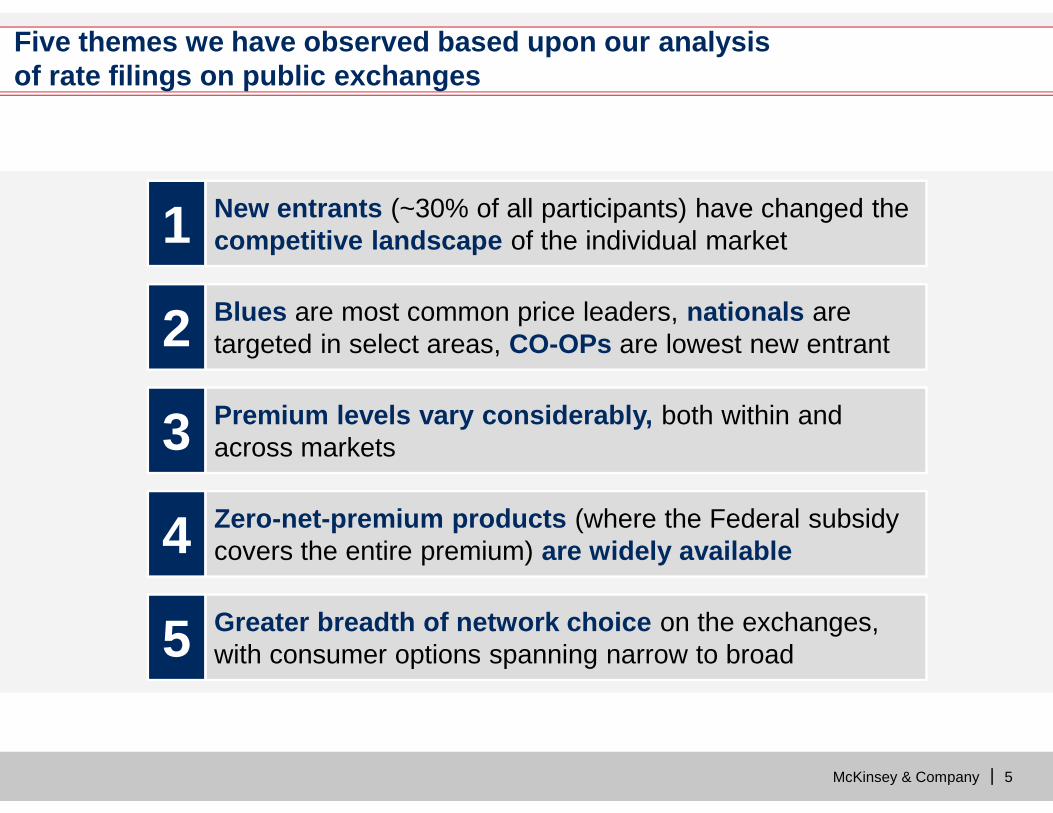
11 New entrants (~30% of all participants) have changed thecompetitive landscape of the individual marketNew entrants (~30% of all participants) have changed thecompetitive landscape of the individual market
22 Blues are most common price leaders, nationals aretargeted in select areas, CO-OPs are lowest new entrantBlues are most common price leaders, nationals aretargeted in select areas, CO-OPs are lowest new entrant
33 Premium levels vary considerably, both within andacross marketsPremium levels vary considerably, both within andacross markets
44 Zero-net-premium products (where the Federal subsidycovers the entire premium) are widely availableZero-net-premium products (where the Federal subsidycovers the entire premium) are widely available
55 Greater breadth of network choice on the exchanges,with consumer options spanning narrow to broadGreater breadth of network choice on the exchanges,with consumer options spanning narrow to broad
Five themes we have observed based upon our analysisof rate filings on public exchanges
McKinsey & Company | 6
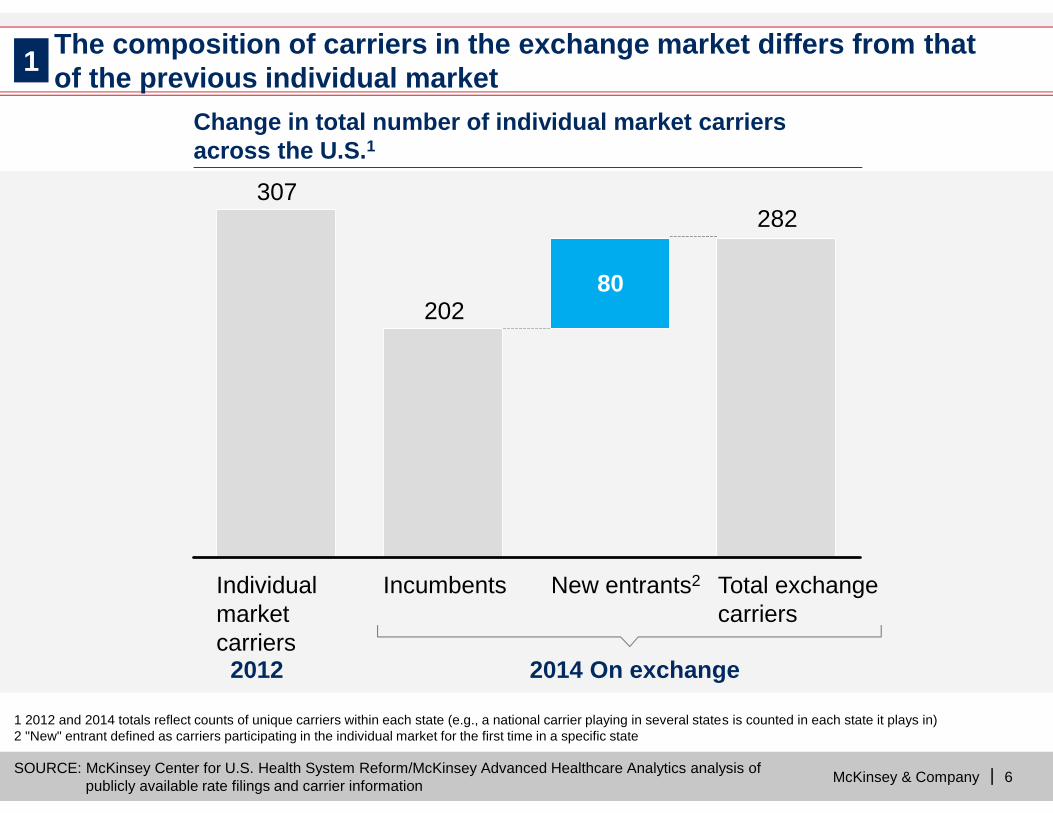
1 2012 and 2014 totals reflect counts of unique carriers within each state (e.g., a national carrier playing in several states is counted in each state it plays in)2 "New" entrant defined as carriers participating in the individual market for the first time in a specific state
2014 On exchange2012
The composition of carriers in the exchange market differs from thatof the previous individual market
SOURCE: McKinsey Center for U.S. Health System Reform/McKinsey Advanced Healthcare Analytics analysis ofpublicly available rate filings and carrier information
1
282
202
307
Individualmarketcarriers
Incumbents Total exchangecarriers
New entrants2
80
Change in total number of individual market carriersacross the U.S.1
McKinsey & Company | 7
AL
ARAZ
CACO
CT
FL
GA
IA
ID
IL IN
KSKY
LA
MA
ME
MI
MN
MO
MS
MT
NC
ND
NE
NH
NM
NV
NY
OH
OK
OR
PA
SC
SD
TN
TX
UT
VA
VT
WA
WI
WV
WY
DCDEMD
NJ RI
HI
AK
SOURCE: McKinsey Center for U.S. Health System Reform/McKinsey Advanced Healthcare Analytics analysis ofpublicly available rate filings and carrier information
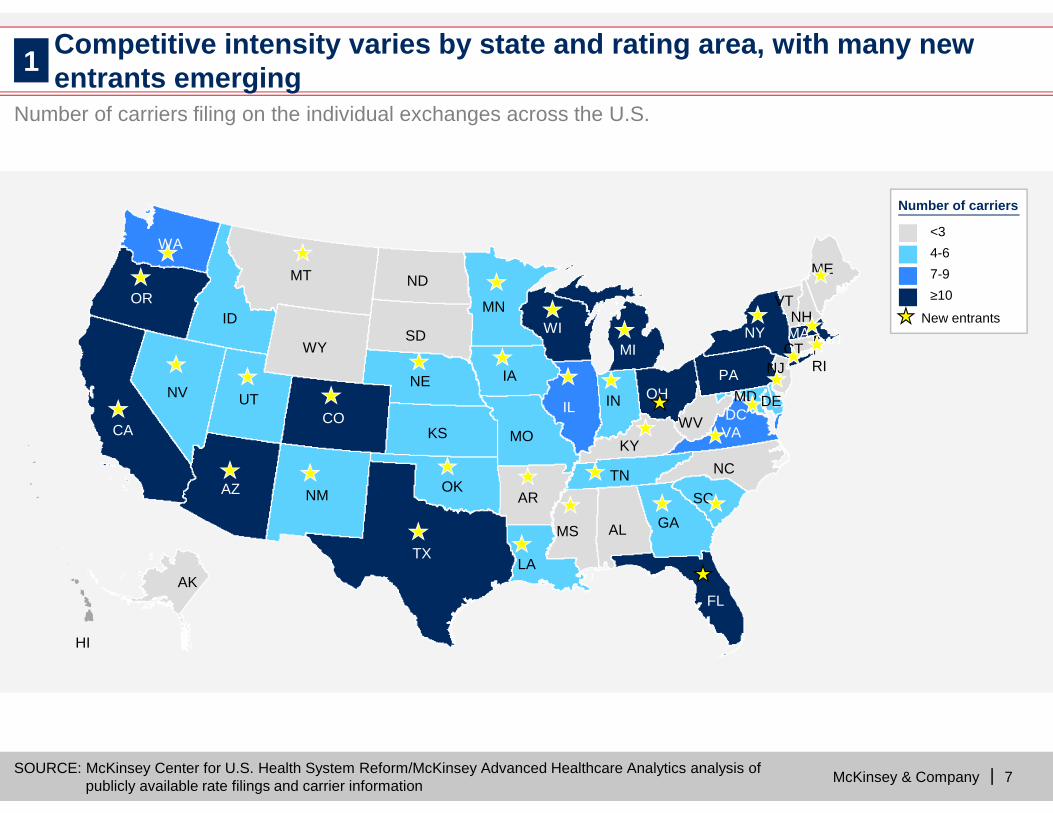
Number of carriers filing on the individual exchanges across the U.S.
Competitive intensity varies by state and rating area, with many newentrants emerging
<34-67-9≥10
Number of carriers
New entrants
1
McKinsey & Company | 8
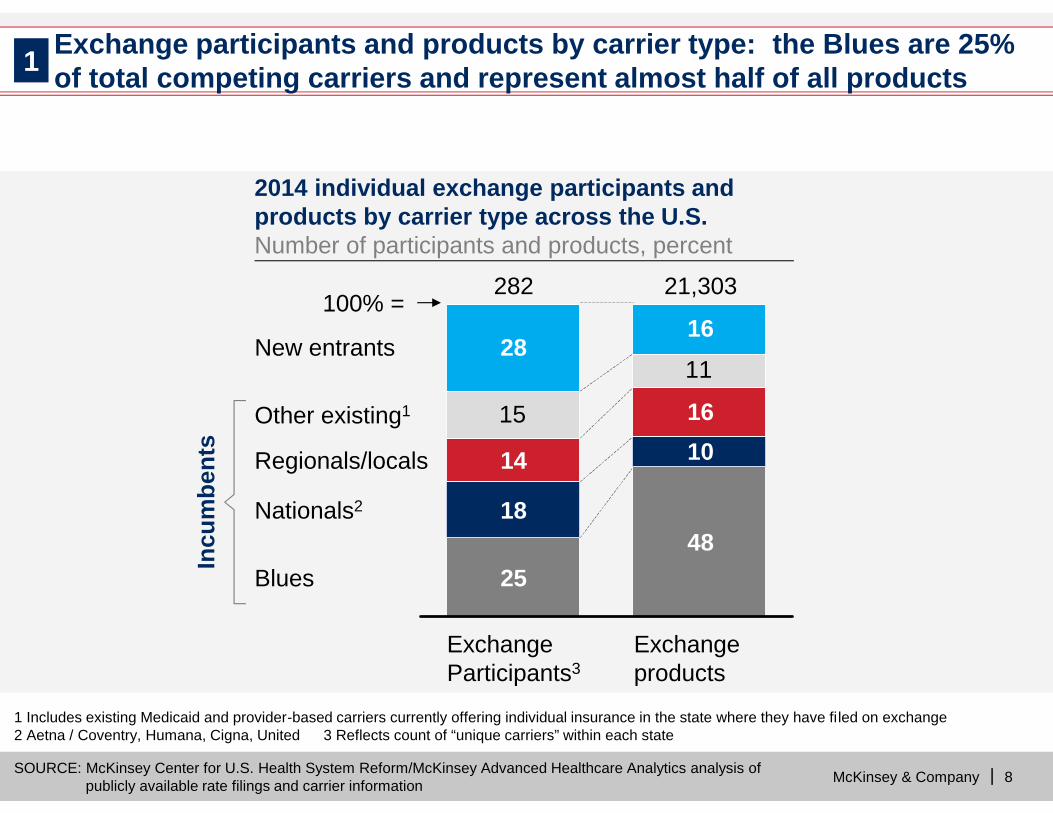
1 Includes existing Medicaid and provider-based carriers currently offering individual insurance in the state where they have filed on exchange2 Aetna / Coventry, Humana, Cigna, United 3 Reflects count of “unique carriers” within each state
Incu
mbe
nts
SOURCE: McKinsey Center for U.S. Health System Reform/McKinsey Advanced Healthcare Analytics analysis ofpublicly available rate filings and carrier information
Exchange participants and products by carrier type: the Blues are 25%of total competing carriers and represent almost half of all products1
15
11
100% =
Blues
Nationals2
Regionals/locals
Other existing1
New entrants
Exchangeproducts
21,303
48
1016
16
ExchangeParticipants3
282
25
18
14
28
2014 individual exchange participants andproducts by carrier type across the U.S.Number of participants and products, percent
McKinsey & Company | 9
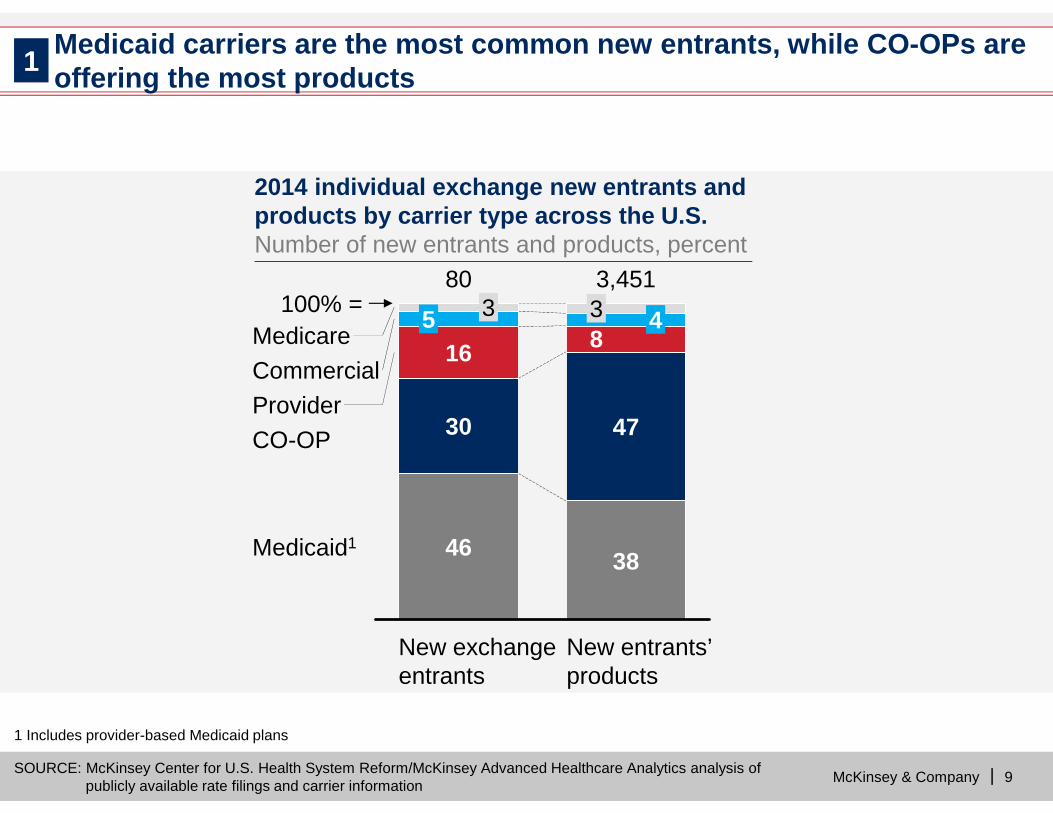
1 Includes provider-based Medicaid plans
SOURCE: McKinsey Center for U.S. Health System Reform/McKinsey Advanced Healthcare Analytics analysis ofpublicly available rate filings and carrier information
Medicaid carriers are the most common new entrants, while CO-OPs areoffering the most products
3100% =
Medicaid1
CO-OPProviderCommercialMedicare
New entrants’products
3,451
38
47
84
80
46
30
165 3
New exchangeentrants
1
2014 individual exchange new entrants andproducts by carrier type across the U.S.Number of new entrants and products, percent
McKinsey & Company | 10
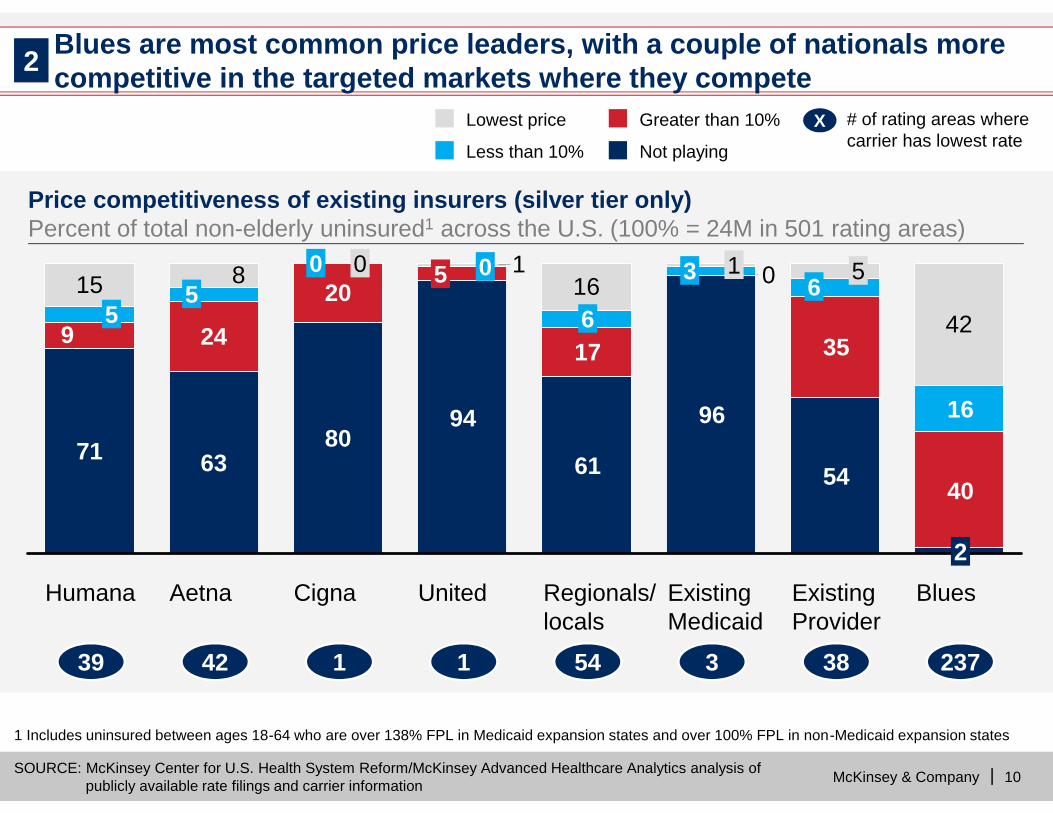
Blues are most common price leaders, with a couple of nationals morecompetitive in the targeted markets where they compete
1 Includes uninsured between ages 18-64 who are over 138% FPL in Medicaid expansion states and over 100% FPL in non-Medicaid expansion states
SOURCE: McKinsey Center for U.S. Health System Reform/McKinsey Advanced Healthcare Analytics analysis ofpublicly available rate filings and carrier information
15 1642
018
Blues2
40
16
ExistingProvider
54
35
6 5
ExistingMedicaid
96
3 1
Regionals/locals
61
176
United
94
5 0
Cigna
80
200 0
Aetna
63
245
Humana
71
95
3939 2372374242 11 11 5454 33 3838
2
Not playing
Greater than 10%
Less than 10%
Lowest price XX # of rating areas wherecarrier has lowest rate
Price competitiveness of existing insurers (silver tier only)Percent of total non-elderly uninsured1 across the U.S. (100% = 24M in 501 rating areas)
McKinsey & Company | 11
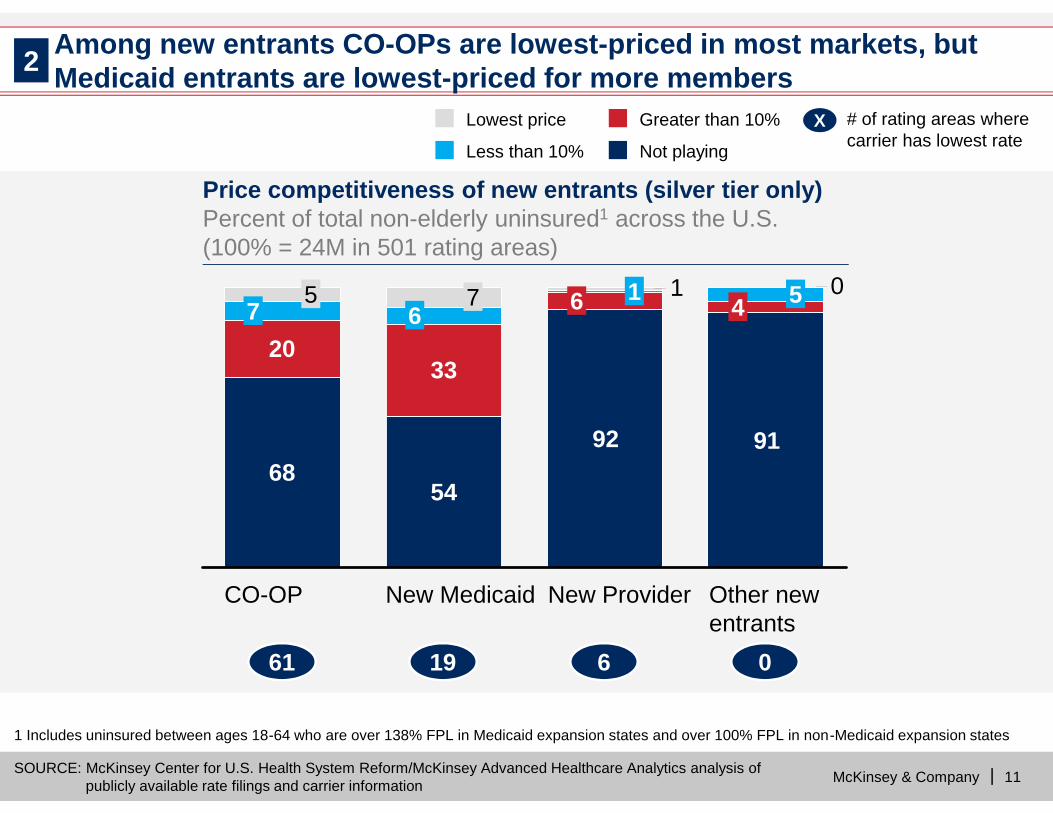
Among new entrants CO-OPs are lowest-priced in most markets, butMedicaid entrants are lowest-priced for more members
1 Includes uninsured between ages 18-64 who are over 138% FPL in Medicaid expansion states and over 100% FPL in non-Medicaid expansion states
SOURCE: McKinsey Center for U.S. Health System Reform/McKinsey Advanced Healthcare Analytics analysis ofpublicly available rate filings and carrier information
016
7
CO-OP
68
Other newentrants
91
4 5
New Provider
92
6 1
New Medicaid
54
3320
7 5
6161 1919 66 00
2
XX # of rating areas wherecarrier has lowest rateNot playing
Greater than 10%
Less than 10%
Lowest price
Price competitiveness of new entrants (silver tier only)Percent of total non-elderly uninsured1 across the U.S.(100% = 24M in 501 rating areas)
McKinsey & Company | 12
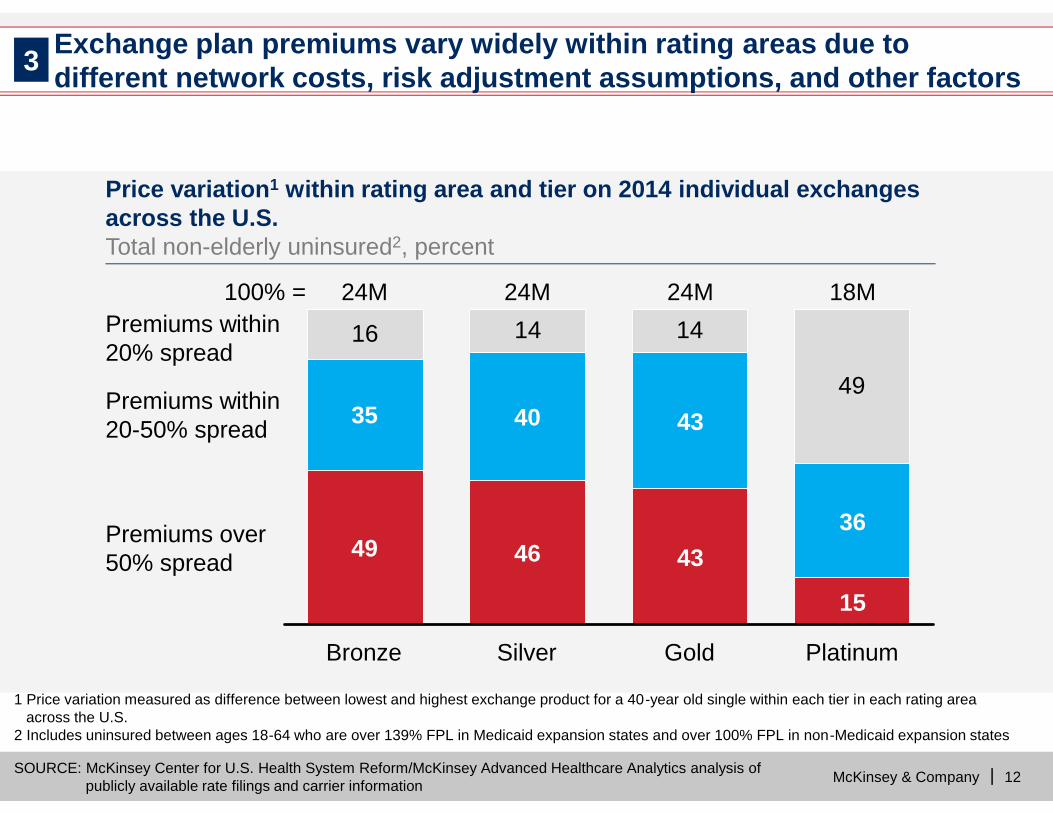
16 14 14
49
Gold
24M
43
43
Silver
24M
46
40
Bronze
24M
35
49
Premiums within20% spread
Platinum
18M100% =
Premiums over50% spread
Premiums within20-50% spread
15
36
1 Price variation measured as difference between lowest and highest exchange product for a 40-year old single within each tier in each rating areaacross the U.S.
2 Includes uninsured between ages 18-64 who are over 139% FPL in Medicaid expansion states and over 100% FPL in non-Medicaid expansion states
SOURCE: McKinsey Center for U.S. Health System Reform/McKinsey Advanced Healthcare Analytics analysis ofpublicly available rate filings and carrier information
Exchange plan premiums vary widely within rating areas due todifferent network costs, risk adjustment assumptions, and other factors3
Price variation1 within rating area and tier on 2014 individual exchangesacross the U.S.Total non-elderly uninsured2, percent
McKinsey & Company | 13
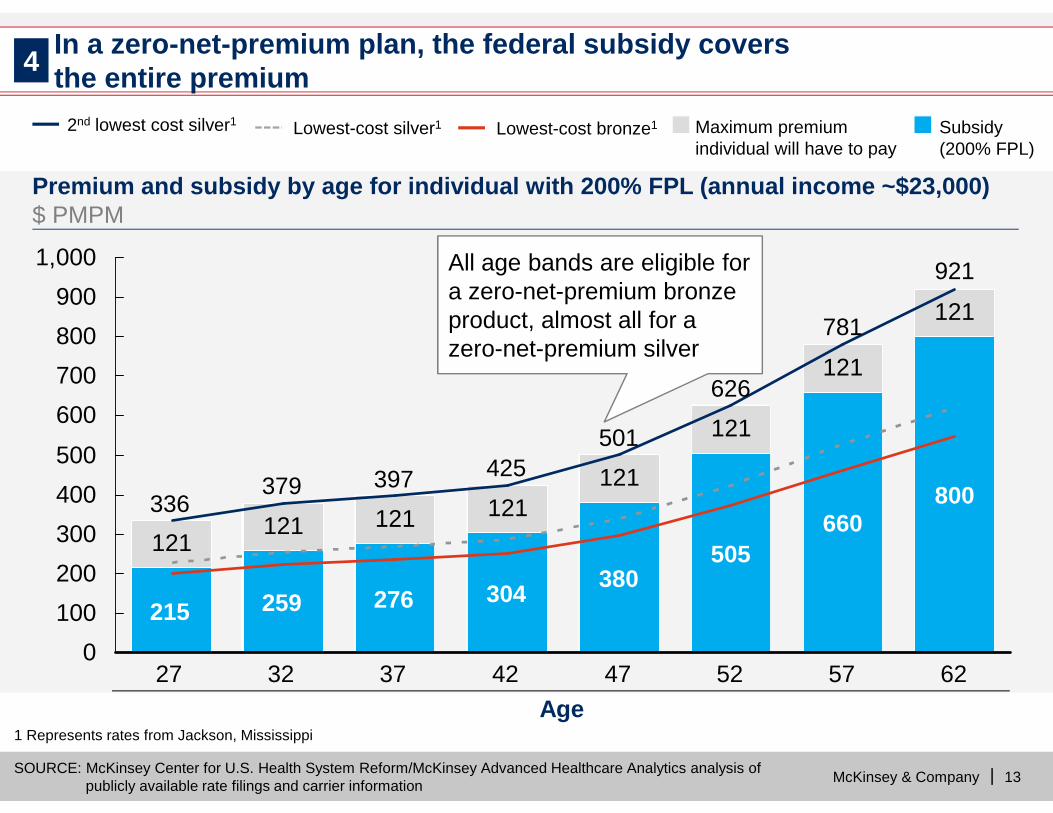
00
121121 121 121
121
121
121
121
0100200300400500600700800900
1,000
62
921
800
57
781
660
52
626
505
47
501
380
42
425
304
37
397
276
32
379
259
27
336
215
Age
SOURCE: McKinsey Center for U.S. Health System Reform/McKinsey Advanced Healthcare Analytics analysis ofpublicly available rate filings and carrier information
In a zero-net-premium plan, the federal subsidy coversthe entire premium
1 Represents rates from Jackson, Mississippi
4
All age bands are eligible fora zero-net-premium bronzeproduct, almost all for azero-net-premium silver
Subsidy(200% FPL)
Lowest-cost silver1 Lowest-cost bronze1 Maximum premiumindividual will have to pay
2nd lowest cost silver1
Premium and subsidy by age for individual with 200% FPL (annual income ~$23,000)$ PMPM
McKinsey & Company | 14
AL
ARAZ
CACO
FL
GA
IA
ID
IL IN
KS
LA
MAMI
MN
MO
MS
NC
ND
NE
NM
NY
OK
OR
SCTN
TX
VA
VT
WA
WI
WV
WY
DCDE
NJ RI
AK
HI
MDNV UT
MT
SD
KY
OHPA
ME
NH
CT
SOURCE: McKinsey Center for U.S. Health System Reform/McKinsey Advanced Healthcare Analytics analysis ofpublicly available rate filings and carrier information
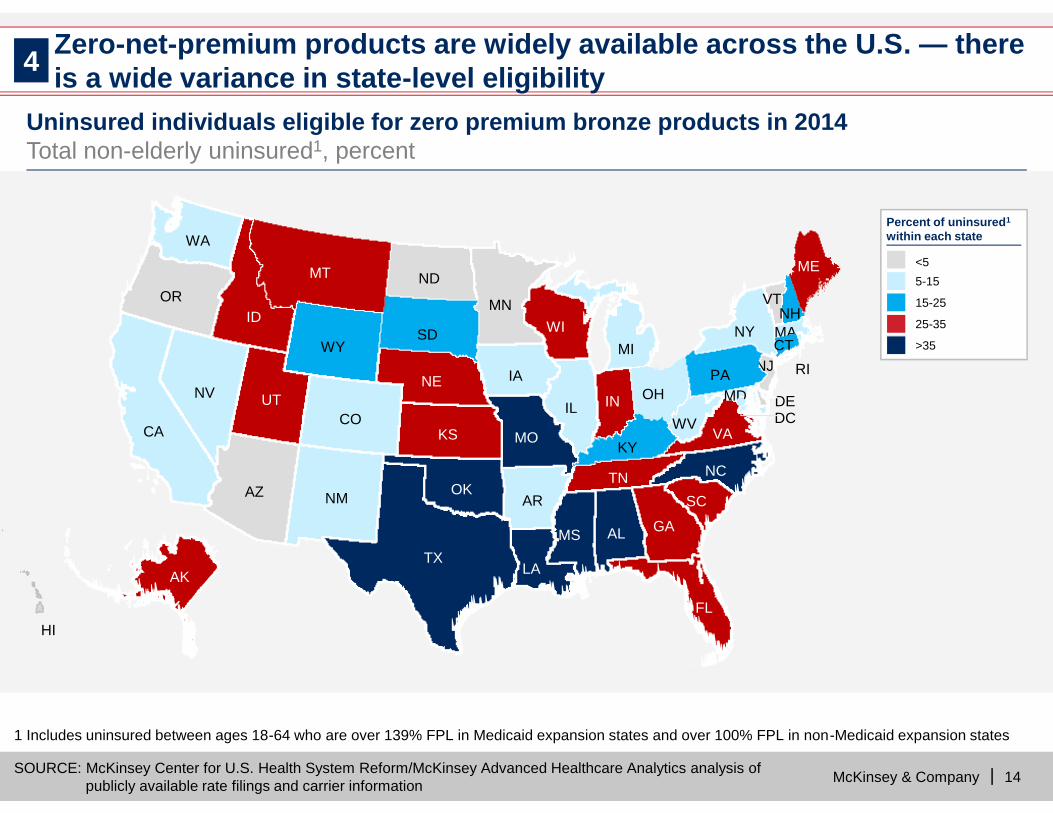
Zero-net-premium products are widely available across the U.S. — thereis a wide variance in state-level eligibility
<55-15
15-25
25-35
Percent of uninsured1
within each state
>35
1 Includes uninsured between ages 18-64 who are over 139% FPL in Medicaid expansion states and over 100% FPL in non-Medicaid expansion states
4
Uninsured individuals eligible for zero premium bronze products in 2014Total non-elderly uninsured1, percent
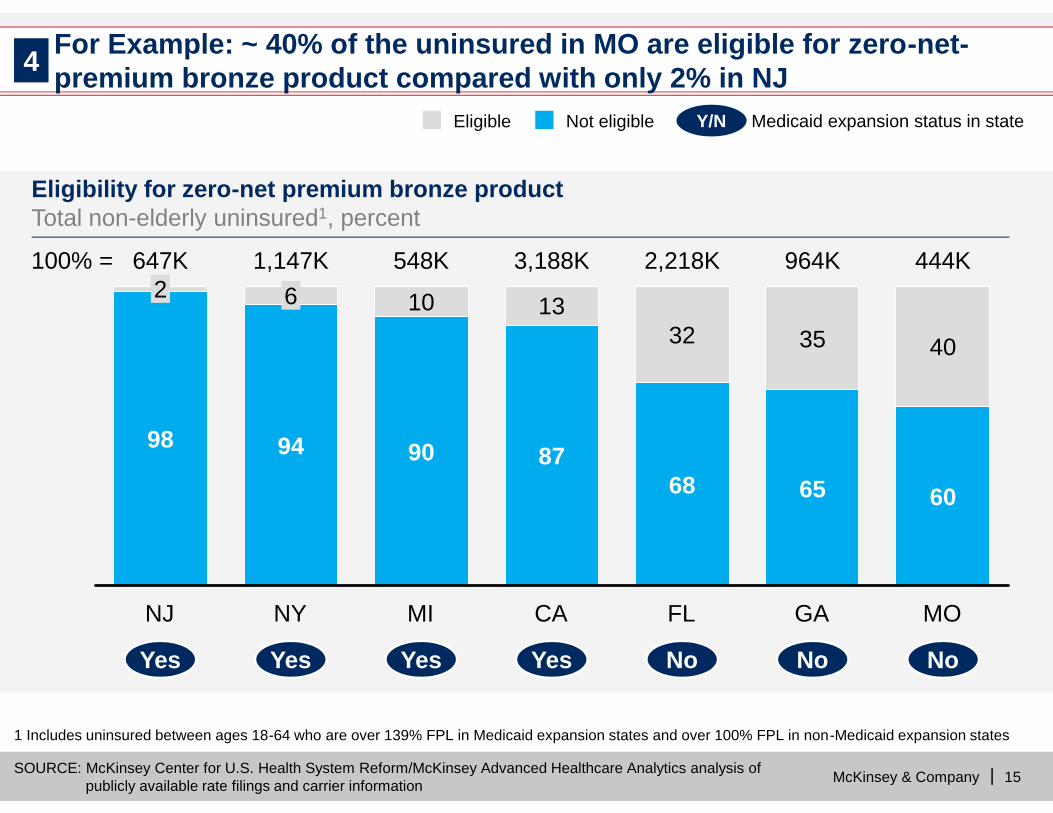
McKinsey & Company | 15
For Example: ~ 40% of the uninsured in MO are eligible for zero-net-premium bronze product compared with only 2% in NJ4
100% =
MO
444K
60
40
GA
964K
65
35
FL
2,218K
68
32
CA
3,188K
87
13
MI
548K
90
10
NY
1,147K
94
6
NJ
647K
98
2
1 Includes uninsured between ages 18-64 who are over 139% FPL in Medicaid expansion states and over 100% FPL in non-Medicaid expansion states
SOURCE: McKinsey Center for U.S. Health System Reform/McKinsey Advanced Healthcare Analytics analysis ofpublicly available rate filings and carrier information
YesYes
Not eligibleEligible
YesYes YesYes YesYes NoNo NoNo NoNo
Y/NY/N Medicaid expansion status in state
Eligibility for zero-net premium bronze productTotal non-elderly uninsured1, percent
McKinsey & Company | 16
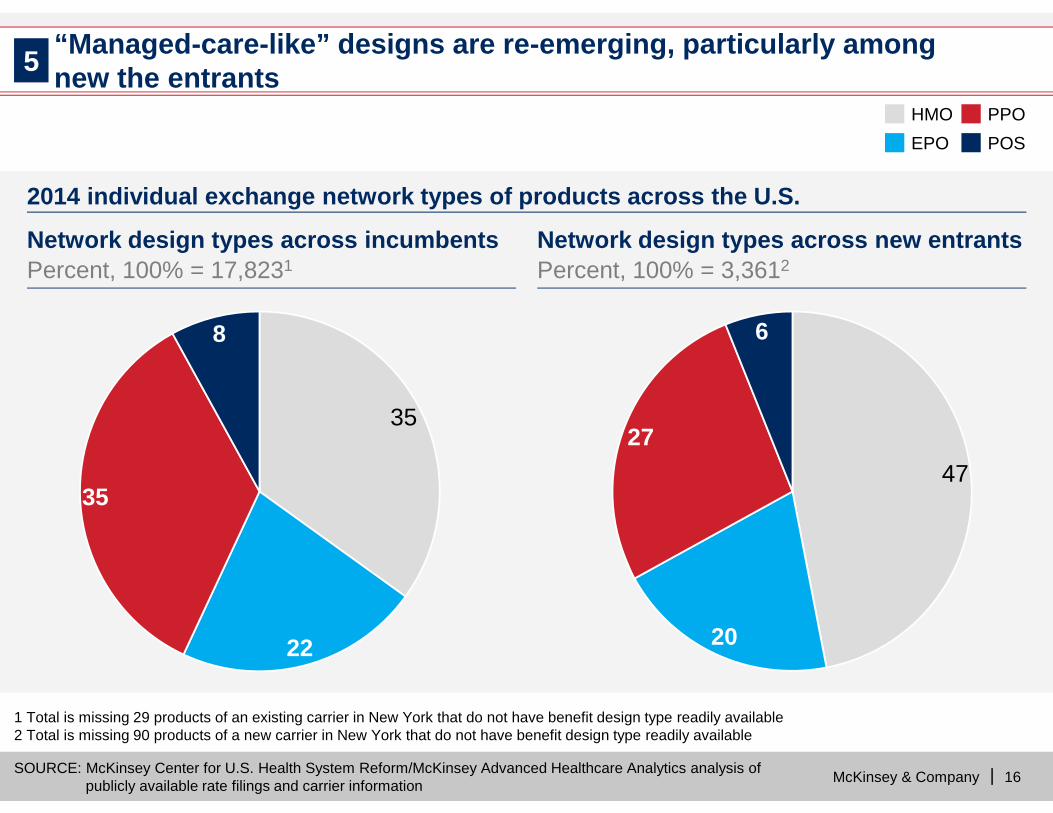
Network design types across incumbentsPercent, 100% = 17,8231
Network design types across new entrantsPercent, 100% = 3,3612
SOURCE: McKinsey Center for U.S. Health System Reform/McKinsey Advanced Healthcare Analytics analysis ofpublicly available rate filings and carrier information
HMO PPOEPO POS
35
8
35
22
47
6
27
20
1 Total is missing 29 products of an existing carrier in New York that do not have benefit design type readily available2 Total is missing 90 products of a new carrier in New York that do not have benefit design type readily available
“Managed-care-like” designs are re-emerging, particularly amongnew the entrants5
2014 individual exchange network types of products across the U.S.
McKinsey & Company | 17
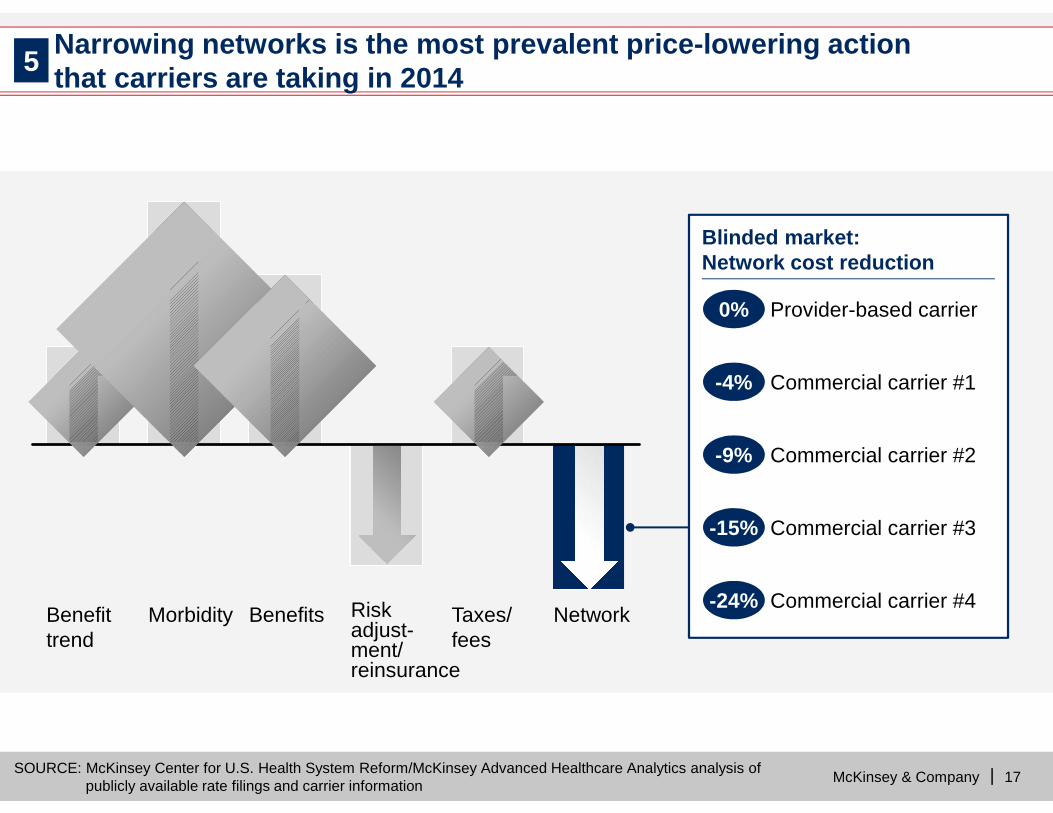
NetworkTaxes/fees
Riskadjust-ment/reinsurance
BenefitsMorbidityBenefittrend
Blinded market:Network cost reduction
Commercial carrier #4-24%-24%
Commercial carrier #3-15%-15%
Commercial carrier #2-9%-9%
Commercial carrier #1-4%-4%
Provider-based carrier0%0%
SOURCE: McKinsey Center for U.S. Health System Reform/McKinsey Advanced Healthcare Analytics analysis ofpublicly available rate filings and carrier information
Narrowing networks is the most prevalent price-lowering actionthat carriers are taking in 20145
McKinsey & Company | 18
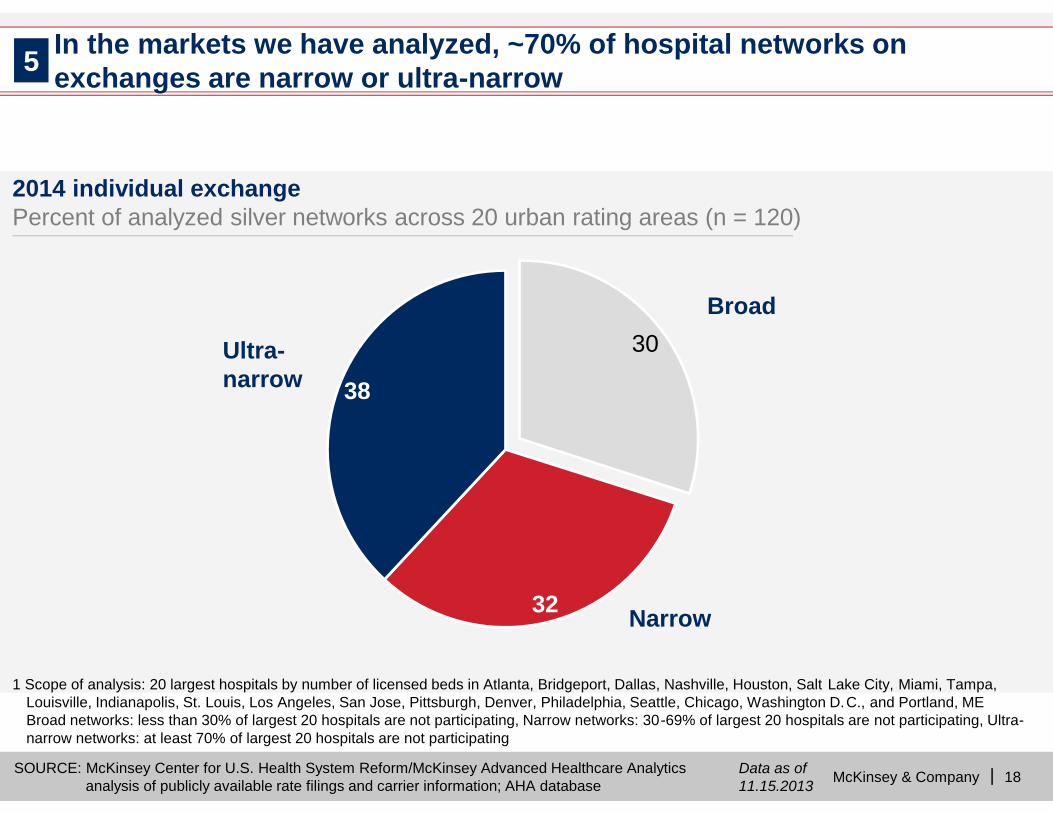
1 Scope of analysis: 20 largest hospitals by number of licensed beds in Atlanta, Bridgeport, Dallas, Nashville, Houston, Salt Lake City, Miami, Tampa,Louisville, Indianapolis, St. Louis, Los Angeles, San Jose, Pittsburgh, Denver, Philadelphia, Seattle, Chicago, Washington D.C., and Portland, MEBroad networks: less than 30% of largest 20 hospitals are not participating, Narrow networks: 30-69% of largest 20 hospitals are not participating, Ultra-narrow networks: at least 70% of largest 20 hospitals are not participating
SOURCE: McKinsey Center for U.S. Health System Reform/McKinsey Advanced Healthcare Analyticsanalysis of publicly available rate filings and carrier information; AHA database
Data as of11.15.2013
30
38
32
Broad
Narrow
Ultra-narrow
2014 individual exchangePercent of analyzed silver networks across 20 urban rating areas (n = 120)
5 In the markets we have analyzed, ~70% of hospital networks onexchanges are narrow or ultra-narrow
McKinsey & Company | 19
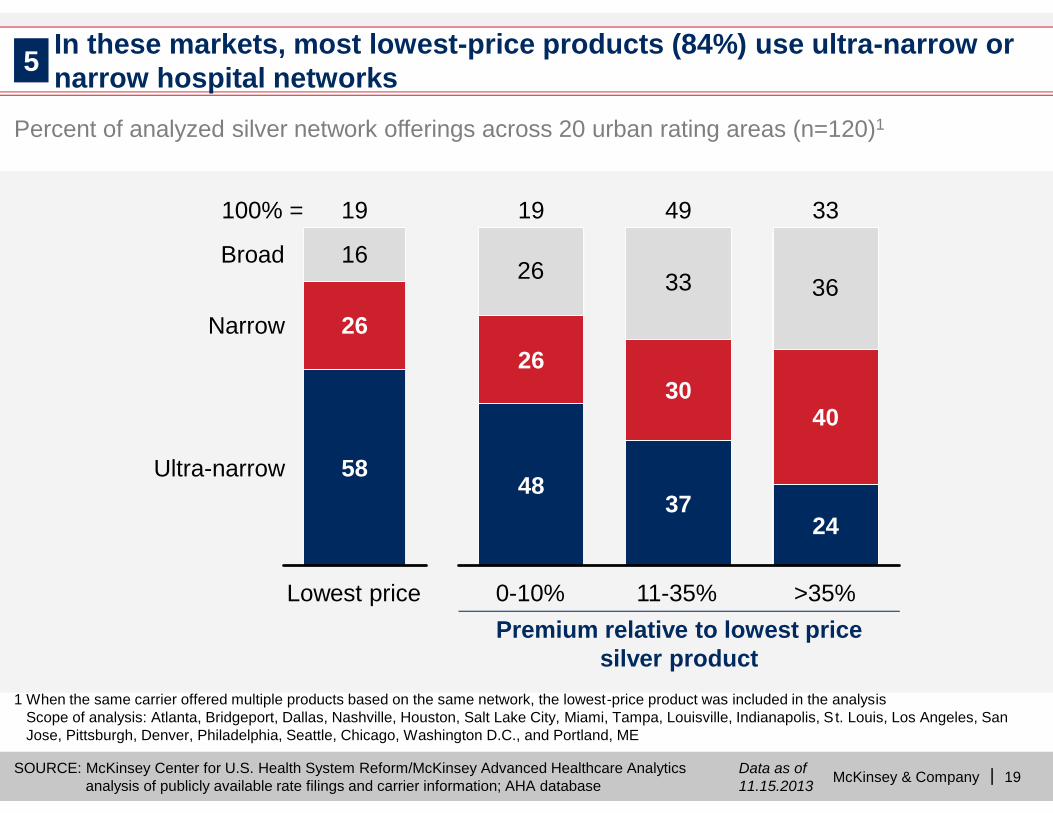
Percent of analyzed silver network offerings across 20 urban rating areas (n=120)1
1 When the same carrier offered multiple products based on the same network, the lowest-price product was included in the analysisScope of analysis: Atlanta, Bridgeport, Dallas, Nashville, Houston, Salt Lake City, Miami, Tampa, Louisville, Indianapolis, S t. Louis, Los Angeles, SanJose, Pittsburgh, Denver, Philadelphia, Seattle, Chicago, Washington D.C., and Portland, ME
SOURCE: McKinsey Center for U.S. Health System Reform/McKinsey Advanced Healthcare Analyticsanalysis of publicly available rate filings and carrier information; AHA database
Data as of11.15.2013
In these markets, most lowest-price products (84%) use ultra-narrow ornarrow hospital networks5
26 33 36
0-10% >35%
33
24
40
11-35%
49
37
30
19
48
26
Lowest price
19
58
26
16
100% =
Ultra-narrow
Narrow
Broad
Premium relative to lowest pricesilver product
McKinsey & Company | 20
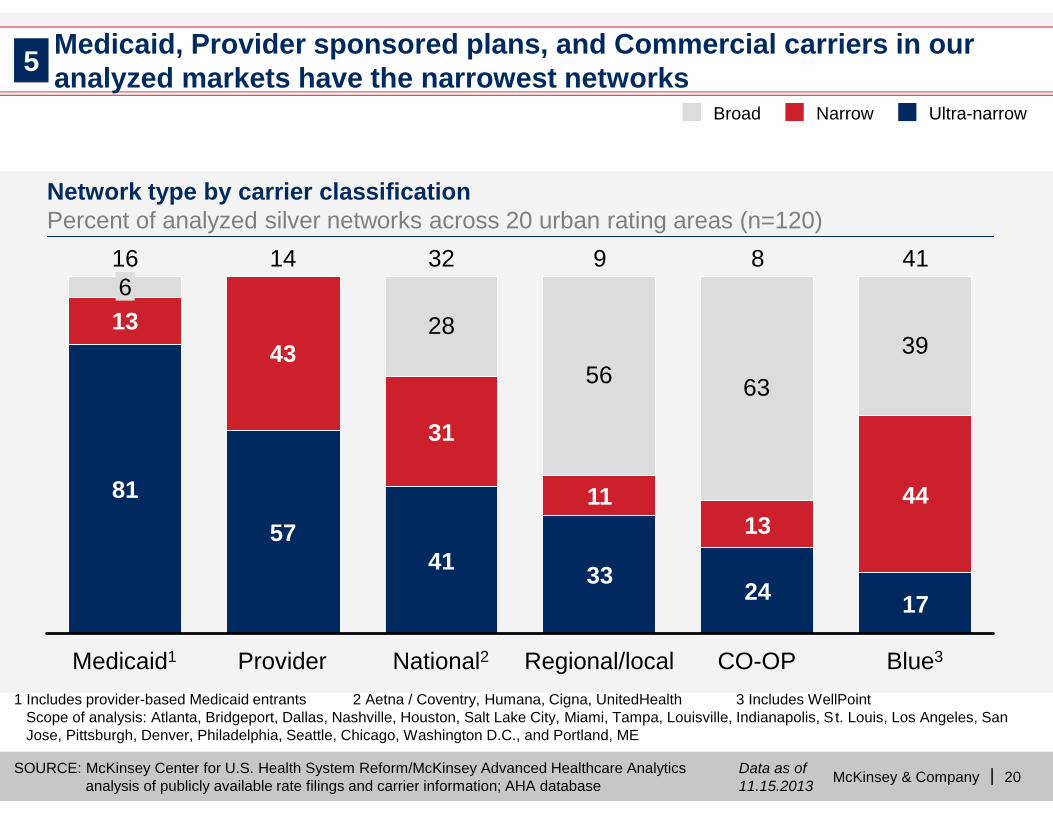
28
56 63
3913
41
31
Provider
14
57
43
Medicaid1
16
81
6
Blue3
41
17
44
CO-OP
8
24
13
Regional/local
9
33
11
National2
32
Ultra-narrowNarrowBroad
5
SOURCE: McKinsey Center for U.S. Health System Reform/McKinsey Advanced Healthcare Analyticsanalysis of publicly available rate filings and carrier information; AHA database
Data as of11.15.2013
1 Includes provider-based Medicaid entrants 2 Aetna / Coventry, Humana, Cigna, UnitedHealth 3 Includes WellPointScope of analysis: Atlanta, Bridgeport, Dallas, Nashville, Houston, Salt Lake City, Miami, Tampa, Louisville, Indianapolis, S t. Louis, Los Angeles, SanJose, Pittsburgh, Denver, Philadelphia, Seattle, Chicago, Washington D.C., and Portland, ME
Medicaid, Provider sponsored plans, and Commercial carriers in ouranalyzed markets have the narrowest networks
Network type by carrier classificationPercent of analyzed silver networks across 20 urban rating areas (n=120)
McKinsey & Company | 21
Our rate filing analyses suggest a number of early observations regardingthe new public exchange space
▪ The competitive landscape appears to have evolved with roughly a third ofincumbents not participating and significant number of new entrants emerging
▪ The Blues are the most common price leaders, nationals are price leaders intargeted markets, and CO-OPs are most often lowest priced among new entrants
▪ There is high degree of variation in prices both within and across markets,potentially driven by varying pricing assumptions by different carriers
▪ Zero-net-premium products (where the Federal subsidy covers the entire premium)are widely available which could have significant impact on uptake
▪ Our exchange simulations have indicated that price is the primary decision driver forconsumers. To reduce product cost, many carriers have used narrow networks
▪ Broader networks are also still often available, leaving the access and price tradeoffup to the consumer; this proliferation of products with varying breadths of hospitalnetworks is consistent with most well-functioning consumer markets – a variety ofchoices comprising different value propositions at different price points
We will continue to analyze consumer and competitor dynamics onpublic exchanges as these marketplaces unfold in 2014 and beyondWe will continue to analyze consumer and competitor dynamics onpublic exchanges as these marketplaces unfold in 2014 and beyond


