
RATIO CONGRUITY EFFECT 1
Fractions We Can’t Ignore:
The Nonsymbolic Ratio Congruity Effect
Percival G. Matthews
University of Wisconsin-Madison
Department of Educational Psychology
Mark Rose Lewis
University of Wisconsin-Madison
Department of Educational Psychology
Correspondence:
Percival G Matthews
Department of Educational Psychology
University of Wisconsin – Madison
1025 W. Johnson Street #884
Madison, Wisconsin 53706-1796
email: [email protected]
ph: (608) 263-3600
fax: (608) 262-0843
Manuscript
RATIO CONGRUITY EFFECT 3
The symbolic representation of whole numbers is a uniquely human cultural achievement.
Although the use of these symbols themselves represents a transformative recycling of human
cognitive architecture (Dehaene & Cohen, 2007), they acquire even greater power when they are
combined to represent new classes of numbers like fractions (Siegler, Thompson, & Schneider,
2011). Indeed, recent research has drawn attention to the pivotal role fractions knowledge plays
in human numerical development (Fazio, Bailey, Thompson, & Siegler, 2014; Siegler, Fazio,
Bailey, & Zhou, 2013). They eventually come to represent complex concepts such as ratio, rate,
and probability, providing the foundation for higher mathematics, science and associated
technologies that are hallmarks of modern society. Despite the importance of fractions for
mathematical cognition, the cognitive foundations of fraction understanding remain elusive.
When faced with the question of how a relatively ancient human brain structure enables
facility with symbolic mathematics – a recent invention on the evolutionary scale – some have
sought to identify core competencies upon which symbolic number concepts might rest. Most of
these arguments share a general orientation with Deheane and Cohen’s (2007) neuronal recycling
hypothesis: More recent cultural inventions such as mathematics and reading co-opt pre-existing
cognitive architectures to support new competencies. In the case of number, the most frequently
cited core competencies are those supporting the enumeration of discrete sets, such as the
approximate number system (ANS) and the object tracking system (Feigenson, Dehaene, &
Spelke, 2004; Piazza, 2010). These competencies are widely thought to support the acquisition of
whole numbers via specialized learning mechanisms (Feigenson et al., 2004; Piazza, 2010).
Other classes of numbers – specifically fractions and irrational numbers – are thought by some to

RATIO CONGRUITY EFFECT 4
go beyond the constraints of these core architectures.1 On this prevailing view, fractions are a
product of human artifice and are therefore not naturally compatible with pre-existing cognitive
architectures. However, several lines of research have indicated that fractions may not be as
artificial as innate constraint theorists have argued (e.g., Jacob, Vallentin, & Nieder, 2012;
Matthews & Chesney, 2015; McCrink, Spelke, Dehaene, & Pica, 2013; McCrink & Wynn, 2007).
The current research provides evidence in support of an expanded view of mathematical
cognition which posits that learning about symbolic fractions is impacted by architectures that
process the magnitudes of nonsymbolic ratios (Lewis, Matthews, & Hubbard, 2015). We reveal a
nonsymbolic Ratio Congruity Effect (RCE) that demonstrates automatic processing of irrelevant
nonsymbolic ratio magnitudes during symbolic fractions comparisons. This effect operates
autonomously alongside previously identified symbolic numerical distance effects and size
congruity effects for absolute size. The key contribution is to demonstrate that perceptually-
based processing of nonsymbolic magnitude interfaces with the processing of symbolic fractions.
Background
Recent studies have brought new attention to the processes underlying the representation
of fractions magnitudes (e.g., DeWolf, Grounds, Bassok, & Holyoak, 2014; Fazio et al., 2014;
Jacob et al., 2012; Kallai & Tzelgov, 2009; Meert, Grégoire, & Noël, 2010). It is frequently
noted that, unlike the case with whole numbers, even educated adults show considerable
difficulties learning about and processing symbolic fractions (e.g., DeWolf et al., 2014). Several
researchers have cited these pervasive difficulties with fractions as evidence for a fundamental
incompatibility between core human cognitive architectures and fraction understanding.
Feigenson et al. (2004) typified this innate constraints account, arguing that fractions are difficult
1 Indeed, recent research suggests that very large whole numbers also tax the constraints of these
systems (e.g., Landy, Silbert, & Goldin, 2013).
RATIO CONGRUITY EFFECT 5
because they are far removed from the intuitions provided by core systems (see also Gelman &
Williams, 19982). As a result of this prevailing belief, most cognitive psychological theories of
numerical development have focused on the acquisition of whole numbers, relegating fractions
to a secondary status (Siegler et al., 2011).
Despite the widely held belief that fractions are in some sense artificial, a growing body
of evidence suggests humans and non-human primates possess neurocognitive architectures that
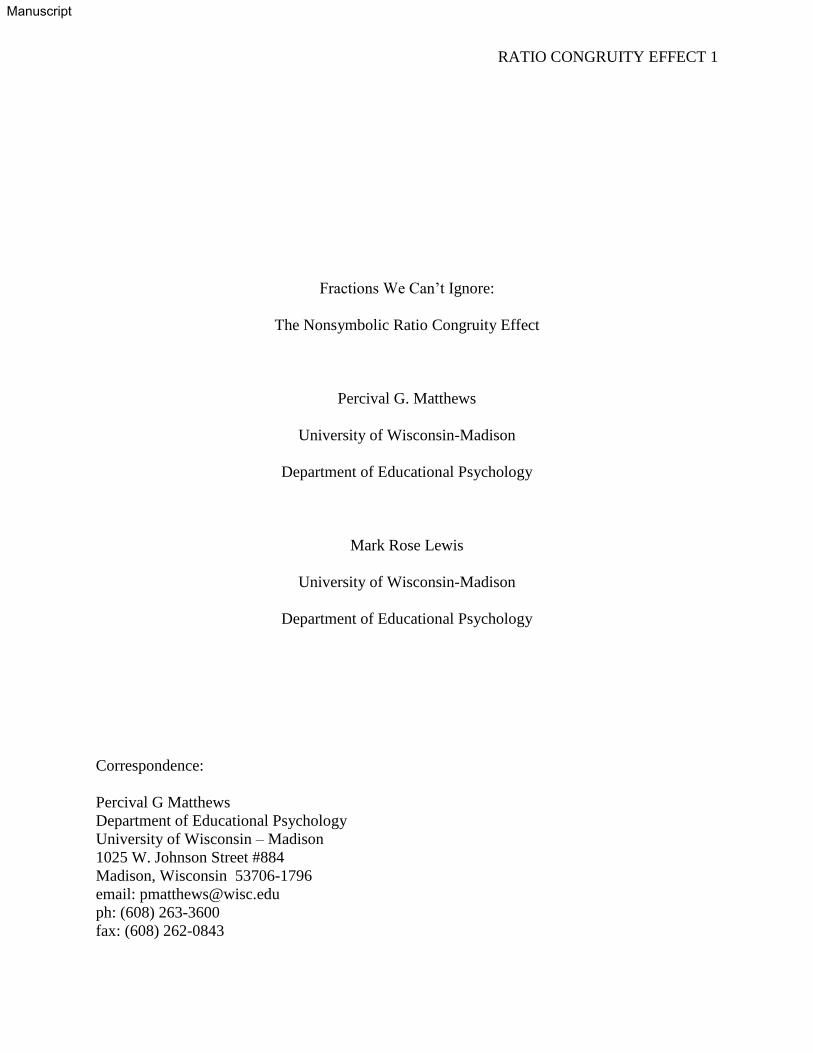
support the representation and processing of nonsymbolic ratios. For instance, Vallentin and
Nieder (2008) trained adult humans and monkeys on match-to-sample tasks using ratios formed
by pairs of lines (Fig. 1a). Humans and monkeys performed far better than chance, showing
considerable sensitivity to ratio magnitudes. Moreover, single-cell recordings from monkeys
revealed individual neurons that responded preferentially to specific nonsymbolic ratios.
Insert Fig. 1 about here
Much other work has revealed sensitivity to nonsymbolic ratios among a wide range of
subject populations, including pre-verbal infants (Duffy, Huttenlocher, & Levine, 2005; McCrink
& Wynn, 2007), school-aged children (Boyer & Levine, 2012; Sophian, 2000; Spinillo & Bryant,
1991), and typically developing adults (Hollands & Dyre, 2000; Jacob & Nieder, 2009). Indeed,
Matthews and Chesney (2015) showed that adults accurately compared nonsymbolic ratios even
when compared across different formats (e.g., ratios of dot arrays vs. ratios of circle areas, Fig.
2 Despite published statements by Rochelle Gelman and Stanislas Dehaene suggesting fractions
are not compatible with basic human architecture, we note that in other work, they make
hypotheses to the contrary suggesting that basic number modules are compatible with rational
numbers (McCrink, Spelke, Dehaene, & Pica, 2013) or even real numbers (Gallistel & Gelman,
2000). These points notwithstanding, their published arguments about innate constraints of the
system are cited very frequently and continue to exert considerable sway.

RATIO CONGRUITY EFFECT 6
1b). The ability to compare ratios despite their instantiations in different formats suggests that
sensitivity to nonsymbolic ratio magnitudes is abstract on some level. No studies to date,
however, have assessed the degree to which nonsymbolic ratio processing automatically
interfaces with symbolic processes. We investigated the potential interaction of nonsymbolic and
symbolic architectures using a Stroop-like paradigm that tested for nonsymbolic RCEs during the
processing of symbolic fractions.
The Nonsymbolic Ratio Congruity Effect
Human processing of whole number symbols appears to be highly integrated with
primitive cognitive architectures that process not only discrete numerosities (Piazza, Pinel, Le
Bihan, & Dehaene, 2007) but also other nonsymbolic magnitudes such as size and even
luminance (Cohen Kadosh & Henik, 2006; Henik & Tzelgov, 1982; Walsh, 2003). The
interaction of symbolic whole number processing with physical magnitude has been revealed by
the numerical size congruity effect (SiCE). The SiCE is a Stroop-like phenomenon in which the
automatic processing of nonsymbolic magnitudes influences the intentional processing of
number symbols and vice versa (e.g., Henik & Tzelgov, 1982). For example, when participants
are asked to compare the numerical sizes of two symbolic digits, incongruent pairings of
physical size (e.g., 2 vs. 4) interfere with performance, leading to slower and less accurate
performance compared to congruent pairings (e.g., 2 vs. 4).
Recently, Kallai and Tzelgov (2009) investigated whether systems processing absolute
physical size might also interact with systems that process symbolic fractions. In one experiment
(Experiment 4), they investigated whether automatic processing of physical size congruence
would affect intentional comparisons of symbolic fractions. They found SiCEs for comparing
pairs of whole numbers, but not for pairs of fractions and concluded that physical magnitude
RATIO CONGRUITY EFFECT 7
does not automatically interact with fraction magnitude judgments. However, this failure to find
SiCEs for fraction comparisons might also have reflected the type of nonsymbolic magnitude
that was manipulated. Kallai and Tzelgov manipulated the absolute physical magnitudes (overall
size) of the fractions being compared by manipulating the total area taken up by a given fraction.
Fraction magnitude, however, is defined relationally; it is determined by the relative sizes of the
components that comprise fractions as opposed to their absolute sizes. Therefore, we predicted
that investigating relationally defined nonsymbolic ratio magnitudes might reveal integration of
symbolic fraction processing with more primitive magnitude processing architectures.
Experiment 1
We tested this hypothesis by investigating whether nonsymbolic ratio magnitude
automatically influences the speed and accuracy of symbolic fraction comparisons. Expanding
upon previous work that has investigated SiCEs based on the absolute sizes of stimuli, we
investigated RCEs that might emerge from relative magnitudes. Participants selected the larger
of two symbolic fractions varying along three dimensions: the numerical values of the symbolic
fractions compared (the relevant dimension), the congruity of the absolute physical sizes of the
fractions relative to the symbolic fraction decision, and the congruity of the nonsymbolic ratios
formed by the fonts used to print the numerators and denominators of each fraction.
Evidence of RCEs would have two implications for theories concerning processing of
fraction magnitudes. First, RCEs for symbolic comparison tasks would demonstrate a heretofore
unobserved relationship between two very different representations of ratios (i.e., symbolic and
nonsymbolic). Second, because the nonsymbolic ratio manipulation is unfamiliar to participants,
there would be little argument that any observed effects were the results of practice. They would
instead be consistent with the existence of cognitive architectures specifically dedicated to
RATIO CONGRUITY EFFECT 8
processing the holistic magnitudes of non-symbolic ratios as suggested by Jacob et al. (2012).
Method
Participants
Participants were 40 undergraduates (35 female, Mage = 20.03) from a large Midwestern
university participating for course credit.
Stimuli
The symbolic fractions used were irreducible proper fractions with single digit
numerators and denominators, excluding ½ to avoid effects associated with its special status (see
Schneider & Siegler, 2010). From these, we produced 86 fraction pairs with no shared
components (i.e., no digit appeared in both fractions of a pair). Pairs were constructed this way to
reduce reliance on componential strategies that might bypass the processing of holistic fraction
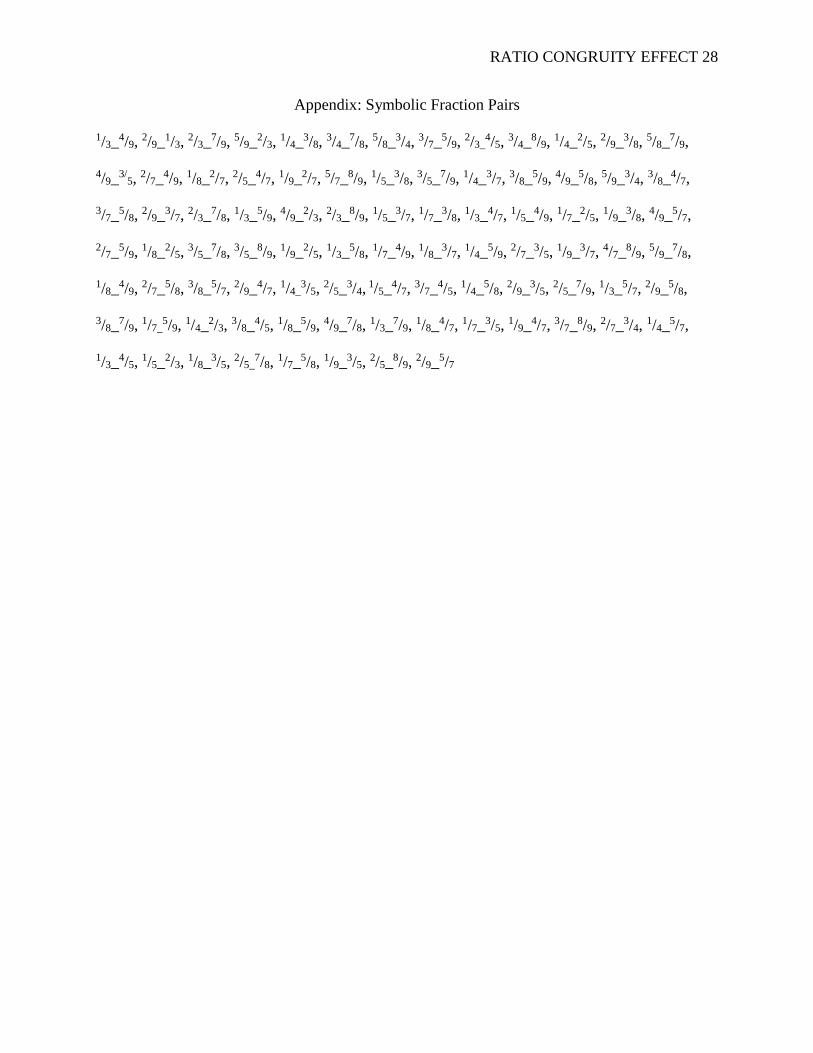
magnitude (Meert, et al., 2010). The Appendix lists all fraction pairs used.
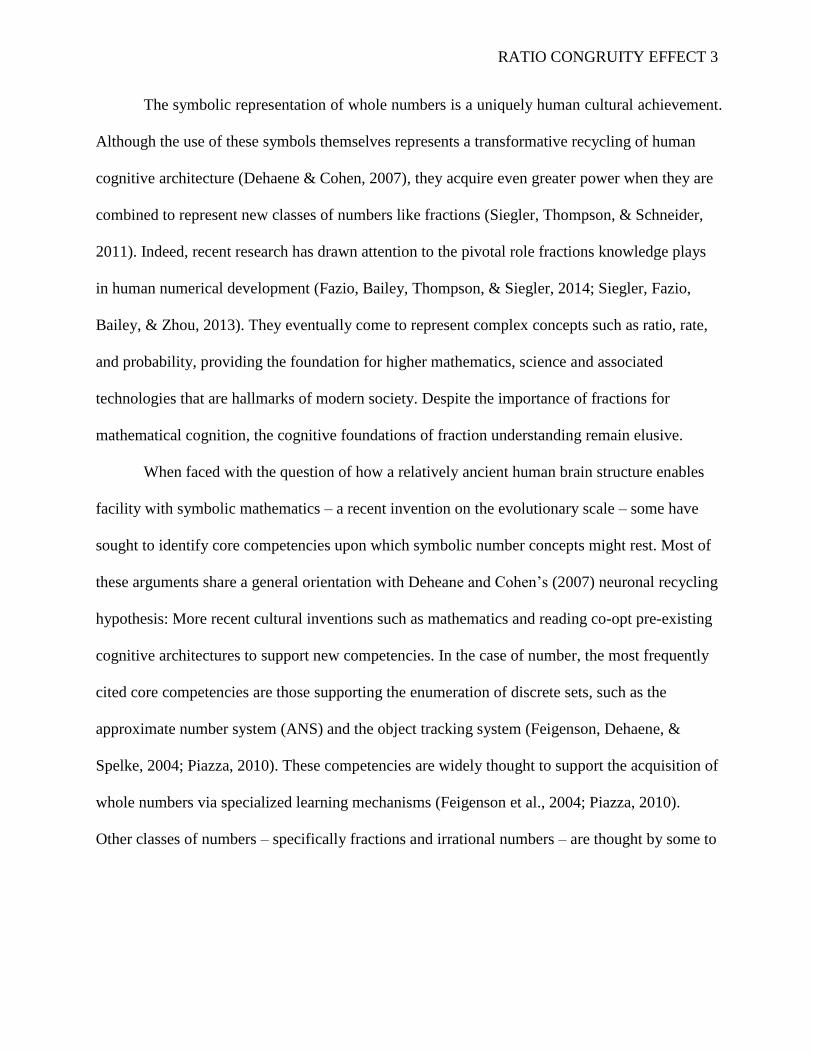
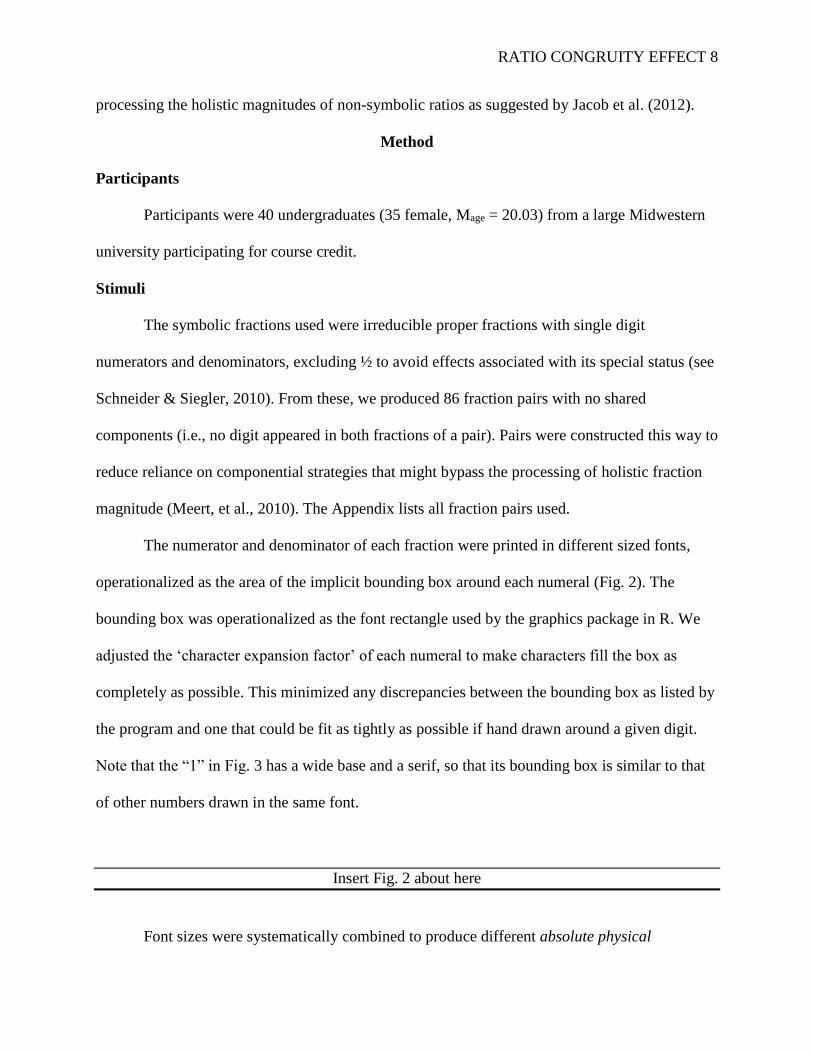
The numerator and denominator of each fraction were printed in different sized fonts,
operationalized as the area of the implicit bounding box around each numeral (Fig. 2). The
bounding box was operationalized as the font rectangle used by the graphics package in R. We
adjusted the ‘character expansion factor’ of each numeral to make characters fill the box as
completely as possible. This minimized any discrepancies between the bounding box as listed by
the program and one that could be fit as tightly as possible if hand drawn around a given digit.
Note that the “1” in Fig. 3 has a wide base and a serif, so that its bounding box is similar to that
of other numbers drawn in the same font.
Insert Fig. 2 about here
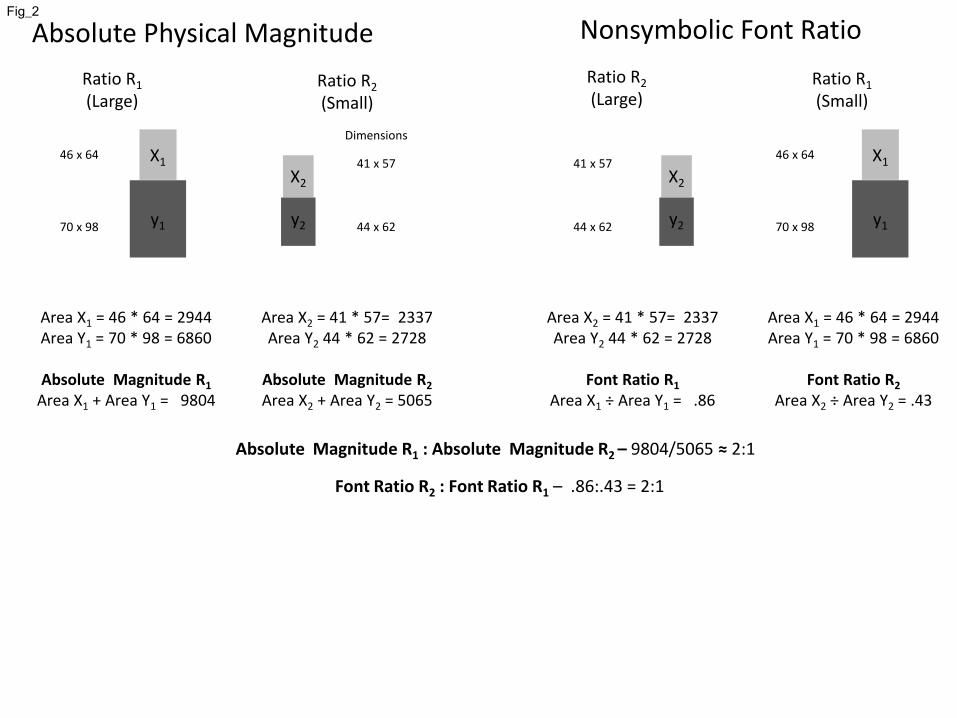
Font sizes were systematically combined to produce different absolute physical

RATIO CONGRUITY EFFECT 9
magnitudes and nonsymbolic font ratios. The absolute physical magnitude of a fraction was
defined as the summed areas of the numerator and denominator fonts. This dimension is not
defined relationally, as it is simply the summed area of fraction components. In contrast, the
nonsymbolic font ratio was defined as the number generated by dividing the numerator font area
by the denominator font area. Numerator font size was always smaller than denominator font
size. Because this was defined relationally, it was possible to have small font ratios with large
physical magnitudes and to have large font ratios with small absolute physical magnitudes (Fig.
2).
Fraction font sizes were determined for each trial with these restrictions:
1) Fonts of individual characters ranged in size from 17 x 24 pixels to 132 x 185 pixels;
2) Nonsymbolic font ratios composed of these characters ranged in value from
approximately .1 to .9;
3) The absolute physical magnitude for a fraction was allowed to range from 12233 to
37800 sq pixels;
4) The ratio between the larger font ratio and smaller font ratio was always approximately
2:1. Note that this ratio is actually a ratio of ratios (see Fig. 1);
5) The ratio of the larger absolute physical magnitude to smaller absolute physical
magnitude was always approximately 2:1.
For each trial, the program first randomly chose the value of the larger font ratio (between .2
and .9). The value of the smaller ratio was set to ½ of this value (e.g., .10 to .45). Next the larger
absolute magnitude was randomly chosen from the range described above, and the smaller
absolute magnitude was set to ½ of this value. This combination of font ratio and absolute
magnitude completely defined the actual font sizes for each of the components used. This
RATIO CONGRUITY EFFECT 10
method allowed absolute physical magnitudes and nonsymbolic font ratio magnitudes to vary
randomly across trials while constraining both to be approximately 2:1 within each comparison
pair. These ratios were very close, but inexact approximations due to the necessity of rendering
fonts in a discrete number of pixels. The larger fraction was on the right for half of the trials and
on the left for the other half. This was also true for font ratio and for absolute physical magnitude.
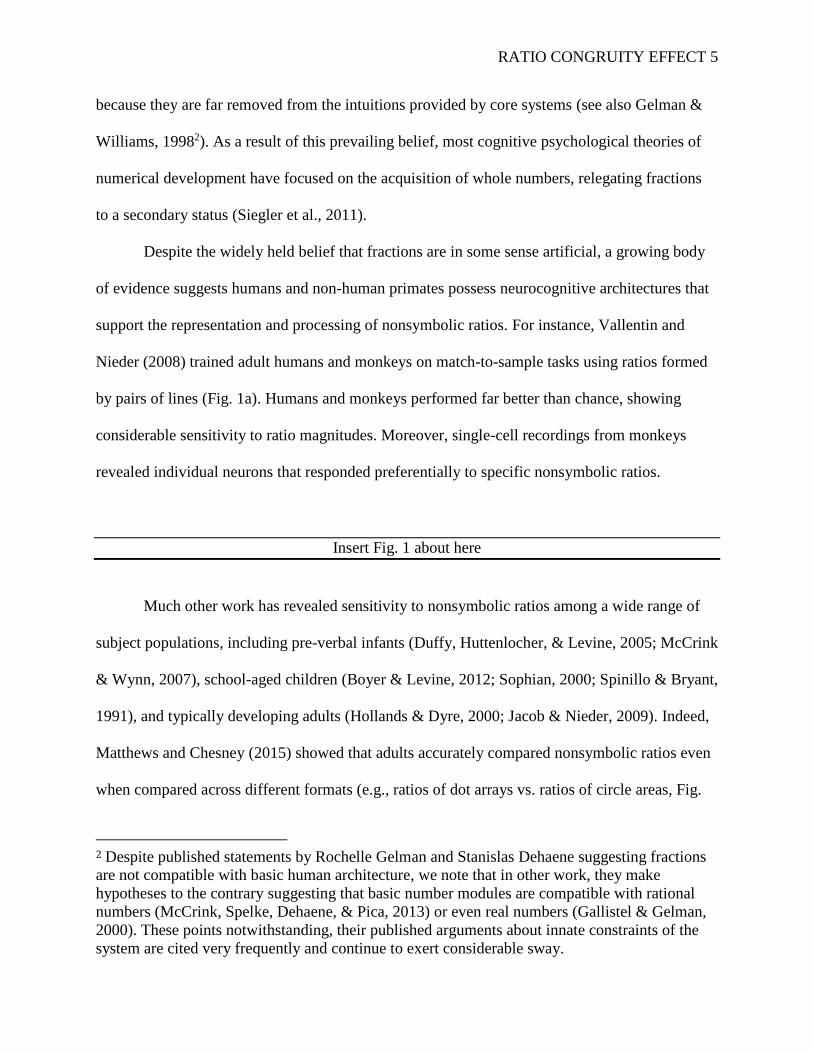
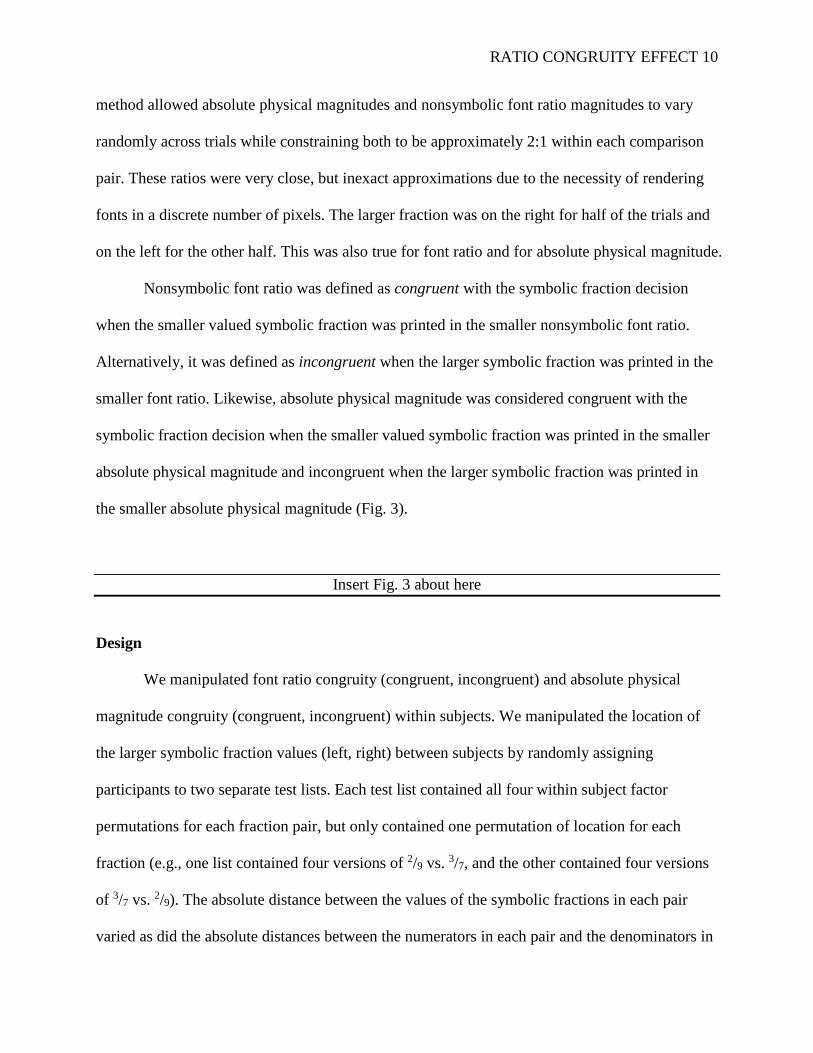
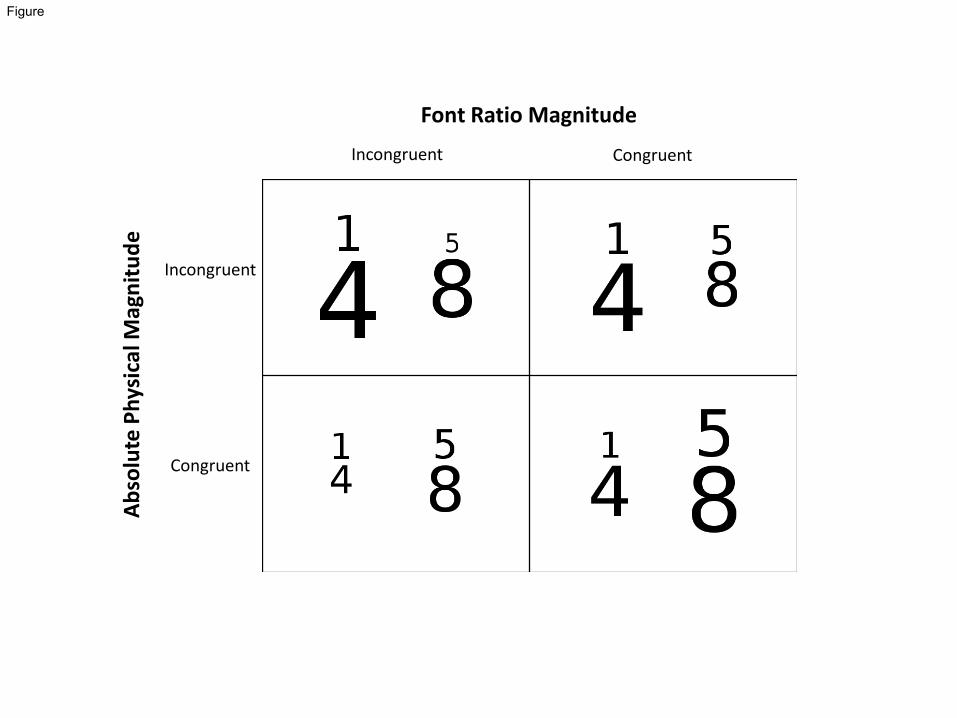
Nonsymbolic font ratio was defined as congruent with the symbolic fraction decision
when the smaller valued symbolic fraction was printed in the smaller nonsymbolic font ratio.
Alternatively, it was defined as incongruent when the larger symbolic fraction was printed in the
smaller font ratio. Likewise, absolute physical magnitude was considered congruent with the
symbolic fraction decision when the smaller valued symbolic fraction was printed in the smaller
absolute physical magnitude and incongruent when the larger symbolic fraction was printed in
the smaller absolute physical magnitude (Fig. 3).
Insert Fig. 3 about here
Design
We manipulated font ratio congruity (congruent, incongruent) and absolute physical
magnitude congruity (congruent, incongruent) within subjects. We manipulated the location of
the larger symbolic fraction values (left, right) between subjects by randomly assigning
participants to two separate test lists. Each test list contained all four within subject factor
permutations for each fraction pair, but only contained one permutation of location for each
fraction (e.g., one list contained four versions of 2/9 vs. 3/7, and the other contained four versions
of 3/7 vs. 2/9). The absolute distance between the values of the symbolic fractions in each pair
varied as did the absolute distances between the numerators in each pair and the denominators in
RATIO CONGRUITY EFFECT 11
each pair. The presentation order was randomized for each participant.
Procedure
Participants were instructed to select the larger fraction while ignoring differences in font
size. Stimuli were presented on an LCD monitor (54.61 cm, measured diagonally) using a script
written in PEBL (Mueller, 2012). Participants pressed “j” when they judged the right symbolic
fraction to be larger and “f” when they judged the left to be larger. On each trial, participants first
saw a fixation cross for 1000ms followed by a fraction pair. Stimuli remained on-screen until
participants made a choice. The next trial commenced immediately following a response.
Participants completed 5 practice trials followed by 344 experimental trials (86 pairs x 2 absolute
physical congruity x 2 font ratio congruity).
Results
We used linear mixed models (LMM) to account for within-subject correlation among
trials. We conducted separate analyses with RT (a linear model) and accuracy (a logistic model)
as dependent variables to parallel analyses in prior literature (Schneider & Siegler, 2010).
Models initially included two nonsymbolic independent variables (font ratio congruity and
absolute magnitude congruity) and three symbolic ones: holistic distance (i.e. |Fraction1 –
Fraction2|), numerator distance (i.e., |Numerator1 – Numerator2|), and denominator distance (i.e.,
|Denominator1 – Denominator2|). Preliminary analyses also indicated that fraction pairs in which
the smaller symbolic fraction contained both a larger numerator and a larger denominator than
the larger symbolic fraction (i.e., 2/9 vs. 1/3, 5/9 vs. 2/3, etc.) were responded to more slowly and
less accurately than others (see also Ischebeck, Weilharter, & Körner, 2015). Consequently, we
added a double symbolic incongruity factor to the LMM models to ensure that estimates were
not unduly influenced by these items. This wholly symbolic factor was defined as incongruent
RATIO CONGRUITY EFFECT 12
when both the numerator and the denominator values of the smaller fraction were larger than the
numerator and denominator of the larger fraction and as congruent otherwise. We also initially
included several interaction terms: holistic distance font ratio congruity, holistic distance
absolute physical magnitude congruity. holistic distance double symbolic incongruity, absolute
physical magnitude congruity font ratio congruity, and absolute physical magnitude congruity
double symbolic incongruity. No interactions were significant, so we dropped the terms and
reran the analyses confined to main effects.
We estimated fixed effects for all variables with random intercepts. Outliers were culled
at the participant level; responses more than 3 standard deviations from a participant’s mean RT
were trimmed. This affected less than 2% of the data. As is standard in the literature, RT analysis
included only error-free trials. However, because participants were very accurate overall (M =
93.4), RT analyses still included over 90% of all data points. Results from LMM analyses are
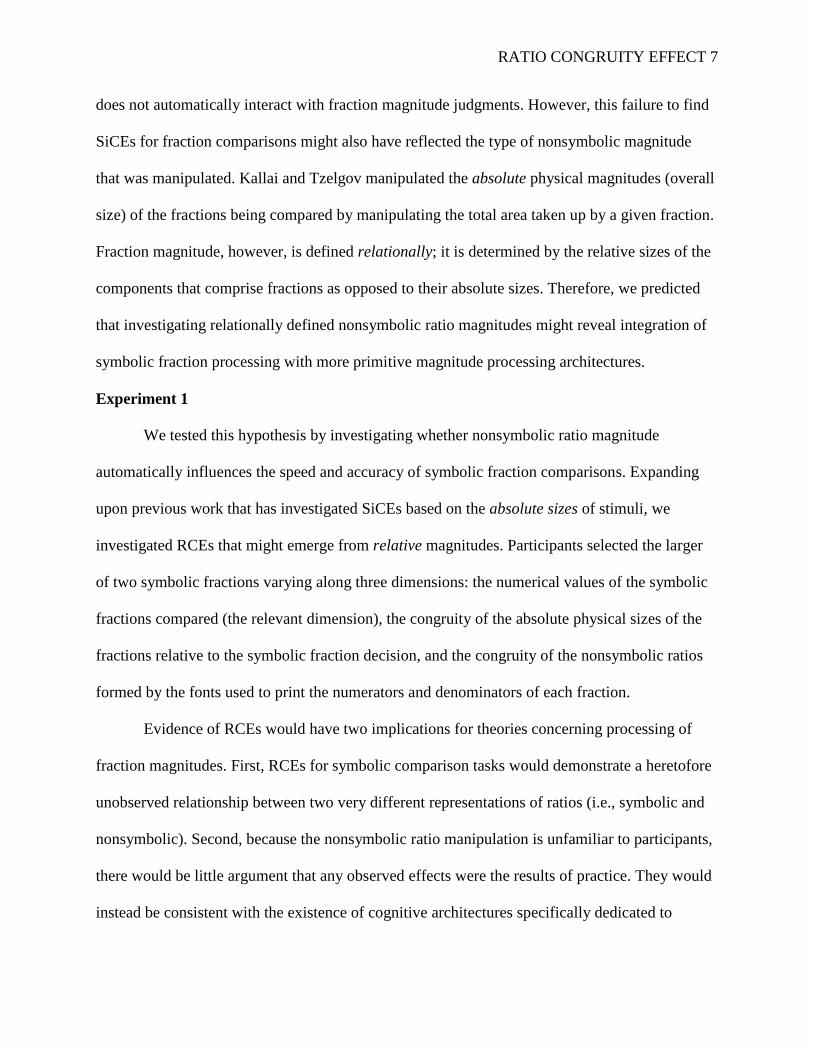
presented in Tables 1a and 1b and in Fig. 4.3
Insert Tables 1a and 1b about here
Insert Fig. 4 about here
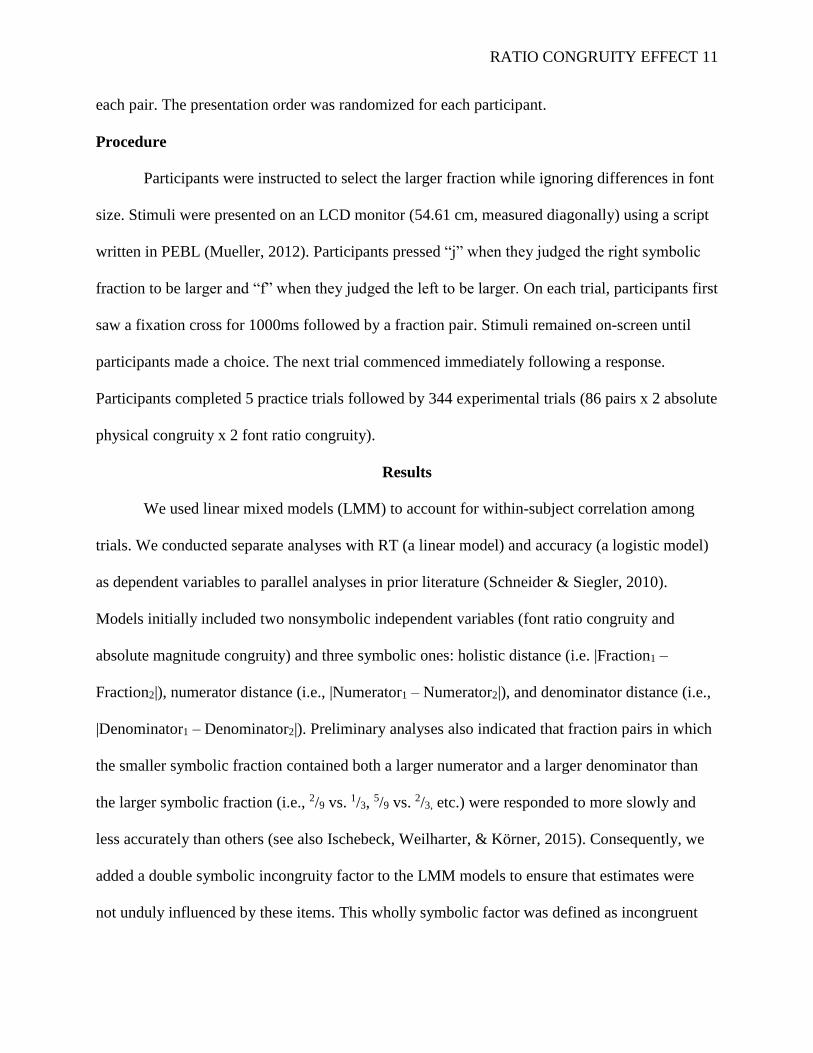
Analyses revealed the predicted font-based RCEs. Even though nonsymbolic font ratio
was an irrelevant task dimension, participants were slower (M = 99.35 ms, p < .01) and less
likely to be accurate (OR = .54, p < .01) when fractions were printed in font ratios that were
3 We conducted analysis using raw RTs because it yielded results with easily interpretable units.
However, RTs for comparisons tend to be positively skewed, violating normality assumptions, so
we also analyzed log transformed RT data. Analyses of log RTs were compatible with those
from raw scores, with the same variables emerging as significant and in the same direction across
both analyses.
RATIO CONGRUITY EFFECT 13
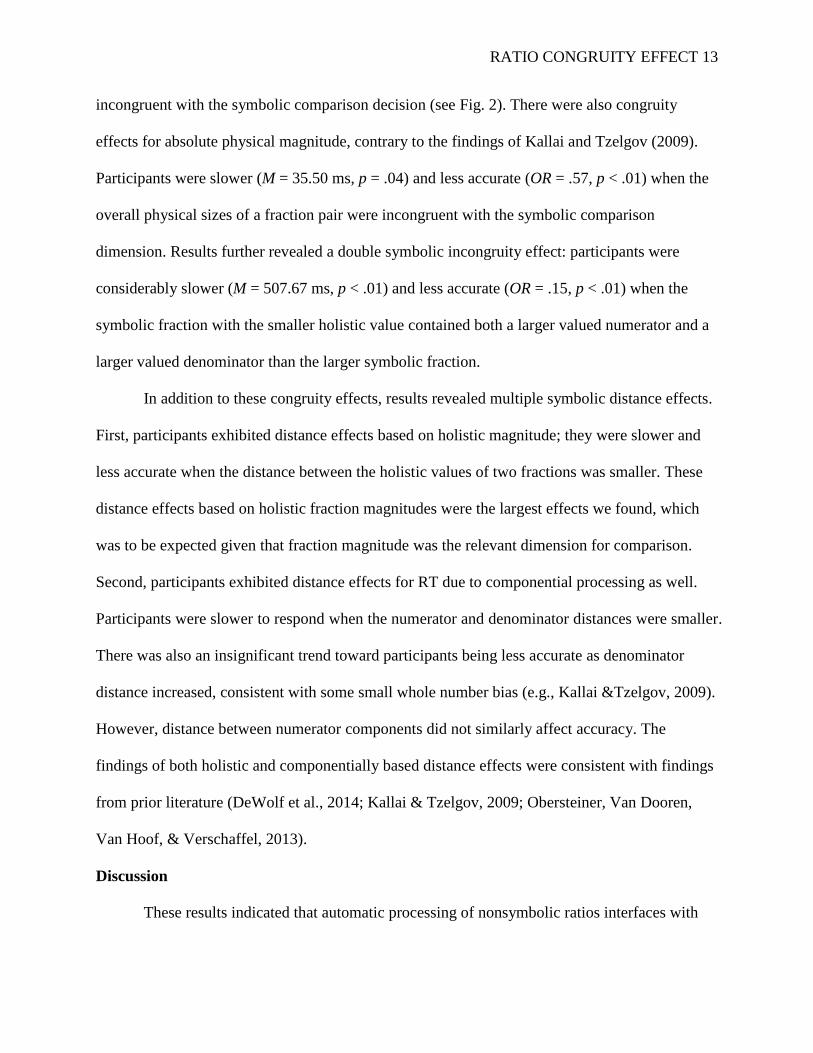
incongruent with the symbolic comparison decision (see Fig. 2). There were also congruity
effects for absolute physical magnitude, contrary to the findings of Kallai and Tzelgov (2009).
Participants were slower (M = 35.50 ms, p = .04) and less accurate (OR = .57, p < .01) when the
overall physical sizes of a fraction pair were incongruent with the symbolic comparison
dimension. Results further revealed a double symbolic incongruity effect: participants were
considerably slower (M = 507.67 ms, p < .01) and less accurate (OR = .15, p < .01) when the
symbolic fraction with the smaller holistic value contained both a larger valued numerator and a
larger valued denominator than the larger symbolic fraction.
In addition to these congruity effects, results revealed multiple symbolic distance effects.
First, participants exhibited distance effects based on holistic magnitude; they were slower and
less accurate when the distance between the holistic values of two fractions was smaller. These
distance effects based on holistic fraction magnitudes were the largest effects we found, which
was to be expected given that fraction magnitude was the relevant dimension for comparison.
Second, participants exhibited distance effects for RT due to componential processing as well.
Participants were slower to respond when the numerator and denominator distances were smaller.
There was also an insignificant trend toward participants being less accurate as denominator
distance increased, consistent with some small whole number bias (e.g., Kallai &Tzelgov, 2009).
However, distance between numerator components did not similarly affect accuracy. The
findings of both holistic and componentially based distance effects were consistent with findings
from prior literature (DeWolf et al., 2014; Kallai & Tzelgov, 2009; Obersteiner, Van Dooren,
Van Hoof, & Verschaffel, 2013).
Discussion
These results indicated that automatic processing of nonsymbolic ratios interfaces with
RATIO CONGRUITY EFFECT 14
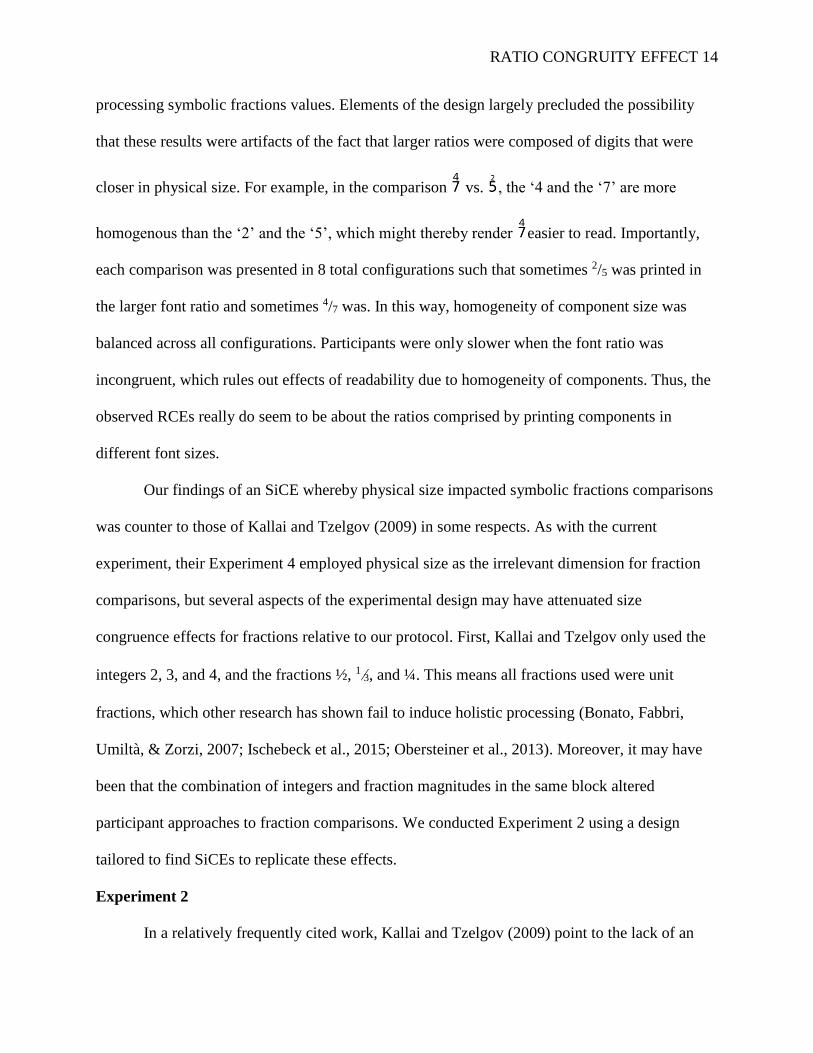
processing symbolic fractions values. Elements of the design largely precluded the possibility
that these results were artifacts of the fact that larger ratios were composed of digits that were
closer in physical size. For example, in the comparison vs. , the ‘4 and the ‘7’ are more
homogenous than the ‘2’ and the ‘5’, which might thereby render easier to read. Importantly,
each comparison was presented in 8 total configurations such that sometimes 2/5 was printed in
the larger font ratio and sometimes 4/7 was. In this way, homogeneity of component size was
balanced across all configurations. Participants were only slower when the font ratio was
incongruent, which rules out effects of readability due to homogeneity of components. Thus, the
observed RCEs really do seem to be about the ratios comprised by printing components in
different font sizes.
Our findings of an SiCE whereby physical size impacted symbolic fractions comparisons
was counter to those of Kallai and Tzelgov (2009) in some respects. As with the current
experiment, their Experiment 4 employed physical size as the irrelevant dimension for fraction
comparisons, but several aspects of the experimental design may have attenuated size
congruence effects for fractions relative to our protocol. First, Kallai and Tzelgov only used the
integers 2, 3, and 4, and the fractions ½, 13, and ¼. This means all fractions used were unit
fractions, which other research has shown fail to induce holistic processing (Bonato, Fabbri,
Umiltà, & Zorzi, 2007; Ischebeck et al., 2015; Obersteiner et al., 2013). Moreover, it may have
been that the combination of integers and fraction magnitudes in the same block altered
participant approaches to fraction comparisons. We conducted Experiment 2 using a design
tailored to find SiCEs to replicate these effects.
Experiment 2
In a relatively frequently cited work, Kallai and Tzelgov (2009) point to the lack of an
RATIO CONGRUITY EFFECT 15
SiCE (i.e., that comparison of symbolic fractions was not affected by physical size) to conclude
that “unlike natural numbers, fractions are not associated with specific size or quantity even in
the [numerical comparison] task, where participants were asked to infer the numerical value of
the fraction” (p. 1859). The lack of an SiCE was presumed in part to be due to fractions being
encoded as generalized magnitudes less than one. However, the findings of Experiment 1 only
make sense if symbolic fraction magnitudes are more differentiated. We felt it important to
corroborate these contrary findings. A conservative reader might charge that our Experiment 1
had features that could possibly compromise the validity of the SiCE finding for absolute
physical magnitude. Specifically, it is possible that the manipulation of font ratios – a novel
stimulus for participants – prompted wholesale changes in fractions processing strategies and
that the overall SiCE emerged as a result. We conducted Experiment 2 as a modification of
Experiment 4 of Kallai and Tzelgov with a new sample of participants in an attempt to replicate
the overall SiCE without the added factor of font ratio manipulation.
Method
Participants
Participants were 35 undergraduates (28 female, Mage = 19.91) from a large Midwestern
university participating for course credit.
Stimuli & Procedure
The symbolic fraction pairs compared were the same set of 86 from Experiment 1. Font
ratio magnitude was constant for all stimuli, as the numerator and denominator of each fraction
were printed in the same font for a given fraction. To manipulate overall size, each comparison
involved one fraction printed in a small size (74 x 230 pixels) and another in a large size (100 x
323 pixels). Thus, the screen area taken by small fractions was approximately half that taken by
RATIO CONGRUITY EFFECT 16
large ones. Absolute physical magnitude congruity was defined just as it was in Experiment 1.
We manipulated absolute physical magnitude congruity (congruent, incongruent) and the
location of the larger symbolic fraction (left, right) within subjects for each of the 86 fraction
pairs. This yielded 344 trials for each participant (86 pairs x 2 absolute physical congruity x 2
side of presentation). All participants saw the same trials in random order. The procedure and
computer hardware were identical to that of Experiment 1. Stimuli were presented using
Superlab 5 software (Cedrus Corporation, 2014).
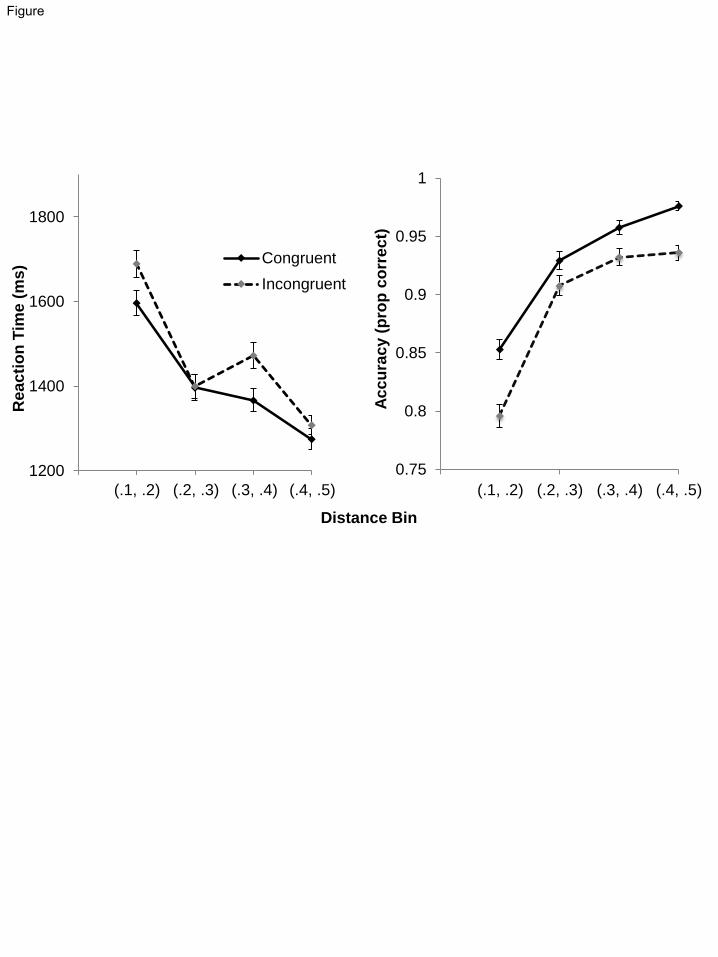
Results
We ran separate LMM analyses for RT and accuracy parallel to those conducted in
Experiment 1. Independent variables included absolute physical magnitude congruity, holistic
distance, numerator distance, denominator distance, and double symbolic incongruity, all defined
the same as in Experiment 1. Responses more than 3 standard deviations from a participant’s
mean RT were trimmed. This affected less than 2% of the data. RT analyses included only error-
free trials, but still included over 90% of all data points because participants were mostly
accurate overall (M = 90.7). Results from LMM analyses are presented in Tables 2a and 2b and
Fig. 5.
Insert Tables 2a and 2b about here
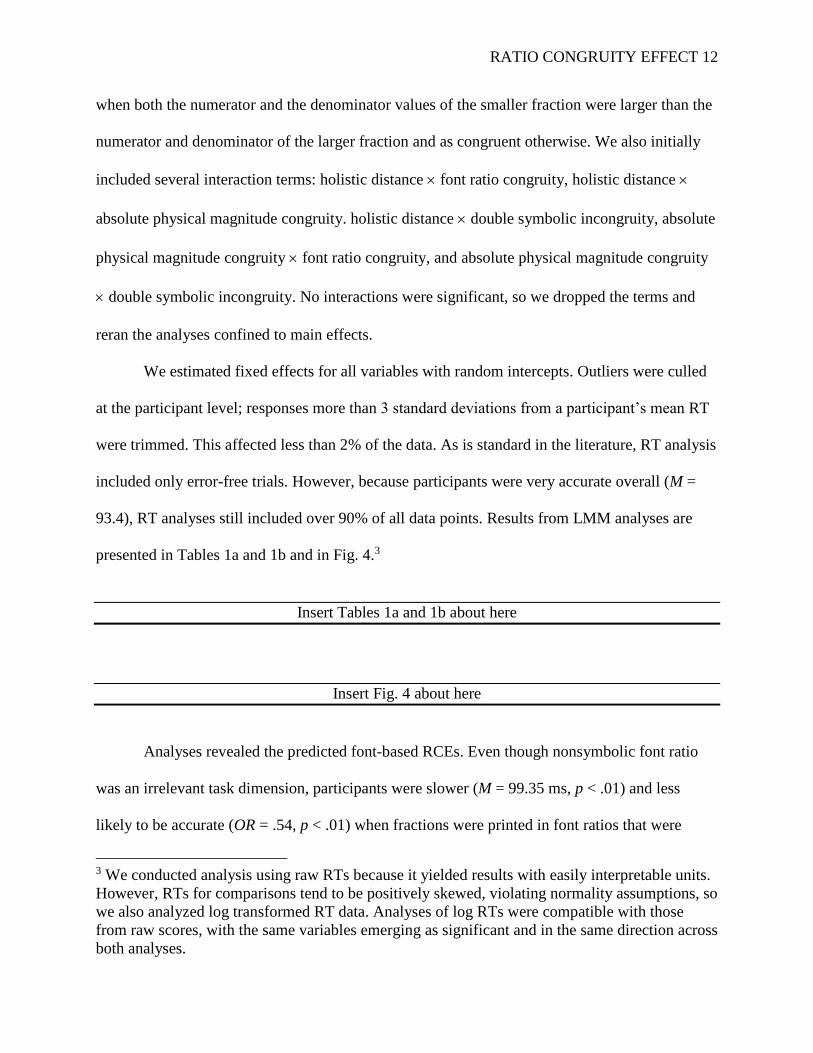
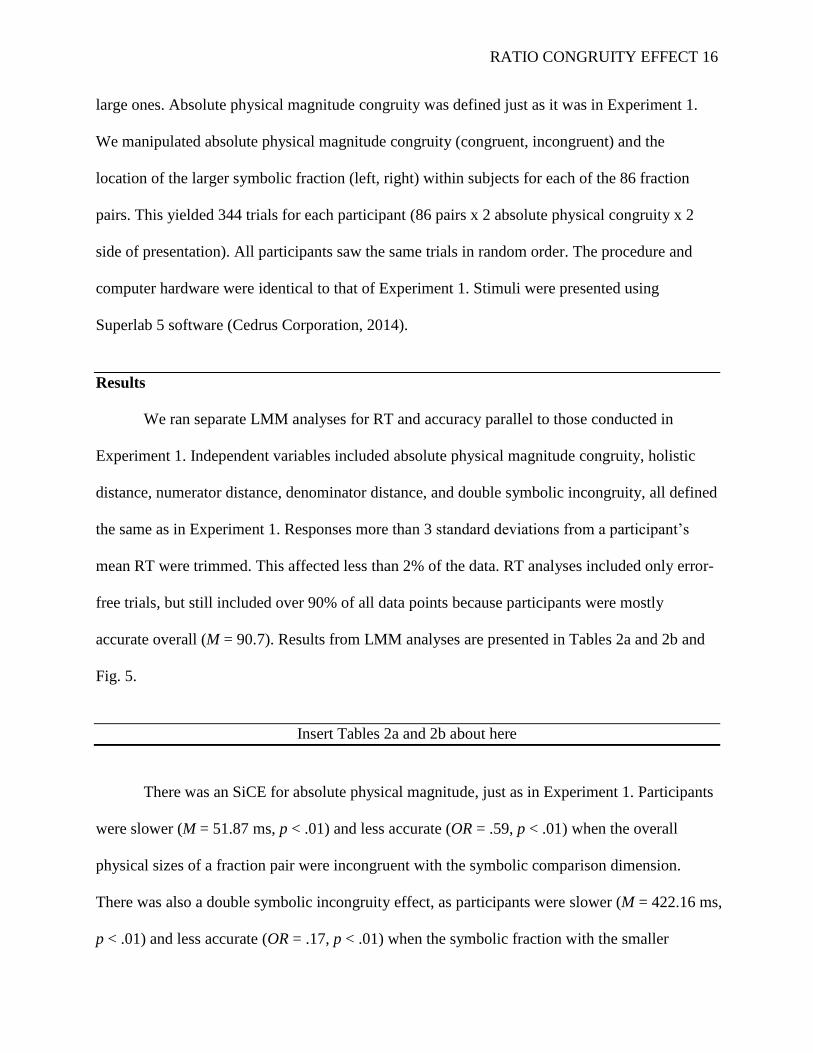
There was an SiCE for absolute physical magnitude, just as in Experiment 1. Participants
were slower (M = 51.87 ms, p < .01) and less accurate (OR = .59, p < .01) when the overall
physical sizes of a fraction pair were incongruent with the symbolic comparison dimension.
There was also a double symbolic incongruity effect, as participants were slower (M = 422.16 ms,
p < .01) and less accurate (OR = .17, p < .01) when the symbolic fraction with the smaller

RATIO CONGRUITY EFFECT 17
holistic value contained both a larger valued numerator and a larger valued denominator than the
larger symbolic fraction.
Insert Fig. 5 about here
In addition to these congruity effects, participants were slower and less accurate when the
distance between the holistic values of two fractions was smaller. As in Experiment 1, these
effects were the largest effects we found. Participants were also slower and less accurate when
numerator distances were smaller. Finally, although participants were slower when denominator
distances were smaller, the componential distance effect for denominators regarding accuracy
failed to reach significance. Again, the findings of both holistic and componentially based
distance effects were consistent with findings from prior literature (DeWolf et al., 2014; Meert et
al., 2010; Obersteiner et al., 2013).
Discussion
Experiment 2 confirmed our findings of an SiCE for fractions using a more direct
paradigm than that of Experiment 1. Despite the fact that overall physical size was an irrelevant
dimension, it still influenced judgments of symbolic magnitude. In order for participants to
systematically map physical size onto symbolic size, they must differentiate between large and
small fractions based on symbolic magnitude. Thus, these results are consistent with participants
treating symbolic fractions as magnitudes that can be differentiated, not as generalized
undifferentiated magnitudes less than one.
General Discussion
These experiments presented the first behavioral evidence that automatic processing of
nonsymbolic magnitudes interferes with processing of symbolic fraction magnitudes. Experiment
RATIO CONGRUITY EFFECT 18
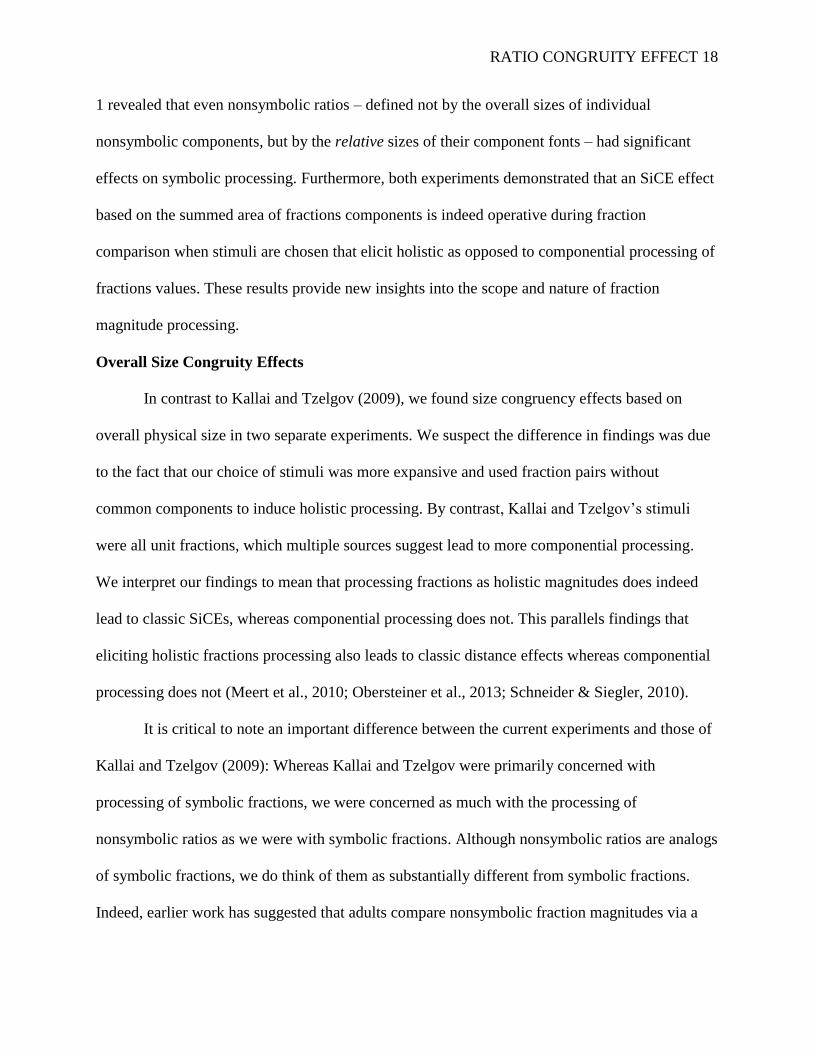
1 revealed that even nonsymbolic ratios – defined not by the overall sizes of individual
nonsymbolic components, but by the relative sizes of their component fonts – had significant
effects on symbolic processing. Furthermore, both experiments demonstrated that an SiCE effect
based on the summed area of fractions components is indeed operative during fraction
comparison when stimuli are chosen that elicit holistic as opposed to componential processing of
fractions values. These results provide new insights into the scope and nature of fraction
magnitude processing.
Overall Size Congruity Effects
In contrast to Kallai and Tzelgov (2009), we found size congruency effects based on
overall physical size in two separate experiments. We suspect the difference in findings was due
to the fact that our choice of stimuli was more expansive and used fraction pairs without
common components to induce holistic processing. By contrast, Kallai and Tzelgov’s stimuli
were all unit fractions, which multiple sources suggest lead to more componential processing.
We interpret our findings to mean that processing fractions as holistic magnitudes does indeed
lead to classic SiCEs, whereas componential processing does not. This parallels findings that
eliciting holistic fractions processing also leads to classic distance effects whereas componential
processing does not (Meert et al., 2010; Obersteiner et al., 2013; Schneider & Siegler, 2010).
It is critical to note an important difference between the current experiments and those of
Kallai and Tzelgov (2009): Whereas Kallai and Tzelgov were primarily concerned with
processing of symbolic fractions, we were concerned as much with the processing of
nonsymbolic ratios as we were with symbolic fractions. Although nonsymbolic ratios are analogs
of symbolic fractions, we do think of them as substantially different from symbolic fractions.
Indeed, earlier work has suggested that adults compare nonsymbolic fraction magnitudes via a
RATIO CONGRUITY EFFECT 19
perceptual process that does not involve converting them to symbolic form (Matthews &
Chesney, 2015). These differences should be kept in mind when comparing the current findings
with those of Kallai and Tzelgov.
For instance, it is noteworthy that the SiCEs in the current experiments were
accompanied by response latencies that averaged over 1600ms. Even though physical size
clearly affected symbolic comparisons, it remains true that symbolic fractions comparisons took
considerably longer than the < 800ms participants took to make fractions comparisons in Kallai
and Tzelgov. This was longer still than the time those same participants typically took to
compare whole numbers (typically ~500ms). The comparatively long reaction times might be
taken to support Kallai and Tzelgov’s contention that the magnitudes of symbolic fractions are
not discretely represented in long-term memory and that they are instead generated by applying
some sort of processing strategies to their whole number components (see also DeWolf et al.,
2014). Thus, despite the findings of SiCEs, it remains clear that comparing symbolic fractions
magnitudes is qualitatively more difficult than comparing whole numbers.
The Ratio Congruity Effect
Although Jacob and Nieder’s (2009) neuroimaging paradigm found that nonsymbolic
ratios automatically evoked neural responses, the current study is the first to show that automatic
processing of nonsymbolic ratios can lead to competition with symbolic processing. This
automatic processing of ratio magnitude even when irrelevant to the task at hand is consistent
with Jacob et al.’s (2012) hypothesis that there are cognitive architectures specifically dedicated
to processing nonsymbolically instantiated ratios. These results stand alongside developmental
work on ratio processing (e.g., Boyer & Levine, 2012; Duffy et al., 2005; Sophian, 2000) in
contrast to the assertion made by several cognitive scientists that fractions concepts are
RATIO CONGRUITY EFFECT 20
unsupported by primitive architectures (e.g., Dehaene, 1997; Feigenson et al., 2004; Gelman &
Williams, 1998).
The presence of RCEs is evidence of considerably more complex nonsymbolic
processing than that indicated by SiCEs for overall size. Whereas overall SiCEs may reflect
automatic processing of coarse scalar magnitudes that correspond to the overall amount of space
stimuli occupy, RCEs persisted even after partialing out absolute physical magnitude, confirming
that it really was the ratio between font areas that drove the effect. This is evidence of automatic
processing of relational magnitudes, minimally with genuine ordinal properties: For congruity to
exert effects, the direction of ‘large’ in the symbolic dimension must be at least coarsely mapped
to ‘large’ in the nonsymbolic ratio dimension. This indicates a degree of sophistication in
nonsymbolic ratio processing that goes beyond a generalized representation of small magnitudes.
One question raised by the presence of RCEs is whether the same neural circuits are
involved in the processing of both nonsymbolic ratios and symbolic fraction values. Indeed,
neuroimaging studies have shown that the fronto-parietal cortical networks implicated in the
representation of nonsymbolic ratios are similar to those involved in representing and processing
symbolic fractions (Jacob & Nieder, 2009). However, no neuroimaging studies have directly
investigated whether processing of symbolic fractions and of nonsymbolic ratios engage the
same neural circuitry. The present findings suggest that the time for investigating these links has
arrived.
Conclusions
On a final note, the revelation of RCEs raises questions concerning the nature of human
numerical cognition as it results to magnitude processing more generally. Is the automatic
processing of nonsymbolic ratio magnitude the activity of a very general magnitude processing

RATIO CONGRUITY EFFECT 21
system (Walsh, 2003)? Might this automatic ratio processing help support our understanding of
numerical magnitudes (Lewis et al., 2015; Matthews, Lewis, & Hubbard, 2015)? Indeed, Siegler
et al. (2011) argued that the one thing uniting whole numbers, fractions, and all real numbers for
that matter, is that they can be represented as magnitudes on a number line. It may be that
number lines are such an effective representation because they leverage the same powerful and
automatically invoked sensitivities to nonsymbolic ratios that drove the effects of this research
(See Barth & Paladino, 2011 for an account of number line estimation as ratio matching).
Moreover, the current research stands alongside recent findings demonstrating that ratio
sensitivity extends beyond line segments minimally to include ratios composed of dots
(Matthews et al., 2015; Meert, Grégoire, Seron, & Noël, 2012), circle areas (Matthews &
Chesney, 2015), and implicitly defined font area ratios. In the final analysis, it may be that
attending more to how humans process nonsymbolic ratios, these fractions that we can’t ignore,
may hold significant potential for enriching our understanding of the human number sense.

RATIO CONGRUITY EFFECT 22
Acknowledgements
This research was supported in part by an internal grant from the Wisconsin Alumni Research
Fund and in part by NSF Grant DRL-1420211.
RATIO CONGRUITY EFFECT 23
References
Barth, H. C., & Paladino, A. M. (2011). The development of numerical estimation: evidence
against a representational shift. Developmental Science, 14(1), 125–135.
http://doi.org/10.1111/j.1467-7687.2010.00962.x
Bonato, M., Fabbri, S., Umiltà, C., & Zorzi, M. (2007). The mental representation of numerical
fractions: Real or integer? Journal of Experimental Psychology: Human Perception and
Performance, 33(6), 1410–1419. http://doi.org/10.1037/0096-1523.33.6.1410
Boyer, T. W., & Levine, S. C. (2012). Child proportional scaling: Is 1/3 = 2/6 = 3/9 = 4/12?
Journal of Experimental Child Psychology, 111(3), 516–533.
http://doi.org/10.1016/j.jecp.2011.11.001
Cohen Kadosh, R., & Henik, A. (2006). A Common Representation for Semantic and Physical
Properties. Experimental Psychology (formerly “Zeitschrift Für Experimentelle
Psychologie”), 53(2), 87–94. http://doi.org/10.1027/1618-3169.53.2.87
Dehaene, S. (1997). The number sense. Oxford University Press New York:
Dehaene, S., & Cohen, L. (2007). Cultural recycling of cortical maps. Neuron, 56(2), 384–398.
http://doi.org/10.1016/j.neuron.2007.10.004
DeWolf, M., Grounds, M. A., Bassok, M., & Holyoak, K. J. (2014). Magnitude comparison with
different types of rational numbers. Journal of Experimental Psychology: Human
Perception and Performance, 40(1), 71–82. http://doi.org/10.1037/a0032916
Duffy, S., Huttenlocher, J., Levine, S., & Duffy, R. (2005). How Infants Encode Spatial Extent.
Infancy, 8(1), 81–90. http://doi.org/10.1207/s15327078in0801_5
Fazio, L. K., Bailey, D. H., Thompson, C. A., & Siegler, R. S. (2014). Journal of Experimental
Child Psychology. Journal of Experimental Child Psychology, 123, 53–72.
RATIO CONGRUITY EFFECT 24
Feigenson, L., Dehaene, S., & Spelke, E. (2004). Core systems of number. Trends in Cognitive
Sciences, 8(7), 307–314. http://doi.org/10.1016/j.tics.2004.05.002
Gallistel, C. R., & Gelman, R. (2000). Non-verbal numerical cognition: from reals to integers.
Trends in Cognitive Sciences, 4(2), 59–65. http://doi.org/10.1016/S1364-6613(99)01424-
2
Gelman, R., & Williams, E. M. (1998). Enabling constraints for cognitive development and
learning: Domain specificity and epigenesis. In Handbook of child psychology: Volume
2: Cognition, perception, and language (pp. 575–630). Hoboken, NJ, US: John Wiley &
Sons Inc.
Henik, A., & Tzelgov, J. (1982). Is three greater than five: The relation between physical and
semantic size in comparison tasks. Memory & Cognition, 10(4), 389–395.
http://doi.org/10.3758/BF03202431
Hollands, J. G., & Dyre, B. P. (2000). Bias in Proportion Judgments: The Cyclical Power
Model* 1. Psychological Review, 107(3), 500–524.
Ischebeck, A., Weilharter, M., & Körner, C. (2015). Eye movements reflect and shape strategies
in fraction comparison. The Quarterly Journal of Experimental Psychology, 0(0), 1–15.
http://doi.org/10.1080/17470218.2015.1046464
Jacob, S. N., & Nieder, A. (2009). Tuning to non-symbolic proportions in the human
frontoparietal cortex. European Journal of Neuroscience, 30(7), 1432–1442.
http://doi.org/10.1111/j.1460-9568.2009.06932.x
Jacob, S. N., Vallentin, D., & Nieder, A. (2012). Relating magnitudes: the brain’s code for
proportions. Trends in Cognitive Sciences, 16(3), 157–166.
http://doi.org/10.1016/j.tics.2012.02.002

RATIO CONGRUITY EFFECT 25
Kallai, A. Y., & Tzelgov, J. (2009). A generalized fraction: An entity smaller than one on the
mental number line. Journal of Experimental Psychology: Human Perception and
Performance, 35(6), 1845–1864. http://doi.org/10.1037/a0016892
Kallai, A. Y., & Tzelgov, J. (2012). When meaningful components interrupt the processing of
the whole: The case of fractions. Acta Psychologica, 139(2), 358–369.
http://doi.org/10.1016/j.actpsy.2011.11.009
Landy, D., Silbert, N., & Goldin, A. (2013). Estimating Large Numbers. Cognitive Science,
37(5), 775–799. http://doi.org/10.1111/cogs.12028
Matthews, P. G., & Chesney, D. L. (2015). Fractions as percepts? Exploring cross-format
distance effects for fractional magnitudes. Cognitive Psychology, 78, 28–56.
http://doi.org/10.1016/j.cogpsych.2015.01.006
McCrink, K., Spelke, E. S., Dehaene, S., & Pica, P. (2013). Non-symbolic halving in an
Amazonian indigene group. Developmental Science, 16(3), 451–462.
http://doi.org/10.1111/desc.12037
McCrink, K., & Wynn, K. (2007). Ratio Abstraction by 6-Month-Old Infants. Psychological
Science, 18(8), 740–745. http://doi.org/10.1111/j.1467-9280.2007.01969.x
Meert, G., Grégoire, J., & Noël, M.-P. (2010). Comparing 5/7 and 2/9: Adults can do it by
accessing the magnitude of the whole fractions. Acta Psychologica, 135(3), 284–292.
http://doi.org/10.1016/j.actpsy.2010.07.014
Meert, G., Grégoire, J., Seron, X., & Noël, M.-P. (2012). The mental representation of the
magnitude of symbolic and nonsymbolic ratios in adults. The Quarterly Journal of
Experimental Psychology, 65(4), 702–724. http://doi.org/10.1080/17470218.2011.632485
RATIO CONGRUITY EFFECT 26
Newton, K. J. (2008). An Extensive Analysis of Preservice Elementary Teachers’ Knowledge of
Fractions. American Educational Research Journal, 45(4), 1080–1110.
http://doi.org/10.3102/0002831208320851
Obersteiner, A., Van Dooren, W., Van Hoof, J., & Verschaffel, L. (2013). The natural number
bias and magnitude representation in fraction comparison by expert mathematicians.
Learning and Instruction, 28, 64–72. http://doi.org/10.1016/j.learninstruc.2013.05.003
Piazza, M. (2010). Neurocognitive start-up tools for symbolic number representations. Trends in
Cognitive Sciences, 14(12), 542–551. http://doi.org/10.1016/j.tics.2010.09.008
Piazza, M., Pinel, P., Le Bihan, D., & Dehaene, S. (2007). A Magnitude Code Common to
Numerosities and Number Symbols in Human Intraparietal Cortex. Neuron, 53(2), 293–
305. http://doi.org/10.1016/j.neuron.2006.11.022
Schneider, M., & Siegler, R. S. (2010). Representations of the magnitudes of fractions. Journal
of Experimental Psychology: Human Perception and Performance, 36(5), 1227–1238.
http://doi.org/10.1037/a0018170
Siegler, R. S., Fazio, L. K., Bailey, D. H., & Zhou, X. (2013). Fractions: the new frontier for
theories of numerical development. Trends in Cognitive Sciences, 17(1), 13–19.
http://doi.org/10.1016/j.tics.2012.11.004
Siegler, R. S., Thompson, C. A., & Schneider, M. (2011). An integrated theory of whole number
and fractions development. Cognitive Psychology, 62(4), 273–296.
http://doi.org/10.1016/j.cogpsych.2011.03.001
Sophian, C. (2000). Perceptions of proportionality in young children: matching spatial ratios.
Cognition, 75(2), 145–170. http://doi.org/10.1016/S0010-0277(00)00062-7
RATIO CONGRUITY EFFECT 27
Spinillo, A. G., & Bryant, P. (1991). Children’s Proportional Judgments: The Importance of
“Half.” Child Development, 62(3), 427–440. http://doi.org/10.1111/j.1467-
8624.1991.tb01542.x
Vallentin, D., & Nieder, A. (2008). Behavioral and Prefrontal Representation of Spatial
Proportions in the Monkey. Current Biology, 18(18), 1420–1425.
http://doi.org/10.1016/j.cub.2008.08.042
Walsh, V. (2003). A theory of magnitude: common cortical metrics of time, space and quantity.
Trends in Cognitive Sciences, 7(11), 483–488. http://doi.org/10.1016/j.tics.2003.09.002
RATIO CONGRUITY EFFECT 28
Appendix: Symbolic Fraction Pairs
1/3_4/9,
2/9_1/3,
2/3_7/9,
5/9_2/3,
1/4_3/8,
3/4_7/8,
5/8_3/4,
3/7_5/9,
2/3_4/5,
3/4_8/9,
1/4_2/5,
2/9_3/8,
5/8_7/9,
4/9_3/
5, 2/7_
4/9, 1/8_
2/7, 2/5_
4/7, 1/9_
2/7, 5/7_
8/9, 1/5_
3/8, 3/5_
7/9, 1/4_
3/7, 3/8_
5/9, 4/9_
5/8, 5/9_
3/4, 3/8_
4/7,
3/7_5/8,
2/9_3/7,
2/3_7/8,
1/3_5/9,
4/9_2/3,
2/3_8/9,
1/5_3/7,
1/7_3/8,
1/3_4/7,
1/5_4/9,
1/7_2/5,
1/9_3/8,
4/9_5/7,
2/7_5/9,
1/8_2/5,
3/5_7/8,
3/5_8/9,
1/9_2/5,
1/3_5/8,
1/7_4/9,
1/8_3/7,
1/4_5/9,
2/7_3/5,
1/9_3/7,
4/7_8/9,
5/9_7/8,
1/8_4/9,
2/7_5/8,
3/8_5/7,
2/9_4/7,
1/4_3/5,
2/5_3/4,
1/5_4/7,
3/7_4/5,
1/4_5/8,
2/9_3/5,
2/5_7/9,
1/3_5/7,
2/9_5/8,
3/8_7/9,
1/7_5/9,
1/4_2/3,
3/8_4/5,
1/8_5/9,
4/9_7/8,
1/3_7/9,
1/8_4/7,
1/7_3/5,
1/9_4/7,
3/7_8/9,
2/7_3/4,
1/4_5/7,
1/3_4/5,
1/5_2/3,
1/8_3/5,
2/5_7/8,
1/7_5/8,
1/9_3/5,
2/5_8/9,
2/9_5/7
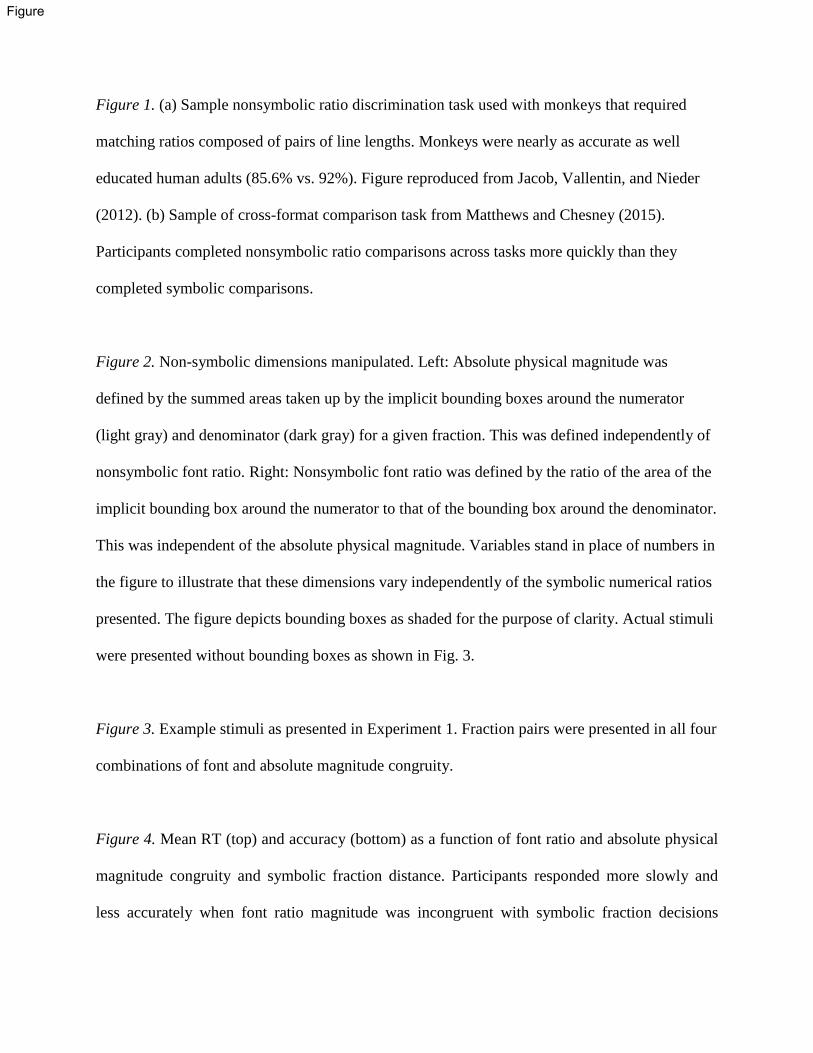
Figure 1. (a) Sample nonsymbolic ratio discrimination task used with monkeys that required
matching ratios composed of pairs of line lengths. Monkeys were nearly as accurate as well
educated human adults (85.6% vs. 92%). Figure reproduced from Jacob, Vallentin, and Nieder
(2012). (b) Sample of cross-format comparison task from Matthews and Chesney (2015).
Participants completed nonsymbolic ratio comparisons across tasks more quickly than they
completed symbolic comparisons.
Figure 2. Non-symbolic dimensions manipulated. Left: Absolute physical magnitude was
defined by the summed areas taken up by the implicit bounding boxes around the numerator
(light gray) and denominator (dark gray) for a given fraction. This was defined independently of
nonsymbolic font ratio. Right: Nonsymbolic font ratio was defined by the ratio of the area of the
implicit bounding box around the numerator to that of the bounding box around the denominator.
This was independent of the absolute physical magnitude. Variables stand in place of numbers in
the figure to illustrate that these dimensions vary independently of the symbolic numerical ratios
presented. The figure depicts bounding boxes as shaded for the purpose of clarity. Actual stimuli
were presented without bounding boxes as shown in Fig. 3.
Figure 3. Example stimuli as presented in Experiment 1. Fraction pairs were presented in all four
combinations of font and absolute magnitude congruity.
Figure 4. Mean RT (top) and accuracy (bottom) as a function of font ratio and absolute physical
magnitude congruity and symbolic fraction distance. Participants responded more slowly and
less accurately when font ratio magnitude was incongruent with symbolic fraction decisions
Figure
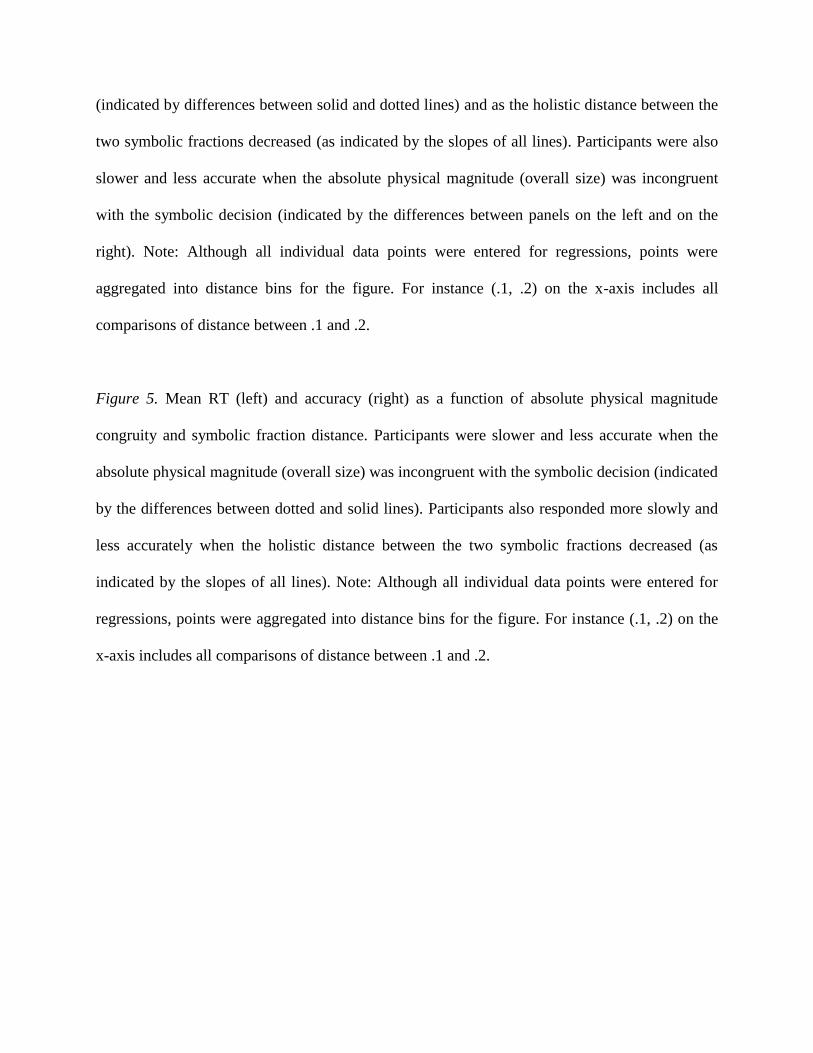
(indicated by differences between solid and dotted lines) and as the holistic distance between the
two symbolic fractions decreased (as indicated by the slopes of all lines). Participants were also
slower and less accurate when the absolute physical magnitude (overall size) was incongruent
with the symbolic decision (indicated by the differences between panels on the left and on the
right). Note: Although all individual data points were entered for regressions, points were
aggregated into distance bins for the figure. For instance (.1, .2) on the x-axis includes all
comparisons of distance between .1 and .2.
Figure 5. Mean RT (left) and accuracy (right) as a function of absolute physical magnitude
congruity and symbolic fraction distance. Participants were slower and less accurate when the
absolute physical magnitude (overall size) was incongruent with the symbolic decision (indicated
by the differences between dotted and solid lines). Participants also responded more slowly and
less accurately when the holistic distance between the two symbolic fractions decreased (as
indicated by the slopes of all lines). Note: Although all individual data points were entered for
regressions, points were aggregated into distance bins for the figure. For instance (.1, .2) on the
x-axis includes all comparisons of distance between .1 and .2.
500 ms
a) b)
Fig_1
1300
1500
1700
1900
2100
0.1 0.2 0.3 0.4 0.5
Congruent
Incongruent
1300
1500
1700
1900
2100
0.1 0.2 0.3 0.4 0.5
0.75
0.8
0.85
0.9
0.95
1
0.1 0.2 0.3 0.4 0.5
Congruent
Incongruent
0.75
0.8
0.85
0.9
0.95
1
0.1 0.2 0.3 0.4 0.5
Distance Bin
Distance Bin
Rea
cti
on
Tim
e (
ms
)A
cc
ura
cy (
pro
p c
orr
ec
t)
(.1, .2) (.2, .3) (.3, .4) (.4, .5) (.1, .2) (.2, .3) (.3, .4) (.4, .5)
(.1, .2) (.2, .3) (.3, .4) (.4, .5) (.1, .2) (.2, .3) (.3, .4) (.4, .5)
Font Ratio
Font Ratio
Absolute Physical Magnitude Congruent Absolute Physical Magnitude Incongruent
Absolute Physical Magnitude Congruent Absolute Physical Magnitude Incongruent
Fig_4
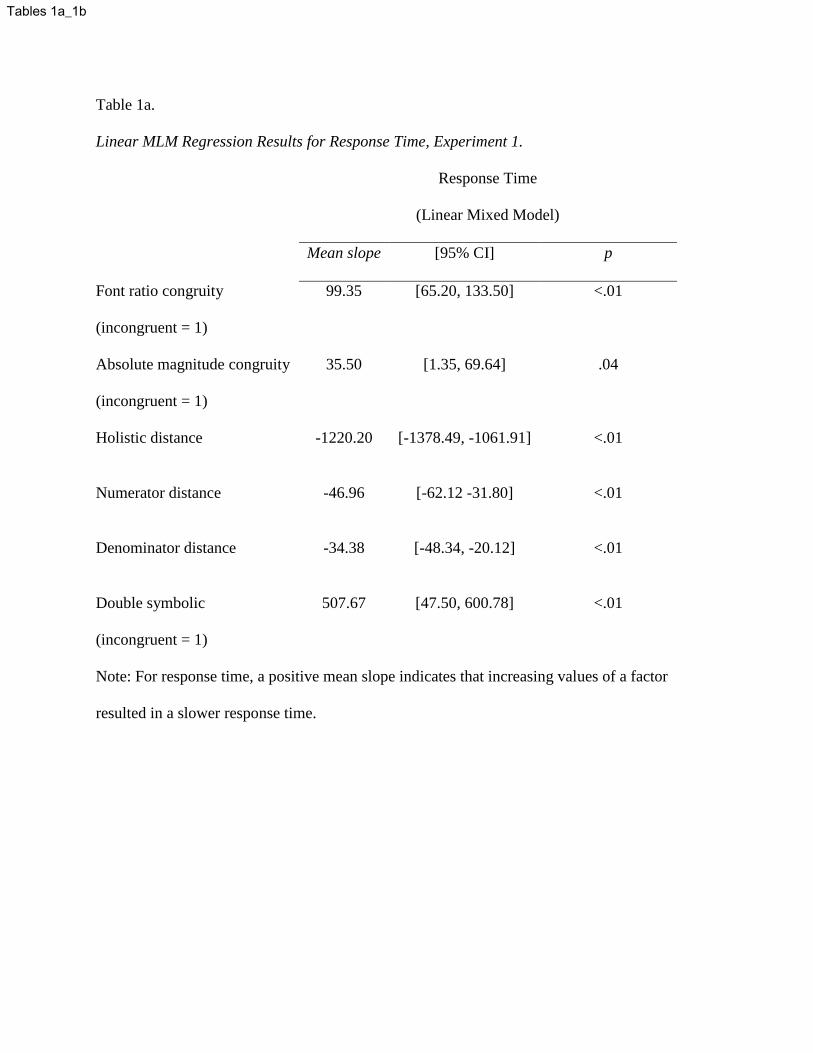
Table 1a.
Linear MLM Regression Results for Response Time, Experiment 1.
Response Time
(Linear Mixed Model)
Mean slope [95% CI] p
Font ratio congruity
(incongruent = 1)
99.35 [65.20, 133.50] <.01
Absolute magnitude congruity
(incongruent = 1)
35.50 [1.35, 69.64] .04
Holistic distance -1220.20 [-1378.49, -1061.91] <.01
Numerator distance -46.96 [-62.12 -31.80] <.01
Denominator distance -34.38 [-48.34, -20.12] <.01
Double symbolic
(incongruent = 1)
507.67 [47.50, 600.78] <.01
Note: For response time, a positive mean slope indicates that increasing values of a factor
resulted in a slower response time.
Tables 1a_1b
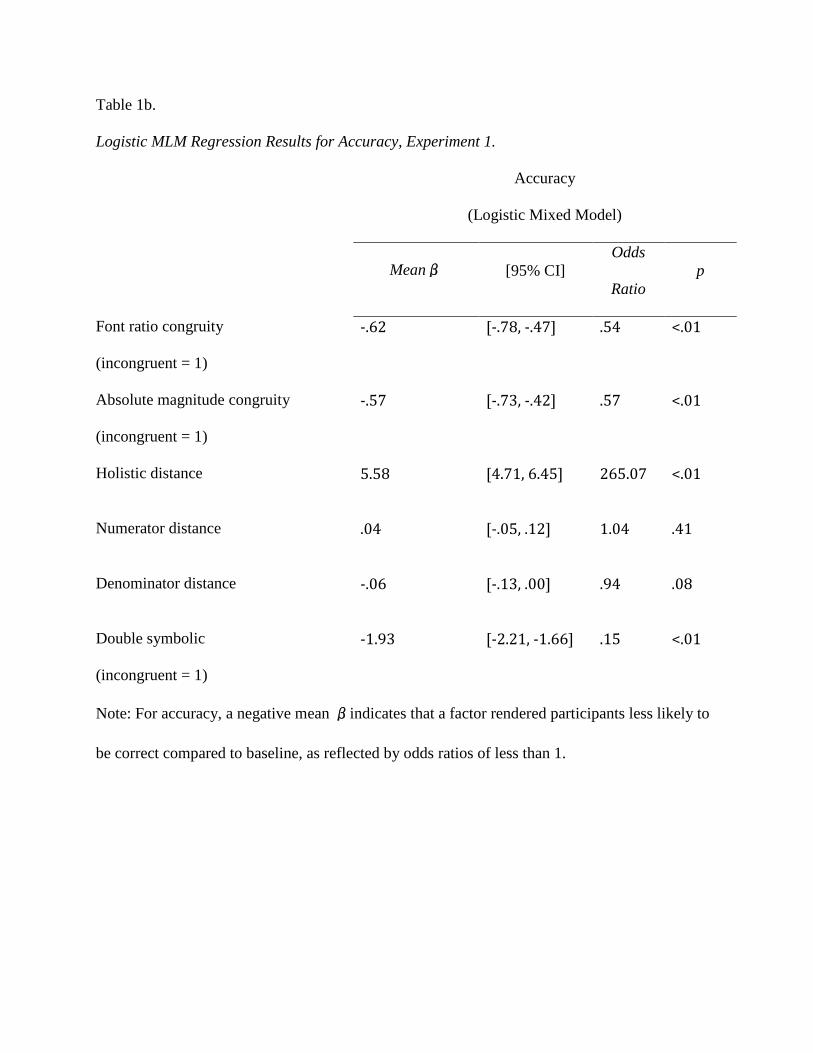
Table 1b.
Logistic MLM Regression Results for Accuracy, Experiment 1.
Accuracy
(Logistic Mixed Model)
Meanβ [95% CI]
Odds
Ratio
p
Font ratio congruity
(incongruent = 1)
-.62 [-.78, -.47] .54 <.01
Absolute magnitude congruity
(incongruent = 1)
-.57 [-.73, -.42] .57 <.01
Holistic distance 5.58 [4.71, 6.45] 265.07 <.01
Numerator distance .04 [-.05, .12] 1.04 .41
Denominator distance -.06 [-.13, .00] .94 .08
Double symbolic
(incongruent = 1)
-1.93 [-2.21, -1.66] .15 <.01
Note: For accuracy, a negative mean βindicates that a factor rendered participants less likely to
be correct compared to baseline, as reflected by odds ratios of less than 1.
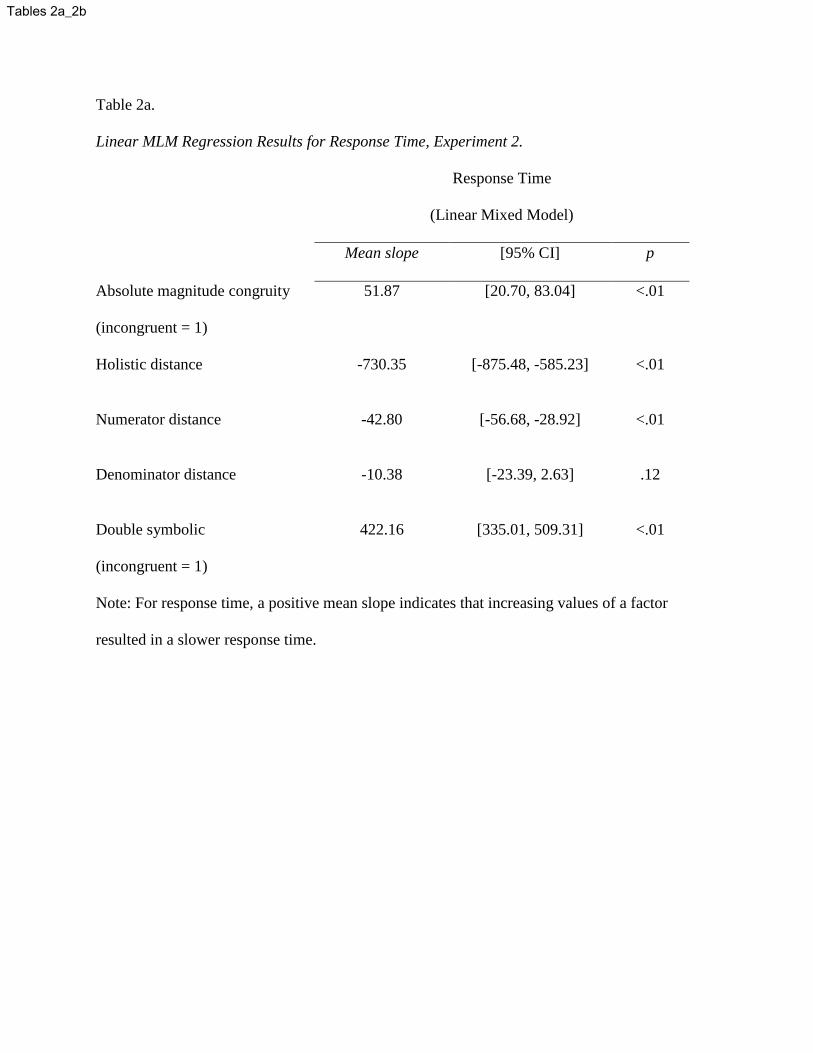
Table 2a.
Linear MLM Regression Results for Response Time, Experiment 2.
Response Time
(Linear Mixed Model)
Mean slope [95% CI] p
Absolute magnitude congruity
(incongruent = 1)
51.87 [20.70, 83.04] <.01
Holistic distance -730.35 [-875.48, -585.23] <.01
Numerator distance -42.80 [-56.68, -28.92] <.01
Denominator distance -10.38 [-23.39, 2.63] .12
Double symbolic
(incongruent = 1)
422.16 [335.01, 509.31] <.01
Note: For response time, a positive mean slope indicates that increasing values of a factor
resulted in a slower response time.
Tables 2a_2b
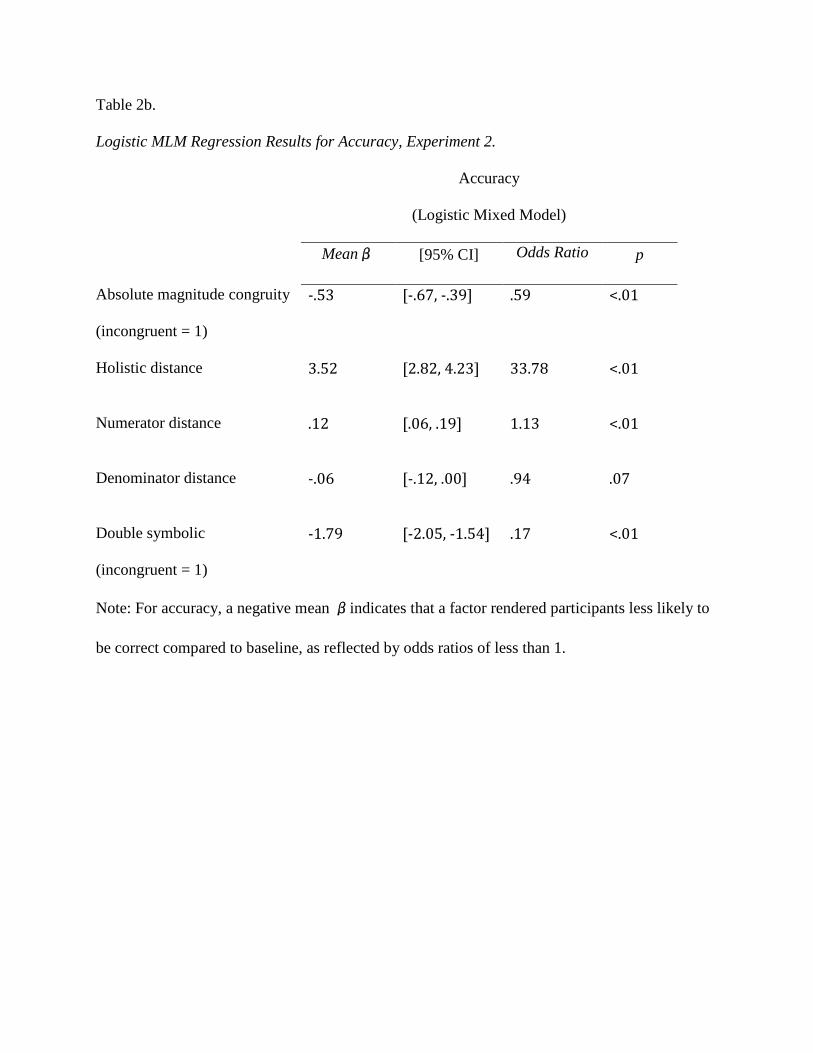
Table 2b.
Logistic MLM Regression Results for Accuracy, Experiment 2.
Accuracy
(Logistic Mixed Model)
Meanβ [95% CI] Odds Ratio p
Absolute magnitude congruity
(incongruent = 1)
-.53 [-.67, -.39] .59 <.01
Holistic distance 3.52 [2.82, 4.23] 33.78 <.01
Numerator distance .12 [.06, .19] 1.13 <.01
Denominator distance -.06 [-.12, .00] .94 .07
Double symbolic
(incongruent = 1)
-1.79 [-2.05, -1.54] .17 <.01
Note: For accuracy, a negative mean βindicates that a factor rendered participants less likely to
be correct compared to baseline, as reflected by odds ratios of less than 1.
Absolute Physical Magnitude Nonsymbolic Font Ratio
Ratio R1
(Large)
Area X1 = 46 * 64 = 2944Area Y1 = 70 * 98 = 6860
Absolute Magnitude R1
Area X1 + Area Y1 = 9804
Area X2 = 41 * 57= 2337Area Y2 44 * 62 = 2728
Absolute Magnitude R2
Area X2 + Area Y2 = 5065
Ratio R2
(Small)
46 x 64
70 x 98
X2
y2
41 x 57
44 x 62
Dimensions
Ratio R2
(Large)Ratio R1
(Small)
X2
y2
41 x 57
44 x 62
X1
y1
46 x 64
70 x 98
Area X2 = 41 * 57= 2337Area Y2 44 * 62 = 2728
Font Ratio R1
Area X1 ÷ Area Y1 = .86
Area X1 = 46 * 64 = 2944Area Y1 = 70 * 98 = 6860
Font Ratio R2
Area X2 ÷ Area Y2 = .43
Absolute Magnitude R1 : Absolute Magnitude R2 – 9804/5065 ≈ 2:1
Font Ratio R2 : Font Ratio R1 – .86:.43 = 2:1
X1
y1
Fig_2
Font Ratio MagnitudeA
bso
lute
Ph
ysic
al M
agn
itu
de
Incongruent Congruent
Incongruent
Congruent
Figure
Rea
cti
on
Tim
e (
ms
)
Ac
cu
rac
y (
pro
p c
orr
ec
t)
1200
1400
1600
1800
0 0.1 0.2 0.3 0.4
Congruent
Incongruent
0.75
0.8
0.85
0.9
0.95
1
0 0.2 0.4
Distance Bin
(.1, .2) (.2, .3) (.3, .4) (.4, .5) (.1, .2) (.2, .3) (.3, .4) (.4, .5)
Figure


