

AN ABSTRACT OF THE THESIS OF
Keith R. Forr for the degree of Master of Science in
Forest Science presented on March 16, 1992.
Title: The Starch Content of Roots and the Osmotic Concen-
tration of Expressed Xylem Sap as Predictors of Doucilas-Fir
Seedling Ouality
Abstract approved:Joe B. Zaerr
The goal of this study was to evaluate the ability of
two seedling quality evaluation methods to predict the field
survival of Douglas-fir (Pseudotsuga menziesii) seedlings.
The starch reserves in seedlings have been suggested as a
possible predictor of seedling quality. Starch reserves
have been shown to decrease during cold storage, but there
has been no concentrated evaluation of their relationship to
seedling quality and field survival. This study has
investigated the correlation between starch reserves in
Douglas-fir seedling roots (and needles) and subsequent
field survival. It has also evaluated the ability of
measurements of the osmotic concentration of expressed xylem
sap to detect seedling damage and predict field survival.
Results show that neither the starch content of roots
nor the osmotic concentration of xylem sap is a reliable
predictor of Douglas-fir seedling quality. The study also
suggested that the starch content of Douglas-fir needles has
no significant relationship to seedling quality.

Starch content of roots increased considerably
throughout the winter in seedlings growing in nursery beds.
Seedlings lifted and cold stored showed large reductions in
root starch reserves due to respiration, but did not
necessarily exhibit reduced survival potential in the field.
Even some seedlings with very low root starch reserves were
able to survive on the field site. Any relationship between
starch reserves and overall seedling quality is weak at
best.
The osmotic concentration of xylem sap also failed to
exhibit a significant correlation with field survival. The
test was unable to reliably detect seedling damage,
especially damage resulting from cold storage or root
desiccation. The study demonstrated that severe freezing
damage often results in significantly elevated solute
concentrations in expressed xylem sap, apparently due to
leakage of cell solutes through ruptured cell membranes.
However, osmotic concentration of xylem sap below the level
associated with severe freezing damage does not necessarily
indicate that the seedlings are healthy. The method may be
a quick and easy way to detect seedlings damaged by
freezing.
The "standard" root growth potential and stress (OSU
vigor) tests are still the most reliable techniques to
estimate Douglas-fir seedling quality. The best single
predictor of field survival in this study was the mean total
length of new roots after one month, which accounted for 51
percent of the variability in field survival.

THE STARCH CONTENT OF ROOTSAND THE OSMOTIC CONCENTRATION OF EXPRESSED XYLEM SAP
AS PREDICTORS OF DOUGLAS-FIR SEEDLING QUALITY
by
Keith R. Forry
A THESIS
submitted to
Oregon State University
in partial fulfillment ofthe requirements for the
degree of
Master of Science
Completed March 16, 1992
Comnmnenceinent June, 1993
APPROVED:
Professor of Tree Physiology in charge of major
Head of department of Forest Science
Dean of Graduate School
Date thesis is presented March 16, 1992
Typed by Kim Hammer and Joan Morris for Keith R. Forry

ACKNOWLEDGEMENTS
Many people helped me realize this moment, and I know
that I will leave someone out. It has taken over 7 years,
but I've finally completed my thesis. Special thanks to my
family--Lela, Bev, Vicki, Till, Shell, and Kevin--for their
constant support and encouragement. The scholastic
achievements of my sisters paved the way to this degree.
The patience and assistance of my graduate committee
(Joe Zaerr, my major professor; Everett Hansen; Robin Rose;
and John Sessions) deserve special acknowledgement,
especially Joe, who provided constant encouragement and
support throughout my extended tenure as a grad student.
Thanks also to Logan Norris, my department head, for his
prodding and support during the last 4 years; to Tom Popham,
Bud Graham, and everyone else at the Department of Forest
Science for their assistance and advice; and to my fellow
graduate students for the friendship and intellectual
stimulation during my years at OSU. Special thanks to Bob,
the cougar man; Valerie, my research partner; and Doug, who
showed me the way.
Financial assistance from the Forestry Intensified
Research program made this all possible. Kim and Joan made
it reality. Thanks also to ECI for helping it all come
together, finally.
This thesis is dedicated in memory of Raymond S. Forry,
my father.

TABLE OF CONTENTS
INTRODUCTION 1
LITERATURE REVIEW 7
GENERAL EXPERIMENTAL METHODS AND STANDARD QUALITYASSESSMENT TESTS 22
Seedling Source and Lifting 22
Quality-Reducing Treatments 24Freezing Treatments 25Root Desiccation 25Root Submersion 26Cold Storage 26
Quality Assessment Tests 26Growth Chamber Performance 27OSU Vigor Test 27
Root Growth Potential 28
Field Performance 28
Statistical Analysis 29
Results and Discussion 30
STARCH ANALYSIS 44
Materials and Methods 45
Results and Discussion 47
OSMOTIC CONCENTRATION OF EXPRESSED XYLEM SAP 53
Materials and Methods 53
Results and Discussion 54
DISCUSSION AND suiii 60
BIBLIOGRAPHY 64
APPENDICES 78
Starch Analysis of Conifer Tissues 78Purification of Amyloglucosidase 84Purification of a-Amylase 89Amyloglucosidase Assay 94a-Amylase Assay 97Preparation of DEAE-Cellulose 101Preparation of Dialysis Tubing 104

LIST OF FIGURES
Figure Paqe
Flow Chart of Seedling Processing Procedures 23
Starch Reserve Loss in Seedling Roots DuringCold Storage 49
Root Starch Reserves Increase Throughout Winterin Douglas-Fir Seedlings in the Nursery Bed 51
Root Starch Content and Field Survival 52
Elevated Xylem Sap Osmolarity As AssociatedWith Poor Field Survival 59

LIST OF TABLES
Table Page
Experimental Results From the Field Site 31
Experimental Results From the Growth Chamber 34
Root Growth Potential Results 38
OSU Vigor Test Results 42
Starch Concentration in Seedling Tissues 48
Osmotic Concentration of Expressed Xylem Sap 55
THE STARCH CONTENT OF ROOTS
AND THE OSMOTIC CONCENTRATION OF EXPRESSED XYLEM SAP
AS PREDICTORS OF DOUGLAS-FIR SEEDLING QUALITY
INTRODUCTION
Reforestation of harvested land is an essential com-
ponent of the forest products industry in the Pacific North-
west. As additional acreage is set aside for preservation
as wilderness, recreation areas, and protection of endan-
gered species and sensitive sites, it becomes increasingly
important to reestablish productive stands on commercial
forest sites.
There are numerous factors that affect the success of
reforestation efforts, among them are site preparation,
planting practices, protection from animal damage, and con-
trol of competing vegetation. One especially important
factor is the quality of seedlings used in the reforestation
effort. If seedlings used for reforestation have been mis-
treated or damaged prior to planting, the regeneration
effort will likely fail, regardless of investments made in
other aspects of the reforestation process. The failure of
a single plantation can cost thousands of dollars for pur-
chase of additional seedlings, planting costs, vegetation
management, and delayed revenues.
Knowledge of the physiological processes of coniferous
seedlings has advanced tremendously during the past few
decades. This has enabled nurseries to design culturing
practices that ensure the production of vigorous, healthy
seedlings for outplanting on reforestation sites. Conse-
quently, most coniferous seedlings produced today are of
high quality and are readily established on the outplanting
site.

2
Unfortunately, uncontrollable conditions continue to
injure and degrade seedlings. Frost early in the season can
damage seedlings that have not hardened sufficiently to
withstand freezing temperatures. Similarly, failure of cold
storage facilities could subject seedlings to excessively
low or high temperatures, which adversely affect seedling
quality.
Human error can also result in degradation of seedling
quality. For example, parking a truck in the sun when
hauling bareroot seedlings can result in boxes of seedlings
being exposed to excessively high temperatures.
Irreversible tissue damage can also result when bareroot
seedlings are accidentally left exposed and their roots dry
out.
In some instances, seedling damage can be easily
detected by visual inspection. Roots torn during the lift-
ing process can be easily identified, and affected seedlings
can be culled by nursery personnel. Seedlings whose stems
have been girdled by insects or pathogens can also be easily
identified and discarded. However, in many cases it is not
possible to detect seedling damage through visual inspec-
tion. Damage from freezing or root desiccation often pro-
duces no visible symptoms until months after the seedlings
have been outplanted.
A reliable, rapid method of evaluating seedling quality
would greatly assist foresters and landowners in ensuring
that only vigorous, healthy seedlings are planted. If low
quality seedlings are planted and the plantation fails,
initial expenditures will be for naught, and the reforesta-
tion process will have to begin again.
A simple, rapid test that could reliably estimate the
physiological status of coniferous planting stock would
3
enable reforestation personnel to match seedlings' field
performance potential with their various planting sites. It
could also assist nursery managers with the refinement of
cultural practices to ensure the production of the highest
quality seedlings possible.
Numerous attempts have been made to develop tests to
evaluate seedling quality. Initially, the efforts centered
on the morphological characteristics of seedlings, generally
based on the assumption that a bigger seedling was a better
seedling. After studying the performance of morphological
grades of southern pines on plantations throughout the
south, Wakely (1948) realized that seedling morphological
characteristics were often poorly correlated with field
performance, and he introduced the concept of physiological
grades for seedlings. Since that time numerous attempts
have been made to develop tests that identify the physio-
logical status of coniferous seedlings.
One of the earliest methods developed to evaluate
seedling physiological status, and probably the most widely
used procedure, is the root growth capacity or root growth
potential (RGP) technique, first reported by Stone in 1955.
This technique evaluates the ability of a seedling to
generate new roots when planted in an optimum environment.
Numerous studies have shown that the ability of a seedling
to grow new roots when planted in an environment favorable
to root growth is a good general indicator of the seedling's
physiological status, but it often correlates poorly with
field performance (Binder et al. 1988, Landis and Skakel
1988, Ritchie and Tanaka 1990).
Another approach to characterizing the overall physio-
logical status of seedlings was developed at Oregon State
University (OSU). The OSU vigor test characterizes seedling

4
quality on the basis of bud burst and survival of potted
seedlings placed in a growth-stimulating environment (Herman
and Lavender 1979, McCreary and Duryea 1985). This method
also measures the ability of seedlings to survive the
stresses associated with operational planting, by exposing
roots to desiccating conditions before potting and placing
in growth-stimulating conditions.
Other seedling quality evaluation procedures have been
designed to measure a specific physiological attribute,
rather than identify a seedling's overall physiological
status. Examples include plant water potential (Joly 1985),
frost hardiness (Tiinmis 1976), dormancy status (Ritchie
1984), and nutrient content of foliage (Landis 1985).
Still other methods have concentrated on measuring the
concentration of important biochemical compounds in seedling
tissues. Considerable research has been performed on the
relationship between seedling quality and carbohydrate
reserves (Marshall 1985). Plant growth regulators (PGR's)
have also been investigated as possible indicators of
seedling quality (Zaerr 1985), but the lack of understanding
of the role of PGR's in seedling physiology has hampered
investigations of the relationship between PGR levels and
seedling quality.
Despite the extensive research efforts to develop meth-
ods of assessing seedling quality, there is still no simple
technique to reliably predict the survival of outplanted
seedlings. The currently available procedures all have
shortcomings. Some require expensive, specialized equipment
and highly trained technicians to perform the testing. Oth-
ers take too long to yield reliable assessments to be useful
as routine evaluations of seedling quality. Many fail to
consistently correlate well with field performance.

5
An ideal test of seedling quality would have the fol-
lowing characteristics (Zaerr 1985):
- Yield results rapidly.
- Be simple to perform and understand.
- Be cheap and readily accessible to all potential
users.
- Reliably assess seedling quality every time.
- Test seedlings nondestructively so that test subjects
could be outplanted.
- Quantitatively assess seedling quality, permitting
probability values to be assigned to results.
- Be fully diagnostic and able to identify any seedling
damage.
It is unlikely that any single procedure could meet all
of these criteria. The goal of the research presented in
this thesis was to evaluate the usefulness of two seedling
quality tests in predicting survival of outplanted Douglas-
fir (Pseudotsuga menziesii) seedlings. Specifically, the
research objectives were these:
To compare the starch content of roots and/or
needles at the time of planting with RGP and OSU
vigor test for their ability to assess coastal
Douglas-fir seedling quality, as indicated by
subsequent survival in the field.
To compare the osmotic concentration of xylem sap
at the time of planting with RGP and OSU vigor test
for their ability to assess coastal Douglas-fir
seedling quality, as indicated by subsequent sur-
vival in the field.
This introduction is followed by a literature review on
methods of evaluating seedling quality, with special emphasis
6
on prior studies of starch content and osmotic concentration
of xylem sap as they relate to seedling quality.
The third chapter describes the treatments used to cre-
ate a range of quality in the seedlings and the quality
assessment methods used for comparison (RGP and OSU vigor
test). The results from these tests are correlated with
seedling survival on the outplanting site.
The fourth chapter briefly presents the materials and
methods used to determine the starch content of seedling
tissue samples. (Starch analysis methods are described in
detail in the appendices.) Results from the starch analyses
are presented in detail, including correlations with field
survival.
The fifth chapter describes the procedures used to
measure the osmotic concentration of xylem sap and presents
the results of these analyses. It concludes with a discus-
sion of the ability of this test to assess seedling quality
and presents correlations with field survival.
The results of all of the research and analyses are
summarized in the final chapter. An evaluation of the
ability of starch concentration and osmotic concentration of
xylem sap to assess seedling quality is presented.
LITERATURE REVIEW
Reforestation personnel have recognized for many years
that some seedling lots exhibit higher growth and survival
rates when outplanted than other lots of seedlings. This
variability in seedling performance has often been
attributed to the condition, or quality, of the seedlings at
the time of planting. However, there has been considerable
debate over the characteristics that a "high quality"
seedling should have.
Since the purpose of planting stock is to become
successfully established and grow rapidly in a forest
plantation, then seedling quality must be defined in terms
of a seedling's survival and growth potential on its
designated planting site (Ritchie 1984).
Initial attempts to characterize seedling quality were
generally based on seedling size, assuming that a bigger
seedling is a better seedling. Occasionally, other factors,
such as root form, root-shoot ratio, appearance of winter
buds, and presence of secondary needles, were also
considered (McCreary 1986). Early studies on "seedling
quality" reinforced the belief that bigger seedlings exhibit
better field performance.
In an early experiment, Paton (1929) investigated the
relationship between seedling size and subsequent growth and
survival in the field. After studying seedlings from five
coniferous species, he concluded that the smallest seedlings
in nursery seed beds were small because of an inherent lack
of vigor, and that small trees are weaklings and less desir-
able than larger ones.
7
Several subsequent studies provided additional evidence
to support the assumption that bigger seedlings are better

seedlings, but results were often inconsistent. Chapman
(1948) compared field survival and height growth of various
sizes, or grades, of 1-0 shortleaf pine (Pinus echinata) and
found close correlation between stem caliper and field
performance. However, Chapman (1948) also reported that the
shortest seedlings had the greatest survival and height
growth in some plots. Pomeroy et al. (1949) reported that
although larger grades of jack pine (Pinus banksiana)
seedlings exhibited better survival and early height growth
than smaller seedlings, there was no difference in size
after 13 years.
Results such as these lead Wakely to question the
validity of using morphological characteristics as a basis
for grading forest-tree seedlings. After investigating the
performance of southern pine plantations established in the
1920's, 30's, and 40's, Wakely (1949) concluded that inorpho-
logical grades were not consistently dependable guides to
seedling quality. He found that smaller trees sometimes
outperformed larger trees, and that seedlings of the same
morphological grade, but raised in different nurseries,
showed markedly different survival rates when planted on the
same site. Based on these observations, Wakely suggested
that "a seedling's ability to resist excessive water loss,
to take in water, and to extend its root system promptly,
might depend far less on its size and form than on its
internal chemical or physiological condition--that is, on
its physiological grade."
Following up on his initial observations, Wakely (1954)
conducted a 2-year study of seedling morphological grades
and "showed conclusively that the physiological qualities of
seedlings can overbalance the effects of their morphological
grades on survival and growth." However, Wakely did not
imply that morphology has no influence on subsequent field
performance. This is certainly not the case, as many

9
studies have shown that initial seedling size can greatly
affect field survival and growth (Thompson 1985). Wakely,
however, was one of the first to recognize that internal
physiological characteristics of seedlings can be more
important to field performance than seedling morphology.
A study in the Lake States demonstrated that when 2-0
red pine (Pinus resinosa) seedlings were graded into small,
medium, and large classes on the basis of stem caliper, the
large stock had much better survival than smaller classes
after 10 years (Stoeckeler and Limstrom 1950). Based on
superior performance of larger seedlings of ponderosa (Pinus
ponderosa) and jeffrey pine (Pinus jeffreyi), Fowells (1953)
concluded that, in the absence of a better grading system,
discarding smaller trees will result in better field
survival and increased plantation growth. Although Zaerr
and Lavender (1976) reported better survival of Douglas-fir
seedlings weighing more than 4 grams than for seedlings
weighing less than 4 grams, they also found that the
heaviest classes of seedlings exhibited lower survival rates
than medium-sized seedlings.
Initial attempts to develop a method of measuring the
physiological status of seedlings concentrated on a seed-
ling's ability to generate new roots. Stone (1955) studied
the production of new roots on seedlings from five conifer-
ous species and found that although the seedlings all exhib-
ited similar morphological characteristics, production of
new roots differed dramatically. Indeed, he found that
nearly all seedlings that failed to generate new roots dur-
ing their initial 60 days in pots died during a subsequent
120-day growth period.
Subsequently, Stone and co-workers at the University of
California at Berkely conducted numerous experiments to fur-
ther characterize the relationship between a seedling's

10
ability to generate new roots and its outplanting perfor-
Inance. They concluded that the root regenerating potential
(RRP) or the root growth potential (RGP) of a seedling is
critical to its success in the field (Stone and Schubert
1959a, Stone and Schubert 1959b, Stone et al. 1961, Stone
and Benseler 1962). They defined both RRP and RGP as the
ability of a seedling to initiate and/or elongate roots when
placed in an environment favorable to root growth. RGP was
characterized numerically as the number of new roots pro-
duced by a seedling during one month in a greenhouse where
soil was maintained at 20C (Stone et al. 1963).
Additional studies also identified a number of factors
that influenced a seedling's ability to generate new roots.
RGP was shown to vary with date of lifting, and a definite
periodicity in RGP was identified for several coniferous
species (Stone and Schubert 1959c, Stone and Schubert l959e,
Stone et al. 1962, Stone et al. 1963, Krugman et al. 1965,
Stone and Jenkinson 1970, Burr et al. 1989). Additional
factors found to affect RGP include the length of cold
storage (Stone and Schubert l959d, Stone and Jenkinson 1971,
Omi et al. 1991), the nursery where seedlings were produced
(Stone et al. 1963), fumigation of nursery seed beds
(Krugxnan et al. 1965), temperature (Krugman and Stone 1966,
Binder et al. 1990), and soil moisture (Stone and Jenkinson
1970).
Many other researchers have investigated RGP and its
relationship to environmental conditions, physiological
properties, and nursery cultural practices during the last
two decades. The relationship between carbohydrate reserves
and RGP were examined by van den Driessche (1978) and
Ritchie (1982), but neither could identify a significant
correlation. Zaerr (1967) found that there was little cor-
relation between RGP and auxin concentration in shoots. Day
and MacGillivray (1975) confirmed that low soil moisture

11
content had a detrimental effect on the RGP of white spruce
(Picea glauca) seedlings. Repeated nursery root wrenching
was shown to increase RGP for Caribbean pine (Pinus caribaea)
(Bacon and Bachelard 1978) and Monterey pine (Pinus radiata)
(Rook 1969). Nambiar et al. (1979) demonstrated that low
soil temperature adversely affects the initiation and elon-
gation of new Monterey pine roots.
There has also been considerable effort to demonstrate
a positive correlation between RGP and field survival.
Stone and colleagues found that seedlings with high RGP
exhibited the best survival when outplanted (Stone 1955,
Stone and Schubert l959a, Stone and Schubert 1959d, Stone et
al. 1961). Similar results have been reported by other
researchers (Jenkinson and Nelson 1978, Jenkirison 1980,
Sutton 1980, Jenkinson and Nelson 1985, Feret and Kreh 1985,
McCreary and Duryea 1987), but the relationship between RGP
and field survival rates is not always clear (Dunsworth
1986). Ritchie and Dunlap (1980), in a review of the liter-
ature, stated that "while it has been difficult to establish
a clear cause-effect relationship between RGP and seedling
survival after planting, a compelling body of evidence indi-
cates that the two are often very closely correlated."
The research on the correlation between RGP and field
survival has also lead to the development of the concept of
"lifting windows" for coniferous seedlings. By studying the
effects of various lifting dates and cold storage on RGP and
subsequent survival, researchers have identified periods of
time during the year (lifting windows) when seedlings can be
lifted, stored, and outplanted with little degradation in
quality. Extensive research of this phenomenon has shown
that lifting windows vary not only for different species,
but also by seed source (Jenkinson and Nelson 1978, Jenkin-
son 1980) and location of nursery (Hermann et al. 1972,
Jenkinson 1984).
12
Although there has been extensive research on the rela-
tionship between RGP and field survival, there is little
data that clearly demonstrate that poor survival is closely
correlated with low RGP, except for poor survival due to
untimely lifting and cold storage. Feret et al. (1985)
demonstrated, however, that both RGP and field survival of
loblolly pine (Pinus taeda) seedlings are affected by
varying the temperature and duration of cold storage.
McCreary and Duryea (1987) reported that field survival of
seedlings subjected to damage from freezing, hot storage,
root desiccation, and root submersion in hot water was
closely correlated with RGP.
Little research has been done on the relationship
between RGP and seedling growth in the field. Significant
correlations between height growth and RGP have been
reported for both jack pine and white spruce, but the
tremendous variability in RGP measurements tended to obscure
the relationship (Sutton 1980). The relationship between
RGP and first-year height growth has been reported to be
curvilinear for both loblolly pine (Feret et al. 1985) and
lodgepole pine (Pinus contorta) (Burdett et al. 1983).
Significant correlations between RGP and both first- and
second-year height growth have been reported for loblolly
pine (Feret and Kreh 1985) and Douglas-fir (McCreary and
Duryea 1987).
Although RGP is clearly a good indicator of seedling
quality, it is only a fair predictor of outplanting survival
(Binder et al. 1988, Landis and Skakel 1988, Ritchie and
Tanaka 1990). RGP is a point-in-time assessment of seedling
quality, providing an indication of high stress resistance
or seedling damage. RGP is hypothesized to reflect overall
seedling quality due to its relationship with cold hardiness
and bud dormancy (Ritchie 1985, Tinus et al. 1986, Burdett
1987, Burr et al. 1989, Ritchie and Tanaka 1990). However,

13
like other quality assessment tests, RGP does not factor in
planting or site quality, which significantly impact
outplanting success.
The use of RGP as a predictor of seedling quality is
widespread, but there are many problems with this method.
The technique lacks accuracy, precision, and repeatability
(Binder et al. 1988, Ritchie and Tanaka 1990). RGP test
conditions have a tremendous impact on the production of new
roots, and optimum conditions vary with the species tested
(Binder et al. 1990). Within-test root production is highly
variable, and mean RGP values are often poorly correlated
with outplanting survival and growth.
Another drawback of RGP is the length of time required
to complete the test. Most studies of RGP have used
evaluation intervals of 21 to 30 days--an unacceptable
delay for most operational decisions regarding whether or
not to discard a batch of possibly damaged seedlings.
Hydroponic and aeroponic methods of estimating RGP have been
developed that yield results in as little as 7 days for some
species (Burdett 1979, Rietveld and Tinus 1990).
Even if useful RGP assessments can be made after a
reasonably short time period, the technique is tedious and
time consuming. The best predictor of field performance has
been shown to be the average number of new roots per seed-
ling (McCreary and Duryea 1987), a measurement that can take
over an hour for vigorous, healthy seedlings. Recent
research has concentrated on less time-consuming methods of
estimating RGP, such as semiquantitatively scaling seedlings
on the approximate number of new roots (Burdett 1979, Dolata
1986), measuring root volume (Burdett 1979), and measuring
root area index (Rietveld 1986, Rietveld and Tinus 1990).
Although some of these alternative methods appear promising,

14
the most rapid RGP assessment techniques require expensive,
specialized equipment.
Another method to evaluate seedling quality is the OSU
vigor test, developed at Oregon State University over the
last 25 years. This procedure monitors bud burst and
survival of seedlings potted and maintained in a growth-
stimulating environment. Half of the test seedlings are
first placed in a "hot, dry" room [32c., 30 percent relative
humidity (R.H..)), for 15 minutes before potting. The method
was designed to simulate seedling stress associated with
lifting, planting, and initial establishment in the field.
It is theorized that drying seedling roots prior to potting
causes weak, low-quality seedlings (which would likely die
if outplanted) to die or exhibit delayed bud burst in the
growth chamber. A rating system, based on mortality and
time of bud burst, has been developed to predict field per-
formance (McCreary 1986).
The method was first described by Hermann and Lavender
(1979). It has since been evaluated by several researchers,
primarily at OSU, with mixed results. A positive correla-
tion between growth room survival of stressed seedlings and
field survival was reported by Lavender et al. (1980), but
the correlation was weak. McCreary and Duryea (1985)
reported positive correlations between field survival and
survival of both stressed and unstressed seedlings in the
growth room. The method was also used operationally for
several years and exhibited significant correlations between
field survival and growth room survival of both stressed and
control seedlings of several species (McCreary 1986). In
contrast, Omi et al. (1986) reported poor relationships
between field survival and OSU vigor test ratings for
Douglas-fir. McCreary and Duryea (1987) reported that
growth room survival of both stressed and unstressed
seedlings was highly correlated with field performance.

15
In an experiment comparing the predictive ability of
three different quality evaluation techniques, McCreary and
Duryea (1987) found that the OSU vigor test had the highest
correlation with both first- and second-year field survival.
Surprisingly, the study also indicated that survival of both
stressed and unstressed seedlings in the growth chamber
predicted field performance equally well. The authors con-
sequently concluded that growth room survival of either
stressed or unstressed seedlings after 6 weeks could be used
to predict field performance, and simply potting seedlings
and monitoring their survival and bud burst in a growth room
would suffice for the vigor evaluation.
The results from McCreary and Duryea (1987) indicate
that field performance can be projected from seedling sur-
vival in a growth-stimulating environment. These results
have been contradicted by other researchers (Lavender et al.
1980, Omi et al. 1986), suggesting that the technique cannot
be relied on to evaluate seedling quality. In addition, the
technique requires the use of expensive growth chambers, and
results are unavailable for 6 to 8 weeks.
Numerous alternative methods for assessing seedling
quality have been investigated during the last two decades.
Most rely on measuring a specific physiological attribute,
rather than characterizing the overall physiological quality
of seedlings. Although these "material attributes" are gen-
erally more easily measured, the results frequently have
rather low predictive value, unless the measurements are
outside of the normal range (Ritchie 1984).
Plant water potential, or plant moisture stress (PMS),
is one material attribute that is routinely measured in
seedling production facilities to assess seedling physiolog-
ical status. Most commonly, measurements of PMS are made
with a pressure chamber, or "pressure bomb" (Ritchie and

16
Hinckley 1975, Cleary and Zaerr 1980). PMS measurements are
used by nursery personnel to properly schedule irrigation
(Zaerr et al. 1981, Cleary et al. 1986) and other culturing
practices, including root wrenching and lifting (Burdett and
Simpson 1984, Edgren 1984). Measurements of PMS are also
used to determine if cold-stored seedlings have adequate
moisture content (Cleary and Zaerr 1980). These uses of PMS
measurements simply help to ensure that seedling quality is
maintained in the nursery and until seedlings are out-
planted, but do not actually assess seedling quality.
PMS measurements have also been proposed as a method of
assessing seedling frost hardiness and general seedling
quality. Bixby and Brown (1974) found an initial decrease
in PMS following the freezing of black locust (Robinia
pseudoacacia). Similar results were also reported for other
species by Timmis (1976). Day and MacGillivray (1975) found
that increased PMS readings were exhibited by white spruce
seedlings with low RGP measurements. Similarly, significant
correlations between RGP and PMS readings have been reported
for several hardwood species following cold storage (Webb
and von Aithen 1980).
In a study of the use of PMS to evaluate seedling qual-
ity, McCreary and Duryea (1987) found a significant corre-
lation between changes in PMS of potted seedlings over an
8-day period and field performance. The authors found that
the higher the percentage of seedlings whose PMS values were
greater than 0.5 megapascals (MPA) or less than 3.0 MPA on
the eighth day after potting, the greater the field survival
and growth. Interestingly, this research identified a
stronger correlation between the PMS evaluation and both
first- and second-year field survival, than between RGP and
field survival. The strongest correlation with field
survival was exhibited by the OSU vigor test. Of the three
techniques evaluated, the PMS evaluation had the weakest
17
correlation with height growth of outplanted seedlings.
Clearly, PNS measurements provide a useful assessment of
seedling quality, but additional research is required to
clarify the relationship between PNS and field performance.
Other methods of evaluating seedling quality have been
developed and tested, some have even been used opera-
tionally. Examples include assessment of frost hardiness
(Tixnmis 1976, Wallner et al. 1982, Glerum 1985, Burr et al.
1986, Burr et al. 1987, Laacke et al. 1987, Burr et al.
1989), bud dormancy (Lavender 1985, Tinus et al. 1987), root
respiration (McCreary and Zaerr 1987), the oscilloscope
technique (Askren and Hermann 1979, Holbo et al. 1981),
infrared thermography (Weatherspoon and Laacke 1985, Laacke
et al. 1987, Orlander et al. 1989), electrical resistance or
Shigometer test (McCollough and Wagner 1987), stress-induced
volatile emissions (Hawkins and Binder 1990), and
chlorophyll fluorescence (Hawkins and Lister 1985, Vidaver
and Binder 1987, Vidaver et al. 1988, Hawkins and Binder
1990). Although some of these tests show potential, none
has been found to be completely satisfactory at this time.
Two techniques for assessing seedling quality that have
shown promise in previous experiments and yield results in a
short time are the starch content of seedlings and the
osmotic concentration of xylem sap. Extensive investiga-
tions of carbohydrate status and its relationship to various
physiological attributes have been performed, but little
research has investigated the correlation between starch
content and seedling quality. In addition, interpretation
of the literature is hampered by the diversity of carbohy-
drate extraction and measurement techniques utilized, which
determines the extent of carbohydrate extraction and the
actual compounds measured.

18
For many years researchers have thought that high
levels of reserve carbohydrates were necessary for ini-
tiation of new root growth (Wakely 1948, Ritchie 1982).
However, it is now apparent that factors other than carbo-
hydrate reserves affect RGP.
Van den Driesschhe (1978) found that RGP in red pine
increased throughout fall to a peak in midwinter, before
decreasing in early spring. In contrast, starch content of
red pine stems and roots was relatively unchanged throughout
this time period. Starch content of needles did increase
throughout fall, but declined to a minimum during midwinter
(when RGP was highest), before increasing again in early
spring. Starch reserves in white spruce exhibited a simi-
lar pattern of change as that found in red pine, but RGP
patterns were quite different. White spruce RGP was very
high in late summer before dropping to a low level, followed
by a gradual increase through the winter months. Van den
Driessche concluded that there was little relationship
between starch reserves and RGP.
In a study of cold-stored Douglas-fir seedlings,
Ritchie (1982) found that total nonstructural carbohydrates
declined gradually throughout the storage period, while RGP
peaked after 6 months of storage before declining with
extended storage. These results do not support a direct
relationship between carbohydrate reserves and RGP.
In the same study, Ritchie (1982) measured the total
nonstructural carbohydrate reserves of Douglas-fir seedlings
lifted at various times. He found that roots and stems
showed a gradual increase of carbohydrate reserves through-
out winter, reaching the highest levels in early spring. In
contrast, total nonstructural carbohydrates in foliage
peaked in late January before declining in February, then
increased again in March. RGP of these seedlings was low in

19
early winter before peaking in January, followed by a grad-
ual decline during late winter and early spring.
Similarly, Rose and Whiles (1985) found no relationship
between the initial starch content of lateral roots and RGP
of loblolly pine seedlings. In this study, nondestructive
sampling techniques were used to gather root samples for
starch analysis, and the same seedlings were used to deter-
mine RGP and then measure starch content again after the RGP
test. Although the authors did find a correlation between
RGP and root starch content after the RGP test, the coeff i-
cient of determination was very low (R2=O.32).
Witherspoon and Lumis (1986) found that little-leaf
linden (Tilia cordata) lifted and planted in the fall exhib-
ited significantly higher RGP than seedlings either lifted
in fall and planted in spring or lifted and planted in
spring. However, the difference in root starch content of
the seedlings was not sufficient to account for the large
difference in RGP. Their research did confirm a loss in
root starch content during cold storage of the fall-lifted
seedlings that were subsequently planted in spring.
Rose (1992) found no relationship between root starch
content of loblolly pine seedlings and RGP. Measurements
taken over a 30-day period showed that RGP was not related
to the percentage of starch initially in the roots, nor was
it related to the starch content of new white lateral roots.
The study did find that seedlings that produced new roots
generally had more starch in all plant components than
seedlings without new roots.
These studies clearly show that there is little or no
relationship between RGP and carbohydrate reserves of seed-
lings. Experiments with shading, girdling, and defoliation
suggest that root growth is dependent not on reserve

20
carbohydrates, but on current photosynthates (Richardson 1958,
Zaerr et al. 1973, van den Driessche 1978, Marshall 1984).
These results do not, however, rule out the possibility that
starch reserves could be an indicator of general seedling
quality, since only two of the studies evaluated field
survival, and in both studies almost all of the seedlings
survived (Ritchie 1982, Witherspoon and Lumis 1986).
It is commonly thought that RGP is related to bud
dormancy and is primarily an indication of a seedling's
readiness to grow (Ritchie and Dunlap 1980, Burr et al.
1989, Ritchie and Tanaka 1990). Carbohydrate status probably
is more a reflection of a seedling's ability to withstand
stress, such as cold storage, when respiratory losses are
not replenished by photosynthesis (Marshall 1985). If this
is the case, then carbohydrate reserves may only be
important for seedling survival when they are forced to draw
heavily on their reserves (Little 1970).
Carbohydrate reserves have been shown to decline during
cold storage of many species, including jeffrey pine and
ponderosa pine (Hellmers 1962, Omi 1990, Omi and Rose 1990);
loblolly pine (Gilmore 1961); mugo pine (Pinus mugo) and
Monterey pine (McCracken 1979); black walnut (Juglans
nigra), northern red oak (Ouercus rubra), white ash
(Fraxinus americana), and yellow-poplar (Liriodendron tulip-
ifera) (Rietveld et al. 1982); Scots pine (Pinus sylvestris)
(Puttonen 1986); little-leaf linden (Witherspoon and Loomis
1986); and Douglas-fir (Ritchie 1982). Several of these
studies demonstrated a correlation between carbohydrate
reserves and survival (Gilmore 1961, Hellmers 1962, Rietveld
et al. 1982, Puttonen 1986). Puttonen (1986) showed that
Scots pine seedlings exhibited significant mortality if
total carbohydrate reserves dropped below 2 percent of dry
matter during storage, and suggested that this may be a
threshold level for seedling survival.

21
These studies clearly demonstrate that starch levels
decline during cold storage due to respiratory loss, and
suggest a relationship between starch, or at least total
carbohydrate reserves, and seedling survival. Since field
survival is the ultimate test of seedling quality, this
suggests that starch levels may be a reliable indicator of
seedling quality. However, the lack of a relationship
between RGP and carbohydrate reserves contradicts a clear
linear relationship and indicates that if starch reserves
impact on seedling quality it may be in the form of a
threshold level, as suggested by Puttonen (1986).
There has been very little research performed on the
relationship between the osmotic concentration of xylem sap
and seedling quality. A preliminary study by Joly (1985)
showed that lethal temperatures, both high and low, resulted
in an increased osmotic concentration of expressed xylem
sap. Joly concluded that the elevated osmotic concentration
of expressed xylem sap in seedlings killed by lethal temper-
atures is due to disruption of the cell membranes, permit-
ting solute leakage from the cell contents. Undamaged
seedlings showed very low osmotic concentrations, suggesting
that high osmotic concentrations of expressed xylem sap may
be a reliable indicator of seedling damage and an estimator
of seedling quality. Obviously, much more research is
needed to clarify the relationship between the osmotic
concentration of xylem sap and seedling quality.

GENERAL EXPERIMENTAL METHODS
AND STANDARD QUALITY ASSESSMENT TESTS
The preceeding literature review describes many of the
previously investigated tests for evaluating seedling qual-
ity and includes an indepth discussion of the most common
operationally used tests currently available. To enhance
the investigation of the ability of starch content and
osmotic concentration of xylem sap to estimate seedling
quality, several of the "standard" quality assessment tests
were run concurrently. This permitted comparison of results
from the new methods with the predictive ability of
"standard" tests, in addition to analyzing the new methods'
ability to estimate seedling field survival. The "standard't
quality assessment tests chosen for comparison include root
growth potential (RGP), osu vigor test, and growth room
survival.
This chapter provides a description of the experimental
design, seedling stock, and quality-reducing treatments used
in this investigation. An overview of the seedling process-
ing procedures utilized in this study is illustrated in
Figure 1. The chapter also presents results from the
"standard" quality assessment tests and the outplanting
site, including a statistical analysis of the predictive
ability of the "standard" tests.
Seedling Source and Lifting
The study was performed over two planting seasons:
February to June 1985 and October 1985 to March 1986.
Seedling stock utilized was 2-0 bareroot Douglas-fir
seedlings grown at the D. L. Phipps State Forest Nursery
near Elkton, Oregon. The first portion of the project
consisted of 2,200 seedlings lifted on February 6, 1985,
grown from seed originating in Oregon seed zone number 252.
22

LIFTED FROM NURSERY BED (various dates)
CONTROLFreezing
-90 -120 -15C 30 minutes 60 minutes 450 48C
QUALITY-REDUCING TREATMENTS
Root Desiccation Root Submersion
COLD STORAGE
QUALITY ASSESSMENT TESTS
OSU VigorTest
Root GrowthPotential
Figure 1. Flow Chart of Seedling Processing Procedures. After lifting, seedlings were
split into groups. Each group received one quality-reducing treatment. They were thendivided into three subgroups for the storage component (not all lifts were subjected to
storage). After storage, the subgroups were further divided for quality assessment.
0 months 2 months 4 months
Field Growth RoomPerformance Performance

24
The second part consisted of seedlings from four lifting
dates: 1,100 seedlings on October 22, 1985; 200 seedlings
on December 5, 1985; 1,500 seedlings on January 17, 1986;
and 900 seedlings on March 10, 1986. All of these latter
seedlings were grown from seed collected in Oregon seed zone
number 491.
Seedlings were inspected after lifting and graded to
ensure relative uniformity. All damaged seedlings (other
than minor root damage) and seedlings with multiple tops
were discarded. Seedlings from the first season were gen-
erally smaller than those from the second season. Conse-
quently, the minimum seedling stem caliper retained was 3 mm
for the first season and 4 mm for the second season.
The seedlings were then randomly divided into groups
for application of quality-reducing treatments. Roots of the
seedlings were washed to remove any clinging soil, then
pruned to 25 cm with a paper cutter. Excess water was
shaken off the roots before placing the seedlings into
double plastic bags and cold storage until treatment and
planting.
Quality-Reducing Treatments
Seedlings were subjected to one of several quality-
reducing treatments to create a range of quality in the
study population. Treatments chosen included the following:
- Freezing to -9C, -12C, or -15C.
- Root desiccation for 30 minutes or 60 minutes.
- Root submersion in 45C or 48C water.
- Cold storage for 60 days or 120 days.
- Control (no quality-reducing treatment).
Only some of the treatments were applied to any single
lift of seedlings, and no group of seedlings was subjected
25
to more than two of the quality-reducing treatments (one of
which was always cold storage). A brief description of each
treatment follows.
Freezing Treatments
Freezing treatments were performed in a Kalt freezing
chamber that was programmed to equilibrate at 4C for 1 hour,
then decrease by 2C per hour to a final temperature of -9C,
-l2C, or -15C, where it remained for 1 hour. Seedlings
subjected to freezing treatments were enclosed in plastic
bags, 30 to 40 seedlings per bag to ensure even freezing,
and placed in a single layer in the freezing chamber. Upon
reaching the target temperature, individual bags of
seedlings were carefully removed and placed in a cold room
(4C) to thaw slowly. Freezing treatments simulate the
damage resulting from frost in the field or the failure of a
cold storage facility.
Root Desiccation
Root desiccation was simulated in a controlled atmo-
sphere room maintained at 35C, with 35 percent relative
humidity (R.H.). Seedlings to be treated were subdivided
into groups of 30 for easier handling, then their roots were
gently patted dry with absorbent cloths. Root desiccation
was performed by hanging seedlings singly on a rope
stretched across the hot, dry room, and held upright by
clothespins. After the designated drying time, seedlings
were sequentially removed from the rope and placed in a
bucket of water for 5 minutes to rehydrate the roots
(Hermann 1967, McCreary and Duryea 1985). Excess water was
shaken of f the roots and the seedlings were placed back into
the cold room until planted. These treatments simulate
seedling damage that may result from root exposure during
lifting and planting operations.

Root Submersion
These treatments were performed in a large sink filled
with hot water, the temperature of which was carefully
monitored and maintained within 1 degree of the desired
temperature. Seedlings subjected to root submersion were
initially separated into groups of 40 seedlings, and a
twist-tie was placed around each group. Roots of the
seedlings were placed into the hot water (45C or 48C) for
exactly 15 minutes. After removal from the hot water,
excess water was shaken off the roots, and the treated
seedlings were returned to the cold room until planted.
These treatments were designed to simulate the rapid heating
that can occur when seedlings are improperly stored or left
exposed to direct sunlight.
Cold Storage
Cold storage was performed in a cold room maintained at
4C, plus or minus 2C. Seedlings were placed in double plas-
tic bags, and the bags stored on wooden racks to maintain
uniform cooling. Stored seedlings were inspected monthly,
and their roots were moistened, if necessary. Mold growth
was not a problem on seedlings stored for 60 days, but was
apparent on some of the previously treated seedlings that
were subsequently stored for 120 days. However, mold growth
was generally minimal, and no chemicals were used to inhibit
molding.
Quality Assessment Tests
At the time of planting, each group of treated
seedlings was randomly subdivided into groups of 20
seedlings for quality assessment. In addition to field
performance, three "standard" tests were used in this study.
26

OSU Vigor Test
27
They were growth chamber performance, root growth potential,
and the OSU vigor test. Results from each test were used to
formulate regression equations for predicting field survival
and to provide a basis for comparison with the two quality
assessment tests being evaluated.
Growth Chamber Performance
Seedlings utilized for growth chamber performance were
planted five per pot in forest soil and placed in the growth
chamber. A single growth chamber was used throughout this
study. Pots were watered every other day to maintain the
soil near field capacity. The growth chamber was maintained
at 20C with a 16-hour photoperiod.
Seedling buds were monitored biweekly throughout the
growth period and rated on the following scale of 0 to 5:
Rating Bud Condition
0 dormant--dark brown
1 scales beginning to lighten
2 scales light brown, tip of bud yellow
3 bud burst--needles just visible
4 needles exposed and expanding
5 flush--needles expanded and stem visible
Data were collected on the terminal and most advanced
lateral buds on each seedling. At the end of the growth
period (approximately 60 days), the final condition of each
seedling was recorded. A seedling was classified as dead if
the cambium at the root collar was brown and desiccated.
This test is based on the comparison of bud burst and
survival of stressed and unstressed seedlings placed in a

28
growth-stimulating environment. The handling of unstressed
seedlings is described above. Stressed seedlings were sub-
jected to root desiccation for 15 minutes in a hot, dry room
(35C, 35 percent R.H.) (Hermann and Lavender 1979, McCreary
and Duryea 1985). After rehydration of their roots,
seedlings were planted five per pot and placed in the growth
chamber. Bud burst and survival were monitored as described
above.
Root Growth Potential
Before planting seedlings for determination of RGP,
they were inspected for new root growth, and new active root
tips were removed, if present. Seedlings were then potted
five per pot and placed in the growth chamber. After 1
month of growth (28 days the first season, 30 days the
second season), seedlings were removed from the pots, their
roots washed, and all new white root tips greater than 5 mm
in length were measured and recorded (Ritchie 1985).
Field Performance
The outplanting site was located in the OSU Forest
Genetics Nursery, 11 km north of Corvallis, Oregon. The
field plot was laid out in blocks of four rows, 0.3 m apart.
Five seedlings were planted per row, at 0.3 m spacing.
Treatments were randomly assigned to individual rows to
negate any variation in microsite conditions within the
field plot. On each planting date, all seedlings were
planted with a shovel in a single day.
Vegetation on the field site was controlled manually.
Seedlings were protected from deer damage through the appli-
cation of Big Game Repellant (Powder-BGR--P, Deer-Away,
Minneapolis, Minnesota) at the time of bud burst. This pre-
caution was insufficient to prevent all damage, however, and

29
several seedlings received significant browsing. Pocket
gophers on the site were controlled through poison baiting
(Gopher Bait, ORCO, Eugene, Oregon), and damage from these
animals was limited to one seedling.
Buds of the outplanted seedlings were monitored regu-
larly throughout spring and early summer, the period of
active shoot elongation. Survival was determined on the
following November 1st, after the commencement of the fall
rains.
Statistical Analysis
Survival data collected on the seedlings were converted
to an average percent survival for each treatment and qual-
ity assessment test. These data were then normalized
through an arcsine square root transformation for use in the
formation of predictive regression equations.
Data collected on date of bud burst and bud flush were
evaluated as the number of days from planting until burst
and flush for the terminal and most advanced lateral buds.
The mean number of days until bud burst and bud flush was
calculated for each treatment and quality assessment test,
then transformed by taking the square root. For evaluation
with the OSU vigor test, the percentage of stressed and
unstressed seedlings that had experienced bud burst after 8
weeks was also calculated.
RGP data were evaluated as the total number of new
roots greater than 5 mm in length, as well as the total
combined length of all new roots. Means were calculated for
each treatment, and the total number of new roots was
transformed by taking the square root. These results were
used in the formation of regression equations.

30
Through stepwise linear regression of field survival
on the data from each quality assessment test, the "best"
predictive equation was formulated for each method. Predic-
tive variables in each equation were selected by comparison
of F-values; those variables with the highest F-values (and,
consequently, the highest correlation with field survival)
were included in the equation if the correlation was signif-
icant (P10.10). The "best" equation was chosen on the basis
of the highest R2 value. Residual plots were formed for
each of the "best" regression equations to investigate
whether the equation adequately fit the data.
Results and Discussion
Table 1 presents the complete results from this study
on the field site, while Table 2 presents the same data from
the growth chamber. The use of quality-reducing treatments
was very successful in creating a wide range of quality
within the study population, both in the field and the
controlled environment chamber.
In general, seedling survival on the outplanting site
was considerably less than in the growth chamber. Although
this is rather common, due to the less than optimum
conditions in the natural environment, field survival in
this study was adversely impacted by several factors.
In the first season of this study, the cold storage of
the seedlings delayed planting until mid-April and mid-June,
well past the optimum time for planting. To make things
even worse, the weather during the summer of 1985 was very
hot and dry. Consequently, only 3 of the 160 seedlings
planted in June 1985, after 4 months of cold storage,
survived until November 1985.
Adverse weather conditions also contributed to reduced
field survival during the second season of the study.

- - Continued. See footnote at end of table. -
Table 1. Experimental Results From the Field Site.
LIFTDATE
TREATMENT
APPLIED1
COLDSTORAGE(Months)
PERCENT
SURVIVAL
MEAN DAYSTO BUD BURST
MEAN DAYSTO BUD FLUSH
Lateral Terminal Lateral Terminal
1-85 None 0 60 16.8 31.9 26.7 38.9
1-85 30 inins. RD 0 30 28.9 41.1 37.1 48.5
1-85 60 inins. RD 0 35 27.7 41.0 36.6 47.4
1-85 -9C FR 0 40 14.1 27.8 22.9 35.7
1-85 -12C FR 0 15 17.1 37.8 25.3 41.9
1-85 -15C FR 0 0 12.3 28.7 20.3 29.0
1-85 45C RS 0 45 17.1 27.9 24.8 34.0
1-85 48C RS 0 60 17.2 38.1 25.3 43.91-85 None 2 0 12.8 19.2 18.6 25.6
1-85 30 inins. RD 2 20 16.7 19.7 21.5 24.0
1-85 60 mins. RD 2 15 20.9 28.1 26.4 34.1
1-85 -9C FR 2 45 18.4 17.2 23.0 21.3
1-85 -12C FR 2 0 26.7 31.0 33.5 34.0
1-85 -15C FR 2 0 11.7 13.0 19.0 21.01-85 45C RS 2 40 17.3 24.4 24.7 30.2
1-85 48C RS 2 50 13.8 22.2 20.1 27.5
1-85 None 4 5 8.0 9.8 12.9 13.9
1-85 30 mins. RD 4 0 10.8 14.4 16.4 19.4
1-85 60 mins. RD 4 0 25.4 22.5 27.8 28.9

Table 1. Experimental Results From the Field Site (Continued).
COLD
- - Continued. See footnote at end of table. -
LIFT
DATE
TREATMENTAPPLIED1
STORAGE
(Months)
PERCENTSURVIVAL
TO BUD BURST TO BUD FLUSH
Lateral Terminal Lateral Terminal
1-85 -9C FR 4 0 9.6 11.3 14.1 16.0
1-85 -12C FR 4 0 17.5 13.0 24.0 16.0
1-85 -15C FR 4 0 10.0 N/A N/A N/A
1-85 45C RS 4 10 7.9 9.4 12.7 13.5
1-85 48C RS 4 0 11.6 13.2 15.7 17.1
10-85 None 0 15 67.3 101.0 84.2 104.0
10-85 -9C FR 0 0 100.0 N/A 110.0 N/A
10-85 -12C FR 0 0 N/A N/A N/A N/A
10-85 -l5C FR 0 0 50.0 N/A 54.0 N/A
10-85 15 inins. RD 0 10 71.8 N/A 80.7 N/A
10-85 30 mins. RD 0 15 71.7 N/A 86.0 N/A
10-85 60 mins. RD 0 0 N/A N/A N/A N/A
10-85 None 2 55 42.7 72.9 51.0 77.9
10-85 None 4 20 28.8 33.2 34.4 37.8
12-85 None 0 75 32.7 90.8 46.7 97.3
1-86 None 0 90 19.0 38.3 27.0 44.0
1-86 -9C FR 0 60 28.1 40.7 38.0 46.3
1-86 -12C FR 0 90 24.4 35.7 31.5 42.4
1-86 -l5C FR 0 35 24.6 39.1 34.7 44.8
MEAN DAYS MEAN DAYS

Table 1. Experimental Results From the Field Site (Continued).
i-Abbreviations used: RD = Root Desiccation; FR = Freezing; RS = Root Submersion; C =Degrees Centigrade; N/A = Not Applicable.
LIFT
DATE
TREATMENTAPPLIED1
COLDSTORAGE(Months)
PERCENTSURVIVAL
MEAN DAYSTO BUD BURST
MEAN DAYSTO BUD FLUSH
Lateral Terminal Lateral Terminal
1-86 15 mins. RD 0 70 22.3 38.3 29.7 44.6
1-86 30 inins. RD 0 60 30.5 43.1 37.9 49.1
1-86 60 mins. RD 0 35 39.9 46.7 49.8 52.9
1-86 None 2 95 14.3 20.3 20.7 25.2
1-86 -9C FR 2 15 18.7 22.1 26.1 27.0
1-86 -15C FR 2 0 37.7 51.5 46.8 55.5
1-86 15 mins. RD 2 65 19.2 23.8 25.7 28.0
1-86 30 mins. RD 2 30 25.4 27.9 31.3 32.4
1-86 60 mins. RD 2 0 38.6 26.3 47.6 30.0
3-86 None 0 100 5.0 12.9 14.0 17.7
3-86 -9C FR 0 20 4.6 12.4 18.6 19.5
3-86 -12C FR o 15 5.1 13.3 15.6 21.0
3-86 -15C FR 0 0 7.1 13.2 12.4 13.5
3-86 15 mins. RD 0 85 5.2 15.3 14.9 20.5
3-86 30 mins. RD 0 45 6.1 28.4 37.1 32.8
3-86 60 nuns. RD 0 0 18.6 15.0 51.3 21.0

- - Continued. See footnote at end of table. -
Table 2. Experimental Results From the Growth Chamber.
LIFTDATE
TREATMENTAPPLIED1
COLDSTORAGE(Months)
PERCENTSURVIVAL
MEAN DAYSTO BUD BURST
MEAN DAYSTO BUD FLUSH
Lateral Terminal Lateral Terminal
1-85 None 0 80 16.8 31.9 26.7 38.9
1-85 30 mins. RD 0 75 28.9 41.1 37.1 48.5
1-85 60 mins. RD 0 65 27.7 41.0 36.6 47.4
1-85 -9C FR 0 45 14.1 27.8 22.9 35.7
1-85 -12C FR 0 35 17.1 37.8 25.3 41.9
1-85 -15C FR 0 0 12.3 28.7 20.3 29.0
1-85 45C RS 0 90 17.1 27.9 24.8 34.0
1-85 48C RS 0 80 17.2 38.1 25.3 43.9
1-85 None 2 100 12.8 19.2 18.6 25.6
1-85 30 mins. RD 2 100 16.7 19.7 21.5 24.0
1-85 60 mins. RD 2 80 20.9 28.2 26.4 34.1
1-85 -9C FR 2 15 18.4 17.3 23.0 21.3
1-85 -12C FR 2 10 26.7 31.0 33.5 34.0
1-85 -15C FR 2 10 11.7 13.0 19.0 21.0
1-85 45C RS 2 90 17.3 24.4 24.7 30.2
1-85 48C RS 2 100 13.8 22.2 20.1 27.5
1-85 None 4 80 8.0 9.8 13.0 13.9
1-85 30 nuns. RD 4 80 10.8 14.4 16.4 19.4
1-85 60 inins. RD 4 60 25.4 22.5 27.8 28.9
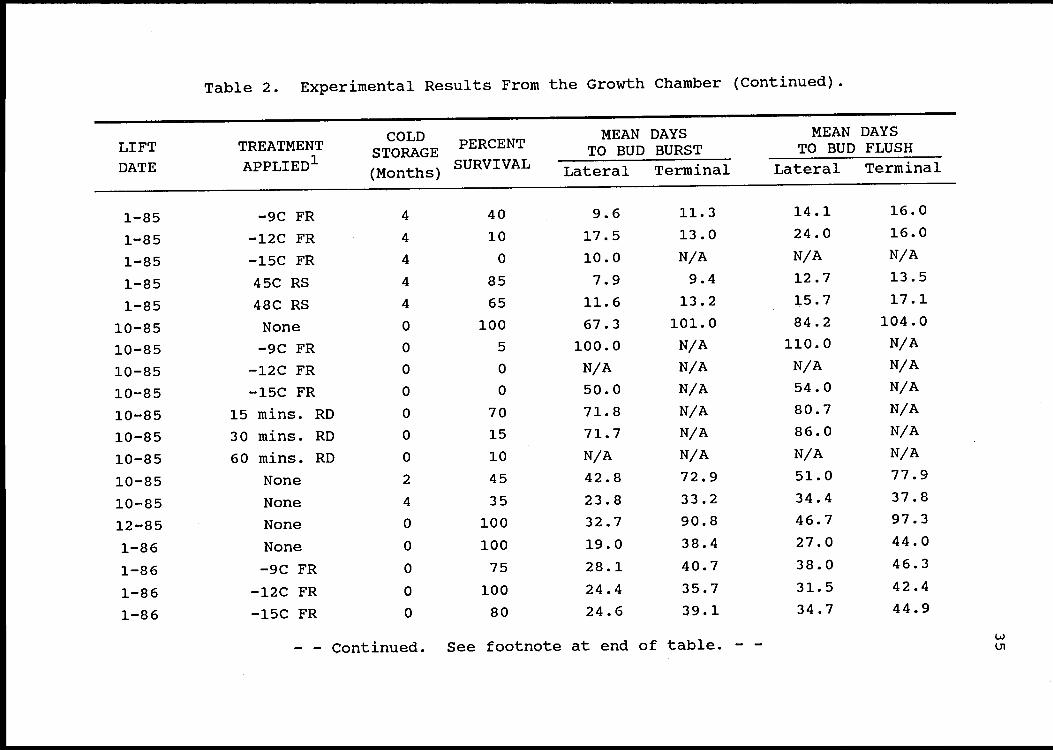
Table 2. Experimental Results From the Growth Chamber (Continued).
- - Continued. See footnote at end of table. -
LIFTDATE
TREATMENTAPPLIED1
COLDSTORAGE(Months)
PERCENTSURVIVAL
MEAN DAYSTO BUD BURST
MEAN DAYSTO BUD FLUSH
Lateral Terminal Lateral Terminal
1-85 -9C FR 4 40 9.6 11.3 14.1 16.0
1-85 -12C FR 4 10 17.5 13.0 24.0 16.0
1-85 -15C FR 4 0 10.0 N/A N/A N/A
1-85 45C RS 4 85 7.9 9.4 12.7 13.5
1-85 48C RS 4 65 11.6 13.2 15.7 17.1
10-85 None 0 100 67.3 101.0 84.2 104.0
10-85 -9C FR 0 5 100.0 N/A 110.0 N/A
10-85 -12C FR 0 0 N/A N/A N/A N/A
10-85 -l5C FR 0 0 50.0 N/A 54.0 N/A
10-85 15 luins. RD 0 70 71.8 N/A 80.7 N/A
10-85 30 mins. RD 0 15 71.7 N/A 86.0 N/A
10-85 60 nuns. RD 0 10 N/A N/A N/A N/A
10-85 None 2 45 42.8 72.9 51.0 77.9
10-85 None 4 35 23.8 33.2 34.4 37.8
12-85 None 0 100 32.7 90.8 46.7 97.3
1-86 None 0 100 19.0 38.4 27.0 44.0
1-86 -9C FR 0 75 28.1 407 38.0 46.3
1-86 -12C FR 0 100 24.4 35.7 31.5 42.4
1-86 -15C FR 0 80 24.6 39.1 34.7 44.9

Table 2. Experimental Results From the Growth Chamber (Continued).
'Abbreviations used: RD = Root Desiccation; FR = Freezing; RS = Root Submersion; C =Degrees Centigrade; N/A = Not Applicable.
LIFT
DATE
TREATMENTAPPLIED1
COLDSTORAGE(Months)
PERCENTSURVIVAL
MEAN DAYSTO BUD BURST
MEAN DAYSTO BUD FLUSH
Lateral Terminal Lateral Terminal
1-86 15 ntins. RD 0 100 22.3 38.3 29.7 44.6
1-86 30 mins. RD 0 95 30.5 43.1 37.9 49.1
1-86 60 mins. RD 0 70 39.9 46.7 49.8 52.9
1-86 None 2 100 14.4 20.3 20.7 25.3
1-86 -9C FR 2 70 18.7 22.1 26.1 27.0
1-86 -15C FR 2 20 37.7 51.5 46.8 55.5
1-86 15 mins. RD 2 100 19.2 23.8 25.7 28.1
1-86 30 mins. RD 2 90 25.4 27.9 31.3 32.4
1-86 60 mins. RD 2 50 38.6 26.3 47.6 30.0
3-86 None 0 100 5.0 12.9 14.0 17.7
3-86 -9C FR 0 20 4.7 12.4 18.6 19.5
3-86 -12C FR 0 20 5.1 13.3 15.6 21.0
3-86 -15C FR 0 0 7.1 13.2 12.4 13.5
3-86 15 mins. RD 0 100 5.2 15.3 15.0 20.5
3-86 30 mins. RD 0 90 6.1 28.4 37.1 32.8
3-86 60 mins. RD 0 65 18.6 15.0 51.3 21.0

37
Shortly after planting the seedlings lifted in October 1985,
the weather turned unseasonably cold and dry. Many of the seed-
lings had not sufficiently hardened to withstand the below
freezing temperatures, and only 8 of the 140 seedlings planted
at that time survived until November 1986. In contrast, 55
percent of the October-lifted seedlings planted in the field
after 2 months cold storage survived until November 1986.
Previous investigators have demonstrated a very high
correlation between growth chamber and field performance
(MeCreary and Duryea 1985). A highly significant relation-
ship was also exhibited in this study, but the correlation
between field survival and growth chamber survival was con-
siderably less than in previous studies (r0.69). Indeed,
the residual plot from regression of growth room survival on
field survival (both nornalized by an arcsine squareroot
transformation) showed heteroscedasticity, which was not eliiri-
mated through weighted least squares regression. The severe
conditions on the field site, which resulted in reduced
survival, certainly contributed to this rather weak correla-
tion. The lack of a strong relationship between growth
chamber and field survival simply demonstrates, once again,
that many factors besides seedling quality affect growth and
survival in the natural environment (McCreary 1986).
Results from the RGP evaluation are shown in Table 3.
As found in previous investigations, there was a highly
significant relationship between RGP and seedling survival,
both in the growth chamber and on the field site. The RGP
measurement that predicted growth chamber survival best was
the mean number of new roots greater than 5 mm in length
(normalized by taking squareroot), which accounted for 73
percent of the variability in growth chamber survival (R2
0.73). In contrast, the mean total length of new roots had
the greatest correlation with field survival (R2=0.51), but
accounted for only a little over half of the variability.

Table 3. Root Growth Potential Results.
- - Continued. See footnote at end of table. -
LIFT
DATE
TREATMENTAPPLIED1
COLDSTORAGE(Months)
PERCENTSURVIVAL
MEAN NUMBEROF NEW ROOTS
MEAN TOTALLENGTH (cm)OF NEW ROOTS
1-85 None 0 100 96.8 1,033
1-85 30 ins. RD 0 100 60.9 799
1-85 60 inins. RD 0 95 22.3 269
1-85 -9C FR 0 100 104.6 1,016
1-85 -12C FR 0 95 62.3 655
1-85 -15C FR 0 40 0.0 0
1-85 45C RS 0 100 27.6 396
1-85 48C RS 0 100 44.1 519
1-85 None 2 100 110.4 1,512
1-85 30 inins. RD 2 100 156.5 1,735
1-85 60 nuns. RD 2 90 47.5 567
1-85 -9C FR 2 100 58.0 598
1-85 -12C FR 2 50 27.0 275
1-85 -15C FR 2 0 0.0 0
1-85 45C RS 2 85 108.2 1,505
1-85 48C RS 2 100 154.6 1,965
1-85 None 4 100 94.9 1,117
1-85 30 inins. RD 4 100 109.5 1,218
1-85 60 Inins. RD 4 85 43.2 445

Table 3. Root Growth Potential Results (Continued).
- - Continued. See footnote at end of table. -
LIFT
DATE
TREATMENTAPPLIED1
COLDSTORAGE(Months)
PERCENT
SURVIVAL
MEAN NUMBEROF NEW ROOTS
MEAN TOTALLENGTH (cm)OF NEW ROOTS
1-85 -9C FR 4 60 47.0 460
1-85 -l2C FR 4 35 22.0 226
1-85 -15C FR 4 5 0.0 0
1-85 45C RS 4 100 98.5 1,172
1-85 48C RS 4 85 105.3 1,323
10-85 None 0 95 66.2 906
10-85 -9C FR 0 10 0.0 0
10-85 -l2C FR 0 45 0.0 0
10-85 -15C FR 0 35 0.0 0
10-85 15 inins. RD 0 85 45.2 647
10-85 30 mins. RD 0 75 0.0 0
10-85 60 mins. RD 0 80 0.0 0
10-85 None 2 55 24.7 428
10-85 None 4 45 20.9 330
12-85 None 0 100 185.8 2,731
1-86 None 0 100 141.0 2,042
1-86 -9C FR 0 70 74.5 902
1-86 -12C FR 0 100 109.5 1,565
1-86 -15C FR 0 95 74.5 948

Table 3. Root Growth Potential Results (Continued).
-AbbreviatiOfls used: RD = Root Desiccation; FR = Freezing; RS = Root Submersion; C =
Degrees Centigrade; N/A = Not Applicable.
LIFT
DATE
TREATMENTAPPLIED1
COLDSTORAGE(Months)
PERCENTSURVIVAL
MEAN NUMBEROF NEW ROOTS
MEAN TOTALLENGTH (cm)OF NEW ROOTS
1-86 15 nuns. RD 0 100 154.0 2,343
1-86 30 mins. RD 0 100 119.3 1,857
1-86 60 mins. RD 0 100 23.4 293
1-86 None 2 100 182.7 2,492
1-86 -9C FR 2 95 59.8 785
1-86 -15C FR 2 60 0.4 3
1-86 15 mins. RD 2 100 160.2 2,285
1-86 30 mins. RD 2 100 134.3 1,803
1-86 60 mins. RD 2 80 14.1 162
3-86 None 0 100 153.0 1,978
3-86 -9C FR 0 45 17.3 22].
3-86 -12C FR 0 15 3.9 35
3-86 -15C FR 0 5 0.0 0
3-86 15 mins. RD 0 100 205.2 2,408
3-86 30 mins. RD 0 100 42.4 376
3-86 60 mins. RD 0 60 1.4 12

41
The strong relationship between RGP and seedling
survival was clearly demonstrated in this investigation, but
it is also clear that more than the ability to grow new
roots is essential for seedling survival, especially in the
natural environment.
Table 4 shows the results from the OSU vigor test. In
many cases the test successfully identified lots of
seedlings with poor seedling quality that subsequently
exhibited low survival rates in the field, confirming the
value of this quality assessment test. On the other hand,
the test identified several seedling lots as good to
excellent in quality, but field survival was very poor. The
severe conditions on the field site certainly contributed to
this lack of correlation.
The mixed results from these "standard" quality
assessment tests are not surprising and clearly demonstrates
the difficulty in predicting field performance of Douglas-
fir seedlings. The strong correlation between the test
results and actual field survival indicates that the quality
attributes assessed by these tests (i.e., root growth,
stress resistance), are important components of seedling
quality. However, the results also clearly indicate that
many other factors, in addition to seedling quality, affect
a seedling's field performance.

- - Continued. See footnote at end of table. -
Table 4. OSU Vigor Test Results.
LIFTDATE
TREATMENT
APPLIED1
COLD GROWTH ROOMSTORAGE PERCENT SURVIVAL
DIFFERENCEIN PERCENTBUD BURST
PREDICTEDQUALITY
FIELDPERCENT
SURVIVAL(Months) Unstres'd Stressed
1-85 None 0 80 75 5 Fair 60
1-85 30 rains. RD 0 75 80 15 Fair 30
1-85 60 rains. RD 0 65 45 25 Poor 35
1-85 -9C FR 0 45 85 -5 Poor 40
1-85 -l2C FR 0 35 20 30 Poor 15
1-85 -15C FR 0 0 0 40 Poor 0
1-85 45C RS 0 90 70 10 Fair 45
1-85 48C RS 0 80 70 15 Fair 60
1-85 None 2 100 100 5 Excellent 0
1-85 30 rains. RD 2 100 90 10 Good 20
1-85 60 rains. RD 2 80 10 45 Poor 15
1-85 -9C FR 2 15 30 -30 Poor 45
1-85 -12C FR 2 10 35 -30 Poor 0
1-85 -15C FR 2 10 0 15 Poor 0
1-85 45C RS 2 90 100 -5 Good 40
1-85 48C RS 2 100 100 -10 Excellent 50
1-85 None 4 80 80 0 Fair 5
1-85 30 rains. RD 4 80 55 15 Poor 0
1-85 60 rains. RD 4 60 35 35 Poor 0

1Abbreviations used: RD = Root Desiccation; FR = Freezing; RS = Root Submersion; C =Degrees Centigrade; N/A = Not Applicable.
Table 4. OSU Vigor Test Results (Continued).
LIFTDATE
TREATMENTAPPLIED1
COLDSTORAGE(Months)
GROWTH ROOMPERCENT SURVIVAL
DIFFERENCEIN PERCENTBUD BURST
PREDICTEDQUALITY
FIELDPERCENTSURVIVALUnstres'd Stressed
1-85 -9C FR 4 40 60 15 Poor 0
1-85 -12C FR 4 10 15 -5 Poor 0
1-85 -15C FR 4 0 0 5 Poor 0
1-85 45C RS 4 85 85 10 Good 10
1-85 48C RS 4 65 75 20 Fair-Poor 0
10-85 None 0 100 70 15 Fair-Poor 15
1-86 None 0 100 100 0 Excellent 90
3-86 None 0 100 100 0 Excellent 100

STARCH MALYSIS
Previous research has identified several compounds,
including starch, sugars, heinicelluloses, fats, and fatty
acids, that act as energy reserves in seedlings (Kreuger and
Trappe 1967, Glerum 1980, Distelbarth et. al. 1984, Loescher
et al. 1990). The contribution of heinicelluloses to energy
reserves is still unclear, and the difficulty in
characterizing and measuring these compounds eliminated them
from consideration as an indicator of seedling quality.
Fats and fatty acids are known to be important energy
reserves in coniferous species, and in Douglas-fir
specifically (Krueger and Trappe 1967, Glerum 1980), but the
level of these reserves does not change dramatically through
the year. It seems unlikely that these compounds would
provide an estimation of seedling quality.
On the other hand, starch and sugar reserves have been
shown to fluctuate considerably from season to season and
have been suggested as a reliable indicator of seedling
quality (Krueger and Trappe 1967, Marshall 1985, Puttonen
1986). Previous studies with Douglas-fir have shown that
total nonstructural carbohydrate reserves increase through-
out winter before decreasing with the onset of spring growth
(Ritchie 1982). Krueger and Trappe (1967) demonstrated that
sugar concentrations peak during mid-winter, while starch
content peaks several months later.
In this study, we chose to concentrate solely on starch
reserves as a predictor of seedling quality; therefore, it
was essential that the methods utilized were specific for
starch. Many methods of measuring carbohydrate reserves
have been developed over the years (Heinze and Murneek 1940,Krueger and Trappe 1967, Ebell 1969, Beutler 1984, Rose et
al. 1991), but only enzyme analyses are specific for starch.
44

45
The enzymic hydrolysis method described by Haissig and Dixon
(1979) was chosen as the safest, easiest, and most reliable
starch measurement technique and was utilized in this study.
Minor modifications were made to streamline the method
without sacrificing reliability and accuracy (Beutler 1984,
Pazur 1985, Rose et al. 1991).
This chapter briefly describes the methods used to mea-
sure starch. A full description of the enzyme purification
and starch measurement techniques is included in the
appendices. Results from the starch analyses are also
presented in this chapter, and the relationship of starch to
seedling quality is evaluated.
Materials and Methods
Tissue samples for starch analysis were collected from
the seedlings immediately before planting (1 day before
planting on the field site). Each sample consisted of sev-
eral roots or needles removed from each seedling and pooled
over a group of five seedlings (each pot in the growth
chamber or row in the field consisted of five seedlings).
Subsequently, tissue samples for many of the treatments were
pooled over a group of 20 seedlings prior to analysis.
Tissue samples were placed in plastic bags and im-
mediately frozen to -20C. Tissue samples were transferred
to a -8CC freezer for long-term storage within 8 hours of
collection.
In preparation for starch measurement, tissue samples
were transferred to glass vials and steamed for 5 to 10
minutes to denature the native enzymes (Loomis 1985). The
tissue samples were then dried by lyophilization and ground
to pass through a 40-mesh screen.

46
Soluble sugars, pigments, and other interfering com-
pounds were subsequently extracted with a methanol:chloroform:
water solution at least three times to ensure complete
extraction. Extracted tissue samples were dried overnight
at 50C to evaporate any residual solvent.
Starch was solubilized by mixing the extracted tissue
pellet with 0.1 N sodium hydroxide solution and incubating
at 5CC for 30 minutes. This solution was neutralized with
0.1 N acetic acid in preparation for starch digestion.
Starch was digested by incubating the solubilized tis-
sue solution with purified a-amylase and amyloglucosidase
for 24 hours at 5CC to 55C. This procedure converts the
starch from a polymer to free glucose molecules.
After conversion of the starch to glucose, an aliquot
of the solution was transferred to a test tube and diluted
to fall within the range of the glucose standard curve.
Glucose concentration was measured through a coupled reac-
tion involving glucose oxidase and peroxidase, which results
in the oxidation of o-dianisidine, producing a reddish color
upon the addition of concentrated sulfuric acid. One
molecule of o-dianisidine is oxidized for each molecule of
glucose in the sample solution. Quantification of the color
intensity with a spectrophotometer and comparison with the
concurrently run glucose "standard curvett permits accurate
calibration of the glucose measurements.
Glucose values were converted to starch equivalents and
percent dry weight for statistical analysis. Means were
calculated for each sample (samples were analyzed for starch
content at least three separate times) and for each
treatment. The data were normalized through an arcsine
squareroot transformation for use in predictive regression
equations.

Results and Discussion
The results from the starch measurements are shown in
Table 5. Treatments for analysis of starch content were
carefully chosen to evaluate the effects of various seedling
stress factors on starch content, as well as the relation-
ship of starch reserves and seedling quality. Due to the
lack of a significant correlation between starch content and
seedling quality, starch measurements were not performed on
all treatments.
The results are very interesting, but generally not
surprising. The quality-reducing treatments (other than
cold storage) did not significantly alter the starch content
of seedling tissues, but did greatly reduce both growth
chamber and field survival. This clearly shows that starch
content alone is not a reliable predictor of seedling qual-
ity. Injuries that greatly reduce seedling quality cannot
be identified by measuring starch reserves. The correlation
between starch content (arcsine squareroot of mean percent
dry weight) and field survival (arcsine squareroot percent
survival) was insignificant (R2=O.07, P=O.31), as was the
correlation between starch content and growth room survival
(R2=O.09, P=O.25)
Cold storage resulted in a significant decrease in the
starch content of seedling roots, but did not show a strong
relationship between starch content and seedling quality.
Figure 2 illustrates the decrease in starch content during
cold storage for three lifting dates. Seedlings from the
1985-86 season utilized their root starch reserves at a
faster rate than those from the previous season. Seedlings
lifted in January 1985 utilized their root starch reserves
at a relatively constant rate of approximately 0.5 percent
of dry weight per month of cold storage, while those lifted
in January 1986 utilized their root starch reserves about
3.5 times faster during 2 months of cold storage.
47

i-Abbreviations used: RD = Root Desiccation; FR = Freezing; RS = Root Submersion; C =Degrees centigrade; N/A = Not Applicable.
Table 5. Starch Concentration in Seedling Tissues.
LIFT
DATE
TREATMENTAPPLIED1
COLDSTORAGE(Months)
MEANPERCENT STARCH
PERCENT SURVIVAL
FieldGrowthChamberRoots Needles
1-85 None 0 5.41 0.11 60 80
1-85 60 mins. RD 0 5.40 0.11 35 65
1-85 -l5C FR 0 5.20 N/A 0 0
1-85 45C RS 0 5.36 0.12 45 90
1-85 None 2 4.37 0.12 0 100
1-85 None 4 3.30 0.11 5 80
10-85 None 0 2.27 N/A 15 100
10-85 -15C FR 0 2.79 N/A 0 0
10-85 60 mins. RD 0 2.53 N/A 0 10
10-85 None 2 0.11 N/A 55 45
10-85 None 4 0.08 N/A 20 35
12-85 None 0 2.53 N/A 75 100
1-86 None 0 6.19 N/A 90 100
1-86 -15C FR 0 6.28 N/A 35 80
1-86 None 2 2.71 N/A 95 100
3-86 None 0 10.78 N/A 100 100

49
6-
0
6.19A
5.41
2.27U.
0
1-85
2.71
LIFT DATE
4.37
10-85-U,-
1-86..A..
2 4
MONTHS IN COLD STORAGE
330
011 0.08.-
Figure 2. Starch Reserve Loss in Seedling Roots During ColdStorage. Data shown are for control seedlingsand those subjected only to cold storage. Lossof starch reserves during cold storage due tomaintenance respiration can be substantial.
Seedlings lifted in October 1985 utilized their root
starch reserves at the rate of approximately 1 percent of
dry weight per month during the first 2 months of cold stor-
age, at which time they reached such a low level that,
apparently, remaining starch could not be utilized for
maintenance respiration, and an alternative energy reserve
was drawn upon during subsequent storage. After 4 months of
cold storage, the seedlings had less than 0.1 percent starch
in their roots, and yet 20 percent of these seedlings
survived in the field (35 percent in the growth chamber).
This appears to contradict the idea that a threshold level
of starch reserves is needed for seedlings to survive
(Marshall 1985, Puttonen 1986), unless that threshold is
very low.
50
The relationship between the loss of root starch
reserves during cold storage and subsequent survival was
evaluated by regressing mean percent starch (arcsine square-
root normalization) on seedling survival (arcsine squareroot
normalization) for the controls and cold storage treatments
only. There was no significant relationship between starch
content of cold-stored seedlings and field survival (R2=
0.02, P=0.76). However, there was a significant relation-
ship between the starch content of cold-stored seedlings and
growth chamber survival (R2=0.56, P=0.03), suggesting that
starch reserves may indeed be an indicator of seedling
quality following cold storage.
Omi (1990) found that the starch reserves of ponderosa
pine seedlings lifted in the fall and stored below freezing
until planting in spring were poorly related to root
initiation and first-year field growth. However, starch
reserves at the time of planting were significantly related
to first-year field survival.
While these results suggest that starch reserves of
cold-stored seedlings are an important component of seedling
qaulity, they also show that starch content alone does not
provide an adequate assessment of seedling quality. The
relationship between starch reserves and field survival is
weak, at best, and additional information (such as RGP) is
required to adequately assess seedling quality.
This study has confirmed that starch reserves increase
during the months preceding spring growth, as previously
reported (Krueger and Trappe 1967, Ritchie 1982). Figure 3
illustrates the increase of root starch reserves in
seedlings in the nursery bed from October 1985 to March
1986. In contrast to Krueger and Trappe (1967), root starch
reserves began to increase during mid-winter and continued
to increase until at least early spring. Since total

51
carbohydrate reserves were not measured during this study,
it was not possible to determine whether the increase in
starch reserves was due to winter photosynthesis or the
conversion of free sugars to starch.
10
0
I-(I) ..
F-Z 6 .6.19w0
zA
W 2 2.27
0
10-85 12-85 1-86
LIFT DATE
A.10.78
3-86
Figure 3. Root Starch Reserves Increase Throughout Winterin Douglas-Fir Seedlings in the Nursery Bed.
The analysis of the starch content of needles from
Douglas-f ir seedlings indicated that starch is not a signif-
icant energy reserve in this tissue, at least not during
winter. Measurements of the starch content of needles from
seedlings lifted in January 1985 showed that starch reserves
averaged approximately 0.1 percent of dry weight and did not
decrease during cold storage. These results contradict the
findings of other researchers and suggest that previous
investigations have been measuring compounds other than
starch. It is of course possible that the method utilized

52
in this study failed to access the starch reserves present
in needles, but this seems unlikely.
Figure 4 clearly illustrates the lack of a relationship
between starch reserves and field survival. For example,
while root starch content did not increase significantly
from October to December 1985, the survival of outplanted
seedlings increased from 15 percent in October to 75 percent
in December. Obviously, starch reserves alone cannot be
relied upon to evaluate the quality of Douglas-fir
seedlings.
Figure 4. Root Starch Content and Field Survival. Datashown are for control seedlings only (no quality-reducing treatments). Root starch reservesincrease throughout winter in seedlings in thenursery bed, but are poorly correlated with fieldsurvival. Starch content alone does not ade-quately characterize seedling quality.

OSMOTIC CONCENTRATION OF EXPRESSED XYLEM SAP
Little is known about the relationship between seedling
quality and the concentration of solutes in xylem sap. It
is known that the xylem functions primarily as a conduit for
water from the roots to needles. Since water is the primary
commodity transported by xylem tissue, the concentration of
solutes in xylem sap is very low in healthy plants, and min-
eral salts make up the bulk of the dissolved solutes.
When a cell membrane is damaged, such as can be caused
by freezing or excessive heat, the integrity of the membrane
is frequently compromised, and the contents of the cell can
leak out. Previous research by Joly (1985) indicated that
leakage of cell solutes from damaged cells considerably
increased the osmotic concentration of xylem sap. This
relationship, if shown to be consistent, could be a useful
indicator of seedling damage.
The tremendous benefit of this technique is the short
period of time required to complete the test--less than 5
minutes. The equipment required is relatively inexpensive
and easy to use. Interpretation of the results could be as
simple as comparing the readout on the osmometer with a
chart correlating osmotic concentration and predicted
seedling quality. In fact, if it could be shown that the
osmotic concentration of xylem sap accurately and realiably
predicts seedling quality and is able to identify all types
of seedling damage, it would meet the criteria of an ideal
test of seedling quality (Zaerr 1985).
Materials and Methods
Seedlings were tested for the osmotic concentration of
their xylem sap 1 day before being planted. To complete the
measurement, a small undamaged branchlet was removed from
53

54
the seedling, and approximately 1/2 inch of the bark and
phloem tissue was removed from the cut end. This ensured
that the sample would not be contaminated by phloem exudate.
The branchlet was then inserted through a one-hole
stopper and installed into a pressure chamber (PMS Instru-
ments Co., Corvallis, Oregon). Chamber pressure was then
increased, forcing xylem sap from the tissue and onto a dry
filter paper disk placed on the end of the stem. When the
disk became saturated with expressed xylem sap, it was im-
mediately transferred to the sample chamber of a vapor pres-
sure osmometer (Wescor Inc., Logan, Utah) for determination
of osmotic concentration (total concentration of solute in
the sap). Measurement of osmolarity proceeds automatically
until the osmotic concentration (in millimoles of solute per
kilogram of solvent) appears on the display (approximately
90 seconds).
Results and Discussion
Results (Table 6) from the investigation of the rela-
tionship between seedling quality and the osmotic concen-
tration of xylem sap were rather disappointing. While it
appears that membrane damage severe enough to greatly reduce
seedling quality may be accompanied by a significant
increase in xylem sap osmolarity, it is also apparent that
lethal damage is not always associated with increased
osmotic concentration of the xylem sap.
While the relationship between seedling survival in the
growth chamber and the osmotic concentration of expressed
xylem sap was highly significant (P=0.0008), the correlation
was quite weak (R2=0.l8). Squaring the mean osmotic concen-
tration improved the correlation a little, but not substan-
tially (R2=0.20). The relationship between field survival and
the osmotic concentration of xylem sap was insignificant.

Table 6. Osmotic Concentration of Expressed Xylem Sapand Its Relationship to Seedling Survival.
- - Continued. See footnote at end of table. - -
COLD MEAN OSMOTIC PERCENT SURVIVALLIFT TREATMENT STORAGE CONCENTRATION GrowthDATE APPLIED1 (Months) (mmol/kg) Field Chamber
1-85 None 0 31.6 60 80
1-85 30 mins. RD 0 33.8 30 75
1-85 60 mins. RD 0 35.3 35 65
1-85 -9C FR 0 32.5 40 45
1-85 -12C FR 0 44.0 15 35
1-85 -l5C FR 0 71.5 0 0
1-85 45C RS 0 34.8 45 90
1-85 48C RS 0 32.3 60 80
1-85 None 2 30.9 0 100
1-85 30 mins. RD 2 37.4 20 100
1-85 60 mins. RD 2 37.0 15 80
1-85 -9C FR 2 35.4 45 15
1-85 -l2C FR 2 39.4 0 10
1-85 -15C FR 2 45.3 0 10
1-85 45C RS 2 32.0 40 90
1-85 48C RS 2 42.5 50 100
1-85 None 4 26.6 5 80
1-85 30 mins. RD 4 26.6 0 80
1-85 60 nuns. RD 4 30.0 0 60

Table 6. Osmotic Concentration of Expressed Xylem Sapand Its Relationship to Seedling Survival (Continued).
- - Continued. See footnote at end of table. - -
LIFTDATE
TREATMENTAPPLIED1
COLDSTORAGE(Months)
MEAN OSMOTICCONCENTRATION
(inmol/kg)
PERCENT SURVIVALGrowth
Field Chamber
1-85 -9C FR 4 31.8 0 40
1-85 -12C FR 4 28.4 0 10
1-85 -15C FR 4 34.4 0 0
1-85 45C RS 4 32.4 10 85
1-85 48C RS 4 35.4 0 65
10-85 None 0 40.5 15 100
10-85 -9C FR 0 88.4 0 5
10-85 -12C FR 0 74.2 0 0
10-85 -15C FR 0 135.4 0 0
10-85 15 mins. RD 0 54.4 10 70
10-85 30 mins. RD 0 57.1 15 15
10-85 60 mins. RD 0 56.9 0 10
10-85 None 2 40.8 55 45
10-85 None 4 49.6 20 35
12-85 None 0 47.9 75 100
1-86 None 0 43.6 90 100
1-86 -9C FR 0 42.3 60 75
1-86 -12C FR 0 42.9 90 100
1-86 -l5C FR 0 42.2 35 80
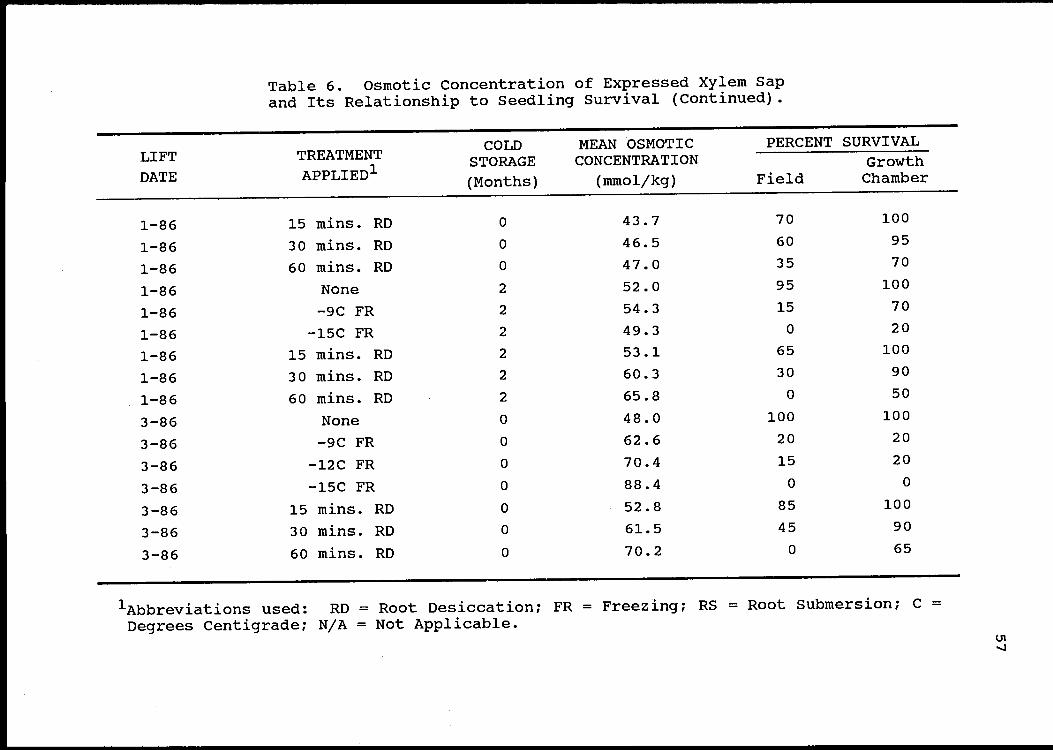
1Abbreviations used: RD = Root Desiccation; FR = Freezing; RS = Root Submersion; C =Degrees Centigrade; N/A = Not Applicable.
Table 6. Osmotic Concentration of Expressed Xylem Sapand Its Relationship to Seedling Survival (Continued).
LIFTDATE
TREATMENT
APPLIED1
COLDSTORAGE
(Months)
MEAN OSMOTICCONCENTRATION
(mmol/kg)
PERCENT SURVIVAL
FieldGrowthChamber
1-86 15 xnins. RD 0 43.7 70 100
1-86 30 Inins. RD 0 46.5 60 95
1-86 60 inins. RD 0 47.0 35 70
1-86 None 2 52 . 0 95 100
1-86 -9C FR 2 54 . 3 15 70
1-86 -15C FR 2 49. 3 0 20
1-86 15 Inins. RD 2 53. 1 65 100
1-86 30 Inins. RD 2 60.3 30 90
1-86 60 mins. RD 2 65.8 0 50
3-86 None 0 48.0 100 100
3-86 -9C FR 0 62 . 6 20 20
3-86 -12C FR 0 70.4 15 20
3-86 -15C FR 0 88.4 0 0
3-86 15 mins. RD 0 52 . 8 85 100
3-86 30 inins. RD 0 61.5 45 90
3-86 60 Inins. RD 0 70.2 0 65
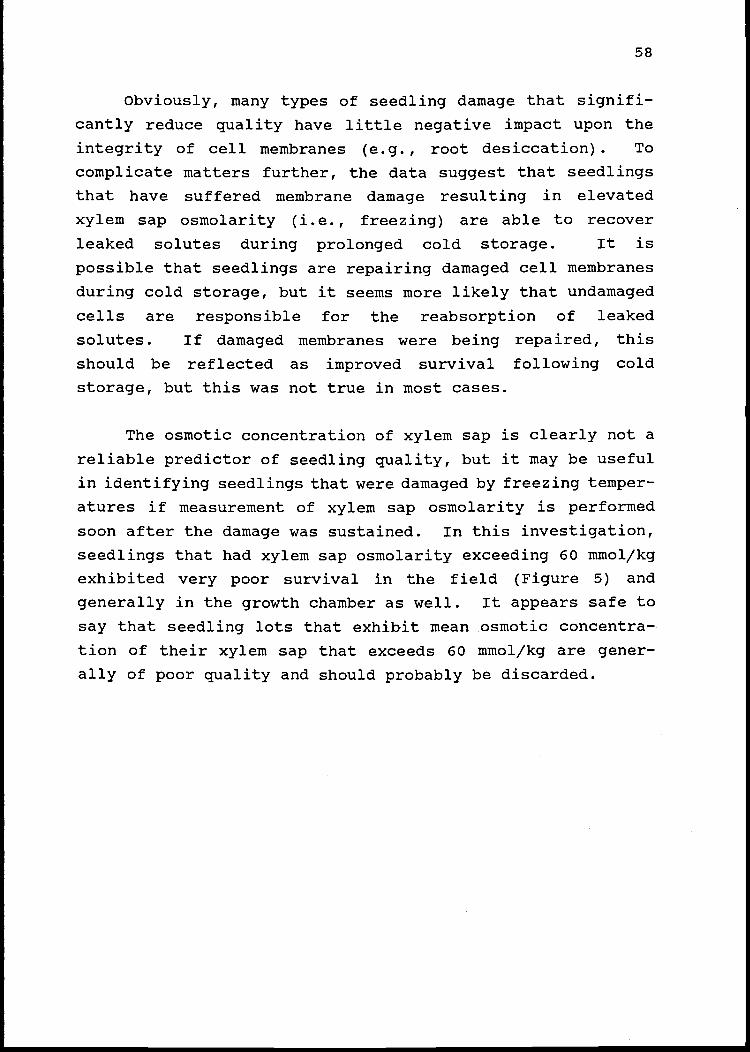
58
Obviously, many types of seedling damage that signifi-
cantly reduce quality have little negative impact upon the
integrity of cell membranes (e.g., root desiccation). To
complicate matters further, the data suggest that seedlings
that have suffered membrane damage resulting in elevated
xylem sap osmolarity (i.e., freezing) are able to recover
leaked solutes during prolonged cold storage. It is
possible that seedlings are repairing damaged cell membranes
during cold storage, but it seems more likely that undamaged
cells are responsible for the reabsorption of leaked
solutes. If damaged membranes were being repaired, this
should be reflected as improved survival following cold
storage, but this was not true in most cases.
The osmotic concentration of xylem sap is clearly not a
reliable predictor of seedling quality, but it may be useful
in identifying seedlings that were damaged by freezing temper-
atures if measurement of xylem sap osmolarity is performed
soon after the damage was sustained. In this investigation,
seedlings that had xylem sap osmolarity exceeding 60 mmol/kg
exhibited very poor survival in the field (Figure 5) and
generally in the growth chamber as well. It appears safe to
say that seedling lots that exhibit mean osmotic concentra-
tion of their xylem sap that exceeds 60 mmol/kg are gener-
ally of poor quality and should probably be discarded.

Figure 5. Elevated Xyleni Sap Osinolarity Is Associated With Poor Field Survival.
-J
>>
Cl)
-JLU
I-
ZLUC)cc:LU0.
100 -
80 -
60 -
-
40 -
20
0
a
I
Undetermined
I
a
a
a
a
Ia.. a.
a
I
Poor Quality
Note:
a
If the osmotic concentration ofexpressed xylem sap fromDouglas-fir seedlings damagedby freezing exceeds 60 mmol/kg, the seedlings should bediscarded.
I
0 20 40 60 80 100 120 140
OSMOLARITY (mmol/kg)

DISCUSSION AND SUMMARY
The project described in this thesis was designed to
assess the ability of the osmotic concentration of xylem sap
and the starch content of roots and/or needles to estimate
Douglas-fir seedling quality. As a benchmark of the ability
of these new methods to predict field survival, two
"standard" quality assessment tests were run simultaneously.
The predictive ability of the RGP and osu vigor test methods
has previously been demonstrated (McCreary 1986).
Results indicate that neither the starch content of
roots nor the osmotic concentration of expressed xylem sap
is a reliable predictor of Douglas-fir seedling quality.
The starch content of Douglas-fir needles apparently has no
relationship to seedling survival; needle starch levels were
very low in mid-winter, with no change during cold storage.
The starch content of Douglas-fir roots proved to have
no significant relationship with seedling survival in either
the field or controlled environment chamber. This result
was not surprising, as previous research had indicated that
if starch reserves have an impact on seedling quality, it is
due to a threshold level below which seedlings would die.
This study provided data that suggest that if a threshold
level of starch reserves is indeed required for seedling
survival, it must be extremely low. Several cold-stored
seedlings with starch reserves averaging less than 0.1 per-
cent dry weight were able to survive on the field site.
The surprising result with respect to the starch content
of roots was the total lack of a relationship (R20.02) between
starch reserves following cold storage and field survival.
The fact that root starch reserves after cold storage were
significantly correlated with growth chamber survival
(R2=0.56) makes this even more puzzling. It is likely that
60

61
the harsh conditions on the field site during both seasons
of this study caused the death of many seedlings that would
have survived "normal" conditions and, consequently, over-
shadowed a possible relationship between root starch
reserves of cold-stored seedlings and field survival. Even
so, root starch reserves do not appear to be a useful pre-
dictor of general seedling quality, and it is probably not
worth the expense to set up a lab to measure seedling starch
reserves for the purpose of estimating seedling quality.
The osmotic concentration of expressed xylem sap also
failed to reliably predict field survival of Douglas-fir
seedlings. It did exhibit a weak correlation with seedling
survival in the growth chamber, and the method was capable
of identifying seedlings with severe damage from freezing.
When a cell is frozen, ice crystals frequently damage
the cell membrane, permitting the leakage of solutes from
inside the cell into extracellular fluids. When many cells
are damaged through severe freezing, solute leakage is suf-
ficient to elevate the osmotic concentration of xylem sap.
This can be easily measured with a vapor pressure osmometer,
and this study showed that seedling lots with average xylem
sap osmolarity exceeding 60 mmol/kg have very poor survival
potential and should probably be discarded. Only seedlings
exposed to lethal freezing temperatures exhibited osmotic
concentrations of xylem sap that exceeded 60 mmol/kg.
The benefit of the xylem sap test is the rapid avail-
ability of the results. With this method a nursery manager
could test 20 to 30 seedlings within an hour and know im-
mediately whether the previous night's severe frost
significantly damaged the seedlings. The only problem with
the scenario is that osmolarity readings for xylem sap below
60 mmol/kg do not guarantee that the seedlings are healthy.
Consequently, it seems that this method of estimating
R2 R2Partial Model
62
seedling quality will be of limited use to the reforestation
industry.
It appears that the RGP and osu vigor test methods are
still the most reliable techniques to estimate seedling
quality. In this study, the overall best" regression
equation to predict Douglas-fir seedling survival combined
measurements from both of these tests as follows:
NOPNSURV = -0.1567 + 0.0003034 (MEANLNGTH) - 0.1634
(SQTL1TBRST) + 0.1919 (SQTTERFLSH)
where: NORNSURV = arcsine squareroot of mean
percent survival
MEANLNGTH = mean total length of new
roots (in mm)
SQTLATBRST = squareroot mean days to
lateral burst
SQTTERFLSH = squareroot mean days to
terminal flush
This equation accounted for 56 percent of the variabil-
ity in field survival (R2=0.56, F(3,43)=l8.50, P0.000l),
but it probably isn't worth the effort needed to complete
both RGP and OSTJ vigor test assessments.
The best single predictor of field survival was the
mean total length of new roots (in mm), which accounted for
51 percent of the variability in field survival. If a reli-
able assessment of seedling quality is needed, it appears
that RGP is still the best method available.
Variable F(343) P
MEANLNGTH 0.427 0.427 28.19 0.0001
SQTLATBRST 0.062 0.489 7.32 0.0097
SQTTERFLSH 0.074 0.564 13.17 0.0008

63
One problem with all of the currently available methods
is the tremendous variability in seedling response. Al-
though the mean total number of new roots was significantly
correlated with field survival, there was tremendous vari-
ability in the total length of new roots produced by
seedlings that were treated identically. Since it is impos-
sible to eliminate the variability in seedling response, it
is necessary to sample quite large numbers of seedlings to
obtain an accurate assessment of the overall quality of the
seedlings. This is quite costly and very tedious.
As has been shown in previous investigations, there is
no quality assessment test that can precisely predict
seedling survival in the field. The excellent correlations
with growth chamber survival demonstrated in this and other
studies indicate that many of the available methods can pro-
vide a reliable estimation of seedling quality. The problem
is that seedling quality is only one of many factors that
affect seedling survival in the natural environment. It is
known that weather, competition from other vegetation, ani-
mal browsing, and other factors also significantly impact
upon field survival. Until the influence of these environ-
mental factors on seedling survival can be measured and
characterized, plantation success or failure cannot be accu-
rately predicted.
The RGP and OSU vigor test provide adequate estimations
of general seedling quality and are the best quality assess-
ment tests available at this time. Future research should
concentrate on developing a "batteryt' of simple tests, such
as the osmotic concentration of xylem sap, which can be per-
formed quickly and, when used concurrently, yield a reliable
assessment of seedling quality. The goal is to ensure that
only vigorous, healthy seedlings are planted, increasing the
probability of successful plantation establishment.

BIBLIOGRAPHY
Allen, W. G. and J. E. Spradlin. 1974. Amylases and theirproperties. Brewers Digest 49:48-53,65.
Askren, C. A. and R. K. Hermann. 1979. Is the oscilloscopetechnique suitable for predicting survival of plantingstock? Tree Planters' Notes 30(4):7-ll.
Bacon, G. 3. and E. P. Bachelard. 1978. The influence ofnursery conditioning treatments on some physiologicalresponses of recently transplanted seedlings of Pinuscaribaea Mor. var. honduriensis. B. & G. Aust. For.Res. 8:171-183.
Bentley, R. 1955. Glucose aerodehydrogenase (glucoseoxidase). In Methods in enzymology, Vol. I. (S. P.
Colowick and N. 0. Kaplan, eds.). Academic Press, Inc.New York, NY. p. 340-345.
Bernfeld, P. 1951. Enzymes of starch degradation andsynthesis. In Advances in enzymology, Vol. XII.(F. F. Nord, ed.). Interscience Publishers. New York,NY. p. 379.
Beutler, H.-O. 1984. Starch. Chap. 1.1. fl Methods ofenzymatic analysis. 3rd ed. Vol. VI. Metabolitesl:carbohydrates. (H. U. Bergmeyer, 3. Bergmeyer, andN. Grassl, eds.). Verlag Chemie. Weinheim, Germany.p. 2-10.
Binder, W. D., P. Fielder, R. Scagel and G. 3. Krumlik.1990. Temperature and time-related variation of rootgrowth in some conifer tree species. Can. 3. For. Res.20: 1192-1199.
Binder, W. D., R. K. Scagel and G. 3. Krumlik. 1988. Rootgrowth potential: facts, myths, value? InProceedings, combined meeting of the Western ForestNursery Associations: Western Forest Nursery Council,Forest Nursery Association of British Columbia, andIntermountain Forest Nursery Association. (T. D.
Landis, tech. coord.). Vernon, B. C. Aug., 1988. USDAFor. Ser. Rocky Mt. For. and Range Exper. Sta. Gen.Tech. Rep. RM-l67. p. 111-118.
Bixby, 3. A. and G. N. Brown. 1974. Rapid determination ofcold hardiness in black locust seedlings using a pres-sure chamber. In Proceedings, 3rd N. Amer. For. Biol.Workshop. (C. P. P. Reid and G. H. Fechner, eds.).Fort Collins, CO. Sept., 1974. p. 354-355.
64

65
Burdett, A. N. 1979. New methods for measuring root growthcapacity: their value in assessing lodgepole pinestock quality. Can. J. For. Res. 9:63-67.
Burdett, A. N. 1987. Understanding root growth capacity:theoretical considerations in assessing planting stockquality by means of root growth tests. Can. J. For.Res. 17:768-775.
Burdett, A. N., D. G. Simpson and C. F. Thompson. 1983.Root development and plantation establishment success.Plant and Soil 71:103-110.
Burdett, A. N. and D. G. Simpson. 1984. Lifting, grading,packaging, and storing. In Forest nursery manual:production of bareroot seedlings. (M. L. Duryea and T.D. Landis, eds.). Martinus Nijhoff/Dr. W. Junk Pub-lishers. The Hague/Boston/Lancaster. For ForestResearch Laboratory, Oregon State University, Corval-lis, OR. p. 227-234.
Burr, K. E., R. W. Tinus, S. J. Wallner and R. N. King.1987. Comparison of four cold hardiness tests on threewestern conifers. In Proceedings, coiribined WesternForest Nursery Council and Intermountain Nurseryman'sAssociation meeting. (T. D. Landis, ed.). Tumwater,WA. Aug., 1986. USDA For. Ser. Rocky Mt. For. andRange Exper. Sta. Gen. Tech. Rep. RN-137. p. 87-95.
Burr, K. E., R. W. Tinus, S. J. Wailner and R. M. King.1989. Relationships among cold hardiness, root growthpotential and bud dormancy in three conifers. TreePhysiol. 5: 291-306.
Burr, K. E., S. J Wailner and R. W. Tinus. 1986. Cold-hardiness testing of conifer seedlings. fl Proceed-ings, Intermountain Nurseryman's Association meeting.(T. D. Landis and J. W. Fischer, eds.). Fort Collins,CO. Aug., 1985. USDA For. Ser. Rocky Mt. For. andRange Exper. Sta. Gen. Tech. Rep. RM-125. p. 104-108.
Chapman, A. G. 1948. Survival and growth of various gradesof shortleaf pine planting stock. Iowa State Col. J.Sci. 22:323-331.
Cleary, B., P. Morgan and J. Zaerr. 1986. Effect of irri-gation control on seedling quality. In Proceedings,9th N. Amer. For. Biol. Workshop. Physiology and gen-eral basis of forest decline. (C. G. Tauer and T. C.
Hennessey, eds.). Stillwater, OK. June, 1986.p. 230-234.

66
Cleary, B. D. and J. B. Zaerr. 1980. Pressure chambertechniques for monitoring and evaluating seedling waterstatus. N. Z. J. For. Sci. l0(l):l33-14l.
Cooper, T. G. 1977. The tools of biochemistry. John Wileyand Sons. New York/London/Sydney/Toronto. p. 136-168.
Day, R. J. and G. R. MacGillivray. 1975. Root regenerationof fall-lifted white spruce nursery stock in relationto soil moisture content. For. Chron. 51:196-199.
Distelbarth, H., U. Kull and K. Jeremias. 1984. Seasonaltrends in energy contents of storage substances inevergreen gymnosperms growing under mild climatic con-ditions in Central Europe. Flora Morphol. Geobot.Oekophysiol. 175(1) :15-30.
Dolata, R. D. 1987. Root regeneration potential. Pro-ceedings, combined Western Forest Nursery Council andIntermountain Nurseryman's Association meeting. (T. D.Landis, ed.). Tumwater, WA. Aug., 1986. USDA For.Ser. Rocky Mt. For. and Range Exper. Sta. Gen. Tech.Rep. PN-137. p. 77-79.
Dunsworth, B. G. 1987. Root growth potential in coastalcontainer species: trends from operational testing andprediction of outplanting performance. i2 Proceedings,combined Western Forest Nursery Council and Intermoun-tam Nurseryman's Association meeting. (T. D. Landis,ed.). Tumwater, WA. Aug., 1986. USDA For. Ser. RockyMt. For. and Range Exper. Sta. Gen. Tech. Rep. RM-l37.p. 103-105.
Ebell, L. F. 1969. Specific total starch determinations inconifer tissues with glucose oxidase. Phytochem. 8:
25-36.
Edgren, J. W. 1984. Nursery storage to planting hole: aseedling's hazardous journey. In Forest nursery man-ual: production of bareroot seedlings. (M. L. Duryeaand T. D. Landis, eds.). Martinus Nijhoff/Dr. W. JunkPublishers. The Hague/Boston/Lancaster. For ForestResearch Laboratory, Oregon State University, Corval-lis, OR. p. 235-242.
Feret, P. P. and R. E. Kreh. 1985. Seedling root growthpotential as an indicator of loblolly pine field per-formance. For. Sci. 3l(4):1005-loll.

67
Feret, P. P., R. E. Kreh and L. E. DeWald. 1985. Rootgrowth potential of stored lobiolly pine seedlings. fl
Proceedings, 3rd Biennial Southern Silvicultural Re-search Conference. (E. Shoulders, ed.). Atlanta, GA.Nov., 1984. USDA For. Ser. Southern For. Exper. Sta.Gen. Tech. Rep. SO-54. p. 18-24.
Fleming, I. D. 1968. Amyloglucosidase: a-i, 4-glucanglucohydrolase (E. C. 3.2.1.3). Starch and itsderivatives, 4th ed. (7. A. Radley, ed.). Chapman andHall, Ltd. London. p. 498-508.
Fowells, H. A. 1953. The effect of seed and stock sizes onsurvival and early growth of ponderosa and jeffreypine. J. For. 51(7):504-507.
Giimore, A. R. 1961. The carbohydrate reserves of loblollypine (Pinus taeda L.) roots in relation to earlysurvival of outpianted seedlings. D. F. thesis. DukeUniversity. Durham, NC. 71 p.
Glerum, C. 1980. Food sinks and food reserves of trees intemperate climates. N. Z. J. For. Sci. lO(l):176-l85.
Glerum, C. 1985. Frost hardiness of coniferous seedlings:principles and applications. In Evaluating seedlingquality: principles, procedures, and predictive abili-ties of major tests. (M. L. Duryea, ed.). Proceedingsof workshop, Oct., 1984. Forest Research Laboratory,Oregon State University, Corvallis, OR. p. 107-123.
Haissig, B. E. and R. E. Dickson. 1979. Starch measurementin plant tissue using enzymatic hydrolysis. Physiol.Plant. 47:151-157.
Haissig, B. E. and R. E. Dickson. 1982. Glucose measure-ment errors in enzymic starch hydrolysates at highenzyme-glucose weight ratios. Physiol. Plant. 54:244-248.
Hawkins, C. D. B. and W. D. Binder. 1990. State of the artseedling stock quality tests based on seedlingphysiology. ja Target Seedling Symposium:Proceedings, combined meeting of the Western ForestNursery Associations. (R. Rose, S. J. Campbell and T.D. Landis, eds.). Roseburg, OR. Aug., 1990. USDA For.Ser. Rocky Mt. For. and Range Exper. Sta. Gen. Tech.Rep. RN-200, p. 91-121.
Hawkins, C. D. B. and G. R. Lister. 1985. In vivo chlor-ophyll flourescence as a possible indicator of thedormancy stage in Douglas-fir seedlings. Can. J. For.Res. 15(4) :607-612.

68
Heinze, P. H. and A. E. Murneek. 1940. Comparative accu-racy and efficiency in determination of carbohydratesin plant material. Missouri Agricultural ExperimentStation Research Bulletin 314. 23 p.
Heilmers, H. 1962. Physiological changes in stored pineseedlings. Tree Planters' Notes 53:9-10.
Hermann, R. K. 1967. Seasonal variation in sensitivity ofDouglas-fir seedlings to exposure of roots. For. Sci.13(2) :140-149.
Hermann, R. K., D. P. Lavender and J. B. Zaerr. 1972.Lifting and storing western conifer seedlings. ForestResearch Laboratory, Oregon State University, Corval-lis, OR. Research Paper 17. 8 p.
Hermann, R. K. and D. P. Lavender. 1979. Testing the vigorof coniferous planting stock. Forest Research Labora-tory, Oregon State University, Corvallis, OR. ResearchNote 63. 3 p.
Holbo, H. R., C. A. Askren and R. K. Hermann. 1981. Doesthe oscilloscope technique reveal the dormancy statusof Douglas-fir and ponderosa pine? For. Sci. 27(2):405-412.
Jenkinson, J. L. 1980. Improved plantation establishmentby optimizing growth capacity and planting time ofwestern yellow pines. USDA For. Ser. Pacific S. W.
For. and Range Exper. Sta. Res. Pap. PSW-154. 22 p.
Jenkinson, J. L. 1984. Seed source lifting windows improveplantation establishment of Pacific slope Douglas-fir.Di Seedling physiology and reforestation success. (M.
L. Duryea and G. N. Brown, eds.). Martinus Nijhoff/Dr. W. Junk Publishers. The Hague/Boston/Lancaster.p. 115-141.
Jenkinson, J. L. and J. A. Nelson, 1978. Seed source lift-ing windows for Douglas-fir in the Humboldt Nursery.
Proceedings, Western Forest Nursery Council andIntermountain Nurseryman's Association Conference.Eureka, CA. Aug., 1978. p. 1377-1395.
Jenkinson, J. L. and J. A. Nelson. 1985. Cold storage in-creases resistance to dehydration stress in PacificDouglas-fir. Di Proceedings, combined Western ForestNursery Council and Intermountain Nurseryman's Associa-tion meeting. (T. D. Landis, ed.). Coeur d'Alene, ID.Aug., 1984. USDA For. Ser. Intermountain Res. Sta.Gen. Tech. Rep. INT-185. p. 38-44.

69
Joly, R. J. 1985. Techniques for determining seedlingwater status and their effectiveness in assessingstress. fl, Evaluating seedling quality: principles,procedures, and predictive abilities of major tests.(M. L. Duryea, ed.). Proceedings of workshop, Oct.,1984. Forest Research Laboratory, Oregon State Uni-versity, Corvallis, OR. p. 17-28.
Krueger, K. W. and J. M. Trappe. 1967. Food reserves andseasonal growth of Douglas-fir seedlings. For. Sci.13(2) :192-202.
Krugman, S. L., E. C. Stone and P. V. Bega. 1965. Theeffects of soil fumigation and lifting date on theroot-regenerating potential of Monterey pine plantingstock. J. For. 63(2):114-l19.
Krugman, S. L. and E. C. Stone. 1966. The effect of coldnights on the root-regenerating potential of ponderosapine seedlings. For. Sci. l2(4):451-459.
Laacke, R. J., C. P. Weatherspoon and R. W. Tinus. 1987.Monitoring cold hardiness of tree seedlings by infraredthermography. In Proceedings, combined Western ForestNursery Council and Intermountain Nurseryman's Associ-ation meeting. (T. D. Landis, ed.). Tumwater, WA.Aug., 1986. USDA For. Ser. Rocky Mt. For. and RangeExper. Sta. Gen. Tech. Rep. RN-137. p. 97-102.
Landis, T. D. 1985. Mineral nutrition as an index ofseedling quality. Evaluating seedling quality:principles, procedures, and predictive ability of majortests. (M. L. Duryea, ed.). Proceedings of workshop,Oct., 1984. Forest Research Laboratory, Oregon StateUniversity, Corvallis, OR. p. 29-48.
Landis, T. D. and S. G. Skakel. 1988. Root growthpotential as an indicator of outplanting performance:problems and perspectives. In Proceedings, combinedmeeting of the Western Forest Nursery Associations:Western Forest Nursery Council, Forest NurseryAssociation of British Columbia, and IntermountainForest Nursery Association. (T. D. Landis, tech.coord.). Vernon, B.C. Aug., 1988. USDA For. Ser.Rocky Mt. For. and Range Exper. Sta. Gen. Tech. Rep.RM-167. p. 106-110.
Lavender, D. P. 1985. Bud dormancy. Evaluating seed-ling quality: principles, procedures, and predictiveabilities of major tests. (M. L. Duryea, ed.). Pro-ceedings of workshop, Oct., 1984. Forest ResearchLaboratory, Oregon State University, Corvallis, OR.p. 7-15.

70
Lavender, D. P., R. K. Hermann and P. Hinz. 1980. Con-trolled environment facilities for predicting vigor inoutplanted Douglas-fir seedlings. Proceedings, 5thN. Amer. For. Biol. Workshop. (C. A. Hollis and A. E.Squillace, eds.). Gainesville, FL. March, 1978.p. 242-244.
Little, C. H. A. 1970. Seasonal changes in carbohydrateand moisture content in needles of balsam fir (Abiesbalsainea). Can. J. Bot. 48:2021-2028.
Loescher, W. H., T. McCamant and J. D. Keller. 1990.Carbohydrate reserves, translocation, and storage inwoody plant roots. Hort. Sd. 25(3): 274-281.
Loomis, W. D. 1985. Personal communication. Dept. of Bio-chemistry, Oregon State University, Corvallis, OR.
Marshall, J. D. 1984. Physiological control of fine rootturnover. Ph.D. thesis. Oregon State University, Cor-vallis, OR. 98 p.
Marshall, J. D. 1985. Carbohydrate status as a measure ofseedling quality. In Evaluating seedling quality:principles, procedures, and predictive abilities ofmajor tests. (N. L. Duryea, ed.). Proceedings ofworkshop, Oct., 1984. Forest Research Laboratory, Ore-gon State University, Corvallis, OR. p. 49-58.
McCollough, D. G. and M. R. Wagner. 1987. Evaluation offour techniques to assess vigor of water-stressed pon-derosa pine. Can. J. For. Res. 17:138-145.
McCracken, I. J. 1979. Changes in the carbohydrate concen-tration of pine seedlings after cool storage. N. Z. J.For. Sci. 9(l):34-43.
McCreary, D. D. 1986. Evaluating the quality of Douglas-fir [Pseudotsuga menziesii (Mirb.) Francol seedlings:a comparison of some current and proposed evaluationmethods. Ph.D. thesis. Oregon State University, Cor-vallis, OR. 108 p.
McCreary, D. D. and M. L. Duryea. 1985. OSU vigor test:principles, procedures, and predictive ability. InEvaluating seedling quality: principles, procedures,and predictive abilities of major tests. (N. L.Duryea, ed.). Proceedings of workshop, Oct., 1984.Forest Research Laboratory, Oregon State University,Corvallis, OR. p. 85-92.

71
McCreary, D. D. and M. L. Duryea. 1987. Predicting fieldperformance of Douglas-fir seedlings: comparison ofroot growth potential, vigor and plant moisture stress.New Forests 3:153-169.
McCreary, D. D. and J. B. Zaerr. 1987. Root respirationhas limited value for assessing Douglas-fir seedlingquality. Can. J. For. Res. 17:1144-1147.
McDonald, E. 1985. Personal communication. Dept. ofMolecular Biology, Oregon State University, Corvallis,OR.
Narabiar, E. K. S., G. D. Bowen and R. Sands. 1979. Rootregeneration and plant water status of Pinus radiata D.Don seedlings transplanted to different soil tempera-tures. J. Exper. Bot. 30(119):1119-1131.
Omi, S. K. 1990. Effects of fall lifting and long-termfreezer storage on ponderosa pine seedling physiologyand quality. Ph. D. thesis. Oregon State University,Corvallis, OR. 205p.
Omi, S. K., G. T. Howe and M. L. Duryea. 1986. First-yearfield performance of Douglas-fir seedlings in relationto nursery characteristics. In Proceedings, combinedWestern Forest Nursery Council and Intermountain Nurs-eryman's Association meeting. (T. D. Landis, ed.).Tumwater, WA. Aug., 1986. USDA For. Ser. Rocky Mt.For. and Range Exper. Sta. Gen. Tech. Rep. RN-137.p. 29-34.
Omi, S. K. and R. Rose. 1990. Target root starchconcentrations before storage: testing the model. InTarget Seedling Symposium: Proceedings, combinedmeeting of the Western Forest Nursery Associations.(R. Rose, S. J. Campbell and T. D. Landis, eds.).Roseburg, OR. Aug., 1990. USDA For. Ser. Rocky Mt.For. and Range Exper. Sta. Gen. Tech. Rep. RN-200. p.195-200.
Omi, S. K., B. Yoder and R. Rose. 1991. Fall lifting andlong-term freezer storage of ponderosa pine seedlings:effects on post-storage leaf water potential, stomatalconductance, and root growth potential. Tree Physiol.8: 315-325.
Orlander, G., G. Egnell and S. Forsen. 1989. Infraredthermography as a means of assessing seedling quality.Scand. J. For. Res. 4: 215-222.
Paton, R. R. 1929. The relation of size of seedling treesto their vigor. Ohio Exper. Sta. Bimon. Bull. 141:191-194.
72
Pazur, 3. H. 1985. Personal communication. Department ofBiochemistry and Molecular Biology, Pennsylvania StateUniversity, University Park, PA.
Pazur, 3. H. 1987. Personal communication. Department ofBiochemistry and Molecular Biology, Pennsylvania StateUniversity, University Park, PA.
Pazur, 3. H. and T. Ando. 1959. The action of an amylo-glucosidase of Aspergillus niger on starch and malto-oligosaccharides. 3. Biol. Chem. 234(8):1966-1970.
Pazur, 3. H., H. R. Knull and A. Cepure. 1971. Glyco-enzymes: structure and properties of the two forms ofglucoamylase from Aspergillus niger. Carbohyd. Res.20: 83-96.
Pazur, 3. H., Y. Tominaga and S. Kelly. 1984. The relation-ship of structure of glucoamylase and glucose oxidaseto antigenicity. 3. Protein Chem. 3(l):49-62.
Pomeroy, K. B., F. K. Green and L. B. Burkett. 1949. Im-portance of stock quality in survival and growth ofplanted trees. 3. For. 47(9):706-707.
Puttonen, P. 1986. Carbohydrate reserves in Pinus sylves-tris seedling needles as an attribute of seedlingvigor. Scand. 3. For. Res. 1:181-193.
Richardson, S. D. 1958. Bud dormancy and root developmentin Acer saccharinum. In The physiology of foresttrees. (K. V. Thimann, ed.). Ronald Press. New York,NY. p. 409-425.
Rietveld, W. 3. 1987. A new, more efficient method toevaluate root growth potential of planting stock usinga root area index. In Proceedings, combined WesternForest Nursery Council and Intermountain Nurseryman'sAssociation meeting. (T. D. Landis, ed.). Tumwater,WA. Aug., 1986. USDA For. Ser. Rocky Mt. For. andRange Exper. Sta. Gen. Tech. Rep. PN-137. p. 96.
Rietveld, W. 3. and R. W. Tinus. 1990. An integratedtechnique for evaluating root growth potential of treeseedlings. USDA For. Ser. Rocky Mt. For. and RangeExper. Sta. Res. Note RN-497. Fort Collins, CO. 4p.
Ritchie, G. A. 1982. Carbohydrate reserves and root growthpotential in Douglas-fir seedlings before and aftercold storage. Can. 3. For. Res. 12:905-912.

73
Ritchie, G. A. 1984. Assessing seedling quality. .fl For-est nursery manual: production of bareroot seedlings.(N. L. Duryea and T. D. Landis, eds.). MartinusNijhoff/Dr. W. Junk Publishers. The Hague/Boston/Lancaster. For Forest Research Laboratory, OregonState University, Corvallis, OR. p. 243-259.
Ritchie, G. A. 1985. Root growth potential: principles,procedures, and predictive ability. In Evaluatingseedling quality: principles, procedures, and predic-tive abilities of major tests. (N. L. Duryea, ed.).Proceedings of workshop, Oct., 1984. Forest ResearchLaboratory, Oregon State University, Corvallis, OR.p. 93-105.
Ritchie, G. A. and J. R. Dunlap. 1980. Root growth poten-tial: its development and expression in forest treeseedlings. N. Z. J. For. Sci. l0(l):2l8-248.
Ritchie, G. A. and T. N. Hinckley. 1975. The pressurechamber as an instrument for ecological research. Ad-vances in Ecol. Res. 9:165-254.
Ritchie, G. A. and 1. Tanaka. 1990. Root growth potentialand the target seedling. In Target Seedling Symposium:Proceedings, combined meeting of the Western ForestNursery Associations. (R. Rose, S. J. Campbell and T.D. Landis, eds.). Roseburg, OR. Aug., 1990. USDA For.Ser. Rocky Mt. For. and Range Exper. Sta. Gen. Tech.Rep. RN-200. p. 37-51.
Robyt, J. F. and W. J. Whelan. 1968. The a-amylases. nStarch and its derivatives, 4th ed. (J. A. Radley,ed.). Chapman and Hall, Ltd. London. p. 430-497.
Rook, D. A. 1969. Water relations of wrenched and Un-wrenched Pinus radiata seedlings on being transplantedinto conditions of water stress. N. Z. J. For. 14:50-58.
Rose, R. 1992. Root growth potential and starch differencesin seedlings of six families of genetically improvedloblolly pine. In press. Paper 2747 of the ForestResearch Laboratory, Oregon State University,Corvallis, OR.
Rose, R., C. L. Rose, S. K. Omi, K. R. Forry, D. N. Duralland W. L. Bigg. 1991. Starch determination byperchioric acid vs enzymes: evaluating the accuracyand precision of six colorimetric methods. J. Agric.Food Chem. 39(1): 2-11.

74
Rose, R. W. and R. P. Whiles. 1985. Root growth potentialand carbohydrate shifts in previously cold stored lob-lolly pine seedlings grown in hydroponic culture. .fl
Proceedings, 3rd Biennial Southern Silvicultural Re-search Conference. (E. Shoulders, ed.). Atlanta, GA.Nov., 1984. USDA For. Ser. Southern For. Exper. Sta.Gen. Tech. Rep. SO-54. p. 25-33.
Stoeckeler, J. H. and G. A. Lintstroni. 1950. Reforestationresearch findings in northern Wisconsin and upperMichigan. USDA For. Ser. Lake States For. Exper. Sta.Pap. 23. 34 p.
Stone, E. C. 1955. Poor survival and the physiologicalcondition of planting stock. For. Sci. 1(2):90-94.
Stone, E. C. and R. W. Benseler. 1962. Planting ponderosapine in the California pine region. J. For. 60(7):462-466.
Stone, E. C., E. E. Gilden, D. W. Cooper and R. J. Malain.1961. Planting dates for Douglas-fir seedlings in Cal-ifornia forest lands. Calif. Agric. 15(8):15-16.
Stone, E. C. and J. L. Jenkinson. 1970. Influence of soilwater on root growth capacity of ponderosa pine trans-plants. For. Sci. 16(2):230-239.
Stone, E. C. and J. L. Jenkinson. 1971. Physiologicalgrading of ponderosa pine nursery stock. J. For.69(1) :31-33.
Stone, E. C., J. L. Jenkinson and S. L. Krugman. 1962.Root-regenerating potential of Douglas-fir seedlingslifted at different times of the year. For. Sci.8(3) :288-297.
Stone, E. C. and G. H. Schubert. 1959a. Root regenerationby seedlings. Calif. Agric. 13(2) :12-14.
Stone, E. C. and G. H. Schubert. 1959b. Ponderosa pineplanting stock. Calif. Agric 13(3):1l-12.
Stone, E. C. and G. H. Schubert. 1959c. Root regenerationby ponderosa pine seedlings lifted at different timesof the year. For. Sci. 5(4):322-332.
Stone, E. C. and G. H. Schubert. l959d. The physiologicalcondition of ponderosa pine (Pinus ponderosa Laws.)planting stock as it affects survival after cold stor-age. J. For. 57(ll):837-841.

75
Stone, E. C. and G. H. Schubert. 1959e. Seasonal perio-dicity in root regeneration on ponderosa pine trans-plants--a physiological condition. n Proceedings,Soc. Am. For. Salt Lake City, Utah. Sep.-Oct., 1958.p. 154-155.
Stone, E. C., G. H. Schubert, R. W. Benseler, F. J. Baronand S. L. Krugman. 1963. Variation in the root regen-erating potentials of ponderosa pine from four Califor-nia nurseries. For. Sci. 9(2):217-225.
Sutton, R. F. 1980. Planting stock quality, root growthcapacity, and field performance of three borealconifers. N. Z. J. For. Sci. lO(l):54-71.
Takagi, T., H. Toda and T. Isemura. 1971. Bacterial andmold atnylases. j The enzymes, 3rd ed. Vol. V. (P. D.Boyer, ed.). Academic Press. New York. p. 235-271.
Thompson, B. E. 1985. Seedling morphological evaluation--what you can tell by looking. In Evaluating seedlingquality: principles, procedures, and predictive abili-ties of major tests. (M. L. Duryea, ed.). Proceedingsof workshop, Oct., 1984. Forest Research Laboratory,Oregon State University, Corvallis, OR. p. 59-71.
Timmis, R. 1976. Methods of screening tree seedlingsfor frost hardiness. In Tree physiology and yieldimprovement. (N. G. R. Cannell and F. T. Last,eds.). Academic Press. London/New York/San Francisco.p. 421-435.
Tinus, R. W., K. E. Burr, S. J. Wallner and R. M. King.1987. Relation between cold hardiness, root growthcapacity, and bud dormancy in three western conifers..fl Proceedings, combined Western Forest Nursery Counciland Intermountain Nurseryman's Association meeting.(T. D. Landis, ed.). Tumwater, WA. Aug., 1986. USDAFor. Ser. Rocky Mt. For. and Range Exper. Sta. Gen.Tech. Rep. RN-l37. p. 80-86.
Toda, H. and S. Akabori. 1963. Chromatography of Taka-amylase A on diethylaminoethyl-cellulose column. J.
Biochein. 53(2) :102-110.
Tsugita, A., M. Inoue and S. Akabori. 1959. Chromatographyof crystalline Taka-ainylase A on a weak anion exchanger.J. Biochem. 46(1):93-95.

76
van den Driessche, R. 1978. Seasonal changes in rootgrowth capacity and carbohydrates in red pine and whitespruce nursery seedlings. In Proceedings, IUFRO sylTipO-slum on root physiology and symbiosis. (A. Riedackerand J. Gagnaire-Michard, eds.). Nancy, France. Sept.,1978. p. 6-19.
Vidaver, B. and W. Binder. 1987. Variable chlorophyll fluo-rescence: predicting seedling quality. Solutions--TheFRDA research newsletter. British Columbia. l(l):4-5.
Vidaver, W., P. Toivonen, G. Lister, R. Brooke and W.
Binder, 1988. Variable chlorophyll fluorescence andits potential use in tree seedling production andforest regeneration. In Proceedings, combined meetingof the Western Forest Nursery Associations: WesternForest Nursery Council, Forest Nursery Association ofBritish Columbia, and Intermountain Forest NurseryAssociation. (T. D. Landis, tech. coord.). Vernon,B.C. Aug., 1988. USDA For. Ser. Rocky Mt. For. andRange Exper. Sta. Gen. Tech. Rep. RN-167. p. 127-132.
Wakeley, P. C. 1948. Physiological grades of southern pinenursery stock. Proc. Soc. Am. For. Ann. Cony. 1948.43:311-320.
Wakeley, P. C. 1954. Planting the southern pines. USDAFor. Ser. Agric. Monograph No. 18. 233 p.
Wailner, S. J., J. E. Bourque, T. D. Landis, S. E. McDonaldand R. W. Tinus. 1982. Cold hardiness testing ofcontainer seedlings. In Proceedings, IntermountainNurseryman's Association meeting. (R. F. Huber,ed.). Edmonton, Alberta. Aug., 1981. Nor. For. Res.Ctr., Can. For. Ser., Env. Can. Inf. Rep. NOR-X-24l.p. 21-25.
Weatherspoon, P. and J. Laacke. 1985. Infrared thermogra-phy for assessing seedling condition--rationale andpreliminary observations. In Evaluating seedling qual-ity: principles, procedures, and predictive abilitiesof major tests. (M. L. Duryea, ed.). Proceedings ofworkshop, Oct., 1984. Forest Research Laboratory, Ore-gon State University, Corvallis, OR. p. 127-135.
Webb, D. P. and F. W. von Aithen. 1980. Storage of hard-wood planting stock: effects of various storageregimes and packaging methods on root growth and physi-ological quality. N. Z. J. For. Sci. lO(l):83-96.
Witherspoon, W. R. and G. P. Lumis. 1986. Root regenera-tion, starch content, and root promoting activity inTilia cordata cultivars at three different digging-planting times. J. Environ. Hort. 4(3):76-79.

77
The Worthington Manual. 1977. E.C.3.2.1.1 alpha ainylase(swine pancreas). p. 173-176.
Zaerr, J. B. 1967. Auxin and the root-regenerating poten-tial in ponderosa pine seedlings. For. Sci. 13(3):258-264.
Zaerr, J. B. 1985. The role of biochemical measurements inevaluating vigor. fl Evaluating seedling quality:principles, procedures, and predictive abilities ofmajor tests. (N. L. Duryea, ed.). Proceedings ofworkshop, Oct., 1984. Forest Research Laboratory, Ore-gon State University, Corvallis, OR. p. 137-141.
Zaerr, J. B., B. D. Cleary and J. L. Jenkinson. 1981.Scheduling irrigation to induce seedling dormancy. fl
Proceedings, Intermountain Nurseryman's Association andWestern Forest Nursery Council combined meeting.Boise, ID. Aug., 1980. USDA For. Ser. IntermountainFor. and Range Exper. Sta. Gen. Tech. Rep. INT-109.p. 74-79.
Zaerr, J. B. and D. P. Lavender. 1976. Size and survivalof 2-0 Douglas-fir seedlings. Forest Research Labora-tory, Oregon State University, Corvallis, OR. Res.Pap. 32. 6 p.
Zaerr, J. B., D. P. Lavender, R. K. Herman and G. B. Sweet.1973. Factors affecting root growth in Douglas-firseedlings. Abstract from Plant Physiology, Program andAbstracts, annual meeting. University of Calgary,Alberta. June, 1973. Vol. 51, supplement. p. 20.

APPENDICES

Appendix A
STARCH ANALYSIS FOR CONIFER TISSUES
Adapted from Haissig and Dickson 1982, 1979; Ebell 1969.
Solutions:
1) methanol:chloroform:water, 12:5:3 v/v/v (MCW solution)--
mix 1200 ml methanol, 500 ml chloroform, and 300 ml
deionized distilled water (ddH2O). Use reagent grade
solvents, or better.
0.1 N sodium hydroxide---dissolve 4.00 g sodium hydrox-
ide (NaOH) in 1000 ml ddH2O.
0.1 N acetic acid--add 5.75 ml glacial acetic acid
(HAc) to 950 ml ddH2O. Mix well and bring to a total
volume of 1000 ml with additional ddH2O.
30% sodium hydroxide--dissolve 30.0 g NaOH in 100 ml
ddH2O.
0.05 M sodium acetate buffer, pH 5.1--add 2.84 ml
glacial acetic acid (HAC) to about 900 ml ddH2O.
Adjust to pH 5.1 with 30% sodium hydroxide (solution
#4). Bring to total volume of 1000 ml with additional
ddH2O.
0.1 M sodium phosphate buffer, pH 7.0--dissolve 8.7 g
dibasic sodium phosphate (Na2HPO4) and 5.3 g monobasic
sodium phosphate monohydrate (NaH2PO4H20) in 1000 ml
ddH2O.
78
2 )
7) a-amylase/amyioglucosidase digestion solution--this
solution should contain 2 uN units/mi of amylogiucosi-
dase (from Aspergillus niger) and 400 UM units/mi of a-
amylase (from A. oryzae) in 0.05 M NaOAc buffer, pH 5.1
(solution #5). Use purified, assayed enzymes to pre-
pare this solution (see the appropriate purification
and assay procedures in Appendices B-E).
glucose oxidase/peroxidase/o-dianisidine solution--dis-
solve 100.0 mg o-dianisidine dihydrochioride in 10.0 ml
ddH2O. (This step is needed, as the dye does not dis-
solve well in the final buffer.) Mix the 10.0 ml 0-dianisidine solution with 990 ml 0.1 M sodium phosphate
buffer, pH 7.0 (solution #6). Add the appropriate
amount of glucose oxidase (GOD) and peroxidase (POD),
to yield a final concentration of 5 units GOD/mi and 1
unit POD/nil, and mix well. [See the bottle labels for
the enzyme assays. The approximate amounts of enzymes
to add are 44-45 mg glucose oxidase (from A. niger,
type X, Sigma no. G-8135 or G-7l41) and about 5 mg per-
oxidase (from horseradish, type II, Sigma no. P-8250).1
The final solution is 0.16 mM o-dianisidine in 0.1 M
sodium phosphate buffer, pH 7.0, containing about 5
units GOD/mi and 1 unit POD/mi. This solution is
stable for up to 1 month if stored in the refrigerator
in a brown bottle.
75% sulfuric acid--place 250 ml ddH2O in a heavy glass
acid stock bottle and very slowly (over an hour or two)
add 750 ml sulfuric acid (H2s04) while stirring slowly
with a magnetic stir bar. The dilution of acid gener-
ates considerable heat and must be done slowly. Wear
rubber gloves, safety glasses, and a lab coat. Be
careful; too much heat can cause the stock bottle to
break, but do not try to cool it with water.
8
9
)
)
79

Procedures:
Immediately after collection, the fresh tissue for starch
analysis should be cooled to -20C (or -80C if available).
Fresh tissue can be stored for months if maintained at -80C.
The tissue is then steamed (at ambient atmospheric pressure)
for 5-10 minutes to denature the native enzymes (Loomis
1985). After steaming the tissue is dried by lyophilization
(approximately 3 days). The tissue is then ground with a
Wiley mill to pass through a 40-mesh screen and stored at -20C
(-80C is preferable) until analyzed.
Place chromic acid-washed 15 ml centrifuge tubes in oven
overnight to ensure that they are completely dry. Cool to
room temperature in a desiccating chamber, then weigh to the
nearest 0.1 mg. Place tissue samples (50-100 mg, preferably
use 100 mg) into the dried, weighed centrifuge tubes. Place
the tubes and samples into the 50C oven overnight to remove
any remaining moisture in the sample. Cool the tubes and
samples to room temperature in the desiccating chamber, then
weigh to the nearest 0.1 mg to obtain the tissue dry weight.
Add 5.0 ml MCW solution (solution #1) to each sample to sus-
pend the tissue (use repipeter if available). Sonicate for
10 seconds (or use Vortex mixer on lowest setting). [These
steps should be done in a hood; wear rubber gloves, safety
glasses, and a lab coat. Chloroform is reported to be car-
cinogenic.]
After 10 minutes at room temperature (20 minutes if vor-
texed), the tubes are centrifuged at llOOg for 10 minutes.
Remove the supernatant by aspiration or by hand using a
Pasteur pipet. Work in the hood and be careful not to
remove any of the tissue sample while aspirating the MCW
solution. Save this solution for analysis of soluble
sugars, if desired. Repeat the extraction with MCW solution
80

81
and centrifugation 2 to 3 more times until the MCW solution
is clear. (Root and stem tissue should be extracted at
least 3 times, needles at least 4 times.) Combine all of
the MCW extracts for the determination of soluble sugars, if
desired. Place the extracted tissue samples in the 50C oven
overnight to evaporate residual NCW.
Remove the tubes from the oven and add 4.0 ml of 0.1 N NaOH
(solution #2). Stopper and mix on the Vortex mixer until
the pellet is broken up and suspended within the solution.
Incubate in the 50C oven for 30 minutes with occasional
swirling. The starch should be solubilized during this pro-
cedure. After 30 minutes the sample solution is neutralized
and adjusted to pH 5.1 by addition of 5.0 ml of 0.1 N acetic
acid (solution #3). The starch is now dissolved in a 0.05 M
sodium acetate (NaOAc) buffer, pH 5.1, and ready for enzyme
digestion.
Add 1.0 ml of the a-amylase/aniyloglucosidase digestion solu-
tion (solution #7) to each of the tubes. Stopper the tubes,
mix the tissue/enzyme solution well (Vortex mixer), and
incubate for 24 hours at 50C to 55C. The tubes should be
checked after reaching the incubation temperature to insure
that no stoppers have been pushed out via thermal expansion.
Occasional mixing during the starch digestion is not neces-
sary, but can be done if desired.
After digestion, mix the sample solutions well (Vortex
mixer), and centrifuge at ilOOg for 10 minutes. Transfer
two 0.5 ml aliquots (to replicate the glucose determinations
and check your precision) of the diluted sample solution to
small test tubes (approximately 10 ml); use 0.05 M NaOAC
buffer, pH 5.1 (solution #5) to prepare the dilutions.
Dilution is necessary to get the sample solutions into the
range of the glucose standard curve. The appropriate dilu-
tion depends on the anticipated amount of starch in the

82
sample: a 1:2 dilution is good for low starch tissue (up to
1.5% starch, i.e. needles), a 1:5 dilution is suitable for
tissue with 1-4.5% starch, a 1:10 dilution is appropriate
for tissues with 4-9% starch, and a 1:20 dilution is suit-
able for high starch tissues (9-18% starch). (Some tissues
with even higher starch content, will require more than a
1:20 dilution. If the sample size is smaller than 100 mg, a
smaller dilution will be needed.) Add 5.0 ml of the glucose
oxidase/peroxidase/o-dianisidine solution (solution #8) to
each 0.5 ml sample aliquot. Stopper, mix well, and incubate
at 37C for 30 minutes. [The temperature must be controlled
carefully, as GOD is inactivated at 39C (Bentley 1955). An
alternative procedure is incubation at room temperature for
45 minutes.] The glucose standards should be treated in the
same manner (two 0.5 ml aliquots of each concentration plus
5.0 ml solution #8).
Transfer the tubes to a cold water bath and rapidly add 1.0
ml 75% sulfuric acid (solution #9) to each tube to stabilize
the color formed (cut off about 1 mm of the pipet tip to
ease the pipetting of the viscous acid). After the tubes
have cooled, stopper, mix well with the Vortex mixer, and
read the absorbance at 525 nm versus a buffer-reagent blank.
Determine the glucose concentration by comparison with the
glucose standard curve run simultaneously (run 10, 20, 40,
60, 80, and 100 ug/ini glucose standards).
The glucose values are converted to starch equivalents by
multiplying the glucose concentration by 0.9 (Pazur 1987).
The starch equivalents are converted to percent dry weight by
dividing by the dry weight of the corresponding tissue sample.
Glucose Standard Curve Solutions:
1) 0.05 M sodium acetate buffer, pH 5.1, with 0.1% benzoic
acid--add 2.84 ml glacial acetic acid to about 900 ml

3
4
)
)
83
ddH2O. Adjust to pH 5.0 with 30% NaOH. Add 1.000 g
benzoic acid and mix until completely dissolved. Then
add a few more drops of 30% NaOH to achieve a final pH
of 5.1. Adjust to 1000 ml with additional ddH2O.
2) 1% glucose solution--dissolve 0.100 g anhydrous glucose
in 10.0 ml 0.05 M NaOAc buffer, pH 5.1, with 0.1% ben-
zoic acid (solution #1).
0.1% glucose solution--mix 5.0 ml 1% glucose solution
(solution #2) with 45.0 ml solution #1.
100 ug/ml glucose standard--mix 10.0 ml 0.1% glucose
(solution #3) with 90.0 ml solution #1.
80 ug/mi glucose standard--mix 8.0 ml 0.1% glucose with
92.0 ml solution #1.
60 ug/mi glucose standard--mix 6.0 ml 0.1% glucose with
94.0 ml solution #1.
40 ug/ml glucose standard--mix 4.0 ml 0.1% glucose with
96.0 ml solution #1.
20 ug/inl glucose standard--mix 2.0 ml 0.1% glucose with
98.0 ml solution #1.
10 ug/mI glucose standard--mix 1.0 ml 0.1% glucose with
99.0 nil solution #1.
Blank--use 0.5 ml aliquots of solution #1.
The glucose solutions should be stored in the refrigerator
and are stable for months (when prepared with benzoic acid).

Appendix B
PURIFICATION OF ANYLOGLUCOSIDASE
Adapted from Pazur et al. 1984, Pazur and Ando 1959.
Solutions:
0.04 M calcium acetate--dissolve 0.352 g calcium
acetate monohydrate (Ca(OAc)2H20) in 50.0 ml deionized
distilled water (ddH2O).
0.1 M citric acid--dissolve 19.21 g anhydrous citric
acid (or 21.014 g monohydrate) in 1000 ml ddH2O.
0.2 M dibasic sodium phosphate--dissolve 28.392 g diba-
sic sodium phosphate (Na2HPO4) in 1000 ml ddH2O. (It's
best to add the phosphate to the water, or large, hard-
to-dissolve clumps will form).
0.1 M citrate/phosphate buffer, pH 8.0--mix 4.7 ml 0.1
M citric acid (solution #2) with 120 ml 0.2 N Na2HPO4
(solution #3). This is only an approximation and may
need adjustment.
0.05 N sodium acetate (NaOAc) buffer, pH 5.1--add 2.84 ml
glacial acetic acid to approximately 900 ml ddH2O. Adjust
the pH to 5.1 with 30% sodium hydroxide (NaOH) and
bring to a final volume of 1000 ml with additional ddH2O.
0.05 M Citrate/Phosphate Buffers:
pH 8.0--mix 19.0 ml 0.1 M citric acid (solution #2),
481 ml 0.2 M Na2HPO4 (solution #3), and 500 ml ddH2O.
(This yields pH 7.98 at room temperature).
84

85
pH 6.0--mix 48.0 ml 0.1 N citric acid (solution #2),
77.0 ml 0.2 M Na2HPO4 (solution #3), and 125 ml ddH2O.
(These volumes are only approximate and may need fur-
ther refinement. Adjust the pH with phosphoric acid if
necessary).
pH 4.0--mix 79.0 ml 0.1 M citric acid (solution #2),
46.0 ml 0.2 M Na2HPO4 (solution #3), and 125 ml ddH2O.
(This should yield pH 4.0 at room temperature, but the
volumes may need minor adjustments.)
Column Preparation:
Pour a 50 cm3 column of prepared DEAE-cellulose (Whatman DE-
32) using vacuum to obtain good packing. [The DEAE-cellulose
should first be prepared using the appropriate buffer (0.05 N
citrate/phosphate, pH 8.0) following the procedures detailed
in Appendix F. An alternative is the use of pre-prepared
DEAE-cellulose (Whatman DE-52), which has been equilibrated
with the desired buffer before use.) The column is poured
in a 60 cm3 disposable syringe barrel. Use two pieces of
Whatinan #4 filter paper at the bottom of the syringe (one
small paper-punch-size piece to cover the central opening,
another piece the size of the syringe barrel on top of the
first), and one piece on top of the packed column (the size
of the syringe barrel).
Wash the column thoroughly with about 500 ml of 0.05 M
citrate/phosphate buffer, pH 8.0 (solution #6), using a
peristaltic pump. Begin washing at a 0.75-1.0 mi/minute
flow rate to ensure good packing of the column. The flow
rate can be increased to about 2 mi/minute after an hour of
washing. The column can be stored overnight at room
temperature if the system is tightly closed to prevent
column desiccation.

Enzyme Preparation:
Dissolve 5.0 g of the crude amyloglucosidase (from
Aspergillus niger, lyophilized powder, Sigma no. A-3423 or
equivalent) in 50 ml ddH2O. Filter through Whatman #4 f ii-
ter paper. Rinse beaker with 2-5 ml ddH2O, and pour through
the funnel to rinse it.
Add 10.0 ml of 0.04 M calcium acetate (solution #1) to the
filtrate and mix well. [The Ca2 ion stabilizes the amy-
loglucosidase and causes the precipitation of some protein
impurities (Pazur 1987).) Centrifuge at llOOg for 10 min-
utes. Decant the supernatant into prepared dialysis tubing
and dialyze versus ddH2O for 24 hours or overnight in the
refrigerator (see Appendix G for preparation of dialysis
tubing). Discard filter paper and precipitate.
Enzyme Separation:
Wash the column with an additional 100 ml of 0.05 N
citrate/phosphate buffer, pH 8.0 (solution #6), immediately
prior to enzyme application. Allow the buffer to run down
to the top of the column before applying the enzyme solu-
tion, but do not allow the column to run dry (or it may need
to be discarded).
Mix the dialyzed amyloglucosidase solution with an equal
volume of 0.1 M citrate/phosphate buffer, pH 8.0 (solution
#4). Carefully layer the amyloglucosidase solution onto the
top of the column with a Pasteur pipet to establish a small
reservoir of solution to buffer the drops. Apply the
remaining enzyme solution to the column using the pen-
staltic pump and a 0.75 ml/minute flow rate. A slow flow
rate during application is essential for proper bonding of
the enzyme to the column matrix (Cooper 1977).
86

87
After all of the amylogiucosidase solution has been applied
to the column, run it down to the top of the column. Layer
0.05 M citrate/phosphate buffer, pH 8.0 (solution #6), onto
the top of the column using a Pasteur pipet. Then wash the
column with 250 ml of this solution using a 2 mi/minute flow
rate (all further elution of the column will be done using a
2 mi/minute flow rate). This will elute the
glucotransferase and an a-amyiase that are present in the
enzyme mixture.
After washing the column with solution #6, let the solution
run to the top of the column as before. Using a Pasteur
pipet, layer 0.05 M citrate/phosphate buffer, pH 6.0
(solution #7), onto the column. Wash the column with 250 mlof this buffer. The first 140 ml of eluate after switching
to pH 6.0 may be discarded. At that point (about 70 minutes
after application of the pH 6.0 buffer), collect the next 80
ml of eluate (approximately 40 minutes of running); this is
the amyloglucosidase II fraction.
After elution with solution #7 is complete, run the solution
to the top of the column, and switch to 0.05 M
citrate/phosphate buffer, pH 4.0 (solution #8), as before.
The first 100-110 ml (about 50-55 minutes of running) of
eluate after switching to pH 4.0 may be discarded. At that
point collect the next 100 ml of eluate (approximately 50
minutes of running); this is the amyloglucosidase I fraction
and the bulk of the crude enzyme preparation. After elution
of this fraction the separation is complete and the column
may be discarded.
Final Amyloglucosidase Purification:
The amyloglucosidase is further purified by acetone precipi-
tation. Cool the amyloglucosidase II fraction to near
freezing, then adjust to pH 4.0 with phosphoric acid; this

88
is the isoelectric point of amyloglucosidase II. Mix with
an equal volume (80 ml) of ice cold (-2CC) acetone, and
readjust to pH 4.0 (acetone affects the pH). Cover the
solution and place in -20C freezer for a few hours or
overnight to aid precipitation.
Recover the amyloglucosidase II by centrifuging at 1100 g
for 10 minutes; discard the supernatant. Suspend the pre-
cipitate in a small amount of 0.05 M NaOAc buffer, pH 5.1
(solution #5), and transfer to a plastic test tube. Assay
the solution for activity (see procedure in Appendix D),
then place in -20C freezer for storage.
Cool the amyloglucosidase I fraction to near freezing and
adjust to pH 3.5, the isoelectric point of aiuyloglucosidase
I, with phosphoric acid. Mix with an equal volume (100 ml)
of ice cold acetone, and readjust to pH 3.5. Cover and
place the solution in -20C freezer for a few hours or
overnight, as above. Recover the amyloglucosidase I by cen-
trifugation as above, and suspend in 0.05 N NaOAc, pH 5.1
(solution #5). After assaying for activity (Appendix D),
store the solution in a plastic tube in -20C freezer until
needed.

2
3
)
)
89
Appendix C
PURIFICATION OF a-AHYLASE
Adapted from Takagi et al. 1971, Toda and Akabori 1963,
Tsugita et al. 1959.
Solutions:
1) 0.1 M sodium acetate buffer, pH 7.5--dissolve 4.0 g
sodium hydroxide (NaOH) in 950 ml deionized distilled
water (ddH2O). Adjust to pH 7.5 with glacial acetic
acid (HAc). [The pH will decrease very slowly during
the addition of the first 5 ml, but will then change
rapidly. Be careful not to overshoot the desired pH.)
Bring to 1000 ml total volume with additional ddH2O.
0.2 M sodium acetate buffer, pH 7.5--dissolve 4.101 g
anhydrous sodium acetate (NaOAc) in 250 ml ddH2O.
Adjust to pH 7.5 with 10% glacial acetic acid; approxi-
mately 2-3 drops will be needed.
0.4 M sodium acetate buffer, pH 7.5--dissolve 8.203 g
anhydrous NaOAc in 250 ml ddH2O. Adjust to pH 7.5 with
10% glacial acetic acid; approximately 5-6 drops will
be required.
0.25 M calcium acetate--dissolve 2.20 g calcium acetate
monohydrate (Ca(OAc)2H20) in 50.0 ml ddH2O.
1.0 M sodium hydroxide--dissolve 10.0 g sodium hydrox-
ide (NaOH) in 250 ml ddH2O.
0.05 M sodium acetate (NaOAc) buffer, pH 5.1--add 2.84
ml glacial acetic acid to approximately 900 ml ddH2O.

90
Adjust to pH 5.1 with 30% sodium hydroxide (NaOH) and
bring to a final volume of 1000 ml with additional
ddH2O.
Column Preparation:
Pour a 50 cm3 column of prepared DEAE-cellulose (Whatman DE-
32), using vacuum to obtain good packing. [The DEAE-cellu-
lose should first be prepared using the appropriate buffer
(0.1 M NaOAc, pH 7.5), following the procedures detailed in
Appendix F. An alternative is the use of pre-prepared DEAE-
cellulose (Whatman DE-52), which has been equilibrated with
the desired buffer before use.) The column is poured in a
60 cm3 disposable syringe barrel. Use two pieces of Whatman
#4 filter paper at the bottom of the syringe (one small
paper-punch-size piece to cover the central opening, another
piece the size of the syringe barrel on top of the first),
and one piece on top of the packed column (the size of the
syringe barrel).
Wash the column thoroughly with about 500 ml of 0.1 N sodium
acetate buffer, pH 7.5 (solution #1), using a peristaltic
pump. Begin washing at a flow rate of 0.75-1.0 ml/xninute to
ensure good packing of the column. The flow rate can slowly
be increased to 2.0 ml/minute after an hour of washing. The
column can be stored overnight at room temperature if the
system is tightly closed to prevent column desiccation.
Enzyme Preparation:
Dissolve 2.000 g a-amylase powder (from Aspergillus oryzae,
crude preparation type X-A, Sigma no. A-0273 or equivalent)
in 10.0 nil ddH2O in a small beaker, using a stainless steel
spatula. This takes quite a while and a lot of stirring,
but it all will eventually go into solution.

91
Add 10.0 ml of 0.25 M calcium acetate (solution #4) to the
a-amylase solution and mix thoroughly. Filter through Whatinan
#4 filter paper. Rinse the beaker with a few drops of ddH2O
and pour this through the filter paper to rinse it.
Transfer the filtered enzyme solution to prepared dialysis
tubing and dialyze versus ddH2O overnight in the refrigera-
tor (see preparation procedure in Appendix G). Discard the
filter paper and precipitate.
Enzyme Separation:
Wash the column with an additional 100 ml of 0.1 M NaOAc
buffer, pH 7.5 (solution #1), at a 2 ml/minute flow rate
before applying the enzyme solution. Allow the buffer to
run down to the top of the column before applying the enzyme
solution, but do not allow the column to run dry (or it may
need to be discarded).
Remove the enzyme solution from the dialysis tubing and
determine its volume. Add sufficient anhydrous sodium
acetate powder to the enzyme solution to yield a final con-
centration of 0.1 M NaOAc [i.e. for 30 ml of enzyme solu-
tion, add 0.246 g anhydrous NaOAc]. The pH of this solution
will be about 6.6, and should be adjusted to 7.5 by the
addition of 1 M NaOH (solution #5); about 2-3 drops will be
required.
The a-amylase solution should be carefully layered onto the
top of the column with a Pasteur pipet to establish a small
reservoir of solution (7-10 ml) to buffer the falling drops.
Be careful not to disturb the surface of the column. Apply
the remaining enzyme solution via the peristaltic pump,
using a 0.75 ml/minute flow rate. A slow flow rate during
application is essential for proper bonding of the enzyme to
the column matrix (cooper 1977).

92
After all of the enzyme solution has been applied to the
column, run it down to the top of the column. Carefully
layer 0.1 N NaOAc buffer, pH 7.5, onto the column using a
Pasteur pipet. Reattach the peristaltic pump and wash the
column with 200-250 ml of solution #1 using a 2 mi/minUte
flow rate. [All further elution of the column will be done
at this flow rate.) This will elute some of the undesirable
compounds from the column.
After washing the column with solution #1, let the buffer
run down to the top of the column as before. Using a Pas-
teur pipet, layer 0.2 N NaOAc buffer, pH 7.5 (solution #2),
onto the top of the column. Wash the column with about 200
ml of this buffer. This buffer will elute an amyloglucosi-
dase from the column (Fleming 1968).
After washing with solution #2, run the solution to the top
of the column, and switch to 0.4 N NaOAc buffer, pH 7.5
(solution #3), as before. The first 30 ml of eluate follow-
ing the switch to solution #3 should be discarded. Collect
the next 75 ml of eluate; this contains the a-amylase, and
the bulk of the activity of the crude enzyme mixture. Upon
elution of this fraction, the separation is complete and the
column may be discarded.
Final a-Amylase Purification:
Add the appropriate amount of calcium acetate monohydrate to
the a-ainylase solution to yield a final concentration of
0.025 M (add 0.331 g Ca (OAc)2H20 to 75 ml a-amylase solu-
tion). [The Ca2 ion is essential for the stability of a-
amylase (Allen and Spradlin 1974, Robyt and Whelan 1968).)
After solubilization of the Ca(OAc)2H20, adjust the solu-
tion to pH 4.2, the isoelectric point of a-amylase, by
addition of glacial acetic acid.

93
Precipitate the a-amylase by the addition of ice cold ace-
tone to a final concentration of 60% (add 113 ml of acetone
to the a-amylase solution). Further addition of glacial
acetic acid will be required to readjust the pH to 4.2 after
adding the acetone. Cover with parafilin and place the solu-
tion in -20C freezer for a few hours to aid precipitation.
Recover the a-ainylase by centrifugation at 1100 g for 10
minutes. Discard the supernatant.
Suspend the precipitate in 0.05 N sodium acetate buffer, pH
5.1 (solution #6), to which a tiny pinch of sodium chloride
(NaC1) has been added. [The chloride ion is essential for
maximum a-amylase activity (Robyt and Whelan 1968).] Trans-
fer the a-amylase suspension to plastic tubes. Assay the
solution for activity (see procedure in Appendix E), then
store in -20C freezer until needed.

Appendix D
AMYLOGLUCOSIDASE ASSAY
Adapted from Sigma Diagnostics 1984, Pazur et al. 1971.
Solutions:
1. 0.05 M sodium acetate (NaOAc) buffer, pH 5.1--mix 2.84
ml glacial acetic acid with approximately 900 nil deion-
ized distilled water (ddH2O). Adjust to pH 5.1 at room
temperature with 30% sodium hydroxide (NaOH) and bring
to a final volume of 1000 ml with additional ddH2O.
2) 0.21 mM o-dianisidine/0.05 M NaOAc buffer, pH 5.1--dis-
solve 13.2 mg o-dianisidine dihydrochioride in 2.0 ml
ddl-120 (this solution is stable for about three months
in the refrigerator). Mix 1.0 ml of this solution with
99.0 ml 0.05 M NaOAc, pH 5.1 (solution #1). This final
solution is stable for up to one month if stored in a
brown bottle in the refrigerator.
1% starch solution--dissolve 0.100 mg soluble potato
starch in 10.0 nil 0.05 N NaOAc, pH 5.1 (solution #1).
Bring the solution to a gentle boil while continuously
stirring with a magnetic stir bar. The final solution
should be translucent with a slight whitish tint. Cool
to room temperature and return to 10.0 ml total volume,
if necessary.
4) Glucose oxidase (GOD)/peroxidase (POD) solution--dis-
solve the appropriate amount of GOD and POD in 0.05 M
NaOAc, pH 5.1 (solution #1). [See the assay on the
bottle label. The approximate amounts needed are 1 mg
glucose oxidase (from Aspergillus niqer, type X, Sigma
94
3 )

95
no. G-8135 or G-7l4l) per 2 ml of solution and 1 mg
peroxidase (from horseradish, type II, Sigma no. P-
8250) per 3 ml of solution.] A final concentration of
50-60 units of each enzyme per ml is desired. Make 2-4
ml of this solution; it is stable for at least 3 months
if stored in the refrigerator.
5) Amyloglucosidase solution--prepare a dilution of the
amyloglucosidase sample to be assayed using solution
#1, containing 0.5-1.0 units/mi. Start with a 1:10
dilution and dilute further as needed.
Assay Procedure:
In a 3 ml optical glass cuvette (Markson #i-G-iO or equiva-
lent), or small test tube if using spectrophotometer with
sipper, mix 2.40 ml 0.21 mM o-dianisidine solution (solution
#2), 0.50 ml 1% starch solution (solution #3), and 0.10 ml
of the glucose oxidase/peroxidase solution (solution #4).
This solution will stain the cuvettes, but can be cleaned
with methanol, ethanol, or a sodium hydroxide solution.
After mixing thoroughly, equilibrate at 25C (or room temper-
ature) and check the absorbance at 500 nm to ascertain that
it is steady, then calibrate the spectrophotometer with the
solution.
At time 0, add 0.10 ml of the ainyloglucosidase solution
(solution #5) to the above mixture. Mix well by vortexing
or inversion and place the cuvette into the spectrophotome-
ter. Follow the increase in absorbance at 500 nm over 10-15
minutes, recording the A500 at 15-20 second intervals.
Dilute the enzyme solution further, if necessary, so that
the rate of increase in absorbance is linear (concentrated
enzyme solutions exhibit exponential rate increase). Use the

96
maximum linear rate of absorbance increase to calculate the
activity.
There is a 1:1 ratio of o-dianisidine oxidized to D-glucose
liberated from starch.
uN units/mi amyloglucosidase solution =
(A500/ininute) (3.1 ml) (dilution factor)/(7.5) (0.1 ml)
Where: 3.1 ml = volume of assay mixture
0.1 ml = volume of ainyloglucosidase solution in
assay mixture
7.5 = mM extinction coefficient for oxidized
o-dianisidine
dilution factor = 200, for 1:200 dilution
(and so forth)
IU units amyloglucosidase/mi =
(uX units/mi) (0.18 mg/uM glucose)
Where: molecular weight of glucose = 180.16 g/mole

Appendix E
a-AMYLASE ASSAY
Adapted from the Worthington Manual 1977, Bernfeld 1951.
Solutions:
1) 0.02 N sodium phosphate buffer, pH 6.9, with 0.006 M
sodium chloride--dissolve 2.839 g dibasic sodium phos-
phate (Na2HPO4) and 0.351 g sodium chloride (NaC1) in
950 ml deionized distilled water (ddH2Q). Adjust to pH
6.9 with 1 N hydrochloric acid (HC1), and bring to a
final volume of 1000 ml with additional ddH2O. This
solution is stable for at least a year if kept refrig-
erated.
2 N sodium hydroxide--dissolve 8.000 g sodium hydroxide
(NaOH) in 100 ml ddH2Q. This solution is stable for
years at room temperature.
3,5-dinitrosalicylic acid reagent--dissolve 1.000 g
3,5-dinitrosalicylic acid in 20.0 ml 2 N NaOH (solution
#2). Add the dye slowly while stirring vigorously with
a magnetic stir bar. Dissolving the dye can be aided
by adding up to 50 ml ddH2o. When the dye is com-
pletely solubilized, add 30.0 g potassium sodium
tartrate tetrahydrate (Rochelle salt) slowly, while
continuously stirring. After complete solubilization,
bring the total volume of the solution to 100 ml with
additional ddH2o. Flush the flask with nitrogen gas
(N2) and rapidly cover tightly with parafilm to exclude
carbon dioxide (CO2), which causes rapid decomposition
of the dye [this step is unnecessary if the solution
will be used immediately and then discarded]. This
2
3
)
)
97

4 )
98
solution is stable for up to 2 weeks if kept covered
and stored in the refrigerator.
1% starch solution--dissolve 0.500 g soluble starch in
50.0 ml 0.02 M sodium phosphate buffer, pH 6.9, with
0.006 M NaC1 (solution #1). Bring to a gentle boil
while continuously stirring with a magnetic stir bar.
The final solution should be translucent, with a slight
whitish tint. Cool to room temperature and return to
50.0 ml total volume with ddH2O, if necessary.
5) a-amylase solution--a concentration of 100-250 units a-
amylase per ml of solution is needed for this assay.
At least three concentrations within this range are
required for accurate determination of the a-amylase
activity, so prepare a range of dilutions (i.e. 1:10,
1:50, 1:100, 1:500, 1:1000) for each enzyme preparation
to be assayed; use solution #1 to prepare the dilu-
tions.
Maltose Standard Curve:
100 inN maltose stock solution--dissolve 0.360 g maltose
monohydrate in 10.0 ml solution #1. This solution is stable
for several weeks if stored covered in the refrigerator.
10 inN maltose standard--mix 1.0 ml 100 inN maltose stock with
9.0 ml solution #1. Prepare two 1.00 ml aliquots for the
standard curve.
7.5 inN maltose standard--mix 750 ul 10 inN maltose standard
with 250 ul solution #1. Prepare two 1.00 ml aliquots.
5.0 inN maltose standard--mix 500 Ui. 10 inN maltose standard
with 500 ul solution #1. Prepare two 1.00 ml aliquots.

99
2.5 mM maltose standard--mix 250 ul 10 inN maltose standard
with 750 ul solution #1. Prepare two 1.00 ml aliquots.
1.0 mM maltose standard--mix 100 ul 10 inN maltose standard
with 900 ul solution #1. Prepare two 1.00 ml aliquots.
0.0 inN maltose standard (blank)--use two 1.00 ml aliquots of
solution #1.
Assay Procedure:
Transfer 0.50 ml aliquots of the enzyme dilutions prepared
above to large test tubes (>12 ml capacity). It is best to
run duplicates of each enzyme dilution. Also run a blank
containing 0.5 ml of solution #1. Equilibrate all tubes at
25C (room temperature is okay).
At timed intervals [10 sec is good; 5 sec is too short for
pipetting], add 0.50 ml 1% starch solution (solution #4) to
each tube containing an enzyme dilution (and the solution #1
blank), and mix well on a Vortex mixer. [Cut about 1 mm of
the pipet tip off to increase the bore and allow faster
transfer of the solutions.]
Incubate the tubes at 25C (or room temperature) for exactly
3 minutes. Then, at the same timed interval as before,
sequentially add 1.00 ml of the 3,5-dinitrosalicylic acid
(DNS) reagent to each tube. The DNS reagent should be at
the same temperature as the enzyme/starch solutions.
Immediately mix the solutions thoroughly on a Vortex mixer;
this stops the enzyme reaction.
At this point, add 1.00 ml of the DNS reagent to each of the
tubes comprising the maltose standard curve and mix thorough-
ly. [The maltose standard curve should be run in duplicate--

100
run 2 tubes of each maltose concentration, each containing
1.00 ml of the appropriate maltose solution.]
Incubate all of the tubes in a boiling water bath for 5
minutes (boil all of the tubes at once, if possible, to
ensure the same amount of time in the water bath for all
tubes). Cool the tubes to room temperature, and add 10.0 ml
of ddH2O to each tube (use a repipeter, if available). Nix
the contents thoroughly using a Vortex mixer and/or tube
inversion. Nothing in this assay is extremely harmful, so
general safety procedures are adequate.
Determine the absorbance of each tube at 540 nm using the
0.0 inN maltose standard as the blank. It may be necessary
to correct for absorption due to the starch solution, by
subtracting the absorbance of the buffer/starch blank from
the absorbances of the enzyme solutions (not the maltose
standard curve). However, the absorbance of the starch
solution is usually negligible and generally can be ignored.
The liberation of maltose (in umoles) by the enzyme solu-
tions is determined from the maltose standard curve using
linear regression analysis. A maltose standard curve must
be processed each time the assay is performed, concurrently
with the enzyme preparations.
units/mi a-ainyiase solution = (umoles maltose liberated)
(dilution factor)/(0.5 ml)(3 minute)
Where: 0.5 ml = volume of enzyme solution used
3 minutes = time allowed for starch digestion
dilution factor = 100, for 1:100 dilution
(and so forth)

Appendix F
PREPARATION OF DEAE-CELLULOSE
Adapted from McDonald 1985, cooper 1977.
Solutions:
0.5 N sodium hydroxide--dissolve 60.000 g sodium
hydroxide (NaOH) in 3000 ml deionized distilled water
(ddH2O).
0.5 N hydrochloric acid--add 64.7 ml 36% (11.6 N)
hydrochloric acid (HC1) to 1435 ml ddH2O.
0.2 N sodium acetate buffer, pH 7.5--dissolve 12.303 g
anhydrous sodium acetate (NaOAc) in 750 ml ddH2O.
Adjust to pH 7.5 with 10% glacial acetic acid (HAc);
approximately 6 drops will be required.
0.1 N sodium acetate buffer, pH 7.5, with 0.1% sodium
azide--dissolve 2.051 g anhydrous NaOAc in 250 ml
ddH2O, and adjust to pH 7.5 with approximately 1 drop
of 10% HAc. Add 0.250 g sodium azide (NaN3) and stir
to dissolve.
0.1 N citrate/phosphate buffer, pH 8.0--dissolve 0.548
g anhydrous citric acid and 20.485 g dibasic sodium
phosphate (Na2HPO4) in 750 ml ddH2O.
0.05 M citrate/phosphate buffer, pH 8.0 with 0.1%
sodium azide--dissolve 0.091 g anhydrous citric acid
and 3.414 g Na2HPO4 in 250 ml ddH2O. Add 0.250 g NaN3
and stir to dissolve.
101
3
4
)
)

Procedure:
Suspend 100 g dry DEAE-cellulose powder (Whatman DE-32) in
approximately 1500 ml of 95% ethanol in a large beaker.
Gently stir the slurry occasionally with a glass stirring
rod (DEAE-cellulose fragments easily, so stirring should be
kept to a minimum). After 30 minutes filter the slurry
through a large Buchner funnel (using Whatinan qualitative
filter paper #1 or #4) to remove the ethanol.
Suspend the DEAE-cellulose in 1500 ml 0.5 N NaOH and stir
occasionally for 1 hour. Filter the slurry as before, and
wash extensively in the funnel with tap water.
Suspend the DEAE-cellulose in 1500 ml 0.5 N HC1 and stir
occasionally for 30 minutes. Filter as before and wash
extensively with tap water.
Suspend the DEAE-cellulose in 1500 ml 0.5 N NaOH and stir
occasionally for 30 minutes. Filter as before and wash with
tap water until the pH is reduced to 8.0.
At this point the DEAE-cellulose is ready to be equilibrated
with the initial buffer to be used in the enzyme purifica-
tion procedure. Suspend half of the material in 750 ml 0.2
M NaOAC buffer, pH 7.5 (solution #3; for the purification of
a-amylase), and the other half in 750 ml 0.1 M
citrate/phosphate buffer, pH 8.0 (solution #5; for the
purification of ainyloglucosidase). [A concentrated buffer
is used for the equilibration of the DEAE-cellulose.] Stir
the suspensions gently for at least 3 hours while monitoring
the pH. Maintain the pH at its initial level (7.5 or 8.0)
by the addition of the appropriate acid solution (acetic or
citric), if necessary.
102
103
After the pH has stabilized, quit stirring and allow the
DEAE-cellulose to settle. Any fines that have been gener-
ated during the procedure will float to the top of the
slurry and should be removed at this time by aspiration, or
with a Pasteur pipet. Filter the slurries as before, and
wash with tap water.
Re-suspend the DEAE-cellulose in approximately 150 ml of the
appropriate buffer containing 0.1% NaN3 (solutions #4 and
#6). The slurry should again be allowed to settle and any
fines removed as before. For proper column packing, the
excess buffer after settling of the ion exchanger should be
approximately 20% of the total volume. Add additional
buffer if necessary. Store the prepared DEAE-cellulose at
4C until ready to use. Resuspend the DEAE-cellulose before
pouring the column.

Appendix G
PREPARATION OF DIALYSIS TUBING
Adapted from McDonald 1985, Cooper 1977.
Solutions:
5mM (ethylenedinitrilo) -tetraacetic acid--dissolve
1.396 g (ethylenedinitrilo)-tetraacetic acid disodium
salt (EDTA) in 750 nil deionized distilled water
(ddH2O).
1 M sodium hydroxide--dissolve 10.0 g sodium hydroxide
(NaOH) in 250 ml ddH2O.
Procedure:
Cut the dry dialysis tubing into short lengths appropriate
for the amount of solution to be dialyzed. Moisten one end
of the tubing and tie it into a double knot. Be gentle or
the tubing may be damaged.
In a 1000 ntl wide-mouthed Erlenmeyer flask, bring the 5mM
EDTA solution (solution #1) to a boil while stirring slowly
with a magnetic stir bar. Adjust the solution to pH 8.0
with 1 M NaOH (solution #2); about 6 ml will be needed.
Add the pieces of dialysis tubing to the boiling 5 mM EDTA
solution, pH 8.0, and boil for 15 minutes with occasional
stirring (use a long glass stirring rod). Be careful not to
damage the tubing.
104
All further handling of the tubing should be done while
wearing rubber gloves. This protects the boiled dialysis
105
tubing from contamination by protease enzymes on your hands.
Rinse the tubing thoroughly with tap water. Follow this
with a thorough rinsing in ddH2O.
Store the prepared dialysis tubing in ddH2O in the refriger-
ator (4C). If kept covered and well-hydrated, the prepared
tubing will remain in good condition for a year or more.


