
Portland State University Portland State University
PDXScholar PDXScholar
Dissertations and Theses Dissertations and Theses
Fall 1-1-2015
Nonlinear Analysis and Digital Pre-Distortion of the Nonlinear Analysis and Digital Pre-Distortion of the
SC-FDMA Signals in LTE Uplink System SC-FDMA Signals in LTE Uplink System
Changwen Zhu Portland State University
Follow this and additional works at: https://pdxscholar.library.pdx.edu/open_access_etds
Part of the Electrical and Computer Engineering Commons
Let us know how access to this document benefits you.
Recommended Citation Recommended Citation Zhu, Changwen, "Nonlinear Analysis and Digital Pre-Distortion of the SC-FDMA Signals in LTE Uplink System" (2015). Dissertations and Theses. Paper 2105. https://doi.org/10.15760/etd.2103
This Thesis is brought to you for free and open access. It has been accepted for inclusion in Dissertations and Theses by an authorized administrator of PDXScholar. Please contact us if we can make this document more accessible: [email protected].
Nonlinear Analysis and Digital Pre-Distortion of the SC-FDMA Signals in LTE
Uplink System
by
Changwen Zhu
A thesis submitted in partial fulfillment of the
requirements for the degree of
Master of Science
in
Electrical and Computer Engineering
Thesis Committee:
Fu Li, Chair
Xiaoyu Song
James E. Morris
Portland State University
2014
i
Abstract
Single-carrier frequency division multiple access (SC-FDMA) has become a popular
alternative to orthogonal frequency division multiple access (OFDM) in multi-user
communication on LTE uplink systems. This is primarily due to the low peak-to-
average power ratio (PAPR) of SC-FDMA compared to that of OFDM. Long-term
evolution (LTE) uses SC-FDMA on the uplink to exploit this PAPR advantage to
reduce transmit power amplifier (PA) back-off in mobile user terminals. However, the
latest generation of communication systems requires high power efficiency and a large
quantity of capacity in transmitting mobile data, bringing out some other critical
problems: 1) the nonlinearity of Radio Frequency (RF) power amplifiers inevitably
affects the power efficiency. Working beyond the saturation point is the main reason
for power amplifiers having nonlinear properties; 2) In order to obtain adequate
capacity, wide bandwidth is applied to the latest communication systems. Since in
previous systems the pre-distorter would focus on memory-less distortion with
relatively narrow bandwidth, this change makes memory distortion become a serious
issue, degrading the transmission quality in the wireless communication systems.
The intent of this thesis is to present nonlinear analysis of the SC-FDMA Spectrum
with the RF power amplifier. Relevant mathematical models were considered and
applied to the RF power amplifier in terms of intermodulation products and the third-
order intercept point. The equivalent mathematical model is applied for the first time
to SC-FDMA signals and with the previous formulation of the PA model, the
derivation of the expressions for spectrum regrowth of amplified SC-FDMA signals
ii
was first established and finally simulated with Matlab software. The digital pre-
distortion (DPD) technology was also applied to SC-FDMA signals for the first time
in this thesis. An inverse intermodulation and Autoregressive Moving-Average (IM-
ARMA) model was introduced to linearize the PA distortion with memory in the LTE
uplink system. The DPD was finally implemented by Matlab R2010b.
Conclusions are drawn that amplified power emission levels can be expressed by the
form of third-order intercept point (IP3). The expressions for spectrum regrowth of
amplified SC-FDMA signals have been verified for the first time with the comparison
of simulation, measurement and calculation results. The effects of third order
intermodulation have a greater impact than higher order components with respect to
out-of-band emission power levels. Furthermore, the DPD algorithm reduced the
spectrum regrowth of SC-FDMA signals by 12 dB. The proposed pre-distorter can
effectively solve the distortion problem caused by the memory effect in RF power
amplifier.

iii
Acknowledgements
I feel so fortunate to have all kinds of support from many helpful people. I would like
to express the deepest appreciation to my advisor and thesis committee chair,
Professor Fu Li, for his constant support, encouragement, enthusiasm, and patience in
guiding this research. He introduced me to the various aspects of wireless
communication systems, and helped me to find this exciting research topic. Without
his invaluable probing comments and insightful suggestions this thesis would not have
been possible.
I owe special thanks to Professor Xiaoyu Song and Professors James Morris, for their
guidance and support as the members of the thesis committee. My appreciation should
also be given to Xiao Li, the Ph.D student in our video image processing group, who
provided me the academic quest during the whole time.
My special thanks to my friends in Portland: Ming Shen, Qi Li, Siyuan Yan, Bosi
Chen and Peng Gao. My special thanks also to my friends in the US, UK and China:
Boyang Lu, Linqing Luo, Danjun Xu, Dapeng Yuan, Xuanzi Xia, Yujing Zhang,
Yunwei Wu and Dan Wu.
This thesis is dedicated to my parents Bingguo Zhu and Min Jin, and my grandparents,
for their constant and unconditional support and love. They are my first mentors who
nurtured my growth and instilled in me righteous values for living.
iv
Table of Contents
Abstract ............................................................................................................................ i
Acknowledgements ....................................................................................................... iii
List of Tables ................................................................................................................. vi
List of Figures ............................................................................................................... vii
Chapter 1 Introduction .................................................................................................... 1
1.1 A Statement of the Problem .................................................................................. 1
1.2 Review of Literature ............................................................................................. 2
1.3 Contributions of This Thesis ................................................................................. 2
1.3.1 Nonlinear Analysis of SC-FDMA Spectrum ................................................. 2
1.3.2 The Digital Pre-Distortion of SC-FDMA Spectrum ...................................... 3
Chapter 2 Nonlinear Analysis of SC-FDMA Spectrum for LTE Up-link ...................... 4
2.1 Power Amplifier Model ........................................................................................ 4
2.1.1 Nonlinearity of Power Amplifiers .................................................................. 4
2.1.2 Traditional Memory-less Model .................................................................... 5
2.1.2.1 Intermodulation Products (𝐼𝑀𝑃𝑛) ........................................................... 6
2.1.2.2 Third-order Intercept Point (𝐼𝑃3) ............................................................ 8
2.1.2.3 Fifth-order Intercept Point (𝐼𝑃5) ........................................................... 10
2.1.3 RF Power Amplifier’s Mathematical Model ................................................ 11
2.1.3.1 Mathematical Model of with 𝐼𝑃3 only .................................................. 11
2.1.3.2 Mathematical Model of with 𝐼𝑃3 and 𝐼𝑃5 ............................................ 12
2.2 SC-FDMA Signals .............................................................................................. 12
2.2.1 Basics of SC-FDMA Signals ....................................................................... 13
2.2.2 The Equivalent Mathematical Model of SC-FDMA signals ........................ 14
2.3 Spectrum Regrowth of Amplified LTE Uplink Signals ..................................... 16
Chapter 3 The Digital Pre-Distortion of the SC-FDMA Signals in LTE Up-link
System .......................................................................................................................... 19
3.1 Pre-Distortion Review ........................................................................................ 19
3.2 Spectrum Regrowth Analysis with Pre-Distortion ............................................. 20
v
3.2.1 Block A: The Nonlinear Model .................................................................... 21
3.2.2 Block C: The Memory Effect Model ........................................................... 21
3.2.3 Block B: The Inverse Polynomial of PA ...................................................... 23
3.2.4 Block D: The Inverse Memory Effect of PA ............................................... 23
Chapter 4 Analysis and Experimental Study of SC-FDMA Signals ............................ 25
4.1 SC-FDMA Spectrum for LTE Up-link System .................................................. 25
4.1.1 SC-FDMA Spectrum with 𝐼𝑃3 only ............................................................ 28
4.1.2 SC-FDMA Spectrum with both 𝐼𝑃3 and 𝐼𝑃5 .............................................. 29
4.2 The Digital Pre-Distortion of the SC-FDMA Signals ........................................ 30
Chapter 5 Concluding Remarks .................................................................................... 33
References .................................................................................................................... 34

vi
List of Tables
Table 2.1 Intermodulation distortion products in a Two-Tone System .......................... 7
Table 2.2 Parameters applied in two-tone system .......................................................... 7
Table 2.3 Parameters applied in the simulation math model ........................................ 15
Table 4.1 Experimental Instruments ............................................................................. 27
vii
List of Figures
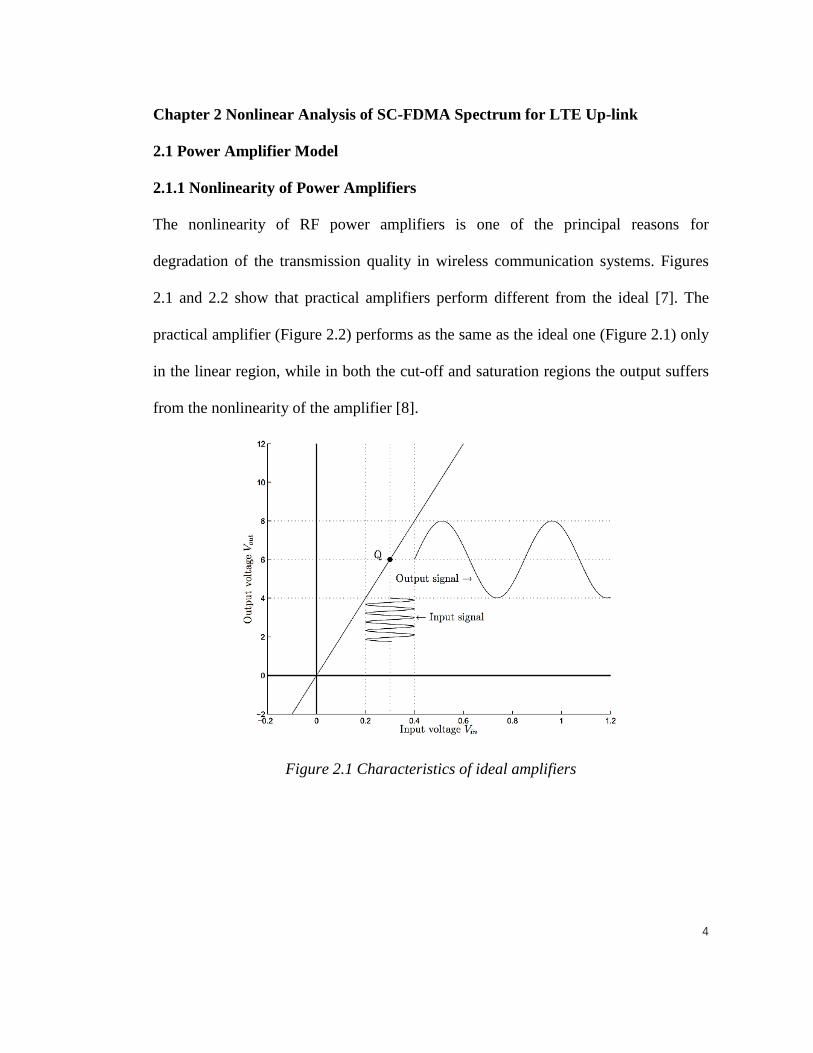
Figure 2.1 Characteristics of ideal amplifiers ................................................................. 4
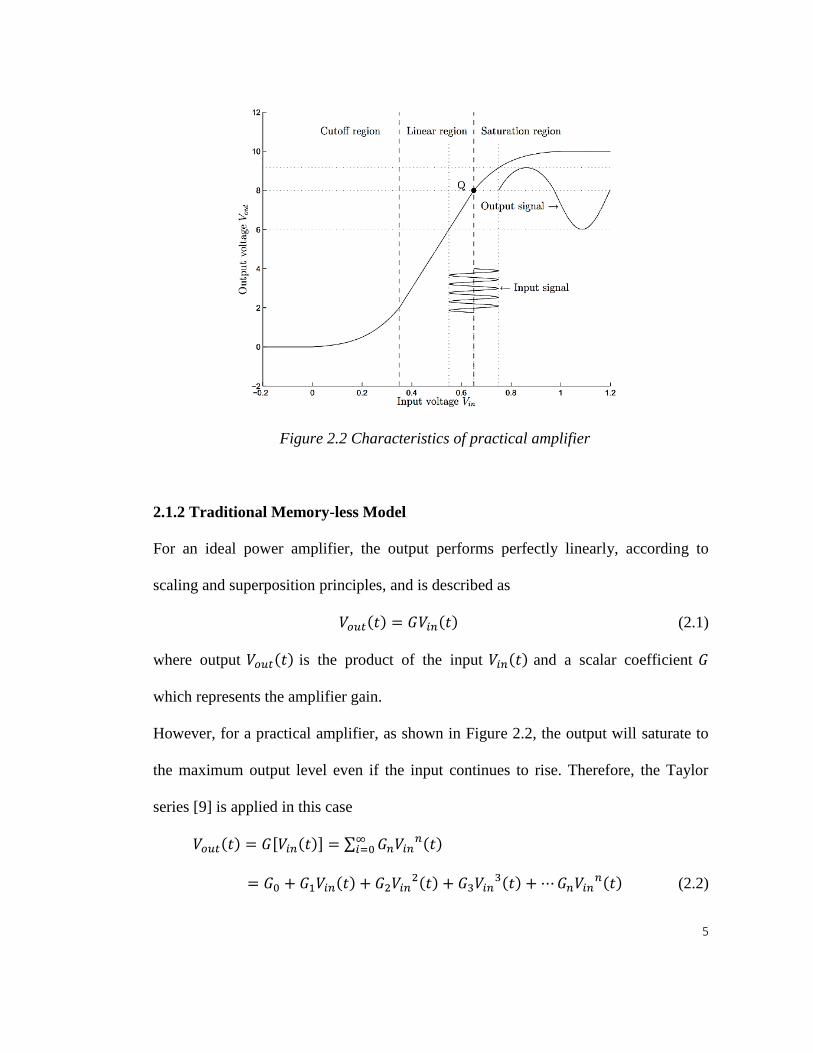
Figure 2.2 Characteristics of practical amplifier ............................................................ 5
Figure 2.3 Spectrum of Products in the two-tone system ............................................... 8
Figure 2.4 The definition of third-order intercept point ................................................. 9
Figure 2.5 Two-tone test for the third-order intermodulation ...................................... 10
Figure 2.6 Two-tone test for the fifth-order intermodulation ....................................... 11
Figure 2.7 Transmitter and receiver of OFDM & SC-FDMA systems ........................ 13
Figure 2.8 CCDF of PAPR of OFDM and SC-FDMA signals .................................... 14
Figure 2.9 Power spectrum comparison among simulation, measurement and
calculation results of baseband SC-FDMA signal ........................................................ 16
Figure 3.1 The Structure of DPD process..................................................................... 20
Figure 4.1 The flow chat of simulation process ........................................................... 26
Figure 4.2 Experimental setup of spectrum measurement of SC-FDMA signals ........ 27
Figure 4.3 Power spectrum comparison among amplified signals with 𝐼𝑃3 only in up-
link LTE Wireless system ............................................................................................ 28
Figure 4.4 Power spectrum comparison with both 𝐼𝑃3 and 𝐼𝑃5 .................................. 30
Figure 4.5 The power spectrum comparison of SC-FDMA signals ............................. 31
1
Chapter 1 Introduction
1.1 A Statement of the Problem
The nonlinearity of RF power amplifiers is one of the main concerns in wireless
communication systems. The amplifier won’t have a non-linear problem before it
attains the saturation point. However, as LTE advanced systems require greater
capacity and reliability in transmitting mobile data, the linear region of the amplifier
can’t satisfy the ever-increasing requirement due to the lack of power efficiency. In
this situation, the power amplifier is always designed to operate beyond the saturation
point, which will result in nonlinearity of the amplifier. The nonlinear distortion is one
of the principal reasons for degrading the transmission quality in the wireless
communication systems. SC-FDMA is commonly used in the uplink of LTE and LTE
advanced systems because of the lower PAPR compared with the widely used OFDM
scheme. However, the nonlinearity caused by the characteristic of the RF power
amplifiers is still a critical problem, and there is little research in linearization of SC-
FDMA signals with RF power amplifiers in LTE uplink systems.
Digital pre-distortion (DPD) is generally applied by employing digital baseband
distortion ahead of the amplifier to compensate for the nonlinearity effects and to
provide efficiency enhancements for high power amplifiers in the different
communication systems. The added distortion has totally opposite nonlinear features
from the nonlinearity of the amplifier. With the inclusion of intermodulation products
(IMPs) in the DPD algorithm, the spectrum regrowth of the amplified signals can be
counteracted well in terms of memory-less PA models. The latest generation wireless
2
communication systems, like LTE and LTE advanced systems, require larger
bandwidth, whereas the additional memory effect reduces precision of the traditional
pre-distorter.
1.2 Review of Literature
Previously the research group in Portland State University has already conducted in-
depth studies of the power amplifier nonlinearity and digital pre-distortion. Heng Xiao
built the mathematical relationship between 3rd and 5th order coefficients and intercept
points of RF power amplifiers [1]. Chunming Liu analyzed nonlinearity of RF power
amplifiers with OFDM signals [2]. Bosi Chen extended that knowledge to LTE and
WiMAX systems [3] and Xiao Li established the model of high order spectrum
regrowth of OFDM signals in 4G communication systems and proceeded to pre-
distortion with memory effects [4]. Furthermore, the impact of the power amplifier on
SC-FDMA signals has been discussed in recent studies [5].
1.3 Contributions of This Thesis
1.3.1 Nonlinear Analysis of SC-FDMA Spectrum
In this thesis, the nonlinearity of SC-FDMA signals has been analyzed and predicted
in spectral terms. Owing to the nonlinearity of RF power amplifiers, an analytic model
is introduced on the basis of the third-order intercept point (𝐼𝑃3) since this could be
considered as a weakly nonlinear system [6]. The model is subsequently applied for
3
the first time to SC-FDMA signals for the nonlinear analysis of spectrum regrowth.
Finally the simulation results have been compared with measurement.
1.3.2 The Digital Pre-Distortion of SC-FDMA Spectrum
Digital Pre-Distortion (DPD) based on the efficient and flexible inverse
intermodulation and Autoregressive Moving-Average (IM-ARMA) model is applied
to SC-FDMA signals in the LTE uplink system to linearize the PA distortion with
memory. It captures the nonlinearity effect and the memory effect first with two
separate models based on the Hammerstein structure, and then applies the inverse
polynomial model and the inverse IM-ARMA model to compensate for the two effects
respectively. The improvement of the DPD algorithm for the SC-FDMA signals has
been verified with a series of experimental measurements for the first time in this
thesis.
4
Chapter 2 Nonlinear Analysis of SC-FDMA Spectrum for LTE Up-link
2.1 Power Amplifier Model
2.1.1 Nonlinearity of Power Amplifiers
The nonlinearity of RF power amplifiers is one of the principal reasons for
degradation of the transmission quality in wireless communication systems. Figures
2.1 and 2.2 show that practical amplifiers perform different from the ideal [7]. The
practical amplifier (Figure 2.2) performs as the same as the ideal one (Figure 2.1) only
in the linear region, while in both the cut-off and saturation regions the output suffers
from the nonlinearity of the amplifier [8].
Figure 2.1 Characteristics of ideal amplifiers
5
Figure 2.2 Characteristics of practical amplifier
2.1.2 Traditional Memory-less Model
For an ideal power amplifier, the output performs perfectly linearly, according to
scaling and superposition principles, and is described as
𝑉𝑜𝑢𝑡(𝑡) = 𝐺𝑉𝑖𝑛(𝑡) (2.1)
where output 𝑉𝑜𝑢𝑡(𝑡) is the product of the input 𝑉𝑖𝑛(𝑡) and a scalar coefficient 𝐺
which represents the amplifier gain.
However, for a practical amplifier, as shown in Figure 2.2, the output will saturate to
the maximum output level even if the input continues to rise. Therefore, the Taylor
series [9] is applied in this case
𝑉𝑜𝑢𝑡(𝑡) = 𝐺[𝑉𝑖𝑛(𝑡)] = ∑ 𝐺𝑛𝑉𝑖𝑛𝑛(𝑡)∞
𝑖=0
= 𝐺0 + 𝐺1𝑉𝑖𝑛(𝑡) + 𝐺2𝑉𝑖𝑛2(𝑡) + 𝐺3𝑉𝑖𝑛
3(𝑡) + ⋯ 𝐺𝑛𝑉𝑖𝑛𝑛(𝑡) (2.2)
6
where 𝐺0 is the DC output offset, and 𝐺𝑛 is the coefficient corresponding to the term
𝑉𝑖𝑛𝑛(𝑡). 𝐺1𝑉𝑖𝑛(𝑡) is the first order term which is the linear part similar to the ideal
amplifier. However, the other terms, such as the second order term 𝐺2𝑉𝑖𝑛2(𝑡), cause
nonlinear distortion if not all coefficient 𝐺𝑛 (𝑛 > 1) are zero. Hence, as 𝐺1 must
always be much larger than 𝐺𝑛 (𝑛 > 1), in order to perform as an acceptable linear
amplifier.
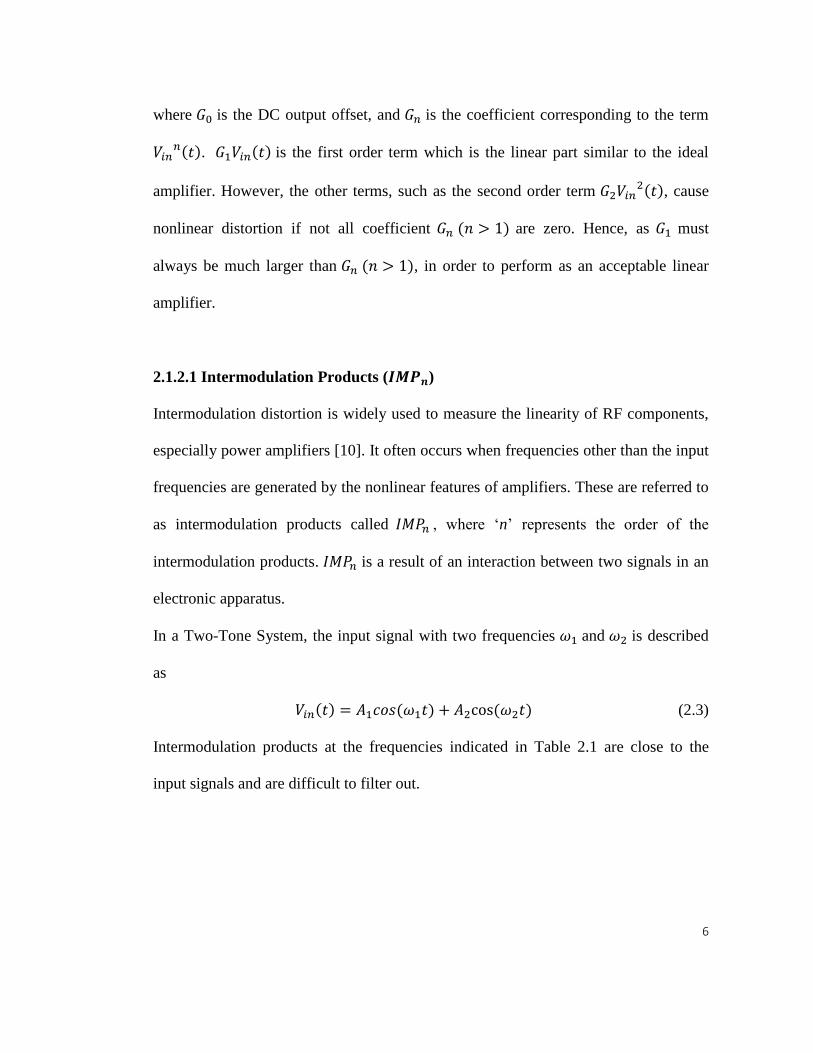
2.1.2.1 Intermodulation Products (𝑰𝑴𝑷𝒏)
Intermodulation distortion is widely used to measure the linearity of RF components,
especially power amplifiers [10]. It often occurs when frequencies other than the input
frequencies are generated by the nonlinear features of amplifiers. These are referred to
as intermodulation products called 𝐼𝑀𝑃𝑛 , where ‘n’ represents the order of the
intermodulation products. 𝐼𝑀𝑃𝑛 is a result of an interaction between two signals in an
electronic apparatus.
In a Two-Tone System, the input signal with two frequencies 𝜔1 and 𝜔2 is described
as
𝑉𝑖𝑛(𝑡) = 𝐴1𝑐𝑜𝑠(𝜔1𝑡) + 𝐴2cos (𝜔2𝑡) (2.3)
Intermodulation products at the frequencies indicated in Table 2.1 are close to the
input signals and are difficult to filter out.
7
Frequency
Fifth-order 3𝜔1 − 2𝜔2
Third-order 2𝜔1 − 𝜔2
First Signal 𝜔1
Second Signal 𝜔2
Third-order 2𝜔2 − 𝜔1
Fifth-order 3𝜔2 − 2𝜔1
Table 2.1 Intermodulation distortion products in a Two-Tone System
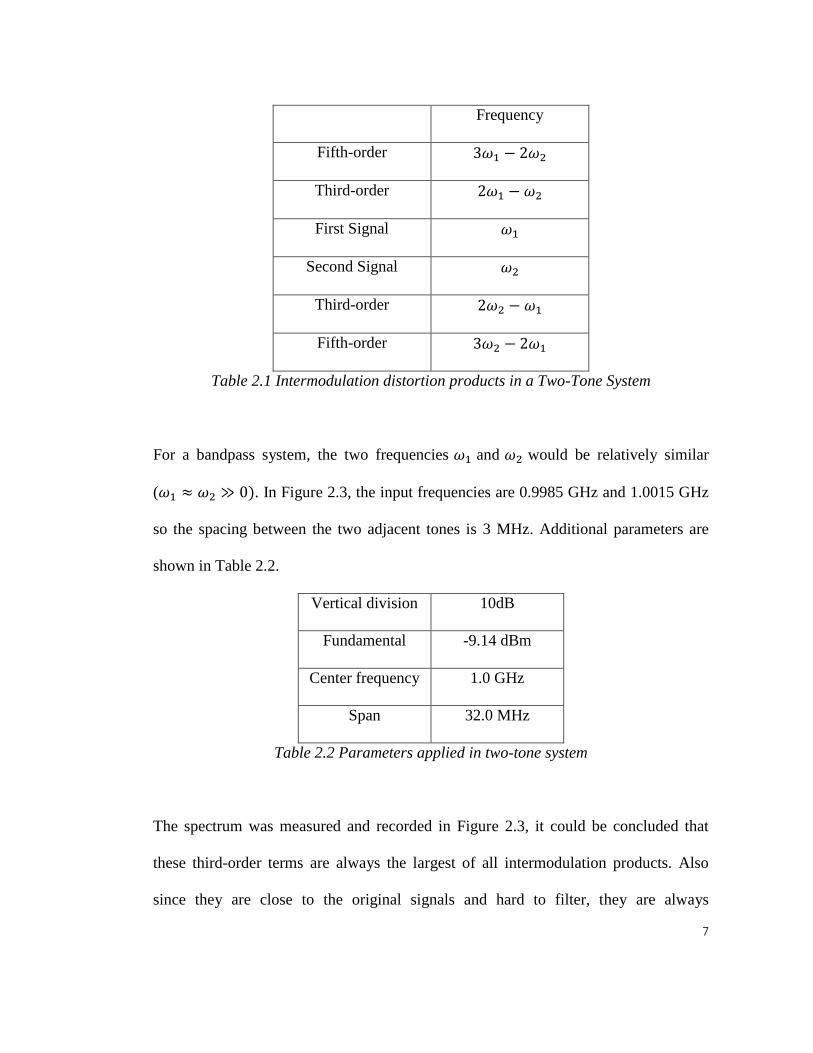
For a bandpass system, the two frequencies 𝜔1 and 𝜔2 would be relatively similar
(𝜔1 ≈ 𝜔2 ≫ 0). In Figure 2.3, the input frequencies are 0.9985 GHz and 1.0015 GHz
so the spacing between the two adjacent tones is 3 MHz. Additional parameters are
shown in Table 2.2.
Vertical division 10dB
Fundamental -9.14 dBm
Center frequency 1.0 GHz
Span 32.0 MHz
Table 2.2 Parameters applied in two-tone system
The spectrum was measured and recorded in Figure 2.3, it could be concluded that
these third-order terms are always the largest of all intermodulation products. Also
since they are close to the original signals and hard to filter, they are always
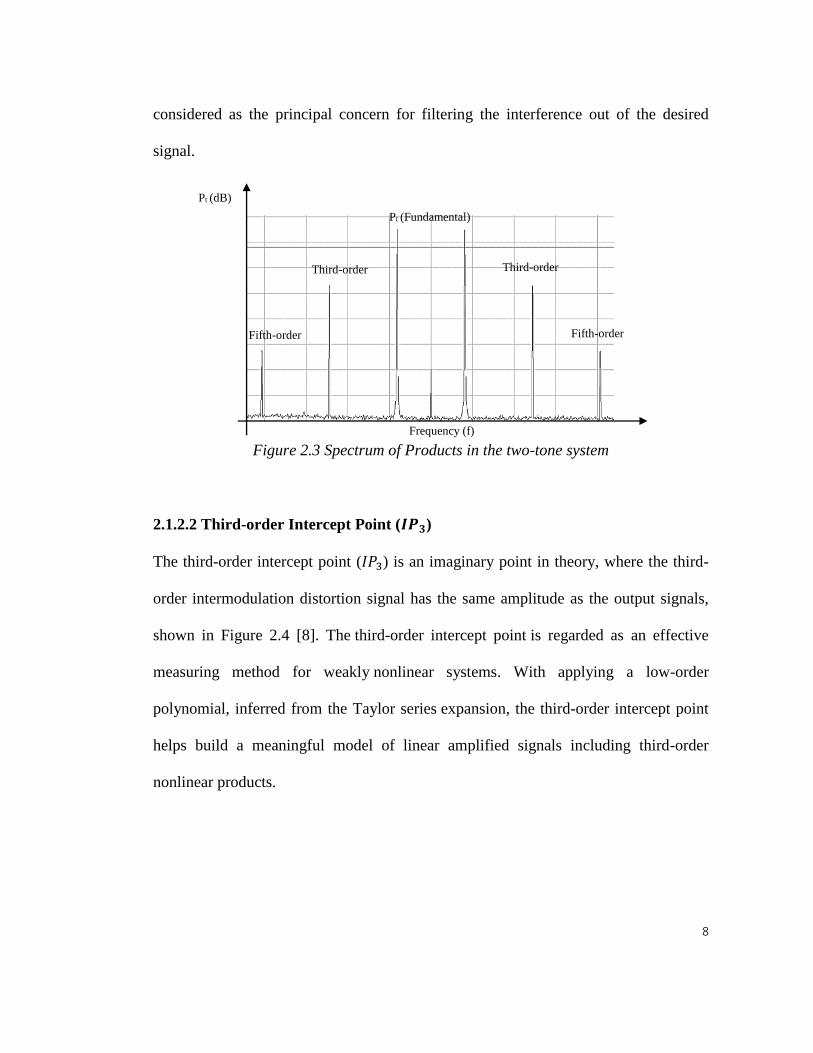
8
considered as the principal concern for filtering the interference out of the desired
signal.
Figure 2.3 Spectrum of Products in the two-tone system
2.1.2.2 Third-order Intercept Point (𝑰𝑷𝟑)
The third-order intercept point (𝐼𝑃3) is an imaginary point in theory, where the third-
order intermodulation distortion signal has the same amplitude as the output signals,
shown in Figure 2.4 [8]. The third-order intercept point is regarded as an effective
measuring method for weakly nonlinear systems. With applying a low-order
polynomial, inferred from the Taylor series expansion, the third-order intercept point
helps build a meaningful model of linear amplified signals including third-order
nonlinear products.
Pt (dB)
Frequency (f)
Pt (Fundamental)
Third-order
Fifth-order
Third-order
Fifth-order
9
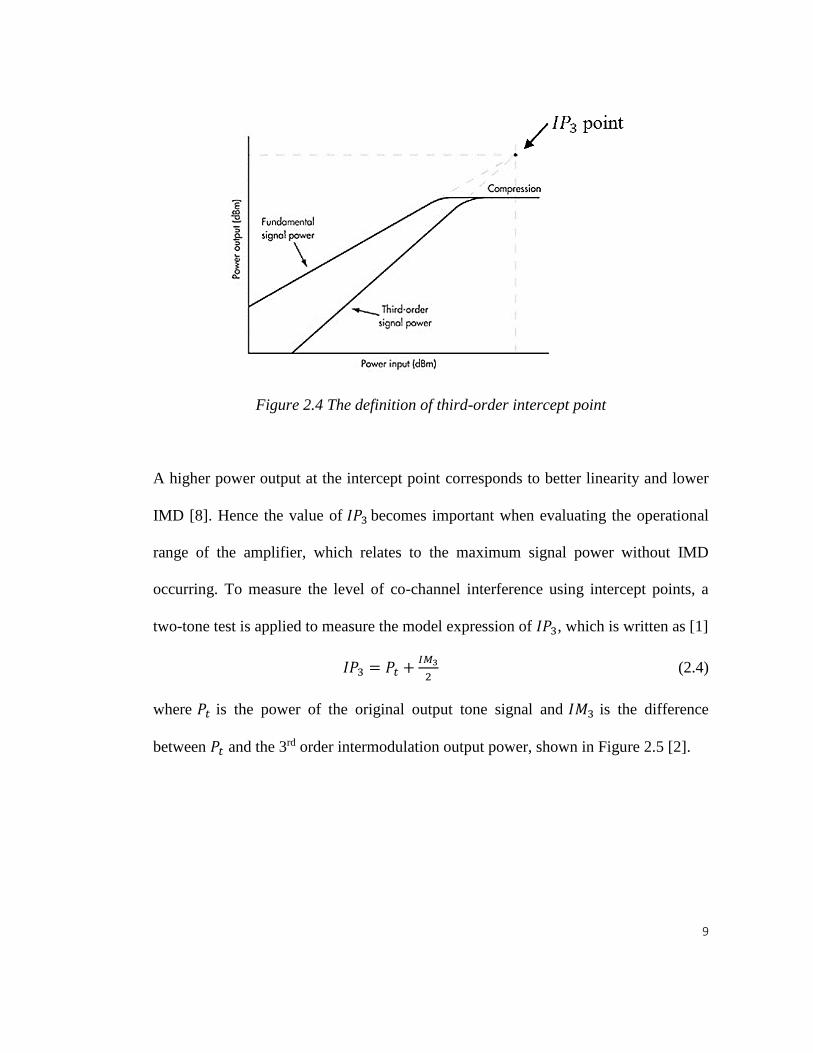
Figure 2.4 The definition of third-order intercept point
A higher power output at the intercept point corresponds to better linearity and lower
IMD [8]. Hence the value of 𝐼𝑃3 becomes important when evaluating the operational
range of the amplifier, which relates to the maximum signal power without IMD
occurring. To measure the level of co-channel interference using intercept points, a
two-tone test is applied to measure the model expression of 𝐼𝑃3, which is written as [1]
𝐼𝑃3 = 𝑃𝑡 +𝐼𝑀3
2 (2.4)
where 𝑃𝑡 is the power of the original output tone signal and 𝐼𝑀3 is the difference
between 𝑃𝑡 and the 3rd order intermodulation output power, shown in Figure 2.5 [2].
10
3IM3IMP
Frequency ( f )
dBPttP tP
3IMP
Third-order
IM Product
Figure 2.5 Two-tone test for the third-order intermodulation
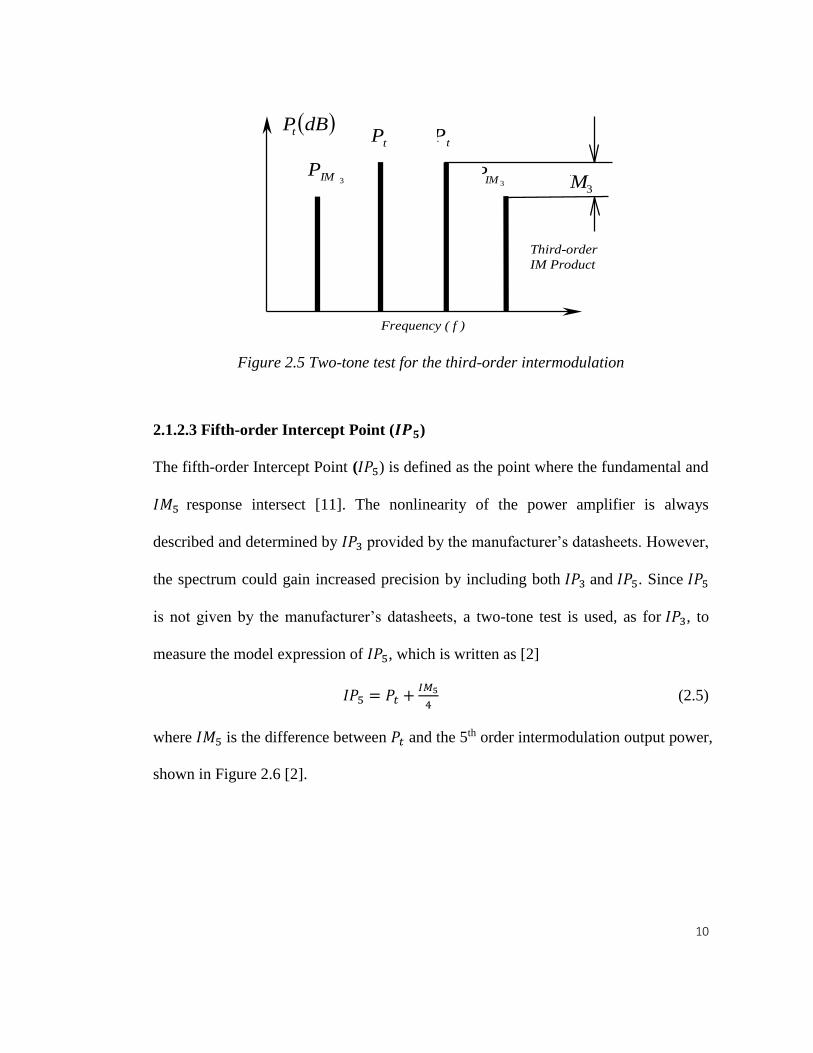
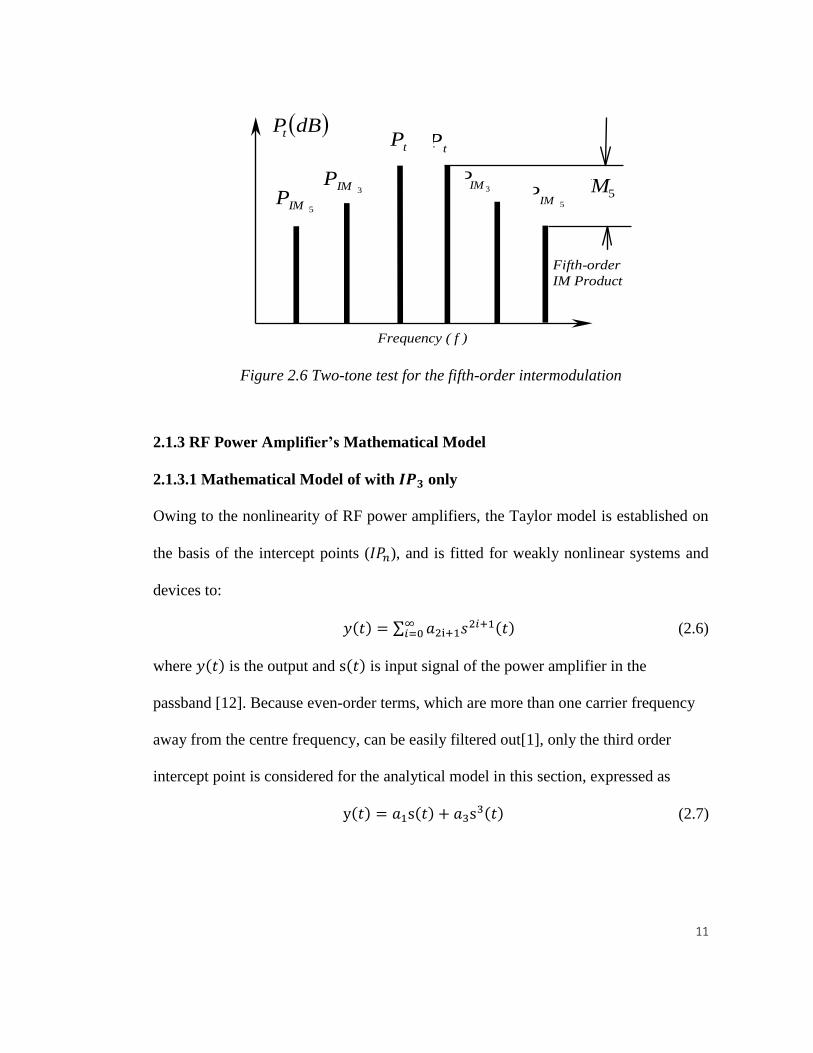
2.1.2.3 Fifth-order Intercept Point (𝑰𝑷𝟓)
The fifth-order Intercept Point (𝐼𝑃5) is defined as the point where the fundamental and
𝐼𝑀5 response intersect [11]. The nonlinearity of the power amplifier is always
described and determined by 𝐼𝑃3 provided by the manufacturer’s datasheets. However,
the spectrum could gain increased precision by including both 𝐼𝑃3 and 𝐼𝑃5. Since 𝐼𝑃5
is not given by the manufacturer’s datasheets, a two-tone test is used, as for 𝐼𝑃3, to
measure the model expression of 𝐼𝑃5, which is written as [2]
𝐼𝑃5 = 𝑃𝑡 +𝐼𝑀5
4 (2.5)
where 𝐼𝑀5 is the difference between 𝑃𝑡 and the 5th order intermodulation output power,
shown in Figure 2.6 [2].
11
5IMP5IMP 5IM3IMP
Frequency ( f )
dBPt
tPtP
3IMP
Fifth-order
IM Product
Figure 2.6 Two-tone test for the fifth-order intermodulation
2.1.3 RF Power Amplifier’s Mathematical Model
2.1.3.1 Mathematical Model of with 𝑰𝑷𝟑 only
Owing to the nonlinearity of RF power amplifiers, the Taylor model is established on
the basis of the intercept points (𝐼𝑃𝑛), and is fitted for weakly nonlinear systems and
devices to:
𝑦(𝑡) = ∑ 𝑎2i+1𝑠2𝑖+1(𝑡)∞𝑖=0 (2.6)
where 𝑦(𝑡) is the output and s(𝑡) is input signal of the power amplifier in the
passband [12]. Because even-order terms, which are more than one carrier frequency
away from the centre frequency, can be easily filtered out[1], only the third order
intercept point is considered for the analytical model in this section, expressed as
y(𝑡) = 𝑎1s(𝑡) + 𝑎3s3(𝑡) (2.7)
12
The coefficients 𝑎1 and 𝑎3 depend on the linear gain 𝐺 of the amplifier and 𝐼𝑃3, both
of which are always introduced in datasheets from the manufacturers of RF power
amplifiers. For the amplifier with gain compression (𝑎3 < 0),
𝑎1 = 10𝐺
20, 𝑎3 = −2
310(−
𝐼𝑃310
+3𝐺
20) (2.8)
2.1.3.2 Mathematical Model of with 𝑰𝑷𝟑 and 𝑰𝑷𝟓
In this section, both 𝐼𝑃3 and 𝐼𝑃5 are considered for the analytical model, expressed as
y(𝑡) = 𝑎1s(𝑡) + 𝑎3s3(𝑡) + 𝑎5s5(𝑡) (2.9)
The extra coefficient 𝑎5 depends on the linear gain 𝐺 and 𝐼𝑃5. For the amplifier with
gain compression,
𝑎5 = −2
510(−
𝐼𝑃55
+𝐺
4) (2.10)
2.2 SC-FDMA Signals
Single-Carrier Frequency-Division Multiple Access (SC-FDMA) is widely used in the
up-link of long-term evolution (LTE) and LTE-Advanced systems. It is similar to
Orthogonal Frequency-Division Multiplexing (OFDM) used in the downlink of LTE
systems [13], but with an extra Discrete Fourier Transform (DFT) block prior to
subcarrier mapping, SC-FDMA shows its strength in a robust high peak-to-average-
power ratio (PAPR) which produces benefits of both terminal expense and power
efficiency [14]. However, the nonlinearity caused by the characteristic of the RF
power amplifiers is still a critical problem, and there is very little research into
linearization for the SC-FDMA signals.
13
2.2.1 Basics of SC-FDMA Signals
SC-FDMA with cyclic prefix (CP) is widely applied in the up-link of long-term
evolution (LTE) systems due to its salient advantage of low peak-to-average-power
ratio (PAPR) contributing to a low terminal expense and high power efficiency of the
transmitter [14]. It has some similarities to Orthogonal Frequency-Division
Multiplexing (OFDM) used in the down-link of LTE systems, but the unique
characteristic of SC-FDMA is embodied in different carrier transmission schemes,
prompting SC-FDMA to be a more valuable alternative to OFDM. A SC-FDMA
transceiver occupies an additional Discrete Fourier Transform (DFT) block prior to
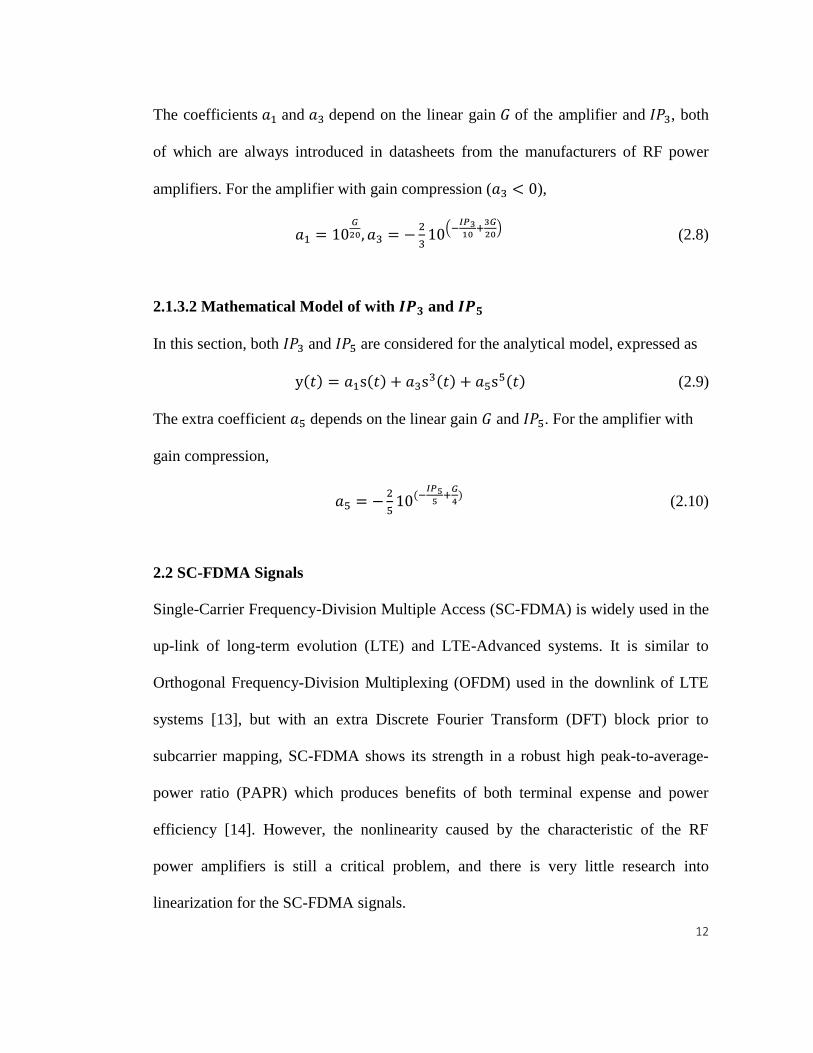
subcarrier mapping, illustrated in Figure 2.7 [15].
Figure 2.7 Transmitter and receiver of OFDM & SC-FDMA systems
In a transmitter, data symbols are transformed from the time domain to the frequency
domain. After subcarrier mapping, the Inverse Discrete Fourier Transform (IDFT)
operation performs the same feature with a single carrier signal with lower power
variations. Moreover, the transmitted signals are operated in the frequency domain
through shifting the IDFT inputs, in order to satisfy requests for flexible bandwidth
[16]. By contrast, because of the increasing number of subcarriers, outputs in the time
14
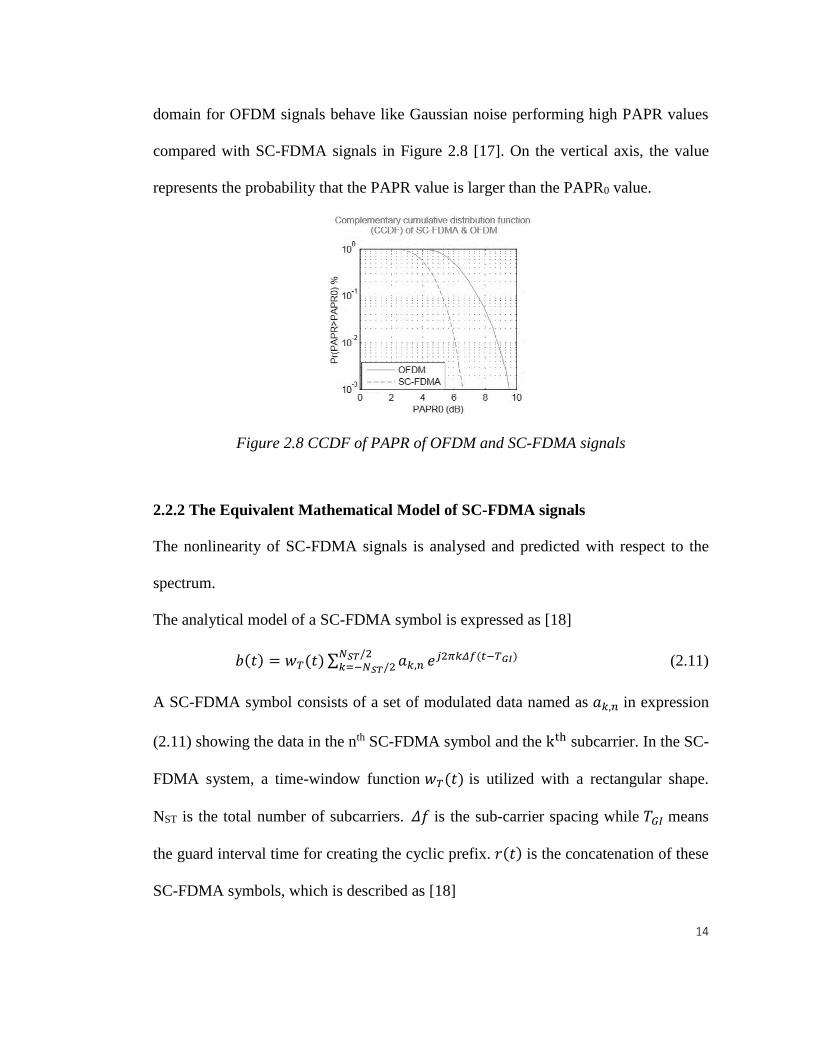
domain for OFDM signals behave like Gaussian noise performing high PAPR values
compared with SC-FDMA signals in Figure 2.8 [17]. On the vertical axis, the value
represents the probability that the PAPR value is larger than the PAPR0 value.
Figure 2.8 CCDF of PAPR of OFDM and SC-FDMA signals
2.2.2 The Equivalent Mathematical Model of SC-FDMA signals
The nonlinearity of SC-FDMA signals is analysed and predicted with respect to the
spectrum.
The analytical model of a SC-FDMA symbol is expressed as [18]
𝑏(𝑡) = 𝑤𝑇(𝑡) ∑ 𝑎𝑘,𝑛𝑁𝑆𝑇/2𝑘=−𝑁𝑆𝑇/2 𝑒𝑗2𝜋𝑘𝛥𝑓(𝑡−𝑇𝐺𝐼) (2.11)
A SC-FDMA symbol consists of a set of modulated data named as 𝑎𝑘,𝑛 in expression
(2.11) showing the data in the nth SC-FDMA symbol and the kth subcarrier. In the SC-
FDMA system, a time-window function 𝑤𝑇(𝑡) is utilized with a rectangular shape.
NST is the total number of subcarriers. 𝛥𝑓 is the sub-carrier spacing while 𝑇𝐺𝐼 means
the guard interval time for creating the cyclic prefix. 𝑟(𝑡) is the concatenation of these
SC-FDMA symbols, which is described as [18]
15
𝑟(𝑡) = ∑ 𝑤𝑇(𝑡 − 𝑛𝑇𝑠)∞𝑛=−∞ [∑ 𝑎𝑘,𝑛
𝑁𝑆𝑇/2
𝑘=−𝑁𝑆𝑇
2
𝑒𝑗2𝜋𝑘𝛥𝑓(𝑡−𝑇𝐺𝐼−𝑛𝑇𝑠)] (2.12)
where 𝑇𝑠 is the symbol duration time. The transmitted SC-FDMA signal 𝑠(𝑡) then is
written as [13]
𝑠(𝑡) = 𝑅𝑒[𝑟(𝑡)𝑒𝑗2𝜋𝑓𝑐𝑡] (2.13)
where 𝑅𝑒[∗] is the real part of the signal while 𝑓𝑐 denotes the carrier frequency of the
LTE system. The parameters used in the math model for testing the LTE signal are
listed in Table 2.3 [18].
SC-FDMA parameter LTE
Subcarrier frequency spacing 𝛥𝑓 15k Hz
Number of used subcarriers 𝑁𝑆𝑇 1200
FFT size 8192
Total symbol time 𝑇𝑠 71.36 μs
Data modulation 16-QAM
Sampling frequency 1/𝑇𝑠 15.36 MHz
Circular prefix 𝑇𝐺𝐼 4.69 μs
Table 2.3 Parameters applied in the simulation math model
The general formula of the power spectral density (PSD) of a SC-FDMA baseband
signal is written as [4]
P𝑟(𝑓) =𝑅𝑠
4∑ [|𝑊(𝑓 − 𝑘∆𝑓)|2 + |𝑊(−𝑓 − 𝑘∆𝑓)|2]NST/2
k=−NST
2
(2.14)
16
where 𝑅𝑠 =1
𝑇𝑠 is the symbol rate and 𝑊(𝑓) defines the Fourier transform of the
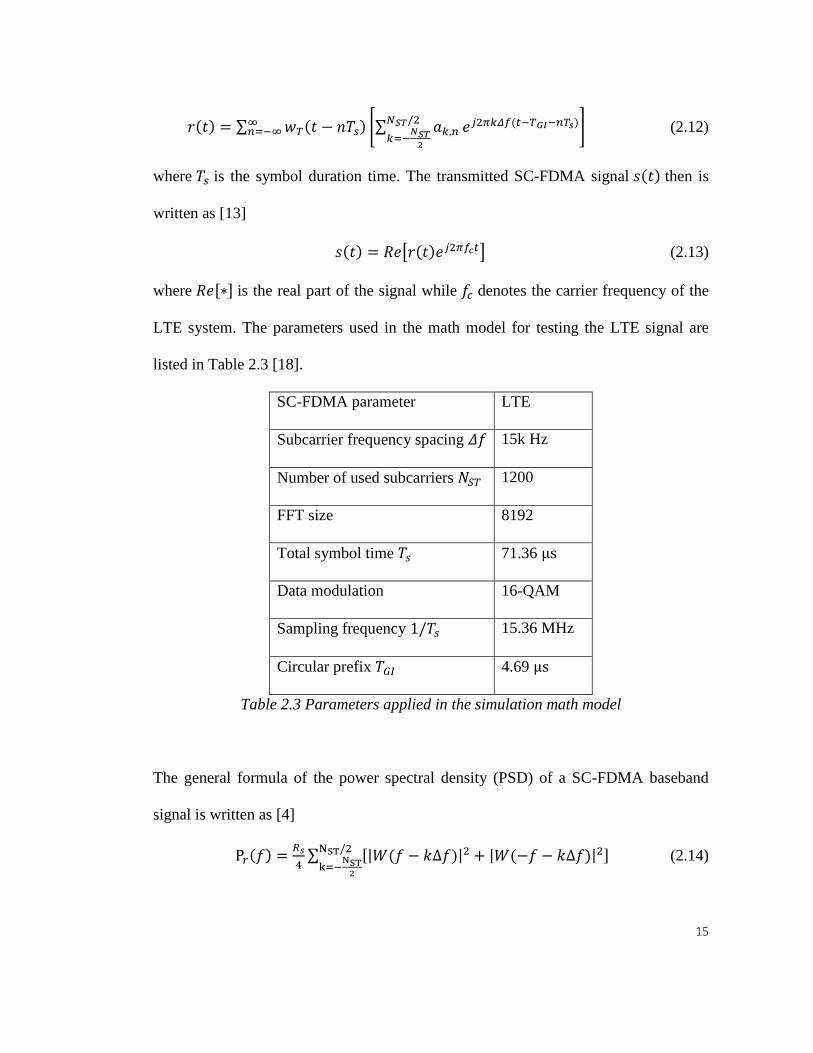
rectangular window function in this case. Figure 2.9 illustrates that the simulated and
measured baseband signal spectra achieve good matches with the spectrum of the
calculated expression (2.14) [19].
Figure 2.9 Power spectrum comparison among simulation, measurement and
calculation results of baseband SC-FDMA signal
2.3 Spectrum Regrowth of Amplified LTE Uplink Signals
From expression (2.13), a RF power amplifier has the analytical model shown as
𝑦(𝑡) = 𝛰{𝑠(𝑡)} = Ϝ[𝑟(𝑡)]𝑐𝑜𝑠 (2𝜋𝑓𝑐𝑡 + 𝜑[𝑟(𝑡)]) (2.15)
where 𝛰{∗} is the operation of amplifier while Ϝ[∗] and 𝜑[∗] are AM/AM and
AM/PM conversions respectively, depending on the model characteristics of the
amplifier.
17
Implementing an autocorrelation of 𝑟(𝑡) and by the corollary to the Wiener-
Khintchine Theorem [12], the final power spectrum 𝑃𝑦(𝑓) of y(t) will become:
𝑃𝑦(𝑓) = 𝐴1𝑃1(𝑓−𝑓𝑐)
𝑁𝑆𝑇+ 𝐴2
𝑃3(𝑓−𝑓𝑐)
𝑁𝑆𝑇3 (2.16)
𝑃1 represents the PSD of a SC-FDMA baseband signal and 𝑃3 is equivalent to the
convolution results of three 𝑃1 values. 𝐴1 and A2 are two factors having values after
calculation shown below:
𝐴1 = 2𝑃0 − 12𝑃0210−
𝐼𝑃310 + 18𝑃0
310−𝐼𝑃35
𝐴2 = 48𝑃0310−
𝐼𝑃35 (2.17)
where 𝑃0 =𝑎1
2𝑁𝑆𝑇
4 is the linear output power of the amplifier.
Another form in terms of 𝐼𝑃3, evolved from the power spectrum result of 𝑃𝑦(𝑓) in
(2.16) and (2.17), is described as:
𝐷1 × 10−𝐼𝑃3
5 + 𝐷2 × 10−𝐼𝑃310 + 𝐷𝐶 = 0 (2.18)
where
𝐷1 =18𝑃0
3
𝑁𝑆𝑇3 𝑃1(𝑓 − 𝑓𝑐) +
48𝑃03
𝑁𝑆𝑇3 𝑃3(𝑓 − 𝑓𝑐)
𝐷2 = −12𝑃0
2
𝑁𝑆𝑇3 𝑃1(𝑓 − 𝑓𝑐) (2.19)
𝐷𝐶 =2𝑃0
𝑁𝑆𝑇 𝑃1(𝑓 − 𝑓𝑐) − 𝑃𝑦(𝑓)
In order to get the explicit expression of 𝐼𝑃3, the form in (2.18) is solved with (2.19):
𝐼𝑃3 = −10 × log10 (−𝐷2+√𝐷2
2−4𝐷1𝐷𝐶
2𝐷1) (2.20)
18
According to the theoretical expression, the value of 𝐼𝑃3 depends on a particular out-
of-band emission power level. The emission level of the power spectrum in a given
band from 𝑓1 and 𝑓2 is described as 𝑃𝐼𝑀3(𝑓1, 𝑓2) [13]:
𝑃𝐼𝑀3(𝑓1, 𝑓2) = ∫ 𝑃𝑦(𝑓)𝑑𝑓
𝑓2
𝑓1 (2.21)
From the integration of 𝑃𝑦(𝑓) , another group of coefficients 𝐷1′ , 𝐷2
′ and 𝐷𝐶′ is
calculated as [13]
𝐷1′ =
18𝑃03
𝑁𝑆𝑇3 ∫ 𝑃1(𝑓 − 𝑓𝑐)𝑑𝑓
𝑓2
𝑓1
+48𝑃0
3
𝑁𝑆𝑇3 ∫ 𝑃3(𝑓 − 𝑓𝑐)𝑑𝑓
𝑓2
𝑓1
𝐷2′ = −
12𝑃02
𝑁𝑆𝑇3 ∫ 𝑃1(𝑓 − 𝑓𝑐)𝑑𝑓
𝑓2
𝑓1 (2.22)
𝐷𝐶′ =
2𝑃0
𝑁𝑆𝑇 ∫ 𝑃1(𝑓 − 𝑓𝑐)𝑑𝑓
𝑓2
𝑓1
− 𝑃𝐼𝑀3(𝑓1, 𝑓2)
However, the new expression of 𝐼𝑃3 is of the same form with (2.20) except the latter
coefficients substitute for the previous ones respectively, giving a clear view of state
transition between the out-of-band emission power level and 𝐼𝑃3.
19
Chapter 3 The Digital Pre-Distortion of the SC-FDMA Signals in LTE Up-link
System
RF power amplifiers (PA) bring nonlinear distortion that degrades signal transmission
quality and increases inter-channel interference [20]. In addition, with the
development of fourth generation (4G) mobile communication systems, the modern
wideband signal has aroused the attention to the issues wherein the accuracy of PA
modelling has been influenced by memory effects, which is always not considered in
other narrowband applications [21]. This new issue arises a request for applying DPD
algorithms with the memory effect to the wideband LTE systems since traditional pre-
distorters always perform poor accuracy with memory-less models. A DPD algorithm
is applied to the SC-FDMA signals in the uplink of the LTE systems. It captures the
nonlinearity and memory effects with two separate models based on the Hammerstein
structure first, and then applies the inverse polynomial model and the inverse IM-
ARMA model to compensate previous two parts of effect respectively. The
improvement of the DPD algorithm for the SC-FDMA signals was verified with a
series of experimental measurements.
3.1 Pre-Distortion Review
The digital pre-distorter (DPD) is widely applied by employing digital baseband
distortion ahead of the amplifier to compensate for the nonlinearity effects and provide
efficiency enhancements for high power amplifiers in the different communication
systems. This thesis presents a digital pre-distorter first applied to linearize SC-FDMA
20
signals having the PA distortion with memory effect using an efficient and flexible
inverse intermodulation and Autoregressive Moving-Average (IM-ARMA) model in
the LTE uplink system.
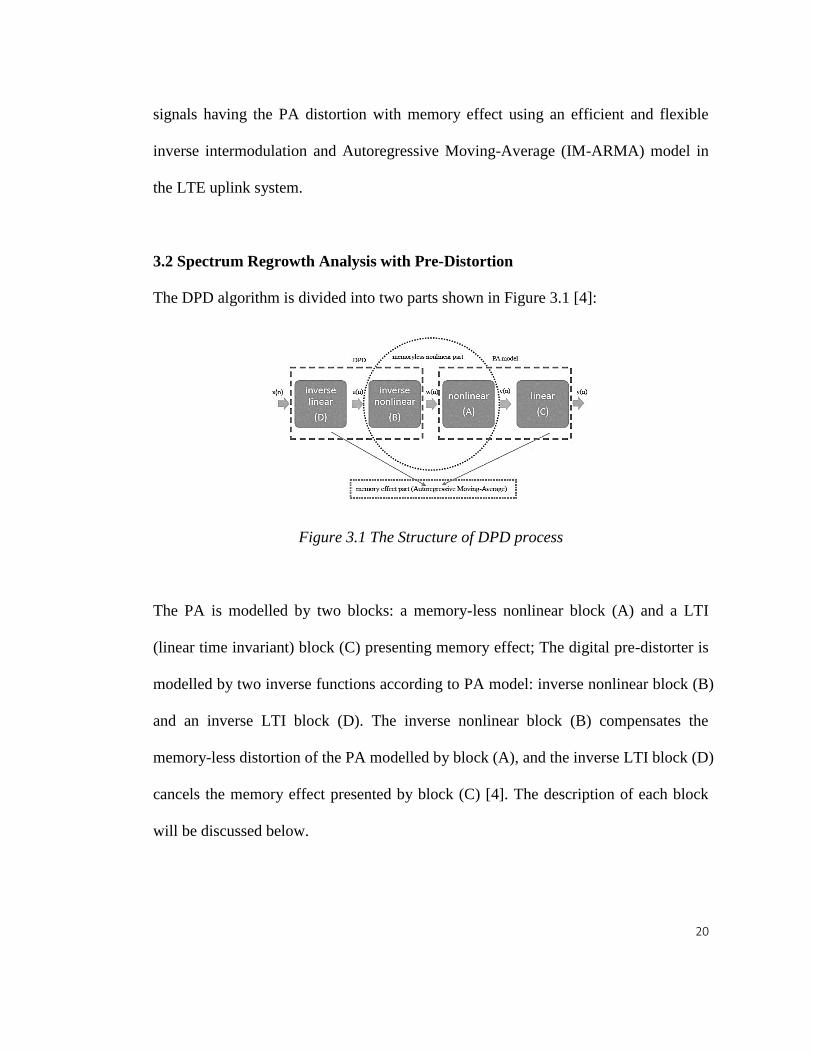
3.2 Spectrum Regrowth Analysis with Pre-Distortion
The DPD algorithm is divided into two parts shown in Figure 3.1 [4]:
Figure 3.1 The Structure of DPD process
The PA is modelled by two blocks: a memory-less nonlinear block (A) and a LTI
(linear time invariant) block (C) presenting memory effect; The digital pre-distorter is
modelled by two inverse functions according to PA model: inverse nonlinear block (B)
and an inverse LTI block (D). The inverse nonlinear block (B) compensates the
memory-less distortion of the PA modelled by block (A), and the inverse LTI block (D)
cancels the memory effect presented by block (C) [4]. The description of each block
will be discussed below.
21
3.2.1 Block A: The Nonlinear Model
The Taylor series model v(n) of a high power amplifier is applied for the polynomial
model, expressed as [22]:
v(n) = 𝑎1w(𝑛) + 𝑎3w3(𝑛) + ⋯ + 𝑎𝑀𝑤𝑀(𝑛) (3.1)
where w(𝑛) represents the input. The coefficient series 𝑎𝑚 is determined by the linear
gain 𝐺 of the amplifier and 𝑚-order intercept point (𝐼𝑃𝑚). It should be noticed that
only terms with odd-order features are included in this model due to the simple
filtration process with even-order 𝐼𝑃𝑚 terms, which are always kept far away from the
center of passband. Moreover, the coefficient series 𝑎𝑚 have the form of an
exponential function. Accordingly, following function is proposed to describe the
relationship between 𝑎𝑚 and PA intercept points [4]:
𝑎𝑚 = −2
𝑚−12
(𝑚
𝑚+12
)
10(𝐼𝑀𝑃𝑚−𝑚𝑃𝑡+𝑚𝐺
20) (3.2)
where (𝑚
𝑚+1
2
) gives the number of different combinations of 𝑚+1
2 elements that can be
chosen from an 𝑚-element set. 𝐺 is the gain of the PA while 𝐼𝑀𝑃𝑚 stands for the 𝑚th
order intermodulation product, which is the difference between the original output
signal and the 𝑚th order intermodulation output power from a simple two tone test.
3.2.2 Block C: The Memory Effect Model
With the development of fourth generation mobile communication system, the modern
wideband signal has aroused the attention to the issues wherein the accuracy of PA
22
modelling has been influenced by memory effects which is always not considered in
narrowband applications.
For the memory effect part, the output is determined by both current and past inputs
[4]. Therefore, the time delays of both inputs and outputs are required to be involved
in the algorithm. Due to the linear delay property of the memory effect, the
Autoregressive Moving-Average (ARMA) model is used as:
∑ 𝑝(𝑘)𝑦(𝑛 − 𝑘) = ∑ 𝑞(𝑙)𝑣(𝑛 − 𝑙)𝐿𝑙=0
𝐾𝑘=0 (3.3)
where 𝑣 and 𝑦 mean the input and output functions, while 𝑘 and 𝑙 are two delays of
outputs and inputs respectively. p(k) and q(l) are coefficients of AR and MA parts of
the model. The transfer function is presented as [4]:
𝐻(𝑧) =∑ 𝑞(𝑘)𝑧−𝑘𝐾
𝑘=0
∑ 𝑝(𝑙)𝑧−𝑙𝐿𝑙=0
(3.4)
The advantages of the ARMA filter contain: It is quite simple to obtain the
coefficients from several mature algorithms [22], also the memory effect can be
reduced easily by applying the pre-distortion algorithm which is the inverse transfer
function of the ARMA filter.
Finally the PA model with memory effect is described with nonlinearity polynomial
function and memory effect function [4]:
∑ 𝑞(𝑘)𝑦(𝑛 − 𝑘)𝐾𝑘=0 = ∑ 𝑝(𝑙)[𝑎1𝑤(𝑛 − 𝑙) + 𝑎3𝑤3(𝑛 − 𝑙) + ⋯ + 𝑎𝑀𝑤𝑀(𝑛 − 𝑙)]𝐿
𝑙=0
(3.5)
23
3.2.3 Block B: The Inverse Polynomial of PA
To pre-distort the PA, we start from the linearization of the memory-less distortion
modelled in (3.1) for the block A. A developed formula based on the polynomial
model is described as [4]:
𝑤(𝑡) = 𝑏1𝑢(𝑡) + 𝑏3𝑢3(𝑡) + ⋯ + 𝑏𝑃𝑢𝑃(𝑡) (3.6)
By replacing 𝑤(𝑡) in (3.6), the whole system in (3.1) then can be expressed as:
𝑣(𝑡) = ℎ1𝑢(𝑡) + ℎ3𝑢3(𝑡) + ⋯ + ℎ𝑀∙𝑃𝑢𝑀∙𝑃(𝑡) (3.7)
The 𝑝th order nonlinearity requests at least the same order polynomial pre-distorter for
linearization. From the definition of 𝑝th order inverse method [22], the coefficients are
described as:
ℎ1 = 𝑎1, ℎ3 = 0, … ℎ𝑝 = 0 (3.8)
PA will have no nonlinearity output with 𝑝th of pre-distorter polynomial order if all the
equations in (3.8) are satisfied. To achieve the goal, the series of coefficient 𝑏𝑃 is
calculated as [4]:
𝑏𝑝 = − ∑ [(∑ 𝑏𝑖1𝑏𝑖2
… 𝑏𝑖𝑚
∑ 𝑖𝑘𝑚𝑘=1 =𝑝
∑ 𝑖𝑘𝑚𝑘=1 =𝑚
𝑖𝑘 𝑖𝑠 𝑜𝑑𝑑 𝑖𝑛𝑡𝑒𝑔𝑒𝑟
)𝑎𝑚
𝑎1]𝑀
𝑚=3𝑚 𝑖𝑠 𝑜𝑑𝑑 𝑖𝑛𝑡𝑒𝑔𝑒𝑟
(3.9)
where M is the maximum order within the PA model.
3.2.4 Block D: The Inverse Memory Effect of PA
Since linear signals v(t) has been generated by counteracting the effect from both the
inverse polynomial block (B) and the polynomial block (A), the memory effect is
necessary to be removed then. The memory effect (LTI block C) is modelled as
24
ARMA in (3.5), so the inverse block (D) should have the same ARMA structure with
inverse AR and MA coefficients. This was achieved by exchanging the positions of
pole and zero. The output u(n) of inverse ARMA block (D) and the inverse transfer
function can be indicated as:
∑ 𝑝(𝑘)𝑦(𝑛 − 𝑘) = ∑ 𝑞(𝑙)𝑣(𝑛 − 𝑙)𝐿𝑙=0
𝐾𝑘=0 (3.10)
𝐻(𝑧) =∑ 𝑞(𝑘)𝑧−𝑘𝐾
𝑘=0
∑ 𝑝(𝑙)𝑧−𝑙𝐿𝑙=0
(3.11)
25
Chapter 4 Analysis and Experimental Study of SC-FDMA Signals
4.1 SC-FDMA Spectrum for LTE Up-link System
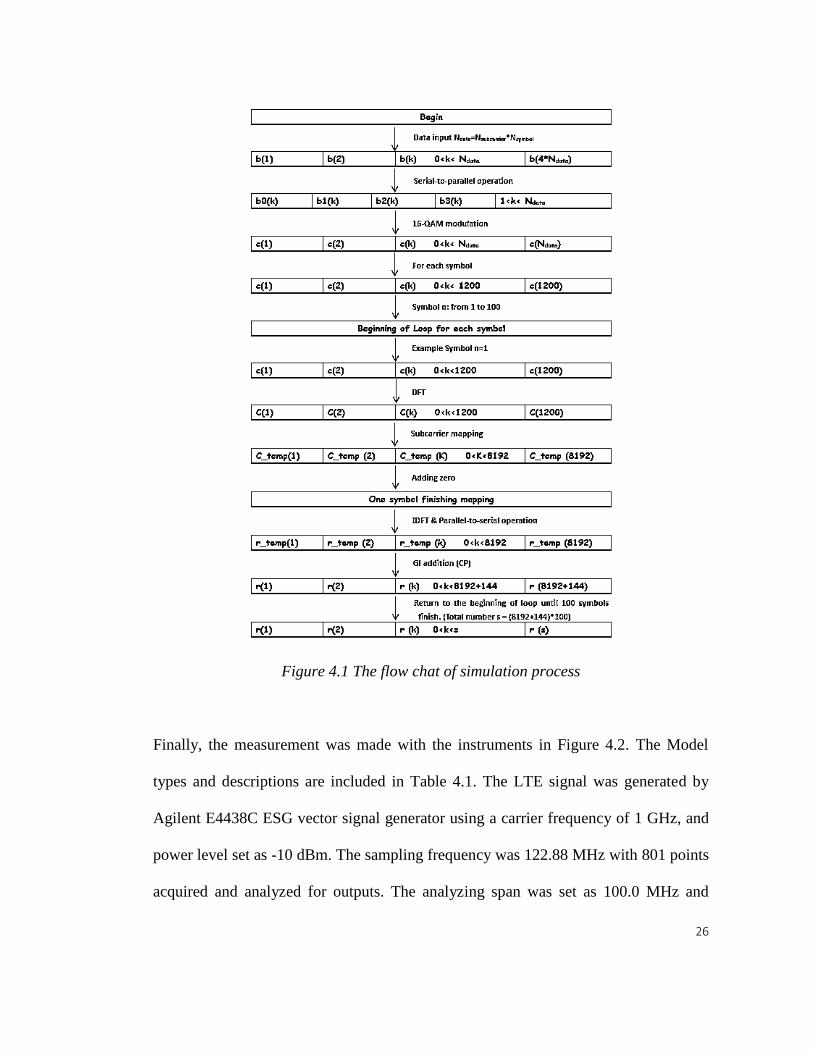
The simulation section followed a similar sequence to the transmitter structure in
Figure 2.7. The simulation process is shown in Figure 4.1. 16-QAM modulated
complex symbols were applied to the SC-FDMA system. The normalization factor
KMOD was chosen as 1
√10 to achieve the same average power for mappings in this
case. Compared with the OFDM system, the extra N-point DFT block transferred the
system into a single-carrier one which avoids a high PAPR and improves system
throughput by confining the power within a certain threshold. Then during the
subcarrier mapping, the Localized FDMA method was chosen through using a certain
fraction of the whole bandwidth. The amplifier simulation was then built with the
Taylor model. For the calculation section, a rectangular window function for the SC-
FDMA signal was applied prior to calculating the PSD of the RF signal. Then the total
bandwidth was split in two sets of parts shown in expression (2.13) and (2.14), and the
whole analytical models were shown and discussed in previous sections.
26
Figure 4.1 The flow chat of simulation process
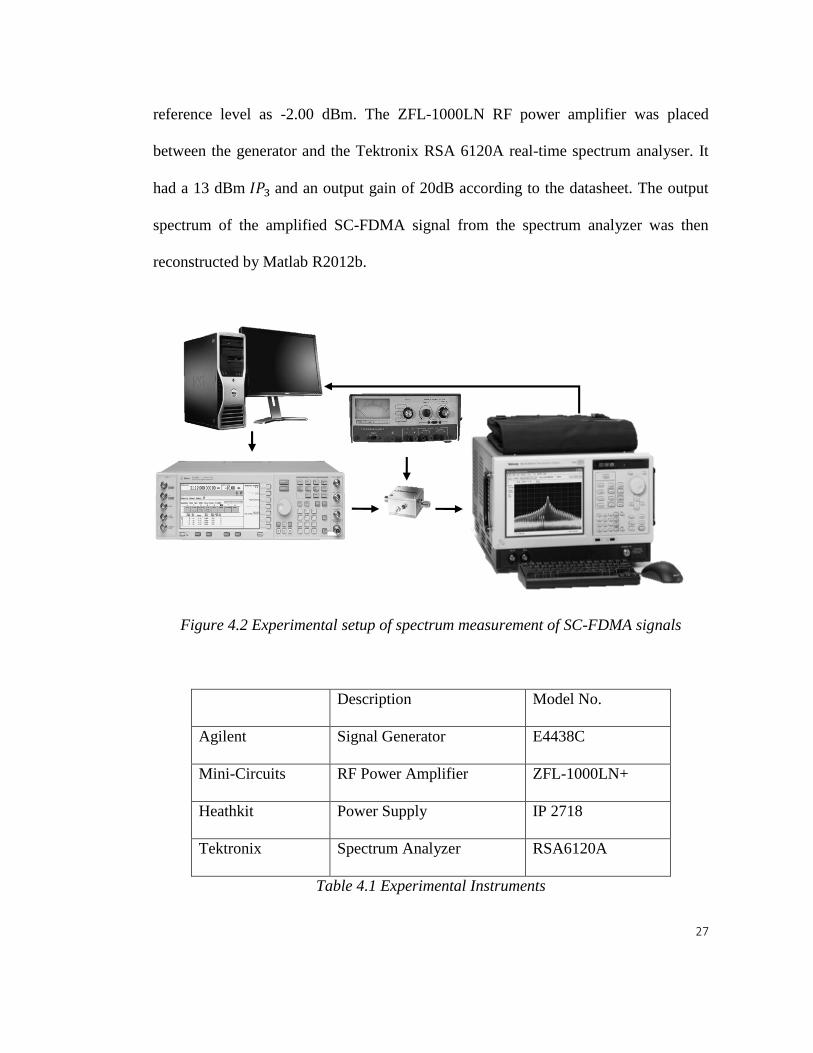
Finally, the measurement was made with the instruments in Figure 4.2. The Model
types and descriptions are included in Table 4.1. The LTE signal was generated by
Agilent E4438C ESG vector signal generator using a carrier frequency of 1 GHz, and
power level set as -10 dBm. The sampling frequency was 122.88 MHz with 801 points
acquired and analyzed for outputs. The analyzing span was set as 100.0 MHz and
27
reference level as -2.00 dBm. The ZFL-1000LN RF power amplifier was placed
between the generator and the Tektronix RSA 6120A real-time spectrum analyser. It
had a 13 dBm 𝐼𝑃3 and an output gain of 20dB according to the datasheet. The output
spectrum of the amplified SC-FDMA signal from the spectrum analyzer was then
reconstructed by Matlab R2012b.
Figure 4.2 Experimental setup of spectrum measurement of SC-FDMA signals
Description Model No.
Agilent Signal Generator E4438C
Mini-Circuits RF Power Amplifier ZFL-1000LN+
Heathkit Power Supply IP 2718
Tektronix Spectrum Analyzer RSA6120A
Table 4.1 Experimental Instruments
28
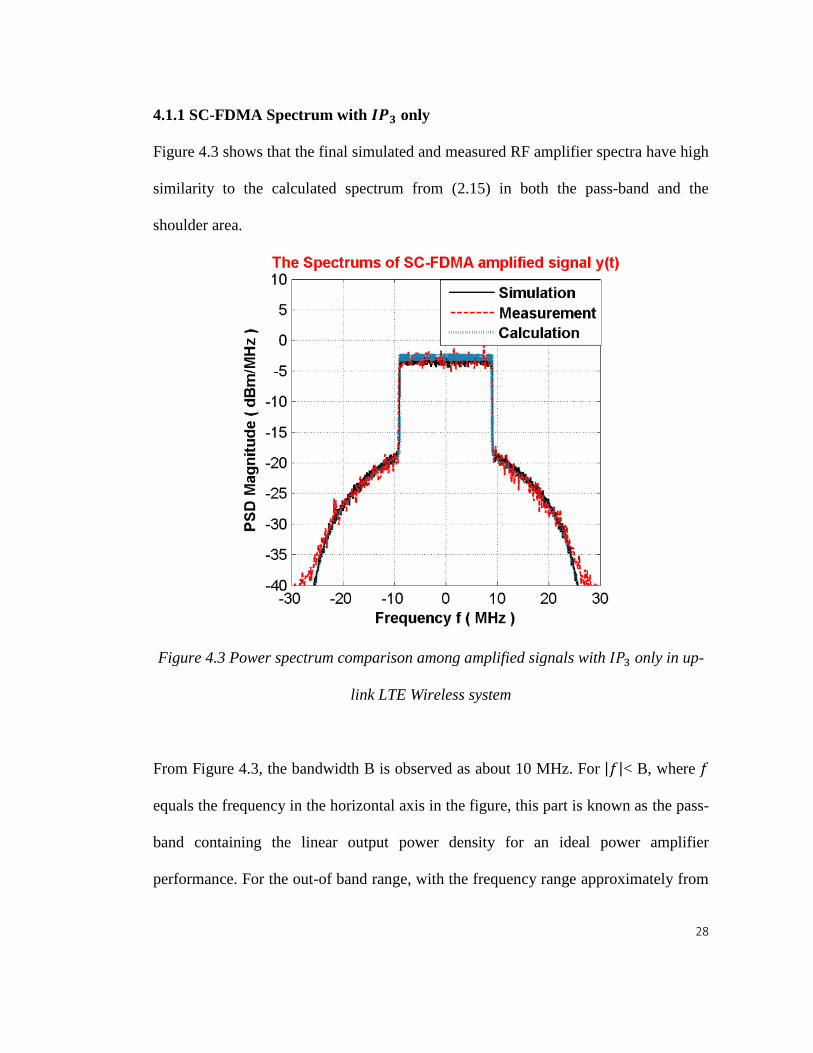
4.1.1 SC-FDMA Spectrum with 𝑰𝑷𝟑 only
Figure 4.3 shows that the final simulated and measured RF amplifier spectra have high
similarity to the calculated spectrum from (2.15) in both the pass-band and the
shoulder area.
Figure 4.3 Power spectrum comparison among amplified signals with 𝐼𝑃3 only in up-
link LTE Wireless system
From Figure 4.3, the bandwidth B is observed as about 10 MHz. For |𝑓|< B, where 𝑓
equals the frequency in the horizontal axis in the figure, this part is known as the pass-
band containing the linear output power density for an ideal power amplifier
performance. For the out-of band range, with the frequency range approximately from
29
10 to 30 MHz shown in Figure 4.3, the PSD output 𝑃𝑦(𝑓) is mainly related to 3rd
intermodulation since only 𝐼𝑃3 is considered in the calculation. The result shows that
the out-of-band spectrum density is always controlled by intermodulation, and these
out-of-band frequency components are usually named as spectrum regrowth and
include the most significant part of the emission of a power amplifier.
Furthermore, for the band |𝑓| > 3B, which is about 30 MHz shown in Figure 4.3, the
power density is still not zero because there always exists some noise, which cannot be
neglected in terms of power level compared with the output spectrum. This point of
view is not proposed in Figure 4.3 as the result of some limitations. Firstly, only 𝐼𝑃3 is
considered in this part. From the figure, it can be concluded that it has great difficulty
distinguishing 𝐼𝑃3 with ambient noise since the power level of higher-order
intermodulation points is not considerable in this part, which is more than 40 dB lower
than the amplified output power. Secondly, because the datasheet of a power amplifier
does not often include the value of 𝐼𝑃5 or higher orders, it is not reliable to simulate
and calculate the amplified spectrum with higher order intermodulation at this point.
4.1.2 SC-FDMA Spectrum with both 𝑰𝑷𝟑 and 𝑰𝑷𝟓
From the Figure 4.4, the bandwidth B is modified to about 4.5 MHz. In this case, The
PSD outputs of simulated and measured signal spectrums achieve good matching with
the spectrum of calculated expression for the band |𝑓| < 3B. For the band |𝑓| > 3B,
which is about 13.5 MHz shown in Figure 4.4, The extra noise has a relatively deep
influence on the output spectrum with fifth order intercept points in terms of power
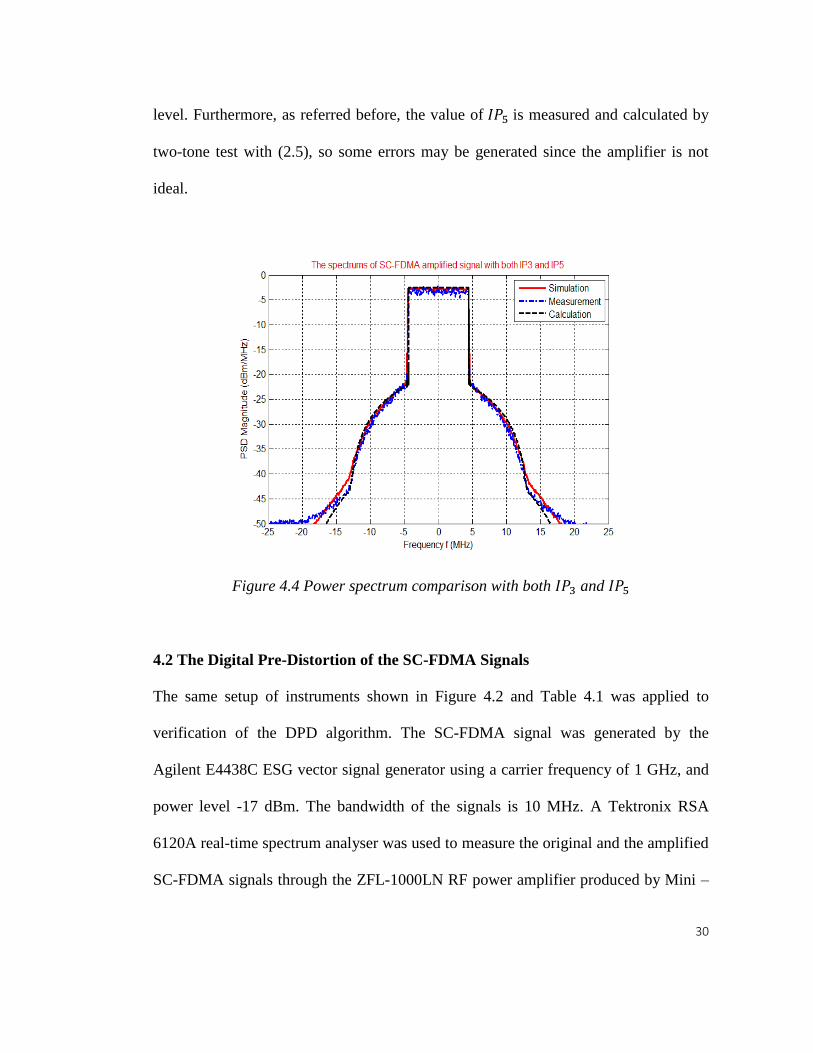
30
level. Furthermore, as referred before, the value of 𝐼𝑃5 is measured and calculated by
two-tone test with (2.5), so some errors may be generated since the amplifier is not
ideal.
Figure 4.4 Power spectrum comparison with both 𝐼𝑃3 and 𝐼𝑃5
4.2 The Digital Pre-Distortion of the SC-FDMA Signals
The same setup of instruments shown in Figure 4.2 and Table 4.1 was applied to
verification of the DPD algorithm. The SC-FDMA signal was generated by the
Agilent E4438C ESG vector signal generator using a carrier frequency of 1 GHz, and
power level -17 dBm. The bandwidth of the signals is 10 MHz. A Tektronix RSA
6120A real-time spectrum analyser was used to measure the original and the amplified
SC-FDMA signals through the ZFL-1000LN RF power amplifier produced by Mini –
31
Circuit. The output gain is 20 dB according to the datasheet. The DPD is finally
implemented by MATLAB R2010b.
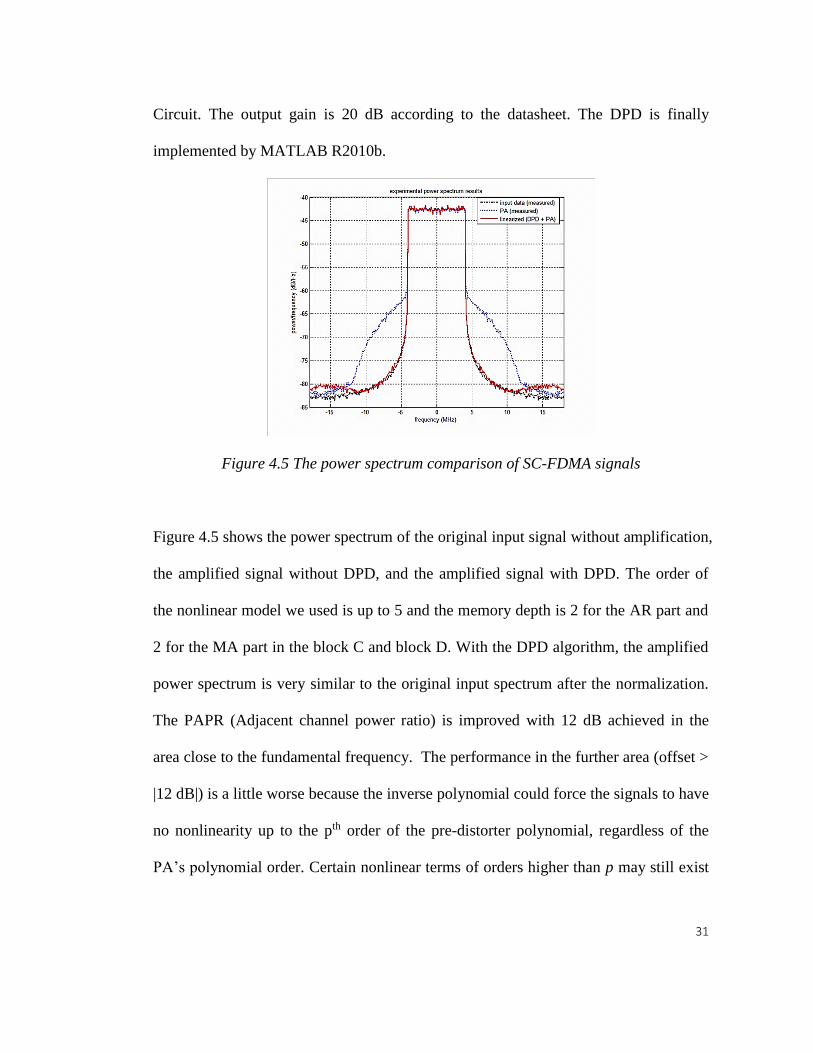
Figure 4.5 The power spectrum comparison of SC-FDMA signals
Figure 4.5 shows the power spectrum of the original input signal without amplification,
the amplified signal without DPD, and the amplified signal with DPD. The order of
the nonlinear model we used is up to 5 and the memory depth is 2 for the AR part and
2 for the MA part in the block C and block D. With the DPD algorithm, the amplified
power spectrum is very similar to the original input spectrum after the normalization.
The PAPR (Adjacent channel power ratio) is improved with 12 dB achieved in the
area close to the fundamental frequency. The performance in the further area (offset >
|12 dB|) is a little worse because the inverse polynomial could force the signals to have
no nonlinearity up to the pth order of the pre-distorter polynomial, regardless of the
PA’s polynomial order. Certain nonlinear terms of orders higher than p may still exist

32
in the compensated output. However, those interferences could be filtered out easily
since they are relatively far from the fundamental frequency.
33
Chapter 5 Concluding Remarks
The research results confirm that spectrum regrowth with RF power amplifiers has
been specified and measured efficiently. This sort of design includes the advantages of
SC-FDMA and is of great help for both designing RF power amplifiers and for further
improving spectrum regrowth with pre-distortion outside channels, which can be
extended to other wireless systems based on SC-FDMA modulation. The spectrum
regrowth analysis technology of SC-FDMA signals is applied and verified in the
testing and simulation work with LTE signals. From the experimental result, it was
supposed that the fifth or higher order intermodulation has little effect on out-of-band
emission power levels. The theoretical result from reasonable calculation is verified
along with experiment outputs. The relationship between power spectrum levels and
nonlinearity coefficients of RF power amplifiers, mainly 𝐼𝑃3 in this thesis, is verified
in the analytical model. Also the ARMA based DPD algorithm with memory
polynomial model is applied to SC-FDMA signals in the LTE uplink system. The
experimental results showed that the DPD algorithm reduced the spectrum regrowth
by 12 dB. With the expression of amplified power emission levels we derived, the
result may help meet the out-of-band requirements of the LTE standards and make
progress with digital pre-distortion in the up-link of LTE systems.
34
References
[01]. H. Xiao, “Spectrum Modeling for Linear RF Power Amplifier Design for
Digital Cellular Communication Signals”, Ph.D. dissertation, Portland State
University, 1999.
[02]. C. M. Liu, “Spectral Modeling and Nonlinear Distortion Analysis of OFDM
Based Wireless LAN Signals”, Ph.D. dissertation, Portland State University, 2005.
[03]. B. S. Chen, “Spectrum Regrowth for OFDM-Based LTE and WINAX Systems”,
M.S. thesis, Portland State University, 2012.
[04]. X. Li, “Nonlinearity Analysis and Predistortion of 4G Wireless
Communication Systems”, Ph.D. dissertation, Portland State University, 2013.
[05]. F. S. Al-kamali, M. I. Dessouky, B. M. Sallam, F. Shawki, F. E. Abd El-Samie,
“Impact of the Power Amplifier on the Performance of the Single Carrier
Frequency Division Multiple Access System”, Telecommunication Systems, vol.
52, no. 1, pp 31-38, 2013.
[06]. R. Sobot, “Wireless Communication Electronics”, Springer Science+Busness
Media, LLC, 2012.
[07]. P. Jantunen, “Modelling of Nonlinear Power Amplifiers for Wireless
Communications”, M.S. thesis, Helsinki University of Technology, 2004.
[08]. S. C. Cripps, “RF Power Amplifiers for Wireless Communications”, Artech
House, INC, 1999.
[09]. L. W.Couch, “Digital and Analog Communication Systems”, New Jersey:
Prentice-Hall, Inc., 1996.
35
[10]. W. Kester, “Intermodulation Distortion Considerations for ADCs”, Analog
Devices, Tutorial MT-012, Rev. A, 2009.
[11]. H. Xiao, Q. Wu, F. Li, “Measure a power amplifier’s fifth-order intercept
point”, RF Design, April, pp. 54–56, 1999.
[12]. X. Li, B.S. Chen, C.M. Liu, X.R. Wang, K.R. Cho, F. Li, “Spectrum modelling
and regrowth for 4G wireless signals”, Electronics Letters, Vol. 48, No 4, 2012.
[13]. C.M. Liu, F. Li, “Nonlinearity analysis of OFDM-based wireless systems in
Orthogonal frequency division multiple access fundamentals and applications”,
Auerbach Publications, Orthogonal Frequency Division Multiple Access
Fundamentals and Applications, Chapter 3, pp. 41–65, 2010.
[14]. M. Jamal, B. Horia, K. Maria, I. Alexandru, “Study of Multiple Access
Schemes in 3GPP LTE OFDMA vs. SC-FDMA”, IEEE Applied Electronics,
International Conference, pp. 1-4, 2011.
[15]. Xixia Leader in Converged IP Testing, “SC-FDMA Single Carrier FDMA in
LTE”, IXIA, 915-2725-01 Rev A, 2009.
[16]. M. Rumney, “3GPP LTE: Introducing Single-Carrier FDMA”, Agilent
Measurement Journal, vol. 4, pp. 18-27, 2008.
[17]. H.G. Myung, J. Lim, D.J. Goodman, “Single Carrier FDMA for Up-link
Wireless Transmission”, IEEE Transactions on Vehicular Technology Magazine,
vol. 3, no. 1, 2006.
[18]. S. Parkvall, “TS 36.211-11.2.0 E-UTRA Physical channels and modulation”,
The 3rd Generation Partnership Project, Rel. 11, Version 11.2.0, 2013.
36
[19]. C.W. Zhu, X. Li, F. Li, ‘Nonlinear analysis of SC-FDMA spectrum for LTE
up-link’ International Journal of Electronics Letters, Vol. 2, Issue 1, pp. 30-36,
2014.
[20]. H. Gandhi, “A Flexible Volterra-Based Adaptive Digital PreDistortion
Solution for Wideband RF Power Amplifier Linearization”, Microwaves and RF
Magazine, Jul. & Aug. 2008.
[21]. Aug. 2008.X. Li, F. Li, “RF Power Amplifiers Nonlinear Modeling with
Memory Effect”, International Journal of Electronics Letters, vol. 1, no. 1, pp. 44-
49, 2013.
[22]. M. Schetzen, “Theory of pth-order inverses of nonlinear systems”, Circuits and
Systems, IEEE Transactions, Vol. 23, Issue 5, 2003.


