

TAM ETG Webinar #3Network Life Cycle Analysis Part 1: Introduction and Overview
Wednesday, July 8, 2015
1
MnDOT TAMPLife Cycle Costing for Pavements

Presentation FrameworkBrief Overview
(development process, components, assets analyzed)
MnDOT’s TAMP Pavement Life Cycle Costs Purpose Process Inputs and Assumptions Strategies and Results
MnDOT’s Post-TAMP Pavement Asset Management Initiative
Collect Better Data on Pavement Maintenance Activities – Labor, Equipment, Materials

Transportation Asset Management Plan (TAMP)
FHWA pilot project
Moving Ahead for Progress in the 21st Century (MAP-21)
Development Process

Asset Inventory & Conditions Risk Analysis Life Cycle Cost Analysis Performance Measures &
Targets Performance Gap
Assessment Financial Plan & Investment
Strategies Implementation & Next Steps
TAMP Components
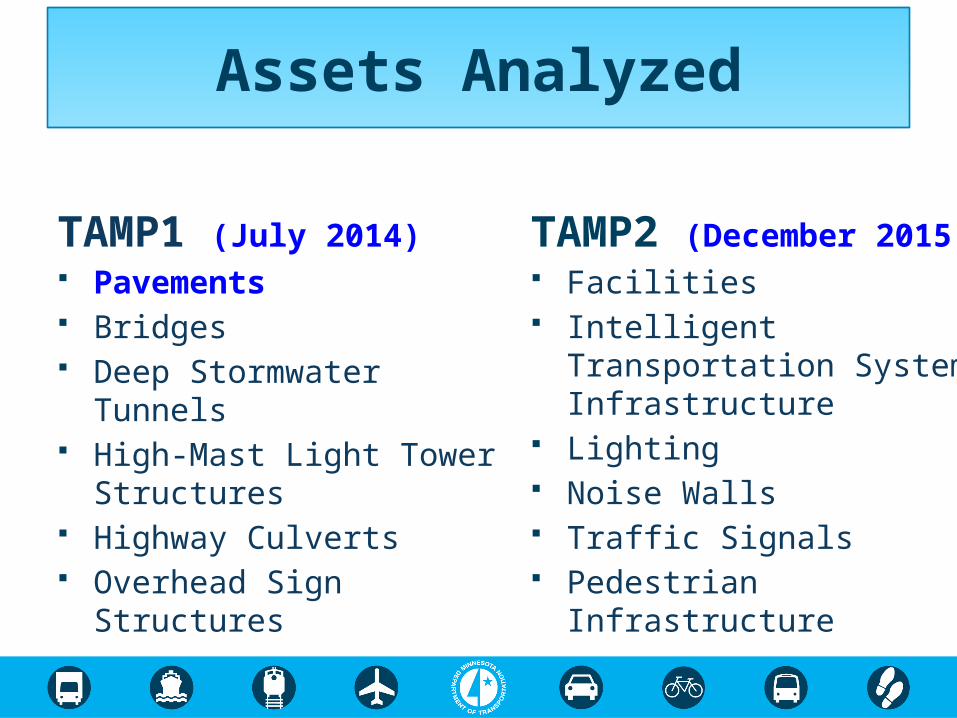
TAMP1 (July 2014) Pavements Bridges Deep Stormwater Tunnels High-Mast Light Tower
Structures Highway Culverts Overhead Sign Structures
TAMP2 (December 2015) Facilities Intelligent Transportation
System Infrastructure Lighting Noise Walls Traffic Signals Pedestrian Infrastructure
Assets Analyzed

MnDOT’s TAMP Pavement Life Cycle Costs
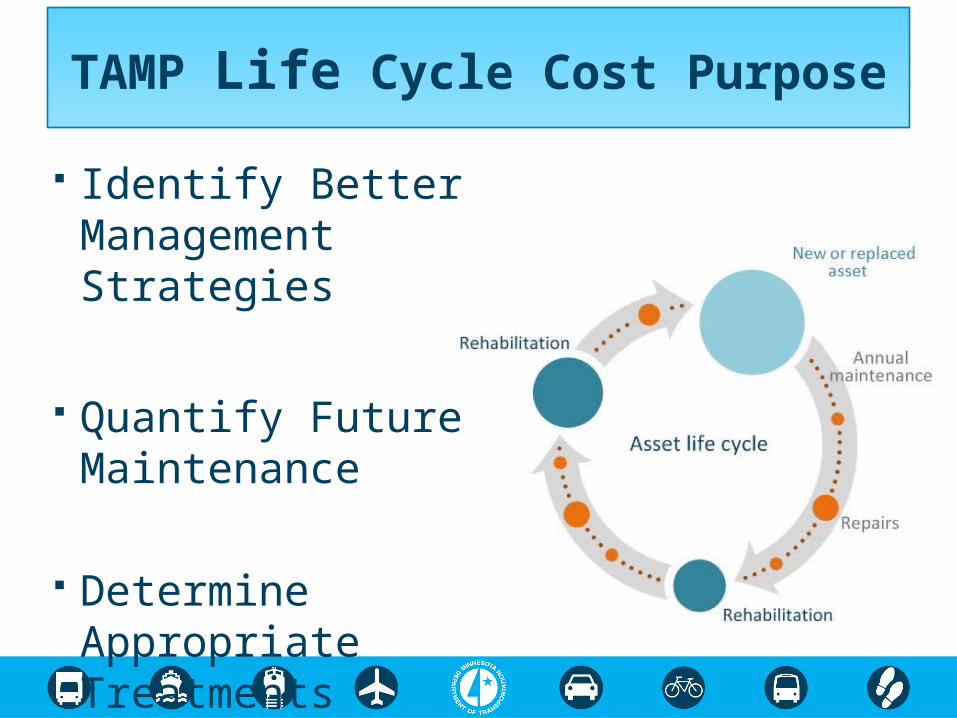
TAMP Life Cycle Cost Purpose
Identify Better Management Strategies
Quantify Future Maintenance
Determine Appropriate Treatments

Life-Cycle Costs Iceberg Initial Capital
Expenditures
Maintenance Costs
Future Capital Costs
Operationalcosts are not part of LCC, but are part of
overall management $
Background image: http://www.pvisoftware.com/blog/wp-content/uploads/2013/11/Pegasus_vertex_Iceberg.png
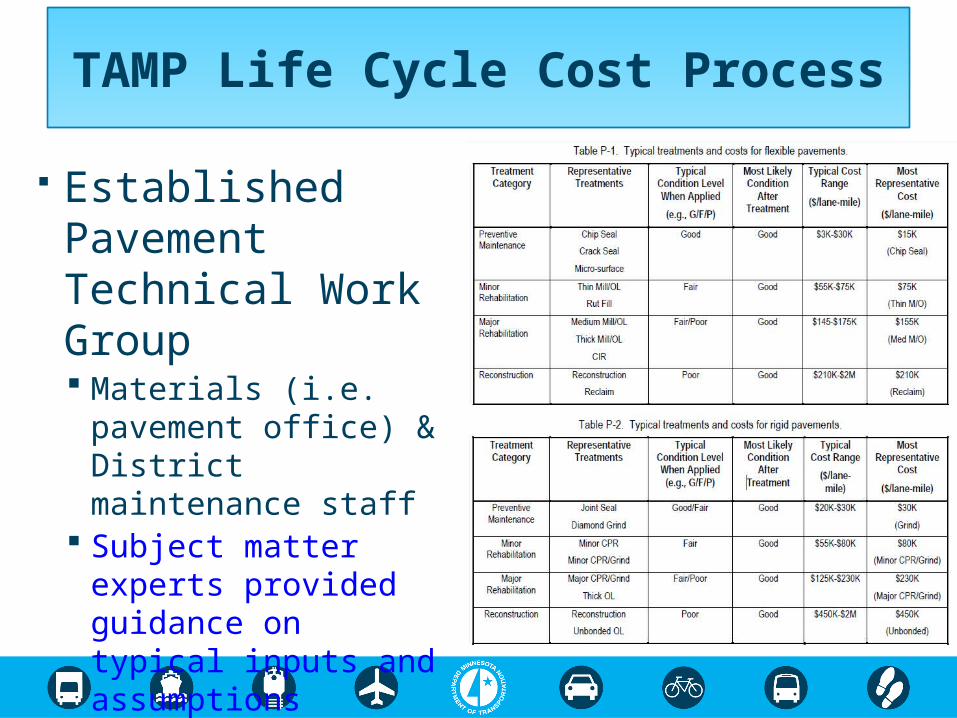
TAMP Life Cycle Cost Process
Established Pavement Technical Work Group Materials (i.e. pavement
office) & District maintenance staff
Subject matter experts provided guidance on typical inputs and assumptions
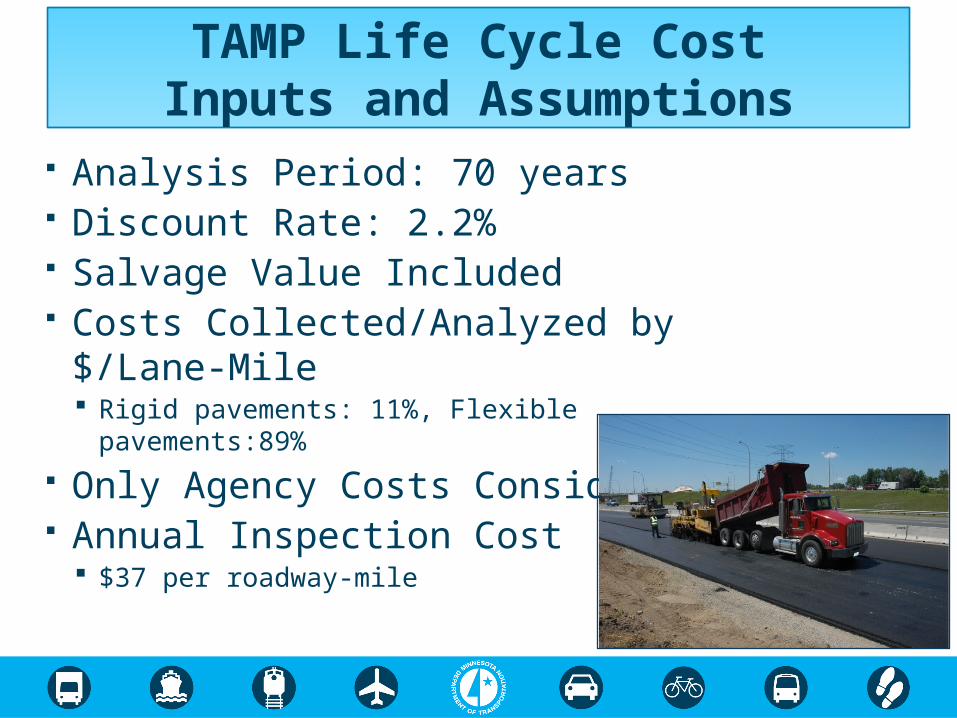
TAMP Life Cycle CostInputs and Assumptions
Analysis Period: 70 years Discount Rate: 2.2% Salvage Value Included Costs Collected/Analyzed by $/Lane-Mile
Rigid pavements: 11%, Flexible pavements:89%
Only Agency Costs Considered Annual Inspection Cost
$37 per roadway-mile

TAMP Life Cycle CostInputs and Assumptions
Routine & Reactive Maintenance MnDOT Metro spent $1.4 Million in 2012 Maintenance investment by condition
(G/F/P) could not be determined Maintenance performed 482 ln-mi of
pavements: 295 in Good, 161 in Fair and 26 in Poor
Weighting factors applied to maintenance costs: Good-0.8, Fair-1.2, Poor-1.8 Equates to Good-$2340/ln-mi, Fair-$3480/ln-
mi, Poor-$5229/ln-mi

Life Cycle CostsStrategies & Results
Typical, Desired, Worst First Strategies Identify minor and major rehab surface treatments for asphalt
and concrete
Deterioration Models for Various LCCA Scenarios

Mill & Overlay Strategy (Flexible Pavements)
Typical Pavement Age (yrs)
Pavement Age Range
(yrs)Treatment
Typical Condition When Applied
Typical Cost ($/ln-mi) Cost Range ($/ln-mi)
0 0 Initial Construction - $657,500 $210,000 - $2,000,000
8 6-10 Crack Treatment Good $6,000 $3,000 - $10,000
12 10-14 Surface Treatment Good $15,000 $10,000 - $30,000
20 18-22 Mill & Overlay (1st Overlay) Fair $155,000 $145,000 - $175,00024 21-25 Crack Treatment Good $6,000 $3,000 - $10,000
26 25-29 Surface Treatment Fair $15,000 $10,000 - $30,000
35 33-35 Mill & Overlay (2nd Overlay) Fair $155,000 $145,000 - $175,000
39 36-40 Crack Treatment Good $6,000 $3,000 - $10,000
41 39-43 Surface Treatment Fair $15,000 $10,000 - $30,000
47 45-49 Mill & Overlay (3rd Overlay) Poor $155,000 $145,000 - $175,00051 49-53 Crack Treatment Good $6,000 $3,000 - $10,00053 51-55 Surface Treatment Fair $15,000 $10,000 - $30,00057 55-59 Mill & Overlay (4th Overlay) Poor $155,000 $145,000 - $175,00061 59-63 Crack Treatment Good $6,000 $3,000 - $10,00063 61-65 Surface Treatment Fair $15,000 $10,000 - $30,00065 63-67 Mill & Overlay (5th Overlay) Poor $155,000 $145,000 - $175,00068 66-70 Crack Treatment Good $6,000 $3,000 - $10,00070 68-72 Reconstruction Fair $657,500 $210,000 - $2,000,000

Typical Pavement Age (yrs)
Pavement Age Range
(yrs)Treatment
Typical Condition When Applied
Typical Cost ($/ln-mi) Cost Range ($/ln-mi)
0 0 Initial Construction - $657,500 $210,000 - $2,000,000
8 6-10 Crack Treatment Good $6,000 $3,000 - $10,000
12 10-14 Surface Treatment Good $15,000 $10,000 - $30,000
20 18-22 Mill & Overlay (1st Overlay) Fair $155,000 $145,000 - $175,000
23 21-25 Crack Treatment Good $6,000 $3,000 - $10,000
27 25-29 Surface Treatment Fair $15,000 $10,000 - $30,000
35 33-35 Mill & Overlay (2nd Overlay) Fair $155,000 $145,000 - $175,000
38 36-40 Crack Treatment Good $6,000 $3,000 - $10,000
43 41-45 Surface Treatment Fair $15,000 $10,000 - $30,000
50 47-53 FDR/Reconstruction - $657,500 $210,000 - $2,000,00058 56-60 Crack Treatment Good $6,000 $3,000 - $10,000
62 60-64 Surface Treatment Good $15,000 $10,000 - $30,000
70 68-72Mill & Overlay (1st Overlay after FDR/Reconstruction)
Fair $155,000 $145,000 - $175,000
FDR/Reconstruction Strategy (Flexible Pavements)
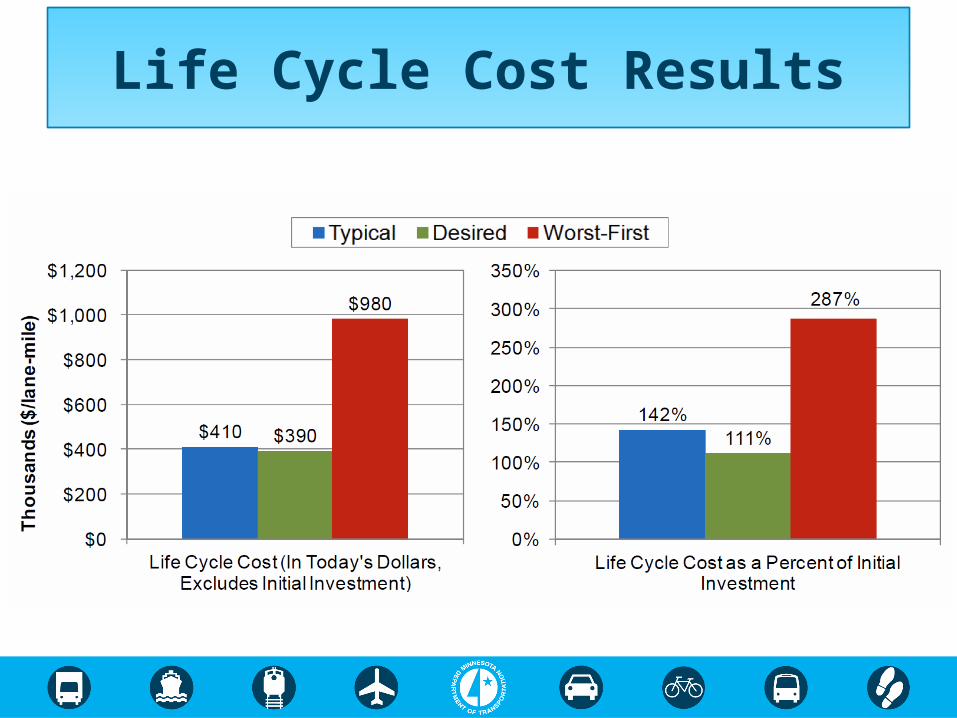
Life Cycle Cost Results
MnDOT’s Post-TAMP Pavement Asset
Management Initiative

“Understand Life Cycle Costs of Major Assets” – Maintenance costs (TAMP)
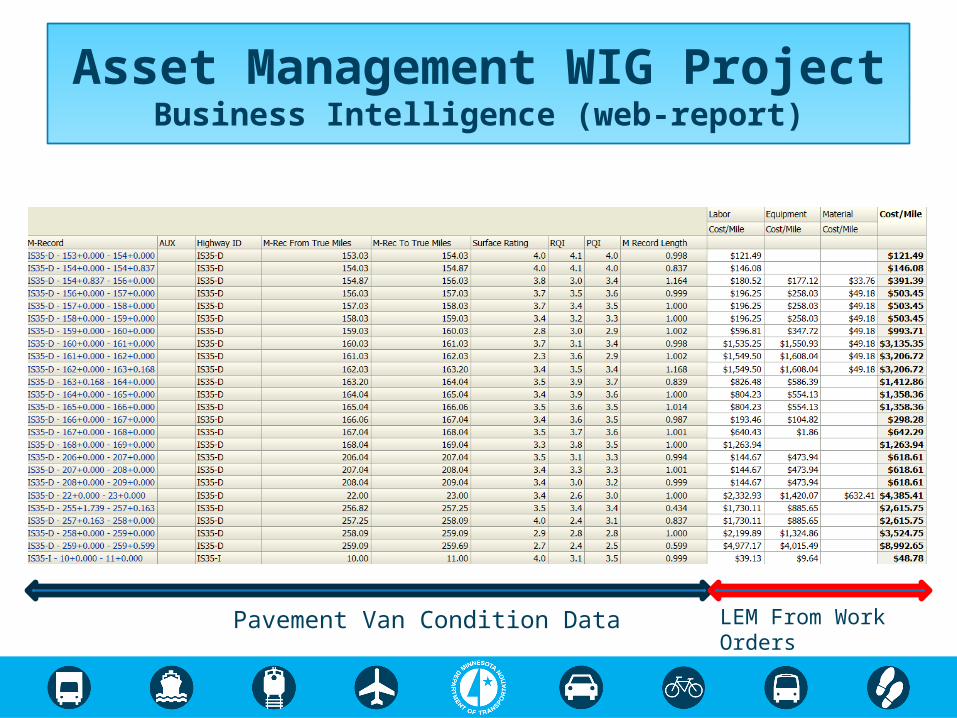
Phase 1: Determine how much “labor, equipment, material (LEM)” was spent at certain asset conditions?
Pavement Entering LEM in RCA; assigning reference points for certain (maint.) source codes RCA RECORD is being divided into segments; matched to condition data from pavement Van (M-records)
Asset Management WIG ProjectAgency goal
THREE M-RECORDS
Roadway Segment
0 1 2 3 4RCA RECORD (TOTAL LEM)
Reference Points
LEM1LEM2 LEM3
18
Pavement Van Condition Data LEM From Work Orders
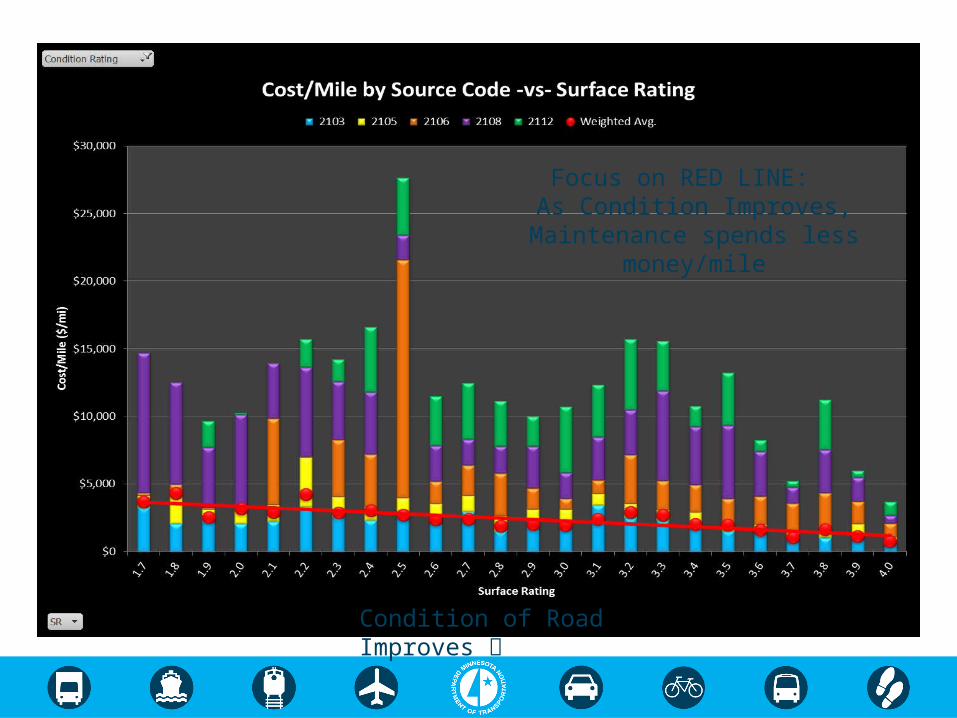
Asset Management WIG ProjectBusiness Intelligence (web-report)
19
Condition of Road Improves
Focus on RED LINE: As Condition Improves, Maintenance
spends less money/mile

Typical Pavement
Age* (yrs)
Pavement Age
Range** (yrs)
TreatmentTypical Condition
When AppliedTypical Cost ($/ln-mi)*** Cost Range ($/ln-mi)***
0 0 Initial Construction - $657,500# $210,000 - $2,000,000
8 6-10 Crack Treatment Good $6,000 $3,000 - $10,000
12 10-14 Surface Treatment Good $15,000 $10,000 - $30,000
20 18-22 Mill & Overlay (1st Overlay) Fair $155,000 $145,000 - $175,000
23 21-25 Crack Treatment Good $6,000 $3,000 - $10,000
27 25-29 Surface Treatment Fair $15,000 $10,000 - $30,000
35 33-35Mill & Overlay (2nd
Overlay)Fair $155,000 $145,000 - $175,000
38 36-40 Crack Treatment Good $6,000 $3,000 - $10,000
43 41-45 Surface Treatment Fair $15,000 $10,000 - $30,000
50 47-53 FDR/Reconstruction - $657,500# $210,000 - $2,000,000
58 56-60 Crack Treatment Good $6,000 $3,000 - $10,000
62 60-64 Surface Treatment Good $15,000 $10,000 - $30,000
70 68-72Mill & Overlay (1st Overlay after FDR/Reconstruction)
Fair $155,000 $145,000 - $175,000
Pavement Life Cycle Cost Strategy
Thank You!
For further information contact Kirby Becker
[email protected] / (651) 366-3740
Or visithttp://www.dot.state.mn.us/assetmanagement


