

The Philippine The Philippine Health Care Health Care
System:System: An UpdateAn UpdateJaime Z. Galvez Tan, MD, MPHJaime Z. Galvez Tan, MD, MPH
[email protected]@gmail.com+63917 853 7798+63917 853 7798

A Community Participatory A Community Participatory ExerciseExercise
On a separate sheet of On a separate sheet of paper, write one word paper, write one word
that you feel would best that you feel would best describe the Philippine describe the Philippine
Health Situation Health Situation

The Philippines The Philippines 20062006
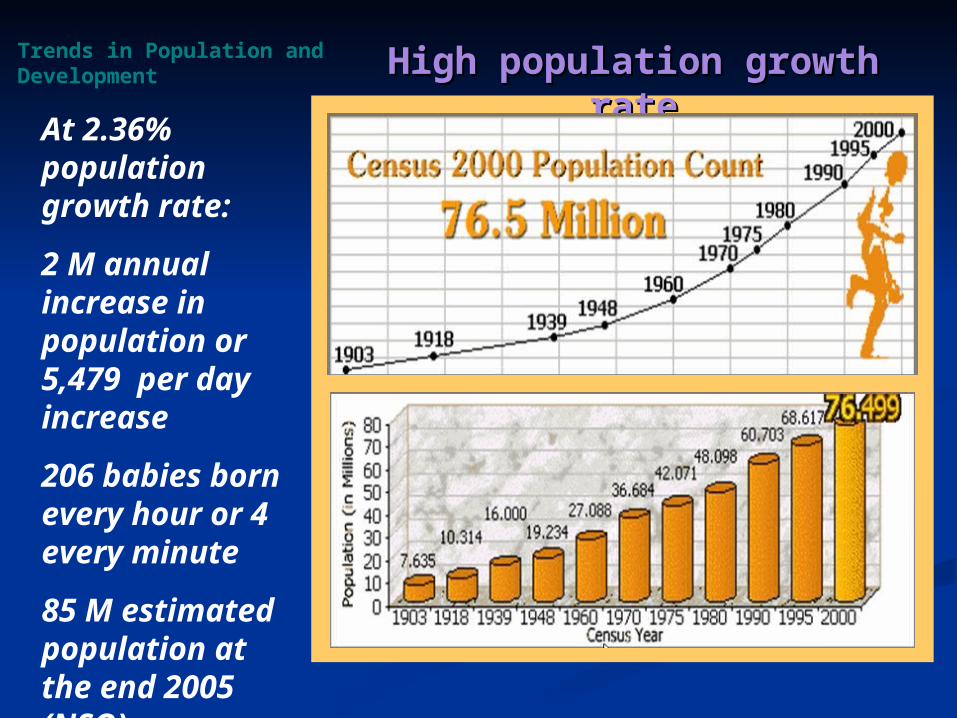
High population growth High population growth raterate
Trends in Population and Development
At 2.36% population growth rate:
2 M annual increase in population or 5,479 per day increase
206 babies born every hour or 4 every minute
85 M estimated population at the end 2005 (NSO)

The Good The Good News…..News…..
BUTBUT
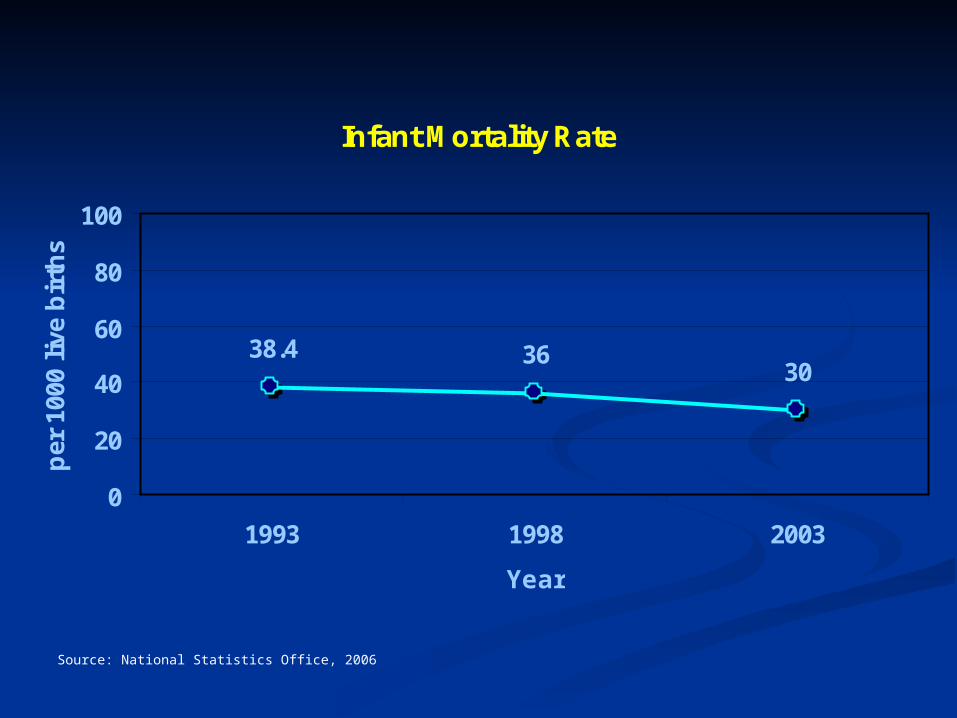
Infant Mortality Rate
38.4 3630
0
20
40
60
80
100
1993 1998 2003
Year
per
100
0 li
ve b
irth
s
Source: National Statistics Office, 2006
020406080
100120140
PerThousand
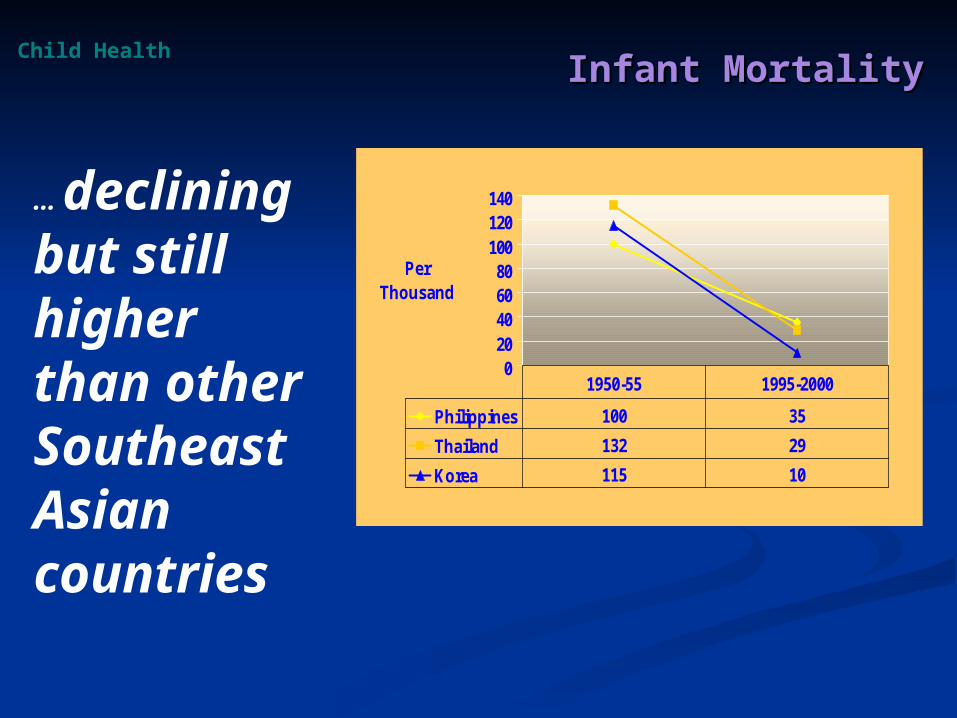
Philippines 100 35
Thailand 132 29
Korea 115 10
1950-55 1995-2000
Infant MortalityInfant Mortality
… declining but still higher than other Southeast Asian countries
Child Health

Maternal Mortality Ratio
209
172
0
50
100
150
200
250
1993 1998
Year
Ra
tio
Source: National Statistics Office, 2006
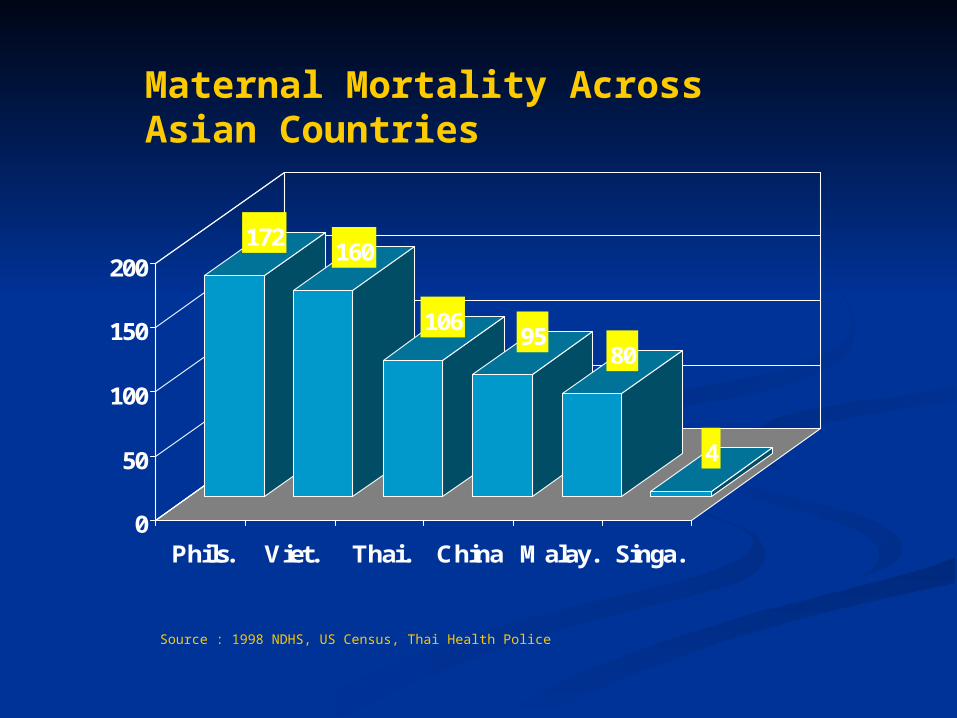
172160
10695
80
4
0
50
100
150
200
Phils. Viet. Thai. China Malay. Singa.
Source : 1998 NDHS, US Census, Thai Health Police
Maternal Mortality Across Asian Countries
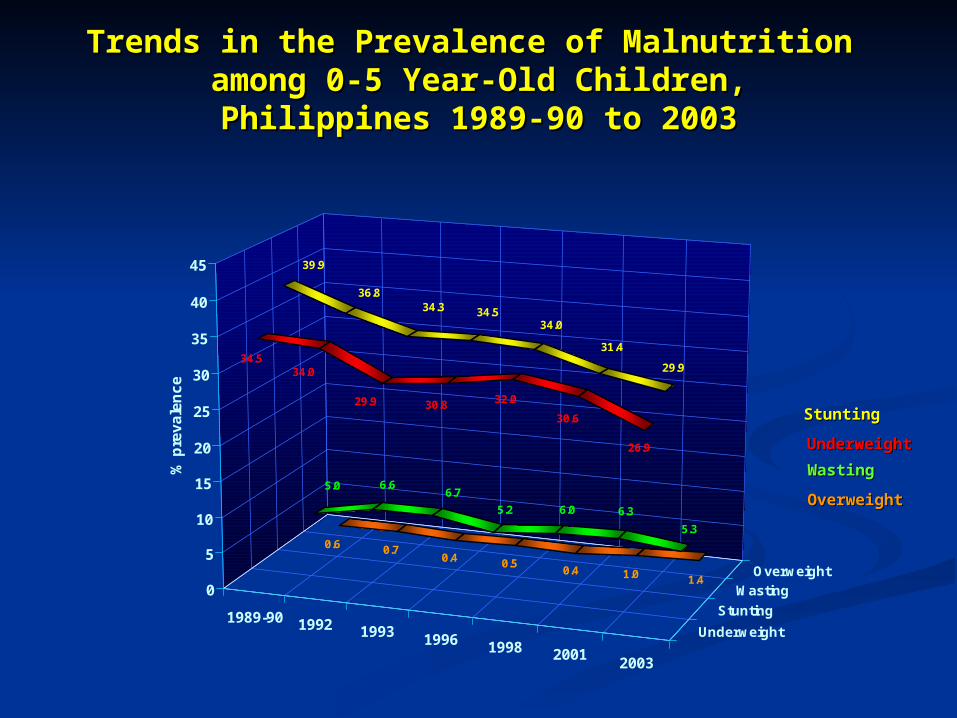
1989-90 1992 1993 1996 1998 20012003
Underweight
Stunting
Wasting
Overweight
0.6 0.70.4 0.5
0.4 1.0 1.4
5.0 6.66.7
5.2 6.0 6.3
5.3
39.9
36.834.3 34.5
34.0
31.4
29.934.5
34.0
29.9 30.8 32.0
30.6
26.9
0
5
10
15
20
25
30
35
40
45
% p
rev
ale
nc
e
OverweightOverweight
Trends in the Prevalence of Malnutrition Trends in the Prevalence of Malnutrition among 0-5 Year-Old Children,among 0-5 Year-Old Children,Philippines 1989-90 to 2003Philippines 1989-90 to 2003
UnderweightUnderweight
StuntingStunting
WastingWasting

Yes Declining Yes Declining Malnutrition but…Malnutrition but…
A cohort of A cohort of 3.3. million3.3. million children children 0-5 years old remain in chronic 0-5 years old remain in chronic malnutrition throughout their malnutrition throughout their pre-school years.pre-school years.
This means one fourth of Filipino This means one fourth of Filipino pre-school children are always at pre-school children are always at high risk of mental and physical high risk of mental and physical retardationretardation..

1989-90 1992 1993 19961998
20012003
Underweight
Stunting
Overweight
0.10.2 0.6
0.4n
0.8 1.3
44.842.8
42.2
39.140.8
41.1
35.834.232.5
30.5
28.330.2
32.9
25.6
0
5
10
15
20
25
30
35
40
45
50
% p
rev
ale
nc
e
OverweightOverweight
UnderweightUnderweight
StuntingStunting
Trends in the Prevalence of Malnutrition Trends in the Prevalence of Malnutrition of 6-10 Year-Old Children,of 6-10 Year-Old Children,
Philippines 1989-90 to 2003Philippines 1989-90 to 2003

Yes among elementary Yes among elementary school children, declining school children, declining
malnutrition but…malnutrition but…A cohort of 3.6 million school children A cohort of 3.6 million school children
age 6 to 10 years old remain in chronic age 6 to 10 years old remain in chronic malnutrition during their school years. malnutrition during their school years. They would likely not perform well and They would likely not perform well and most likely drop out.most likely drop out.
This means one fourth of our future work force This means one fourth of our future work force will be physically and mentally deficient.will be physically and mentally deficient.

Proportion of Mothers Delivered By A Health Professional
28.2 34.2
59.8
0
20
40
60
80
100
1993 1998 2003
Year
Pro
po
rtio
n
Source: National Demographic and Health Surveys ; National Statistics Office, 2006

Proportion of Mothers Delivering at Home
71.565.5 61.4
0
20
40
60
80
100
1993 1998 2003
Year
Pro
po
rtio
n
Source: National Demographic and Health Surveys; National Statistics Office, 2006
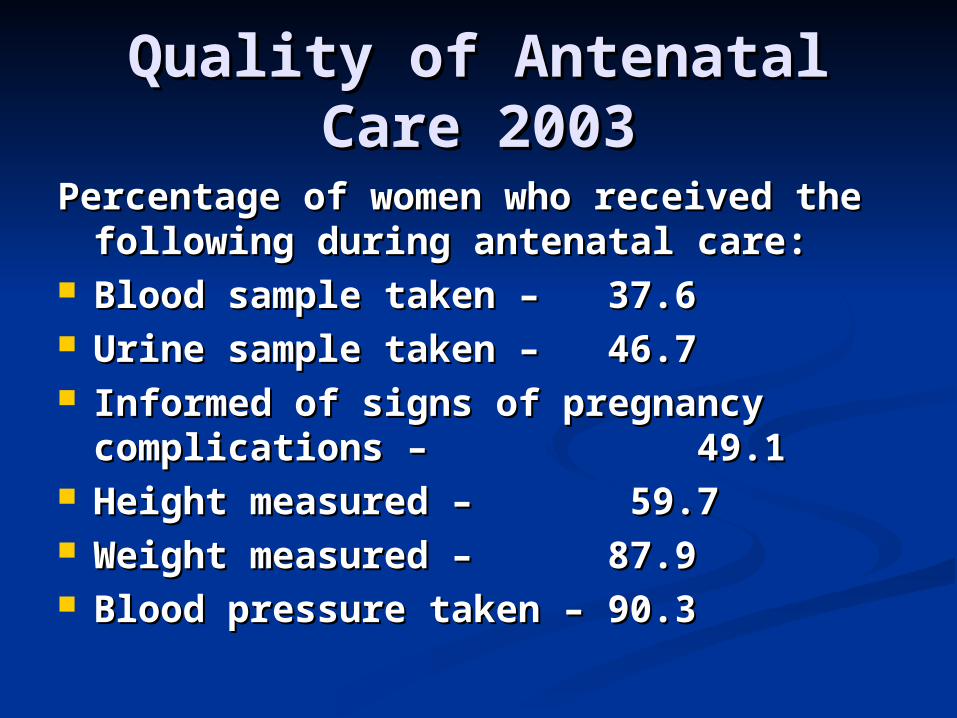
Quality of Antenatal Care Quality of Antenatal Care 20032003
Percentage of women who received the Percentage of women who received the following during antenatal care:following during antenatal care:
Blood sample taken – 37.6Blood sample taken – 37.6 Urine sample taken – 46.7Urine sample taken – 46.7 Informed of signs of pregnancy Informed of signs of pregnancy
complications – 49.1complications – 49.1 Height measured – 59.7Height measured – 59.7 Weight measured – 87.9Weight measured – 87.9 Blood pressure taken – 90.3Blood pressure taken – 90.3

NowNow
The Bad The Bad News……News……

1965 1970 1975 1980 1985 1990 1995 2000 2002
0%
10%
20%
30%
40%
50%
60%
70%
80%
90%
100%P
erce
nt
Year
Death by Attendance in 5-year I ntervals, Philippines 1965-2002
Unattended
Attended
Source: National Statistics Office, 2006
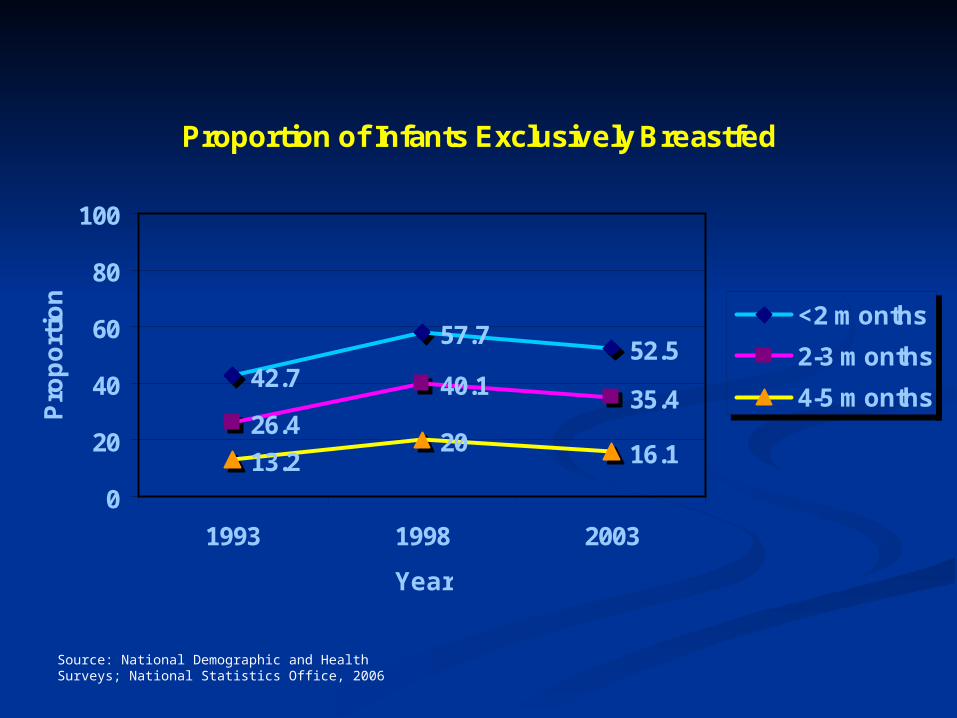
Proportion of Infants Exclusively Breastfed
42.7
57.752.5
26.4
40.1 35.4
13.220 16.1
0
20
40
60
80
100
1993 1998 2003
Year
Pro
po
rtio
n
<2 months
2-3 months
4-5 months
Source: National Demographic and Health Surveys; National Statistics Office, 2006

Proportion of Fully Immunized Children
69.458.2
65.3 64.5 65.2 61.3 62.9 59.9
0
20
40
60
80
100
1993 1997 1998 1999 2000 2001 2002 2003
Year
Pro
po
rtio
n
Source: National Statistics Office, 2006
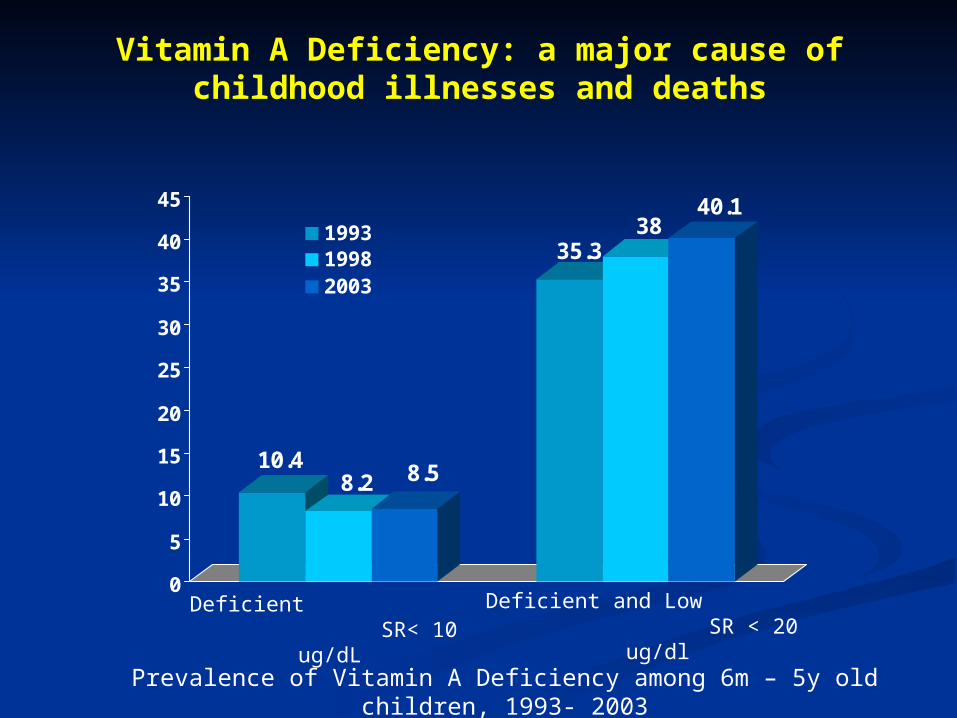
10.48.2 8.5
35.338
40.1
0
5
10
15
20
25
30
35
40
45
199319982003
Deficient SR< 10 ug/dL
Deficient and Low SR < 20 ug/dl
Prevalence of Vitamin A Deficiency among 6m – 5y old children, 1993- 2003
Vitamin A Deficiency: a major cause of childhood illnesses and deaths

49.2
25.7
42.0
56.6
29.6
35.6
65.9
29.1
37.4
0
10
20
30
40
50
60
70
6 mos - < 1 y 1 - 5 y 6 - 12 y
%
199319982003
Prevalence of anemia among children: 1993, 1998, and 2003
Anemia: a major cause of poor school performance Anemia: a major cause of poor school performance and school drop-outand school drop-out

0
50100
150
200
250300
$
Bottom 30% Middle 30% Top 40%
Income Class
Expenditures for Medicine within the Mean Health Expenditure
Source: The Filipino Poverty Report Card, World Bank, Social Weather Station 2001

Why the Good News Why the Good News but….but….
Why the Bad News….Why the Bad News….
An analysis of the An analysis of the some of some of the the immediate causesimmediate causes

2.53
2.03
1.81
1.55 1.6
1.84
1.4
1.1
0
0.5
1
1.5
2
2.5
3
%
1998 1999 2000 2001 2002 2003 2004 2005
Year
Proportion of the Health Budget in the Philippine National Budget
Source: National Statistical Coordination Board, 2005
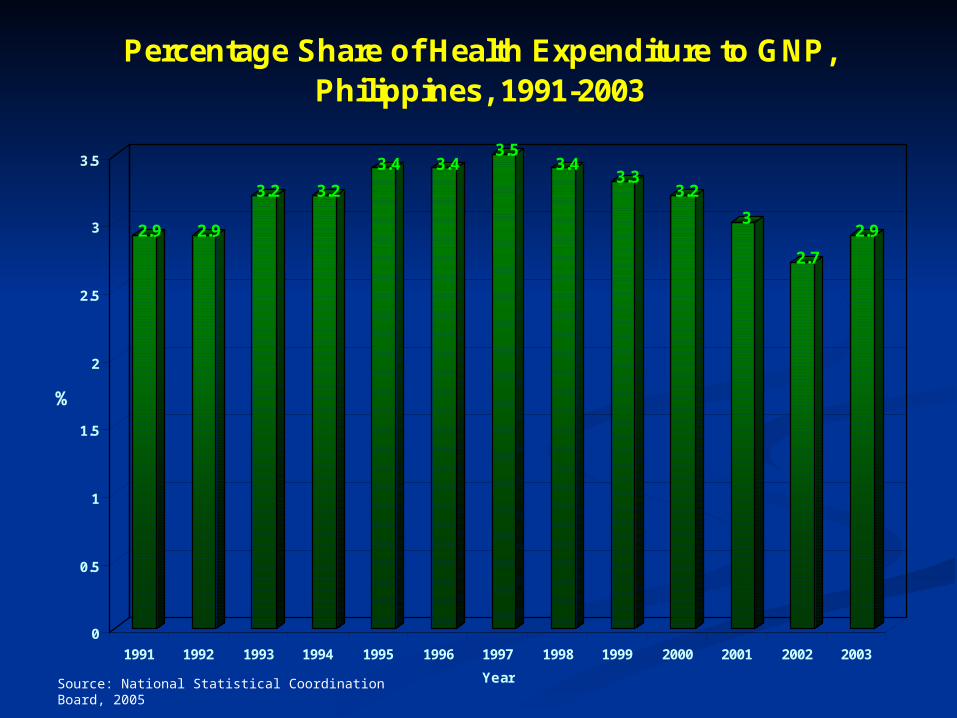
2.9 2.9
3.2 3.2
3.4 3.43.5
3.43.3
3.2
3
2.7
2.9
0
0.5
1
1.5
2
2.5
3
3.5
%
1991 1992 1993 1994 1995 1996 1997 1998 1999 2000 2001 2002 2003
Year
Percentage Share of Health Expenditure to GNP, Philippines, 1991-2003
Source: National Statistical Coordination Board, 2005
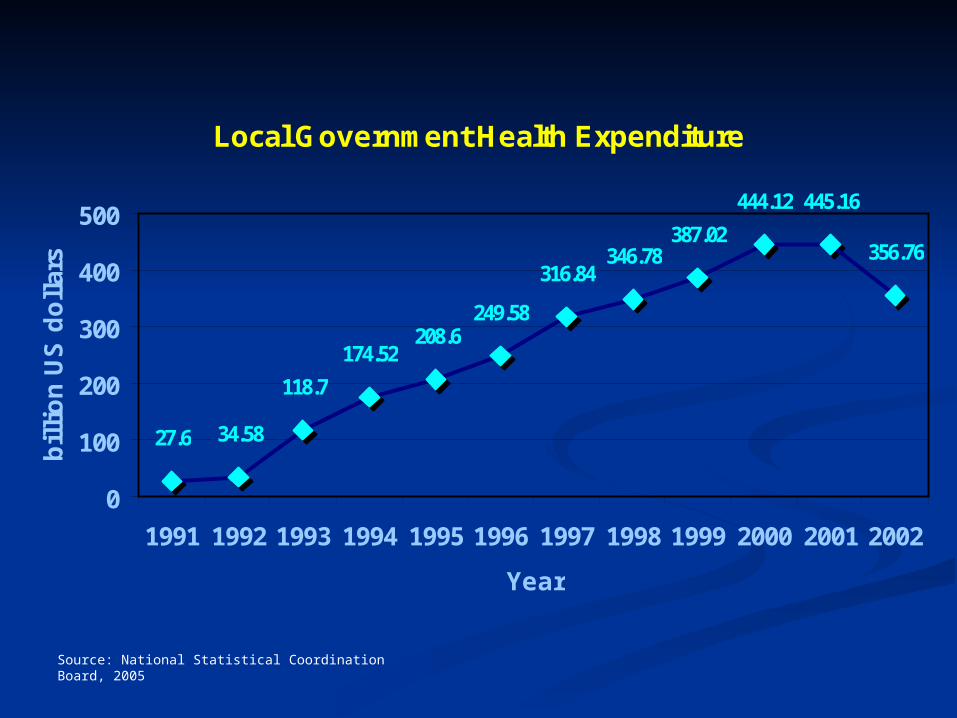
Local Government Health Expenditure
27.6 34.58
118.7
174.52208.6
249.58
316.84346.78
387.02
444.12 445.16
356.76
0
100
200
300
400
500
1991 1992 1993 1994 1995 1996 1997 1998 1999 2000 2001 2002
Year
bil
lio
n U
S d
oll
ars
Source: National Statistical Coordination Board, 2005

Philippine Health Insurance Program, 2003
70%
43% 27%
15%
11%
2%2%
Non-members
Privately Employed
Government Employed
Individually Paying
Indigents/Sponsored
OFWs
Others
Source: NDHS, 2003

If all data accounted for, at least 100,000 Nurses left in the last 10 ten years – the highest volume in
history
Note: full USA data not Note: full USA data not accounted for accounted for
Source: Source: Professional RegulationCommission, 2004
Deployment of Filipino Nurses, 1994-2003
0
2,000
4,000
6,000
8,000
10,000
12,000
14,000
16,000
18,000
20,000
1994 1995 1996 1997 1998 1999 2000 2001 2002 2003
VOLUME
YEAR VOLUME
1994 6,699
1995 7,584
1996 4,734
1997 4,242
1998 4,591
1999 5,413
2000 7,683
2001 13,536
2002 11,911
2003 18,450
TOTAL 84,843
Average (10-year period)
8,931 nurses/year

Nursing Licensure Board Passers
61.45 58.2454.22
50.0255.79
49.86 49.253.5
44.75 48.18 49.68 51.6
010203040506070
Year
board passers
Source: PRC, 2005

Source: Source: Calculated, PRC Data, 2004
Performance of Schools in the NURSING Licensure Examination, 1994-1998, 2001, and 2002
YEAR Passing Rate
of less than 50%
% Passing Rate
of 50% & above
% Total
1994 - 1998
68 38% 113 62% 181
2001 116 48% 124 52% 240
2002 150 63% 87 37% 237
68
113 116124
150
87
0
20
40
60
80
100
120
140
160
1994 - 1998 2001 2002
PassingRate ofless than50%
PassingRate of50% andabove

Source: Source: Professional Regulatory Commission, 2004
Nursing Board Performance
YEAR Number of Examinees
% Increase
Number of Passers
% Increase
Passing Rate
1994 41,459 - 25,477 - 61.45
1995 38,689 -7% 22,532 -12% 58.24
1996 25,163 -35% 13,643 -39% 54.22
1997 19,546 -22% 9,776 -28% 50.02
1998 17,101 -13% 9,541 -2% 55.79
1999 13,152 -23% 6,558 -31% 49.86
2000 9,270 -30% 4,601 -30% 49.63
2001 8,269 -11% 4,430 -4% 53.57
2002 9,449 14% 4,228 -5% 44.75
2003 15,606 65% 7,526 78% 48.23
2004 25,294 62% 12,581 67% 49.74%2005 50,280 25, 951 51.60%Average
(12-year period)
22,785 examinees/year
12,267 registered nurses/year

The Phenomenon The Phenomenon of Doctors of Doctors
Becoming NursesBecoming Nurses““Nursing Medics”Nursing Medics”
Only in the Philippines Only in the Philippines before 2005before 2005
(now no more)(now no more)

Doctors Becoming Doctors Becoming NursesNurses
Around 3,000 doctors have left as Around 3,000 doctors have left as nurses since 2000nurses since 2000
In 2003-2005, more than 4000 In 2003-2005, more than 4000 physicians took the Philippine Board physicians took the Philippine Board of Nursing Licensure Exams of Nursing Licensure Exams
Currently around 3,000 doctors are Currently around 3,000 doctors are enrolled in 45 nursing schools enrolled in 45 nursing schools offering customized courses for offering customized courses for physicians all over the countryphysicians all over the country

Nursing Medics: Who Are Nursing Medics: Who Are They?They?
Around 80% of government physicians Around 80% of government physicians have taken up or are enrolled in nursinghave taken up or are enrolled in nursing
They come from all kinds of specialtiesThey come from all kinds of specialties Their age range from 25 years old to 65 Their age range from 25 years old to 65
years oldyears old Years of practice as a physician range Years of practice as a physician range
from zero to 38 yearsfrom zero to 38 years More females than males; More females than males; They come from all regions of the countryThey come from all regions of the country
Source: Source: KII, Personal Study 2004
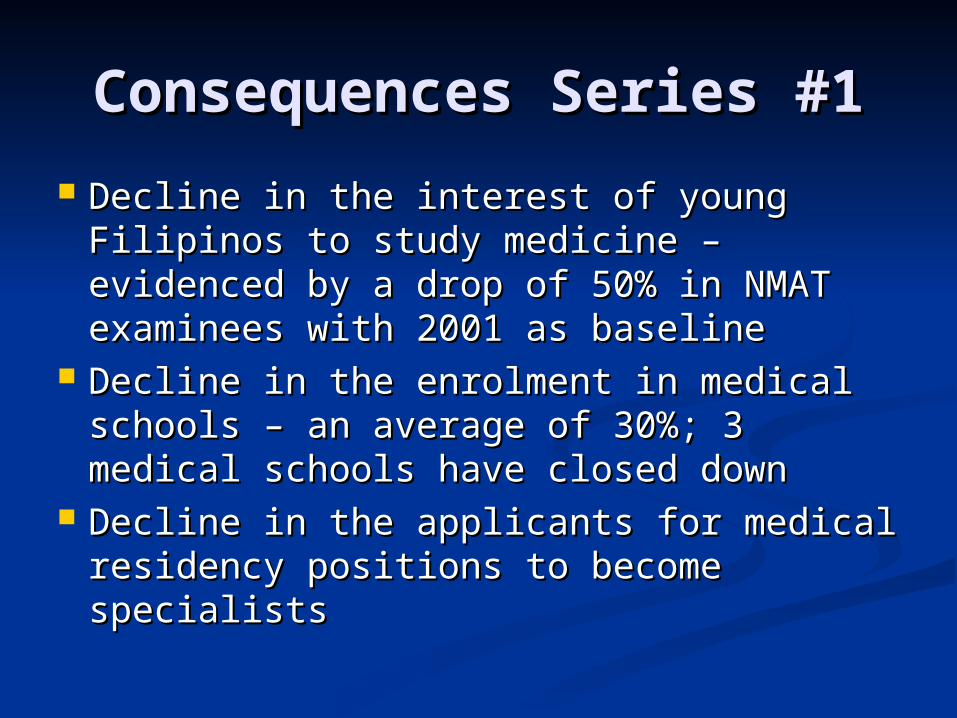
Consequences Series #1Consequences Series #1
Decline in the interest of young Filipinos Decline in the interest of young Filipinos to study medicine – evidenced by a drop to study medicine – evidenced by a drop of 50% in NMAT examinees with 2001 as of 50% in NMAT examinees with 2001 as baselinebaseline
Decline in the enrolment in medical Decline in the enrolment in medical schools – an average of 30%; 3 medical schools – an average of 30%; 3 medical schools have closed downschools have closed down
Decline in the applicants for medical Decline in the applicants for medical residency positions to become specialists residency positions to become specialists
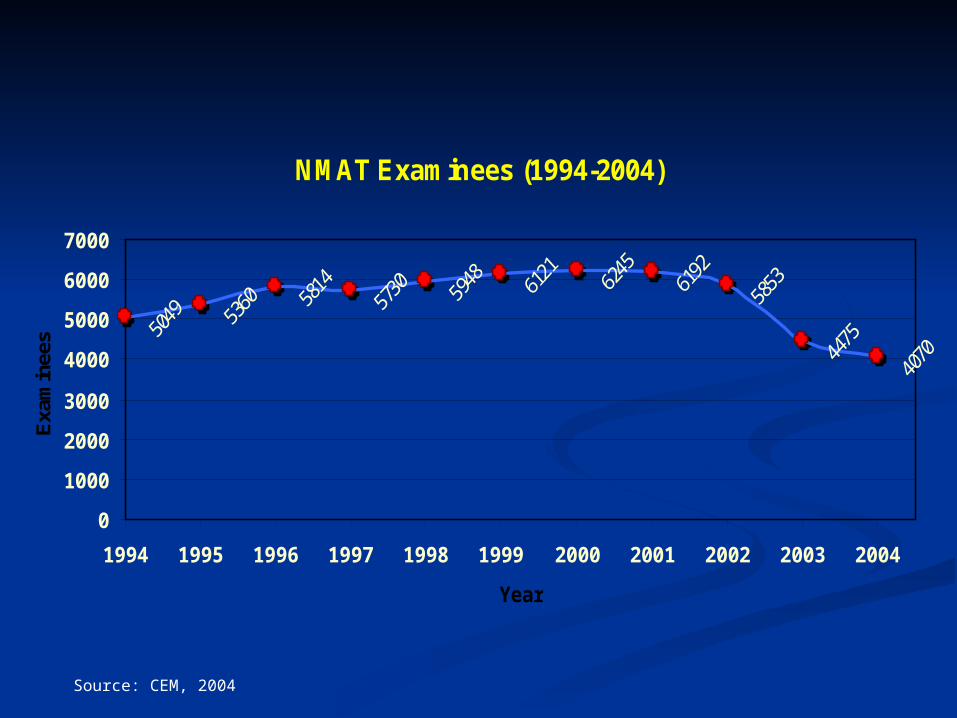
NMAT Examinees (1994-2004)
0
1000
2000
3000
4000
5000
6000
7000
1994 1995 1996 1997 1998 1999 2000 2001 2002 2003 2004
Year
Exa
min
ees
Source: CEM, 2004
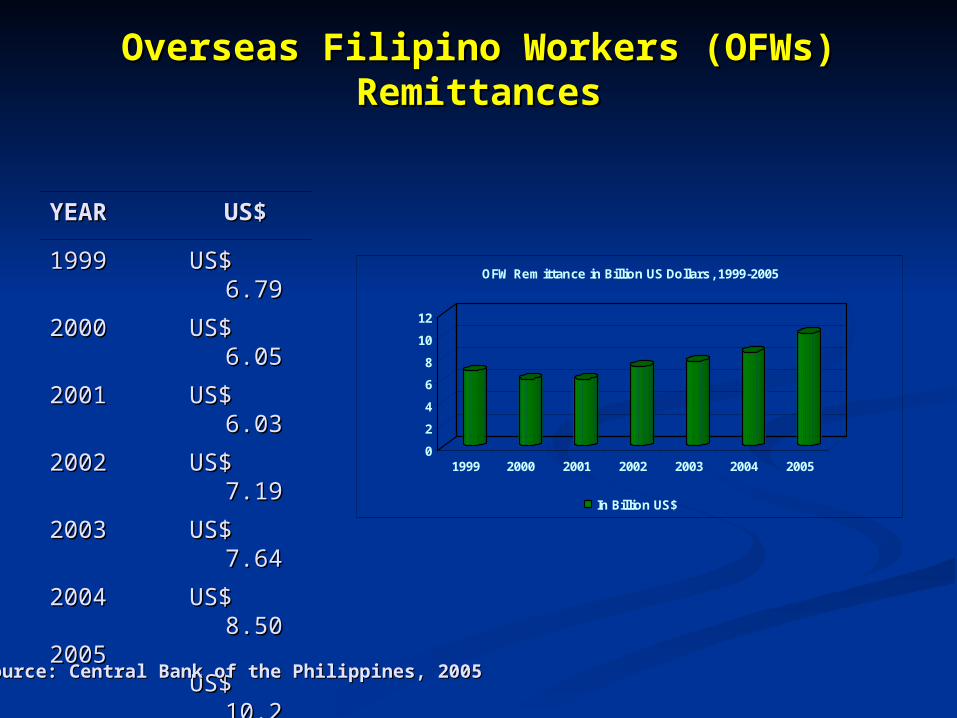
Overseas Filipino Workers (OFWs) Overseas Filipino Workers (OFWs) RemittancesRemittances
YEARYEAR US$US$
19991999 US$ 6.79US$ 6.79
20002000 US$ 6.05US$ 6.05
20012001 US$ 6.03US$ 6.03
20022002 US$ 7.19US$ 7.19
20032003 US$ 7.64US$ 7.64
2004 2004
20052005
US$ 8.50US$ 8.50
US$US$ 10.210.2
Source: Central Bank of the Philippines, 2005Source: Central Bank of the Philippines, 2005
0
2
4
6
8
10
12
1999 2000 2001 2002 2003 2004 2005
OFW Remittance in Billion US Dollars, 1999-2005
In Billion US$

NMATNMAT
NMAT Examinees (1994-2005)
50495360
5814 5730 5948 6121 6245 61925853
44754070
2912
0
1000
2000
3000
4000
5000
6000
7000
1994 1995 1996 1997 1998 1999 2000 2001 2002 2003 2004 2005 2006
Consequences Series #2Consequences Series #2
200 hospitals have closed down within 200 hospitals have closed down within the past two years – no more doctors and the past two years – no more doctors and nursesnurses
800 hospitals have partially closed (with 800 hospitals have partially closed (with one to two wards closed) – lack of doctors one to two wards closed) – lack of doctors and nursesand nurses
Nurse to patient ratios in provincial and Nurse to patient ratios in provincial and district hospitals now 1: 40 to 1: 60district hospitals now 1: 40 to 1: 60
Loss of highly skilled nurses in all Loss of highly skilled nurses in all hospitals across the countryhospitals across the country

Why these bad bad sad Why these bad bad sad sad news!sad news!
An analysis of the An analysis of the some of the some of the major major underlying causes underlying causes

IncomeIncome
Annual average family income: Annual average family income: US$2,619 (FIES 2000)US$2,619 (FIES 2000)
Poverty incidence: 34% or 25.8 million Poverty incidence: 34% or 25.8 million people (NEDA 2001)people (NEDA 2001)
Poverty Self-Rating by Filipinos:Poverty Self-Rating by Filipinos: March 2001: 64% are poor (50 March 2001: 64% are poor (50
M)M) Oct 2005: 75% are poor (64 M)Oct 2005: 75% are poor (64 M) (Pulse Asia Surveys 2001-2005) (Pulse Asia Surveys 2001-2005)

1998 1999 2000 2001 2002
1080
1040
1030 1030
1020
1000
1010
1020
1030
1040
1050
1060
1070
1080
In US DollarsSource: WDI Online, World Bank
Philippine Per Capita Gross National Income

EmploymentEmployment
Total labor force: 35 MillionTotal labor force: 35 Million Total Unemployment Rate: Total Unemployment Rate:
10.1% (LFS Oct. ’03)10.1% (LFS Oct. ’03) Total Underemployment Rate: Total Underemployment Rate:
15.7% ( LFS Oct. ’03)15.7% ( LFS Oct. ’03)

1997
1999
2001
2003
0%
2%
4%
6%
8%
10%
12%
Year
Unemployment Rate, Philippines 2003
Source: http://www.bsp.gov.ph/statistics/spei/tab46b.htm
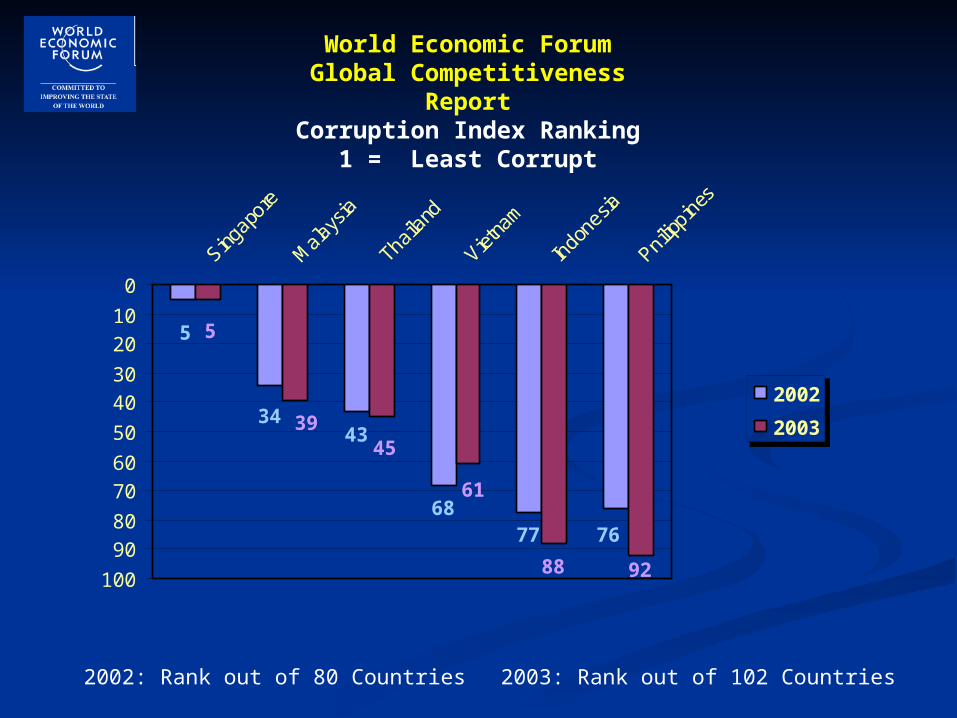
World Economic ForumGlobal Competitiveness Report
Corruption Index Ranking1 = Least Corrupt
2002: Rank out of 80 Countries 2003: Rank out of 102 Countries
43
6877
88
34
76
5
45
61
39
92
5
0
10
20
30
40
50
60
70
80
90
100
Singap
ore
Mala
ysia
Thail
and
Vietna
m
Indo
nesia
Pnilipp
ines
2002
2003

National BudgetNational Budget
Budget deficit 2004: US$5B or Budget deficit 2004: US$5B or 35% of the national budget35% of the national budget
% of National Budget for debt % of National Budget for debt servicing: 30%-45% (2002-04)servicing: 30%-45% (2002-04)
What Can NGOs and POs What Can NGOs and POs Do About the Situation?Do About the Situation?
Advocacy Based StrategiesAdvocacy Based Strategies Local Government Based Strategies Local Government Based Strategies Community Based StrategiesCommunity Based Strategies

Advocacy Based Advocacy Based Strategies #1Strategies #1
Lobby for national policy coherence in Lobby for national policy coherence in health human resource development health human resource development (HHRD). (HHRD).
Lobby (text, write, email, call) the heads of Lobby (text, write, email, call) the heads of the 15 government agencies involved in the 15 government agencies involved in HHRD to regularly meet and speak with HHRD to regularly meet and speak with ONE voice.ONE voice.
These are: DOH, DOLE, POEA, OWWA, These are: DOH, DOLE, POEA, OWWA, CHED, PRC, PhilHealth, PITAHC, DOF, CHED, PRC, PhilHealth, PITAHC, DOF, DFA, NEDA, DBM, TESDA, DOST, DTIDFA, NEDA, DBM, TESDA, DOST, DTI
What NGOs & POs can do?What NGOs & POs can do? ConvergenceConvergence PartnershipPartnership Budget InvolvementBudget Involvement Monitoring/quality standardMonitoring/quality standard Community Management/community basedCommunity Management/community based Policy involvementPolicy involvement Political Reform/Good PoliticsPolitical Reform/Good Politics People empowerment in governancePeople empowerment in governance Development of indigenous resourcesDevelopment of indigenous resources More women leadersMore women leaders Community awareness/education for allCommunity awareness/education for all Health empowermentHealth empowerment equityequity

The Extra ChallengeThe Extra Challenge
NGOs, POs and CommunitiesNGOs, POs and Communities Can Do It !!!!!!Can Do It !!!!!!
Let’s Do It NOW !!!!!Let’s Do It NOW !!!!!

Thank You Very Thank You Very Much!!Much!!
Maraming Maraming Salamat Po!Salamat Po!Jaime Z. Galvez Tan M.D., Jaime Z. Galvez Tan M.D.,
M.P.H.M.P.H.
[email protected]@gmail.com
+63917 853 7798 mobile+63917 853 7798 mobile


19982003
19982003
19982003
Underweight
Underheight
Overweight
LEGEND:
30.226.7
40.836.5
n 1.3
0
10
20
30
40
50
% p
revale
nce
Comparison in the Prevalence of Malnutrition Between 1998 and 2003 among 6-10 Year-Old Children
1998 2003 1998 19982003 2003
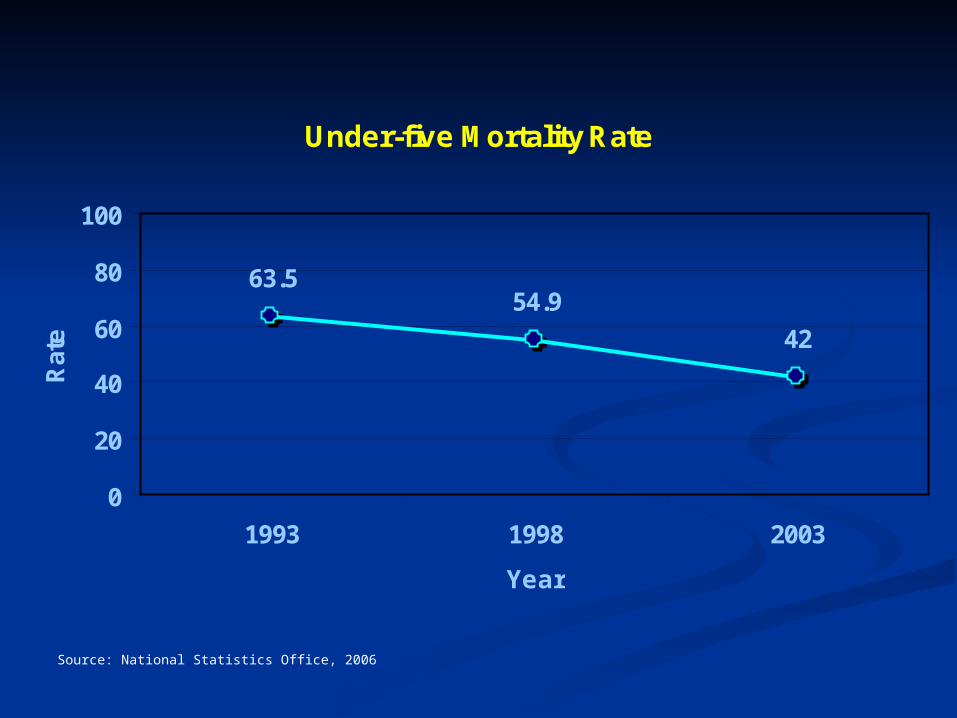
Under-five Mortality Rate
63.554.9
42
0
20
40
60
80
100
1993 1998 2003
Year
Rat
e
Source: National Statistics Office, 2006


