121
MPSC WIC MIS System Detailed Functional Design Document VM Vendor Management Reports Revision Date: June 6, 2017 Maintained by:

MPSC WIC MIS SystemDetailed Functional Design DocumentVM Vendor Management Reports
Revision Date: June 6, 2017
Maintained by:
VM Vendor Management Reports
Products and company names mentioned herein may be the trademarks or registered trademarks of their respective owners. Unmentioned brands or company names are also respected with their own registered trademarks. Some content may be a direct translation from their Web sites.
Document RevisionsRevision
Date Updated By Requested By Description of Revision
5/24/2013 Ciber Team MPSC Amendment 7 Updates4/23/2014 Ciber Team MP User Group Release 4.0 Task Order 3
3/8/2015 Ciber Team MP User Group Release 4.2 Updates3/27/2015 Ciber Team MP User Group Release 5.0 Task Order 4 draft4/12/2015 Ciber Team MP User Group Release 5.0 Task Order 49/10/2015 Ciber Team MP User Group Release 5.01 Updates
12/28/2015 Ciber Team MP User Group Release 5.03 Updates3/3/2016 Ciber Team MP User Group Release 5.04 CI-62
7/22/2016 Ciber Team MP User Group Release 5.05 Updates5/23/17 CDP Team MP User Group Cover page, header, and footer
mods for new M&E contractor
Page of Document Revisions June 6, 2017

VM Vendor Management Reports
Table of Contents1 Introduction.........................................................................................................5
1.1 Security Access with Vendor Reports.........................................................51.2 Chain Based – Vendor Status Selection (Smart Card EBT / Online Xerox EBT / Online CDP EBT)........................................................................................5
2 Vendor Management Reports.............................................................................72.1 General Reports.........................................................................................7
2.1.1 Vendor List.................................................................................................72.1.2 Vendor Authorization Actions Scheduled and Completed........................102.1.3 Vendor Feedback Report.........................................................................112.1.4 Routine Monitoring Report.......................................................................132.1.5 Investigations Conducted Report (State Office Only)...............................152.1.6 Vendor Sanction Summary Report...........................................................172.1.7 Vendor Risk Summary Report (State Office Only)...................................192.1.8 Vendor Completed Education Report.......................................................202.1.9 Vendor Planned Education Report...........................................................222.1.10 Vendor Sales Analysis Report (FI Only).................................................242.1.11 Display FI Report Number Contents Report (FI Only)............................262.1.12 Vendor Mailing Labels............................................................................282.1.13 Vendor Farmers Report..........................................................................302.1.14 Electronic Cash Register System Report...............................................322.1.15 Vendor APL Type Report (Online CDP EBT Only)................................34
2.2 FI Redemption Reports (FI Only)..............................................................372.2.1 Local Agency Redemption Report............................................................372.2.2 Vendor Redemption Rejection Report......................................................392.2.3 Vendor Redemption Summary Report.....................................................412.2.4 Vendor Food Items Purchased Report.....................................................442.2.5 Vendor CVV Redemption Report.............................................................46
2.3 EBT Redemption, Settlement & Reconciliation Reports...........................482.3.1 ACH Payments – Vendor Claims and Adjustments Report (Smart Card EBT Only).............................................................................................................482.3.2 ACH Vendor Payments Report (Smart Card EBT Only)..........................512.3.3 Claim Submission Errors Report (Smart Card EBT / Online Xerox EBT / Online CDP EBT).................................................................................................532.3.4 Expired and Unsettled Vendor Adjustments Report (Smart Card EBT Only) 562.3.5 Point of Sales Errors Report (Smart Card EBT Only)..............................582.3.6 Retailer NTE Exceptions Report (Smart Card EBT / Online Xerox EBT / Online CDP EBT).................................................................................................60
2.4 EBT Analysis (Smart Card EBT / Online Xerox EBT / Online CDP EBT). 632.4.1 EBT Over Redemption Report.................................................................632.4.2 Percent of Food Redeemed – State Report.............................................662.4.3 Percent of Food Redeemed – LA/Clinic Report.......................................69
2.5 EBT Vendor Sales (Smart Card EBT / Online Xerox EBT / Online CDP EBT) 73
2.5.1 UPC/PLU Sales by Vendor Report...........................................................73
June 6, 2017 Table of Contents Page of

VM Vendor Management Reports
2.5.2 Vendor EBT Redemption Summary Report.............................................752.5.3 Vendor EBT Sales Report........................................................................762.5.4 Vendor Formula Stocking Report.............................................................782.5.5 Vendor UPC/PLU Sales Report...............................................................802.5.6 Vendor UPC Price Increase Report.........................................................832.5.7 Vendor Quarterly Report..........................................................................85
2.6 EBT UPC/PLU (Smart Card EBT / Online Xerox EBT / Online CDP EBT)912.6.1 Formula Purchased Report......................................................................912.6.2 Top UPC/PLU Sold Report.......................................................................942.6.3 UPC Price Compare Report.....................................................................962.6.4 UPC/PLU List...........................................................................................992.6.5 UPC/PLU List for Vendors......................................................................1012.6.6 UPC/PLU Not Purchased Report...........................................................1032.6.7 UPC/PLU Purchased Report..................................................................1052.6.8 UPC/PLU APL Type Report (Online CDP EBT Only)............................1082.6.9 UPC/PLU Peer Group Price History Report...........................................111
Page of Document Revisions June 6, 2017

MPSC WIC MIS System VM Vendor Management Reports
1 IntroductionThis reports DFDD contains the reports related to the Vendor Management functional area.
1.1 Security Access with Vendor ReportsIf a report contains the parameter 'Local Agency', only the Local Agencies that the user has been assigned are available in the 'Local Agency' parameter list box. The Authorized Vendor Report is an exception; all Local Agencies is available in the Local Agency parameter list box regardless of the Local Agencies the user has been assigned to.If a report does not contain the parameter 'Local Agency,' the data for all Vendors is returned regardless of the Local Agencies the user has been assigned to.
1.2 Chain Based – Vendor Status Selection (Smart Card EBT / Online Xerox EBT / Online CDP EBT)
Many of these EBT reports have parameters that are based on the Chain Based – Vendor Status selection feature. The following example with sample data explains how this feature works. Here is the sample data for this discussion:
Vendor Chain StatusVendor A Chain 1 ActiveVendor B Chain 2 ActiveVendor C Un-Assigned ActiveVendor X Chain 2 Not Active
Note: The context of Active for this function is vendor status where the Pay indicator is set to Yes (See SA 5 Vendor Management Screens DFDD; Section 7 Vendor Status Codes). Step 1: User accesses the report by clicking on the report name in the navigation tree.
Step 2: The Chain dropdown is defaulted to Select All. The Vendor Status dropdown is defaulted to Active Vendors. User opens Vendors dropdown, and it is filtered to Vendor A, Vendor B and Vendor C. User selects Vendor A and executes report.
Step 3: The User desires to filter based on Chain 2. In the Chain dropdown, user selects Select All which clears the checkboxes then selects Chain 2. This along with the Vendor
June 6, 2017 Vendor Management Reports Page 5 of 113

VM Vendor Management Reports MPSC WIC MIS System
Status being set to Active Vendors filters the Vendor list to Vendor B. All previous Vendor checks are cleared.
Step 4: User selects Inactive Vendors from Vendor Status. This along with the Chain being set to Chain 2 filters the Vendor list to Vendor X. All previous Vendor checks are cleared.
Step 5: User changes mind and selects Select All from Vendor Status. This along with the Chain being set to Chain 2 filters the Vendor list to Vendor B and Vendor X. All previous Vendor checks are cleared.
This example shows how the Chain and Vendor Status work as a filter to determine the vendors that are shown in the Vendor dropdown. Using the Select All and individual checkboxes, the user determines the vendors that are included into the report. There may be other parameters associated with a given report (i.e. start and end dates) but they have no interaction with these three parameters.Note: The above examples use generic references to Chaina and Vendors. The formatting is standard with the exception For Smart Card EBT, Vendor ID formatted to 4 digits (leading zeroes); otherwise format to 5 digits (leading zeroes).
Page 6 of 113 Vendor Management Reports June 6, 2017

MPSC WIC MIS System VM Vendor Management Reports
2 Vendor Management Reports2.1 General Reports
2.1.1 Vendor List
Description List all WIC-authorized active vendors in the selected Local Agency to be given to new clients so they know where to shop. Include Store name and address, phone number, and store type.
Parameters Chain, Vendor Status (All, Active or Inactive), Local Agency, City, Peer Group, Store Type, Date, Sort By (‘Vendor ID’, ‘Vendor Name’ or City), Group By (‘Local Agency’ or ‘Peer Group’)Note: City is disabled until the Local Agency value(s) is selected. After the Local Agency value(s) is selected, the City values that are available are presented based on the physical address of the vendors assigned to the selected Local Agencies.
Record Selection / Filtering / Calculations
Return all vendors associated with the selection parameters.Type = TIP store type. Date = Use when determining selection for Vendor Status and Store Type.
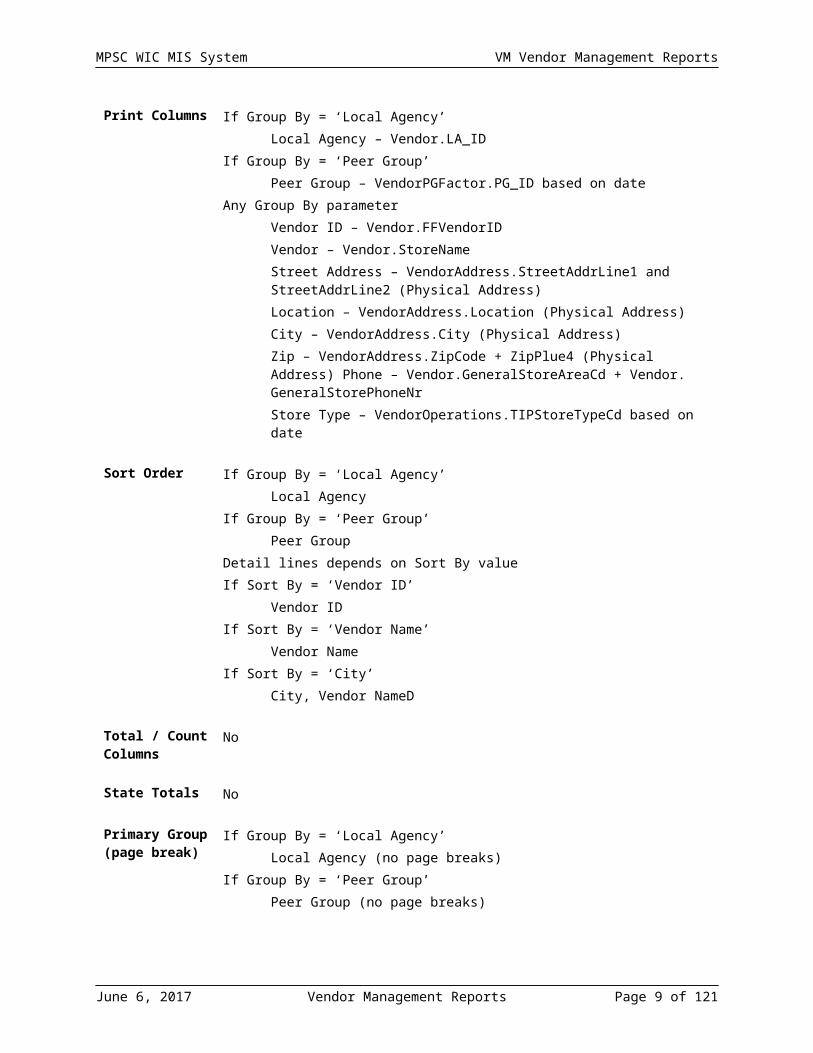
Print Columns
If Group By = ‘Local Agency’Local Agency – Vendor.LA_ID
If Group By = ‘Peer Group’Peer Group – VendorPGFactor.PG_ID based on date
Any Group By parameterVendor ID – Vendor.FFVendorIDVendor – Vendor.StoreNameStreet Address – VendorAddress.StreetAddrLine1 and StreetAddrLine2 (Physical Address)Location – VendorAddress.Location (Physical Address)City – VendorAddress.City (Physical Address)Zip – VendorAddress.ZipCode + ZipPlue4 (Physical Address) Phone – Vendor.GeneralStoreAreaCd + Vendor. GeneralStorePhoneNrStore Type – VendorOperations.TIPStoreTypeCd based on date
June 6, 2017 Vendor Management Reports Page 7 of 113

VM Vendor Management Reports MPSC WIC MIS System
Sort Order If Group By = ‘Local Agency’Local Agency
If Group By = ‘Peer Group’Peer Group
Detail lines depends on Sort By valueIf Sort By = ‘Vendor ID’
Vendor IDIf Sort By = ‘Vendor Name’
Vendor NameIf Sort By = ‘City’
City, Vendor NameD
Total / Count Columns
No
State Totals No
Primary Group (page break)
If Group By = ‘Local Agency’Local Agency (no page breaks)
If Group By = ‘Peer Group’Peer Group (no page breaks)
Additional Group By
None
Group By ‘Local Agency’
Group By ‘Peer Group’
Page 8 of 113 Vendor Management Reports June 6, 2017
MPSC WIC MIS System VM Vendor Management Reports
June 6, 2017 Vendor Management Reports Page 9 of 113

VM Vendor Management Reports MPSC WIC MIS System
2.1.2 Vendor Authorization Actions Scheduled and Completed
Description Provides a listing of the steps needed to complete vendor authorization and whether each step has been completed for each applicant vendor. This report is across vendors identifying their milestones for a specific date range. This provides a list that the vendor coordinators can use as a checklist.
Parameters Local Agency, Start Date, End Date
Record Selection / Filtering / Calculations
The date parameters refer to all actions scheduled during the time period.
Print Columns
Local Agency, Vendor, City, Local Agency Coordinator, Milestone, Scheduled Date, Completed Date
Sort Order Local Agency, Vendor Name, Date Completed
Total / Count Columns
State Totals
Primary Group (page break)
Local Agency
Additional Group By
Vendor, City, Local Agency Coordinator
Page 10 of 113 Vendor Management Reports June 6, 2017

MPSC WIC MIS System VM Vendor Management Reports
2.1.3 Vendor Feedback Report
Description Provides a listing of all the feedback received about vendors. The vendor coordinators are supplied with the date of the feedback, any pertinent information about the feedback and what action was taken.
Parameters
Record Selection / Filtering / Calculations
All Vendors with active feedback or feedback in the last year.
Print Columns
Chain ID, Vendor, Vendor ID, City, Date of Feedback (Record Date), Feedback Type, Source, Action Type, Closed Date, Comments
Sort Order Chain ID, Vendor Name, Date of Feedback
Total / Count Columns
State Totals
Primary Group (page break)
Additional Group By
June 6, 2017 Vendor Management Reports Page 11 of 113

VM Vendor Management Reports MPSC WIC MIS System
Page 12 of 113 Vendor Management Reports June 6, 2017

MPSC WIC MIS System VM Vendor Management Reports
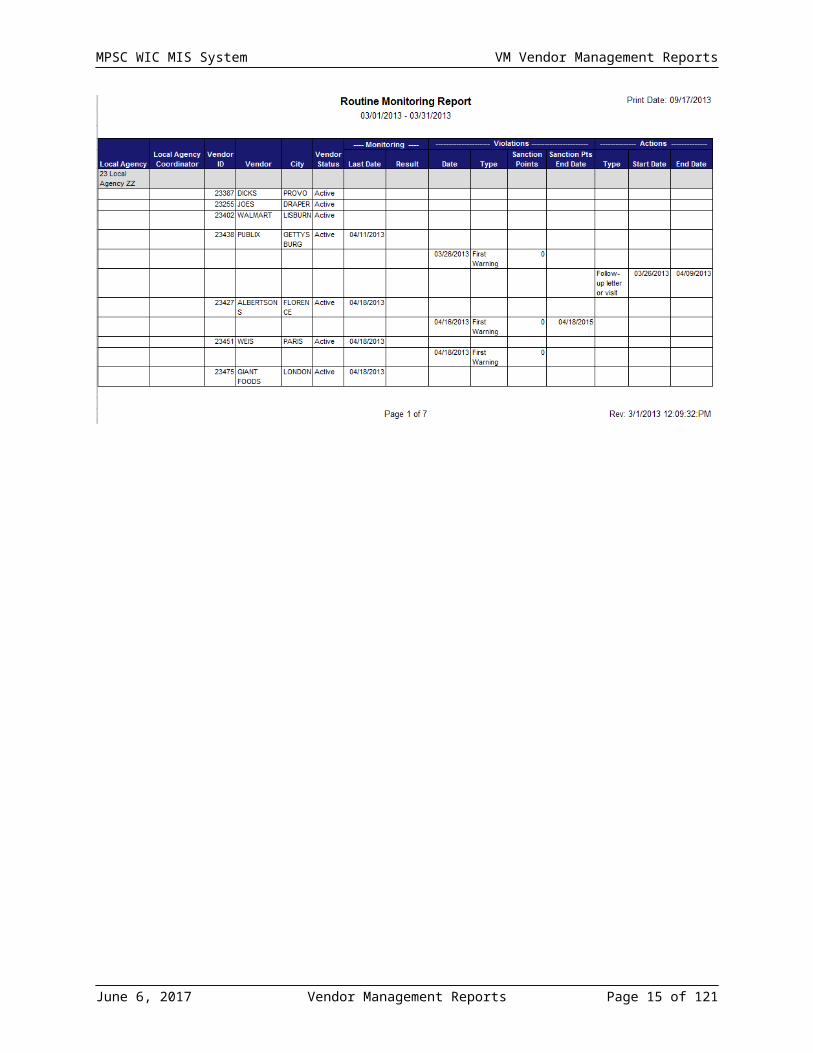
2.1.4 Routine Monitoring Report
Description To assist local agency/state agency staff in scheduling required monitoring visits.
Parameters Local Agency, Local Agency Coordinator, Start Date, End Date
Record Selection / Filtering / Calculations
Return all vendors who were active during the Start Date and End Date along with the last monitoring visit.
Print Columns
Local Agency Number – Local Agency Name, LA Coordinator, Vendor ID, Vendor City, Last Mon Dt, Monitoring Result, Vendor Status, Violation - Date, Type, Sanction Pts, Sanc Pts End Date, Actions - Type, Start ate, End Date
Sort Order Local Agency, LA Coordinator, Last Monitoring Date, Vendor Name
Total / Count Columns
No
State Totals No
Primary Group (page break)
Local Agency, Local Agency Coordinator
Additional Group By
June 6, 2017 Vendor Management Reports Page 13 of 113

VM Vendor Management Reports MPSC WIC MIS System
Page 14 of 113 Vendor Management Reports June 6, 2017
MPSC WIC MIS System VM Vendor Management Reports
2.1.5 Investigations Conducted Report (State Office Only)
Description Provides a listing of the Investigation monitoring activities conducted during a specified period to include compliance buy and inventory audit visits
Parameters Fiscal Year (Pre-populated list that includes the current Federal Fiscal Year plus the prior four Federal Fiscal Years, in descending sequence. Format is FY9999. If the current system date is between October 1st and December 31st, the current Federal Fiscal Year is the current system date year + 1 year. If the current system date is between January 1st and September 30th, the current Federal Fiscal Year is the current system date year.)
Record Selection / Filtering / Calculations
Return all investigation records within the given fiscal year.Report to include vendors that have received investigation activities within the fiscal year requested.
Print Columns
Vendor ID, Vendor, Local Agency, City, Investigation - Date, Status, Activity - Date, Type, Outcome, Action - Type, End Date, Comments
Sort Order Vendor ID, Investigation Date (newest to oldest), Activity - Type, Activity - Date (newest to oldest).
Total / Count Columns
Total Vendors Investigated: Each vendor is counted one time regardless of the number of investigation records listed.Total Number of Compliance Buys: Count of records with an Activity Type of “Compliance Buy."Percentage of Stores Investigated: Total Vendors Investigated / Total Number of Active Vendors.
State Totals Yes (top of first page)
Primary Group (page break)
None
Additional Group By
June 6, 2017 Vendor Management Reports Page 15 of 113

VM Vendor Management Reports MPSC WIC MIS System
Page 16 of 113 Vendor Management Reports June 6, 2017

MPSC WIC MIS System VM Vendor Management Reports
2.1.6 Vendor Sanction Summary Report
Description Provides a listing of all vendors with open sanctions or any sanction within the last year. Descriptions of the violation, what sanction was imposed, the Sanction Points and the date the vendor was advised about the sanction are included.
Parameters Chain ID
Record Selection / Filtering / Calculations
All Vendors with open sanctions or any sanction within the last year.
Records are selected when a violation row has been created and a action row has been added that has an Action Type of ‘Sanction’. This information may be entered on the Feedback, Routine Monitoring, Investigations – Compliance Activity or Investigations – Inventory Audit Activity screens.
Print Columns
Chain ID, Vendor ID, Vendor, City, Oversight Activity, Violations Date, Violations Type, Violation Sanction Pts, Violation Sanc Pts End Date, Actions Type, Actions Start Date, Actions End Date
Sort Order Chain ID, Vendor ID, Oversight Activity, Violation Date, Actions End Date
Total / Count Columns
State Totals
Primary Group (page break)
Additional Group By
June 6, 2017 Vendor Management Reports Page 17 of 113

VM Vendor Management Reports MPSC WIC MIS System
Page 18 of 113 Vendor Management Reports June 6, 2017

MPSC WIC MIS System VM Vendor Management Reports
2.1.7 Vendor Risk Summary Report (State Office Only)
Description Identifies vendors flagged as high risk and underlying risk factors to assist State Agency in targeting compliance buys. The report includes high risk vendors and state specified risks.
Parameters Fiscal Year (Pre-populated list that includes the current Federal Fiscal Year plus the prior four Federal Fiscal Years, in descending sequence. Format is FY9999. If the current system date is between October 1st and December 31st, the current Federal Fiscal Year is the current system date year + 1 year. If the current system date is between January 1st and September 30th, the current Federal Fiscal Year is the current system date year).
Record Selection / Filtering / Calculations
Select vendors who have one or more high risks as defined by High Risk Vendor analysis and/or vendor risks assigned using the Vendor Risk screen.
Print Columns
Vendor, Vendor ID, Address, City, Risk Code, Risk Description
Sort Order Vendor Name
Total / Count Columns
No
State Totals No
Primary Group (page break)
Vendor Name
Additional Group By
Comments The risk description identifies ARVA risks.
June 6, 2017 Vendor Management Reports Page 19 of 113

VM Vendor Management Reports MPSC WIC MIS System
Page 20 of 113 Vendor Management Reports June 6, 2017

MPSC WIC MIS System VM Vendor Management Reports
2.1.8 Vendor Completed Education Report
Description Provides a listing of vendors who have completed scheduled training for a specific local agency or statewide covering a specified time period designated by the user.
Parameters Start Date, End Date, Local Agency Number
Record Selection / Filtering / Calculation
Select all completed vendor training records that match the input criteria
Print Columns
Local Agency, Vendor ID, Vendor, Address, City, Completed Date, Attendees, Training Reason, Content
Sort Order Local Agency, Vendor ID, and Completed Date.
Total / Count Columns
Local Agency total training completed. The training record is counted as a separate training each time a training record is designated as completed.
State Totals Statewide total training completed
Primary Group (page break)
Local Agency
Additional Group By
Vendor, Completed Date
June 6, 2017 Vendor Management Reports Page 21 of 113

VM Vendor Management Reports MPSC WIC MIS System
Page 22 of 113 Vendor Management Reports June 6, 2017

MPSC WIC MIS System VM Vendor Management Reports
2.1.9 Vendor Planned Education Report
Description Provides a listing of scheduled education for a specific local agency or statewide covering a specified time period designated by the user to assist in planning the logistics of the education. Report is used to determine the need for follow-up with vendors to reschedule missed education or take other action.
Parameters (Defaults)
Beginning Date, Ending Date, Local Agency Number (statewide if not entered)
Record Selection / Filtering / Calculations
Select all vendor training records that match the input criteria. Select all training records with a Completed Date that is null and a Planned Date within the Beginning Date and Ending Date parameters, then apply any local agency selection parameters. Records include those planned, but not completed.
Print Columns
Vendor number – Vendor name, Vendor Address, Vendor City, Planned Date, Training Reason, Training Content
Sort Order Planned Date, Vendor Name
Total / Count Columns
Local Agency total training scheduled and missed.Scheduled count is the count of all training records with a Completed Date that is null and a Planned Date within the Beginning Date and Ending Date parameters, grouped by local agency.Missed count is the count of all training records with a Completed Date that is null and a Planned Date within the Beginning Date and Ending Date parameters and the Planned Date is prior to the report run date, grouped by local agency.
State Totals Statewide total training scheduled and missed.Scheduled count is the count of all training records with a Completed Date that is null and a Planned Date within the Beginning Date and Ending Date parameters.Missed count is the count of all training records with a Completed Date that is null and a Planned Date within the Beginning Date and Ending Date parameters and the Planned Date is prior to the report run date.
Primary Group (page break)
Local Agency
Additional Group By
Vendor
June 6, 2017 Vendor Management Reports Page 23 of 113

VM Vendor Management Reports MPSC WIC MIS System
Page 24 of 113 Vendor Management Reports June 6, 2017

MPSC WIC MIS System VM Vendor Management Reports
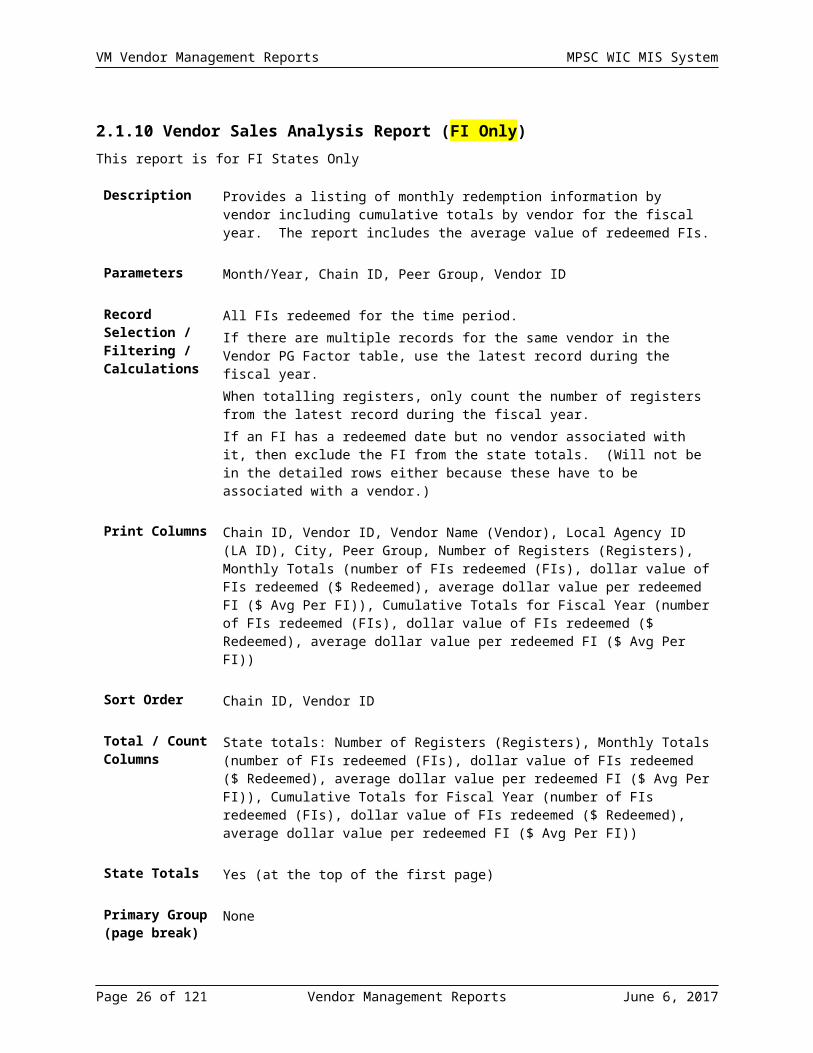
2.1.10 Vendor Sales Analysis Report (FI Only)This report is for FI States Only
Description Provides a listing of monthly redemption information by vendor including cumulative totals by vendor for the fiscal year. The report includes the average value of redeemed FIs.
Parameters Month/Year, Chain ID, Peer Group, Vendor ID
Record Selection / Filtering / Calculations
All FIs redeemed for the time period.If there are multiple records for the same vendor in the Vendor PG Factor table, use the latest record during the fiscal year.When totalling registers, only count the number of registers from the latest record during the fiscal year.If an FI has a redeemed date but no vendor associated with it, then exclude the FI from the state totals. (Will not be in the detailed rows either because these have to be associated with a vendor.)
Print Columns
Chain ID, Vendor ID, Vendor Name (Vendor), Local Agency ID (LA ID), City, Peer Group, Number of Registers (Registers), Monthly Totals (number of FIs redeemed (FIs), dollar value of FIs redeemed ($ Redeemed), average dollar value per redeemed FI ($ Avg Per FI)), Cumulative Totals for Fiscal Year (number of FIs redeemed (FIs), dollar value of FIs redeemed ($ Redeemed), average dollar value per redeemed FI ($ Avg Per FI))
Sort Order Chain ID, Vendor ID
Total / Count Columns
State totals: Number of Registers (Registers), Monthly Totals (number of FIs redeemed (FIs), dollar value of FIs redeemed ($ Redeemed), average dollar value per redeemed FI ($ Avg Per FI)), Cumulative Totals for Fiscal Year (number of FIs redeemed (FIs), dollar value of FIs redeemed ($ Redeemed), average dollar value per redeemed FI ($ Avg Per FI))
State Totals Yes (at the top of the first page)
Primary Group (page break)
None
Additional Group By
June 6, 2017 Vendor Management Reports Page 25 of 113
VM Vendor Management Reports MPSC WIC MIS System
Page 26 of 113 Vendor Management Reports June 6, 2017

MPSC WIC MIS System VM Vendor Management Reports
2.1.11 Display FI Report Number Contents Report (FI Only)This report is for FI States Only
Description This report displays the contents of a single FI Reporting Number. FI Reporting Numbers are used primarily in High Risk Vendor Analysis reports.A FI Report Number is a unique number that is auto-assigned to it by the system whenever a unique combination of food items (with their quantities) is introduced to the system. This unique number was assigned for reporting purposes only. It is important to understand how the WIC system handles FIs. The WIC system ensures that FIs regardless of where originated are identified as the same when their contents are the same. From a vendor or client perspective, the food instrument is a sum of the contents and the WIC system enforces this. An example is the best way to explain this.Model Food Package “A” has its 3rd FI containing 1 dozen eggs and 30 oz of WIC approved cheese. This package is used for Client #1.Model Food Package “B” has its 2nd FI containing 2 dozen eggs and 32 oz of WIC approved cheese. But when this package is assigned to Client #3, WIC personnel customize this 2nd FI to contain 1 dozen eggs and 30 oz of WIC approved cheese.Model Food Package “C” has its 1st FI containing 1 dozen eggs and 30 oz of WIC approved cheese and also its 4th FI containing 1 dozen eggs and 30 oz of WIC approved cheese. This package is used for Client #2.When each one of these FIs is saved, the WIC system has an algorithm that checks the contents against the existing set of saved FIs. The system recognizes that all four of these FIs contain the same contents and assign the same FI report number to the FI. Therefore, although all three originated from a different source, they are considered the same.
Parameters FI Reporting Number (one or blank)
Record Selection / Filtering / Calculations
FI Reporting Number records
Print Columns
FI Reporting Number, Item Quantity, Description
Sort Order FI Reporting Number
Total / Count Columns
None
State Totals None
June 6, 2017 Vendor Management Reports Page 27 of 113

VM Vendor Management Reports MPSC WIC MIS System
Primary Group (page break)
None
Additional Group By
None
Page 28 of 113 Vendor Management Reports June 6, 2017

MPSC WIC MIS System VM Vendor Management Reports
2.1.12 Vendor Mailing Labels
Description There may be instances where Vendor labels need to be generated. The Vendor Mailing Labels format a Vendor list of all active vendors so that it can be saved out to an Excel spreadsheet for importing into a MS Office product for label printing. MS Office products support the many industry standard label layouts. If a vendor has an address type of 'Mailing,' that address is used for the label; otherwise, the 'Physical' address is used. The Vendor Contact Name (along with the Contact Title) is the Primary contact who corresponds with the address type. There is a row for every active vendor in the file that is meant for mailing to the store location.
Parameters
Record Selection / Filtering / Calculations
All active vendors
Print Columns
Vendor IDVendor NameContact TitleContact NameStreet Address 1Street Address 2CityStateZip Code
Sort Order Vendor ID
Total / Count Columns
None
State Totals No
Primary Group (page break)
No
Additional Group By
No
June 6, 2017 Vendor Management Reports Page 29 of 113

VM Vendor Management Reports MPSC WIC MIS System
Page 30 of 113 Vendor Management Reports June 6, 2017

MPSC WIC MIS System VM Vendor Management Reports
2.1.13 Vendor Farmers ReportDescription Select all active vendors who are designated as farmers. List all
locations (address types) for the farmer. The Vendor Contact Name (along with the Contact Title) is the contact who corresponds with the address type.
ParametersRecord Selection / Filtering / Calculations
All active vendors designated as farmers.
Print Columns
Vendor IDVendor NameContact Title (Primary contact of Physical Address)Contact Name (Primary contact of Physical Address)FMNPType (English description of AddressTypeCd)Address (Concatentate Street Line 1, Suite, PO Box and Street Line 2)City, State, Zip
Sort Order Vendor IDTotal / Count Columns
Total FarmersTotal Farmer participating FMNP
State Totals NoPrimary Group (page break)
No
Additional Group By
No
June 6, 2017 Vendor Management Reports Page 31 of 113

VM Vendor Management Reports MPSC WIC MIS System
Page 32 of 113 Vendor Management Reports June 6, 2017

MPSC WIC MIS System VM Vendor Management Reports
2.1.14 Electronic Cash Register System ReportDescription Provides a listing of Electronic Cash Register Systems used by active
Vendors at a specific date.Parameters Electronic Cash Register System (All, Select One or more)
Active As Of Date
Subtitle Active As Of Date: <Active As Of Date>Record Selection / Filtering / Calculations
Select all active vendors as of the parameter date. For each active vendor, select their Electronic Cash Register System based on the parameter and based on the most recent Vendor Operation record (VendorOperations.RecordedDt).
Print Columns
ECR System (English description of VendorOperations.ECRSystemCd)Vendor ID (Vendor.FFVendorID) For Smart Card EBT, Vendor ID formatted to 4 digits (leading zeroes); otherwise format to 5 digits (leading zeroes).Vendor Name (Vendor.StoreName)
Sort Order ECR System, Vendor IDTotal / Count Columns
Total # Vendors (per ECR System)
State Totals NoPrimary Group (page break)
No
Additional Group By
No
June 6, 2017 Vendor Management Reports Page 33 of 113

VM Vendor Management Reports MPSC WIC MIS System
Page 34 of 113 Vendor Management Reports June 6, 2017

MPSC WIC MIS System VM Vendor Management Reports
2.1.15 Vendor APL Type Report (Online CDP EBT Only)This report is for states using the optional APL Type functionality. Currently, APL Type functionality is only available to EBT States using CDP’s WIC Direct as their EBT Host. APL Type functionality allows WIC Direct to create Approved Product List (APL) files that only include foods that a vendor is allowed to sell. The APL Type identified in the vendor and UPC/PLU data is the mechanism that allows WIC Direct to generate customized APL files for each vendor. Description This report lists vendors by their assigned APL Type. It displays basic
vendor details. The report is grouped by APL Type. The report sequence is APL Type, Vendor ID.
Parameters APL Type (All, none, one, or more) APL Type – Display Code.AssignedCd concatenated with Code.LongDc where Code.Status = ‘A’ and Code.CT_ID = CodeType.ID and CodeType.ShortDc = ‘APL Type’. Display list in Code.DisplaySeqNr, Code.LongDc sequence.
Vendor Status (All, Active, or Inactive) – Display VendorStatusCode.StatusCodeDc where VendorStatusCode.Status = ‘A.. Display list in VendorStatusCode.DisplaySeqNr sequence.
Local Agency (All, one, or more) – Display LocalAgency.FFLocalAgencyID concatenated with LocalAgency.Name where LocalAgency.Status = ‘A’. Display list in LocalAgency.FFLocalAgencyID sequence.
Sub Titles NoneRecord Selection / Filtering / Calculations
Return all vendors associated with the selection parameters: APL Type selection:
o Select vendors whose most recent VendorOperations.APLTypeCd is equal to one of the selected APL Type parameter values.
Vendor Status selection:o If Vendor Status = Active, select only vendors whose most
recent VendorStatus.VendorStatusCd is equal to ‘A’.o If Vendor Status = Inactive, select only vendors whose
most recent VendorStatus.VendorStatusCd is not equal to ‘A’.
o If Vendor Status = All, select all vendors. Local Agency selection:
o Select vendors whose Vendor.LA_ID is equal to one of the selected Local Agency parameter values.
Print Columns
Total Line APL Type – VendorOperations.APLTypeCd from the most recent
VendorOperations record for the vendor concatenated with Code.LongDc where Code.AssignedCd = VendorOperations.APLTypeCd and CodeType.ShortDc = ‘APL Type’.
Total Count – Count of vendors within the APL Type group.
June 6, 2017 Vendor Management Reports Page 35 of 113

VM Vendor Management Reports MPSC WIC MIS System
Detail Line Vendor ID – Vendor.FFVendorID. Vendor Name – Vendor.StoreName. Vendor Status – VendorStatusCode.StatusCodeDc where
VendorStatusCode.VendorStatusCd = the most recent VendorStatus.VendorStatusCd and VendorStatus.Vend_ID = Vendor.ID.
Local Agency – LocalAgency.FFLocalAgencyID concatenated with LocalAgency.Name where LocalAgency.ID = Vendor.LA_ID.
Sort Order APL Type, Vendor IDPrimary Group (page break)
APL Type
Additional Group By
N/A
Page 36 of 113 Vendor Management Reports June 6, 2017
MPSC WIC MIS System VM Vendor Management Reports
June 6, 2017 Vendor Management Reports Page 37 of 113

VM Vendor Management Reports MPSC WIC MIS System
2.2 FI Redemption Reports (FI Only)
2.2.1 Local Agency Redemption ReportThis report is for FI States Only
Description Provides a listing of monthly redemption information by local agency and clinic including cumulative totals by local agency and clinic for the fiscal year.
Parameters Month, Year
Record Selection / Filtering / Calculations
All FIs redeemed for the fiscal year. (This does not include checks rejected by the bank.)
Print Columns
Local Agency, Clinic, Monthly Totals (number of FIs redeemed, dollar value of FIs redeemed, average dollar value per redeemed FI), Cumulative Totals for Fiscal Year (number of FIs redeemed, dollar value of FIs redeemed, average dollar value per redeemed FI),
Sort Order Local Agency, Clinic
Total / Count Columns
No
State Totals Monthly Totals (number of FIs redeemed, dollar value of FIs redeemed, average dollar value per redeemed FI, Cumulative Totals for Fiscal Year (number of FIs redeemed, dollar value of FIs redeemed, average dollar value per redeemed FI),
Primary Group (page break)
Local Agency
Additional Group By
Clinic
Page 38 of 113 Vendor Management Reports June 6, 2017

MPSC WIC MIS System VM Vendor Management Reports
June 6, 2017 Vendor Management Reports Page 39 of 113

VM Vendor Management Reports MPSC WIC MIS System
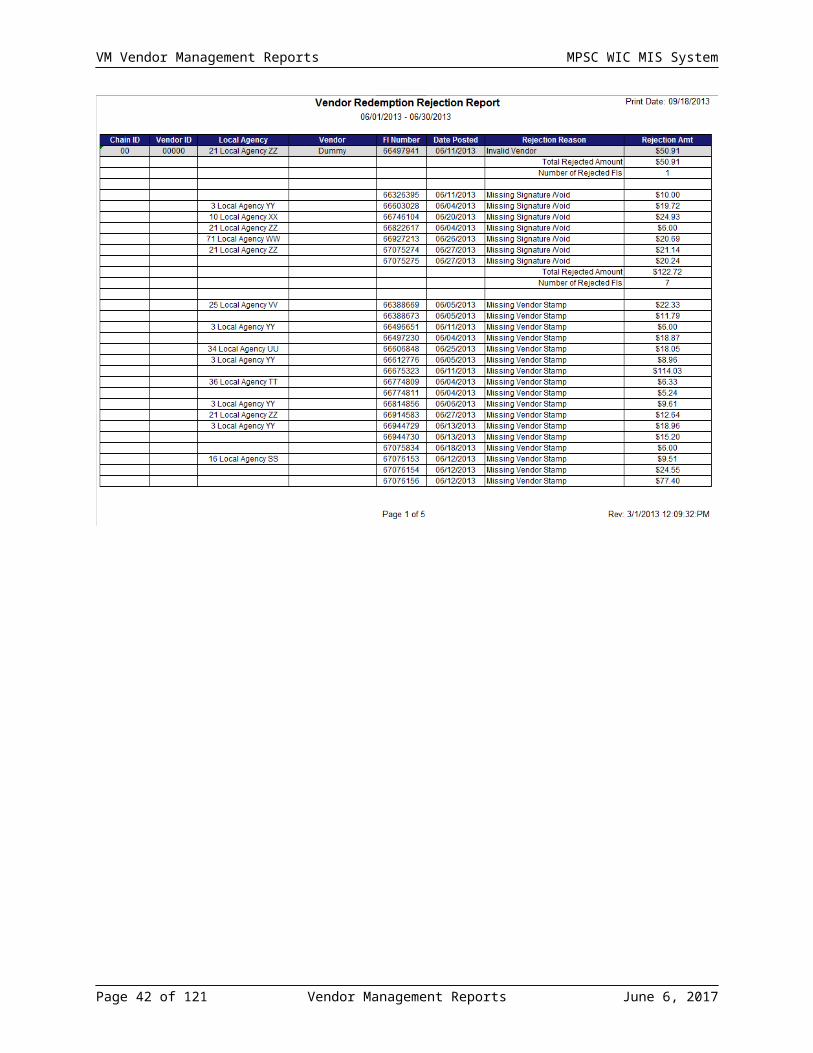
2.2.2 Vendor Redemption Rejection ReportThis report is for FI States Only
Description The Vendor Redemption Rejection Report lists FI Numbers which have been rejected during the selection period.
Parameters Begin Date, End Date, Chain ID, Vendor ID
Record Selection / Filtering / Calculations
Select FIs that have been rejected by the bank during the date range selected.FIs without a Vendor ID are listed at the top of the report as a “Dummy” vendor.
Print Columns
Chain ID, Vendor ID, Local Agency (where the FI was created), Vendor, FI Number, Date Posted (By the Bank), Rejection Reason, Rejection Amount
Sort Order Chain ID, Vendor ID, Rejection Reason, FI Number
Total / Count Columns
Number and amount total of FIs rejected for the VendorNumber and amount total of FIs rejected for vendor per reject reasonTotal rejects as a percent of the total FIs processed for the vendor.
State Totals No
Primary Group (page break)
None
Additional Group By
Chain ID, Vendor ID
Page 40 of 113 Vendor Management Reports June 6, 2017
MPSC WIC MIS System VM Vendor Management Reports
June 6, 2017 Vendor Management Reports Page 41 of 113
VM Vendor Management Reports MPSC WIC MIS System
2.2.3 Vendor Redemption Summary ReportThis report is for FI States Only
Description The Vendor Redemption Summary Report summarizes redemption (valid and rejected) at the peer group, vendor chain and the vendor levels.
Parameters Begin Date, End DateSelect one: Statewide (default if no selection) Peer Group Vendor Chain Name Vendor
Hierarchy or data that is found under the selection is produced.
Record Selection / Filtering / Calculations
Select all FIs (valid and rejected) by the bank interface redemption process during the date range selected.
Print Columns
State summary level: Count of FIs, Count of FI Rejected, Count Rejection %, Amount of FIs. Amount of Rejected FIs, Amount Rejection %State detail level: Rejection Reason, Count of Rejected FIs, Count Rejection % (for State total), Amount of Rejected FIs, Amount Rejection % (for State total)Peer Group summary level: Peer Group Number, Count of FIs, Count of FI Rejected, Count Rejection %, Amount of FIs. Amount of Rejected FIs, Amount Rejection %Peer Group detail level: Rejection Reason, Count of Rejected FIs, Count Rejection % (for Peer Group total), Amount of Rejected FIs, Amount Rejection % (for Peer Group total)Vendor Chain summary level: Vendor Chain Name, Count of FIs, Count of FI Rejected, Count Rejection %, Amount of FIs. Amount of Rejected FIs, Amount Rejection %Vendor Chain detail level: Rejection Reason, Count of Rejected FIs, Count Rejection % (for Chain total), Amount of Rejected FIs, Amount Rejection % (for Chain total)Vendor summary level: Vendor ID, Vendor Name, Count of FIs, Count of FI Rejected, Count Rejection %, Amount of FIs. Amount of Rejected FIs, Amount Rejection %Vendor detail level: Rejection Reason, Rejection Reason, Count of Rejected FIs, Count Rejection % (for Vendor total), Amount of Rejected FIs, Amount Rejection % (for Vendor total)
Sort Order Peer Group Number, Count Reject %, Reject Reason %
Page 42 of 113 Vendor Management Reports June 6, 2017

MPSC WIC MIS System VM Vendor Management Reports
Total / Count Columns
See Print columns
State Totals Yes
Primary Group (page break)
None
Additional Group By
Peer GroupVendor ChainVendor
Special Notes If a Vendor Chain is found in more than one peer group, then the Vendors under the Vendor Chain appear according to its peer group. This means that that a Vendor Chain may appear multiple times in this report.
June 6, 2017 Vendor Management Reports Page 43 of 113

VM Vendor Management Reports MPSC WIC MIS System
2.2.4 Vendor Food Items Purchased ReportThis report is for FI States Only.
Description This report lists the food items redeemed per month per vendor for the previous quarter. It is assumed that all items on the FI are redeemed, so the stores get an approximate inventory of what they provided to WIC.
Parameters
Record Selection / Filtering / Calculations
Select all items from food instruments redeemed during the time period.
Print Columns
Vendor Name, Vendor ID, Food Item
Sort Order Vendor Name, Food Item
Total / Count Columns
Quantity purchased per food item (assume all items on an FI were redeemed)
State Totals No
Primary Group (page break)
Vendor Name
Additional Group By
Page 44 of 113 Vendor Management Reports June 6, 2017

MPSC WIC MIS System VM Vendor Management Reports
June 6, 2017 Vendor Management Reports Page 45 of 113

VM Vendor Management Reports MPSC WIC MIS System
2.2.5 Vendor CVV Redemption ReportThis report is for FI states only.Description This report shows redeemed CVV FIs from a vendor perspective. The
report shows counts and amounts; comparing issued amounts against the redeemed amounts. The data is summarized to the chain, peer groups and statewide totals.
Parameters Start Date and End DateRecord Selection / Filtering / Calculations
All FIs that are marked as CVVs whose redemption date is within (inclusive of) the date parameters.Record Selection:Note: Per packaging business rules, CVV FIs can only have one food item with a quantity of 1 on them. The food item line in the report (the mockup shows ‘Up to $4.00 Cash Value’) is the food item description of the food item.Redeemed Counts = CVV FIs by the unique StateFI number that have a redemption date.Calculations:Count % Redeemed = Percent per grouping of the individual line items.Issued Amount = Average Price from the redeemed FI. This is the value of the CVV FI food item.Redeemed Amount = Redemption Amount from the redeemed FIRedeemed % of Issued = Redeemed Amount divided by Issued Amount
Print Columns
Redeemed CountCount % RedeemedIssued AmountRedeemed AmountRedeemed % of Issued
Sort Order Peer Group NumberChain Name (No Chain at bottom)Vendor ID
Total / Count Columns
ChainPeer Group
State Totals YesPrimary Group (page break)
No
Additional Group By
No
Page 46 of 113 Vendor Management Reports June 6, 2017

MPSC WIC MIS System VM Vendor Management Reports
June 6, 2017 Vendor Management Reports Page 47 of 113

VM Vendor Management Reports MPSC WIC MIS System
2.3 EBT Redemption, Settlement & Reconciliation ReportsRSR stands for Redemptions, Settlement and Reconciliation.
2.3.1 ACH Payments – Vendor Claims and Adjustments Report (Smart Card EBT Only)
Description This report shows the relationship between vendor ACH payments and the vendor claims and associated adjusted amounts.
Parameters Chain Based – Vendor Status Selection (Chains, Vendor Status and Vendors)Start Date, End Date
Subtitle <Start Date> through <End Date>
Record Selection / Filtering / Calculations
Using start and end date parameters, select the ACH files (based on ACHOR.ACHOREffectiveEntryDt; then using selected vendors, select all ACHDetail transactions (Vend_ID).
The ARF records associated with the ACH files contain the key in the ARF.ACHOR_ID.
Page 48 of 113 Vendor Management Reports June 6, 2017

MPSC WIC MIS System VM Vendor Management Reports
Print Columns
Vendor line:Vendor / ACH File Name (width 25) – Vendor ID and Vendor Name (ARF.Vend_ID to Vendor table)ACH line:Vendor / ACH File Name – ACHOR.FileNmEntry Date – ACHOR.ACHOREffectiveEntryDtClaim File - blankSettle Date – blankClaimed Amt – Sum of its Claim Name line’s Claimed AmtDifference – Sum of its Claim Name line’s DifferencePaid Amount – Sum of its Claim Name line’s Paid AmountD5 Adj Amt – Sum of its Claim Name line’s D5 Adj AmtTotal Amount– Sum of its Claim Name line’s Total AmountsDiscount Amt – Sum of its Claim Name line’s Discount AmountClaim Name line:Vendor / ACH File Name – blankEntry Date – blankClaim File – ARF.FileNm based on ARF.ACHOR_ID but replace ‘A’ with ‘S’ in first letter of extensionSettle Date – ARF.SettlementDt based on ARF.ACHOR_IDClaimed Amt – Sum of each ARF’s D4 Claimed Amounts (ARFD4.ClaimedAmt based on ARF.ACHOR_ID)Difference – Claim Amt minus Paid AmountPaid Amount – ARF’s Settlement Amount (ARF.SettlementAmt based on ARF.ACHOR_ID) minus D5 Adj AmtD5 Adj Amt – Sum of each ARF’s D5 Adjusted Amounts based on D5 Adjustment Code (ARFD5.AdjustAmt based on ARFD5.AdjustCd. Credits are positive amounts. Debits are negative amounts.)Total Amount – Sum of Paid Amount plus D5 Adj AmtDiscount Amt – ARF’s Discount Amount (ARF.DiscountAmt based on ARF.ACHOR_ID)
Sort Order Vendor line: Vendor IDACH line: Entry Date, ACH FileClaim File line: Settle Date, Claim File
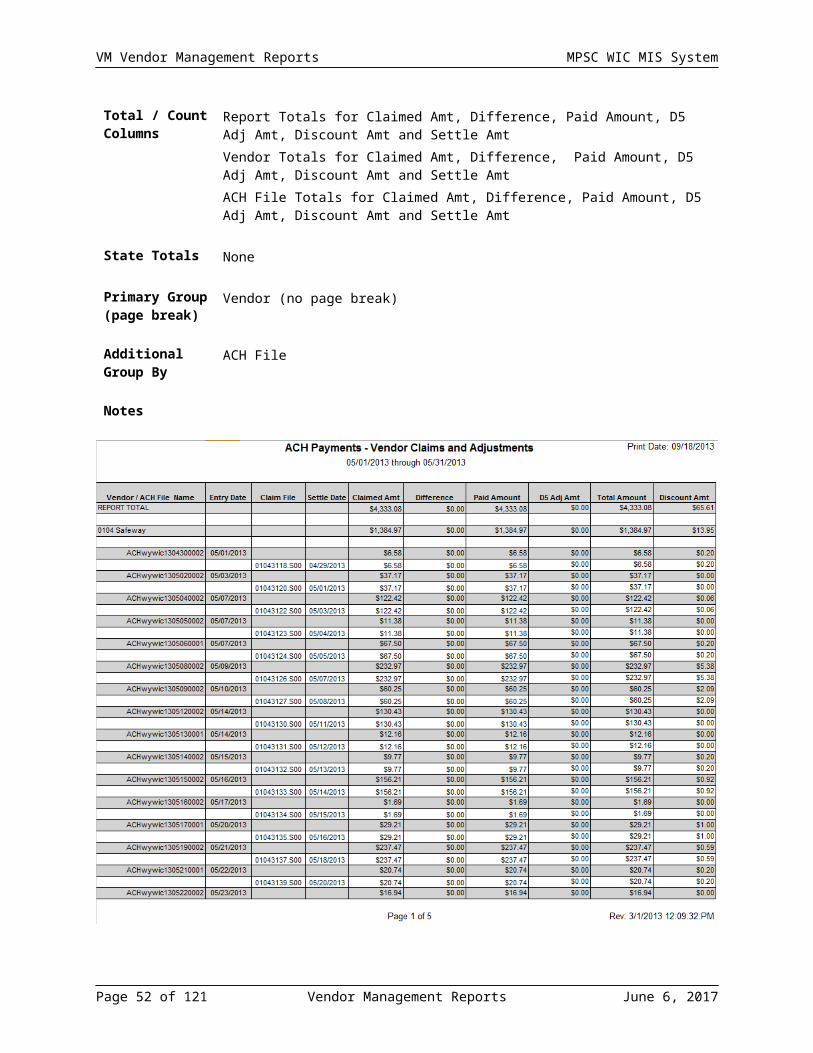
Total / Count Columns
Report Totals for Claimed Amt, Difference, Paid Amount, D5 Adj Amt, Discount Amt and Settle AmtVendor Totals for Claimed Amt, Difference, Paid Amount, D5 Adj Amt, Discount Amt and Settle AmtACH File Totals for Claimed Amt, Difference, Paid Amount, D5 Adj Amt, Discount Amt and Settle Amt
State Totals None
June 6, 2017 Vendor Management Reports Page 49 of 113

VM Vendor Management Reports MPSC WIC MIS System
Primary Group (page break)
Vendor (no page break)
Additional Group By
ACH File
Notes
Page 50 of 113 Vendor Management Reports June 6, 2017

MPSC WIC MIS System VM Vendor Management Reports
2.3.2 ACH Vendor Payments Report (Smart Card EBT Only)
Description This report allows a user to research vendor ARF and how they have been paid in ACH files.
Parameters Chain Based – Vendor Status Selection (Chain, Vendor Status and Vendors)Start Date, End Date
Subtitle <Start Date> through <End Date>
Record Selection / Filtering / Calculations
Using start and end date parameters, select the ARF files based on ARF settlement date (ARF.SettlementDt).
Print Columns
Vendor line:Vendor (width 25) – Vendor ID and Vendor Name (ARF.Vend_ID to Vendor table)Claim File lineClaim File (width 12) – ARF.FileNm but replace ‘A’ with ‘S’ in first letter of extensionSettle Date – ARF.SettlementDtACH File Name (width 20) – IF ARF has been processed into an ACH (ARF.ACHOR_ID is not null), ACHOR.FileNm; if ARF has not been processed into an ACH (ARF.ACHOR_ID is null), then blank.Entry Date – IF ARF has been processed into an ACH (ARF.ACHOR_ID is not null), ACHOR.ACHOREffectiveEntryDt; if ARF has not been processed into an ACH (ARF.ACHOR_ID is null), then blank.Claimed Amt – Sum of ARF’s D4 Claimed Amounts (ARFD4.ClaimedAmt)Difference – Claimed Amount – Paid AmtPaid Amount – ARF’s Settlement Amount (ARF.SettlementAmt) minus D5 Adj AmtD5 Adj Amt – Sum of ARF’s D5 Adjusted Amounts based on D5 Adjustment Code (ARFD5.AdjustAmt based on ARFD5.AdjustCd. Credits are positive amounts. Debits are negative amounts.)Total Amount – Sum of Paid Amount plus D5 Adj AmtDiscount Amt - ARF’s Discount Amount (ARF.DiscountAmt)
Sort Order Vendor line: Vendor IDClaim File line: Settle Date, Claim Name
Total / Count Columns
Vendor Totals for Claimed Amt, Difference, Paid Amount, D5 Adj Amt, Discount Amt and Total Amount
June 6, 2017 Vendor Management Reports Page 51 of 113
VM Vendor Management Reports MPSC WIC MIS System
State Totals None
Primary Group (page break)
Vendor
Additional Group By
None
Notes Due to amount of displayed information (150% of normal report); the standard report font is not used. A smaller font is used.
Page 52 of 113 Vendor Management Reports June 6, 2017

MPSC WIC MIS System VM Vendor Management Reports
2.3.3 Claim Submission Errors Report (Smart Card EBT / Online Xerox EBT / Online CDP EBT)
Description This report allows WIC state office personnel to respond to questions regarding vendor claims where errors were found that affected paid amounts.
Parameters Chain Based – Vendor Status Selection (Chain, Vendor Status and Vendors)Start Date, End DateSort By (values of ‘Vendor’ or ‘Error’)
Subtitle Based on EBT Transactions from <Start Date> through <End Date>
Record Selection / Filtering / Calculations
Using start and end date parameters, select the ARF files based on ARF settlement date (ARF.SettlementDt). Select any D4 record (with its E2 records) if the D4 or E2 has a non-zero MRC (ARFD4.MRCCd and ARFE2.MRCCd).
June 6, 2017 Vendor Management Reports Page 53 of 113

VM Vendor Management Reports MPSC WIC MIS System
Print Columns
Vendor (width 25) - ARF.Vend_ID to Vendor table For Smart Card EBT, Vendor ID formatted to 4 digits (leading zeroes); otherwise format to 5 digits (leading zeroes).Claim File (width 12) – ARF.FileNm (replace ‘A’ with ‘S’ in first letter of extension)Transaction Date - ARFD4.LocalTxnDtTimePAN - If known PAN (ARFD4.EBTC_ID is not null) then go to EBT Card table for the PAN (EBTCard.CardNr). If unknown PAN (ARFD4.EBTI_ID is not null) then go to Invalid UPAN table for the PAN (EBTCard_Invalid.CardNr).Terminal – ARFD4.Terminal (from E1 interface record)Type If D4 MRC Code is non-zero, then “D4” If E2 MRC Code is non-zero, then “E2”Error Code and Description (width 30) (description lookup to ClaimErrorCode table) If D4 MRC Code is non-zero, then D4 MRC Code (ARFD4.MRCCode) If E2 MRC Code is non-zero, then E2 MRC Code (ARFE2.MRCCode)Claim Amt If D4 MRC Code is non-zero, then D4 claim amt (ARFD4.ClaimedAmt) If E2 MRC Code is non-zero, then E2 claim amt (ARFE2.ClaimedAmt)Paid Amt If D4 MRC Code is non-zero, then D4 paid amt (ARFD4.PaidAmt) If E2 MRC Code is non-zero, then E2 paid amt (ARFE2.PaidAmt)Adjust Amt – Claimed Amt – Paid AmountNote: If more than one non-zero MRC is found in the D4/E2 transaction group, then a detail line for each.
Sort Order ‘Vendor’ Sort By option = Vendor ID, Type, Error Code, Terminal, Transaction Date‘Error’ Sort By option = Error Code, Vendor ID, PAN, Transaction Date
Total / Count Columns
None
State Totals None
Primary Group (page break)
None
Additional Group By
None
Notes Due to amount of displayed information (150% of normal report); the standard report font is not used. A smaller font is used.
Page 54 of 113 Vendor Management Reports June 6, 2017

MPSC WIC MIS System VM Vendor Management Reports
June 6, 2017 Vendor Management Reports Page 55 of 113

VM Vendor Management Reports MPSC WIC MIS System
2.3.4 Expired and Unsettled Vendor Adjustments Report (Smart Card EBT Only)
Description This report is used to view any vendor adjustments that are expired and unsettled that have not been manually closed. Expired is defined based on a system parameter that contains the number of days in which a vendor adjustment is processed to a zero balance. Unsettled is any non-zero balance adjustment that has not been manually closed. A user reviews and manually processes the non-zero balance and then closes the adjustment so that the adjustment is not included in future executions of this report.
Parameters None
Subtitle None
Record Selection / Filtering / Calculations
Select all vendor adjustments occurrances that have expired and have a non-zero balance and have not been manually closed.Expired is defined by comparing the current date against the date the vendor adjustment was sent to the EBT Host (VendorAdjustment.SentDt) + the number of days found in the system parameter, Vendor.AdjustmentExpiredDays.Non-zero balances are determined by comparing the vendor adjustment amount (VendorAdjustment.AdjustAmt and VendorAdjustment.AdjustCd which is a credit or debit) against the processed ARF D5 amounts. ARF D5 amounts are found by transversing the VendorAdjARF table (keys of VendAdj_ID and ARFD5_ID) to the ARFD5 record (ARFD5.AdjustAmt and ARFD5.AdjustCd which is a credit or debit).Not manually closed is defined as the adjustment record’s manual close date has not been set (VendorAdjustment.ManualCloseDt is null).
Print Columns
Vendor (width 30) – Based on VendorAdjustment.Vend_ID. Vendor.FFVendorID - Vendor.StoreNameDescription (width 30) – VendorAdjustment.DescriptionTrace # - VendorAdjustment.TraceNrSent Date – VendorAdjustment.SentDtType - (width 6)– VendorAdjustment.AdjustCd – ‘Credit Debit’ code descriptionAdj Amt - VendorAdjustment.AdjustAmtD5 Amts – Amounts of ARFD5.AdjustAmt records associated with vendor adjustmentRemain Amt – Calculated by subtracting the D5 Amts from the Adj AmtsMemo (width 20) – VendorAdjustment.Memo
Sort Order Sent Date (oldest to most recent)
Total / Count Columns
N/A
Page 56 of 113 Vendor Management Reports June 6, 2017

MPSC WIC MIS System VM Vendor Management Reports
State Totals No
Primary Group (page break)
None
Additional Group By
None
Notes None
June 6, 2017 Vendor Management Reports Page 57 of 113

VM Vendor Management Reports MPSC WIC MIS System
2.3.5 Point of Sales Errors Report (Smart Card EBT Only)
Description This report allows WIC state office personnel to respond to questions regarding vendor claims where Point Of Sales (POS) terminal level errors were found.
Parameters Chain Based – Vendor Status Selection (Chain, Vendor Status and Vendors)Start Date, End DateSort By (values of ‘Vendor’ or ‘Error’)
Subtitle Based on EBT Transactions from <Start Date> through <End Date>
Record Selection / Filtering / Calculations
Using start and end date parameters, select the ARF files based on ARF settlement date (ARF.SettlementDt). Select any D4 record if the D4 has a non-zero MRC Code that is marked as POS Error. This marking is found in the ClaimErrorCode table’s ARF D4 Record type whose ClaimErrorCode.POSErrorIn is true.
Print Columns
Vendor (width 25) - ARF.Vend_ID to Vendor tableClaim File (width 12) – ARF.FileNm (replace ‘A’ with ‘S’ in first letter of extension)Transaction Date - ARFD4.LocalTxnDtTimePAN - If known PAN (ARFD4.EBTC_ID is not null) then go to EBT Card table for the PAN (EBTCard.CardNr). If unknown PAN (ARFD4.EBTCI_ID is not null) then go to Invalid PAN table for the PAN (EBTCard_Invalid.CardNr).Terminal – ARFD4.Terminal (from E1 interface record)Error Code and Description – D4 MRCCd description (lookup to ClaimErrorCode table). MRC code is based on the version (ARF X993VersionCd) of the ARF file that the D4 is found.
Sort Order ‘Vendor’ Sort By option = Vendor, Error Code, Terminal, Transaction Date
‘Error’ Sort by option = Error Code, Vendor ID, PAN, Transaction Date
Total / Count Columns
None
State Totals None
Primary Group (page break)
None
Page 58 of 113 Vendor Management Reports June 6, 2017
MPSC WIC MIS System VM Vendor Management Reports
Additional Group By
None
Notes None
June 6, 2017 Vendor Management Reports Page 59 of 113

VM Vendor Management Reports MPSC WIC MIS System
2.3.6 Retailer NTE Exceptions Report (Smart Card EBT / Online Xerox EBT / Online CDP EBT)
Description This report allows WIC state personnel to monitor NTE exceptions and, subsequently, work with their vendors to minimize these exceptions.
Parameters Chain Based – Vendor Status Selection (Chain, Vendor Status and Vendors)Start Date, End Date
Subtitle Based on EBT Transactions from <Start Date> through <End Date>
Record Selection / Filtering / Calculations
Using start and end date parameters, select the ARF E2 transactions (based on ARFD4.LocalTxnDtTime) that have MRCs associated with NTE exceptions. The MRC value related to NTE exceptions will be pulled from the system parameter, Vendor.EBT.NTEReasonCode. For Smart Card EBT, the value will be 5654 : For Version 2, 5654 and for Version 4, 5654. For Online XEROX EBT, the value is TBD. Note: Xerox does not support separate codes for NTE at this time. For Online CDP EBT, the value is TBD
Page 60 of 113 Vendor Management Reports June 6, 2017

MPSC WIC MIS System VM Vendor Management Reports
Print Columns
Vendor group line:<no heading> Vendor ID and Description (width 25) - ARF.Vend_ID to Vendor table For Smart Card EBT, Vendor ID formatted to 4 digits (leading zeroes); otherwise format to 5 digits (leading zeroes).<no heading> ‘PG’ with current peer group number (VendorPGFactors.PG_ID).UPC/PLU group line:UPC / PLU (width 14) – If known UPC/PLU (ARFE2.DP_ID is not null) then go to UPC/PLU Detail Product table for the formatted number (DetailProduct.UPC). If unknown UPC/PLU (ARFE2.DPI_ID is not null) then go to Invalid UPC/PLU Detail Product table.UPC / PLU Description (width 30) – If unknown UPC/PLU (ARFE2.DP_ID is not null) then go to UPC/PLU Detail Product table. If ARFE2.DP_ID is null then description is blank.Detail line:Category / Subcategory (width 30) If known UPC/PLU (ARFE2.DP_ID is not null) then get Subcategory Description by accessing Subcategory (Product food table) using the Horizon food hierarchy. If unknown UPC/PLU (ARFE2.DPI_ID is not null), then blank.Claim File (width 12) (Smart Card EBT Only) – ARF.FileNm (replace ‘A’ with ‘S’ in first letter of extension)Daily Activity (width 12) (Online Xerox EBT/ Online CDP EBT) – ARF.FileNmTransaction Date / Time - ARFD4.LocalTxnDtTimeTerminal - ARFD4.TerminalUnits – ARFE2.PurchasedUnitsClaimed Amt – ARFE2.ClaimedAmtPaid Amount – ARFE2.PaidAmtNTE Adj – Claimed Amt – Paid Amount
Sort Order Vendor ID, UPC/PLU, Transaction Date/Time (for Detail line)
Total / Count Columns
Report Totals for Claimed Amt, Paid Amount and NTE AdjVendor Totals for Claimed Amt, Paid Amount and NTE AdjUPC/PLU Totals (per Vendor) for Claimed Amt, Paid Amount and NTE Adj
State Totals None
Primary Group (page break)
Vendor ID (no page break)
Additional Group By
UPC/PLU Number
June 6, 2017 Vendor Management Reports Page 61 of 113

VM Vendor Management Reports MPSC WIC MIS System
Developer Notes
Due to amount of displayed information (150% of normal report); the standard report font is not used. A smaller font is used.
Page 62 of 113 Vendor Management Reports June 6, 2017

MPSC WIC MIS System VM Vendor Management Reports
2.4 EBT Analysis (Smart Card EBT / Online Xerox EBT / Online CDP EBT)
These reports are related to the general analysis of EBT issuance and/or redemptions.
2.4.1 EBT Over Redemption ReportThis report is for EBT States only.Description This report shows over redemptions from a PAN perspective. As benefits
are aggregated onto the PAN for multiple participants, the system can only determine over redemptions from a PAN perspective.
Parameters Month (Dropdown of English values)Year (Enter 4 digit value)Note: Report translates first day of month as Start Date and last day of month as the End Date based on entered values. Results are only meaningful for completed historical previous months.
Sub Titles Month (English), Year
Record Selection / Filtering / Calculations
Select the Issued Food using the First use date (EBTIssuedFood.FirstUseDt) and the last use date (EBTIssueFood.LastUseDt). The presence of a monthly record in EBTIssuedFood determines the starting quantities for the food.
Select the redemption transactions based on the local transaction date (ARFD4.LocalTxnDtTime). This allows the redemptions to be within the scope of the Issuance and the scope of the issuance to be within the specified report parameters. Only redemption data where the detail product (ARFE2.DP_ID is not null) is valid is included. The detail product is needed to convert the purchased UPC quantity into a benefit qty.
When re-issuance occurs (EBTIssuance.EBTIssuanceTypeCd = ‘REIS’), the system calculates the original issuance and then removes based on re-issuance what was ‘voided’ from the original issuance. What was ‘voided’ from the card is found in the EBTAdjustmentTransaction.Redeemed quantities are adjusted based on Returned Formula based on the (ReturnedFormula.Quantity) and the returned formula (based ReturnedFormula.PCon_ID).Card Balance Corrections (CBCs) are included in the report and are found in the EBTAdjustmentTransaction. CBCs are used to adjust quantities in the initial issuance. If there is no monthly issuance, this will show up as over issuance.The Issuance Category and Subcategory are determined based on the ProductContainer specified at the Time of Issuance. EBTIssuance -> EBTIssuedFood -> ProductContainer -> Product (has Product.SubCategoryNr) -> FoodCategory. The Issuance is match to the redemption (ARFE2) using the redemption Category (ARFE2.SubCategoryNr) and Subcategory (ARFE2.SubCategoryNr)Details lines are only shown when over redemption occur, which is
June 6, 2017 Vendor Management Reports Page 63 of 113

VM Vendor Management Reports MPSC WIC MIS System
defined as Redeemed greater than issued.Units are described from issuance.The Issued, Redeemed and Difference quantities are displayed based on the Issuance Level of the subcategory of the food item.Only Detail rows with a redeemed is greater than issued are displayed.
Print Columns
Economic Unit /PAN line:Economic Unit – IncomeFamily.EconomicUnit + IncomeFamily.DescriptionPAN - (width 17) PAN of original issuance (EBTCard.CardNr of IncF_ID). Mask 99999999-99999999. The PAN of original issuance is used (ignore replacement PAN numbers).
Detail lines:FDTU - (width 25) First date to use of Food issuance (EBTIssuedFood.FirstUseDt)Category – (width 25 - Formatted as 99 XXX) <category number> <category name> (Based on DP_ID, get FoodCategory.CategoryNr, FoodCategory.Name)Subcategory – (width 35 Formatted as 999 XXX) <subcategory number> <subcategory name> (Based on DP_ID, get Product.SubCategoryNr, Product.Name)UOM – (width 6) This is the subcategory’s USDA UOM Description. It is from the EBTIssuedFood.PConID to the ProdContainer.ContainerSizeCd.Issued – The Issued quantity (EBTIssuedFood. Quantity) formatted to the decimal places specified by the Issuance Code. (Product.DecimalBasedIssuanceCd) is adjusted by any card balance corrections (EBTAdjustmentFood.Quantity)Redeemed – The Redeemed quantity based on the ARFE2 records, formatted to the decimal places specified by the Issuance Code. (Product.DecimalBasedIssuanceCd)Difference – The calculation of the Redeemed – Issued, formatted to the decimal places specified by the Issuance Code. (Product.DecimalBasedIssuanceCd)
Sort Order Economic Unit/PAN (Group Heading), FDTU, Category, SubcategoryTotal / Count Columns
None
State Totals NonePrimary Group (page break)
None
Additional Group By
None
Notes None
Page 64 of 113 Vendor Management Reports June 6, 2017

MPSC WIC MIS System VM Vendor Management Reports
June 6, 2017 Vendor Management Reports Page 65 of 113

VM Vendor Management Reports MPSC WIC MIS System
2.4.2 Percent of Food Redeemed – State ReportThis report is for EBT States only.Description This report shows, from a statewide perspective, the amount of food
that is redeemed in the context of what was issued with calculated percentages for a given time period.
The end date can change the results of the redeemed data. For best results, this report should be run with an end date that is the last day of a previous month.
Parameters Month (Dropdown of English values)Year (Enter 4 digit value)Note: Report translates first day of month as Start Date and last day of month as the End Date based on entered values. Results are only meaningful for completed historical previous months.
Sub Titles Month (English), Year
Record Selection / Filtering / Calculations
Cat/Subcat’s Quantity Issued calculation: Based on the issued food FDTU (EBTIssuedFood.FirstUseDt) against the entered time period, select the issued food. Based on the adjusted food FDTU (EBTAdjustmentFood.FirstUseDt) against the entered time period, select the adjusted food. This allows for the issuance units to take into account re-issuances (EBTAdjustmentTransaction.TransTypeCd = ‘REIS’) and manual adjustments (EBTAdjustmentTransaction.TransTypeCd = ‘MAN’). For issued and adjusted food, sum the unique categories and subcategories (based on PCON_ID) and units (based on Quantity). Units are adds or subtracts in the adjusted food.
Cat/Subcat’s Quantity Redeemed calculation: Based on the transaction date/time (ARFD4.LocalTxnDtTime) against the entered time period, select the ARF D4 Trip Thru the Lane. Within these ARF D4 transactions, select the ARF E2 UPC Purchases with valid UPC/PLUs (ARFE2.DP_ID). The ARF E2 Category and Subcategory (ARFE2.CategoryNr and ARFE2.SubCategoryNr) determine the issuance cat/subcat bucket (from above). Calculate the redemption units based on the purchased units (ARFE2.PurchaseUnits).Also, the redemption quantities take into account returned formula. Based on the returned formula FDTU (ReturnedFormula.FirstUseDt) against the entered time period, select the Return Formula transactions. Based on Returned Formula (ReturnedFormula.PCon_ID), the units (ReturnedFormula.Quantity) are removed from the redeemed units.
Calculate Not Redeemed: Quantity Issued minus Quantity Redeemed.
Calculate Percent Redeemed: Quantity Redeemed divided by Quantity Issued.
Print Columns
Category line:Category – (width 25 - Formatted as 99 XXX) <category number>
Page 66 of 113 Vendor Management Reports June 6, 2017

MPSC WIC MIS System VM Vendor Management Reports
<category name> (Based on EBTIssuedFood.PCon_ID, get FoodCategory.CategoryNr, FoodCategory.Name).
Subcategory line:Subcategory – (width 35 Formatted as 999 XXX) <subcategory number> <subcategory name> (Based on EBTIssuedFood.PCon_ID, get Product.SubCategoryNr, Product.Name).UOM – (width 6) Subcategory USDA Unit of Measure Description (Based on EBTIssuedFood.PCon_ID, get ProdContainer.ContainerSizeCd).Quantity Issued – see calculation above.Redeemed Quantity – see calculation above.Not Redeemed – see calculation above.Percent Redeemed – see calculation above.The report does not include category / sub category for active food which had no issuance and no redemption during the entered time period.
Sort Order Category, SubcategoryTotal / Count Columns
Category
State Totals NonePrimary Group (page break)
None
Additional Group By
None
June 6, 2017 Vendor Management Reports Page 67 of 113

VM Vendor Management Reports MPSC WIC MIS System
Page 68 of 113 Vendor Management Reports June 6, 2017

MPSC WIC MIS System VM Vendor Management Reports
2.4.3 Percent of Food Redeemed – LA/Clinic ReportThis report is for EBT States only.Description This report shows, from a LA/clinic perspective, the amount of food that
is redeemed in the context of what was issued with calculated percentages for a given time period.
The end date can change the results of the redeemed data. For best results, this report should be run with an end date that is the last day of a previous month.
Parameters Local Agency (All, Select One or more)Clinic (based on Local Agency All, Select One or more)Month (Dropdown of English values)Year (Enter 4 digit value)Note: Report translates first day of month as Start Date and last day of month as the End Date based on entered values. Results are only meaningful for completed historical previous months.
Sub Titles Month (English), Year
Record Selection / Filtering / Calculations
All issuance and redemption data is tied to the PAN. A PAN is owned by an economic unit (which is part of a family). Based on the family’s clinic against the entered clinics on the entered end date, select the list of PANs that are used to select the redemption data. The data model goes from PAN (EBTCard.CardNr) to Economic unit (EBTCard.IncF_ID) to Family (IncomeFamily.BFam_ID). Family’s clinic (FamilyClinic.BFam_ID to Cln_ID) is based on entered end date to the clinic effective date (FamilyClinic.EffectiveDt).
Cat/Subcat’s Quantity Issued calculation: Based on the issued food FDTU (EBTIssuedFood.FirstUseDt) against the entered time period and list of PANs (EBTIssuance.EBTC_ID), select the issued food. Based on the adjusted food FDTU (EBTAdjustmentFood.FirstUseDt) against the entered time period and list of PANs (EBTAdjustmentTransaction.EBTC_ID), select the adjusted food. This allows for the issuance units to take into account re-issuances (EBTAdjustmentTransaction.TransTypeCd = ‘REIS’) and manual adjustments (EBTAdjustmentTransaction.TransTypeCd = ‘MAN’). For issued and adjusted food, sum the unique categories and subcategories (based on PCON_ID) and units (based on Quantity). Units are adds or subtracts in the adjusted food.
Cat/Subcat’s Quantity Redeemed calculation: Based on the transaction date/time (ARFD4.LocalTxnDtTime) against the entered time period and list of PANs (ARF.EBTC_ID), select the ARF D4 Trip Thru the Lane. Within these ARF D4 transactions, select the ARF E2 UPC Purchases with valid UPC/PLUs (ARFE2.DP_ID). The ARF E2 Category and Subcategory (ARFE2.CategoryNr and ARFE2.SubCategoryNr) determine the issuance cat/subcat bucket (from above). Calculate the redemption units based
June 6, 2017 Vendor Management Reports Page 69 of 113

VM Vendor Management Reports MPSC WIC MIS System
on the purchased units (ARFE2.PurchaseUnits).Also, the redemption quantities need to take into account returned formula. Based on the returned formula FDTU (ReturnedFormula.FirstUseDt) against the entered time period and list of PANs (ReturnedFormula.EBTC_ID), select the Return Formula transactions. Based on Returned Formula (ReturnedFormula.PCon_ID), the units (ReturnedFormula.Quantity) are removed from the redeemed units.
Calculate Not Redeemed: Quantity Issued minus Quantity Redeemed.
Calculate Percent Redeemed: Quantity Redeemed divided by Quantity Issued.
Print Columns
LA/Clinic line:LA/Clinic: (width 20 - Formatted as 9 XX)For LA: LocalAgency.FFLocalAgencyID, LocalAgency.Name.For Clinic: Clinic.FFClinicID, Clinic.Name.
Category line:Category – (width 25 - Formatted as 99 XXX) <category number> <category name> (Based on EBTIssuedFood.PCon_ID, get FoodCategory.CategoryNr, FoodCategory.Name).
Subcategory line:Subcategory – (width 35 Formatted as 999 XXX) <subcategory number> <subcategory name> (Based on EBTIssuedFood.PCon_ID, get Product.SubCategoryNr, Product.Name).UOM – (width 6) Subcategory USDA Unit of Measure Description (Based on EBTIssuedFood.PCon_ID, get ProdContainer.ContainerSizeCd).Quantity Issued – see calculation above.Redeemed Quantity – see calculation above.Not Redeemed – see calculation above.
Percent Redeemed – see calculation above.The report does not include category / sub category for active food which had no issuance and no redemption during the entered time period.
Sort Order LA ID, Clinic ID, Category, SubcategoryTotal / Count Columns
Local Agency of the selected clinicsCategory
State Totals NonePrimary Group (page break)
Local Agency
Additional Group By
None
Page 70 of 113 Vendor Management Reports June 6, 2017

MPSC WIC MIS System VM Vendor Management Reports
June 6, 2017 Vendor Management Reports Page 71 of 113

VM Vendor Management Reports MPSC WIC MIS System
Page 72 of 113 Vendor Management Reports June 6, 2017

MPSC WIC MIS System VM Vendor Management Reports
2.5 EBT Vendor Sales (Smart Card EBT / Online Xerox EBT / Online CDP EBT)
These reports are related to the EBT sales from a vendor perspective. Every report displays vendor sales in some form.
2.5.1 UPC/PLU Sales by Vendor ReportDescription This report shows all the vendor sales for a UPC/PLU for a time period.
The UPC/PLU number and the time period can be entered as a parameter.
Parameters Start DateEnd DateUPC/PLU Number
Sub Titles <Start Date> through <End Date><UPC/PLU Number> – <UPC/PLU Description>
Record Selection / Filtering / Calculations
Select UPC/PLU sales records based on selection parameters. The start and End date are used to select the ARFD4 records where the date (ARFD4.LocalTxnDtTime) is within the date range. The ARFD4 is used to select the ARFE2 records where the detail Product UPC matches the parameter entered. (ARFE2.DP_ID to DetailProduct.ID for the DetailProduct.UPC).
Print Columns Detail line:
Vendor – Vendor ID (Vandor.FFVendorID) Vendor Name (Vandor.FFVendorID). ARF.VendID to the Vendor table. For Smart Card EBT, Vendor ID formatted to 4 digits (leading zeroes); otherwise format to 5 digits (leading zeroes).PG – PeerGroup.PeerGroupNumber - formatted to 2 digitsQuantity – Number of UPCs – Calculate by taking the ARFE2.PurchasedUnits divided by the UPC’s units (DetailProduct.Quantity) - Summed at the vendor level - format to 2 decimalsAverage Price – Total Sales / QuantityTotal Sales – ARFE2.ClaimedAmt - Summed at the vendor level
Sort Order Vendor IDTotal / Count Columns
None
State Totals NonePrimary Group (page break)
None
Additional None
June 6, 2017 Vendor Management Reports Page 73 of 113

VM Vendor Management Reports MPSC WIC MIS System
Group By
Page 74 of 113 Vendor Management Reports June 6, 2017

MPSC WIC MIS System VM Vendor Management Reports
2.5.2 Vendor EBT Redemption Summary ReportThis report is for EBT States Only
Description The Vendor EBT Redemption Summary Report summarizes redemptions transactions (purchases) at the peer group, vendor chain and the vendor levels.
Parameters Start DateEnd DatePeer GroupChain IDVendor ID
Sub Titles <Start Date> through <End Date>
Record Selection / Filtering / Calculations
For the entered vendors, select all the ARF files within the entered date range based on the settlement date (ARF.SettlementDt)
Vendor’s Purchase Total Count is the count of the Trip Through the Lane transactions (ARFD4).
Vendor’s Purchase Total Amount is the sum of the settlement amounts (ARF.SettlementAmt).
Print Columns
Vendor line:Vendor – Vendor.FFVendorID (4 digit) + StoreNamePurchase Total Count - CalculatedPurchase Total Amount - Calculated
Sort Order Peer Group Number, Vendor Chain Name, Vendor ID
Total / Count Columns
Statewide: Purchase Total Count, Purchase Total AmountPeer Group: Purchase Total Count, Purchase Total AmountChain: Purchase Total Count, Purchase Total Amount
State Totals Yes
Primary Group (page break)
None
Additional Group By
Peer GroupVendor Chain
June 6, 2017 Vendor Management Reports Page 75 of 113

VM Vendor Management Reports MPSC WIC MIS System
2.5.3 Vendor EBT Sales ReportThis report is for EBT States only.Description This report is used to view Vendor sales for a given fiscal year.Parameters Fiscal Year (4 digits) – A selection list of available years is generated
based on the available data.Sub Titles Fiscal Year <Year>
Local Agency (All, Select One or more)Record Selection / Filtering / Calculations
Select all vendor sales for a fiscal year based on the vendor’s local agency (Vendor.LA_ID) against the entered Local Agencies. Use the system parameter, System.FederalFiscalMonthStart, to determine the starting month/year and ending month/year for a period of 12 months. Use the batch generated VendorMonthlySales records for the Sales date within the Fiscal Year. The Data Effective date in the header indicates when the latest month of sales that were generated.
Print Columns
Vendor line:Vendor - Vendor ID with Vendor name + ‘, County = Vendor CountyVendorMonthlySales.VendID to the Vendor table. Vendor ID followed by the Vendor.StoreName. VendorAddresss.CountyNm where AddressTypeCd = ‘P’ (Physical) For Smart Card EBT, Vendor ID formatted to 4 digits (leading zeroes); otherwise format to 5 digits (leading zeroes).
Month Total Headings – (width 14) Month abbrev (3 char std) with a two-digit year. The first column is the 3 character abbreviation
Page 76 of 113 Vendor Management Reports June 6, 2017

MPSC WIC MIS System VM Vendor Management Reports
of the System parameter start month.
Month totals line:Monthly Totals - (12 Columns) – VendorMonthlySales.RedemptionAmt. If the fiscal year includes months in the future where no data has been processed (no existing record for the month in the VendorMonthlySales) a blank is displayed.Total – (width 14) the aggregate of the month’s totals for a Vendor.
Sort Order Vendor IDTotal / Count Columns
See month totals line.
State Totals NonePrimary Group (page break)
None
Additional Group By
None
Notes Due to amount of displayed information (150% of normal report); the standard report font is not used. A smaller font is used. This small mockup may need to be viewed in MS Word’s zoom mode.
June 6, 2017 Vendor Management Reports Page 77 of 113

VM Vendor Management Reports MPSC WIC MIS System
2.5.4 Vendor Formula Stocking ReportThis report is for EBT States only.Description This report details the vendor sales of infant formula and WEMF
UPCs/PLUs for a given time period. This allows a vendor to know the stocking impact of their sales.
Parameters Chain Based – Vendor Status Selection (Chain, Vendor Status and Vendors)Start DateEnd Date
Sub Titles <Start Date> through <End Date>Record Selection / Filtering / Calculations
Based on the transaction date/time (ARFD4.LocalTxnDtTime) against the entered time period, select the ARF D4 Trip Thru the Lane transactions for vendors (ARF.Vend_ID) against the entered vendors. Within these ARF D4 transactions, select the ARF E2 UPC Purchases with valid UPC/PLUs (ARFE2.DP_ID) and whose category is marked as Infant Formula (FoodCategory.FormulaIn = ‘Y’) or WIC Eligible Medical Foods (FoodCategory.MedicalIn = ‘Y’). This is based on the food category within Horizon of the UPC (ARFE2.DP_ID).
For each vendor and UPC combination, sum the quantity sold using the purchased units (ARFE2.PurchasedUnits) and sum the total sales using the paid amount (ARFE2.PaidAmt).
Print Columns
Vendor listing at top of each page displaying<Vendor> line – ARF.VendID to the Vendor table. Vendor ID followed by the Vendor.StoreName. For Smart Card EBT, Vendor ID formatted to 4 digits (leading zeroes); otherwise format to 5 digits (leading zeroes).<Contact> line – First and last name of the primary contact of the physical address. (VendorContact.FirstName and LastName of ContactTypeCd = ‘P’ and AddressTypeCd = ‘P’).<Address> line – Physical street address (VendorAddress.StreetAddrLine1, StreetAddrLine2, Suite of AddressTypeCd = ‘P’).<City, State, Zip> line - Physical address – city, state, zip. (VendorAddress.City, State, ZipCode, ZipPlus4 ofAddressTypeCd = ‘P’).
Detail line:UPC Number – DetailProduct.UPC (formatted number)Cat / Subcat (99-999) – UPC’s category and subcategory number (FoodCategory.CategoryNr + Product.SubCategoryNr).UPC Description – (DetalProduct.Description)Quantity Sold – sum of ARFE2.PurchasedUnits divided by the a UPC’s units (DetailProduct.Quantity) - format to 2 decimals.Total Sales – sum of ARFE2.PaidAmt).
Page 78 of 113 Vendor Management Reports June 6, 2017

MPSC WIC MIS System VM Vendor Management Reports
Sort Order Vendor ID, UPC NumberTotal / Count Columns
Vendor: Qty Sold, Total Sales
State Totals NonePrimary Group (page break)
Vendor
Additional Group By
None
Notes None
June 6, 2017 Vendor Management Reports Page 79 of 113

VM Vendor Management Reports MPSC WIC MIS System
2.5.5 Vendor UPC/PLU Sales ReportThis report is for EBT States only.Description This report contains vendor sales details of UPC/PLUs. Grouped by
Vendor, Category/Subcategory, followed by UPC/PLU. Each has quantity sold, total claimed amount and total paid amount.
Parameters Chain Based – Vendor Status Selection (Chain, Vendor Status and Vendors)Category (select none, one or all) – Active onlySubcategory (select none, one or all) – Active onlyStart DateEnd DateState Totals (Yes or No)
Sub Titles <Start Date> through <End Date>Record Selection / Filtering / Calculations
Based on the transaction date/time (ARFD4.LocalTxnDtTime) against the entered time period, select the ARF D4 Trip Thru the Lane transactions for vendors (ARF.Vend_ID) against the entered vendors. Within these ARF D4 transactions, select the ARF E2 UPC Purchases with valid UPC/PLUs (ARFE2.DP_ID) whose category/subcategories match against the entered category/subcategories. This is based on the food category/subcategory within the MPSC system of the UPC (ARFE2.DP_ID).
For each vendor and UPC/PLU combination, sum Quantity column using the purchased units (ARFE2.PurchasedUnits) divided by the UPC’s units (DetailProduct.Quantity), sum the Claim Amt column using the claimed amount (ARFE2.ClaimedAmt) and sum the Paid Amt column using the paid amount (ARFE2.PaidAmt).If State Totals = ‘Yes’, for each UPC/PLU, sum Quantity column using the purchased units (ARFE2.PurchasedUnits), and sum the Total Paid column using the paid amount (ARFE2.PaidAmt).
For determining the NTE: Select the vendor peer group based on the start date. Select the peer group (PG_ID) from the vendor’s VendorPGFactor record for the appropriate Effective Date (RecordedDt). The NTE data is on the DetailProductPeerGroup record which is selected based on the UPC/PLU Number (DP_ID), peer group (PG_ID) and appropriate Effective Date based on the start date (EffectiveDt). The NTE Price is determined by the following calculation of the DetailProductPeerGroup fields: PriceAmt plus Factor times StandardDeviation.
Print Columns
State Totals (if State Totals = ‘Yes’):Same as following lines but use state total numbers.
<vendor line>:Vendor - Vendor ID with Vendor Name. ARF.VendID to the Vendor table. Vendor ID by the Vendor.StoreName. For Smart Card EBT, Vendor ID formatted to 4 digits (leading zeroes); otherwise format to 5 digits (leading zeroes).
Page 80 of 113 Vendor Management Reports June 6, 2017

MPSC WIC MIS System VM Vendor Management Reports
Category / Subcategory line:Category – (width 25 - Formatted as 99 XXX) <category number> <category name> (Based on DP_ID, get FoodCategory.CategoryNr, FoodCategory.Name)Subcategory – (width 35 Formatted as 999 XXX) <subcategory number> <subcategory name> (Based on DP_ID, get Product.SubCategoryNr, Product.Name)
Detail line:UPC/PLU - DetailProduct.UPC (formatted number)UPC Description - DetailProduct.DescriptionUOM - (width 6) DetailProduct.UnitofMeasureCd (USDA UOM Description)Quantity – see calculation above. – format to 2 decimal placesNTE – see calculation above.Claim Amt - see calculation above.Paid Amt - see calculation above.
Sort Order Vendor ID, Category, Subcategory and UPC numberTotal / Count Columns
Per Category / Subcategory: Claim Amt, Paid AmtPer Vendor: Claim Amt, Paid Amt
State Totals If State Totals = ‘Yes’Primary Group (page break)
Vendor
Additional Group By
Category / Subcategory
Notes Due to amount of displayed information (125% of normal report); the standard report font is not used. A smaller font is used. This small mockup may need to be viewed in MS Word’s zoom mode.
June 6, 2017 Vendor Management Reports Page 81 of 113

VM Vendor Management Reports MPSC WIC MIS System
Page 82 of 113 Vendor Management Reports June 6, 2017

MPSC WIC MIS System VM Vendor Management Reports
2.5.6 Vendor UPC Price Increase ReportThis report is for EBT States only.Description This report shows the UPCs for any vendor which had a percent change
in price within a given time period. The percent increase is based on the by comparing the lowest price versus the highest price of a UPC for each vendor. The percent increase threshold is entered as a parameter.
Parameters Peer Group (All, Select One or more)Vendor (based on selected peer groups) (All, Select One or more)Start DateEnd DatePercent Increase (integer)
Sub Titles <Start Date> through <End Date> with > <Percent Increase>% increase
Record Selection / Filtering / Calculations
Based on the transaction date/time (ARFD4.LocalTxnDtTime) against the entered time period, select the ARF D4 Trip Thru the Lane transactions for vendors (ARF.Vend_ID) against the entered vendors. Within these ARF D4 transactions, select the ARF E2 UPC Purchases with valid UPC/PLUs (ARFE2.DP_ID) that have claim amount (ARFE2.ClaimedAmt) greater than 0. Also, eliminate any UPC/PLU from any category that is marked as CVV (FoodCategory.CashValueVoucherIn = ‘Y’). This is based on the food category within Horizon of the UPC (ARFE2.DP_ID).For each unique vendor and UPC combination, determine the minimum and maximum price. The price for a UPC is calculated by claimed amount (ARFE2.ClaimedAmt) divided by purchased units (ARFE2.PurchasedUnits) divided by the UPC’s units (DetailProduct.Quantity). The minimum is determined by the SQL functions min(<calculated price>). The maximum is determined by the SQL functions max(<calculated price>).Any unique vendor and UPC combination that has a difference of greater than the entered Percent Increase, display this UPC on the report.
Print Columns
Peer Group line:Peer Group – (PeerGroup.PeerGroupNumber) formatted to 2 digits.
Vendor line:Vendor - ARF.VendID to the Vendor table. Vendor ID followed by the Vendor.StoreName. For Smart Card EBT, Vendor ID formatted to 4 digits (leading zeroes); otherwise format to 5 digits (leading zeroes).
Detail line:UPC/PLU – DetailProduct.UPC (formatted form).UPC Description – DetailProduct.Description.Minimum Price – min(<calculated price<).Maximum Price – max(<calculated price>).Percent Increase – is the percentage of change between the minimum and the maximum price.
Sort Order Peer Group, Vendor ID, Percent Increase (descending)
June 6, 2017 Vendor Management Reports Page 83 of 113

VM Vendor Management Reports MPSC WIC MIS System
Total / Count Columns
None
State Totals NonePrimary Group (page break)
Peer Group
Additional Group By
Vendor
Notes
Page 84 of 113 Vendor Management Reports June 6, 2017

MPSC WIC MIS System VM Vendor Management Reports
2.5.7 Vendor Quarterly ReportThis report is for EBT States only.Description This report is for a set of vendors. Each vendor has a single page memo
followed by a single page special form with quarterly (by month) sales data.
Parameters Chain Based – Vendor Status Selection (Chains, Vendor Status and Vendors)Fiscal Year – (4 digits)Quarter – (Single selection from a list of 4) formatted as ‘xxx Quarter (mm/01/yyyy – mm/dd/yyyy)’ where xxx is 1st, 2nd, 3rd or 4th. The date ranges of the quarters is based entered Fiscal Year and the system parameter which defines the starting month of the Fiscal Year (System.FederalFiscalMonthStart). For example, if 2009 was entered into the Fiscal Year and the System.FederalFiscalMonthStart set to 10, the list would be:
1st Quarter (10/01/2008 – 12/30/2008)2nd Quarter (01/01/2009 – 03/30/2009)3rd Quarter (04/01/2009 – 06/30/2009)4th Quarter (07/01/2009 – 09/30/2009)
Sub Titles NoneRecord Selection / Filtering / Calculations
For the entered vendors, select all the ARF files within the entered date range based on the settlement date (ARF.SettlementDt)
Vendor’s Form Page: Number of Transactions is the count of the Trip Through the Lane transactions (ARFD4) for each month based on the settlement date (ARF.SettlementDt).
Vendor’s Form Page: Sales Volume is the sum of the settlement amounts (ARF.SettlementAmt) for each month based on the settlement date (ARF.SettlementDt).
Print Columns
Memo page (1st): The data is static with the exception of the following variable data:
Date: Current date.From:
Line 1 - Vendor LA Retail Coordinator. (Vendor.LA_ID to LocalAgency.RetailCoordinator).Line 2 – “<state name> WIC Program” where <state name> is State.Name based on system parameter System.StateAbbrev.
<Quarter dates in body>: Pull dates out of entered quarter parameter.<Fax # in body>: Vendor’s LA’s Fax Number. (Vendor.LA_ID to LocalAgency.FaxAreaCode and FaxPhoneNumber).<Contact me # in body>: Vendor LA’s Phone Number. (Vendor.LA_ID to LocalAgency.BusinessAreaCode and
June 6, 2017 Vendor Management Reports Page 85 of 113

VM Vendor Management Reports MPSC WIC MIS System
BusinessPhoneNumber).Paragraph 2 text – “If you would like a list of Infant Formula Wholesalers, Distributors, and Licensed Retailers that is maintained by the <state name> WIC Program, please let me know.” where <state name> is State.Name based on system parameter System.StateAbbrev.Paragraph 3 test – “….We thank you for your support of the <state name> WIC Program…..” where <state name> is State.Name based on system parameter System.StateAbbrev. where <state name> is State.Name based on system parameter System.StateAbbrev.
Form Page (2nd page) - The data is static with the exception of the following variable data:
Form Title – “<state name WIC Program” where <state name> is State.Name based on system parameter System.StateAbbrev.<Fiscal Year and Quarter> top of page: FY + entered Fiscal Year parameter + Pull text out of entered quarter parameter.Vendor Number: Vendor ID (Vendor.FFVendor_ID) For Smart Card EBT, Vendor ID formatted to 4 digits (leading zeroes); otherwise format to 5 digits (leading zeroes).Vendor Name: Vendor Name (Vendor.StoreName)Vendor Address:
<Address> line – Physical street address (VendorAddress.StreetAddrLine1, StreetAddrLine2, Suite of AddressTypeCd = ‘P’).<City, State, Zip> line - Physical address – city, state, zip. (VendorAddress.City, State, ZipCode, ZipPlus4 ofAddressTypeCd = ‘P’).
Vendor Phone: General Store Phone Number (Vendor.GeneralStoreAreaCd + Vendor.GeneralStorePhoneNr)Vendor Fax: Fax phone number of the primary contact of the physical address. (VendorContact.BusFaxAreaCode and BusFaxNr of ContactTypeCd = ‘P’ and AddressTypeCd = ‘P’).Sales data in Vendor box:
<Sales month>: Full month name of each month in quarter<Number of Transactions>: See calculation above.<Sales Volume>: See calculation above.
Name of WIC Staff: Vendor LA Retail Coordinator. (Vendor.LA_ID to LocalAgency.RetailCoordinator).Fax: # in body>: Vendor’s LA’s Fax Number. (Vendor.LA_ID to LocalAgency.FaxAreaCode and FaxPhoneNumber).
Sort Order Vendor IDTotal / Count Columns
Form Page (Vendor box): Number of Transactions and Sales Volume
State Totals NonePrimary Group (page
For each entered vendor, a single Memo page and a single Form page is produced (each on their own page).
Page 86 of 113 Vendor Management Reports June 6, 2017

MPSC WIC MIS System VM Vendor Management Reports
break)Additional Group By
None
Notes None
June 6, 2017 Vendor Management Reports Page 87 of 113

VM Vendor Management Reports MPSC WIC MIS System
Memo Page
MemoDate: 09/05/2013To: All WIC Authorized VendorsFrom: Sally Smith
State WIC ProgramRe: Quarterly Reports
It's That time again! Attached is the Transaction Quarterly Sales Report that contains the total sales and transaction data from 01/01/2013 to 03/31/2013. Please review the report for any comments/concerns noted for the quarter; then complete the Formula Supplier information and fax the form to me at (321) 555-7654.If you would like a list of Infant Formula Wholesalers, Distributors and Licensed Retailers that is maintained by the State WIC Program, please let me know.
If you have any questions or concerns, please contact me at (321) 555-4567. We thank you for your support of the State WIC Program and look forward to working with you in the future.Thank you.
Page 88 of 113 Vendor Management Reports June 6, 2017
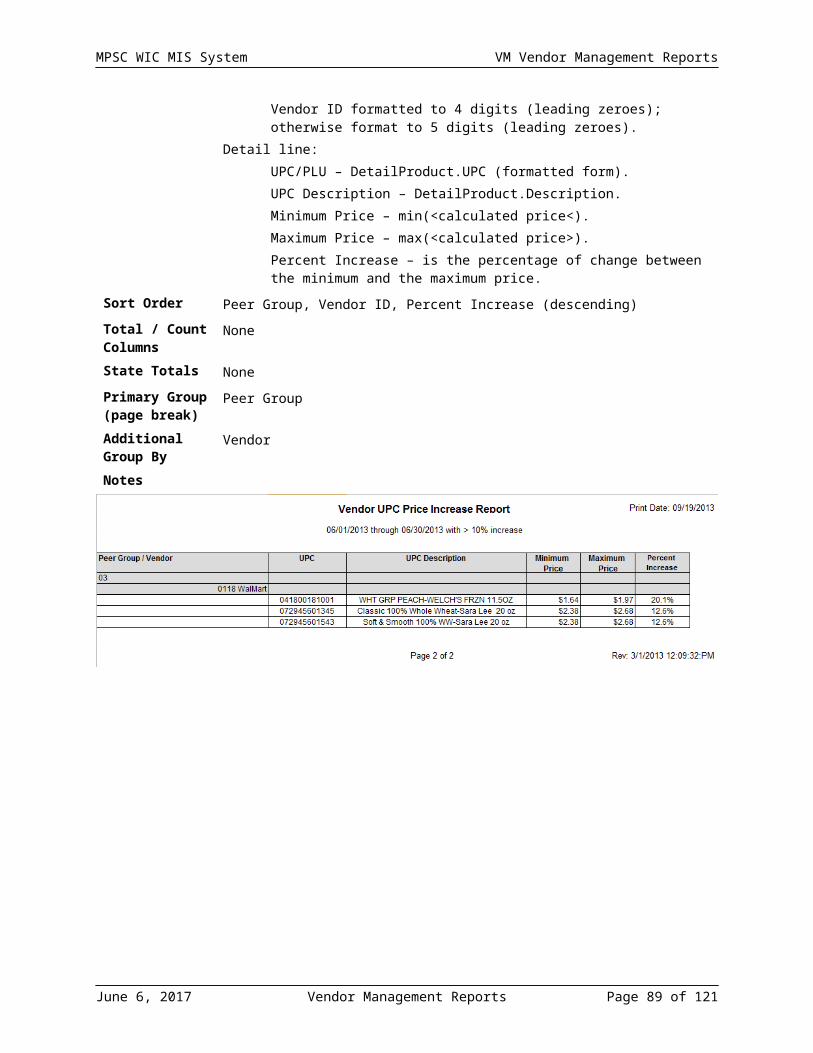
MPSC WIC MIS System VM Vendor Management Reports
Form Page
State WIC ProgramQuarterly Report
FY2013 2nd Quarter
Vendor Number: 0104 Date: _______________________________
Vendor Name: Eastside Store
Vendor Address: 123 Test Avenue Type of Contact: Personal Visit Mail
Greenwood Village, CO 80111 Telephone Fax
Vendor Phone: (123) 555-1234 Is this store high risk? Yes No
Vendor Fax: (123) 555-4321 Is this store in violation? Yes No
Sanction Points added this Quarter: _________
Sales Number of Transactions
Sales Volume Total Sanction Points: _________
January 46 $1,008.75
February 30 $724.77
March 40 $919.72
Total 116 $2,653.24
Previous Violations or Issues of Concern:
Comments to Vendor:
Comments from Vendor:
Follow-up or Corrective Action Needed:
Formula Supplier (name, address and phone):
Name of WIC Staff: Sally Smith Fax: (321) 555-7654
June 6, 2017 Vendor Management Reports Page 89 of 113

VM Vendor Management Reports MPSC WIC MIS System
Signature of WIC Staff: Date:
Name of Vendor Staff:
Date:Signature of Vendor Staff:
"USDA is an equal opportunity provider and employer."
Page 90 of 113 Vendor Management Reports June 6, 2017

MPSC WIC MIS System VM Vendor Management Reports
2.6 EBT UPC/PLU (Smart Card EBT / Online Xerox EBT / Online CDP EBT)
These reports are related to the administration of the UPCs/PLUs. Every report displays UPC/PLU information in some form.
2.6.1 Formula Purchased ReportThis report is for EBT only.Description This report details the sales of infant formula and WEMF UPCs/PLUs for a
given time period. The data that is reported can be controlled by selecting the vendors.
Parameters Chain Based – Vendor Status Selection (Chains, Vendor Status and Vendors)Start DateEnd Date
Sub Titles <Start Date> through <End Date>Record Selection / Filtering / Calculations
Based on the transaction date/time (ARFD4.LocalTxnDtTime) against the entered time period, select the ARF D4 Trip Thru the Lane transactions for vendors (ARF.Vend_ID) against the entered vendors. Within these ARF D4 transactions, select the ARF E2 UPC Purchases with valid UPC/PLUs (ARFE2.DP_ID) and whose category is marked as Infant Formula (FoodCategory.FormulaIn = ‘Y’) or WEMF (FoodCategory.MedicalIn = ‘Y’). This is based on the food category within Horizon of the UPC (ARFE2.DP_ID).
For each vendor and UPC combination, sum the Purchased Quantity using the purchased units (ARFE2.PurchasedUnits) divided by the UPC’s units (DetailProduct.Quantity) and sum the Paid Amount using the paid amount (ARFE2.PaidAmt).
For each vendor and UPC combination, calculate Unit Price by dividing the summed Paid Amount by the summed Purchased Quantity.
Print Columns
Category / Subcategory line:Category / Subcategory (Formatted as 99 XXX / 999 XXX) -<category number> <category name> + ‘/‘ + <subcategory number> <subcategory name> (Based on DP_ID, get FoodCategory.CategoryNr, FoodCategory.Name, Product.SubCategoryNr, Product.Name).
Vendor line:Vendor – Is the Vendor ID with Vendor Name. ARF.VendID to the Vendor table. Vandor.FFVendorID followed by the Vendor.StoreName. For Smart Card EBT, Vendor ID formatted to 4 digits (leading zeroes); otherwise format to 5 digits (leading zeroes).
Detail line:UPC Number – DetailProduct.UPC (formatted number)
June 6, 2017 Vendor Management Reports Page 91 of 113

VM Vendor Management Reports MPSC WIC MIS System
UPC Description – DetalProduct.DescriptionUnits – DetailedProduct.QuantityUnit Price – See calculation above.Purchased Quantity- See calculation above – format to 2 decimal places.Paid Amount – See calculation above.Rebatable - (Y or N) ‘Y’ if a rebate rate was effective for any time within the entered time period. This is based on the UPC/PLU Rebate dates (UPCRebateRate.EffectiveDt and UPCRebateRate.EndDt).
Sort Order Category Number, Subcategory Number, Vendor, UPC NumberTotal / Count Columns
Category / Subcategory: Purchased Quantity, Paid Amount
State Totals NonePrimary Group (page break)
None
Additional Group By
Category, Subcategory, Vendor
Notes
Page 92 of 113 Vendor Management Reports June 6, 2017

MPSC WIC MIS System VM Vendor Management Reports
2.6.2 Top UPC/PLU Sold Report This report is for EBT States only.Description This report shows the top UPC/PLUs sold within selected Subcategories
The number of the top reported UPC/PLUs sold is a selectable parameter.
Parameters Top (count)Category (All, Select One or more) – Active only (categories that have an Effective Date (FoodCategory.EffectiveDt) and End Date (FoodCategory.EndDt) within the Start and End Date parameters (inclusive))Subcategory (All, Select One or more) – Do not show any ‘000’ subcategories. – Active only (subcategories that have an Effective Date (Product.EffectiveDt) and End Date (Product.EndDt) within the Start and End Date parameters (inclusive))Start DateEnd Date
Sub Titles Top <Top> from <Start Date> through <End Date>Record Selection / Filtering / Calculations
Select UPC/PLU sales records based on selection parameters: Start and End date (ARFD4.LocalTxnDtTime) and Category/Subcategory for UPC/PLUs (ARFE2.DP_ID).For each Category/Subcategory, aggregate the purchase quantity (ARFE2.PurchasedUnits) and paid amount (ARFE2.PaidAmt) by Category/Subcategory and by UPC/PLU.Select the top UPC/PLU by quantity in each Category/Subcategory. Calculate percent as UPC/PLU quantity divided by Category/Subcategory quantity.
Print Columns Category / Subcategory line:
Category / Subcategory (Formatted as 99 XXX / 999 XXX) <category number> <category name> + ‘/‘ + <subcategory number> <subcategory name> (Based on DP_ID, get FoodCategory.CategoryNr, FoodCategory.Name, Product.SubCategoryNr, Product.Name).
Detail line:UPC/PLU – Detail Product (DetailProduct.UPC) related to the Redemption (ARFE2.DP_ID)UPC description - DetailProduct.DescriptionPurchased Quantity - Aggregate of the number of UPC/PLU purchased (ARFE2.PurchasedUnits divided by the UPC’s units (DetailProduct.Quantity) – format to 2 decimal places)Purchased Total - Aggregate of UPC/PLU paid amount (ARFE2.PaidAmt)Percent of Total Sales – UPC/PLU quantity divided by Category/Subcategory quantity.
June 6, 2017 Vendor Management Reports Page 93 of 113

VM Vendor Management Reports MPSC WIC MIS System
Sort Order Category/Subcategory, Percent of Total SalesTotal / Count Columns
None
State Totals NonePrimary Group (page break)
None
Additional Group By
None
Notes None
Page 94 of 113 Vendor Management Reports June 6, 2017

MPSC WIC MIS System VM Vendor Management Reports
2.6.3 UPC Price Compare ReportThis report is for EBT States only.Description This report shows UPCs that are out of line in prices from other UPC in
their subcategories. This is done by showing UPCs whose average prices are a given percentage about the average prices of the subcategory. The percentage is a parameter entered by the user and represents the percentage over the average price of UPC's Subcategory.
Parameters Category (All, Select One or more) – Do not show any category where the CVV indicator is Yes. – Active only (categories that have an Effective Date (FoodCategory.EffectiveDt) and End Date (FoodCategory.EndDt) within the Start and End Date parameters (inclusive))Subcategory (All, Select One or more) – Do not show any ‘000’ subcategories. – Active only (subcategories that have an Effective Date (Product.EffectiveDt) and End Date (Product.EndDt) within the Start and End Date parameters (inclusive))Start DateEnd DatePercent Difference (integer)
Sub Titles <Start Date> through <End Date> with > <Percent>% DifferenceRecord Selection / Filtering / Calculations
Based on entered time period against the transaction date/time (ARFD4.LocalTxnDtTime), select the ARF D4 Trip Thru the Lane transactions. Within these D4 transactions, based on entered subcategories use the UPC’s base subcategory, select the ARF E2 UPC Purchases with valid UPC/PLUs (ARFE2.DP_ID).
Calculate each subcategory’s average price for the period based on the claim amounts (ARFE2.ClaimAmt) and purchased units (ARFE2.PurchasedUnits) for all UPC/PLUs in the category/subcategory. A UPC/PLU’s units (ARFE2.DP_ID to DetailProduct.Quantity) in relation to the subcategory must be factored in.
Calculate each UPC/PLU’s average price for the period based on the claim amounts (ARFE2.ClaimAmt) and purchased units (ARFE2.PurchasedUnits divided by the UPC’s units (DetailProduct.Quantity)).
Calculate each UPC/PLU’s Percent Over Average by comparing the subcategory’s average price against the UPC/PLU’s average price. The UPC/PLU’s units (ARFE2.DP_ID to DetailProduct.Quantity) in relation to the subcategory must be factored in.
Any UPC/PLU’s Percent Over Average that is greater than or equal to the entered Percent Difference is displayed on the report.
Print Columns
Category / Subcategory line:Category / Subcategory (Formatted as 99 XXX / 999 XXX) <category number> <category name> + ‘/‘ + <subcategory number> <subcategory name> (Based on DP_ID, get
June 6, 2017 Vendor Management Reports Page 95 of 113
VM Vendor Management Reports MPSC WIC MIS System
FoodCategory.CategoryNr, FoodCategory.Name, Product.SubCategoryNr, Product.Name)Average Price – Calculated average price for the subcategoryUOM – Subcategory Issuance Unit of Measure -Prodcontainer.ContainerSizeCd (English description)
Detail line:UPC/PLU – DetailProduct.UPC (formatted form)UPC Description – DetailProduct.Description.Purchased Quantity – Sum of UPC/PLU purchased – ARFE2.PurchasedUnits divided by the UPC’s units (DetailProduct.Quantity) – format to 2 decimal places.Average Price – Calculated average price for the UPC/PLUsPercent Over Average - is the calculation of the percentage of the UPC/PLU purchase price over the average price of the UPC/PLU purchased between the Start and the End Date. Percent formatted to whole number.Units / Subcat – Units in relation to the subcategory - DetailProduct.QuantityUOM – UPC/PLU Unit of Measure (USDA UOM Description)- (width 6) DetailProduct.UnitofMeasureCdThe Percent Over Avg Price must account for the difference of the UPC’s Units / Subcat. The subcategory average price is based on its UOM whereas the UPC’s average price may be based on a UOM that is multiples of the subcat (i.e. a gallon is 4 units of quarts).
Sort Order Category/Subcategory and UPC numberTotal / Count Columns
None
State Totals NonePrimary Group (page break)
None
Additional Group By
None
NotesDue to amount of displayed information (125% of normal report); the standard report font is not used. A smaller font is used. This small mockup may need to be viewed in MS Word’s zoom mode.
Page 96 of 113 Vendor Management Reports June 6, 2017

MPSC WIC MIS System VM Vendor Management Reports
June 6, 2017 Vendor Management Reports Page 97 of 113

VM Vendor Management Reports MPSC WIC MIS System
2.6.4 UPC/PLU List This report is for EBT States only.Description This report contains the quantity and benefit details for active
UPCs/PLUs within a given time period.Parameters Category (All, Select One or more) – Active only (categories that have an
Effective Date (FoodCategory.EffectiveDt) and End Date (FoodCategory.EndDt) within the Start and End Date parameters (inclusive))Subcategory (All, Select One or more) – Do not show any 000 subcategories – Active only (subcategories that have an Effective Date (Product.EffectiveDt) and End Date (Product.EndDt) within the Start and End Date parameters (inclusive))Start DateEnd Date
Sub Titles Active from <Start Date> through <End Date>Record Selection / Filtering / Calculations
Based on the entered subcategories, select all UPC/PLU (DetailProduct) that were effective for any time within the entered time period. This is based on the UPC/PLU dates (DetailProduct.EffectiveDt and DetailProduct.EndDt).
Print Columns
Category / Subcategory line:Category / Subcategory (Formatted as 99 XXX / 999 XXX) -<category number> <category name> + ‘/‘ + <subcategory number> <subcategory name> (Based on DP_ID, get FoodCategory.CategoryNr, FoodCategory.Name, Product.SubCategoryNr, Product.Name).
Detail line:UPC/PLU – DetailProduct.UPC (formatted form)UPC Description – DetailProduct.Description.UOM – (width 6) DetailProduct.UnitofMeasureCd (USDA UOM Description)Units – DetailProduct.QuantityBenefit Qty – DetailProductBenefitQuantityRebate - (Y or N) ‘Y’ if a rebate rate was effective for any time within the entered time period. This is based on the UPC/PLU Rebate dates (UPCRebateRate.EffectiveDt and UPCRebateRate.EndDt).Generic (Y or N) - DetailProduct.GenericInAll Auth - (Y or N) - DetailProduct.ExcludeIn (inverse of indicator)
Sort Order Category / Subcategory Number, UPC/PLU NumberTotal / Count Columns
None
State Totals NonePrimary None
Page 98 of 113 Vendor Management Reports June 6, 2017

MPSC WIC MIS System VM Vendor Management Reports
Group (page break)Additional Group By
None
Notes Due to amount of displayed information (125% of normal report); the standard report font is not used. A smaller font is used. This small mockup may need to be viewed in MS Word’s zoom mode.
June 6, 2017 Vendor Management Reports Page 99 of 113

VM Vendor Management Reports MPSC WIC MIS System
2.6.5 UPC/PLU List for Vendors This report is for EBT States only.Description This report contains the active UPCs/PLUs within a given time period.Parameters Category (All, Select One or more) – Active only (categories that have an
Effective Date (FoodCategory.EffectiveDt) and End Date (FoodCategory.EndDt) within the Start and End Date parameters (inclusive))Subcategory (All, Select One or more) – Do not show any 000 subcategories – Active only (subcategories that have an Effective Date (Product.EffectiveDt) and End Date (Product.EndDt) within the Start and End Date parameters (inclusive))Start DateEnd Date
Sub Titles Active from <Start Date> through <End Date>Record Selection / Filtering / Calculations
Based on the entered subcategories, select all UPC/PLU (DetailProduct) that were effective for any time within the entered time period. This is based on the UPC/PLU dates (DetailProduct.EffectiveDt and DetailProduct.EndDt).
Print Columns
Category / Subcategory line:Category / Subcategory (Formatted as 99 XXX / 999 XXX) -<category number> <category name> + ‘/‘ + <subcategory number> <subcategory name> (Based on DP_ID, get FoodCategory.CategoryNr, FoodCategory.Name, Product.SubCategoryNr, Product.Name).
Detail line:UPC/PLU – DetailProduct.UPC (formatted form)UPC Description – DetailProduct.Description.Effective Date – DetailProduct.EffectiveDtEnd Dates – DetailProduct.EndDt
Sort Order Category / Subcategory Number, UPC/PLU NumberTotal / Count Columns
None
State Totals NonePrimary Group (page break)
None
Additional Group By
None
Notes None
Page 100 of 113 Vendor Management Reports June 6, 2017

MPSC WIC MIS System VM Vendor Management Reports
June 6, 2017 Vendor Management Reports Page 101 of 113

VM Vendor Management Reports MPSC WIC MIS System
2.6.6 UPC/PLU Not Purchased ReportThis report is for EBT States only.
Description The UPC/PLU Not Purchased Report is to assist the state in determining which UPCs may need to drop from their list of available UPCs.
Parameters Category (All, Select One or more) – Active only categories that have an Effective Date (FoodCategory.EffectiveDt) and End Date (FoodCategory.EndDt) within the Start and End Date parameters (inclusive))Start DateEnd DateCount
Sub Titles <Start Date> through <End Date>
Record Selection / Filtering / Calculations
For each active UPC, count the quantity of redeemed UPCs from the selected subcategories for all vendors from the start to end date inclusively.An active UPC/PLU is based on the End Date parameter: if the date is after the UPC/PLU’s effective date (DetailProduct.EffectiveDt) and before the end date (DetailProduct.EndDt) then it is active. For each UPC/PLU in this list, sum the purchased UPCs (ARFE2.PurchasedUnits divided by the UPC’s units (DetailProduct.Quantity)). The ARFE2 records to be selected are based on the transaction date/time (ARFD4.LocalTxnDtTime) against the entered time period; select the ARF D4 Trip Thru the Lane transactions. Within these ARF D4 transactions and whose ARF E2 UPC Purchases must have valid UPC/PLUs (ARFE2.DP_ID is not null).
The UPC/PLU that are reported are those whose sum is less than or equal to the Count parameter.
Print Columns
Category / Subcategory (Formatted as 99 XXX / 999 XXX) -<category number> <category name> + ‘/‘ + <subcategory number> <subcategory name> (Based on DP_ID, get FoodCategory.CategoryNr, FoodCategory.Name, Product.SubCategoryNr, Product.Name).UPC/PLU – DetailProduct.UPC (formatted number)UPC/PLU Description - DetalProduct.DescriptionGeneric (Yes or No) – DetailProduct.GenericIn Last Date Sold – Most recent transaction date/time (ARFD4.LocalTxnDtTime) for the UPC/PLU. If none were sold, the cell is blank.
Sort Order Category number, Subcategory number, UPC/PLU
Page 102 of 113 Vendor Management Reports June 6, 2017
MPSC WIC MIS System VM Vendor Management Reports
Total / Count Columns
None
State Totals None
Primary Group (page break)
None
Additional Group By
None
June 6, 2017 Vendor Management Reports Page 103 of 113

VM Vendor Management Reports MPSC WIC MIS System
2.6.7 UPC/PLU Purchased ReportThis report is for EBT States only.
Description The EBT UPC/PLU Food Purchased Report shows the UPC counts and average prices for the selected categories over a selected time period.
Parameters Start DateEnd DatesCategory (All, Select One or more) – Active only (categories that have an Effective Date (FoodCategory.EffectiveDt) and End Date (FoodCategory.EndDt) within the Start and End Date parameters (inclusive))Subcategory (All, Select One or more) – Do not show any 000 subcategories – Active only (subcategories that have an Effective Date (Product.EffectiveDt) and End Date (Product.EndDt) within the Start and End Date parameters (inclusive))
Sub Titles <Start Date> through <End Date>
Record Selection / Filtering / Calculations
Based on the transaction date/time (ARFD4.LocalTxnDtTime) against the entered time period, select the ARF D4 Trip Thru the Lane transactions. Within these ARF D4 transactions, select the ARF E2 UPC Purchases with valid UPC/PLUs (ARFE2.DP_ID); select using their system defined category/subcategories against the enter category/subcategories. This is based on the food category/subcategory within the MPSC system of the UPC (ARFE2.DP_ID).
For each UPC/PLU, sum the Units column using the purchased units (ARFE2.PurchasedUnits divided by the UPC’s units (DetailProduct.Quantity)), and sum the Total Paid column using the paid amount (ARFE2.PaidAmt).
Calculate Average: Divide the Total Paid by Purchase Quantity.
Calculate Active: Based on the End Date parameter, if the date is within the UPC/PLU’s effective date (DetailProduct.EffectiveDt) and end date (DetailProduct.EndDt), then display a ‘Yes’; otherwise display a ‘No’.
Calculate Last Used: Most recent Transaction date/time (ARFD4.LocalTxnDtTime) where a ARF E2 UPC Purchases with the UPC/PLU is found (ARFE2.DP_ID).
Page 104 of 113 Vendor Management Reports June 6, 2017
MPSC WIC MIS System VM Vendor Management Reports
Print Columns
Category / Subcategory line:Category / Subcategory (Formatted as 99 XXX / 999 XXX) -<category number> <category name> + ‘/‘ + <subcategory number> <subcategory name> (Based on DP_ID, get FoodCategory.CategoryNr, FoodCategory.Name, Product.SubCategoryNr, Product.Name).
Detail line:UPC/PLU – DetailProduct.UPC (formatted number)UPC/PLU Description – DetalProduct.DescriptionUOM – (width 6) DetailProduct.UnitofMeasureCd (USDA UOM Description)Units – DetailedProduct.QuantityBenefitQuantity – DetailProduct.BenefitQty – format to 2 decimal places.Active – See calculation above.Last Used – See calculation above.Average Price – See calculation above.Purchased Quantity – See calculation above.Total Paid – See calculation above.
Sort Order Category / SubcategoryUPC/PLU
Total / Count Columns
None
State Totals None
Primary Group (page break)
None
Additional Group By
Category / Subcategory
Notes Due to amount of displayed information (125% of normal report); the standard report font is not used. A smaller font is used. This small mockup may need to be viewed in MS Word’s zoom mode.
June 6, 2017 Vendor Management Reports Page 105 of 113

VM Vendor Management Reports MPSC WIC MIS System
Page 106 of 113 Vendor Management Reports June 6, 2017

MPSC WIC MIS System VM Vendor Management Reports
2.6.8 UPC/PLU APL Type Report (Online CDP EBT Only)This report is for states using the optional APL Type functionality. Currently, APL Type functionality is only available to EBT States using CDP’s WIC Direct as their EBT Host. APL Type functionality allows WIC Direct to create Approved Product List (APL) files that only include foods that a vendor is allowed to sell. The APL Type identified in the vendor and UPC/PLU data is the mechanism that allows WIC Direct to generate customized APL files for each vendor. Description This report lists UPCs and PLUs by Category and Subcategory and
includes their assigned APL Types. The report is grouped by Category, Subcategory. The report sequence is Category, Subcategory, UPC/PLU Description.
Parameters Category (All, Select One or more) – Display FoodCategory.CategoryNr concatenated with FoodCategory.ShortName. List active Categories only (Categories that have an Effective Date (FoodCategory.EffectiveDt) less than or equal to the current date and an End Date greater than or equal to the current date. Display list in FoodCategory.CategoryNr sequence.
Subcategory (All, Select One or more) – Do not show any 000 Subcategories. Display Product.SubCategoryNr concatenated with Product.ShortNm. List active Subcategories only (Subcategories that have an Effective Date (Product.EffectiveDt) less than or equal to the current date and an End Date (Product.EndDt) that is greater than or equal to the current date. Display only Subcategories related to the selected Category parameter values, where Product.FC_ID = FoodCategory.ID. Display list in Product.SubCategoryNr sequence.
APL Type (All, none, one, or more) – Display Code.AssignedCd concatenated with Code.LongDc where Code.Status = ‘A’ and Code.CT_ID = CodeType.ID and CodeType.ShortDc = ‘APL Type’. Display list in Code.DisplaySeqNr, Code.LongDc sequence.
Sub Titles NoneRecord Selection / Filtering / Calculations
Return all UPC/PLU data with the selection parameters: APL Type selection:
o Select DetailProduct records with a DetailProduct.EffectiveDt less than or equal to the current date and a DetailProduct.EndDt that is empty or greater than or equal to the current date and there is a DetailProductAPLType record with DetailProductAPLType.APLTypeCd equal to one of the selected APL Type parameter values.
Category selection:o Select DetailProduct records with a
DetailProduct.EffectiveDt less than or equal to the current date and a DetailProduct.EndDt that is empty or greater than or equal to the current date and the related Category record is equal to one of the selected Category parameter
June 6, 2017 Vendor Management Reports Page 107 of 113

VM Vendor Management Reports MPSC WIC MIS System
values. Subcategory selection:
o Select DetailProduct records with a DetailProduct.EffectiveDt less than or equal to the current date and a DetailProduct.EndDt that is empty or greater than or equal to the current date and the related Product record is equal to one of the selected Subcategory parameter values.
Print Columns
Heading Line APL Type – Display all Code.AssignedCd values separated by
spaces where Code.Status = ‘A’ and CodeType.ShortDc = ‘APL Type’.
Total Line Category – Display FoodCategory.CategoryNr concatenated with
FoodCategory.ShortName. Subcategory – Display Product.SubCategoryNr concatenated with
Product.ShortNm. Total Count – Count of DetailProduct records within the Category,
Subcategory group.
Detail Line UPC/PLU – DetailProduct.UPC. UPC/PLU Description – DetailProduct.Description. APL Type – Display ‘X’ under the appropriate APL Type heading
column for each DetailProductAPLType record that is found based on the DetailProductAPLType.APLTypeCd values found.
Sort Order Category, Subcategory, UPC/PLU DescriptionPrimary Group (page break)
N/A
Additional Group By
Category, Subcategory
Page 108 of 113 Vendor Management Reports June 6, 2017
MPSC WIC MIS System VM Vendor Management Reports
June 6, 2017 Vendor Management Reports Page 109 of 113

VM Vendor Management Reports MPSC WIC MIS System
2.6.9 UPC/PLU Peer Group Price History Report This report is for EBT States only.Description This report displays the average prices claimed by vendors for selected
UPCs or PLUs and compares the claimed price to the Peer Group Target Price. The user chooses the Category, Subcategory, the date range of redemption data to be selected, and Peer Group. The user may also filter the selection by entering an optional range of package unit sizes.
Parameters Category (All, Select One or more) – Display FoodCategory.CategoryNr concatenated with FoodCategory.ShortName. List active Categories only (Categories that have an Effective Date (FoodCategory.EffectiveDt) less than or equal to the current date and an End Date greater than or equal to the current date). Display list in FoodCategory.CategoryNr sequence.
Subcategory (All, Select One or more) – Do not show any 000 Subcategories. Display Product.SubCategoryNr concatenated with Product.ShortNm. List active Subcategories only (Subcategories that have an Effective Date (Product.EffectiveDt) less than or equal to the current date and an End Date (Product.EndDt) that is greater than or equal to the current date). Display only Subcategories related to the selected Category, where Product.FC_ID = FoodCategory.ID. Display list in Product.SubCategoryNr sequence.
Start Date – Earliest redemption date to be selected for the report. Includes the calendar control for selection.
End Date – Latest redemption date to be selected for the report. End Date must be >= Start Date. Includes the calendar control for selection.
Peer Group (All, Select One or more) – The list of active, available peer groups available for filtering. Display PeerGroup.PeerGroupNumber where PeerGroup.Status = ‘A’. Display in PeerGroup.PeerGroupNumber sequence.
Start Units Range – Optional entry text field. Numeric whole numbers only. If a value is entered, then a value must also be entered in End Units Range. If Start Units Range is blank, no filtering occurs for Units.
End Units Range – Optional entry text field. Numeric whole numbers only. If a value is entered, then a value must also be entered in Start Units Range and End Units Range must be >= Start Units Range. If End Units Range is blank, no filtering occurs for Units.
Sub Titles <Start Date> Through <End Date>Record Selection / Select ARFE2 purchase records where:
Page 110 of 113 Vendor Management Reports June 6, 2017

MPSC WIC MIS System VM Vendor Management Reports
Filtering / Calculations The related ARFD4.LocalTxnDtTime is greater than or equal to
Start Date and ARFD4.LocalTxnDtTime is less than or equal to End DateAnd ARFE2.CategoryNr equals the selected CategoryAnd ARFE2.DP_ID = DetailProduct.ID and DetailProduct.PCon_ID = ProdContainer.ID and ProdContainer.Prod_ID = Product.ID and Product.SubCategoryNr equals the selected Subcategory.
Filter the selected purchase data to eliminate any purchases where ARF.Vend_ID = current VendorPGFactor.Vend_ID and VendorPGFactor.PG_ID = PeerGroup.ID and PeerGroup.PeerGroupNumber is not selected in the Peer Group criterion.
If Start Units Range and End Units Range contain numeric values, filter the selected purchase data to eliminate any purchases where ARFE2.DP_ID = DetailProduct.ID and DetailProduct.Quantity < Start Units Range or DetailProduct.Quantity > End Units Range.
Display DetailProduct.Quantity in the report detail line with 2 decimal places. But for the purpose of grouping and totaling by units, round DetailProduct.Quantity to the nearest whole number and group by the rounded value. For example, a UPC with units = 17.4 oz. would display 17.4 in the Units column of a detail line. But it would be totaled with other UPCs with units between 16.5 and 17.4 and would be totaled with the group = 17.
Print Columns Peer Group line - PeerGroup.PeerGroupNumber
Category / Subcategory lineCategory / Subcategory (Formatted as 99 XXX / 999 XXX) <category number> <category name> + ‘/‘ + <subcategory number> <subcategory name> (Based on DP_ID, get FoodCategory.CategoryNr, FoodCategory.Name, Product.SubCategoryNr, Product.Name).Units Purchased – sum of DetailProduct.Quantity for all UPC/PLUs for the Category/Subcategory.Average Claim Amount - Sum of ARFE2.ClaimAmt / Sum of ARFE2.PurchasedUnits for all UPC/PLUs for the Category/Subcategory.
Units lineUnits – Grouping rounded DetailProduct.Quantity.Units Purchased – sum of DetailProduct.Quantity for all UPC/PLUs for the Units group.Average Claim Amount - Sum of ARFE2.ClaimAmt / Sum of ARFE2.PurchasedUnits for all UPC/PLUs for the Units group.
June 6, 2017 Vendor Management Reports Page 111 of 113

VM Vendor Management Reports MPSC WIC MIS System
Detail line:UPC/PLU – DetailProduct.UPCUPC/PLU Description - DetailProduct.DescriptionUOM – Display the Description from List Management where the LM Code = Code = ‘Container Size’ and the LM value = ProdContainer.ContainerSizeCdUnits - DetailProduct.QuantityTarget Price – Current DetailProductPeerGroup.PriceAmtLift Factor – Current DetailProductPeerGroup.FactorNTE Price – Current DetailProductPeerGroup.PriceAmt times current DetailProductPeerGroup.FactorUnits Purchased – Sum of ARFE2.PurchasedUnitsAverage Claim Amount – Sum of ARFE2.ClaimAmt / Sum of ARFE2.PurchasedUnitsClaim / Target Price – (Average Claim Amount / Target Price) – 1.0Claim / NTE Price – (Average Claim Amount / NTE Price) – 1.0
Sort Order Peer Group, Category, Subcategory, Units (rounded values), UPC sequence.
Total /Count Columns
None
State Totals NonePrimary Group (page break)
Peer Group
Additional Group By
Category, Subcategory, Units (the rounded values)
Page 112 of 113 Vendor Management Reports June 6, 2017

MPSC WIC MIS System VM Vendor Management Reports
June 6, 2017 Vendor Management Reports Page 113 of 113


