14 Bioreactors RENÉ H. KLEIJNTJENS Gravenhage, The Netherlands KAREL CH. A. M. LUYBEN Delft, The Netherlands 1 Introduction 330 1.1 Contaminated Solid Waste Streams (Soils, Sediments, and Sludges) 330 1.2 Characteristics of the Contaminated Solids 331 2 Bioreactors 332 2.1 Reactor Configurations 332 2.2 Diffusion of the Contaminants out of the Solid Particles 333 3 Slurry Bioreactors 334 3.1 Slurry Processing 334 3.2 Batch Operation 335 3.3 Full Scale Batch Processes 337 3.3.1 The DMT–BIODYN Process 337 3.3.2 The FORTEC Process 338 3.3.3 The OHM Process 338 3.3.4 The Huber Process 338 3.4 Sequential Batch Operation (Semi-Continuous) 338 3.5 Continuous Operation 338 4 Solid State Bioreactors 343 4.1 Process Configuration 343 4.2 Batch Operation: Composting 343 4.3 (Semi-)Continuous Operation: the Rotating Drum Reactor 343 5 Comparison of Bioreactors 344 6 Conclusion and Outlook 344 6.1 Conclusions 344 6.2 Outlook 345 7 References 346
Transcript
14 Bioreactors
RENÉ H. KLEIJNTJENSGravenhage, The Netherlands
KAREL CH. A. M. LUYBENDelft, The Netherlands
1 Introduction 3301.1 Contaminated Solid Waste Streams (Soils, Sediments, and Sludges) 3301.2 Characteristics of the Contaminated Solids 331
2 Bioreactors 3322.1 Reactor Configurations 3322.2 Diffusion of the Contaminants out of the Solid Particles 333
Waste recycling plays a key role in the de-velopment of a sustainable economy (SUZUKI,1992). The classical approach, remediationwithout the production of recycled materials,does not contribute to durable material flows.Moreover, the production of reusable materi-als is a necessity to make waste treatment anattractive economic solution. Recycling, how-ever, can not be done regardless of the effortand costs needed. The overall environmentalbenefits should be positive and fit within thelocal economic and legal framework.
A practical way to qualify these benefits isfound in three issues:
(1) the quality of the recycle products,(2) the amount of energy required per ton,(3) the costs per ton.
Solid waste streams (contaminated soils, sedi-ments, and sludges) can be recycled.The solidshave to be transformed into usable productswhile the contaminants are removed or de-stroyed. In case the contaminants are organic(such as mineral oil, PAH, solvents, BTEX,PCB) the use of bioreactors can result in envi-ronmental benefits (RISER-ROBERTS, 1998). Inbioreactors populations of soil organisms de-grade the contaminants to yield carbon diox-ide, water, and harmless byproducts (SCHLE-GEL, 1986).
A prerequisite for the implementation ofnew technologies such as bioprocessing is thedefinition of recycling and treatment targets.In The Netherlands legal targets for recycledmaterials were set in the Dutch building mate-rial decree (Building Material Act, 1995). De-pending on the content and the leaching of
1 Introduction 331
components, two different ways for using recy-cled materials in plants are defined:
(1) category 1 products, needing no furtherisolation,
(2) category 2 products, needing furtherisolation and monitoring.
In the Dutch practice treatment processes areaimed at the production of category 1 recycleproducts. Although each country still has itsown standards, and standardization is far away(NORTHCLIFF et al., 1998), it is clear that prac-tical recycle standards accelerate the develop-ment needed to create sustainable technologies.
1.2 Characteristics of the Contaminated Solids
In soils the solid matrix is frequently domi-nated by sand, while the water content may be~25%; levels of debris can be found depend-ing on the history of the site, but rarely exceed10%. River, harbor and canal sediments con-tain a majority of water (frequently `60 to70%) while the fine fraction (~63 µm) domi-nates the solids. The latter holds if dredging
takes place in the upper sediment layers. In-dustrial and municipal sludges are mostly veryhumid (`95% water) and have a large con-tent of organics (`60%) (INES, 1997). Indus-trial sludges mostly originate directly fromcorrosion and wear from installations or watertreatment units on the site.
Disregarding the heterogeneous nature ofthe waste, the contaminant behavior is largelydetermined by the fines (WERTHER and WILI-CHOWSKI, 1990),This is due to the fact that sub-micron particles such as humic–clay structuresand clay agglomerates have an extremely highadsorption capacity (BRADY, 1984). The solidwaste, therefore, basically contains a contam-inated fine fraction, a less contaminated sand–gravel fraction, cleaner debris, and a contami-nated water phase.
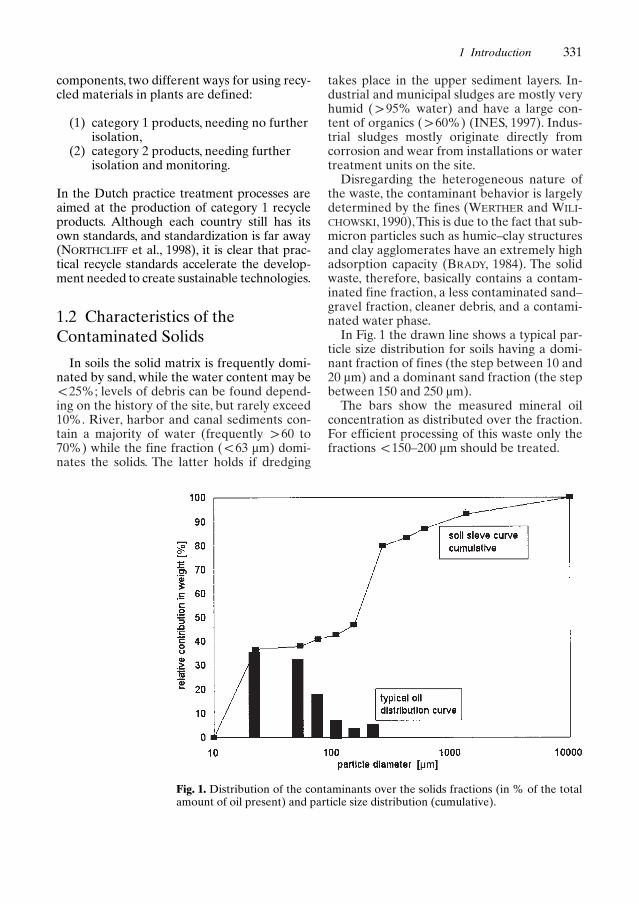
In Fig. 1 the drawn line shows a typical par-ticle size distribution for soils having a domi-nant fraction of fines (the step between 10 and20 µm) and a dominant sand fraction (the stepbetween 150 and 250 µm).
The bars show the measured mineral oilconcentration as distributed over the fraction.For efficient processing of this waste only thefractions ~150–200 µm should be treated.
Fig. 1. Distribution of the contaminants over the solids fractions (in % of the totalamount of oil present) and particle size distribution (cumulative).
In general it can be stated that in order todevelop an appropriate recycling technologythe particle features of the solids have tomatch the type of process operation. For bio-processing this implies the integration of theseparation technology and bioreactors in se-quence of operation in which the clean frac-tions are removed from the feed before enter-ing the reactor (KLEIJNTJENS et al., 1999).
2 Bioreactors
2.1 Reactor Configurations
The aerated bioreactor for solids processingis a 3-phase (solid–liquid–gas) multiphase sys-tem. The solids phase contains the adsorbedcontaminants, the liquid phase (process water)provides the medium for microbial growth,aeration complicates the system. Nutrients andadapted bio-mass may be added to enhancebreakdown. Furthermore, process conditions(temperature, pH, O2 level, etc.) can be moni-tored and to some extent controlled.
Regarding the bioreactor configurationthere are two major topics:
(1) physical state of the multiphase system:(I) bioreactors with a restricted solids
hold-up: slurry reactors (typicalsolids hold up ~40 wt%),
(I) bioreactor with restricted humid-ity: solid state fermentation (solidscontent `50 wt%);
(2) operation mode:(I) batch operation; no fresh material
is introduced to the bioreactor dur-ing processing, the composition ofthe content changes continuously;
(I) continuous operation (plug flow);fresh material is introduced andtreated material removed duringprocessing, the composition in thereactor remains unchanged withtime (LEVENSPIEL, 1972); in prac-tice semi-continuous operation isoften used (interval-wise feedingand removal giving small fluctua-tions in the reactor).
Three basic reactor configurations exist:
(1) slurry bioreactors(2) solid state fixed bed bioreactors(3) rotating drum dry solid bioreactors.
Characteristic for all types of slurry bioreac-tors (Fig. 2) is the need of energy input to sus-tain a 3-phase system in which the solid parti-cles are suspended; the gravity forces acting onthe solids have to be compensated by the dragforces executed by the liquid motion (HINZE,1959). In a properly designed slurry system theenergy input is used to establish three phe-nomena:
(1) suspension,(2) aeration,(3) mixing.
332 14 Bioreactors
Fig. 2. Common configura-tions of slurry bioreactors.
2 Bioreactors 333
A slurry bioreactor can only work properly ifthese three measures are balanced. For eachreactor configuration, the appropriate processconditions depend on parameters such as thereactor scale, particle size distribution, slurrydensity, slurry viscosity, oxygen demand of thebiomass, and the solids hold-up (KLEIJNTJENS,1991).
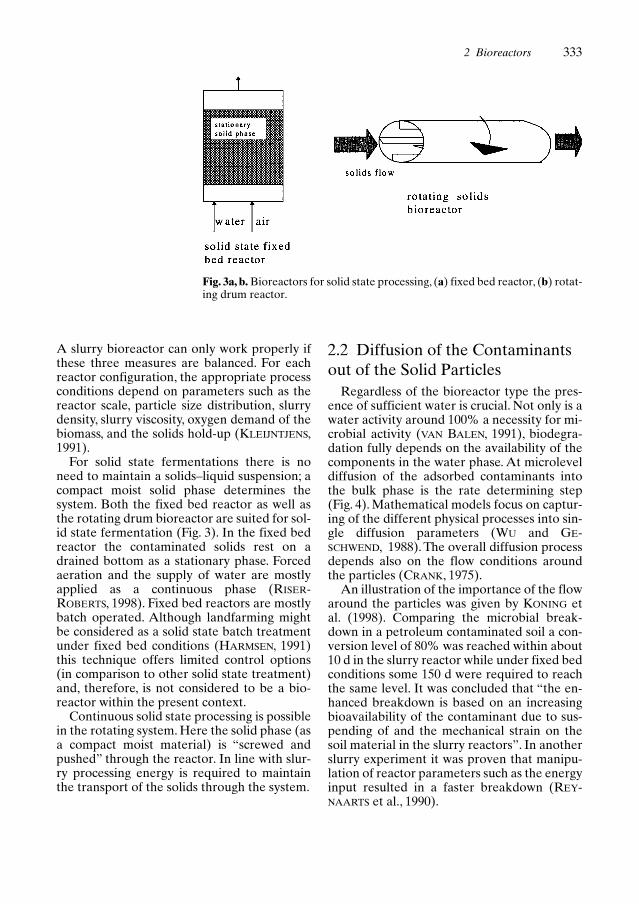
For solid state fermentations there is noneed to maintain a solids–liquid suspension; acompact moist solid phase determines thesystem. Both the fixed bed reactor as well asthe rotating drum bioreactor are suited for sol-id state fermentation (Fig. 3). In the fixed bedreactor the contaminated solids rest on adrained bottom as a stationary phase. Forcedaeration and the supply of water are mostlyapplied as a continuous phase (RISER-ROBERTS, 1998). Fixed bed reactors are mostlybatch operated. Although landfarming mightbe considered as a solid state batch treatmentunder fixed bed conditions (HARMSEN, 1991)this technique offers limited control options(in comparison to other solid state treatment)and, therefore, is not considered to be a bio-reactor within the present context.
Continuous solid state processing is possiblein the rotating system. Here the solid phase (asa compact moist material) is “screwed andpushed” through the reactor. In line with slur-ry processing energy is required to maintainthe transport of the solids through the system.
2.2 Diffusion of the Contaminantsout of the Solid Particles
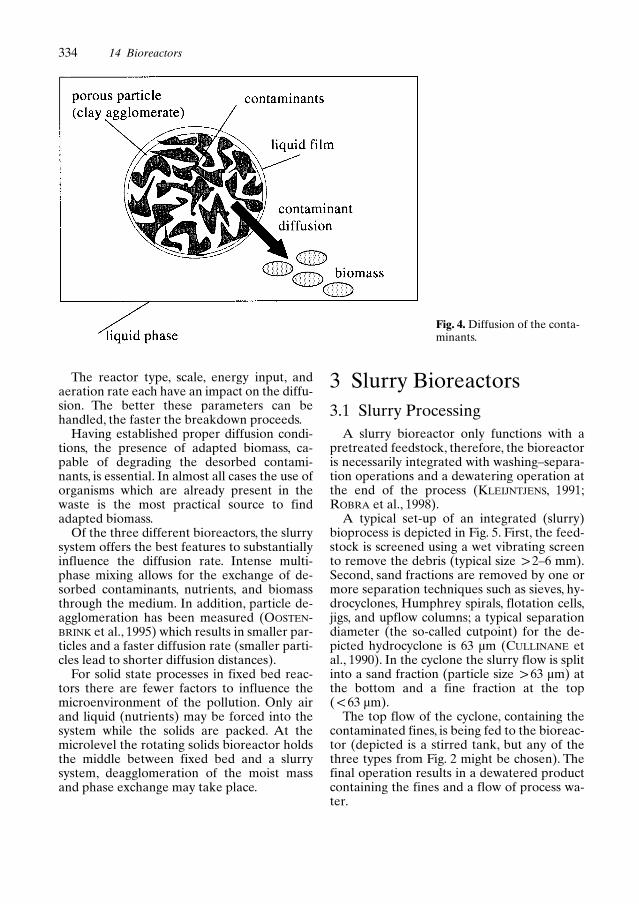
Regardless of the bioreactor type the pres-ence of sufficient water is crucial. Not only is awater activity around 100% a necessity for mi-crobial activity (VAN BALEN, 1991), biodegra-dation fully depends on the availability of thecomponents in the water phase. At microleveldiffusion of the adsorbed contaminants intothe bulk phase is the rate determining step(Fig. 4). Mathematical models focus on captur-ing of the different physical processes into sin-gle diffusion parameters (WU and GE-SCHWEND, 1988). The overall diffusion processdepends also on the flow conditions aroundthe particles (CRANK, 1975).
An illustration of the importance of the flowaround the particles was given by KONING etal. (1998). Comparing the microbial break-down in a petroleum contaminated soil a con-version level of 80% was reached within about10 d in the slurry reactor while under fixed bedconditions some 150 d were required to reachthe same level. It was concluded that “the en-hanced breakdown is based on an increasingbioavailability of the contaminant due to sus-pending of and the mechanical strain on thesoil material in the slurry reactors”. In anotherslurry experiment it was proven that manipu-lation of reactor parameters such as the energyinput resulted in a faster breakdown (REY-NAARTS et al., 1990).
Fig. 3a, b. Bioreactors for solid state processing, (a) fixed bed reactor, (b) rotat-ing drum reactor.
The reactor type, scale, energy input, andaeration rate each have an impact on the diffu-sion. The better these parameters can behandled, the faster the breakdown proceeds.
Having established proper diffusion condi-tions, the presence of adapted biomass, ca-pable of degrading the desorbed contami-nants, is essential. In almost all cases the use oforganisms which are already present in thewaste is the most practical source to findadapted biomass.
Of the three different bioreactors, the slurrysystem offers the best features to substantiallyinfluence the diffusion rate. Intense multi-phase mixing allows for the exchange of de-sorbed contaminants, nutrients, and biomassthrough the medium. In addition, particle de-agglomeration has been measured (OOSTEN-BRINK et al., 1995) which results in smaller par-ticles and a faster diffusion rate (smaller parti-cles lead to shorter diffusion distances).
For solid state processes in fixed bed reac-tors there are fewer factors to influence themicroenvironment of the pollution. Only airand liquid (nutrients) may be forced into thesystem while the solids are packed. At themicrolevel the rotating solids bioreactor holdsthe middle between fixed bed and a slurrysystem, deagglomeration of the moist massand phase exchange may take place.
3 Slurry Bioreactors3.1 Slurry Processing
A slurry bioreactor only functions with apretreated feedstock, therefore, the bioreactoris necessarily integrated with washing–separa-tion operations and a dewatering operation atthe end of the process (KLEIJNTJENS, 1991;ROBRA et al., 1998).
A typical set-up of an integrated (slurry)bioprocess is depicted in Fig. 5. First, the feed-stock is screened using a wet vibrating screento remove the debris (typical size `2–6 mm).Second, sand fractions are removed by one ormore separation techniques such as sieves, hy-drocyclones, Humphrey spirals, flotation cells,jigs, and upflow columns; a typical separationdiameter (the so-called cutpoint) for the de-picted hydrocyclone is 63 µm (CULLINANE etal., 1990). In the cyclone the slurry flow is splitinto a sand fraction (particle size `63 µm) atthe bottom and a fine fraction at the top (~63 µm).
The top flow of the cyclone, containing thecontaminated fines, is being fed to the bioreac-tor (depicted is a stirred tank, but any of thethree types from Fig. 2 might be chosen). Thefinal operation results in a dewatered productcontaining the fines and a flow of process wa-ter.
334 14 Bioreactors
Fig. 4. Diffusion of the conta-minants.
3 Slurry Bioreactors 335
3.2 Batch Operation
A slurry bioreactor is often designed as astandard continuously stirred tank reactor(CSTR) having a mechanical stirrer, baffles,and a sparger at the bottom (Fig. 5). In thesystem a 3-phase suspension of contaminatedsolids, water and air is maintained. Batch deg-radation experiments in aerated stirred slurrybioreactors have been carried out frequently.
Fig. 6a shows the experimental result of abatch experiment at a 4 L scale. Using a con-ventional stirred bioreactor with baffles (stir-rer speed 600 rpm, aeration rate 1.5–3 LminP1, temperature kept at 30°C), adapted biomass and nutrients were added (ammoni-um, phosphate, and potassium) while the pHwas kept at 7–8. The soil was an oil contamin-ated sandy soil starting at an oil concentrationof 3,500 mg kgP1. Within 30 d the concentra-tion dropped to about 500 mg kgP1, while dur-ing the following period (up to day 56) no sig-nificant degradation was measured.
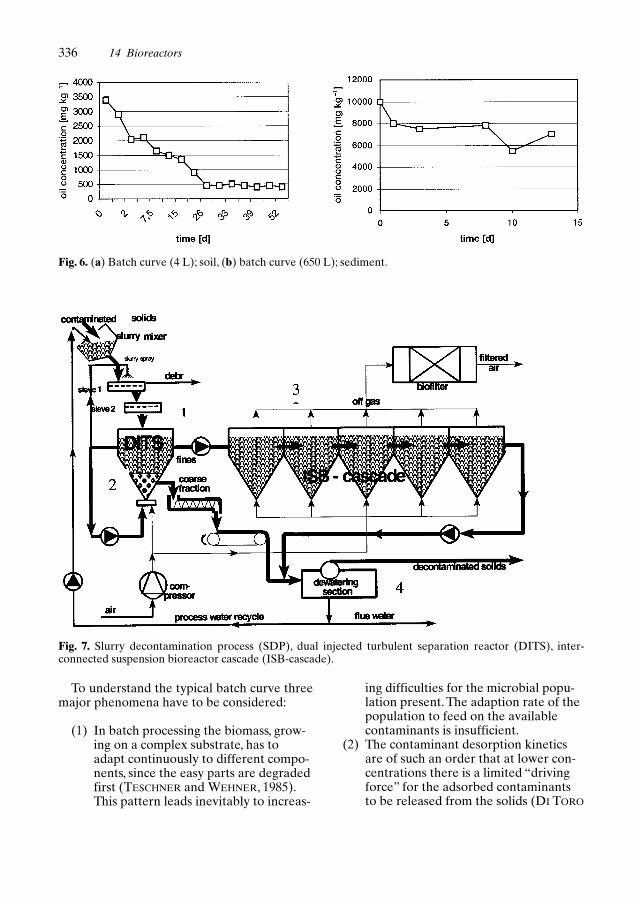
Fig. 6b shows the batch degradation curvefor a heavily polluted harbor sediment asmeasured at the pilot scale (650 L) in an air ag-itated slurry reactor (the DITS reactor). TheDITS-reactor originally is the first reactor partin the Slurry Decontamination Process (seeFig. 7). For this experiment the DITS reactorwas deconnected and used as an individualbatch reactor. For mineral oil the batch pro-cess showed a decrease from 10,000 mg kgP1
down to levels of 6,000–7,000 mg kgP1.Other batch processes have been carried out
(see also Sect. 3.3). Resuming these batch re-sults a “typical” batch curve might be con-structed (Fig. 8): a significant breakdown in thefirst few days is followed by slow down of theprocess in the second stage. In this stage only asmall percentage of the contaminant is degrad-ed over a relatively long period.
The exact shape of the curve and the con-version level at which breakdown stops varywith the composition and age of the solids andtype of contaminant.
Fig. 5. Typical set-up of a (slurry) bioprocess using a batch operated aerated stirred tank reactor (typicalsolids hold-up is 20 wt%).
To understand the typical batch curve threemajor phenomena have to be considered:
(1) In batch processing the biomass, grow-ing on a complex substrate, has toadapt continuously to different compo-nents, since the easy parts are degradedfirst (TESCHNER and WEHNER, 1985).This pattern leads inevitably to increas-
ing difficulties for the microbial popu-lation present. The adaption rate of thepopulation to feed on the availablecontaminants is insufficient.
(2) The contaminant desorption kineticsare of such an order that at lower con-centrations there is a limited “drivingforce” for the adsorbed contaminantsto be released from the solids (DI TORO
and HORZEMPA, 1982). Since microbialbreakdown only proceeds, if the con-taminant is dissolved in the waterphase, this type of kinetics does not al-low for the easy breakdown at lowerconcentrations.
(3) During batch processing inhibiting sideproducts of the microbial breakdownmay increasingly be released into themedium; in addition, the physical condi-tions of the solids may change (e.g., at-trition) which may lead to unfavorablemicrobial circumstances. An examplemight be the drop in pH due to humifi-cation processes which can join thecontaminant breakdown.
3.3 Full Scale Batch Processes
3.3.1 The DMT–BIODYN Process
A full scale batch process has been realizedwith the DMT-BIODYN process (SINDER etal., 1999). The process consists of a fluidizedbed slurry reactor in which the fined grainedcontaminated soils are treated. For aerationthe slurry circulation loop is being treated inan external bubble column (Fig. 9).The reactorconfiguration allows a high solids loading upto 50 wt%. The DMT-BIODYN process hasbeen designed by the Deutsche Montan Tech-nologie GmbH to treat PAH polluted sites atformer coal facilities in the Federal Republicof Germany (NITSCHKE, 1994).
At pilot scale (a 1.2 m3 reactor) varioustechnological parameters were investigatedand the hydraulic feed system at the bottomoptimized. Experiments show that the PAH inthe tests rapidly degraded without a noticeablelag phase; the measured oxygen consumptionrate correlated to the PAH degradation rate.For this specific soil (starting concentrationsabout 250 mg kgP1) after 6 d the target levelswere reached. Comparison of the pilot resultswith results at laboratory scale and a respirom-eter showed that the degradation for this testsoil in each of these systems was similar. Foranother PAH contamination (starting valuesat 1,100 mg kgP1) the target levels could notbe reached (treatment time was 30 d). It wasconcluded that for this specific soil “adsorp-tion of the PAH to the organic matrix results ina reduced bioavailability”. For this latter con-taminated soil experiments combining bio-
Fig. 8. Generalized batch curve.
Fig. 9. DMT–BIODYN process configuration.
processing and soil washing resulted in finallevels below target values.
In Sweden a full scale installation (55 m3 ofthe DMT-BIODYN process has been estab-lished to treat a contaminated gas plant area.The first trials at this scale have been success-fully completed (SINDER et al., 1999).
3.3.2 The FORTEC Process
In The Netherlands the FORTEC process(fast organic removal technology) treatingcontaminated sediments combines severalseparation technologies with bioreactor treat-ment (TEN BRUMMELEN et al., 1997). First stepin the process is the use of hydrocyclones to re-move the sand fractions. The efficiency of theseparation step is optimized by a multi-stagehydrocyclone configuration, separation wasachieved down to a particle size of 20 µm. Af-ter the sand separation the contaminated finefraction is fed to the bioreactor section. Basedon initial experiments with aerated stirredtank bioreactors, a full scale bioreactor sectionwith a total volume of 300 m3 (several reac-tors) was constructed (RIZA-Report 97.067).
A heavily contaminated harbor sediment(port of Amsterdam) was treated with theFORTEC process.After sand removal the finefraction (~20 µm) was batchwise treated inthe full scale bioreactors. At this scale 85% ofthe PAH and 78% of the mineral oil were re-moved after 15 d batch processing (TEN BRUM-MELEN et al., 1997).
3.3.3 The OMH Process
In the USA a large scale slurry bioreactor(750 m3) was used to treat creosote contami-nated lagoon solids stabilized with fly ash (to-tal PAH was 11 g kgP1).An extensive pretreat-ment to classify the material was combinedwith areated and stirred (900 rpm) bioreactorwith a 20% solids load. Conversion for thePAH was measured at 82–99% remediationfor the 3- and 4-ring PAH and 34–78% for thehigher PAH (JERGER et al., 1993).
3.3.4 The Huber Process
At a scale of 30 m3 a batch process treatingthe fine fraction (~200 µm) of a diesel con-taminated soil has been carried out in an airlift bioreactor. The oil concentration droppedfrom 12,000 to 2,000 mg kgP1 after 2 weeksresidence time (BLANK-HUBER et al., 1992).Stripping effects of the diesel contaminantwere determined at about 20% by laboratoryexperiments.
3.4 Sequential Batch Operation(Semi-Continuous)
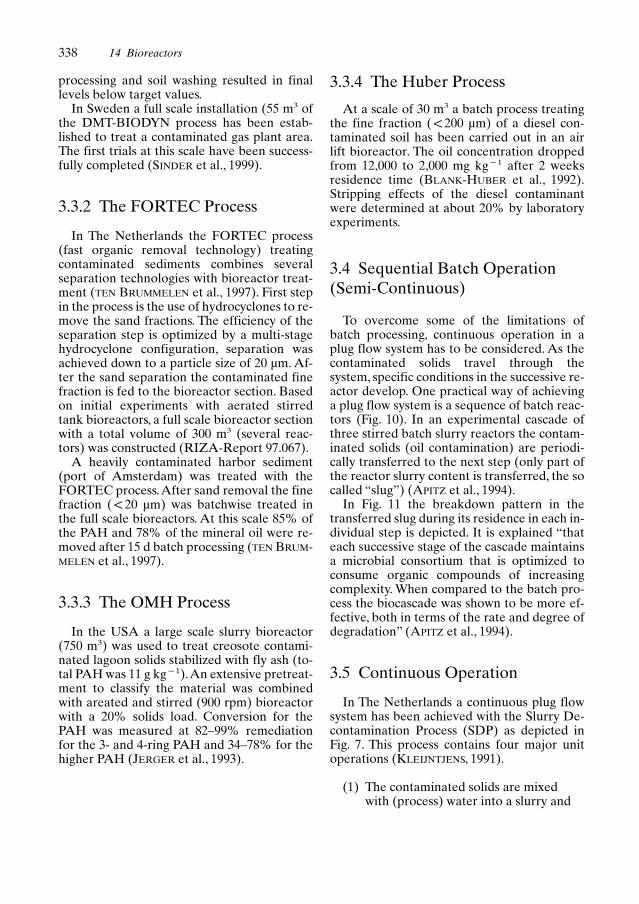
To overcome some of the limitations ofbatch processing, continuous operation in aplug flow system has to be considered. As thecontaminated solids travel through thesystem, specific conditions in the successive re-actor develop. One practical way of achievinga plug flow system is a sequence of batch reac-tors (Fig. 10). In an experimental cascade ofthree stirred batch slurry reactors the contam-inated solids (oil contamination) are periodi-cally transferred to the next step (only part ofthe reactor slurry content is transferred, the socalled “slug”) (APITZ et al., 1994).
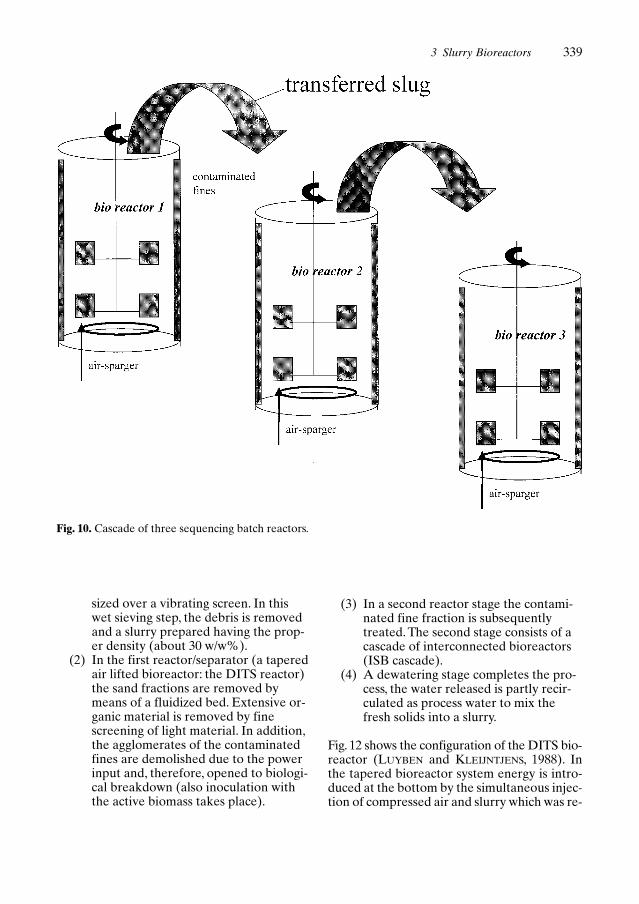
In Fig. 11 the breakdown pattern in thetransferred slug during its residence in each in-dividual step is depicted. It is explained “thateach successive stage of the cascade maintainsa microbial consortium that is optimized toconsume organic compounds of increasingcomplexity. When compared to the batch pro-cess the biocascade was shown to be more ef-fective, both in terms of the rate and degree ofdegradation” (APITZ et al., 1994).
3.5 Continuous Operation
In The Netherlands a continuous plug flowsystem has been achieved with the Slurry De-contamination Process (SDP) as depicted inFig. 7. This process contains four major unitoperations (KLEIJNTJENS, 1991).
(1) The contaminated solids are mixedwith (process) water into a slurry and
338 14 Bioreactors
3 Slurry Bioreactors 339
sized over a vibrating screen. In thiswet sieving step, the debris is removedand a slurry prepared having the prop-er density (about 30 w/w%).
(2) In the first reactor/separator (a taperedair lifted bioreactor: the DITS reactor)the sand fractions are removed bymeans of a fluidized bed. Extensive or-ganic material is removed by finescreening of light material. In addition,the agglomerates of the contaminatedfines are demolished due to the powerinput and, therefore, opened to biologi-cal breakdown (also inoculation withthe active biomass takes place).
(3) In a second reactor stage the contami-nated fine fraction is subsequentlytreated. The second stage consists of acascade of interconnected bioreactors(ISB cascade).
(4) A dewatering stage completes the pro-cess, the water released is partly recir-culated as process water to mix thefresh solids into a slurry.
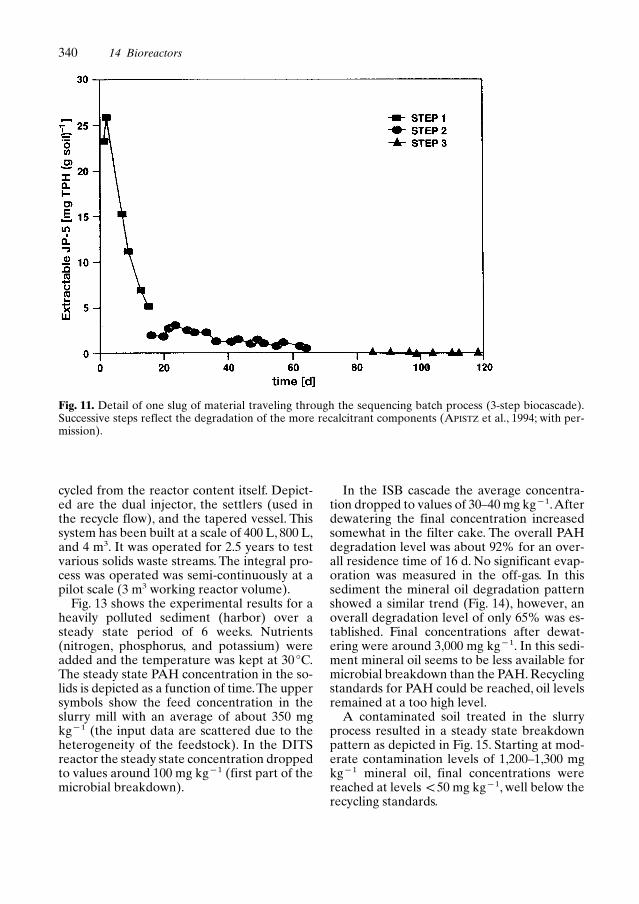
Fig. 12 shows the configuration of the DITS bio-reactor (LUYBEN and KLEIJNTJENS, 1988). Inthe tapered bioreactor system energy is intro-duced at the bottom by the simultaneous injec-tion of compressed air and slurry which was re-
Fig. 10. Cascade of three sequencing batch reactors.
cycled from the reactor content itself. Depict-ed are the dual injector, the settlers (used inthe recycle flow), and the tapered vessel. Thissystem has been built at a scale of 400 L, 800 L,and 4 m3. It was operated for 2.5 years to testvarious solids waste streams. The integral pro-cess was operated was semi-continuously at apilot scale (3 m3 working reactor volume).
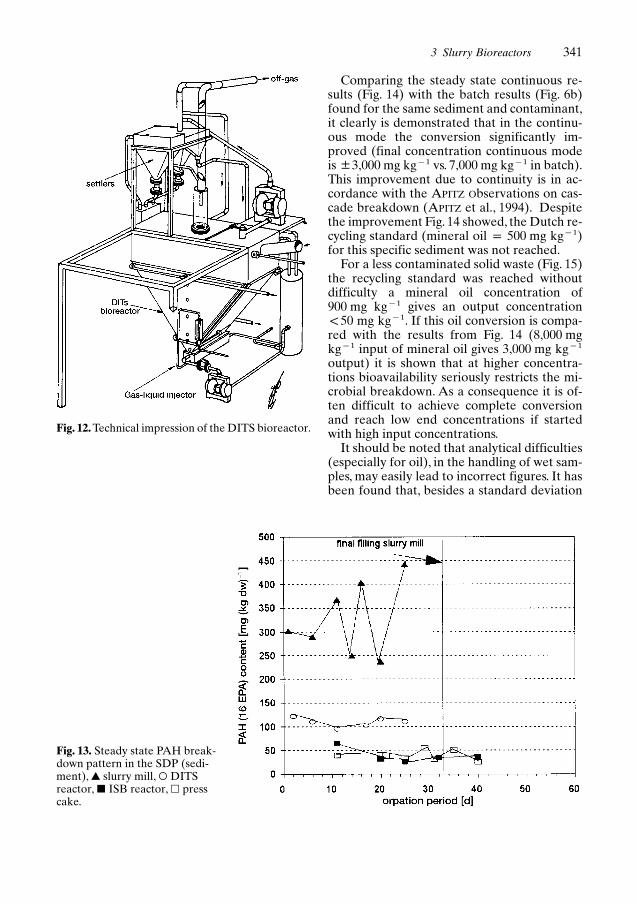
Fig. 13 shows the experimental results for aheavily polluted sediment (harbor) over asteady state period of 6 weeks. Nutrients(nitrogen, phosphorus, and potassium) wereadded and the temperature was kept at 30°C.The steady state PAH concentration in the so-lids is depicted as a function of time.The uppersymbols show the feed concentration in theslurry mill with an average of about 350 mgkgP1 (the input data are scattered due to theheterogeneity of the feedstock). In the DITSreactor the steady state concentration droppedto values around 100 mg kgP1 (first part of themicrobial breakdown).
In the ISB cascade the average concentra-tion dropped to values of 30–40 mg kgP1.Afterdewatering the final concentration increasedsomewhat in the filter cake. The overall PAHdegradation level was about 92% for an over-all residence time of 16 d. No significant evap-oration was measured in the off-gas. In thissediment the mineral oil degradation patternshowed a similar trend (Fig. 14), however, anoverall degradation level of only 65% was es-tablished. Final concentrations after dewat-ering were around 3,000 mg kgP1. In this sedi-ment mineral oil seems to be less available formicrobial breakdown than the PAH. Recyclingstandards for PAH could be reached, oil levelsremained at a too high level.
A contaminated soil treated in the slurryprocess resulted in a steady state breakdownpattern as depicted in Fig. 15. Starting at mod-erate contamination levels of 1,200–1,300 mgkgP1 mineral oil, final concentrations werereached at levels ~50 mg kgP1, well below therecycling standards.
340 14 Bioreactors
Fig. 11. Detail of one slug of material traveling through the sequencing batch process (3-step biocascade).Successive steps reflect the degradation of the more recalcitrant components (APISTZ et al., 1994; with per-mission).
3 Slurry Bioreactors 341
Comparing the steady state continuous re-sults (Fig. 14) with the batch results (Fig. 6b)found for the same sediment and contaminant,it clearly is demonstrated that in the continu-ous mode the conversion significantly im-proved (final concentration continuous modeis B3,000 mg kgP1 vs. 7,000 mg kgP1 in batch).This improvement due to continuity is in ac-cordance with the APITZ Observations on cas-cade breakdown (APITZ et al., 1994). Despitethe improvement Fig. 14 showed, the Dutch re-cycling standard (mineral oil p 500 mg kgP1)for this specific sediment was not reached.
For a less contaminated solid waste (Fig. 15)the recycling standard was reached withoutdifficulty a mineral oil concentration of900 mg kgP1 gives an output concentration~50 mg kgP1. If this oil conversion is compa-red with the results from Fig. 14 (8,000 mgkgP1 input of mineral oil gives 3,000 mg kgP1
output) it is shown that at higher concentra-tions bioavailability seriously restricts the mi-crobial breakdown. As a consequence it is of-ten difficult to achieve complete conversionand reach low end concentrations if startedwith high input concentrations.
It should be noted that analytical difficulties(especially for oil), in the handling of wet sam-ples, may easily lead to incorrect figures. It hasbeen found that, besides a standard deviation
Fig. 12. Technical impression of the DITS bioreactor.
Fig. 13. Steady state PAH break-down pattern in the SDP (sedi-ment), G slurry mill, i DITSreactor, L ISB reactor, l presscake.
of 20% within one laboratory, ring investiga-tions between various laboratories showed avariation of more than 75% (WARBOUT andOUBOTER, 1988). Bearing in mind these varia-
tions, analytical results should be regardedcarefully. This holds the more when samples ofprocessed solids are compared to recyclestandards.
342 14 Bioreactors
Fig. 14. Steady state mineraloil breakdown pattern in theSDP (sediment), G slurrymill, i DITS reactor, L ISBreactor, l press cake.
Fig. 15. Steady state mineraloil breakdown pattern in theSDP (soil), G slurry mill,i DITS reactor, L cascade,l press cake.