Page 1
Strategic Marketing
2FE10E | Degree Project
Title
A Cross-cultural Study on Consumers’ Attitudes toward Web Advertising
A Case of Swedish and Japanese Consumers
Examiner
Setayesh Sattari
Tutor
Åsa Devine
Authors
Sachi Komatsu, Reg. Nr. 19910328, [email protected]
Takuma Tsuji, Reg. Nr. 19910314, [email protected]
Opening Date | Closing Date
2013-01-21 - 2013-05-28
Page 2
Marketing Strategy 2FE10E
Group 4 | Tutor Åsa Devine
Sachi Komatsu| Takuma Tsuji
a
Abstract
This research intended to clarify differences in attitudes toward Web advertising between consumers
form culturally different countries. On that account, this research is conducted within the context of
Japan and Sweden, which are countries that can be considered as highly different culturally.
Through online questionnaires, data were collected from 275 respondents, 160 Japanese and
115 Swedish consumers. Their attitudes toward Web advertising were measured and then compared
based on Pollay and Mittal’s (1993) seven-belief factors – product information, hedonic, social role
and image, good for the economy, materialism, falsity, and value corruption – as these factors have
been argued to highly relate to consumers’ attitudes toward Web advertising. Consequently
questionnaire results were analyzed in a relation to the existing cultural studies.
Finally, the study concludes that there was no evidence that prove differences between
Japanese and Swedish consumers neither in their overall attitudes toward Web advertising nor in four
of the belief factors: product information, hedonic, good for the economy, and materialism. However,
distinctive differences were found in social role and image factor and value corruption factor
between them. Hence, the research indicates that Japanese and Swedish consumers’ overall attitudes
toward Web advertising do not greatly differ, but they prone to place their priorities on Web
advertising in somewhat different manners.
Keywords: Web Advertising, Belief, Attitude, Seven Belief Factors, Dimensions of Culture, Sweden,
Japan
Page 3
Marketing Strategy 2FE10E
Group 4 | Tutor Åsa Devine
Sachi Komatsu| Takuma Tsuji
1 What are the differences in the attitudes toward Web advertising of Swedish and Japanese consumers?
Table of Contents
Abstract ..................................................................................................................... a
1 Introduction ....................................................................................................... 4
1.1 Background ........................................................................................................................... 4
1.2 Problem Discussion .............................................................................................................. 5
1.3 Purpose of Research ............................................................................................................. 8
1.4 Research Question ................................................................................................................ 8
1.5 Outline of Thesis ................................................................................................................... 8
2 Literature Review .............................................................................................. 10
2.1 The Linkage between Beliefs and Attitudes ........................................................................ 10
2.2 Model for Measuring Consumers' Beliefs ............................................................................ 11
2.2.1 Seven Belief Fctors Modified for Web Advertising .............................................................. 12
2.3 Dimensions of Culture ........................................................................................................ 18
2.3.1 Hofstede's Dimensions of Culture ...................................................................................... 20
2.4 Culture and Consumers' Attitudes ...................................................................................... 23
2.5 Chapter Summary ............................................................................................................... 25
2.6 Proposed Research Model .................................................................................................. 26
2.7 Hypotheses ......................................................................................................................... 27
3 Methodolgy ....................................................................................................... 29
3.1 Research Approach ........................................................................................................... 29
3.1.1 Inductive vs. Deductive Research ..................................................................................... 29
3.1.2 Qualitative vs. Quantitative ................................................................................................ 29
3.2 Research Design ................................................................................................................ 30
3.3 Data Sources ........................................................................................................................ 31
Page 4
Marketing Strategy 2FE10E
Group 4 | Tutor Åsa Devine
Sachi Komatsu| Takuma Tsuji
2 What are the differences in the attitudes toward Web advertising of Swedish and Japanese consumers?
3.4 Research Strategy ............................................................................................................. 32
3.5 Data Collection Method - Online Questionnaire ................................................................ 33
3.6 Data Collection Instrument Design .................................................................................. 34
3.6.1 Operationalization and Measurement of Variables ............................................................ 34
3.6.2 Questionnaire Design ....................................................................................................... 37
3.6.3 Pretesting .......................................................................................................................... 38
3.7 Sampling ........................................................................................................................... 39
3.7.1 Sampling Frame ................................................................................................................ 40
3.7.2 Sample Selection and Data Collection Procedure ............................................................. 40
3.8 Data Analysis Method ....................................................................................................... 42
3.9 Quality Criteria ................................................................................................................. 46
3.9.1 Validity .............................................................................................................................. 46
3.9.2 Reliability ............................................................................................................................ 47
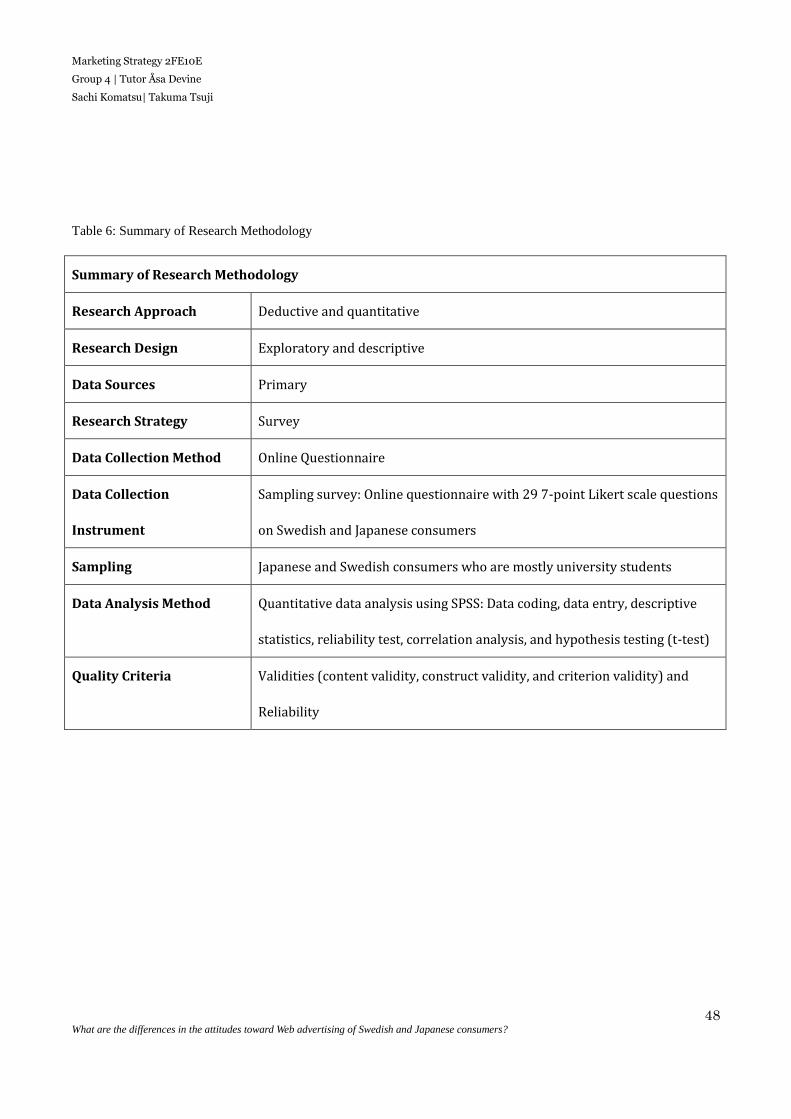
3.10 Chapter Summary ............................................................................................................... 47
4 Survey Results .................................................................................................. 49
4.1 Descriptive Statistics .......................................................................................................... 49
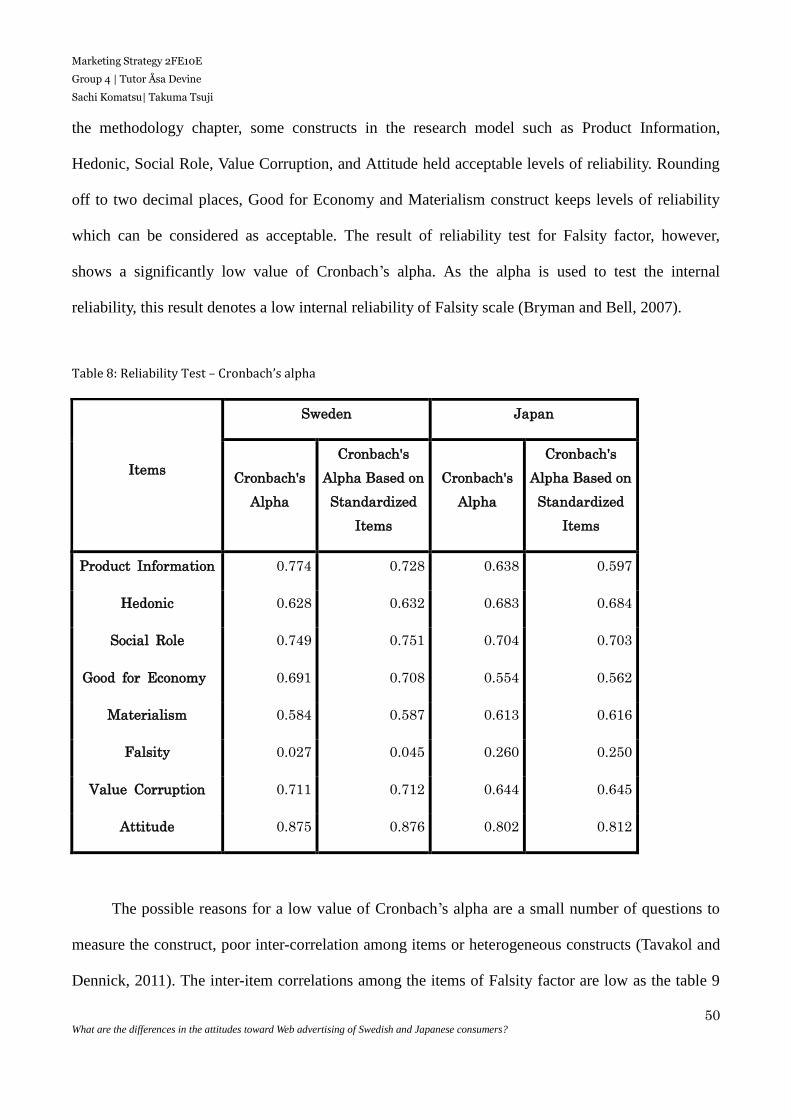
4.2 Reliability Test .................................................................................................................... 49
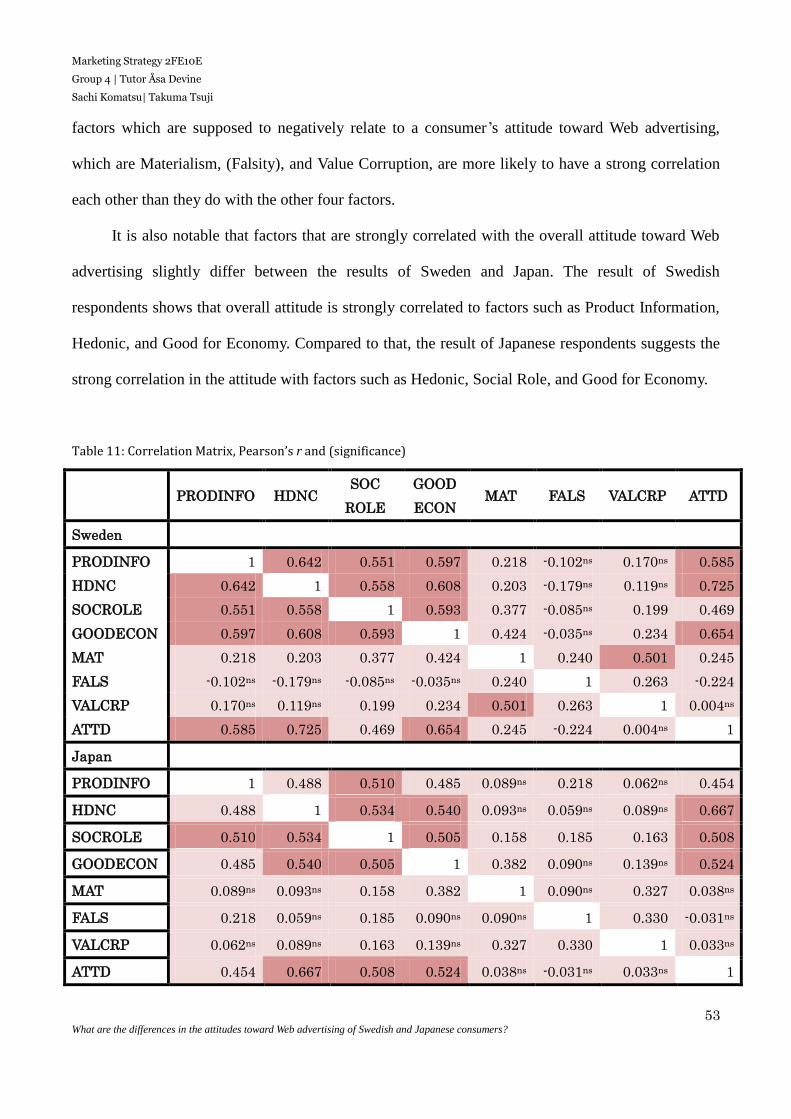
4.3 Correlation Analysis ........................................................................................................... 52
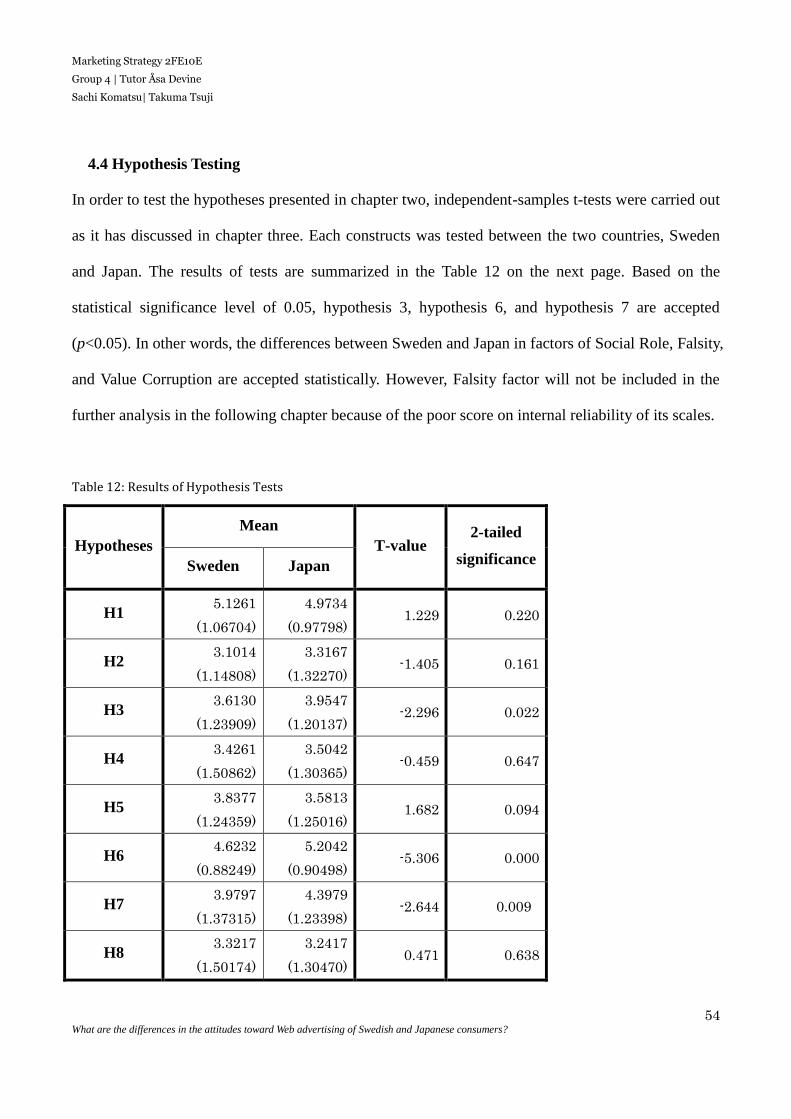
4.4 Hypothesis Testing ............................................................................................................. 54
4.5 Chapter Summary ............................................................................................................... 55
5 Discussion and Interpretation ........................................................................... 56
5.1 Differences between Sweden and Japan in the Seven Belief Factors ................................. 56
5.1.1 Cultural Difference behind Social Role Factor ................................................................... 57
5.1.2 Cultural Difference behind Value Corruption Factor ......................................................... 57
Page 5
Marketing Strategy 2FE10E
Group 4 | Tutor Åsa Devine
Sachi Komatsu| Takuma Tsuji
3 What are the differences in the attitudes toward Web advertising of Swedish and Japanese consumers?
5.2 Factors That Are Similar between Sweden and Japan in the Survey Result ...................... 58
5.3 Cultural Differences andAttitudes toward Web Advertising .............................................. 59
5.4 Chapter Summary ............................................................................................................... 60
6 Conclusion and Theoretical and Managerial Implications .................................. 61
6.1 Conclusion ........................................................................................................................... 61
6.2 Theoretical and Managerial Implications ........................................................................... 62
6.3 Limitations.......................................................................................................................... 63
6.4 Suggestions for Future Research ........................................................................................ 64
Bibliography ............................................................................................................ 65
Appendix ................................................................................................................... I
(A) The Empirical Data for Sweden and Japan ........................................................................... I
(B) Questionnaire (In Swedish) ................................................................................................... I
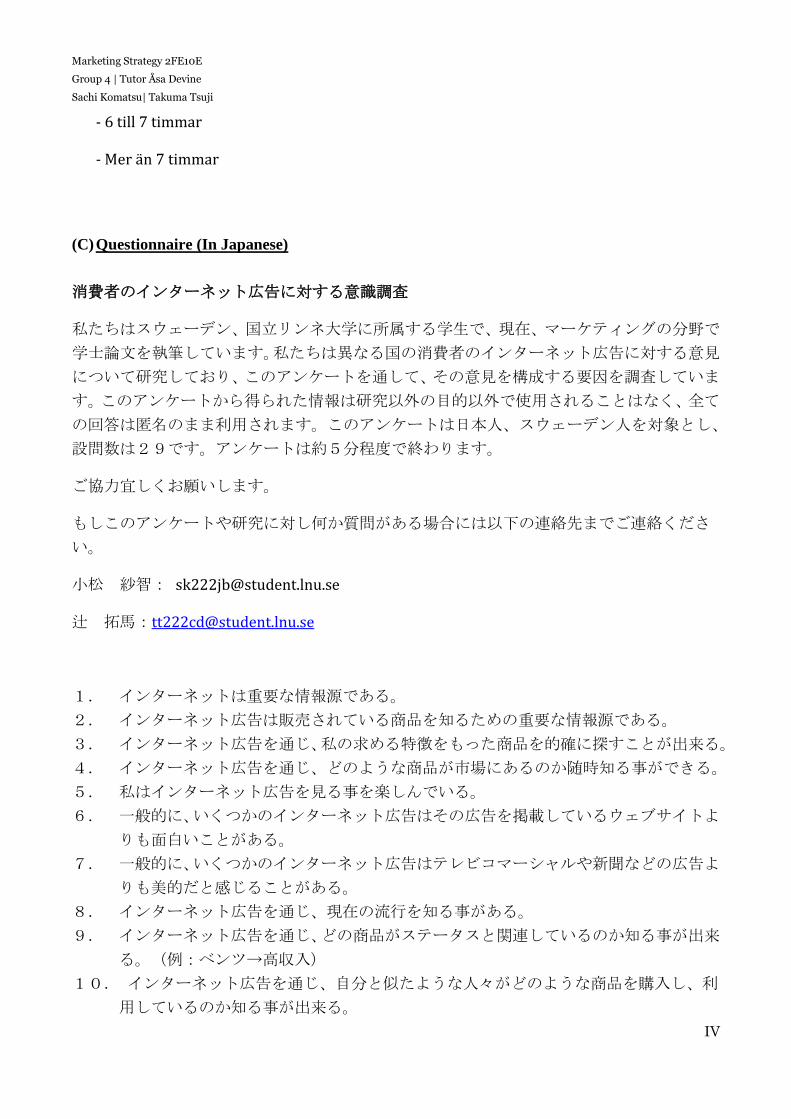
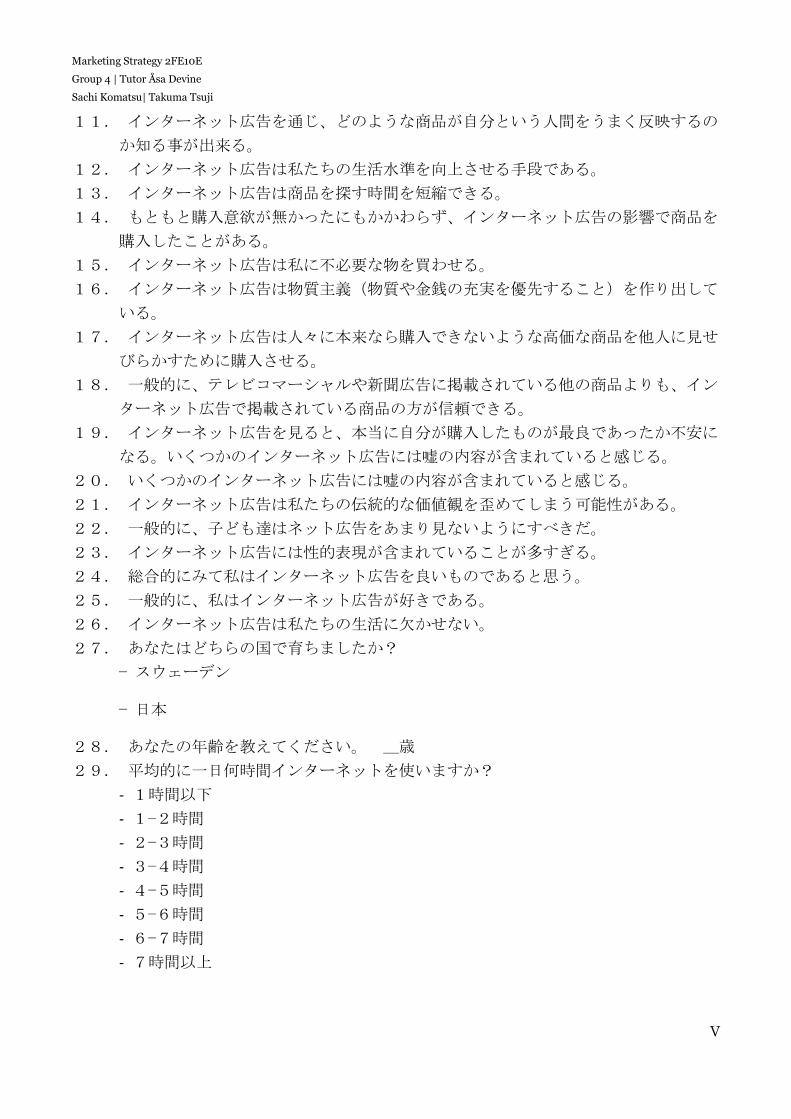
(C) Questionnaire (In Japanese) .............................................................................................. IV
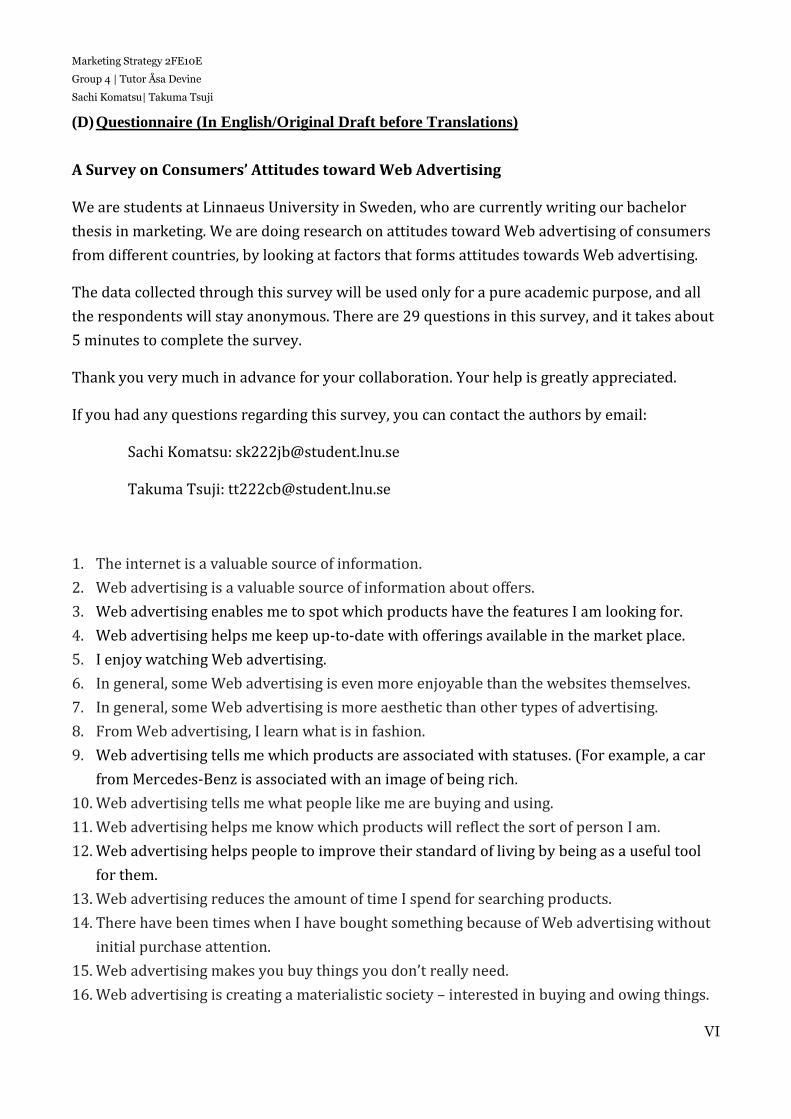
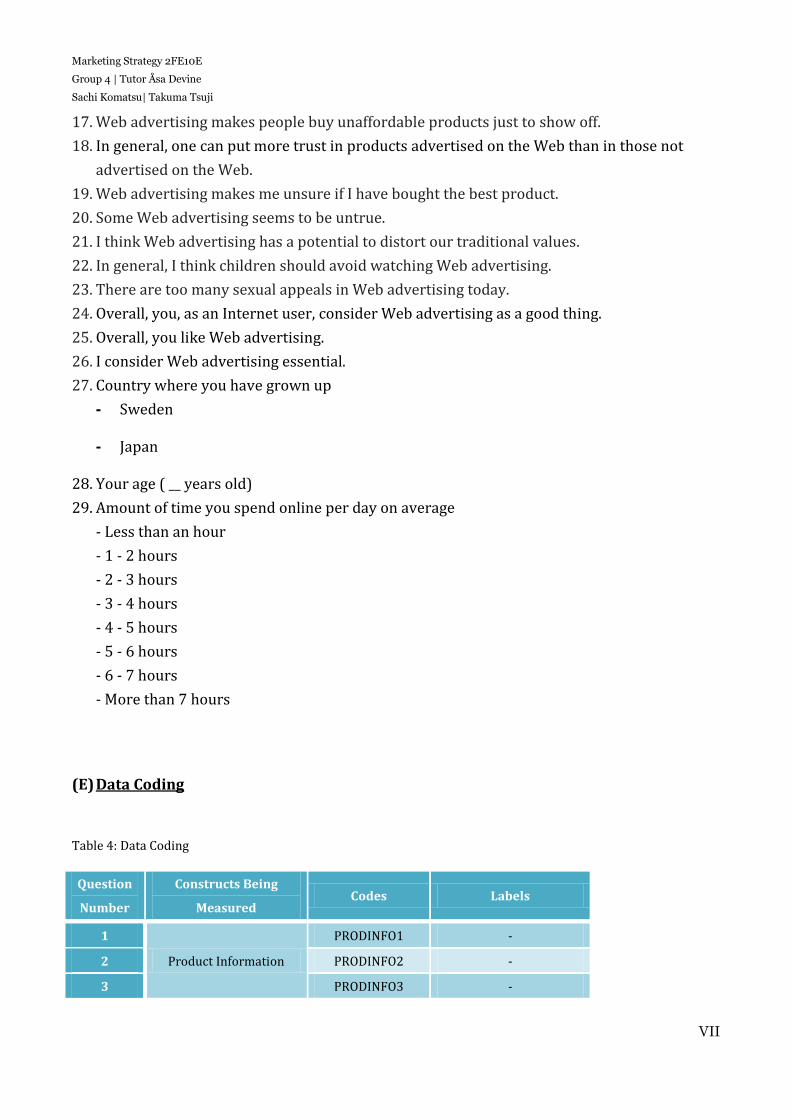
(D) Questionnaire (In English/Original Draft before translations) ......................................... VI
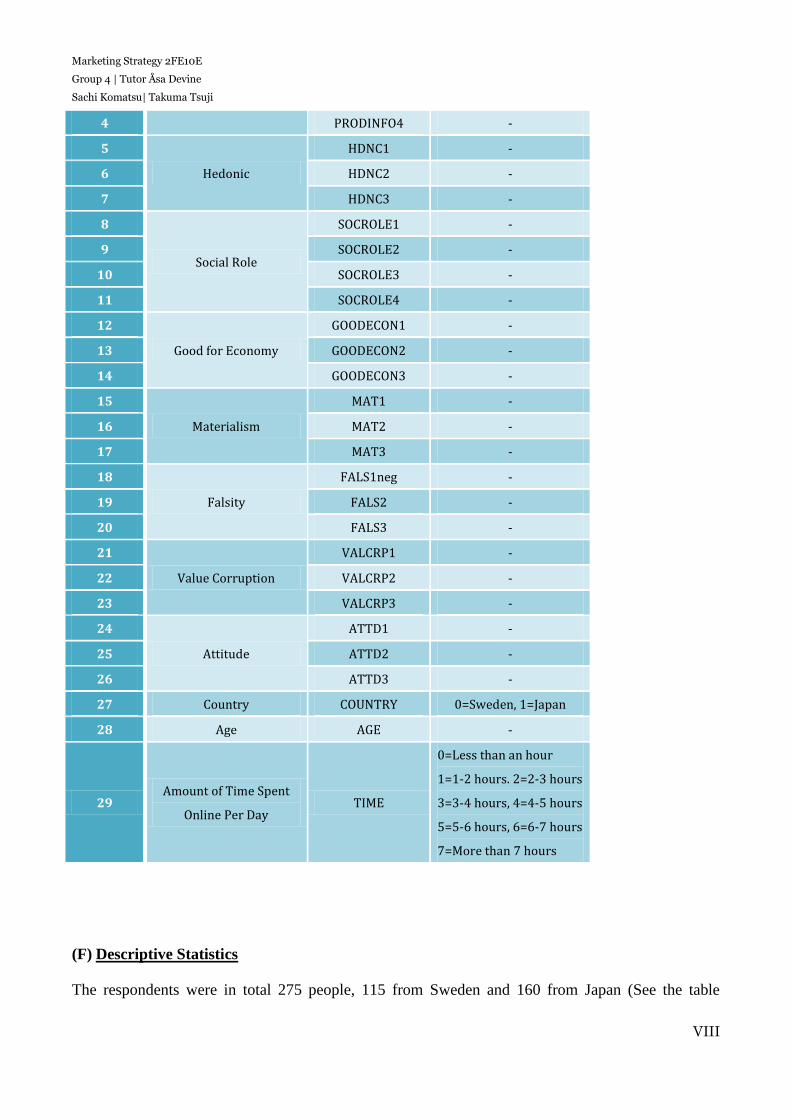
(E) Data Coding ....................................................................................................................... VII
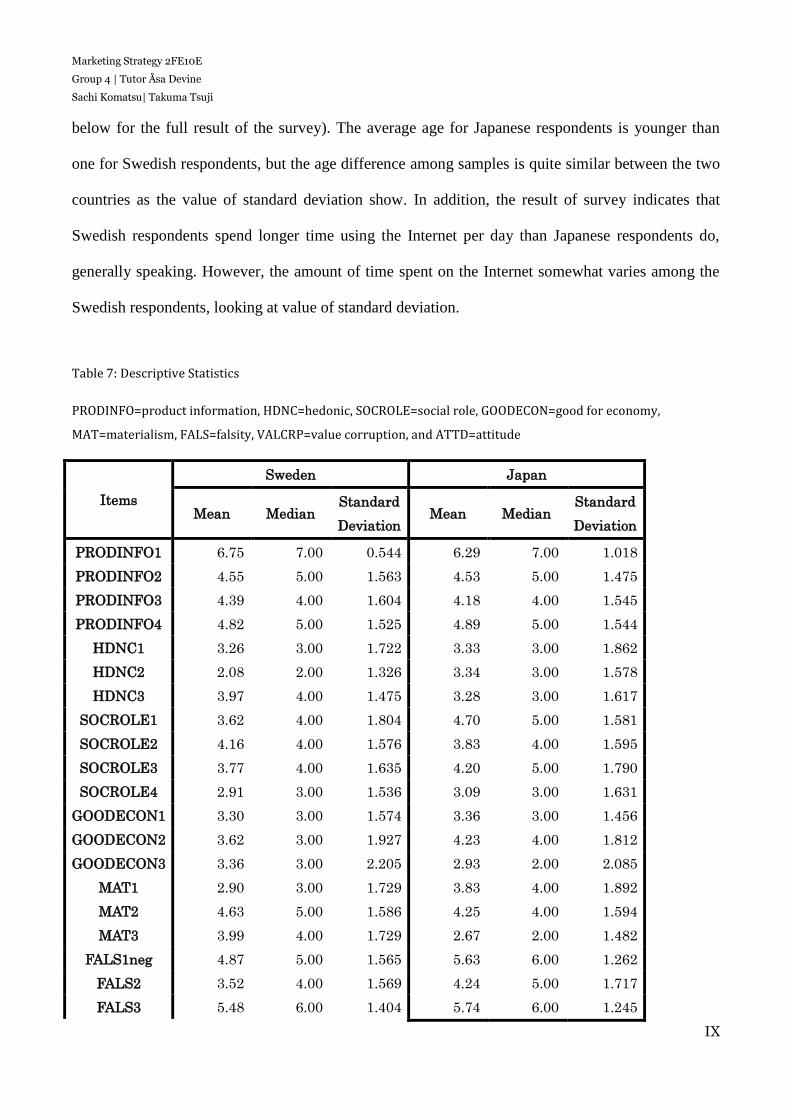
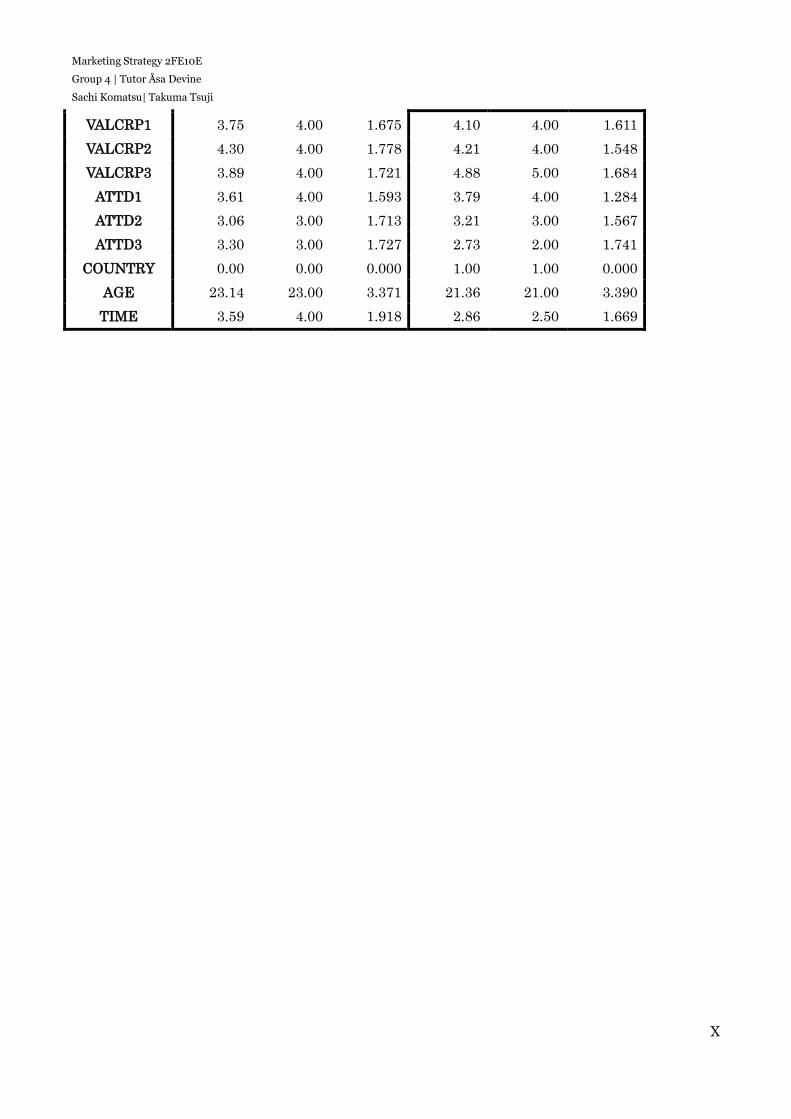
(F) Descriptive Statistics ........................................................................................................VIII
Page 6
Marketing Strategy 2FE10E
Group 4 | Tutor Åsa Devine
Sachi Komatsu| Takuma Tsuji
4 What are the differences in the attitudes toward Web advertising of Swedish and Japanese consumers?
1. Introduction
In this chapter, importance and brief history of the culture-related studies in the field of business
research is presented. It also discusses how the development of Web technology has influenced
businesses as a new mean for advertising. In addition, the problem and question caused by the
background information is presented, guiding to the purpose of the research and research question.
1.1 Background
There are various ways in which cultural factors in an environment can affect a business, and there
have been a number of studies exploring the effects a culture has. For example, one of the earliest
studies that show the importance of cultural effects on a business was conducted in 1967, arguing
that there were various cultural factors such as values and customs that have impacts on ethical
decision making process (Vitell et al., 1993). National culture also has strong impacts on
international business. Research regarding cultural effects on international business is becoming
more active as today’s business world follows a path to be more global (Leung et al., 2005).
The importance of knowing target consumers’ cultural background has also been highlighted.
Due to the increasing competitiveness of the international markets today, it is more and more
important to understand and know different consumers in various markets all over the world.
Attitudes and values of a consumer, for instance, are strongly influenced by culture among the other
environmental influences such as economic influence (Hsu and Burns, 2012). In addition, values,
which are shared among members of a culture, are also said to have strong influence to consumers’
motivations of consumption (Henry, 1976). Thus, understanding how culture affects its business may
be a key factor for success to an enterprise.
In addition, the spread of the Internet and development of Web technology have been
influencing the way today’s businesses are. The way companies approach consumers with
advertising is highly affected by this emergence of the new technology. As the consumers engage
Page 7
Marketing Strategy 2FE10E
Group 4 | Tutor Åsa Devine
Sachi Komatsu| Takuma Tsuji
5 What are the differences in the attitudes toward Web advertising of Swedish and Japanese consumers?
more into the use of the Internet, like using social media and blogging, firms have been trying to seek
opportunities to utilize this new technology for their businesses (Andzulis et al., 2012). The use of
social media as a mean to spread their message is an example of the way the firms have reacted to
the emergence of this new technology (Ibid.). Today, there are various kinds of Web advertising
which one encounters while he is using the Internet in his daily life (Ibid.). Some researcher argues
that flooding of high-tech products in today’s market also helped creating the overall positive
perceptions toward Web advertising (Yoon and Kim, 2001). For instance, as consumer products have
become more and more complicated in terms of functions, consumers tend to spend more time on
searching and comparing possible choices to find the most suitable product for their needs. In this
regard, Web advertising can be the most suitable mean in comparison to other forms of advertising
(Ibid.).
1.2 Problem Discussion
As it has been mentioned, cultural impacts have been a major area of study for business research, and
firms around the world have been shown to possess implications to affect consumers in a range of
ways. Not only for traditional means of advertisements such as TV commercials and printed ones,
but also have Web advertising come to play an important role as both opportunities and challenges to
advertisers (An and Kim, 2008). Web advertising has appeared to play an important role in firms’
international marketing efforts as the number of applications of Web advertising has increased (Ibid.).
The popularity of the Web advertising is rapidly increasing as commercial activities move into the
Internet more (Schlosser et al., 1999), and there is an increasing attention to investigate in system
and impact of Web advertising over recent years (Wang and Sun, 2010). In this way, as the popularity
of Web advertising has increased, it has become increasingly necessary to comprehend the
differences in consumers’ reactions toward this new medium for advertising (An and Kim, 2008).
Some studies show that how consumers perceive and react to the Web advertising is usually
Page 8
Marketing Strategy 2FE10E
Group 4 | Tutor Åsa Devine
Sachi Komatsu| Takuma Tsuji
6 What are the differences in the attitudes toward Web advertising of Swedish and Japanese consumers?
dependent on what they believe and attitudes already formed toward advertisements in general (An
and Kim, 2008). However, traditional means of advertising and Web advertising differ in some ways.
The Internet requires the marketers to manage its unique features as a mean of advertising (Schlosser
et al., 1999). The diversity of the audience is one of the uniqueness of the Web advertising (Chau et
al., 2002). One of the basic distinctiveness of the Web advertising is that consumers have a great
degree of control over exposures to advertisements, unlike the traditional advertisements to which
consumers have somewhat passive role in exposure. Thus, it is critical for Internet advertisers to
grasp in-depth understanding of consumers’ attitudes as it may differ due to many factors including
culture (Schlosser et al., 1999). Web advertisers need to make decisions to obtain an optimal mixture
of international standardization and local adaptations reflecting cultural differences (Chau et al.,
2002).
When advertisers need to make decisions upon the degree to which they are to adapt Web
advertising locally, they may want to know how the attitudes of consumers toward Web advertising
differ country to country. Some of the existing studies show that the relationship between culture and
advertising is natural (Wang and Sun, 2010), and it is a key to succeed for Web advertisers to have
deep understanding about consumers’ beliefs and attitudes towards Web advertising (Wolin et al.,
2002). Thus, the question regarding how attitudes toward Web advertising differs depending on the
cultures of countries (An and Kim, 2008). For example, even if they see the same advertisement in
one country, consumers’ different backgrounds of nationality may lead to different reactions and
results.
The field of study also has practical significance to the firms in today’s business world because
of the relationship among consumers’ beliefs, attitudes, and behaviors. The beliefs about Web
advertising of a consumer are linked to his or her attitudes, and it is likely the case that the formed
attitudes affect the behavior he or she takes (Wolin et al., 2002). The fact that attitudes towards Web
advertising tend to have impacts on consumers’ actual purchasing behavior is important for
Page 9
Marketing Strategy 2FE10E
Group 4 | Tutor Åsa Devine
Sachi Komatsu| Takuma Tsuji
7 What are the differences in the attitudes toward Web advertising of Swedish and Japanese consumers?
companies because the actual purchase is the source of profit to them. In this way, it is critical to gain
as much knowledge as they can about consumers’ attitudes and to have a deeper insight for the issue
regarding cultural effect on attitudes toward Web advertising. Therefore, this paper is to explain how
culture is related to the consumers’ attitudes toward web advertising.
Despite the importance of understanding cultural influence on consumers’ attitudes toward
Web advertising, most of the existing studies have focused on the United States (Wang and Sun,
2010). Moreover, there have not been many cross-cultural studies conducted to make actual
comparison of attitudes toward Web advertising of consumers from different cultures. The first
cross-cultural study on consumers’ attitudes toward Web advertising was conducted in 2008 by An
and Kim, comparing Korean and American consumers’ attitudes (An and Kim, 2008). Wang and Sun
(2010) made contribution to this area of study by comparing two developing countries, China and
Romania (Wang and Sun, 2010). This research attempts to make more contribution by comparing
two developed countries, Sweden and Japan.
In a cross-cultural study, it is important to have major differences in cultural orientations
because it would make it possible to conduct a comparative analysis to highlight where the
differences are and to find out explanations for the differences (An and Kim, 2008). The result of
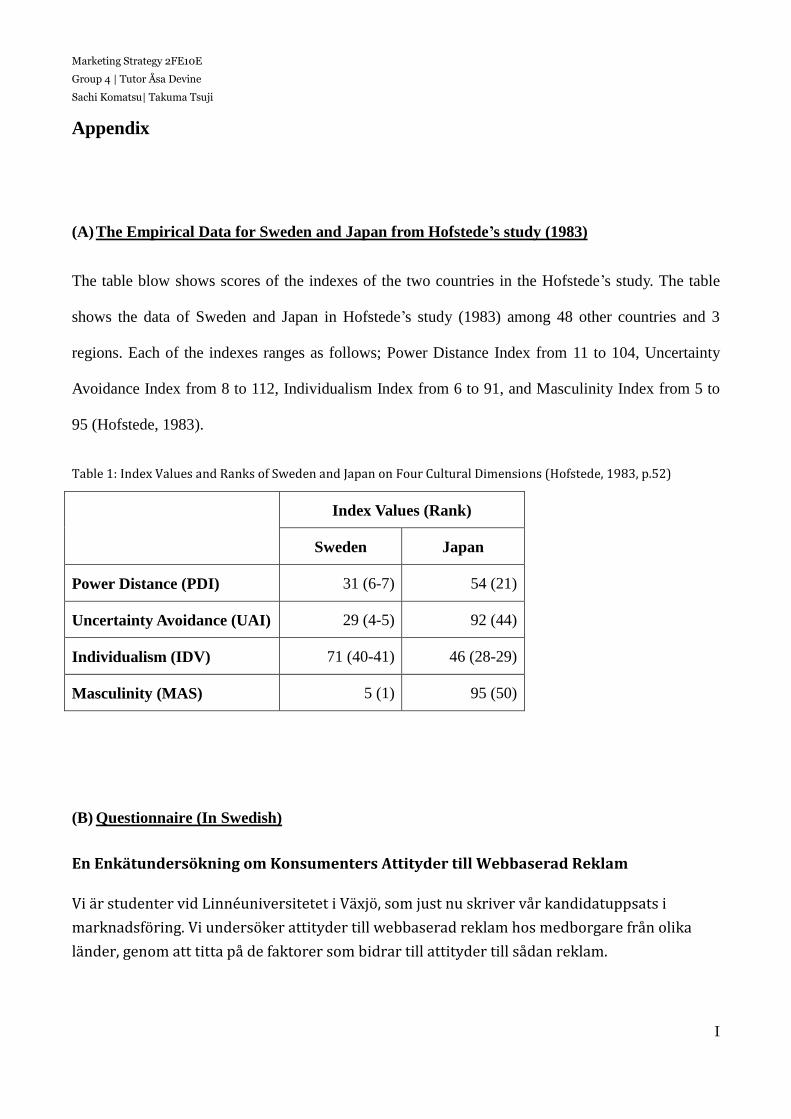
Hofstede’s study (1983) shows different characteristics of Sweden and Japan (See the table 1 in
appendix for detailed data of the two countries). Sweden and Japan have a difference in Masculinity
dimension to the greatest degree. Japan scores extremely high in Masculinity index, while Sweden is
the lowest in the index among the countries examined in the study. This indicates that Japan is
characterized as a highly masculine culture, and Sweden is on the other extreme as a feminine
culture. The Uncertainty Avoidance index in the same Hofstede’s study (1983) also shows a
difference between the two countries. Sweden scores lower in the Uncertainty Avoidance index than
the other countries, while Japan is characterized as a highly uncertainty-avoiding country with a
Page 10
Marketing Strategy 2FE10E
Group 4 | Tutor Åsa Devine
Sachi Komatsu| Takuma Tsuji
8 What are the differences in the attitudes toward Web advertising of Swedish and Japanese consumers?
higher score. In addition, Sweden scores low in Power Distance index and somewhat high in
Individualism, and Japan scores moderate on these two dimensions.
1.3 Purpose of Research
The purpose of this paper is to explain differences in attitudes toward Web advertising of Swedish
and Japanese consumers.
1.4 Research Question
To fulfill the proposed purpose, this study is to answer the following research question:
What are the differences in the attitudes toward Web advertising of Swedish and Japanese
consumers?
1.5 Outline of Thesis
This research is composed of six chapters, and the general contents of each chapter are as follows:
1. Chapter one, introduction, starts the discussion regarding cultural effects on businesses,
gradually putting focus on discussing how cultures have impacts on consumers’ attitudes
toward Web advertising. This chapter also introduces the reason behind the authors’ choice to
conduct a study on Swedish and Japanese consumers.
2. In chapter two, a literature review on the existing studies in the field of culture and
consumers’ attitudes toward Web advertisement is presented. The chapter, in the end,
introduces and discusses the research gap to cover in this study.
3. Chapter three discusses the chosen methodologies for the research and the justifications for
the choices the authors have made.
4. In chapter four, the survey result collected through online questionnaires, which is in line
Page 11
Marketing Strategy 2FE10E
Group 4 | Tutor Åsa Devine
Sachi Komatsu| Takuma Tsuji
9 What are the differences in the attitudes toward Web advertising of Swedish and Japanese consumers?
with the data collection method presented in chapter three, is presented.
5. In chapter five, the data presented in chapter five is interpreted and discussed in alignment
with the theories presented in the previous chapter.
6. The conclusion of the research is drawn in chapter six with the answer for the research
question.
Page 12
Marketing Strategy 2FE10E
Group 4 | Tutor Åsa Devine
Sachi Komatsu| Takuma Tsuji
10 What are the differences in the attitudes toward Web advertising of Swedish and Japanese consumers?
2. Literature Review
This chapter reviews previous studies, which already exist in the field of consumers’ attitudes toward
Web advertising and cultures. It presents the definitions for the key terms which are going to be used
in this research, and it briefly summarizes what previous research have done so far. Finally, the
specific model for this research is presented.
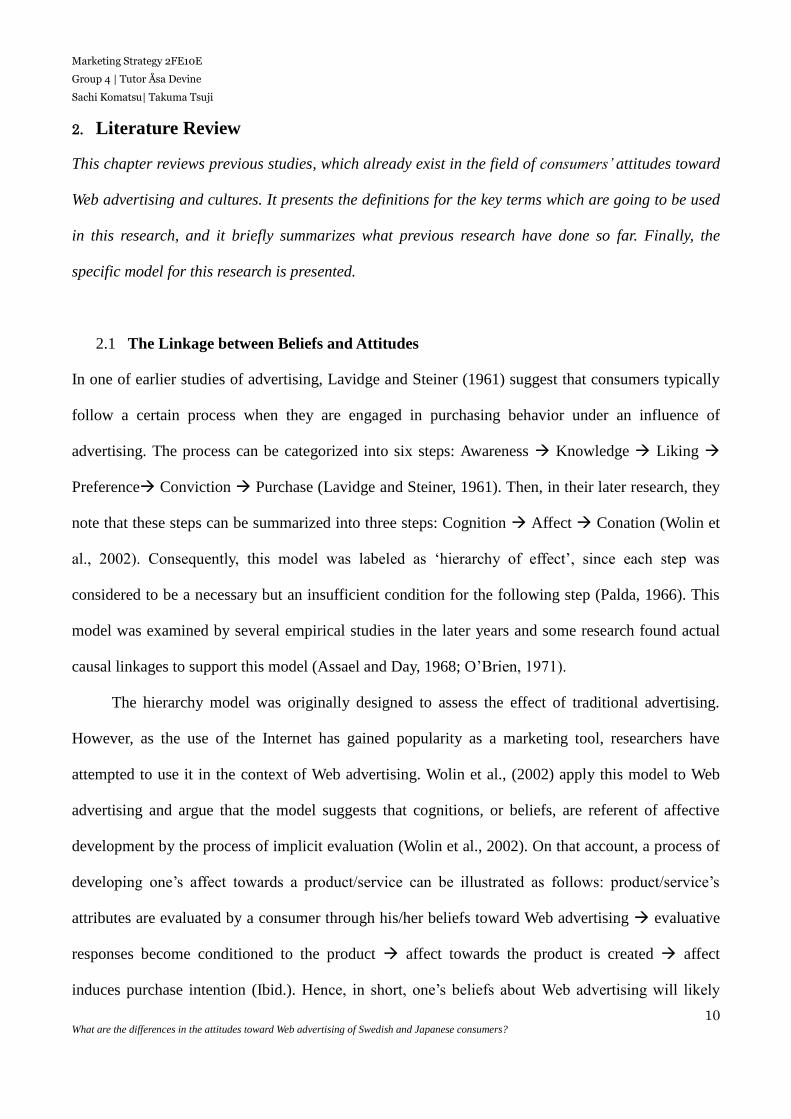
2.1 The Linkage between Beliefs and Attitudes
In one of earlier studies of advertising, Lavidge and Steiner (1961) suggest that consumers typically
follow a certain process when they are engaged in purchasing behavior under an influence of
advertising. The process can be categorized into six steps: Awareness Knowledge Liking
Preference Conviction Purchase (Lavidge and Steiner, 1961). Then, in their later research, they
note that these steps can be summarized into three steps: Cognition Affect Conation (Wolin et
al., 2002). Consequently, this model was labeled as ‘hierarchy of effect’, since each step was
considered to be a necessary but an insufficient condition for the following step (Palda, 1966). This
model was examined by several empirical studies in the later years and some research found actual
causal linkages to support this model (Assael and Day, 1968; O’Brien, 1971).
The hierarchy model was originally designed to assess the effect of traditional advertising.
However, as the use of the Internet has gained popularity as a marketing tool, researchers have
attempted to use it in the context of Web advertising. Wolin et al., (2002) apply this model to Web
advertising and argue that the model suggests that cognitions, or beliefs, are referent of affective
development by the process of implicit evaluation (Wolin et al., 2002). On that account, a process of
developing one’s affect towards a product/service can be illustrated as follows: product/service’s
attributes are evaluated by a consumer through his/her beliefs toward Web advertising evaluative
responses become conditioned to the product affect towards the product is created affect
induces purchase intention (Ibid.). Hence, in short, one’s beliefs about Web advertising will likely
Page 13
Marketing Strategy 2FE10E
Group 4 | Tutor Åsa Devine
Sachi Komatsu| Takuma Tsuji
11 What are the differences in the attitudes toward Web advertising of Swedish and Japanese consumers?
lead to his/her attitudes toward Web advertising (Wolin et al., 2002).
2.2 Model for Measuring Consumers’ Beliefs
Keeping the relationship between consumers’ beliefs and attitudes in mind, it is necessary to
correctly measure one’s beliefs in order to measure his/her attitudes toward Web advertising. To
provide measures for consumers’ beliefs, researchers have been proposing number of models on this
topic. Bauer and Greyser (1968) were the first to define beliefs and attitudes toward advertising
systematically (Wolin et al., 2002). In their research, they argue that beliefs that effect consumers’
attitudes toward advertising can be categorized into two clusters: economic and social effects (Bauer
and Greyser, 1968).
Subsequently, several researchers extended the model. Based on their study conducted in 1992,
Alwittt and Prabhaker (1994) extended the model and argue six dimensions such as information
benefits or availability that underlie consumers’ evaluation of advertising (Alwittt and Prabhaker,
1994). In addition, Lutz (1985) in Wolin et al. (2002) also adds domestic five-construct model, which
was later extended by Durvasula et al. (1993) to lead another finding; consumers’ attitudes toward
advertisement were influenced by four constructs (Durvasula, 1993).
Finally, Pollay and Mittal (1993) completed a seven-factor model based on previous studies.
Seven-factor model represents seven factors that influence consumers’ beliefs about advertising,
which will likely relate to their attitudes toward advertising. The model includes three personal use
factors of advertising: product information, hedonic/pleasure, and social role and image, along with
four social effect factors of advertising: good for the economy, materialism, falsity/no sense, and
value corruption (Pollay and Mittal, 1993).
Though this model was also initially designed to assess consumers’ beliefs and attitudes
toward traditional means of advertising, researchers argue that this can be applied to Web advertising
as well, since consumers responses to Web advertising are quite similar to their responses to
Page 14
Marketing Strategy 2FE10E
Group 4 | Tutor Åsa Devine
Sachi Komatsu| Takuma Tsuji
12 What are the differences in the attitudes toward Web advertising of Swedish and Japanese consumers?
conventional means (Pavlou and Stewart, 2000). Wolin et al. (2002) used seven-belief factor model
to examine consumers’ attitudes and behavior toward Web advertising by measuring respondents’
beliefs about Web advertising. In their research, they measured consumers’ beliefs by modifying
Pollay and Mittal’s original wording and phrasing through operationalizing three or four-scale items
(Wolin et al., 2002).
2.2.1 Seven Belief Factors Modified for Web Advertising
Personal use: Three factors in this category reflect Web advertising’s influence on consumers’
beliefs that are specific, personal, and self-reflective (Pollay and Mittal, 1993; Bauer and Greyser,
1968).
1. Product information
This factor indicates that consumers consider advertising as an important source of information about
a marketplace that eventually improves market place efficiencies; since it better matches consumers’
needs and wants somewhat quickly and effectively (Wang et al., 2009). Among others, previous
research showed that information related reasons seem to be ones that positively related to
consumers’ overall attitudes toward advertising (Pollay and Mittal, 1993). In fact, Ducoffe (1996)
supports this idea in his research and concluded that he found a significant correlation between
product information of advertisement and advertising value for consumers, indicating that consumers
place quite high importance on this factor (Ducoffe, 1996). In previous studies, the first personal use
factor, ‘Product Information’ was measured with the following statements: ‘Web advertising is a
very valuable source of information about sales’; ‘Web advertising helps me keep up to date about
products available in the market place’; ‘Advertising supplies relevant product information’; ‘Web
Page 15
Marketing Strategy 2FE10E
Group 4 | Tutor Åsa Devine
Sachi Komatsu| Takuma Tsuji
13 What are the differences in the attitudes toward Web advertising of Swedish and Japanese consumers?
advertising provides timely information’; ‘Web advertising makes product information immediately
accessible’; ‘Web advertising is a convenient source of product information’; and ‘Internet
advertising supplies complete product information’ (Pollay and Mittal, 1993; Ducoffe, 1996; Wolin
et al., 2002; An and Kim, 2008).
2. Hedonic/pleasure
It has been argued that the experience of advertising can be a pleasure to people, because advertising
can be beautiful to look at, touching in sentiment, funny and exiting in music (Pollay and Mittal,
1993). In addition to these facts, Web advertising has a potential to be perceived as even more
entertaining and pleasant mean because of its unique characteristics, when comparing to traditional
means of advertising. For example, some of the given characteristics of Web advertising such as
interactivity and multimedia capabilities make Web advertising to be more beautiful, sentimental,
motivating, humorous, and entertaining (Watson et al., 1998). Therefore, Web advertising should
potentially have a higher value to consumers than conventional means of advertisement. This factor
has also been reported to have a positive impact on consumers’ attitudes toward Web advertising
(Ducoffe, 1996; Schlosser et al., 1999; Wolin et al., 2002; An and Kim 2008). In previous studies,
Hedonic/pleasure, the second personal factor was measured with: ‘Sometimes I take pleasure in
thinking about what I saw or heard in Web advertising’; ‘Sometimes Web advertising is even more
enjoyable than websites’; ‘Some Web advertising makes me feel good’; ‘Internet advertising is
entertaining’; ‘Internet advertising is enjoyable’; ‘Internet advertising is pleasing’; and ‘Internet
advertising is fun to use’ (Pollay and Mittal, 1993; Ducoffe, 1996; Wolin et al., 2002; An and Kim,
2008).
Page 16
Marketing Strategy 2FE10E
Group 4 | Tutor Åsa Devine
Sachi Komatsu| Takuma Tsuji
14 What are the differences in the attitudes toward Web advertising of Swedish and Japanese consumers?
3. Social role and image
As other means of advertising possess a high influence on formation of social role and image, Web
advertising has a large influence on these factors as well. Advertisers often use this power by
exhibiting “better” life style and social image by specifying their desired product or brand
personality which is often associated with certain status, prestige, or social reaction to purchase,
ownership, and use (Pollay as Mittal, 1993). For that reason, many consumers pay higher prices for
branded products that often feature brand logos, slogans and other types of corporate designs (Ibid.),
indicating that this positively affects consumers’ attitudes toward Web advertising (Pollay and Mittal,
1993; Wolin et al., 2002; An and Kim, 2008). Furthermore, in the context of Web advertising, some
of the uniqueness of Web advertising, such as vivid or interactive messages often enhances its ability
to influence social role and image (Wolin et al., 2002). In previous studies, the last personal use
factor, ‘Social Role and Image’ was measured with: ‘From Web advertising, I learn what is in
fashion and what I should buy for keeping a good social image’; ‘Web advertising tells me what
people like myself are buying and using’; and ‘Web advertising helps me know which products will
or will not reflect the sort of person I am’ (Pollay and Mittal, 1993; Wolin et al., 2002).
Social effects: Social effects represent Web advertising’s impacts on consumers’ beliefs about
economical and social concerns that are more abstract, generalized, and projective to others (Pollay
and Mittal, 1993; Bauer and Greyser, 1968).
1. Good for the Economy
Web advertising is necessary for everybody. Web advertising can save consumers time of searching
products and allow them to scan wide variety of products even from their homes (Wolin et al., 2002).
Page 17
Marketing Strategy 2FE10E
Group 4 | Tutor Åsa Devine
Sachi Komatsu| Takuma Tsuji
15 What are the differences in the attitudes toward Web advertising of Swedish and Japanese consumers?
Furthermore, it has been also argued that advertising can potentially raise the average standard of
living in a long run, as it allows companies to lower production cost and generates healthy
competitions among companies as consumers can adopt new goods and technologies relatively
quickly through Web advertising (Belch and Belch, 2008 in Wang et al., 2009). Even though this
factor has been claimed to have a positive influence on consumers’ attitudes toward Web advertising,
previous studies did not find a strong correlation as a predictor of consumers’ attitudes (Pollay and
Mittal, 1993; Wolin et al., 2002). However, in Pollay and Mittal’s study (1993), this factor was only
single-measured, which is less reliable than three-item measure. Thus, there still is a need for
including this factor as one of possible measures for consumers’ attitudes toward Web advertising. In
previous studies, good for the economy, the first social effect, was measured with the following
statements: ‘Web advertising improves people’s standard of living’; ‘We need Web advertising
improves people’s standard of living’; ‘There have been times when I have bought something
because of a Web advertising’ and ‘Internet advertising is essential’ (Pollay and Mittal, 1993; Wolin
et al., 2002; Wang et al., 2009).
2. Materialism
Materialism can be defined as a set of belief structures that sees consumption as the route to most, if
not all, satisfactions (Pollay and Mittal, 1993). Nowadays, Web users are faced with attractive array
of material goods through Web advertising and it may promote excessive commercial concerns
resulting in materialism (Wolin et al., 2002). Nevertheless Web advertising has a potential to benefit
consumers, it is often criticized because of this reason. In this context, therefore, this factor has a
negative impact on consumers’ attitudes toward Web advertising. In previous studies, materialism,
the second social effect, was measured with: ‘Web advertising makes you buy things you do not
really need’; ‘Web advertising increases dissatisfaction among consumers by showing products
Page 18
Marketing Strategy 2FE10E
Group 4 | Tutor Åsa Devine
Sachi Komatsu| Takuma Tsuji
16 What are the differences in the attitudes toward Web advertising of Swedish and Japanese consumers?
which some consumers cannot afford’; ‘Web advertising is making us a materialistic
society-interested in buying and owing things’; ‘Advertising makes people live in a world of
fantasy’; and ‘Web advertising makes people buy unaffordable products just to show off’ (Pollay and
Mittal, 1993; Wolin et al., 2002; Wang et al., 2009).
3. Falsity/no sense
“Advertising can be seen as purposefully misleading, or more benignly, as not fully informative,
trivial, silly, confusing, etc.” (Pollay and Mittal, 1993, p.102). In the case of Web advertising, many
firms have rushed to create their own websites and Web advertising since the use of Internet has
gained popularity in business field as a mean of advertising. Consequently many firms had created
ineffective and non-logical websites (Nadilo, 1998). These websites tend to contain half-truths,
deceptive claims, and intelligence-insulting prose (Wolin et al., 2002). Hence some consumers may
perceive some of Web advertising as unfaithful or feel that some companies are exaggerating
benefits of offered products. This factor negatively affects consumers’ attitudes toward Web
advertising. In previous studies, ‘Falsity/no sense’ was measured with: ‘One can put more trust in
products advertised on the Web than in those not advertised on the Web’; ‘Certain products play an
important role in my life, and Web advertisements reassure me that I am doing the right thing in
using these products’; ‘Web advertising helps the consumer buy the best brand for the price’; ‘In
general, advertising is misleading’; ‘Most advertising insults the intelligence of the average
consumers’; and ‘In general, advertisements present a true picture of the product advertised’ (Pollay
and Mittal, 1993; Ducoffe, 1996; Wolin et al., 2002; An and Kim, 2008).
Page 19
Marketing Strategy 2FE10E
Group 4 | Tutor Åsa Devine
Sachi Komatsu| Takuma Tsuji
17 What are the differences in the attitudes toward Web advertising of Swedish and Japanese consumers?
4. Value corruption
As mentioned above, any kind of advertising has a potential to shape one’s value in both positive and
negative ways (Pollay and Mittal, 1993). The negative side of this fact has been one of serious
concerns regarding not only traditional means of advertisements but also Web advertising. For
instance, some researchers have depicted the issue in the context of parental guidance: Web
advertising can distort the values that parents desire to instill in their children (Pollay and Mittal,
1993; Wolin et al., 2002). As a result, this sort of concern lead many Web users to start installing
so-called ‘ad blocker’ software to avoid undesired Web advertising (McCormally, 2000 in Wolin et
al., 2002). This factor has a negative effect on consumers’ attitudes toward Web advertising. In the
previous studies, the last social effect, value corruption was measured with: ‘Advertising promotes
undesirable values in our society’; ‘Web advertising takes undue advantage of children’; ‘Web
advertising leads children to make unreasonable purchase demand on their parents’; ‘There is too
much sex in Web advertising’; and ‘Most advertising distorts values of youth’ (Pollay and Mittal,
1993; Wolin et al., 2002)
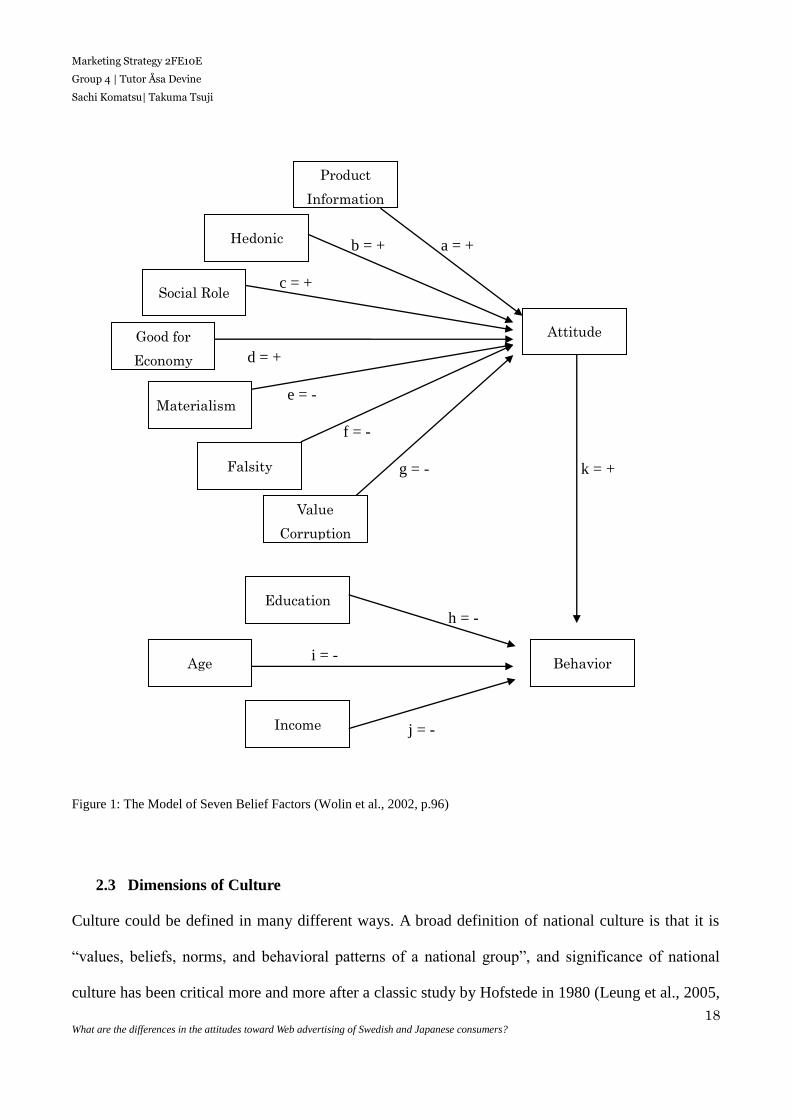
The figure 1 on the next page summarizes the model of seven belief factors, which was used
by Wolin et al. (2002) to understand consumers’ attitudes and behavior towards Web advertising.
This study focuses on the upper part of the model below because the focus of the study is the attitude,
and this study is not to investigate further in the behavior.
Page 20
Marketing Strategy 2FE10E
Group 4 | Tutor Åsa Devine
Sachi Komatsu| Takuma Tsuji
18 What are the differences in the attitudes toward Web advertising of Swedish and Japanese consumers?
b = + a = +
c = +
d = +
e = -
f = -
g = - k = +
h = -
i = -
j = -
Figure 1: The Model of Seven Belief Factors (Wolin et al., 2002, p.96)
2.3 Dimensions of Culture
Culture could be defined in many different ways. A broad definition of national culture is that it is
“values, beliefs, norms, and behavioral patterns of a national group”, and significance of national
culture has been critical more and more after a classic study by Hofstede in 1980 (Leung et al., 2005,
Product
Information
Hedonic
Social Role
Good for
Economy
Materialism
Falsity
Education
Attitude
Value
Corruption
Age
Income
Behavior
Page 21
Marketing Strategy 2FE10E
Group 4 | Tutor Åsa Devine
Sachi Komatsu| Takuma Tsuji
19 What are the differences in the attitudes toward Web advertising of Swedish and Japanese consumers?
p.357). As his operating definition, Hofstede defines culture as “the collective programming of the
mind that distinguishes one group or category of people from another”, putting focus on saying that
culture is “a collective attribute” that is “manifested in behaviors” and that is “common to some but
not all people” (Hofstede and McCrae, 2004, p.58). Although culture may be defined in a broad
range of ways, it is widely agreed among researchers studying consumer behavior that culture has
influence over beliefs, norms, traditions, and values of a society (Manrai and Manrai, 2011).
Using a database collected from 71 countries by a multinational enterprise, Hofstede
conducted a study on differences in national culture in 1980 (Hofstede and McCrae, 2004). This
work has resulted in finding four major dimensions of national culture, which are power distance,
uncertainty avoidance, individualism versus collectivism, and masculinity versus femininity
(Hofstede and McCrae, 2004). In addition to the four dimensions, long-term versus short-term
orientation has been added as a fifth dimension later in 1980s (Hofstede and McCrae, 2004). The
initial four dimensions and a recently added dimension are discussed in detail in 2.3.1.
By examining average scores and rankings of the countries studied, a few generalizations can
be made based on the study. Generally, so-called Western countries tend to score low on power
distance and uncertainty avoidance and to score high on individualism (Manrai and Manrai, 2011).
On the other hand, Eastern countries are characterized with scoring high on power distance,
uncertainty avoidance and collectivism, and they are said to be long-term oriented (Ibid.).
It is also notable that empirical data collection for Hofstede’s study of the original four
dimensions was carried out in 1967 to 1973, which is often criticized as a shortcoming of the work
(Soares et al., 2007). It is often said that the findings are outdated by now as the culture is said to be
evolving (Ibid.). Some researchers have made counter-arguments to this criticism. For example,
Sivakumar and Nakata has argued that the Hofstede’s work is still significant as culture changes slow
enough to keep the cultural differences persistent (Sivakumar and Nakata, 2001). Hofstede himself
Page 22
Marketing Strategy 2FE10E
Group 4 | Tutor Åsa Devine
Sachi Komatsu| Takuma Tsuji
20 What are the differences in the attitudes toward Web advertising of Swedish and Japanese consumers?
has argued that his work would be valid until 2100 as the culture changes slowly and incrementally,
which is not enough to invalidate the country index scores (Hofstede, 2001 in Soares et al., 2007).
2.3.1 Dimensions of Culture
Power distance
The first dimension in Hofstede’s dimensions of culture, power distance, is the degree of acceptance
by less powerful members of institutions regarding unequally distributed power (Hofstede and
McCrae, 2004). As this dimension is the inequality defined from the perspective of followers, it
implies that the followers may support in equality in a society as much as the leaders may do (Ibid.).
The dimension is also suggested to be linked to the amount of power a person has over others
(Manrai and Manrai, 2011).
If a society is identified to hold a low power distance index, it supports the idea of minimizing
the inequality within the community (Hofstede, 1983). The society would also be characterized by
supports for interdependence and equal rights, and members of the society believe that people with
power should try to be seen less powerful than they actually are (Ibid.). Hierarchy in the society with
low power distance index is there for convenience, and redistribution of power is considered to be
the way to make changes to the social structure (Ibid.). If something goes wrong in the society,
people should blame for the system, not others, and there should be a harmony between powerful
individuals and powerless others (Ibid.).
On the other hand, a society with a high power distance index is characterized by acceptance
to the inequality and power (Hofstede, 1983). In the society, people are supposed to act and be seen
as powerful as they are, and dependence of individuals is recommended (Ibid.). It is believed that the
way to change the society is to replace the people in power, and if anything goes wrong, the
powerless are the one to be blamed for (Ibid.). In addition, there may be suppressed conflicts
between people in power and others (Ibid.).
Page 23
Marketing Strategy 2FE10E
Group 4 | Tutor Åsa Devine
Sachi Komatsu| Takuma Tsuji
21 What are the differences in the attitudes toward Web advertising of Swedish and Japanese consumers?
Uncertainty Avoidance
The second dimension of Hofstede’s dimensions of culture deals with the acceptance of a society
toward ambiguity (Hofstede and McCrae, 2004). It is believed that this dimension is connected to
how a society deals with conflicts and hostility (Manrai and Manrai, 2011). This dimension is the
indication of the degree to which members of a society feel comfortable, or uncomfortable, to
situations which are not well-structured or known (Hofstede and McCrae, 2004). Uncertain situations
are defined as those, which are surprising and different from what are considered as usual, and this
dimension of culture examines how members of a society react to those situations (Ibid.).
People in a society with low uncertainty avoidance index are considered to be less emotional,
more willing to take risks in their lives, and less conservative (Hofstede, 1983). Hard work is not
considered as a virtue, and members of the society generally seek to have ease and lower stress
(Ibid.). The rules in the society with low uncertainty avoidance are believed to be something should
be changed if necessary, and people believe that the number of rules should be as few as possible.
Members of the society frown upon aggressive behaviors, and they tend to be accepting toward
dissenting (Ibid.).
Compared to a society with low uncertainty avoidance index, an uncertainty-avoiding culture
tends to minimize the chances of unstructured situations with strict rules (Hofstede and McCrae,
2004). People in an uncertainty-avoiding society are said to have greater anxiety and stress and feel
urged to work hard (Hofstede, 1983). They tend to be conservative and less likely to show emotions
(Ibid.). The society needs written-down rules and regulations, and there are strong stresses toward
agreement being necessary (Ibid.).
Individualism versus Collectivism
Individualism versus Collectivism dimension of culture is the extent to which members of a society
Page 24
Marketing Strategy 2FE10E
Group 4 | Tutor Åsa Devine
Sachi Komatsu| Takuma Tsuji
22 What are the differences in the attitudes toward Web advertising of Swedish and Japanese consumers?
join together in groups (Hofstede and McCrae, 2004). In other words, it looks at the extent to which
members of a society put values on themselves and their groups (Wu, 2006). The individualism
versus collectivism dimension is said to be related to how dependent a person is on the group
(Manrai and Manrai, 2011).
In a non-individualistic culture, people are born to be a part of extended families that are to
look after them in exchange for faithfulness (Hofstede, 1983). They are collectivity-oriented, identify
themselves in the social structure, and emotionally dependent on organizations (Ibid.). Private life
and opinion of a person can be possessed by the group to which the person belongs to, and in turn,
orders, duties, and securities are offered by the group (Ibid.). The decisions are made in groups, and
it is believed that standards of value can vary among different groups (Ibid.).
On the other hand, people in a highly individualistic culture tend to have looser ties between
individuals, and they are supposed to take care of themselves and their immediate families (Hofstede
and McCrae, 2004). They consider that all the people should have a right to enjoy private life and
have personal opinion, and they are self-oriented (Hofstede, 1983). Individual decisions and
emotional independence are valued more than group decisions and dependence to organizations
(Ibid.). It is also believed in the society that there should be universal value standards that can be
applied to everybody (Ibid.).
Masculinity versus Femininity
The fourth dimension of Hofstede’s dimensions of culture, Masculinity versus Femininity dimension,
sees the share of emotional roles between males and females (Hofstede and McCrae, 2004).
Moreover, masculinity versus femininity is said to be connected to choice of gender roles and how it
influences on individuals in a society (Manrai and Manrai, 2011). This dimension takes a look at the
distribution of roles between genders and defines gender roles in institutions (Wu, 2006). The
distribution of this dimension varies from the assertive extreme, which is called as masculine, to the
Page 25
Marketing Strategy 2FE10E
Group 4 | Tutor Åsa Devine
Sachi Komatsu| Takuma Tsuji
23 What are the differences in the attitudes toward Web advertising of Swedish and Japanese consumers?
modest pole, which is feminine (Hofstede and McCrae, 2004).
Scoring low in masculinity index, meaning being feminine, has connotation of being people
oriented (Hofstede, 1983). In a feminine culture, roles between genders should be fluid, and the
differences in gender roles are not connected to the difference in power (Ibid.). It is ideal for the men
in a feminine culture to have modest and thoughtful values in the same way as women do (Hofstede
and McCrae, 2004). Moreover, people put value in the quality of life, and they are said to work to
live (Hofstede, 1983).
On the other extreme, in a masculine culture, the genders appear to have differences in values.
For example, women in a masculine culture seem to be less assertive than men are (Hofstede and
McCrae, 2004). People are money and things oriented in masculine countries, live to work, and
believe that gender roles in the society should be distinguished (Hofstede, 1983). Men in the society
should be dominating, and they are supposed to act assertively, and women are considered to stay
caring and nurturing (Ibid.). Performance and growth are valued, and people should be trying to be
the best in excelling nature (Ibid.).
Long-term versus Short-term Orientation
Lastly, the newer, fifth dimension by Hofstede, the long-tem versus short-term orientation, was
added to prior four dimensions to address national economic growth (Manrai and Manrai, 2011).
This dimension refers to the promotion of virtues, which are oriented toward future returns,
specifically perseverance and thrift (Hofstede, 2001 in Soares et al., 2007). The dimension is strongly
related to the Confucian-like values, and originally called as Confucian Dynamism. However,
Hofstede later renamed the designation as it would be more appropriate (Soares et al., 2007).
2.4 Culture and Consumers’ Attitudes
Culture is said to have a lot of significance to many aspects of a business. This implies that
Page 26
Marketing Strategy 2FE10E
Group 4 | Tutor Åsa Devine
Sachi Komatsu| Takuma Tsuji
24 What are the differences in the attitudes toward Web advertising of Swedish and Japanese consumers?
differences in culture also have importance to a business. According to Munson and McIntyre (1979),
studying aspects of values that could be generalized in culture will reveal cultural differences.
Advertisers have been paying attentions to cultural differences of markets because they recognize
importance of value in understanding consumer behavior (Munson and McIntyre, 1979 in Zhang and
Gelb, 1996). The reasoning for the importance of understanding cultural difference lies in value
system, beliefs and perception processes that consumers get used to as they grow up in a culture.
Accordingly, the result of this process is reflected in the way they react to the messages in
advertisements which fits to their culture (Zhang and Gelb, 1996).
Culture also plays a vital role in knowing more about consumers on the Web. For example,
even if the global consumer interface of the Web needs to be internationalized to some degree, it is
also necessary that the design reflects some of the cultural characteristics of the audience (Chau et al,
2002). This fact may appear in the use of color as the same color may have different representation in
different culture. For instance, white is the color which shows purity in the United States, but the
color is often linked with an image of death in Japan (Ibid.). In this way, each consumer’s tastes and
preferences are affected by collective values of their local society to a certain extent (Ibid.). As
mentioned earlier, beliefs a consumer has tend to be connected to his or her attitude towards web
advertising, and it is likely related further to his or her behavior (Wolin et al, 2002). Hence,
considering in a cultural context would help advertisers to understand and predict whether a
consumer will react positively or negatively to an advertisement (Chau et al., 2002).
In addition, differences in cognitive styles of consumers from different culture affect how
successful an advertisement will be in a market (Cui et al., 2013). The study regarding differences in
cognitive styles among cultures can go back to the studies on hemispheric processing, and they have
found out that there are differences among cultures in the way people process information in their
brain, deriving from the differences in the languages (Ibid.). They have observed that people from
Western culture tend to use left hemispheric processing more, thus people tend to think linearly and
Page 27
Marketing Strategy 2FE10E
Group 4 | Tutor Åsa Devine
Sachi Komatsu| Takuma Tsuji
25 What are the differences in the attitudes toward Web advertising of Swedish and Japanese consumers?
logically, generally speaking (Ibid.). In contrast to that, people from East culture are more likely to
have emphasis on the use of right hemispheric processing, leading to their tendency to think
holistically with images. Studies suggest that people from East culture have analogical, nonlinear,
concrete and intuitive thinking (Ibid.). With these factors contributing to the effectiveness of
international advertising, it is said that East Asians like transformational advertising, while
Westerners perceive informational advertising more attractive (Ibid.).
2.5 Chapter Summary
The importance of knowing consumers’ attitudes to be successful in Web advertising and the factors
that forms up consumers’ attitudes toward Web advertising are well investigated and explained by
existing studies such as Wolin et al. (2002) and Pollay and Mittal (1993). In addition, some of the
existing literatures explore cultural differences of consumers’ attitudes and its importance in the
success of advertising (Zhang and Gelb, 1996; Chau et al, 2002; Cui et al., 2013). In addition to that,
consumers’ attitudes toward Web advertising are still under the process of evolving because of the
newness of the topic (Karson et al., 2006 in Wang and Sun, 2008). Moreover, there have not been
many cross-cultural studies done to investigate in consumers’ attitudes toward Web advertising. The
first cross-cultural study on consumers’ attitudes toward Web advertising was conducted in 2008 by
An and Kim (An and Kim, 2008). There are a few other studies that are attempting to understand
consumers’ attitudes toward Web advertising more in cross-cultural context, such as a study by Wang
and Sun in 2010. Thus, although literature suggests the importance of cultural difference on
consumers’ attitudes toward Web advertising, there have not been enough comparisons explained to
fully understand the differences. By conducting more cross-cultural studies, it may be possible to
strengthen the credibility of the existing argument on the influence of culture to attitudes toward Web
advertising by previous research.
Page 28
Marketing Strategy 2FE10E
Group 4 | Tutor Åsa Devine
Sachi Komatsu| Takuma Tsuji
26 What are the differences in the attitudes toward Web advertising of Swedish and Japanese consumers?
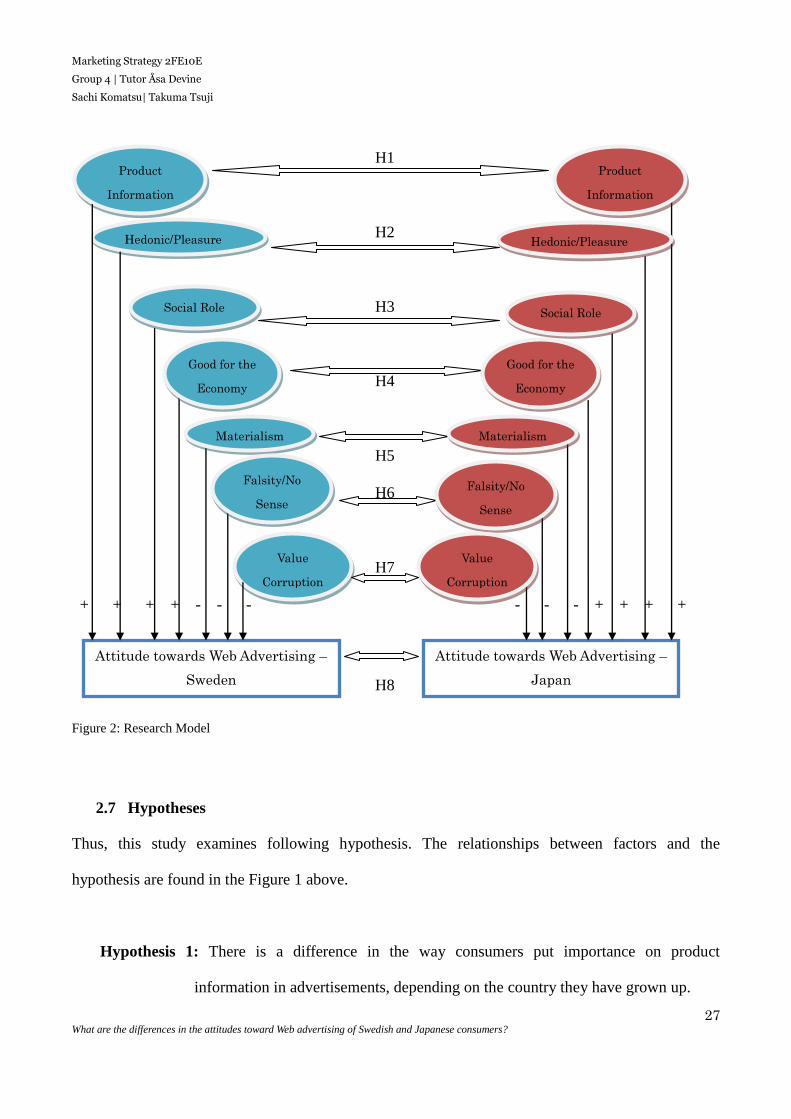
2.6 Proposed Research Model
As it has been discussed in chapter one, this study is to explain the differences in attitudes toward
Web advertising in a context of Sweden and Japan. The whole picture of the research model is
summarized in the Figure 2 on the next page. As the literature in the previous chapter shows, there
are seven belief factors that affects consumers’ attitude toward Web advertising. In addition to those
seven factors, this research attempts to reveal if consumers’ cultural backgrounds may lead to
differences in the way they put importance on different factors among the seven belief factors,
resulting in the differences in their attitudes toward Web advertising.
Page 29
Marketing Strategy 2FE10E
Group 4 | Tutor Åsa Devine
Sachi Komatsu| Takuma Tsuji
27 What are the differences in the attitudes toward Web advertising of Swedish and Japanese consumers?
H1
H2
H3
H4
H5
H6
H7
+ + + + - - - - - - + + + +
H8
Figure 2: Research Model
2.7 Hypotheses
Thus, this study examines following hypothesis. The relationships between factors and the
hypothesis are found in the Figure 1 above.
Hypothesis 1: There is a difference in the way consumers put importance on product
information in advertisements, depending on the country they have grown up.
Hedonic/Pleasure
Social Role
Value
Corruption
1
Product
Information
Attitude towards Web Advertising –
Sweden
Attitude towards Web Advertising –
Japan
Good for the
Economy
Materialism
Falsity/No
Sense
Product
Information
Hedonic/Pleasure
Social Role
Good for the
Economy
Falsity/No
Sense
Materialism
Value
Corruption
1
Page 30
Marketing Strategy 2FE10E
Group 4 | Tutor Åsa Devine
Sachi Komatsu| Takuma Tsuji
28 What are the differences in the attitudes toward Web advertising of Swedish and Japanese consumers?
Hypothesis 2: There is a difference in the way consumers put importance on hedonic factor of
advertisements, depending on the country they have grown up.
Hypothesis 3: There is a difference in the way consumers put importance on social role and
image factor of advertisements, depending on the country they have grown up.
Hypothesis 4: There is a difference in the way consumers put importance on good for the
economy factor of advertisements, depending on the country they have grown up.
Hypothesis 5: There is a difference in the way consumers put importance on materialism factor
of advertisements, depending on the country they have grown up.
Hypothesis 6: There is a difference in the way consumers put importance on falsity factor of
advertisements, depending on the country they have grown up.
Hypothesis 7: There is a difference in the way consumers put importance on value corruption
factor of advertisements, depending on the country they have grown up.
Hypothesis 8: There are different attitudes based on the countries consumers have grown up,
resulting from the differences in the mixture of the seven factors for each country.
Page 31
Marketing Strategy 2FE10E
Group 4 | Tutor Åsa Devine
Sachi Komatsu| Takuma Tsuji
29 What are the differences in the attitudes toward Web advertising of Swedish and Japanese consumers?
3 Methodology
This chapter discusses and justifies the authors’ choices for the methodological approaches
employed in the research. Starting from the discussion regarding research approach, choices for
research design, data sources, research strategy, data collection method, data collection instrument,
sampling, data analysis method, and quality criteria are presented with the reasons behind the
choices.
3.1 Research Approach
3.1.1 Inductive vs. Deductive Research
In the field of business research there are generally two ways of approach to draw a conclusion,
deductive and inductive approaches. In the deductive approach, researchers use existing theories and
ideas to draw a conclusion by conducting experiments based on hypothesizes (Ayalon and Even,
2013). On the other hand, in the inductive approach, researchers collect data and develop a theory
based on the data analysis (Saunders et al., 2009).
Consequently, this research will follow the form of the deductive approach. The primary
purpose of the research is dedicated to fulfill a lack of research in specific areas, more precisely
comparison between Japanese and Swedish consumers’ attitudes toward Web advertising. To
accomplish the objective, the authors have utilized and expanded existing theories and models to
apply to this specific case.
3.1.2 Qualitative vs. Quantitative
Ali and Birley (1999) argue that the term qualitative has no clear meaning and it can be rather
explained as a term, which covers various techniques (Ali and Birley, 1999). They also state that in
the use of qualitative research method, researchers try to describe, decode, and translate reality
through participation (Saunders et al., 2009). Therefore, the main focus is on respondents and their
Page 32
Marketing Strategy 2FE10E
Group 4 | Tutor Åsa Devine
Sachi Komatsu| Takuma Tsuji
30 What are the differences in the attitudes toward Web advertising of Swedish and Japanese consumers?
opinions and reactions. Thus research usually begins with questions and observations of the world
and then moves to more generalized and abstract ideas (Ibid.). On the other hand, quantitative
research method concerns more about actual numbers, such as frequency of occurrence, test score, or
even rental costs (Ibid.).
This study will solely be using the quantitative research approach. In order to achieve the
purpose of this research, to assess and compare differences in attitudes toward web advertising of
consumers from different countries, the authors have based this research on seven-belief factor
model created by Pollay and Mittal (1993). This model intended to quantitatively assess consumers’
attitudes toward Web advertising through seven belief factors. Considering the given nature of the
model, therefore, quantitative research approach would be the most suitable approach for this case.
3.2 Research Design
Research design helps a researcher to form an appropriate design for the chosen subject and the
purpose of his study. It soothes the operation of the study and is to ensure the researcher to be able to
collect empirical data through his study that is necessary to meet the purpose and to answer the
research question (Dhawan, 2010). According to Dhawan (2010), there are three main types of
research design; exploratory design, descriptive design, and causal design (Ibid.).
In exploratory research design, the main purpose of the study often lies in more exact problem
formulation. Thus, the emphasis for this type of research is in finding ideas and insights (Dhawan,
2010). If the study employs descriptive design, it tries to describe the characteristics of the subject to
study. In this type of research design, a researcher needs to have a clear definition of his subject to
study, and the study aims to gather complete data to picture the subject (Ibid.). Lastly, if a study takes
research design of hypothesis testing, it tries to see the fundamental relationships between variables
in the study and to explain if one variable causes the value of another. This type of study enables the
Page 33
Marketing Strategy 2FE10E
Group 4 | Tutor Åsa Devine
Sachi Komatsu| Takuma Tsuji
31 What are the differences in the attitudes toward Web advertising of Swedish and Japanese consumers?
researchers to have reduced bias, increased reliability for their research, and description of causality
(Ibid.).
Since their study aims to observe and obtain deeper understanding of attitudes toward Web
advertising of consumers from different countries, the main interest of the study is to picture the
consumers’ attitudes based on their culture. In addition, the authors conduct an intensive literature
review to get insights for the study from already existing studies. Thus, exploratory and descriptive
research design fits the best for the purpose of the study.
3.3 Data Sources
There are mainly two kinds of data that researchers should consider, primary and secondary. Primary
data are original data that are collected for the first time, and secondary data are those which have
already been collected by somebody else and have existed after the statistical process (Kothari, 2004).
A researcher needs to decide upon the main source of data used primarily in his or her research, so he
or she can make a choice between one and the other methods of collecting data for the research
accordingly (Ibid.).
One of the main advantages of the use of secondary data is the reduction in cost. Because
secondary data already exists, they are less expensive, and they would also save time for researchers
to conduct their study (Cowton, 1998). Other advantages include that they may help the researcher to
refine the research problem, to get background information, to find solution to the research problem,
and to find alternatives for the main research model (Bryman and Bell, 2007). On the other hand,
secondary data do have disadvantages that the data may lack availability and relevance and that the
data may be inaccurate. It may also be insufficient to use only secondary data for the research (Ibid.).
Knowing these advantages and disadvantages of secondary data, the authors’ primary choice of
data source is to use primary data mainly. Although they have been using secondary data to get
insights and to provide theoretical background for their research, the main focus of the research is
Page 34
Marketing Strategy 2FE10E
Group 4 | Tutor Åsa Devine
Sachi Komatsu| Takuma Tsuji
32 What are the differences in the attitudes toward Web advertising of Swedish and Japanese consumers?
going to be centered on the use of primary data collected through their data collection methods
(which is described in later subsections of this chapter). The main reason behind their choice of using
primary data is that the use of primary data allows the author to obtain up-to-date and specific
information needed for their research (Bryman and Bell, 2007). Even though the authors are aware of
the disadvantages of using primary data, which are high costs requirements and its time consuming
nature (Ibid.), those disadvantages can be minimized, thus, the advantages outdo the disadvantages to
the authors.
3.4 Research Strategy
There are five main categories of research strategies available to researchers. Those are experiment,
survey, archival analysis, history, and case study. Table 2 below summarizes the characteristics and
requirements of each research strategy. The first one in the Table 2, experiment, aims at confirming,
falsifying, or establishing the validity of hypothesis by making changes to one or more variables to
see the differences (Bryman and Bell, 2007). However, this strategy is not really common in business
research due to the requirement for control over the behavioral events as it is shown in the table. In
history strategy, the fourth item in the table, a researcher gathers and analyzes historical sources
(Ibid.), but he does not put its focus on contemporary events; thus it is not a common choice in
business research, either.
The rest of three options, survey, archival analysis, and case study, are common choices
available to business researchers. Survey is the sampling of people in the population, and it aims to
make statistical conclusions about the population (Bryman and Bell, 2007). Meanwhile, a researcher
studies documents or archives of the unit he or she is analyzing (Ibid.). The last option in the table,
case study, is also a careful observation of an individual entity or person, which focuses on
developing deeper study rather than studying broad number of events (Cowton, 1998). Among those
three options, the authors take survey with online questionnaire as their research strategies. The
Page 35
Marketing Strategy 2FE10E
Group 4 | Tutor Åsa Devine
Sachi Komatsu| Takuma Tsuji
33 What are the differences in the attitudes toward Web advertising of Swedish and Japanese consumers?
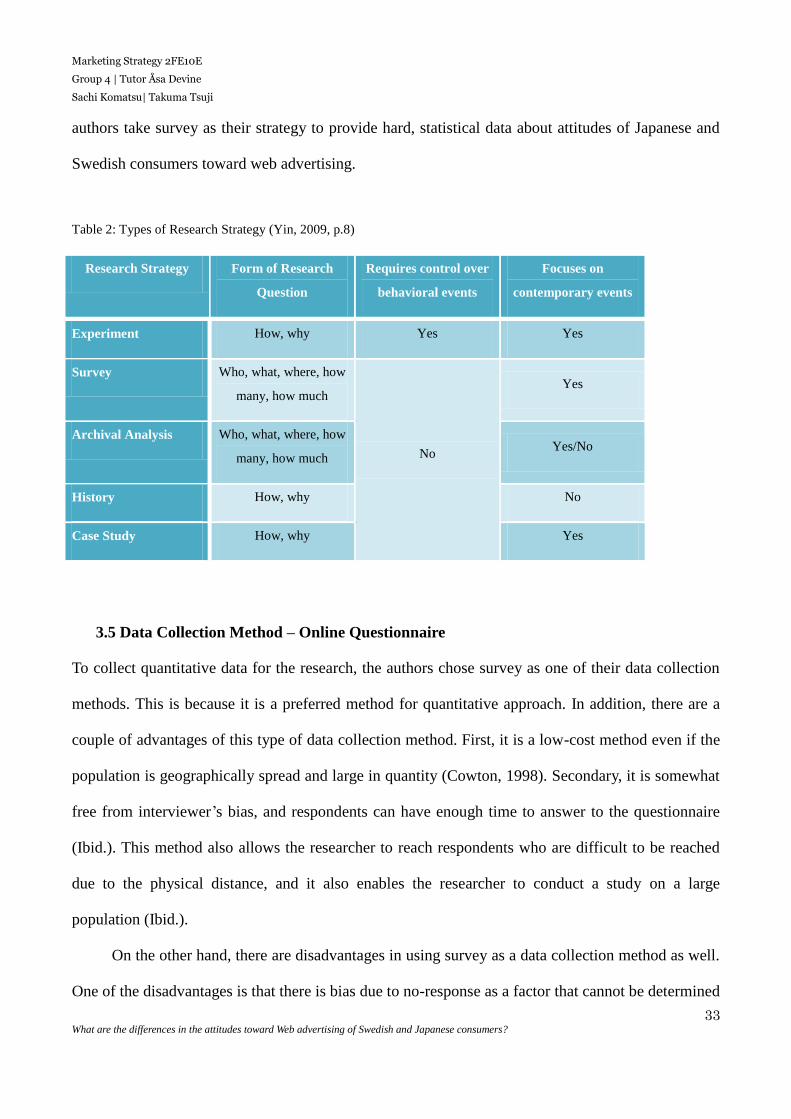
authors take survey as their strategy to provide hard, statistical data about attitudes of Japanese and
Swedish consumers toward web advertising.
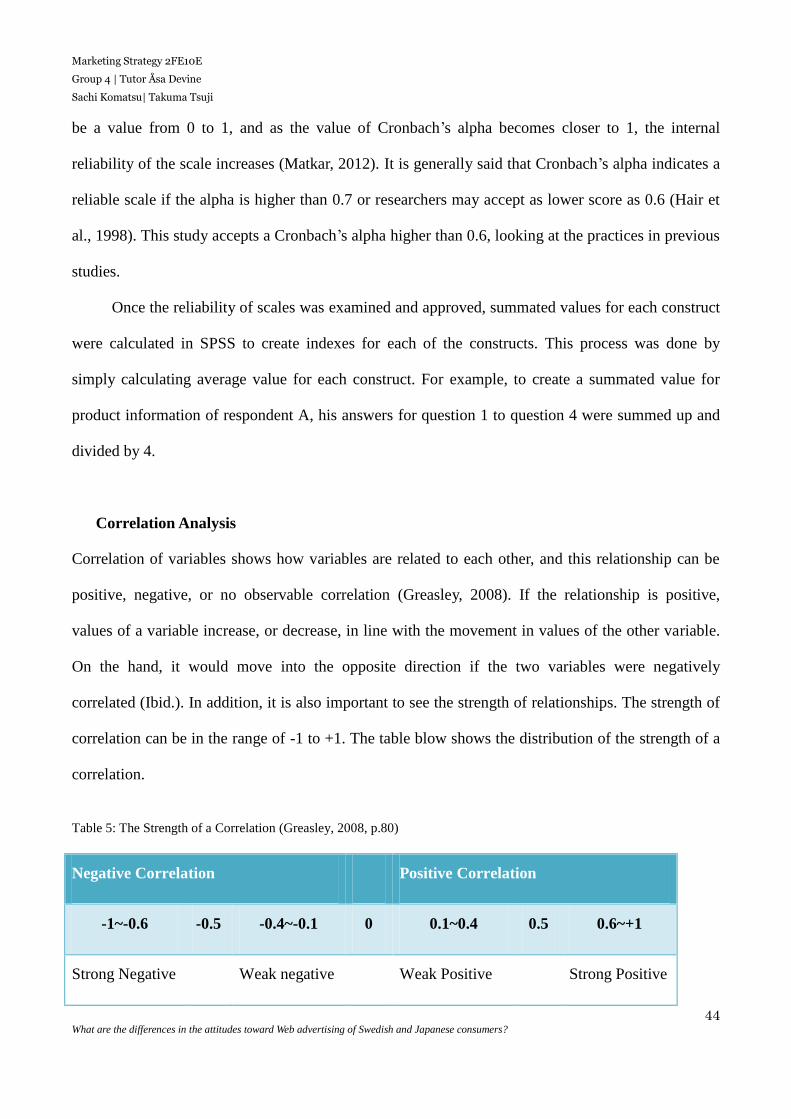
Table 2: Types of Research Strategy (Yin, 2009, p.8)
3.5 Data Collection Method – Online Questionnaire
To collect quantitative data for the research, the authors chose survey as one of their data collection
methods. This is because it is a preferred method for quantitative approach. In addition, there are a
couple of advantages of this type of data collection method. First, it is a low-cost method even if the
population is geographically spread and large in quantity (Cowton, 1998). Secondary, it is somewhat
free from interviewer’s bias, and respondents can have enough time to answer to the questionnaire
(Ibid.). This method also allows the researcher to reach respondents who are difficult to be reached
due to the physical distance, and it also enables the researcher to conduct a study on a large
population (Ibid.).
On the other hand, there are disadvantages in using survey as a data collection method as well.
One of the disadvantages is that there is bias due to no-response as a factor that cannot be determined
Research Strategy Form of Research
Question
Requires control over
behavioral events
Focuses on
contemporary events
Experiment How, why Yes Yes
Survey Who, what, where, how
many, how much
No
Yes
Archival Analysis Who, what, where, how
many, how much Yes/No
History How, why No
Case Study How, why Yes
Page 36
Marketing Strategy 2FE10E
Group 4 | Tutor Åsa Devine
Sachi Komatsu| Takuma Tsuji
34 What are the differences in the attitudes toward Web advertising of Swedish and Japanese consumers?
in advance, and this method is only available as an option when the respondents are educated and
willing to cooperate (Cowton, 1998). Furthermore, the control over the questionnaire is low once it is
sent to the respondents, and flexibility is built in the questionnaire itself (Ibid.). What is more, slow
nature of the method, difficulty to identify representative respondents, and risk for unclear replies are
the others of disadvantages that should be noticed (Ibid.).
3.6 Data Collection Instrument Design
3.6.1 Operationalization and Measurement of Variables
Operationalization can be described as a process of defining vague concepts in order to make the
concept measurable in form of variables composing of specific observation (Bryman and Bell, 2007).
They also mention steps required for successful operationalization: Theoretical insights Define
key variables Provide operational definition of key variables Find and list potential measures
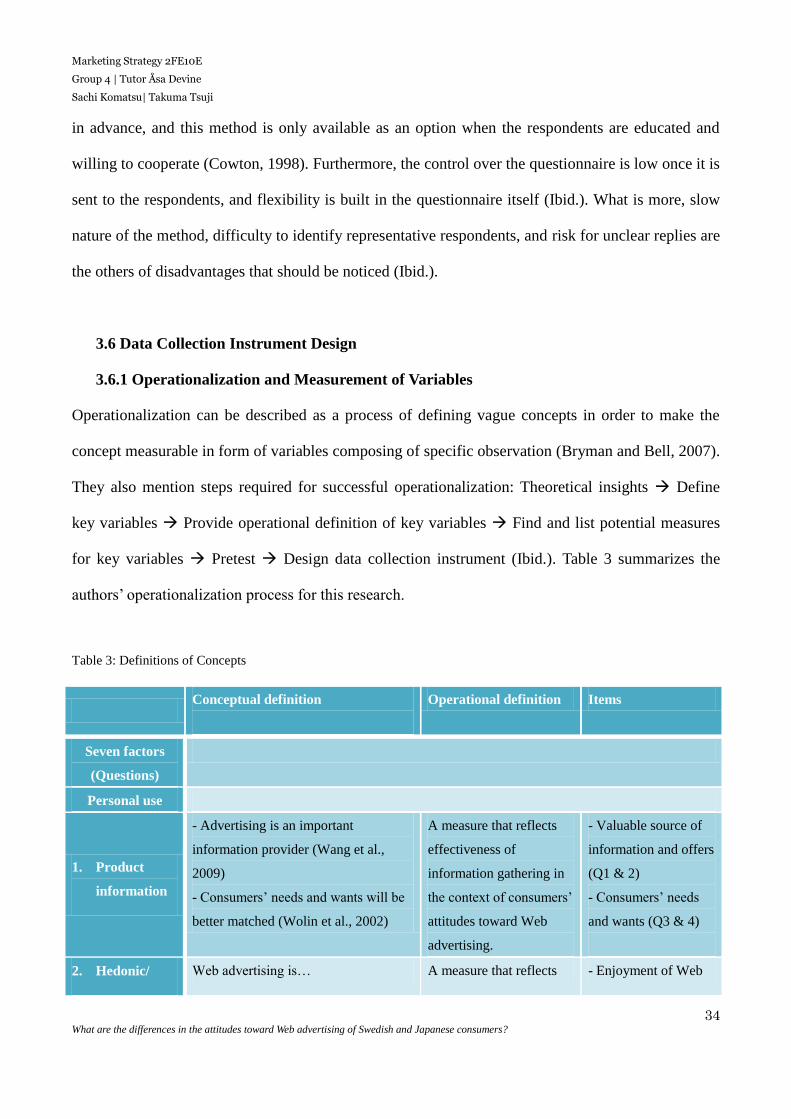
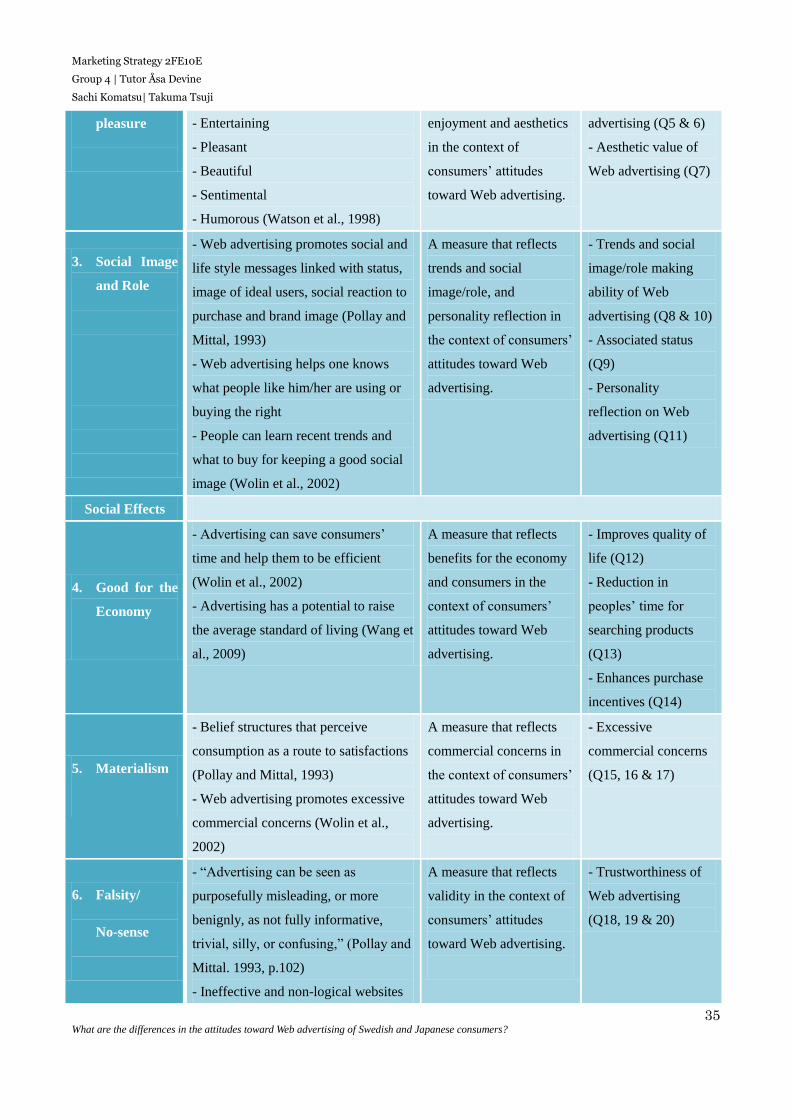
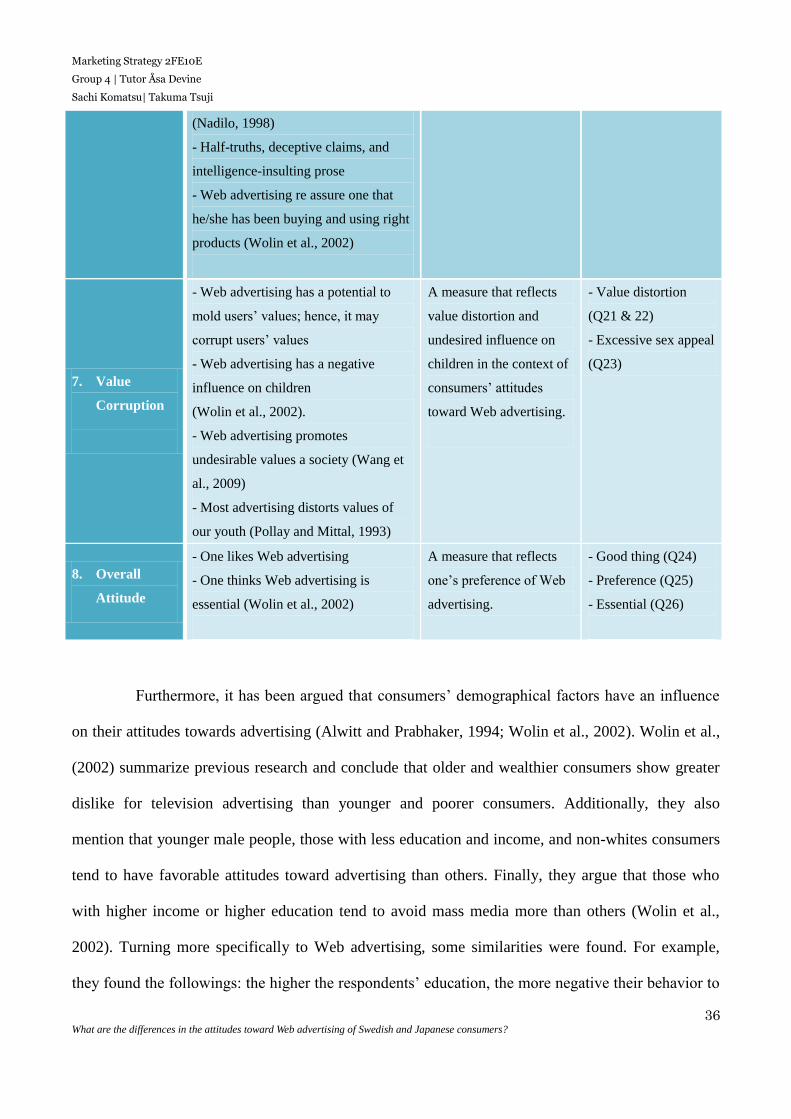
for key variables Pretest Design data collection instrument (Ibid.). Table 3 summarizes the
authors’ operationalization process for this research.
Table 3: Definitions of Concepts
Conceptual definition
Operational definition Items
Seven factors
(Questions)
Personal use
1. Product
information
- Advertising is an important
information provider (Wang et al.,
2009)
- Consumers’ needs and wants will be
better matched (Wolin et al., 2002)
A measure that reflects
effectiveness of
information gathering in
the context of consumers’
attitudes toward Web
advertising.
- Valuable source of
information and offers
(Q1 & 2)
- Consumers’ needs
and wants (Q3 & 4)
2. Hedonic/ Web advertising is… A measure that reflects - Enjoyment of Web
Page 37
Marketing Strategy 2FE10E
Group 4 | Tutor Åsa Devine
Sachi Komatsu| Takuma Tsuji
35 What are the differences in the attitudes toward Web advertising of Swedish and Japanese consumers?
pleasure
- Entertaining
- Pleasant
- Beautiful
- Sentimental
- Humorous (Watson et al., 1998)
enjoyment and aesthetics
in the context of
consumers’ attitudes
toward Web advertising.
advertising (Q5 & 6)
- Aesthetic value of
Web advertising (Q7)
3. Social Image
and Role
- Web advertising promotes social and
life style messages linked with status,
image of ideal users, social reaction to
purchase and brand image (Pollay and
Mittal, 1993)
- Web advertising helps one knows
what people like him/her are using or
buying the right
- People can learn recent trends and
what to buy for keeping a good social
image (Wolin et al., 2002)
A measure that reflects
trends and social
image/role, and
personality reflection in
the context of consumers’
attitudes toward Web
advertising.
- Trends and social
image/role making
ability of Web
advertising (Q8 & 10)
- Associated status
(Q9)
- Personality
reflection on Web
advertising (Q11)
Social Effects
4. Good for the
Economy
- Advertising can save consumers’
time and help them to be efficient
(Wolin et al., 2002)
- Advertising has a potential to raise
the average standard of living (Wang et
al., 2009)
A measure that reflects
benefits for the economy
and consumers in the
context of consumers’
attitudes toward Web
advertising.
- Improves quality of
life (Q12)
- Reduction in
peoples’ time for
searching products
(Q13)
- Enhances purchase
incentives (Q14)
5. Materialism
- Belief structures that perceive
consumption as a route to satisfactions
(Pollay and Mittal, 1993)
- Web advertising promotes excessive
commercial concerns (Wolin et al.,
2002)
A measure that reflects
commercial concerns in
the context of consumers’
attitudes toward Web
advertising.
- Excessive
commercial concerns
(Q15, 16 & 17)
6. Falsity/
No-sense
- “Advertising can be seen as
purposefully misleading, or more
benignly, as not fully informative,
trivial, silly, or confusing,” (Pollay and
Mittal. 1993, p.102)
- Ineffective and non-logical websites
A measure that reflects
validity in the context of
consumers’ attitudes
toward Web advertising.
- Trustworthiness of
Web advertising
(Q18, 19 & 20)
Page 38
Marketing Strategy 2FE10E
Group 4 | Tutor Åsa Devine
Sachi Komatsu| Takuma Tsuji
36 What are the differences in the attitudes toward Web advertising of Swedish and Japanese consumers?
Furthermore, it has been argued that consumers’ demographical factors have an influence
on their attitudes towards advertising (Alwitt and Prabhaker, 1994; Wolin et al., 2002). Wolin et al.,
(2002) summarize previous research and conclude that older and wealthier consumers show greater
dislike for television advertising than younger and poorer consumers. Additionally, they also
mention that younger male people, those with less education and income, and non-whites consumers
tend to have favorable attitudes toward advertising than others. Finally, they argue that those who
with higher income or higher education tend to avoid mass media more than others (Wolin et al.,
2002). Turning more specifically to Web advertising, some similarities were found. For example,
they found the followings: the higher the respondents’ education, the more negative their behavior to
(Nadilo, 1998)
- Half-truths, deceptive claims, and
intelligence-insulting prose
- Web advertising re assure one that
he/she has been buying and using right
products (Wolin et al., 2002)
7. Value
Corruption
- Web advertising has a potential to
mold users’ values; hence, it may
corrupt users’ values
- Web advertising has a negative
influence on children
(Wolin et al., 2002).
- Web advertising promotes
undesirable values a society (Wang et
al., 2009)
- Most advertising distorts values of
our youth (Pollay and Mittal, 1993)
A measure that reflects
value distortion and
undesired influence on
children in the context of
consumers’ attitudes
toward Web advertising.
- Value distortion
(Q21 & 22)
- Excessive sex appeal
(Q23)
8. Overall
Attitude
- One likes Web advertising
- One thinks Web advertising is
essential (Wolin et al., 2002)
A measure that reflects
one’s preference of Web
advertising.
- Good thing (Q24)
- Preference (Q25)
- Essential (Q26)
Page 39
Marketing Strategy 2FE10E
Group 4 | Tutor Åsa Devine
Sachi Komatsu| Takuma Tsuji
37 What are the differences in the attitudes toward Web advertising of Swedish and Japanese consumers?
Web advertising and income level has the same effect as it does in regard to traditional means of
advertising. These indicate that the original model can be applied to Web advertising as well.
Therefore, in addition to the seven factors, measurements for some of demographical data, such as
nationality, age, and average amount of time spent online per day have been added to the
questionnaire.
Taking the above-mentioned characteristics into account, the research is based on quantitative
data collected through questionnaires, which measure consumers’ attitudes based on seven belief
factors. To make a most suitable questionnaire for this research, the authors had modified and
expanded a previously used questionnaire created by Wolin et al. (2002).
3.6.2 Questionnaire Design
When the authors were constructing the questions for this specific research, some of the previous
studies in consumers’ beliefs, attitudes, and behavior toward advertising were reviewed carefully (e.g.
Pollay and Mittal, 1993; Wolin et al., 2002; Wang et al., 2009). Based on the previous studies and
the questionnaires used in those studies, in the end the online questionnaire used for the research
consisted of 29 questions.
Among all, 23 questions were designed to measure the seven-belief factors – product
information, hedonic/pleasure, social role and image, good for the economy, value corruption,
materialism, falsity/no sense - that form respondents’ beliefs about Web advertising. The next three
questions were designed to measure the respondents’ overall attitudes toward Web advertising.
Finally, the rest of the three questions were asked to collect respondents’ demographic information,
such as their country, their age, and amount of time they spend online per day on average. Beside the
last three question, all questions were asked on a seven-point scale of (1) strongly disagree to (7)
strongly agree. 5-point scale and 7-point scale are said to be comparable, therefore, this study is
Page 40
Marketing Strategy 2FE10E
Group 4 | Tutor Åsa Devine
Sachi Komatsu| Takuma Tsuji
38 What are the differences in the attitudes toward Web advertising of Swedish and Japanese consumers?
expected to be comparable with the previous studies, which have been using either 5-point or 7-point
Likert scales (Colman et al., 1997).
3.6.3 Pretesting
When collecting data through questionnaires, researchers need to conduct a pretest in order to refine
a questionnaire that they are going to use. By doing so, they will be able to assure that respondents
will understand the questionnaire in the way that researchers intended to and there will be no
problem in recording acquired data (Saunders et al., 2009). In addition, it also helps researchers to
have some assessment of questions’ validity and reliability of the data (Ibid.).
For the research, a series of pretests were conducted before the online questionnaires were
carried out. The procedure can be summarized into two steps. First of all, the authors have tested
their English version of questionnaire on a senior lecturer at Linnaeus University in Sweden. The
primary reasons for asking a senior lecturer was to make sure that questions used were appropriate,
understandable, and, well reflecting their operationalization of the concepts used. Second, the
translated versions of questionnaire were tested on randomly chosen five Swedish and five Japanese
consumers (translation validity is discussed in 4.9.1). The main focus of the second pretest was to
make sure that all questions were understandable to anybody, as it was assumed that the levels of
respondents’ background knowledge of the research topic would vary to some extent. On that
account, the questions’ validity and reliability, especially wording and phrasing in Swedish and
Japanese, were carefully confirmed through the second pretest.
Page 41
Marketing Strategy 2FE10E
Group 4 | Tutor Åsa Devine
Sachi Komatsu| Takuma Tsuji
39 What are the differences in the attitudes toward Web advertising of Swedish and Japanese consumers?
3.7 Sampling
Briefly there are two kinds of surveys for collecting data for research: census and sampling surveys.
In general, whatever a research purpose is, researchers need to decide whether they are going to use
census or sampling survey when collecting data. Census survey aims to collect and analyze data from
every possible case or group member, whereas sampling survey provides ways that enable
researchers to reduce the amount of data needed to collect by considering only data from a sub-group
rather than entire possible cases or elements (Saunders et al., 2009). Even though census survey can
be more accurate than sampling survey, it cannot be used in many studies. In many studies, it may be
impossible to collect and analyze all available data, due to limited time, money and even access to
entire elements (Ibid.). In that regard, sampling survey requires less cost comparing to census survey.
In fact, if the selection of samplings has conducted successfully, sampling survey can reduce the
amount of time and even money needed for conducting, as the total number of respondents becomes
relatively small. In addition, due to its smaller number of respondents, researchers are able to acquire
more detailed information than census survey can (Ibid.).
The authors had chosen to conduct sampling surveys for the research after examining both
advantages and disadvantages of each survey strategy. The selected survey strategy, sampling survey,
was believed to be most suitable and reasonable for this research over census survey strategy. Some
research showed that, in 2010, 79% of Japanese population and 85% of Swedish population had an
access to the Internet (MPHPT_2012; Olle Findahl, 2010). With the vast numbers of Internet users in
Japan and Sweden, it will be highly costly and impossible to conduct census surveys in Japan and
Sweden. Therefore, census survey strategy was eliminated from the possibilities.
Page 42
Marketing Strategy 2FE10E
Group 4 | Tutor Åsa Devine
Sachi Komatsu| Takuma Tsuji
40 What are the differences in the attitudes toward Web advertising of Swedish and Japanese consumers?
3.7.1 Sampling Frame
In Japan, more than 96% of the young people (13-29 years old) frequently used the Internet in 2010
(MPHPT_2012). However, the freaquency of the use of the Internet became less frequent as the
sampled segments become older. For instance, 94.9% of those who are aged between 40-49 years old
used the Internet in 2010 and it even declined to 86.1% between 50-59 years old people
(MPHPT_2012, p.8). A similar pattern can be seen from Swedish people as well, showing that
Swedish people aged between 16 and 24 years old use the Internet more often than other segments
(Olle Findahl, 2010). Thus, it can be said that younger people are the ones that face Web advertising
most frequently both in Japan and Sweden. On that account, the researchers have decided that the
questionnaires should mainly aim for Japanese and Swedish university students, assuming that the
chosen samples would be well representing the majority of Swedish and Japanese Internet users.
Detailed discussion of the procedure used for distributing the questionnaires is presented in the
following section.
3.7.2 Sample Selection and Data Collection Procedure
For both qualitative and quantitative research method, there is no definite answer when it comes to
the sample size. Rather, it is depending on a number of considerations, time, and costs (Bryman and
Bell, 2007). Therefore, to make a right decision about the sample size, researchers need to take these
considerations into account. When deciding the sample size, the authors had looked at some of the
previous research conducted by Wolin et al. (2002) and Wang et al. (2009) because the questioner
used in this research was based on the questionnaires used in previous studies. In above-mentioned
studies, researchers used paper and pencil surveys and personal interviews to acquire the data.
However, because of some limitations, the authors had decided to distribute the questionnaires via
Page 43
Marketing Strategy 2FE10E
Group 4 | Tutor Åsa Devine
Sachi Komatsu| Takuma Tsuji
41 What are the differences in the attitudes toward Web advertising of Swedish and Japanese consumers?
‘Google document’. There are mainly two reasons why it was chosen for this specific study.
Comparing to paper and pencil survey, first, online questionnaires are able to reduce the amount of
time required for conducting questionnaires and actually collecting data. Since the time limitation
was one of critical concerns that authors faced, this factor was taken into consideration. Second, it
enables researchers to have an access to remotely located respondents. Especially, as the
questionnaires were aiming for consumers in two different countries, Sweden and Japan in this study,
the authors considered this method to be more suitable than paper and pencil survey. With all this
said, some of the concerns about online questionnaires were considered beforehand. Bryman and
Bell (2007) argues the following issues:
- Not everyone has an access to the Internet and has a technical ability to handle the
questionnaires.
- Many people have more than one e-mail address
- A household may have a one computers but several users
- Internet users are a biased sample of the population, in that they tend to be better educated,
wealthier, younger, and not representative in ethnic terms (Couper, 2000 in Bryman and Bell,
2007)
After concerning the issues mentioned above, the authors still believed that online questionnaires
would be best suited to the topic of this research instead of previously used methods. First of all, as
mentioned in the previous section, targeted samples were highly assumed to have an Internet access,
considering the fact that approximately 95% of youth had an access to the Internet in 2010 both in
Japan and Sweden (MPHPT_2012; Olle Findahl, 2010). In this research, the questionnaires used
were aiming for these people. In turn, respondents were also assumed to have an ability to handle
online questionnaires. Therefore, the authors expected that some of the concerns would not really
hinder the process. Further, use of Google document can solve some other issues. Regarding the
issues mentioned above, for instance, researchers do not need to reach respondents’ e-mail addresses,
Page 44
Marketing Strategy 2FE10E
Group 4 | Tutor Åsa Devine
Sachi Komatsu| Takuma Tsuji
42 What are the differences in the attitudes toward Web advertising of Swedish and Japanese consumers?
since it takes a form of self-completion survey. Researchers can simply present a URL and have
respondents reach the questionnaires by themselves. Therefore, the whole process can be simpler for
both researchers and respondents.
In the first place, to draw attentions from Swedish and Japanese students, the questionnaires
were posted on Facebook pages that are related to Japanese and Swedish universities. Additionally,
the questionnaires were sent out to Japanese students at Kansaigaidai University in Japan with the
help of university personnel. In this way, the questionnaire was open to public for 12 days. In the end,
275 respondents answered the questionnaires (160 Japanese and 115 Swedish). The details of the
respondents will be discussed in the later chapter.
3.8 Data Analysis Method
The authors are going to analyze the data, using statistical software, SPSS (Statistical Package for the
Social Sciences). SPSS is one of the most commonly used software to conduct quantitative analyses,
which is available to researchers (Greasley, 2008). An analysis using SPSS takes a several steps: data
coding, data entry, descriptive statistics, reliability test, correlation analysis, and hypothesis testing.
The authors were to follow the steps to display the data and complete their analysis on the data they
collect through the survey.
Data Coding
After the process of questionnaire design, each question in the questionnaire needs to be coded to
enable the analyses using SPSS. As it is shown in the operationalization table in 4.6.1, each question
from question 1 to 26 is supposed to measure a construct in the research model, and either three or
four questions together are to measure each of the constructs. Question 27, 28, and 29 are to gather
personal information of the respondents. The authors have coded all the questions with abbreviations
Page 45
Marketing Strategy 2FE10E
Group 4 | Tutor Åsa Devine
Sachi Komatsu| Takuma Tsuji
43 What are the differences in the attitudes toward Web advertising of Swedish and Japanese consumers?
of the names of the constructs such as “PRODINFO” for product information factor and “HDNC”
for hedonic factor (See Table 4 in the appendix for all the codes).
Data Entry
Using the Form functions in Google Documents, it is possible to save the responses for each version
of the questionnaire in spreadsheets automatically. Two spreadsheets, one for Japanese and the other
for Swedish respondents, are created, and the responses for each country are saved separately. After
the collection of data, the authors have entered the data in to SPSS by copying and pasting the data
from spreadsheets to minimize the chances of errors in data entry. The answers for question 18
(FALS1neg), however, were reversed manually after copying the data because it was a reverse-scaled
question.
Descriptive Statistics
After coding and entering the data, the authors are going to make descriptive statistics on SPSS for
the data they are going to analyze. Descriptive statistics with frequency command produces tables
that show frequencies for the data and measures of central trend (Greasley, 2008). For example,
using descriptive statistics, it is possible to obtain and display statistics for such values as frequencies,
mean values, median values, standard deviations, and minimum and maximum values.
Reliability Test
After obtaining basic information on the data set using descriptive statistics, reliability test is to be
done to make sure that the scale applied in the survey is reliable. Cronbach’s alpha is to be calculated
using the reliability analysis command for this purpose. The authors chose Cronbach’s alpha as their
choice of measure of reliability because it is a common measure of internal reliability when the
questions in the survey are multiple Likert questions (Laerd Statistics_2013). Cronbach’s alpha can
Page 46
Marketing Strategy 2FE10E
Group 4 | Tutor Åsa Devine
Sachi Komatsu| Takuma Tsuji
44 What are the differences in the attitudes toward Web advertising of Swedish and Japanese consumers?
be a value from 0 to 1, and as the value of Cronbach’s alpha becomes closer to 1, the internal
reliability of the scale increases (Matkar, 2012). It is generally said that Cronbach’s alpha indicates a
reliable scale if the alpha is higher than 0.7 or researchers may accept as lower score as 0.6 (Hair et
al., 1998). This study accepts a Cronbach’s alpha higher than 0.6, looking at the practices in previous
studies.
Once the reliability of scales was examined and approved, summated values for each construct
were calculated in SPSS to create indexes for each of the constructs. This process was done by
simply calculating average value for each construct. For example, to create a summated value for
product information of respondent A, his answers for question 1 to question 4 were summed up and
divided by 4.
Correlation Analysis
Correlation of variables shows how variables are related to each other, and this relationship can be
positive, negative, or no observable correlation (Greasley, 2008). If the relationship is positive,
values of a variable increase, or decrease, in line with the movement in values of the other variable.
On the hand, it would move into the opposite direction if the two variables were negatively
correlated (Ibid.). In addition, it is also important to see the strength of relationships. The strength of
correlation can be in the range of -1 to +1. The table blow shows the distribution of the strength of a
correlation.
Table 5: The Strength of a Correlation (Greasley, 2008, p.80)
Negative Correlation Positive Correlation
-1~-0.6 -0.5 -0.4~-0.1 0 0.1~0.4 0.5 0.6~+1
Strong Negative Weak negative Weak Positive Strong Positive
Page 47
Marketing Strategy 2FE10E
Group 4 | Tutor Åsa Devine
Sachi Komatsu| Takuma Tsuji
45 What are the differences in the attitudes toward Web advertising of Swedish and Japanese consumers?
Generally speaking, any values of correlation above 0.5, either negative or positive, imply strong
correlations. However, if the value is getting closer to zero, it means there is a lack of strong
relationship between variables, which indicates a low or no correlation between the two variables
(Greasley, 2008).
Pearson’s r is one of the methods to see the correlation of variables, and the bivariate
correlations function in SPSS is used to obtain Pearson’s r in this study (Bryman and Bell, 2007).
This function enables researchers to obtain Pearson correlation and 2-tailed significance score.
Pearson correlation, which is shown by Pearson’s r in a result of this correlation analysis, is an
indication of how strong the relationship between the variables is, and the significance score shows
how statistically significant the computed Pearson’s r is (Ibid.).
Hypothesis Testing with T-tests
There are some means of carrying hypothesis tests out when researchers want to see the differences
between two constructs. There are two kinds of data, independent and related samples. If the samples
are provided by the same people, those are related samples. However, if it is not the case, the
samples are independent samples (Greasley, 2008). Thus, the authors have chosen
independent-samples t-test as their mean to test their hypotheses. Independent-samples t-test makes
comparison between the means of two non-related groups on the same variable (Laerd
Statistics_T-test_2013). In this study, hypotheses were tested with the conventional level of
statistical significance for business research, which were to accept significance score lower than 0.05.
Page 48
Marketing Strategy 2FE10E
Group 4 | Tutor Åsa Devine
Sachi Komatsu| Takuma Tsuji
46 What are the differences in the attitudes toward Web advertising of Swedish and Japanese consumers?
If the significance score was lower than 0.05, hypothesis tested was accepted (Bryman and Bell,
2007).
3.9 Quality Criteria
3.9.1 Validity
Content validity, or face validity, refers to the degree to which a measurement instrument measures
what it is planned to measure (Bryman and Bell, 2007). To make sure that they keep this validity of
their research, the authors have asked their tutor, who is a senior lecturer at business and economics
department of Linnaeus University in Sweden, to review the content of the questionnaire. They have
also applied the already established theoretical model, which has been tested and used for a several
times by different researchers again and again. The authors have also done a small-scale pretest
before they started sending out the questionnaires. When the authors translated the original copy of
the questionnaire in English into Swedish and Japanese, they have asked a professor and a senior
lecturer to review their translations for each language at business and economics department of
Linnaeus University in Sweden. They have also asked some of their Japanese friends and Swedish
friends to check the use of language in the translations of questionnaire.
The construct validity is the extent to which an operationalization of a study examines the
concepts, which it is supposed to assess. This is to make sure that the hypotheses are tested with
appropriate theories that are significant to the concepts (Bryman and Bell, 2007). To ensure that they
hold this kind of validity for their study, the authors were going to run a correlation analysis on SPSS
before they moved onto the hypotheses testing. This was to avoid having constructs that were
correlating too much each other.
Page 49
Marketing Strategy 2FE10E
Group 4 | Tutor Åsa Devine
Sachi Komatsu| Takuma Tsuji
47 What are the differences in the attitudes toward Web advertising of Swedish and Japanese consumers?
To confirm that they hold criterion validity, or concurrent validity, a researcher should have
criteria that are important and related to the concepts tested. This kind of validity refers to the degree
to which the operationalization the authors employ in their study is able to predict other constructs
and performs as projected in relation to other variables (Bryman and Bell, 2007). This validity was
kept in this study by running statistical hypothesis testing.
3.9.2 Reliability
Reliability deals with the consistency of variables at basic level, and there are a few meanings of the
word (Bryman and Bell, 2007). One of the meanings of the term is the stability, which refers to the
consistency of a measure over repeated or replicated occasions. The second essence of reliability is
the internal reliability, and this is to ensure that all the measurement items are relating to the same
thing that we plan to assess (Ibid.). Reliability of this study was to be assessed by the reliability
analysis on SPSS by looking at the Cronbach’s alpha. Cronbach’s alpha is a common measure of
reliability for the surveys employing such system as multiple Likert questions, and it shows how
questions in the questionnaire are related to each other among the answers from different respondents
(Laerd Statistics_2013). The alpha was used to examine the internal reliability of the study for the
further analysis.
3.10 Chapter Summary
In this chapter, the authors’ choices on methodological approaches for the current study have been
presented and justified. This chapter has explained how the choices are chosen to fulfil the purpose
and to answer the research question. The Table 6 on the next page summarizes all the choices
presented in this chapter.
Page 50
Marketing Strategy 2FE10E
Group 4 | Tutor Åsa Devine
Sachi Komatsu| Takuma Tsuji
48 What are the differences in the attitudes toward Web advertising of Swedish and Japanese consumers?
Table 6: Summary of Research Methodology
Summary of Research Methodology
Research Approach Deductive and quantitative
Research Design Exploratory and descriptive
Data Sources Primary
Research Strategy Survey
Data Collection Method Online Questionnaire
Data Collection
Instrument
Sampling survey: Online questionnaire with 29 7-point Likert scale questions
on Swedish and Japanese consumers
Sampling Japanese and Swedish consumers who are mostly university students
Data Analysis Method Quantitative data analysis using SPSS: Data coding, data entry, descriptive
statistics, reliability test, correlation analysis, and hypothesis testing (t-test)
Quality Criteria Validities (content validity, construct validity, and criterion validity) and
Reliability
Page 51
Marketing Strategy 2FE10E
Group 4 | Tutor Åsa Devine
Sachi Komatsu| Takuma Tsuji
49 What are the differences in the attitudes toward Web advertising of Swedish and Japanese consumers?
4. Survey Results
In this chapter, the result of survey is presented. The result is presented in accordance with the data
analysis method presented in chapter three. Descriptive statistics reveal the general picture of the
result, and reliability test and correlation analysis follow to show details of the survey result. The
result of hypothesis follows after the presentation of the above in the last section of this chapter.
4.1 Descriptive Statistics
The table 7 in appendix shows the whole result of descriptive statistics. The mean and median value
for some items (look Table 3 in chapter 3 for the factors and question numbers in the questionnaire)
appears to be quite similar for both countries. For example, the mean and median values of the items
for Product Information factor are quite similar between the two countries. The values of standard
deviations for this factor also display the similarity between the two countries. On the other hand,
some items, such as Hedonic 2, Social Role 1, Materialism 1, Materialism 3, and Value Corruption 3,
appear to have greater differences than the others in the mean and median values. Moreover, the
differences in the standard deviations of the two countries indicate another difference between the
two countries. For instance, standard deviation for Product Information 1 among the Swedish
respondents is as low as 0.544, while the one among Japanese respondents is 1.018. This shows how
the answers for the question differ among the respondents of each country, and the greater value of
standard deviation for Japanese respondents show that the answers vary more than the ones of
Swedish respondents.
4.2 Reliability Test
As it has been explained in chapter three, reliability of the scale in this study is measured by
Cronbach’s alpha using SPSS. As a result of the reliability test, we obtained the value of Cronbach’s
Alpha as the table 8 on the next page shows. Using the bottom line of 0.6, as it has been discussed in
Page 52
Marketing Strategy 2FE10E
Group 4 | Tutor Åsa Devine
Sachi Komatsu| Takuma Tsuji
50 What are the differences in the attitudes toward Web advertising of Swedish and Japanese consumers?
the methodology chapter, some constructs in the research model such as Product Information,
Hedonic, Social Role, Value Corruption, and Attitude held acceptable levels of reliability. Rounding
off to two decimal places, Good for Economy and Materialism construct keeps levels of reliability
which can be considered as acceptable. The result of reliability test for Falsity factor, however,
shows a significantly low value of Cronbach’s alpha. As the alpha is used to test the internal
reliability, this result denotes a low internal reliability of Falsity scale (Bryman and Bell, 2007).
Table 8: Reliability Test – Cronbach’s alpha
Items
Sweden Japan
Cronbach's
Alpha
Cronbach's
Alpha Based on
Standardized
Items
Cronbach's
Alpha
Cronbach's
Alpha Based on
Standardized
Items
Product Information 0.774 0.728 0.638 0.597
Hedonic 0.628 0.632 0.683 0.684
Social Role 0.749 0.751 0.704 0.703
Good for Economy 0.691 0.708 0.554 0.562
Materialism 0.584 0.587 0.613 0.616
Falsity 0.027 0.045 0.260 0.250
Value Corruption 0.711 0.712 0.644 0.645
Attitude 0.875 0.876 0.802 0.812
The possible reasons for a low value of Cronbach’s alpha are a small number of questions to
measure the construct, poor inter-correlation among items or heterogeneous constructs (Tavakol and
Dennick, 2011). The inter-item correlations among the items of Falsity factor are low as the table 9
Page 53
Marketing Strategy 2FE10E
Group 4 | Tutor Åsa Devine
Sachi Komatsu| Takuma Tsuji
51 What are the differences in the attitudes toward Web advertising of Swedish and Japanese consumers?
below shows. The result of reliability test shows that the Cronbach’s alpha would remain lower than
the acceptable level even if any of the three items for Falsity construct have been deleted (See Table
10 below). This may be showing that questions were not understood by the respondents well or the
factor was not relevant to the countries in the context of this study. Above data led the authors to a
conclusion that the factor was not applicable to the case of this study, and Falsity factor is discarded
in the further analysis because the reliability for this factor cannot be ensured.
Table 9: Inter-correlation Matrix for Falsity
Items FALS1neg FALS2 FALS3
FALS1neg 1.000 -0.151 0.184
FALS2 -0.151 1.000 0.013
FALS3 0.184 0.013 1.000
Table 10: Cronbach’s Alpha If Item Deleted
Items
Cronbach’s Alpha If Item Deleted
Sweden Japan
FALS1neg 0.026 0.541
FALS2 0.310 -0.001
FALS3 -0.355 -0.188
Once the reliability for the scale was assured, the summated values for each factor, except for
Falsity factor, are calculated for each country as indexes, and it is summarized in the figures on the
next page. In the mean values, Social Role factor, Materialism factor, and Value Corruption factor
Page 54
Marketing Strategy 2FE10E
Group 4 | Tutor Åsa Devine
Sachi Komatsu| Takuma Tsuji
52 What are the differences in the attitudes toward Web advertising of Swedish and Japanese consumers?
differ in the number to a great extent. Among the standard deviations, hedonic factor and good for
economy factor proposes differences between two countries, showing that Swedish respondents are
more united in the answers for hedonic factors and more diverse in the answers for good for
economy factor than Japanese respondents are.
Figure 3: Means of Summated Values Figure 4: Standard Deviations of Summated Values
4.3 Correlation Analysis
The table 11 on the next page is the result of the correlation analysis on the data set. In the table, the
coefficients with possibility higher than 0.05 (p>0.05) are marked as not significant (ns
) in
upper-right hand corner of the number. All the other coefficients are statistically significant (p<0.05).
As it has explained in chapter three, in general, the relationships between two variables are strong
when the value of Pearson’s r is greater than 0.5 (Greasley, 2008).
Although there are small differences between the results of Sweden and Japan, there is a
tendency of variables to strongly relate each other based on how the factors are affecting the attitude
in the model proposed in chapter two. Factors that are said to have positive effect on a consumer’s
attitude toward Web advertising are Product Information, Hedonic, Social Role, and Good for
Economy, and those tend to have strong, positive correlation as it is shown in the table. Similarly,
0
0.5
1
1.5
2
2.5
3
3.5
4
4.5
5
5.5
Means
(Sweden)
Means (Japan)
Product
Information Hedonic
Social Role
Good for
Economy Materialism
Falsity
Value
Corruption Attitude
0
0.2
0.4
0.6
0.8
1
1.2
1.4
1.6
Standard
Deviation
(Sweden)
Standard
Deviation
(Japan)
Product
Information Hedonic
Social Role
Good for
Economy Materialism
Falsity
Value
Corruption Attitude
Page 55
Marketing Strategy 2FE10E
Group 4 | Tutor Åsa Devine
Sachi Komatsu| Takuma Tsuji
53 What are the differences in the attitudes toward Web advertising of Swedish and Japanese consumers?
factors which are supposed to negatively relate to a consumer’s attitude toward Web advertising,
which are Materialism, (Falsity), and Value Corruption, are more likely to have a strong correlation
each other than they do with the other four factors.
It is also notable that factors that are strongly correlated with the overall attitude toward Web
advertising slightly differ between the results of Sweden and Japan. The result of Swedish
respondents shows that overall attitude is strongly correlated to factors such as Product Information,
Hedonic, and Good for Economy. Compared to that, the result of Japanese respondents suggests the
strong correlation in the attitude with factors such as Hedonic, Social Role, and Good for Economy.
Table 11: Correlation Matrix, Pearson’s r and (significance)
PRODINFO HDNC SOC
ROLE
GOOD
ECON MAT FALS VALCRP ATTD
Sweden
PRODINFO 1 0.642 0.551 0.597 0.218 -0.102ns 0.170ns 0.585
HDNC 0.642 1 0.558 0.608 0.203 -0.179ns 0.119ns 0.725
SOCROLE 0.551 0.558 1 0.593 0.377 -0.085ns 0.199 0.469
GOODECON 0.597 0.608 0.593 1 0.424 -0.035ns 0.234 0.654
MAT 0.218 0.203 0.377 0.424 1 0.240 0.501 0.245
FALS -0.102ns -0.179ns -0.085ns -0.035ns 0.240 1 0.263 -0.224
VALCRP 0.170ns 0.119ns 0.199 0.234 0.501 0.263 1 0.004ns
ATTD 0.585 0.725 0.469 0.654 0.245 -0.224 0.004ns 1
Japan
PRODINFO 1 0.488 0.510 0.485 0.089ns 0.218 0.062ns 0.454
HDNC 0.488 1 0.534 0.540 0.093ns 0.059ns 0.089ns 0.667
SOCROLE 0.510 0.534 1 0.505 0.158 0.185 0.163 0.508
GOODECON 0.485 0.540 0.505 1 0.382 0.090ns 0.139ns 0.524
MAT 0.089ns 0.093ns 0.158 0.382 1 0.090ns 0.327 0.038ns
FALS 0.218 0.059ns 0.185 0.090ns 0.090ns 1 0.330 -0.031ns
VALCRP 0.062ns 0.089ns 0.163 0.139ns 0.327 0.330 1 0.033ns
ATTD 0.454 0.667 0.508 0.524 0.038ns -0.031ns 0.033ns 1
Page 56
Marketing Strategy 2FE10E
Group 4 | Tutor Åsa Devine
Sachi Komatsu| Takuma Tsuji
54 What are the differences in the attitudes toward Web advertising of Swedish and Japanese consumers?
4.4 Hypothesis Testing
In order to test the hypotheses presented in chapter two, independent-samples t-tests were carried out
as it has discussed in chapter three. Each constructs was tested between the two countries, Sweden
and Japan. The results of tests are summarized in the Table 12 on the next page. Based on the
statistical significance level of 0.05, hypothesis 3, hypothesis 6, and hypothesis 7 are accepted
(p<0.05). In other words, the differences between Sweden and Japan in factors of Social Role, Falsity,
and Value Corruption are accepted statistically. However, Falsity factor will not be included in the
further analysis in the following chapter because of the poor score on internal reliability of its scales.
Table 12: Results of Hypothesis Tests
Hypotheses
Mean
T-value 2-tailed
significance Sweden Japan
H1 5.1261
(1.06704)
4.9734
(0.97798) 1.229 0.220
H2 3.1014
(1.14808)
3.3167
(1.32270) -1.405 0.161
H3 3.6130
(1.23909)
3.9547
(1.20137) -2.296 0.022
H4 3.4261
(1.50862)
3.5042
(1.30365) -0.459 0.647
H5 3.8377
(1.24359)
3.5813
(1.25016) 1.682 0.094
H6 4.6232
(0.88249)
5.2042
(0.90498) -5.306 0.000
H7 3.9797
(1.37315)
4.3979
(1.23398) -2.644 0.009
H8 3.3217
(1.50174)
3.2417
(1.30470) 0.471 0.638
Page 57
Marketing Strategy 2FE10E
Group 4 | Tutor Åsa Devine
Sachi Komatsu| Takuma Tsuji
55 What are the differences in the attitudes toward Web advertising of Swedish and Japanese consumers?
4.5 Chapter Summary
The empirical data collected through the online questionnaire has been presented in chapter four. The
result of the survey on 275 respondents (115 Japanese and 160 Swedes) has been presented in line
with the data analysis method explained previously in chapter three. The result has been presented in
forms of tables and figures so it enables the further analysis in chapter five.
Page 58
Marketing Strategy 2FE10E
Group 4 | Tutor Åsa Devine
Sachi Komatsu| Takuma Tsuji
56 What are the differences in the attitudes toward Web advertising of Swedish and Japanese consumers?
5 Discussion and Interpretation
Chapter five is to discuss the authors’ interpretations of the survey result, which was presented
through the previous chapter. Hofstede’s dimensions of culture (1983) are mainly used to understand
the cultural differences between Sweden and Japan along with a few other literatures. The discussion
presented in this chapter five is to be the base for answering the research question.
5.1 Differences between Sweden and Japan in the Seven Belief Factors
The result of hypotheses tests proves that there are statistically significant differences between
Sweden and Japan in Social Role factor and Value Corruption factor among the seven factors. As it
has been explained in chapter 2, Social Role factor is related to consumers’ beliefs on such things as
social status, prestige, or social reaction (Pollay as Mittal, 1993). Value Corruption is a factor, which
concerns about distorting existing values of consumers (Wolin et al., 2002). Taking a look at mean
values in the results of Sweden and Japan on Social Value index, Japanese consumers put greater
value in this factor than Swedish consumers do as the greater value of mean for this factor indicates.
Correlation efficient of Japanese also shows strong relationship between Social Role factor and the
attitude towards Web advertising. Similarly, Japanese consumers appear to be concerned more about
Value Corruption factor as well, as the higher mean value shows.
Comparing it to the Pollay and Mittal’s study (1993), this result of the survey implies that
Japanese consumers are more sensitive for the brand information in advertising, valuing such
information more than Swedish consumers do. Japanese respondents appear to prefer to have such
information in Web advertising to be able to display their privilege with knowledge they learned
through Web advertising. It also appears that Japanese are more carefully aware of and fearing the
effect that Web advertising may possess to distort the existing values. They tend to have a fear that
Web advertising may contain undesirable information to themselves, to their significant others, and
to the society.
Page 59
Marketing Strategy 2FE10E
Group 4 | Tutor Åsa Devine
Sachi Komatsu| Takuma Tsuji
57 What are the differences in the attitudes toward Web advertising of Swedish and Japanese consumers?
5.1.1 Cultural Difference behind Social Role Factor
Checking the theories against the survey result, the study found some connections between cultural
differences and differences in the seven belief factors of Sweden and Japan. For example, lower
degree of value in Social Role factor of Sweden can be connected to the low Masculinity index and
low Power Distance index of Sweden in Hofstede’s study (1983). As it have been discussed in
theoretical chapter, scoring low in Masculinity index, being characterized as Feminine culture, has
connotation of leveling culture meaning that Swedish consumers do not like trying to be better than
other people (Hofstede, 1983). This may be linked together with scoring low in Power Distance that
they do not like the inequality in the society (Ibid.). These explain why consumers in Sweden are less
concerned about Social Role factor than ones in Japan are; that they do not want to neither show nor
brag their status off to others.
On the other hand, Japan is scoring almost on the other extreme in Masculinity index
(Hofstede, 1983). Japanese consumers are likely to find it valuable to have information regarding
brands in Web advertising due to their cultural background. The excelling nature, achievement being
ideal, and money and things orientation of Japanese culture may have contributed to enhance this
preference and have appeared in the result of survey as higher value in Social Role factor (Ibid.). The
excelling nature of the Japanese culture fits to the Social Role factor of Web advertising that the
advertising can be used as a source of getting brand information to exhibit social status. Moreover,
the characteristics of Japanese culture recognize it as a good thing to be able to do to show off one’s
status, unlike the Swedish culture.
5.1.2 Cultural Difference behind Value Corruption Factor
The survey results of Sweden and Japan on Value Corruption factor may be explained with
Uncertainty Avoidance dimension and Individualism dimension of Hofstede’s four cultural
Page 60
Marketing Strategy 2FE10E
Group 4 | Tutor Åsa Devine
Sachi Komatsu| Takuma Tsuji
58 What are the differences in the attitudes toward Web advertising of Swedish and Japanese consumers?
dimensions. While Sweden is featured as less conservative with lower score in Uncertainty
Avoidance index, Japan is described as a country with a highly uncertainty-avoiding country with a
conservatism nature (Hofstede, 1983). The Japanese culture tends to be greatly concerned with
security and strictly tries to keep the law and order (Ibid.). Like the parenting example for this factor
in the theoretical chapter, this factor is associated with changing existing values (Pollay and Mittal,
1993; Wolin et al., 2002). This may be linked to the greater alert that Japanese consumers showed to
the Value Corruption factor because they would like to avoid negative effects of the Web advertising.
Furthermore, compared to the highly individualistic culture of Sweden, Japanese culture is less
individualistic (Hofstede, 1983). This may have helped to increase the concern on Value Corruption
factor because Japanese consumers may have cared about the negative effect of Web advertising not
only to themselves but also to the others in the society that they should be protected.
In contrast to the characteristics of Japanese culture, Sweden is not identified as an
uncertainty-avoiding culture. Thus, Swedes appeared to be more easygoing and less stressed about
the distortion of the existing values by Web advertising. In addition, scoring high in Individualism
index may have helped to widen the difference between the two countries. Being a highly
individualistic culture has a connotation of self-protection; Swedish culture somewhat supposes that
people should be taking care of themselves (Hofstede, 1983). This may have contributed for the
Swedish consumers to be less concerned about Value Corruption factor because they assume that
individuals should be able to protect themselves. These contrasting values of the two cultures may
have been reflected in the difference in the survey result of Value Corruption factor.
5.2 Factors That Are Similar between Sweden and Japan in the Survey Result
In four other factors among the seven belief factors, except Social Role, Value Corruption and Falsity
factor, the survey result did not identify significant differences between Sweden and Japan. Although
Page 61
Marketing Strategy 2FE10E
Group 4 | Tutor Åsa Devine
Sachi Komatsu| Takuma Tsuji
59 What are the differences in the attitudes toward Web advertising of Swedish and Japanese consumers?
the difference was not significant enough, the result of a few factors somewhat reflects what is said
in the literature on the consumers’ attitudes toward Web advertising and cultural differences.
For example, some studies have shown that Western consumers tend to like informational
advertising more than consumers from Eastern culture do, generally speaking (Cui et al., 2013).
Although it is a small difference, which is not enough to accept the hypothesis 1, the result of the
survey illustrates that Swedish respondents value Product Information factor more than Japanese
respondents do, reflecting this cultural preference.
However, Japanese culture also may tend to value Product Information factor, due to its
characteristic as a highly uncertainty-avoiding culture. Because Japanese culture has characteristic of
seeking for the truth and higher anxiety for ambiguous things, Product Information factor may have
also resulted as an important factor to Japanese respondents as well. In fact, this Product Information
one major factor that tends to be important commonly among many countries around the world
(Ducoffe, 1996).
5.3 Cultural Differences and Attitudes toward Web Advertising
Although the result of the survey shows differences between Sweden and Japan in two factors among
the seven belief factors, there was only a slight difference observed in the overall attitude toward
Web advertising between the two countries. The rejection of hypothesis 8 shows this in the survey
result. The mean values of overall attitudes shows that both Swedish and Japanese consumers have
somewhat negative attitudes toward Web advertising. There have been some studies showing a
connection between cultural differences and differences in consumers’ attitude toward Web
advertising such as Zhang and Gelb (1996), Chau et al. (2002), and Cui et al. (2013). In the context
of this study, however, there has not been enough difference for the hypothesis to be approved as
significant. The difference in overall attitude toward Web advertising may have been more
significant if more of the seven belief factors have had major differences.
Page 62
Marketing Strategy 2FE10E
Group 4 | Tutor Åsa Devine
Sachi Komatsu| Takuma Tsuji
60 What are the differences in the attitudes toward Web advertising of Swedish and Japanese consumers?
One of the possible reasons for the four of the seven belief factors being insignificantly
different between Sweden and Japan is the two countries’ similarities. Although the two countries are
said to differ to a great extent in a few dimensions of culture in Hofstede’s study (1983), the two
countries turned out to have some similarities when other stand points of cultural studies are
considered together, like it is in the case of Product Information factor. In reality, the differences
were considerable to the factors on which the cultures of the two countries are almost contrasting in
some dimensions, which are Social Role and Value Corruption factor. Another possible reason may
lie in the sample selection. Since this study focuses mainly on university students of the two
countries, the study does not represent other demographic populations. Focusing on this particular
population may have made the result of the two countries more similar than it was supposed to be.
5.4 Chapter Summary
This chapter has discussed the interpretations of the survey result. Comparing the result to
Hodstede’s dimensions of culture and other literature on culture, the differences and similarities
observed in the seven belief factors and the result of overall attitudes toward Web advertising were
analyzed. The main findings of the chapter were that there were a few factors that were notably
different between Sweden and Japan in line with the significant cultural differences, and that
attitudes toward Web advertising of both countries are somewhat negative.
Page 63
Marketing Strategy 2FE10E
Group 4 | Tutor Åsa Devine
Sachi Komatsu| Takuma Tsuji
61 What are the differences in the attitudes toward Web advertising of Swedish and Japanese consumers?
6 Conclusion and Theoretical and Managerial Implications
This final chapter of the thesis draws conclusions from the discussion and interpretation in the
previous chapter. The discussion answers the research question of the study, and presentation of
theoretical and managerial implications, and limitations of the study, and suggestions for future
research are followed in this chapter.
6.1 Conclusion
This research has focused on explaining differences in attitudes toward Web advertising between
Japanese and Swedish consumers. In order to achieve this, the following research question was
formulated along with the eight hypotheses based on an intensive literature review: “What are the
differences in the attitudes toward Web advertising of consumers who have grown up in Sweden and
Japan?”
The collected data was applied to Pollay and Mittal’s seven beliefs factors model and then it
was further analyzed in relation to the existing studies on dimensions of cultures. As a result, there
was no evidence to prove the differences in overall attitudes toward Web advertising between
Swedish and Japanese consumers. Moreover, the research did not show any explicit differences in
four factors: product information factor, hedonic factor, good for the economy factor, and
materialism factor. However, in turn, as hypothesis 3 and hypothesis 7 were accepted, the research
clearly showed some distinctive differences between Swedish and Japanese consumers in social role
and image factor and value corruption factor. As explained before, these belief-factors would take a
part in forming consumers’ attitudes toward Web advertising. In this case differences in those two
factors were not influential enough to cause clear differences between Swedish and Japanese
respondents’ overall attitudes toward Web advertising. However, the result still indicates that
Swedish and Japanese consumers perceive Web advertising somewhat differently and they expect
different things from Web advertising.
Page 64
Marketing Strategy 2FE10E
Group 4 | Tutor Åsa Devine
Sachi Komatsu| Takuma Tsuji
62 What are the differences in the attitudes toward Web advertising of Swedish and Japanese consumers?
6.2 Theoretical and Managerial Implications
There are several models that attempt to measure consumers’ beliefs and attitudes toward Web
advertising. Though the model used for this research, Pollay and Mittal’s seven-factor model, has
been widely used so far, this is not the case in the context of cultural studies, along with the fact that
there has not been many cross-cultural studies done. However, this research revealed a possibility
that Pollay and Mittal’s seven-factor model can be applicable to a cross-cultural study. Consequently,
this research approves the possibility that duplication of this research within other contexts, such as
other countries or even culturally different regions within a country, can be made with possible
modifications. Possible modifications will be further discussed in the later section.
Additionally, the research result highlighted the impacts that culture has on consumers and
in turn on businesses, in regard to Web advertising. In the attempt to analyze this matter with the
presented seven-factor model, Hofstede’s research (1983) seemed to be still credible in the case of
Sweden and Japan, as could be seen in the analysis section. This fact implies that his research can be
applied to consumers in other countries as well, when trying to investigate their attitudes toward Web
advertising particularly with the seven-factor model.
Turning to more practical aspects of the findings, the research results show that there is a
certain degree of need for modifying advertising, when it comes to the case of Sweden and Japan.
For instance, since clear differences were found in social role and image factor and value corruption
factor in this case, managers can specifically pay attention to these factors and modify their Web
advertising when their Web advertising is transferred to Japan from Sweden, and vice versa. In
addition, the findings also can be beneficial for firms that conduct their business only in Sweden or
Japan. By looking at data for each country, managers will be able to know things that Swedish and
Japanese consumers desire to get and avoid from Web advertising, and then they will be able to
modify Web advertising to match to targeted consumers needs. Finally, the results would likely to
Page 65
Marketing Strategy 2FE10E
Group 4 | Tutor Åsa Devine
Sachi Komatsu| Takuma Tsuji
63 What are the differences in the attitudes toward Web advertising of Swedish and Japanese consumers?
vary if other countries were to be investigated. Therefore, it is recommended that managers conduct a
similar research on targeted areas before they start Web advertising in a new area.
6.3 Limitations
This research is limited by its scope, mainly resulting from limited time and funds for the research.
Especially, the total amount of data collected both from Japan and Sweden, 275 respondents, is
somewhat smaller than the total amount of data collected in the previous studies in the similar field.
Further, because of the reason mentioned before in chapter three, the questionnaires used were
mainly aiming for college students in Japan and Sweden. Consequently, other age groups and
demographically different groups were not fully covered in this research. Even though the authors
had carefully conducted the sampling selection in the attempt to lead the most representative
samplings for the entire populations of Swedish and Japanese consumers, the result could have
improved if the total number of respondent was increased. Thus, when comparing the data and result
of this research with the ones from previous studies, some attentions should be paid before doing so.
6.4 Suggestions for Future Research
Concerning the given limitations, the authors would like to recommend that future research should
include a larger sample size for the survey. As mentioned above, as the total amount of respondents
rises, the result may look different and it will possibly depict a more accurate picture of a population
in which samples have been selected from. Moreover, future research should also take the
respondents’ demographic characteristics into consideration. In the case of cross-cultural studies,
extended investigation on respondents’ demographic characteristics such as their educational level,
income, occupation, age, or gender may uncover another aspect on this matter.
As another suggestion, there may be a need for revising some of the questionnaire questions.
In this research, the data analysis showed the questions concerning the falsity factor were not fully
Page 66
Marketing Strategy 2FE10E
Group 4 | Tutor Åsa Devine
Sachi Komatsu| Takuma Tsuji
64 What are the differences in the attitudes toward Web advertising of Swedish and Japanese consumers?
understood by some of the respondents as described before. Although wording and phrasing of
questions have been modified to some degree since those questions were formulated, the questions
used in this research and some of the previous studies were still highly dependent on the original
questionnaire questions created by Pollay and Mittal (1993). Considering the rapidly changing
marketing technologies and business environment, relatively obsolete questions can be one of
possible explanations for this problem. However, there is no evidence to prove this idea yet, so it is
also recommended that researchers should look into this concern from different perspectives before
conducting any future research. To do so, researchers may be able to start with qualitative research
on this matter. In this way, they might find another factor that can possibly replace the falsity factor
or they could simply make changes to Pollay and Mittal’s original model in order to measure
consumers’ beliefs and attitudes toward Web advertising more accurately with more understandable
questions. Further, a series of pretests of the questionnaire questions in other contexts is also
recommended. By doing so, researchers can assure the reliability of questions and then make sure if
the model is really applicable to other contexts.
6.5 Chapter Summary
The answer to the research question has been presented in the discussion of general conclusions of
the research. Theoretical and managerial implications of the study have also been addressed in this
chapter, following the general conclusion drawn early in this chapter. After the discussion on
limitations of the study, suggestions are made to future research in this field of study.
Page 67
Marketing Strategy 2FE10E
Group 4 | Tutor Åsa Devine
Sachi Komatsu| Takuma Tsuji
65 What are the differences in the attitudes toward Web advertising of Swedish and Japanese consumers?
Bibliography
An, D. and Kim, S. H. (2008), “A First Investigation into the Cross-Cultural Perceptions of Internet
Advertising”, Journal of International Consumer Marketing, Vol.20, No.2, p.49-65.
Ali, H. and Birley, S. (1999), “Integrating Deductive and Inductive Approaches in A Study of New
Ventures and Customer Perceived Risk”, An International Journal, Vol.2, No.2, p.103-110.
Alwitt, L. F. and Prabaker, P. R. (1994), “Identifying who dislikes television advertising: Not by
Demographics Alone”, Journal of Advertising Research, Vol.34, No.6, p.17-29.
Andzulis, J. M., Panagopoulos, N. G., and Rapp, A. (2012), “A Review of Social Media and
Implications for the Sales Process”, Journal of Personal Selling & Sales Management, Vol.32,
No.3, p.305-316.
Assael, H. and Day, G. S. (1968), “Attitudes and Awareness as Predictors of Market Share”, Journal
of Advertising Research, Vol.8, No.4, p.3-10.
Ayalon, M. and Even, R. (2013), “Deductive Reasoning: In the Eye of the Beholder”, Educational
Studies in Mathematics, Vol.69, No.3, p.235-247.
Bauer, R. and Greyser, S. (1968), “Advertising in America: The Consumer View”, 1st Edition,
Journal of Harvard Business School, Boston.
Bryman, A. and Bell, E. (2007), “Business research methods”, 2nd
edition, Oxford University Press,
Oxford.
Chau, P. Y. K., Cole, M., Massey, A. P., Montoya-Weiss, M., and O’Keefe, R. M. (2002),
“Cultural Differences in the Online Behavior of Consumers”, Communications of the ACM,
Vol.45, No.10, p.138-143.
Colman, A. M., Norris, C. E., and Preston, C. C. (1997), “Comparing Rating Scales of Different
Lengths: Equivalence of Scores from 5-point and 7-point Scales”, Psychological Reports,
Vol.80, p.355-362.
Cowton, C. J. (1998), “The Use of Secondary Data in Business Ethics Research”, Journal of
Business Ethics, Vol.17, No.4, p.423-434.
Page 68
Marketing Strategy 2FE10E
Group 4 | Tutor Åsa Devine
Sachi Komatsu| Takuma Tsuji
66 What are the differences in the attitudes toward Web advertising of Swedish and Japanese consumers?
Cui, G., Liu, H., Yang, X. and Wang, H. (2013), “Culture, cognitive style and consumer response
to informational vs. transformational advertising among East Asians: Evidence from the PRC”,
Asia Pacific Business Review, Vol.19, No.1, p.16-31.
Dhawan, S. (2010), “Research Methodology for Business and Management Studies”, 1st edition,
Swastik Publications, Delhi.
Ducoffe R. H. (1996), “Advertising Value and Advertising on the Web”, Journal of Advertising
Research. September/October 1996, p.21-35.
Durvasula S., Andrews J. C., Lysonski S., and Netemeyer R.G. (1993), “Assessing the
Cross-National Applicability of Consumer Behavior Models: A Model of AttitudeToward
Advertising in General”, Journal of Consumer Research, Vol.19, No.4, p.626-636.
Greasley, P. (2008), “Quantitative Data Analysis Using SPSS : An Introduction for Health and
Social Sciences”, 1st edition, Open University Press, Berkshire.
Hair, J. F. Jr., Anderson, R. E., Tatham, R. L., and Black, W. C. (1998), “Multivariate Data
Analysis”, 5th
edition, Prentice-Hall, Inc., Upper Saddle River.
Henry, W. A. (1976), “Cultural Values Do Correlate with Consumer Behavior”, Journal of
Marketing Research, Vol.13, No.2, p.121-127.
Hofstede, G. (1983), “National Culture in Four Dimensions: A Research-Based Theory of Cultural
Differences among Nations”, International Studies of Management and Organization, Vol.13,
No.1/2, p.46-74.
Hofstede, G. and McCrae, R. R. (2004), “Personality and Culture Revisited: Linking Traits and
Dimensions of Culture”, Cross-Cultural Research, Vol.38, No.1, p.52-88.
Hsu, H. and Burns, L. D. (2012), “The Effects of Culture, Long-term Orientation, and Gender on
Consumers’ Perceptions of Clothing Values”, Social Behavior and Personality, Vol.40, No.10,
p.1585-1596.
Kothari, C. R. (2004), “Research Methodology: Methods and Techniques”, 2nd
edition, New Age
International, Delhi.
Page 69
Marketing Strategy 2FE10E
Group 4 | Tutor Åsa Devine
Sachi Komatsu| Takuma Tsuji
67 What are the differences in the attitudes toward Web advertising of Swedish and Japanese consumers?
Leard Statistics_2013, A website that shows statistics resources or students and researcher, Link:
https://statistics.laerd.com/spss-tutorials/cronbachs-alpha-using-spss-statistics.php,
accessed on May 8th, 2013.
Leard Statistics_T-test_2013, A website that shows statistics resources or students and researcher,
Link:
https://statistics.laerd.com/spss-tutorials/independent-t-test-using-spss-statistics.php,
accessed on May 8th, 2013
Leung, K., Bhagat, R. S., Buchan, N. R., Erez, M., and Gibson, C. B. (2005), “Culture and
International Business: Recent Advances and Their Implications for Future Research”, Journal
of International Business Studies, Vol.36, No.4, p.357-378.
Manrai, L. A. and Manrai, A. K. (2011), “Hofstede's Cultural Dimensions and Tourist Behaviors:
A Review and Conceptual Framework”, Journal of Economics, Finance & Administrative
Science, Vol.16, No.31, p.23-48.
Matkar, A. (2012), “Cronbach’s Alpha Reliability Coefficient for Standard of Customer Services in
Maharashtra State Cooperative Bank”, IUP Journal of Bank Management, Vol. 11, No. 3,
p.89-95.
MPHPT_2012, A governmental information material of Ministry International Affairs and
Communications, Japan, Link:
http://www.soumu.go.jp/johotsusintokei/statistics/data/120530_1.pdf, accessed on May 22nd,
2013.
Nadilo, R. (1998), “On-line Research Taps Consumers Who Spend”, Marketing News, Vol.32,
No.12, p.12.
Page 70
Marketing Strategy 2FE10E
Group 4 | Tutor Åsa Devine
Sachi Komatsu| Takuma Tsuji
68 What are the differences in the attitudes toward Web advertising of Swedish and Japanese consumers?
O’Brien, T. (1971), “Stages of Consumer Decision Making”, Journal of Marketing Research, Vol.8,
No.3, p.283-289.
Olle Findahl (2010), “Swedes and the Internet 2010”, 1st edition, .SE (The Internet Infrastructure
Foundation), Stockholm.
Palda, K. S. (1966), “The Hypothesis of a Hierarchy of Effects: A Partial Evaluation”, Journal of
Marketing Research, Vol.3, No.1, p. 13-24.
Pavlou, P. A. and Stewart, D. W. (2000), “Measuring the Effects and Effectiveness of Interactive
Advertising: A Research Agenda”, Journal of Interactive Advertising, Vol.1, No.1, P.62-78.
Pollay, R. W. and Mittal, B. (1993), “Here’s the beef: factors, determinants, and segments in
consumer criticism of advertising”, Journal of Marketing, Vol.57, No.3, p.99-114.
Saunders, M., Lewis, P., and Thornhill, A. (2009), “Research Methods for Business Students”, 5th
edition, Peason Education Limited, Essex.
Schlosser, A. E., Shavitt, S., and Kanifer, A. (1999), “Survey of Internet Users’ Attitudes toward
Internet Advertising”, Journal of Business Ethics, Vol.17, No.4, p.423-434.
Sivakumar, K. and Nakata, C. (2001), “The Stampede toward Hofstede’s Framework: Avoiding
the Sample Design Pit in Cross-Cultural Research”, Journal of International Business Studies,
Vol.32, No.3, p.555-574.
Soares, A. M., Farhangmehr, M., and Shoham, A. (2007), “Hofstede’s Dimensions of Culture in
International Marketing Studies”, Journal of Business Research, Vol.60, No.3, p.227-284.
Page 71
Marketing Strategy 2FE10E
Group 4 | Tutor Åsa Devine
Sachi Komatsu| Takuma Tsuji
69 What are the differences in the attitudes toward Web advertising of Swedish and Japanese consumers?
Tavakol, M. and Dennick, R. (2011), “Making Sense of Cronbach’s Alpha”, International Journal
of Medical Education, Vol.2, p.53-55.
Vitell, S. J., Nwachukwu, S. L., and Barnes, J. H. (1993), “The Effects of Culture on Ethical
Decision-Making: An Application of Hofstede's Typology”, Journal of Business Ethics, Vol.12,
No.10, p.753-760.
Wang, Y. and Sun, S. (2010), “Modeling online advertising: A cross-cultural comparison between
China and Romania”, Journal of Marketing Communications, Vol.16, No.5, p.271-285.
Wang, Y., Sun, S., Lei, W., and Toncar, M. (2009), “Examining Beliefs and Attitudes toward
Online Advertising among Chinese Consumers”, Direct Marketing: An International Journal,
Vol.3, No.1, p.52-66.
Watson, R. T., Akselsen, S., and Pitt, L. F. (1998), “Attractors: Building Mountains in the Flat
Landscape of the World Wide Web”, California Management Review, Vol.40, No.2, p.36-56.
Wolin, L. D., Korgaonkar, P., and Lund, D. (2002), “Beliefs, Attitudes and Behaviour towards
Web Advertising”, International Journal of Advertising, Vol.21, p.87-113.
Wu, M. (2006), “Hofstede’s Cultural Dimensions 30 Years Later: A Study of Taiwan and the United
States”, Intercultural Communication Studies, Vol.15, No.1, p.33-42.
Yin, R. K. (2009), “Case Study Research: Design and Methods”, 3rd
edition, Sage Publications,
Thousand Oaks.
Yoon, S. and Kim, J. (2001), “Is the Internet More Effective Than Traditional Media? Factors
Affecting the Choice of Media”, Journal of Advertising Research, Vol.41, No.6, p.53-60.
Zhang, Y. and Gelb, B. D. (1996), “Matching Advertising Appeals to Culture: The Influence of
Products' Use Conditions”, Journal of Advertising, Vol.25, No.3, p.29-46.
Page 72
Marketing Strategy 2FE10E
Group 4 | Tutor Åsa Devine
Sachi Komatsu| Takuma Tsuji
I
Appendix
(A) The Empirical Data for Sweden and Japan from Hofstede’s study (1983)
The table blow shows scores of the indexes of the two countries in the Hofstede’s study. The table
shows the data of Sweden and Japan in Hofstede’s study (1983) among 48 other countries and 3
regions. Each of the indexes ranges as follows; Power Distance Index from 11 to 104, Uncertainty
Avoidance Index from 8 to 112, Individualism Index from 6 to 91, and Masculinity Index from 5 to
95 (Hofstede, 1983).
Table 1: Index Values and Ranks of Sweden and Japan on Four Cultural Dimensions (Hofstede, 1983, p.52)
Index Values (Rank)
Sweden Japan
Power Distance (PDI) 31 (6-7) 54 (21)
Uncertainty Avoidance (UAI) 29 (4-5) 92 (44)
Individualism (IDV) 71 (40-41) 46 (28-29)
Masculinity (MAS) 5 (1) 95 (50)
(B) Questionnaire (In Swedish)
En Enkätundersökning om Konsumenters Attityder till Webbaserad Reklam
Vi är studenter vid Linnéuniversitetet i Växjö, som just nu skriver vår kandidatuppsats i
marknadsföring. Vi undersöker attityder till webbaserad reklam hos medborgare från olika
länder, genom att titta på de faktorer som bidrar till attityder till sådan reklam.
Page 73
Marketing Strategy 2FE10E
Group 4 | Tutor Åsa Devine
Sachi Komatsu| Takuma Tsuji
II
Insamlad data från denna undersökning kommer endast att användas inom ramen för vår
studie och alla svarande garanteras anonymitet. Undersökningen består av 29 frågor och tar
ungefär 5 minuter att besvara.
Tack för din medverkan!
Om du har några frågor om undersökningen, vänligen kontakta oss via e-post:
Sachi Komatsu: [email protected]
Takuma Tsuji: [email protected]
1. Internet är en värdefull källa till information.
2. Webbaserad reklam är en värdefull källa till information om erbjudanden.
3. Webbaserad reklam är en möjlighet för mig att avgöra vilka produkter som har de
egenskaper som jag efterfrågar.
4. Webbaserad reklam håller mig uppdaterad om erbjudanden på marknaden.
5. Jag uppskattar webbaserad reklam.
6. Generellt sett är webbaserad reklam till och med roligare än själva web sedan jag besöker.
7. Generellt sett är viss webbaserad reklam mer estetisk än andra typer av reklam.
8. Genom webbaserad reklam håller jag jag mig uppdaterad vad gäller mode.
9. Webbaserad reklam antyder vilka produkter som är associerade med status (exempel: en
bil från Mercedes-Benz associeras med en föreställning om att vara rik)
10. Webbaserad reklam informerar mig om vad människor lika mig köper och använder.
11. Webbaserad reklam hjälper mig avgöra vilka produkter som reflekterar vilken typ av
person jag är.
12. Webbaserad reklam hjälper människor att förbättra sin levnadsstandard genom att vara ett
användbart verktyg för dem.
13. Webbaserad reklam minskar den tid jag spenderar på att söka efter produkter.
14. Det har funnits tillfällen när jag har köpt någonting, på grund av webbaserad reklam, utan
att jag egentligen hade tänkt köpa något.
Page 74
Marketing Strategy 2FE10E
Group 4 | Tutor Åsa Devine
Sachi Komatsu| Takuma Tsuji
III
15. Webbaserad reklam gör att jag köper saker jag egentligen inte behöver.
16. Webbaserad reklam skapar ett materialistiskt samhälle – intresserat av att köpa och äga
saker/prylar.
17. Webbaserad reklam får människor att köpa saker de inte har råd med, bara för att kunna
visa upp.
18. Generellt sett kan man lite mer på produkter marknadsförda på internet, än produkter som
inte marknadsförs på internet.
19. Webbaserad reklam gör mig osäker på om jag verkligen köpt den bästa produkten.
20. Viss webbaserad reklam verkar vara osann.
21. Jag tror att webbaserad reklam riskerar att snedvrida våra traditionella värderingar.
22. Generellt sett tror jag att barn bör undvika att titta på webbaserad reklam.
23. Webbreklam idag innehåller alltför många sexuella anspelningar.
24. Överlag betraktar jag webbaserad reklam som bra.
25. Överlag uppskattar jag webbaserad reklam.
26. Jag anser att webbaserad reklam är viktigt.
27. I vilket land har du växt upp
- Sverige
- Japan
28. Hur gammal är du? _____ år gammal
29. Hur många timmar spenderar i snitt du online varje dag?
- Mindre än en time
- 1 till 2 timmar
- 2 till 3 timmar
- 3 till 4 timmar
- 4 till 5 timmar
- 5 till 6 timmar
Page 75
Marketing Strategy 2FE10E
Group 4 | Tutor Åsa Devine
Sachi Komatsu| Takuma Tsuji
IV
- 6 till 7 timmar
- Mer än 7 timmar
(C) Questionnaire (In Japanese)
消費者のインターネット広告に対する意識調査
私たちはスウェーデン、国立リンネ大学に所属する学生で、現在、マーケティングの分野で
学士論文を執筆しています。私たちは異なる国の消費者のインターネット広告に対する意見
について研究しており、このアンケートを通して、その意見を構成する要因を調査していま
す。このアンケートから得られた情報は研究以外の目的以外で使用されることはなく、全て
の回答は匿名のまま利用されます。このアンケートは日本人、スウェーデン人を対象とし、
設問数は29です。アンケートは約5分程度で終わります。
ご協力宜しくお願いします。
もしこのアンケートや研究に対し何か質問がある場合には以下の連絡先までご連絡くださ
い。
小松 紗智: [email protected]
辻 拓馬:[email protected]
1. インターネットは重要な情報源である。
2. インターネット広告は販売されている商品を知るための重要な情報源である。
3. インターネット広告を通じ、私の求める特徴をもった商品を的確に探すことが出来る。
4. インターネット広告を通じ、どのような商品が市場にあるのか随時知る事ができる。
5. 私はインターネット広告を見る事を楽しんでいる。
6. 一般的に、いくつかのインターネット広告はその広告を掲載しているウェブサイトよ
りも面白いことがある。
7. 一般的に、いくつかのインターネット広告はテレビコマーシャルや新聞などの広告よ
りも美的だと感じることがある。
8. インターネット広告を通じ、現在の流行を知る事がある。
9. インターネット広告を通じ、どの商品がステータスと関連しているのか知る事が出来
る。(例:ベンツ→高収入)
10. インターネット広告を通じ、自分と似たような人々がどのような商品を購入し、利
用しているのか知る事が出来る。
Page 76
Marketing Strategy 2FE10E
Group 4 | Tutor Åsa Devine
Sachi Komatsu| Takuma Tsuji
V
11. インターネット広告を通じ、どのような商品が自分という人間をうまく反映するの
か知る事が出来る。
12. インターネット広告は私たちの生活水準を向上させる手段である。
13. インターネット広告は商品を探す時間を短縮できる。
14. もともと購入意欲が無かったにもかかわらず、インターネット広告の影響で商品を
購入したことがある。
15. インターネット広告は私に不必要な物を買わせる。
16. インターネット広告は物質主義(物質や金銭の充実を優先すること)を作り出して
いる。
17. インターネット広告は人々に本来なら購入できないような高価な商品を他人に見せ
びらかすために購入させる。
18. 一般的に、テレビコマーシャルや新聞広告に掲載されている他の商品よりも、イン
ターネット広告で掲載されている商品の方が信頼できる。
19. インターネット広告を見ると、本当に自分が購入したものが最良であったか不安に
なる。いくつかのインターネット広告には嘘の内容が含まれていると感じる。
20. いくつかのインターネット広告には嘘の内容が含まれていると感じる。
21. インターネット広告は私たちの伝統的な価値観を歪めてしまう可能性がある。
22. 一般的に、子ども達はネット広告をあまり見ないようにすべきだ。
23. インターネット広告には性的表現が含まれていることが多すぎる。
24. 総合的にみて私はインターネット広告を良いものであると思う。
25. 一般的に、私はインターネット広告が好きである。
26. インターネット広告は私たちの生活に欠かせない。
27. あなたはどちらの国で育ちましたか?
− スウェーデン
− 日本
28. あなたの年齢を教えてください。 _歳
29. 平均的に一日何時間インターネットを使いますか?
- 1時間以下
- 1−2時間
- 2−3時間
- 3−4時間
- 4−5時間
- 5−6時間
- 6−7時間
- 7時間以上
Page 77
Marketing Strategy 2FE10E
Group 4 | Tutor Åsa Devine
Sachi Komatsu| Takuma Tsuji
VI
(D) Questionnaire (In English/Original Draft before Translations)
A Survey on Consumers’ Attitudes toward Web Advertising
We are students at Linnaeus University in Sweden, who are currently writing our bachelor
thesis in marketing. We are doing research on attitudes toward Web advertising of consumers
from different countries, by looking at factors that forms attitudes towards Web advertising.
The data collected through this survey will be used only for a pure academic purpose, and all
the respondents will stay anonymous. There are 29 questions in this survey, and it takes about
5 minutes to complete the survey.
Thank you very much in advance for your collaboration. Your help is greatly appreciated.
If you had any questions regarding this survey, you can contact the authors by email:
Sachi Komatsu: [email protected]
Takuma Tsuji: [email protected]
1. The internet is a valuable source of information.
2. Web advertising is a valuable source of information about offers.
3. Web advertising enables me to spot which products have the features I am looking for.
4. Web advertising helps me keep up-to-date with offerings available in the market place.
5. I enjoy watching Web advertising.
6. In general, some Web advertising is even more enjoyable than the websites themselves.
7. In general, some Web advertising is more aesthetic than other types of advertising.
8. From Web advertising, I learn what is in fashion.
9. Web advertising tells me which products are associated with statuses. (For example, a car
from Mercedes-Benz is associated with an image of being rich.
10. Web advertising tells me what people like me are buying and using.
11. Web advertising helps me know which products will reflect the sort of person I am.
12. Web advertising helps people to improve their standard of living by being as a useful tool
for them.
13. Web advertising reduces the amount of time I spend for searching products.
14. There have been times when I have bought something because of Web advertising without
initial purchase attention.
15. Web advertising makes you buy things you don’t really need.
16. Web advertising is creating a materialistic society – interested in buying and owing things.
Page 78
Marketing Strategy 2FE10E
Group 4 | Tutor Åsa Devine
Sachi Komatsu| Takuma Tsuji
VII
17. Web advertising makes people buy unaffordable products just to show off.
18. In general, one can put more trust in products advertised on the Web than in those not
advertised on the Web.
19. Web advertising makes me unsure if I have bought the best product.
20. Some Web advertising seems to be untrue.
21. I think Web advertising has a potential to distort our traditional values.
22. In general, I think children should avoid watching Web advertising.
23. There are too many sexual appeals in Web advertising today.
24. Overall, you, as an Internet user, consider Web advertising as a good thing.
25. Overall, you like Web advertising.
26. I consider Web advertising essential.
27. Country where you have grown up
- Sweden
- Japan
28. Your age ( __ years old)
29. Amount of time you spend online per day on average
- Less than an hour
- 1 - 2 hours
- 2 - 3 hours
- 3 - 4 hours
- 4 - 5 hours
- 5 - 6 hours
- 6 - 7 hours
- More than 7 hours
(E) Data Coding
Table 4: Data Coding
Question
Number
Constructs Being
Measured Codes Labels
1
Product Information
PRODINFO1 -
2 PRODINFO2 -
3 PRODINFO3 -
Page 79
Marketing Strategy 2FE10E
Group 4 | Tutor Åsa Devine
Sachi Komatsu| Takuma Tsuji
VIII
4 PRODINFO4 -
5
Hedonic
HDNC1 -
6 HDNC2 -
7 HDNC3 -
8
Social Role
SOCROLE1 -
9 SOCROLE2 -
10 SOCROLE3 -
11 SOCROLE4 -
12
Good for Economy
GOODECON1 -
13 GOODECON2 -
14 GOODECON3 -
15
Materialism
MAT1 -
16 MAT2 -
17 MAT3 -
18
Falsity
FALS1neg -
19 FALS2 -
20 FALS3 -
21
Value Corruption
VALCRP1 -
22 VALCRP2 -
23 VALCRP3 -
24
Attitude
ATTD1 -
25 ATTD2 -
26 ATTD3 -
27 Country COUNTRY 0=Sweden, 1=Japan
28 Age AGE -
29 Amount of Time Spent
Online Per Day TIME
0=Less than an hour
1=1-2 hours. 2=2-3 hours
3=3-4 hours, 4=4-5 hours
5=5-6 hours, 6=6-7 hours
7=More than 7 hours
(F) Descriptive Statistics
The respondents were in total 275 people, 115 from Sweden and 160 from Japan (See the table
Page 80
Marketing Strategy 2FE10E
Group 4 | Tutor Åsa Devine
Sachi Komatsu| Takuma Tsuji
IX
below for the full result of the survey). The average age for Japanese respondents is younger than
one for Swedish respondents, but the age difference among samples is quite similar between the two
countries as the value of standard deviation show. In addition, the result of survey indicates that
Swedish respondents spend longer time using the Internet per day than Japanese respondents do,
generally speaking. However, the amount of time spent on the Internet somewhat varies among the
Swedish respondents, looking at value of standard deviation.
Table 7: Descriptive Statistics
PRODINFO=product information, HDNC=hedonic, SOCROLE=social role, GOODECON=good for economy,
MAT=materialism, FALS=falsity, VALCRP=value corruption, and ATTD=attitude
Items
Sweden Japan
Mean Median Standard
Deviation Mean Median
Standard
Deviation
PRODINFO1 6.75 7.00 0.544 6.29 7.00 1.018
PRODINFO2 4.55 5.00 1.563 4.53 5.00 1.475
PRODINFO3 4.39 4.00 1.604 4.18 4.00 1.545
PRODINFO4 4.82 5.00 1.525 4.89 5.00 1.544
HDNC1 3.26 3.00 1.722 3.33 3.00 1.862
HDNC2 2.08 2.00 1.326 3.34 3.00 1.578
HDNC3 3.97 4.00 1.475 3.28 3.00 1.617
SOCROLE1 3.62 4.00 1.804 4.70 5.00 1.581
SOCROLE2 4.16 4.00 1.576 3.83 4.00 1.595
SOCROLE3 3.77 4.00 1.635 4.20 5.00 1.790
SOCROLE4 2.91 3.00 1.536 3.09 3.00 1.631
GOODECON1 3.30 3.00 1.574 3.36 3.00 1.456
GOODECON2 3.62 3.00 1.927 4.23 4.00 1.812
GOODECON3 3.36 3.00 2.205 2.93 2.00 2.085
MAT1 2.90 3.00 1.729 3.83 4.00 1.892
MAT2 4.63 5.00 1.586 4.25 4.00 1.594
MAT3 3.99 4.00 1.729 2.67 2.00 1.482
FALS1neg 4.87 5.00 1.565 5.63 6.00 1.262
FALS2 3.52 4.00 1.569 4.24 5.00 1.717
FALS3 5.48 6.00 1.404 5.74 6.00 1.245
Page 81
Marketing Strategy 2FE10E
Group 4 | Tutor Åsa Devine
Sachi Komatsu| Takuma Tsuji
X
VALCRP1 3.75 4.00 1.675 4.10 4.00 1.611
VALCRP2 4.30 4.00 1.778 4.21 4.00 1.548
VALCRP3 3.89 4.00 1.721 4.88 5.00 1.684
ATTD1 3.61 4.00 1.593 3.79 4.00 1.284
ATTD2 3.06 3.00 1.713 3.21 3.00 1.567
ATTD3 3.30 3.00 1.727 2.73 2.00 1.741
COUNTRY 0.00 0.00 0.000 1.00 1.00 0.000
AGE 23.14 23.00 3.371 21.36 21.00 3.390
TIME 3.59 4.00 1.918 2.86 2.50 1.669