The Leadership Factor, Inc. 120 Allens Creek Road Rochester, New York 14618 www.leadershipfactor.com 2009 Minnesota Department of Transportation Rest Area Amenities Study FINAL REPORT November 30, 2009
Transcript
The Leadership Factor, Inc. 120 Allens Creek Road Rochester, New York 14618
www.leadershipfactor.com
2009Minnesota Department of
Transportation Rest Area Amenities Study
FINAL REPORTNovember 30, 2009
The Leadership Factor, Inc. MnDOT Rest Area Amenities Study 2009 Unless otherwise noted, n=600 General Public; n=205 Commercial Drivers
2
TABLE OF CONTENTS
I. BACKGROUND AND OBJECTIVES ........... 3
II. METHODOLOGY ........................................ 4 Research overview ............................................... 4
III. KEY (SUMMARY OF) FINDINGS .............. 6 Amenities (Q1) ..................................................... 7 Visitor safety (Q3a/b) ............................................ 22 Driver safety (Q5a/b) ............................................ 26 Likelihood of stopping more frequently (Q3) ........ 28
IV. CONCLUSIONS/ RECOMMENDATIONS . 33
APPENDIX A – ADDITIONAL DETAILS ........ 35
APPENDIX B – DEMOGRAPHICS ................. 58
APPENDIX C – INCIDENCE ........................... 59
APPENDIX D – QUESTIONNAIRE ................. 60
The Leadership Factor, Inc. MnDOT Rest Area Amenities Study 2009 Unless otherwise noted, n=600 General Public; n=205 Commercial Drivers
3
I. BACKGROUND AND OBJECTIVES The primary objective of this research is to better understand customer wants and expectations related to the amenities, products and services at rest areas. Additional specific informational objectives were to: Identify and measure customer desire for
existing and potentially new amenities, products and services;
Determine the effectiveness of the above at encouraging travelers to stop and use rest areas and
Identify relationships that may exist between rest area visitorship and physical condition, cleanliness and onsite staffing.
Included in this report are the findings of the customer telephone interviews regarding rest area amenities, products and services. Specifically defined are: The key factors that will increase traffic into the
rest stops by encouraging drivers to stop more frequently.
Determinations of other conditions that will influence visitors’ usage of rest area facilities.
Prioritize the improvements that will matter most to customers.
We have always had a good experience at rest areas. We rest and then go on down the road. - Minnesota resident ”
“
The Leadership Factor, Inc. MnDOT Rest Area Amenities Study 2009 Unless otherwise noted, n=600 General Public; n=205 Commercial Drivers
4
II. METHODOLOGY
RESEARCH OVERVIEW QUALITATIVE
Prior to the quantitative phase, there were four focus groups conducted by Strategic Toolbox in March 2009. There was full participation of 37 travelers overall. This included:
Personal travelers who regularly stop at rest areas (10),
Personal travelers who rarely or never stop at rest areas (20), and
Commercial vehicle operators (CVOs), specifically over the road truckers (7).
Additionally, all were pre-screened as:
Having traveled at least one 250-mile trip in the US in the last two years;
Representing a mix of ages, rural and metro living, travel purposes, and traveling alone or with families.
The discussion and probing was largely the same between groups, but somewhat customized to accommodate a reasonable discussion of their experience and attitudes.
QUANTITATIVE
The questionnaire was designed to identify areas that matter the most to drivers in terms of increased visitorship and to separate these needs from attributes that were expected to be in place by drivers. The summary of qualitative findings helped to shape the survey instrument for quantitative portion of the study. The questionnaire used a 10 point scale for most quantitative questions and identified several demographic and behavioral characteristics of each respondent. Respondents were telephoned between June 18th and July 8th, 2009 (calling was interrupted during the holiday weekend 7/3-7/5) The Leadership Factor conducted 805 telephone interviews with respondents from the Midwest in a 5-state area shown below. Interviews were carried out only with drivers who were 18 years old or older and who had traveled at least one 250 mile trip in the US during the last two years. 600 of these respondents were selected from the general public using a purchased random digit dialing list that included people from the following states:
State General Public CVOs
Minnesota 303 100 Iowa 77 23 North Dakota 78 28 South Dakota 67 29 Wisconsin 75 25 Base 600 205 In addition, there were 205 respondents that considered themselves professional truck drivers who were working at least part-time currently and had at least half of their trips driven overnight or ‘long haul’. The names were randomly selected from several Truck Driving Association lists.
These 805 respondents were asked to classify their frequency of stopping at highway rest areas by answering this question: ‘When it comes to trips of 250 miles or more do you consider yourself a: (1) Regular user of highway rest areas (2) an Occasional user, or (3) a Non-user?
The Leadership Factor, Inc. MnDOT Rest Area Amenities Study 2009 Unless otherwise noted, n=600 General Public; n=205 Commercial Drivers
5
The following table segments the population into key subgroups and categorizes the number of respondents in each of these subgroups by frequency of visit. The non-visitor percentage was calculated against the total number of respondents within each subgroup.
Complete confidentiality was guaranteed to respondents and no names provided to Mn/DOT. In order to return a representative sample of drivers, sampling was monitored to maintain an accurate demographic mix, by age, race and gender, based on the predicted census data. Statistical reliability of the sample is held at +/- 4% margin of error at a 95% confidence level overall, and at +/-5% in each regional subgroup.
General Public Subgroups
Regular Visitors
Occasional Visitors
Non Visitors
% Non Visitors
Business Traveler 25 51 9 11%
Travel Alone 50 90 19 12%
Travel w.Others 146 321 46 9%
Travel w.Children 79 198 38 12%
Travel w.Adults <65yrs
149 326 44 8%
Travel w.Adults >65yrs
80 120 10 5%
Travel w.Dog 38 78 15 11%
18-32yrs 9 61 14 17%
33-50yrs 37 118 25 14%
50+yrs 131 189 15 <5%
65+yrs only 59 37 5 <5%
Male 77 163 26 10%
Female 100 205 28 8%
CVOs (all interviews)
112 84 9 4%
The Leadership Factor, Inc. MnDOT Rest Area Amenities Study 2009 Unless otherwise noted, n=600 General Public; n=205 Commercial Drivers
6
III. KEY (SUMMARY OF) FINDINGS The remainder of the report details the quantitative results of the Rest Area Amenities research. These findings have been divided into the following sections:
Amenities (Question 1). Respondents were asked in Q1 of the questionnaire to rate 38 possible rest area amenities in terms of their likelihood to encourage them to stop, assuming the rest areas were clean and safe. Each chart and graph has been ranked by the average score given by respondents and charts with all 38 amenities will identify the amenities which will require the most and the least attention.
Visitor safety (Questions 3a/3b)
Driver safety (Questions 5a/5b)
Influence of Amenities on Visitorship (Question 3) Section IV Conclusions and Recommendations (pages 33-34) Appendices (pages 35-65) The charts and graphs in the Appendices have been created to support the findings from the quantitative phase of this project. The following statements detail the key results of respondents’ feedback. Overall, three quarters of the general public and over 84% of CVO respondents indicated a high likelihood (scores of 8-10 on a 10pt scale) that offering of the improvements which they favored would increase the frequency of their stoppage at highway rest areas. The remainder of the report will focus on defining the top priorities of the General Public and CVOs and their willingness to increase their visitorship if these amenities were offered.
The Leadership Factor, Inc. MnDOT Rest Area Amenities Study 2009 Unless otherwise noted, n=600 General Public; n=205 Commercial Drivers
7
AMENITIES (Q1) Respondents were asked in Q1 to evaluate a total of 38 amenities on a 1-10 scale which measured the likelihood that these amenities, if offered, would encourage them to stop at a rest area with that given feature [assuming the rest areas were fundamentally safe and clean]. These amenities were separated into six categories: (see page 13-15 for a chart listing all amenities, by category, by initial interest).
Activity Areas, Vending Machines, Facilities, Convenience, Information, and Safety
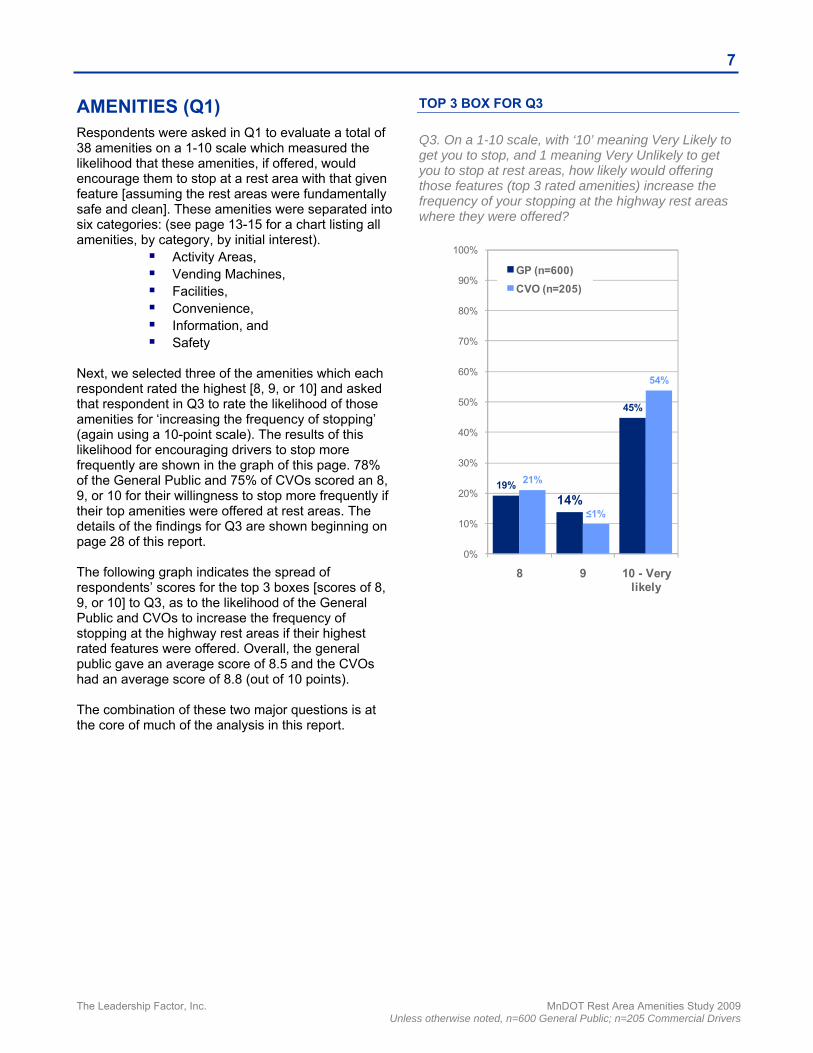
Next, we selected three of the amenities which each respondent rated the highest [8, 9, or 10] and asked that respondent in Q3 to rate the likelihood of those amenities for ‘increasing the frequency of stopping’ (again using a 10-point scale). The results of this likelihood for encouraging drivers to stop more frequently are shown in the graph of this page. 78% of the General Public and 75% of CVOs scored an 8, 9, or 10 for their willingness to stop more frequently if their top amenities were offered at rest areas. The details of the findings for Q3 are shown beginning on page 28 of this report. The following graph indicates the spread of respondents’ scores for the top 3 boxes [scores of 8, 9, or 10] to Q3, as to the likelihood of the General Public and CVOs to increase the frequency of stopping at the highway rest areas if their highest rated features were offered. Overall, the general public gave an average score of 8.5 and the CVOs had an average score of 8.8 (out of 10 points). The combination of these two major questions is at the core of much of the analysis in this report.
TOP 3 BOX FOR Q3
Q3. On a 1-10 scale, with ‘10’ meaning Very Likely to get you to stop, and 1 meaning Very Unlikely to get you to stop at rest areas, how likely would offering those features (top 3 rated amenities) increase the frequency of your stopping at the highway rest areas where they were offered?
19%
14%
45%
21%
≤1%
54%
0%
10%
20%
30%
40%
50%
60%
70%
80%
90%
100%
8 9 10 - Very likely
GP (n=600)
CVO (n=205)
The Leadership Factor, Inc. MnDOT Rest Area Amenities Study 2009 Unless otherwise noted, n=600 General Public; n=205 Commercial Drivers
8
SUMMARY OF REST AREA VISITORS, BY SUBGROUP
Shown below are results of the responses to interest in presented amenities, including facility safety, from the study. Overall observations: The most important amenities within each
questionnaire category were similar between General Public and CVO. However, CVOs were generally more interested in vending machines and items provided through vending machines than the general public. While the general public might benefit from improved vending options, this feature is not likely a key driver that will develop a higher frequency of visitors. Improving the variety and quality of vended offerings may enhance the image of the rest areas, however.
The bottom 6 (least important) potential rest area amenities for all drivers were, 1.) Video games, 2.) Rest area building allowing pets, 3.) Souvenir items, 4.) Pet drinking fountains, 5.) Books on tape or DVD rentals, and 6.) Energy drinks. These features will do little to none to improve visitorship at highway rest areas and should be given the lowest priority.
Frequency of Visits: Regular Visitors – Respondents who called
themselves regular visitors to rest areas represented almost 30% of the general public. These visitors treated rest areas more as a destination, showing more interest in amenities that would be associated with longer visits. Regular visitors were more interested in picnic areas, open lawn areas, family rest rooms, displays and information about the local area and information such as travel brochures, maps and walking trails. Safety-related items, such as 24-hour onsite security, were not as important for Occasional and Non-Visitors, unlike the Occasional and Non-visitors; safety related amenities such as 24 hour on-site security were less important to those using the rest areas more regularly.
Occasional Visitors – Almost two-thirds of the general public stated they occasionally stop at rest areas. Amenities that would most
influence more frequent stopping at rest areas for this subgroup included video surveillance, signs on highway listing amenities and services, traffic/road construction info w/ printable maps/travel directions and free highway maps.
Non-Visitors – 9% of the general public considers themselves to be non-users of rest areas. Not surprisingly, drivers in this group rated almost 90% of the features in the survey significantly lower than average (in terms of the likelihood of causing them to stop more frequently). The only four amenities that were slightly higher than average were energy drinks, books on tape or DVD rentals, video games and wireless Internet access. The highest rated amenity was Video surveillance indicating a perceived lower sense of security.
Gender: Male – over 98% of males felt that rest areas
were very safe or somewhat safe during the day time and 85% felt that they were very safe or somewhat safe during the night time. Males gave lower than average scores for 36 of the 38 amenities. Features that were rated by males as significantly lower than average included 24-hour onsite security guard, 24-hour onsite staff presence, video surveillance, and pet drinking fountains. Female – Females were more interested in
safety related amenities and the most concerned with safety compared to males. 95% of female respondents felt that rest areas were very safe or somewhat safe during the day time, but this number dropped to only 55% who felt they were very safe or somewhat safe during the night time. Females also demonstrated a 30% higher frequency of concern when asked about facility safety. Females rated safety-related amenities, such as 24-hour onsite security guard and Video surveillance much higher than males. Females gave higher influence scores for all amenities except for video games and energy drinks. The influence of family or assisted rest rooms was significantly also higher for females.
The Leadership Factor, Inc. MnDOT Rest Area Amenities Study 2009 Unless otherwise noted, n=600 General Public; n=205 Commercial Drivers
9
Travel Behavior: Business Traveler (based on percent
traveling for business more than 50% of the time) – This group represented 14% of the respondent sample. Similar to the regular visitors, these drivers were less concerned with facility safety, giving lower-than-average scores for features such as Video surveillance, 24-hour on-site security guards, and 24-hour on-site staff presence. They also were less interested in traffic/road construction information, travel brochures for sightseeing, lodging and food, picnic areas, and family or assisted rest rooms. None of the 38 amenities that were asked about were rated higher than average by this group. Travel Alone (based on percent traveling
alone more than 50% of the time) – Those that traveled alone at least 50% of the time gave lower-than-average scores for 24-hr on-site security guard and staff presence, and Travel brochures for sightseeing, lodging/food. Travel with Dog – Respondents in this
category represented almost 22% of the general public population. Naturally, they indicated that pet cleanup supplies, pet exercise areas, and rest area buildings allowing pets were higher-than-average features that would encourage them to stop more frequently.
Age Range: Ages 18-32 – Only 11% of this group
considered themselves regular visitors to rest areas. Conversely, almost 17% considered themselves non-users of rest areas. Drivers under 33 years of age scored significantly higher than the average general public driver for amenities such as energy drinks, microwave ovens, toiletries, video games, books on tape and DVD rentals and souvenir items. They also favored children’s playlots, rest area building with indoor tables, vending machines that accepted credit cards, and wireless Internet access. Interest in Wireless Internet access was almost 25% higher for respondents 18-32 years old compared with other ages. In general, however, Wireless Internet access at rest areas was not in the top 50% of the amenities valued by the other
age brackets. However, they scored below average on their interest in Displays and information about the local area near the rest areas. Drivers in this age bracket also scored significantly lower than average on the perception that stopping at HRAs makes them and others drive more safely.
Ages 33-50 – 21% of this group considered themselves regular visitors to rest areas, and 14% considered themselves non-users of rest areas.
Ages 50+ – 39% of this group considered themselves regular visitors to rest areas, and only 5% considered themselves non-users of rest areas.
Ages 65+ – 58% of this group considered themselves regular visitors to rest areas, and only 5% considered themselves non-users of rest areas. Respondents in this age category had higher than average interest in coffee being offered at rest areas. Conversely, the following amenities were rated much lower than average in terms of influencing them to use rest areas more frequently: wireless Internet access, vending machines that accepted credit cards, ice for coolers, healthy snacks, microwaves, energy drinks, books on tape and DVD rentals, and video games. This age group gave a higher-than-average rating to the perception that stopping at rest areas makes them and others drive more safely.
Signs on the highway listing amenities and services offered was among the top five amenities for all age groups. Direct access from the highway was the most important amenity, along with Adequate parking in the top three for all ages of drivers.
CVOs 54-60% of these professional drivers gave
the highest agreement to the idea that stopping at rest areas makes them and others drive more safely. In terms of amenities, CVOs had higher than average interest in adequate parking and direct access from the highway (their primary needs), weather radar on TV monitors in the
The Leadership Factor, Inc. MnDOT Rest Area Amenities Study 2009 Unless otherwise noted, n=600 General Public; n=205 Commercial Drivers
10
lobbies, audio weather announcements, coffee, wireless Internet access, and books on tape and DVD rentals. Signs on the highway listing amenities offered was among the top five needs for all CVOs. CVO females had a 30-40% higher frequency of mentions than males did regarding facility safety, when asked about concerns with stopping at rest areas. Only 4% of CVOs considered themselves non-users of rest areas. Video surveillance was the top need and expectation for CVO Non-Visitors, paralleling the response from General Public Non-Visitors.
The Leadership Factor, Inc. MnDOT Rest Area Amenities Study 2009 Unless otherwise noted, n=600 General Public; n=205 Commercial Drivers
11
MEAN ATTRIBUTE SCORES FOR EACH SUBGROUP (1 OF 3) Average scores for Q1 based on a 10-pt scale, shown in descending order of the General Public’s overall mean score. Each amenity is color-coded based on the six categories in the questionnaire. General Public CVO
Displays and info about the local area 6.8 7.5 6.7 5.4 6.6 6.7 6.9 6.7 6.8 7.2 6.6 6.0 6.7 7.1 7.0 6.6 7.0 6.4
Q1. Rate the following features on a 1-10 scale, with ‘10’ being the mostly likely to encourage you to stop at a rest area with that feature, and a ‘1’ being least likely to encourage you to stop.
11
The Leadership Factor, Inc. MnDOT Rest Area Amenities Study 2009 Unless otherwise noted, n=600 General Public; n=205 Commercial Drivers
Mean scores were calculated at a 95% confidence level.
The Leadership Factor, Inc. MnDOT Rest Area Amenities Study 2009 Unless otherwise noted, n=600 General Public; n=205 Commercial Drivers
12
MEAN ATTRIBUTE SCORES FOR EACH SUBGROUP (2 OF 3) Average scores for Q1 based on a 10-pt scale, shown in descending order of the General Public’s overall mean score.
Q1. Rate the following features on a 1-10 scale, with ‘10’ being the mostly likely to encourage you to stop at a rest area with that feature, and a ‘1’ being least likely to encourage you to stop.
12
The Leadership Factor, Inc. MnDOT Rest Area Amenities Study 2009 Unless otherwise noted, n=600 General Public; n=205 Commercial Drivers
Mean scores were calculated at a 95% confidence level.
The Leadership Factor, Inc. MnDOT Rest Area Amenities Study 2009 Unless otherwise noted, n=600 General Public; n=205 Commercial Drivers
13
MEAN ATTRIBUTE SCORES FOR EACH SUBGROUP (3 OF 3) Average scores for Q1 based on a 10-pt scale, shown in descending order of the General Public’s overall mean score.
Q1. Rate the following features on a 1-10 scale, with ‘10’ being the mostly likely to encourage you to stop at a rest area with that feature, and a ‘1’ being least likely to encourage you to stop.
13
The Leadership Factor, Inc. MnDOT Rest Area Amenities Study 2009 Unless otherwise noted, n=600 General Public; n=205 Commercial Drivers
Mean scores were calculated at a 95% confidence level.
The Leadership Factor, Inc. MnDOT Rest Area Amenities Study 2009 Unless otherwise noted, n=600 General Public; n=205 Commercial Drivers
14
MEAN ATTRIBUTE DIFFERENCES FOR EACH SUBGROUP (1 OF 3) Shown below are the differences between subgroup scores and the General Public’s overall mean for each amenity. How to read this chart: A green box represents the interest in that amenity (by that respondent group) is significantly higher compared to the general population. Conversely, a red box means interest in that amenity is significantly less than that general population. General Public CVO
Q1. Rate the following features on a 1-10 scale, with ‘10’ being the mostly likely to encourage you to stop at a rest area with that feature, and a ‘1’ being least likely to encourage you to stop.
The Leadership Factor, Inc. MnDOT Rest Area Amenities Study 2009 Unless otherwise noted, n=600 General Public; n=205 Commercial Drivers
The Leadership Factor, Inc. MnDOT Rest Area Amenities Study 2009 Unless otherwise noted, n=600 General Public; n=205 Commercial Drivers
15
MEAN ATTRIBUTE DIFFERENCES FOR EACH SUBGROUP (2 OF 3) Shown below are the differences between subgroup scores and the General Public’s overall mean for each amenity. How to read this chart: A green box represents the interest in that amenity (by that respondent group) is significantly higher compared to the general population. Conversely, a red box means interest in that amenity is significantly less than that general population. General Public CVO
Q1. Rate the following features on a 1-10 scale, with ‘10’ being the mostly likely to encourage you to stop at a rest area with that feature, and a ‘1’ being least likely to encourage you to stop.
The Leadership Factor, Inc. MnDOT Rest Area Amenities Study 2009 Unless otherwise noted, n=600 General Public; n=205 Commercial Drivers
15
The Leadership Factor, Inc. MnDOT Rest Area Amenities Study 2009 Unless otherwise noted, n=600 General Public; n=205 Commercial Drivers
16
MEAN ATTRIBUTE DIFFERENCES FOR EACH SUBGROUP (3 OF 3) Shown below are the differences between subgroup scores and the General Public’s overall mean for each amenity. How to read this chart: A green box represents the interest in that amenity (by that respondent group) is significantly higher compared to the general population. Conversely, a red box means interest in that amenity is significantly less than that general population.
Q1. Rate the following features on a 1-10 scale, with ‘10’ being the mostly likely to encourage you to stop at a rest area with that feature, and a ‘1’ being least likely to encourage you to stop.
The Leadership Factor, Inc. MnDOT Rest Area Amenities Study 2009 Unless otherwise noted, n=600 General Public; n=205 Commercial Drivers
16
The Leadership Factor, Inc. MnDOT Rest Area Amenities Study 2009 Unless otherwise noted, n=600 General Public; n=205 Commercial Drivers
17
Q1. Rate the following features on a 1-10 scale, with ‘10’ being the mostly likely to encourage you to stop at a rest area with that feature, and a ‘1’ being least likely to encourage you to stop.
GENERAL PUBLIC: TOP 10 AMENITY SCORES
Shown below are the average scores for the General Public’s responses to Q1 (Rate the following features on a 1-10 scale, with ‘10’ being the mostly likely to encourage you to stop at a rest area with that feature, and a ‘1’ being least likely to encourage you to stop.), the likelihood that each attribute would encourage them to stop at rest areas more frequently.
Three of the top four amenities came from the
Convenience category. Four of the other top ten amenities came from the
Information category. Two of the other top ten amenities were safety-
related. Only one of the top ten amenities (flush toilets)
came from the Facility category.
Travel brochures for sightseeing, lodging and food
24-hour onsite security guard
Weather radar on TV monitor in lobby
Free highway maps
Traffic and road construction information w/ printable maps
and travel directions
Video surveillance
Signs on highway listing amenities & services offered at
the rest area
Adequate parking
Flush toilets
Direct access from highway
28.00
38.00
6.0 6.5 7.0 7.5 8.0 8.5 9.0 9.5 10.0
Ge
ne
ral P
ub
lic (
n=
60
0)
Average Amenity Score Most likely to encourage you to stop
Less likely to encourage you to stop
The Leadership Factor, Inc. MnDOT Rest Area Amenities Study 2009 Unless otherwise noted, n=600 General Public; n=205 Commercial Drivers
18
Q1. Rate the following features on a 1-10 scale, with ‘10’ being the mostly likely to encourage you to stop at a rest area with that feature, and a ‘1’ being least likely to encourage you to stop.
GENERAL PUBLIC: TOP 10 AMENITY SCORES BY VISITOR FREQUENCYSUBGROUP
Shown below are the average scores for the General Public’s responses to Q1 (Rate the following features on a 1-10 scale, with ‘10’ being the mostly likely to encourage you to stop at a rest area with that feature, and a ‘1’ being least likely to encourage you to stop.), the likelihood that each attribute would encourage them to stop at rest areas more frequently. The top 10 highest rated amenities were selected for the visitor frequency categories and plotted below. Almost all of the highest rated attributes for the Non visitors are rated lower than the bottom end of the Occasional and Regular visitors top ten. The lower scores for this category of visitors indicates that even the highest rated attributes for the Non-Visitors will not be likely to encourage stopping at rest areas.
Direct access and Flush toilets were in the Top
Three amenities for all visitor groups. Adequate parking was rated highly by Regular and Occasional Visitors, as well.
Video surveillance is the top need and expectation for General Public Non-Visitors
24-hour on-site security guard/staff presence is not in the Top Ten amenities for Regular visitors, while Travel brochures for sightseeing, lodging and food were more likely to make them stop more frequently
Direct access from highway
Adequate parking
Flush toiletsSigns on highway listing amenities and services
Video surveillanceTraffic/road construction information w/ printable maps/travel directions
Free highway maps
Weather radar on TV monitor in lobby
Travel brochures for sightseeing, lodging and foodMaps
Direct access from highway
Flush toilets
Adequate parkingSigns on highway listing amenities and services
Traffic/road construction information w/ printable maps/travel directions
Video surveillance
Free highway maps
24-hour onsite security guard
Weather radar on TV monitor in lobby
24-hour onsite staff presence
Video surveillance
Flush toiletsDirect access from highway
Traffic/road construction information w/ printable maps/travel directionsSigns on highway listing amenities and
services24-hour onsite security guard
Adequate parking
24-hour onsite staff presence
Free highway maps
Weather radar on TV monitor in lobby
0.00
10.00
20.00
30.00
6.0 6.5 7.0 7.5 8.0 8.5 9.0 9.5 10.0
Re
gu
lar
Vis
ito
rs (
n=
177
)O
cca
sio
nal
Vis
ito
rs(n
=36
9)
No
n V
isit
ors
(n=
54
)
Average Amenity Score (General Public) Most likely to encourage you to stop
Less likely to encourage you to stop
The Leadership Factor, Inc. MnDOT Rest Area Amenities Study 2009 Unless otherwise noted, n=600 General Public; n=205 Commercial Drivers
19
Adequate parking
Direct access from highway
Flush toilets
Weather radar on TV monitor in lobby
Video surveillanceTraffic/road construction information w/ printable maps/travel directions
Audio weather announcements in lobbySigns on highway listing amenities and services
24-hour onsite staff presence
Coffee
Direct access from highway
Adequate parking
Flush toilets
Signs on highway listing amenities and servicesVideo surveillanceTraffic/road construction information w/
printable maps/travel directions
Weather radar on TV monitor in lobby
Audio weather announcements in lobby
Free highway maps
24-hour onsite staff presence
Video surveillanceTraffic/road construction information w/
printable maps/travel directionsDirect access from highway
Adequate parkingSigns on highway listing amenities and services
Rest area Flush toilets
24-hour onsite security guard
24-hour onsite staff presenceTravel brochures for sightseeing,
lodging and food
Audio weather announcements in lobby
0.00
10.00
20.00
30.00
6.0 6.5 7.0 7.5 8.0 8.5 9.0 9.5 10.0
Re
gu
lar
Vis
ito
rs (
n=
112
)O
cca
sio
na
l V
isit
ors
(n
=8
4)
No
n V
isit
ors
(n
=9)
Average Amenity Score (CVO)Most likely to encourage
you to stopLess likely to encourage you to stop
Q1. Rate the following features on a 1-10 scale, with ‘10’ being the mostly likely to encourage you to stop at a rest area with that feature, and a ‘1’ being least likely to encourage you to stop.
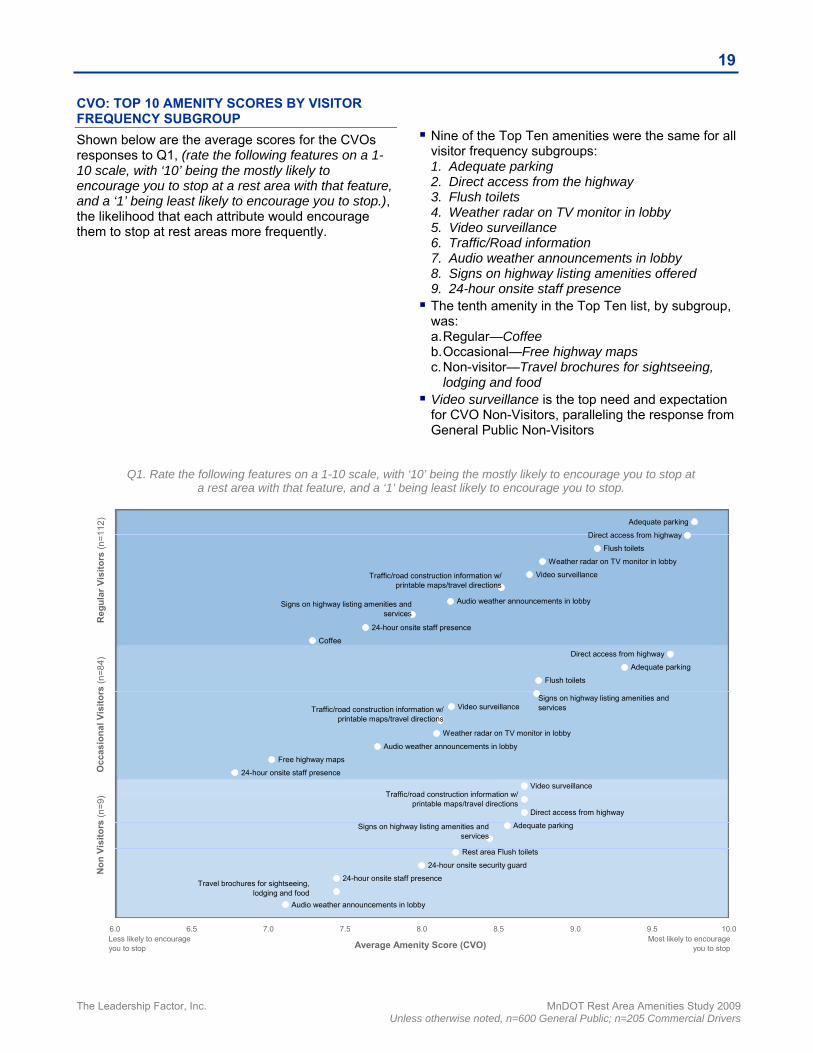
CVO: TOP 10 AMENITY SCORES BY VISITOR FREQUENCY SUBGROUP
Shown below are the average scores for the CVOs responses to Q1, (rate the following features on a 1-10 scale, with ‘10’ being the mostly likely to encourage you to stop at a rest area with that feature, and a ‘1’ being least likely to encourage you to stop.), the likelihood that each attribute would encourage them to stop at rest areas more frequently.
Nine of the Top Ten amenities were the same for all
visitor frequency subgroups: 1. Adequate parking 2. Direct access from the highway 3. Flush toilets 4. Weather radar on TV monitor in lobby 5. Video surveillance 6. Traffic/Road information 7. Audio weather announcements in lobby 8. Signs on highway listing amenities offered 9. 24-hour onsite staff presence The tenth amenity in the Top Ten list, by subgroup,
was: a. Regular—Coffee b. Occasional—Free highway maps c. Non-visitor—Travel brochures for sightseeing,
lodging and food Video surveillance is the top need and expectation
for CVO Non-Visitors, paralleling the response from General Public Non-Visitors
The Leadership Factor, Inc. MnDOT Rest Area Amenities Study 2009 Unless otherwise noted, n=600 General Public; n=205 Commercial Drivers
20
24-hour onsite staf f presence
Travel brochures for sightseeing, lodging/food
Weather radar on TV monitor in lobby
Video surveillance
Free highway maps
Traf f ic/road construction info w/ printable maps/travel directions
Signs on highway listing amenities & services of fered
Adequate parking
Flush toilets
Direct access f rom highway
Weather radar on TV monitor in lobby
24-hour onsite staf f presence
24-hour onsite security guard
Free highway maps
Traf f ic/road construction info w/ printable maps/travel directions
Signs on highway listing amenities & services of fered
Video surveillance
Adequate parking
Flush toilets
Direct access f rom highway
0.00
10.00
20.00
6.0 6.5 7.0 7.5 8.0 8.5 9.0 9.5 10.0
Fe
ma
le (n
=33
4)
Ma
le (
n=
266
)
Average Amenity Score (General Public)Most likely to encourage
you to stopLess likely to encourage you to stop
Q1. Rate the following features on a 1-10 scale, with ‘10’ being the mostly likely to encourage you to stop at a rest area with that feature, and a ‘1’ being least likely to encourage you to stop.
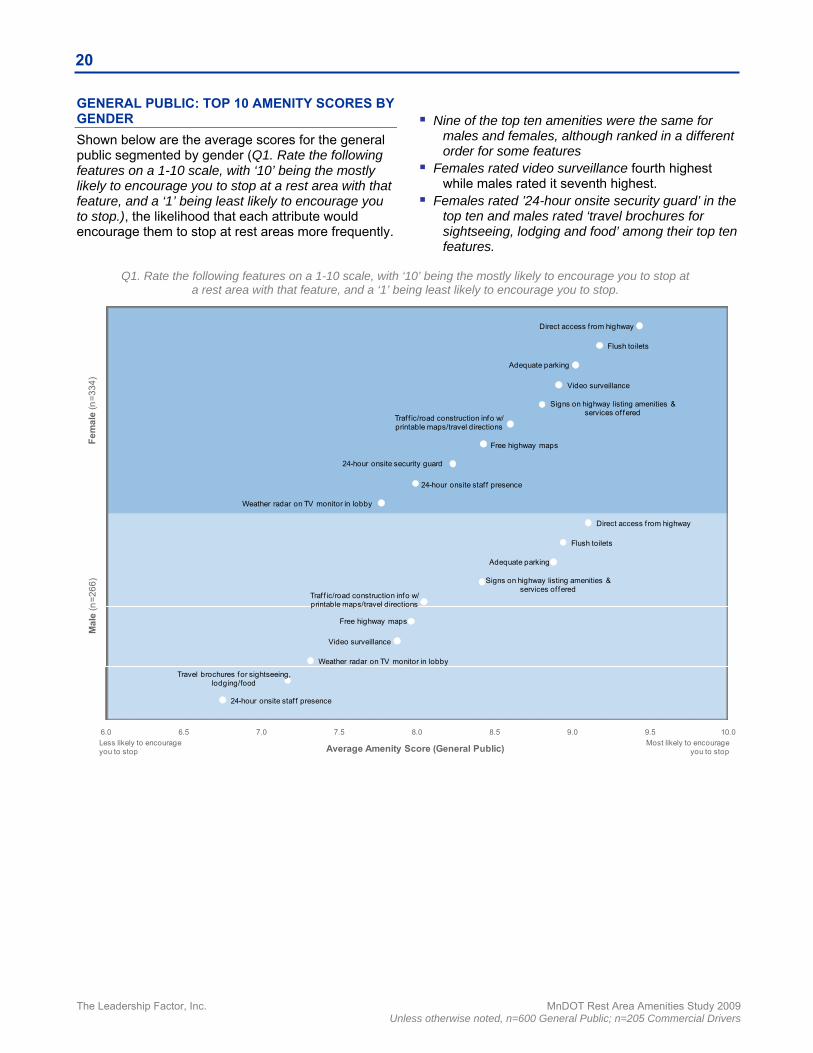
GENERAL PUBLIC: TOP 10 AMENITY SCORES BY GENDER
Shown below are the average scores for the general public segmented by gender (Q1. Rate the following features on a 1-10 scale, with ‘10’ being the mostly likely to encourage you to stop at a rest area with that feature, and a ‘1’ being least likely to encourage you to stop.), the likelihood that each attribute would encourage them to stop at rest areas more frequently.
Nine of the top ten amenities were the same for
males and females, although ranked in a different order for some features
Females rated video surveillance fourth highest while males rated it seventh highest.
Females rated ’24-hour onsite security guard’ in the top ten and males rated ‘travel brochures for sightseeing, lodging and food’ among their top ten features.
The Leadership Factor, Inc. MnDOT Rest Area Amenities Study 2009 Unless otherwise noted, n=600 General Public; n=205 Commercial Drivers
21
Q1. Rate the following features on a 1-10 scale, with ‘10’ being the mostly likely to encourage you to stop at a rest area with that feature, and a ‘1’ being least likely to encourage you to stop.
Direct access from highway
Flush toilets
Adequate parking
Signs on highway listing amenities & services offered
Traffic/road construction info w/ printable maps/travel directions
Free highway maps
Video surveillance
Weather radar on TV monitor in lobby
Travel brochures for sightseeing, lodging/food24-hour onsite security guard
Direct access from highway
Flush toilets
Adequate parkingSigns on highway listing amenities & services offered
Video surveillanceTraffic/road construction info w/ printable maps/travel directions
Free highway mapsWeather radar on TV monitor in lobby
24-hour onsite security guardTravel brochures for sightseeing, lodging/food
Direct access from highway
Flush toilets
Adequate parkingVideo surveillance
Signs on highway listing amenities & services offered
Traffic/road construction info w/ printable maps/travel directions
Free highway maps
24-hour onsite staff presence
24-hour onsite security guard
Weather radar on TV monitor in lobby
0.00
10.00
20.00
30.00
6.0 6.5 7.0 7.5 8.0 8.5 9.0 9.5 10.0
50+
(n
=3
36)
33-
50 (
n=18
0)
18-3
2 (n
=84
)
Average Amenity Score (General Public)Most likely to encourage
you to stopLess likely to encourage you to stop
GENERAL PUBLIC: TOP 10 AMENITY SCORES BY AGE
Shown below are the average scores for the general public segmented by age (Q1. Rate the following features on a 1-10 scale, with ‘10’ being the mostly likely to encourage you to stop at a rest area with that feature, and a ‘1’ being least likely to encourage you to stop.), the likelihood that each attribute would encourage them to stop at rest areas more frequently.
Direct access from the highway was the most important along with Adequate Parking in the top 3 for all subgroups of the 38 rest area features for all drivers of all ages, indicating that convenience and optimum use of their time mattered a great deal.
Six of the remaining seven amenities in the Top Ten were also the same for all age groups
Signs on the highway listing amenities and services offered was the among the Top Five amenities for all age groups.
Differences in the Top Ten amenities were: a. The 33-50 and 50+ age groups ranked Travel
brochures in the Top Ten b. The 18-32 age bracket ranked 24-hour onsite
staff presence in the Top Ten
The Leadership Factor, Inc. MnDOT Rest Area Amenities Study 2009 Unless otherwise noted, n=600 General Public; n=205 Commercial Drivers
22
VISITOR SAFETY (Q3A/B) In addition to asking about amenities that would encourage rest area visitorship, respondents were also asked about their perceptions of the safety at rest area facilities during the nighttime and daytime. Travelers were asked to respond using a scale of, ‘Very Safe’, ‘Somewhat Safe’, ‘Somewhat Unsafe’ and ‘Very Unsafe’.
VISITOR SAFETY FINDINGS
a. When asked what concerns drivers had about stopping at rest areas, visitor safety (in general) was the top concern, mentioned by over 50% for the general public and almost 40% for CVOs. This information parallels the findings from the qualitative phase of the research, in which CVOs and personal travelers shared ideas about the following top priorities for rest area improvements: Well lit throughout Video surveillance (if confident that someone
was watching and would respond if needed) 24-hr. security or someone on site
b. Encountering people appearing suspicious, including prostitutes and strangers was the next highest specific concern regarding safety mentioned.
c. Three out of four respondents stopped at places other than rest areas 30% or more of the time when they travel. Of these, over 8 out of 10 consider rest areas less than very safe during the day and somewhat or very unsafe during the night time.
d. Both CVO and General Public Females also had 30-40% higher frequency of mentions than Males regarding visitor safety.
e. The other top concern for CVOs was the lack of parking late at night. Regular CVO visitors rated sleep as the second most important reason for stopping at highway rest areas.
f. 96% of the general public rated rest areas very safe or somewhat safe during the daytime, versus 68% during the nighttime, however, the percentage rating rest areas somewhat safe rose from 29% during the day to 48% during the night.
g. CVO females regarded Video surveillance 12% higher and 24-hour onsite security guard 23% higher than CVO Males, in terms of influencing their willingness to stop at rest areas.
h. General public females were 5-9% above average for all 3 safety questions (Video surveillance, 24-hour onsite security guard and 24-hour onsite staff presence)
The Leadership Factor, Inc. MnDOT Rest Area Amenities Study 2009 Unless otherwise noted, n=600 General Public; n=205 Commercial Drivers
23
SAFETY DURING THE NIGHTTIME AND DAYTIME
The graph below indicates in greater detail the General Public responses, segmented by age bracket, to questions Q3A and Q3B regarding the safety of drivers and how they feel stopping during the day or during the nighttime hours. 64-71% of all General Public age groups
rated rest areas Very Safe or Somewhat Safe during the Nighttime
94-98% of all General Public age groups rated rest areas Very Safe or Somewhat Safe during the Daytime
Note: Comments in response to Q4: “What concerns, if any, do you have about stopping at highway rest areas during the day?” are shown the appendices, Detailed Findings.
Q3A. In general, how safe do you feel about stopping at highway rest areas during nighttime hours? Q3B. In general, how safe do you feel about stopping at highway rest areas during the day?
15%
21%
21%
20%
65%
60%
71%
75%
51%
43%
50%
49%
29%
35%
26%
23%
19%
24%
18%
20%
6%
4%
2%
2%
14%
12%
11%
12%
1%
0% 25% 50% 75% 100%
18-32 (n=84)
33-50 (n=180)
50+ (n=336)
65+ (n=101)
18-32 (n=84)
33-50 (n=180)
50+ (n=336)
65+ (n=101)
Sa
fety
du
rin
g N
igh
ttim
e h
ours
(Q3
A)
Saf
ety
du
ring
the
day
(Q3
B)
Very safe Somewhat safe Somewhat unsafe Very unsafe
The Leadership Factor, Inc. MnDOT Rest Area Amenities Study 2009 Unless otherwise noted, n=600 General Public; n=205 Commercial Drivers
24
SAFETY DURING THE NIGHTTIME AND DAYTIME, BY GENDER
33%
52%
13%
2%10%
45%
25%19%
0%
25%
50%
75%
100%
Very safe Somewhat safe Somewhat unsafe Very unsafe
Q3a. In general, how safe do you feel about stopping at highway rest areas during nighttime hours?
Male (n=266)Female (n=334)
Nig
htt
ime
79%
20%
2% ≤1%
58%
37%
5%≤1%
0%
25%
50%
75%
100%
Very safe Somewhat safe Somewhat unsafe Very unsafe
Q3b. In general, how safe do you feel about stopping at highway rest areas during the day?
Male (n=266)Female (n=334)
Da
ytim
e
The Leadership Factor, Inc. MnDOT Rest Area Amenities Study 2009 Unless otherwise noted, n=600 General Public; n=205 Commercial Drivers
25
SAFETY ATTRIBUTES (Q1F)
Respondents were asked to rate their likelihood that these safety amenities might encourage them to stop at rest areas. These amenities related to visitor safety rated high on the overall listing of amenities for all drivers. Video surveillance was rated 1.0-1.1 points higher than 24-hour onsite staff presence and 24-hour onsite security guards by the General Public and 1.2-1.5 points higher by CVOs. Females from the General Public rated video surveillance 1.2 points higher than males. Q1. Rate the following features on a 1-10 scale, with ‘10’ being the mostly likely to encourage you to stop at a rest area with that feature, and a ‘1’ being least likely to encourage you to stop. GENERAL PUBLIC/CVO
GENDER
6.8
6.7
7.9
8.0
8.2
8.9
1 2 3 4 5 6 7 8 9 10
Video surveillance
24-hour onsite staff presence
24-hour onsite security guard
Male (n=266)
Female (n=334)
VISITORSHIP
8.8
7.4
7.3
8.4
7.6
7.8
7.6
6.9
7.0
1 2 3 4 5 6 7 8 9 10
Video surveillance
24-hour onsite staff presence
24-hour onsite security guard
Regular Visitor (n=177)
Occasional Visitor (n=369)
Non Visitor (n=54)
8.5
7.4
7.5
8.5
7.3
7.0
1 2 3 4 5 6 7 8 9 10
Video surveillance
24-hour onsite staff presence
24-hour onsite security guard
GP (n=600)
CVO (n=205)
The Leadership Factor, Inc. MnDOT Rest Area Amenities Study 2009 Unless otherwise noted, n=600 General Public; n=205 Commercial Drivers
26
DRIVER SAFETY (Q5A/B) Respondents were also asked their feelings about the relationship between driving safety on the highway and the availability of rest areas. Again, they used a 10 pt scale, where 10 represented ‘Strong agreement’ and 1 meant ‘Strong disagreement’. First they were asked their feelings about stopping at rest areas making them personally safer drivers on the highway. The General Public scored an average 7.7, while the mean score for CVOs was 8.4. Next, drivers were asked whether they felt stopping at rest areas makes others drive more safely on the highway. The General Public scored an average 7.6, while the CVOs mean score was 8.1. Below are their levels of agreement based on the same 10 point scale. (Agree = scores of 8,9,10, Neutral = 4, 5, 6, 7, and Disagree = 1, 2, 3)
DRIVER SAFETY FINDINGS
a. Professionals (CVOs) recognize that stopping at rest areas improves their safety as drivers on the road. This group scored their agreement with the statements ‘Stopping at rest areas makes you personally a safer driver on the highway’ and ‘Stopping at rest areas makes others drive more safely on the highway’ 7% higher than the general public. 15% more of CVO respondents scored the personal driving safety question a ‘10’ compared with the general public’s response.
b. General public non-visitors perceive the effect of stopping at rest areas for personal driver safety as 38.0% lower than Regular visitors.
c. CVO non-visitors perceive the effect of stopping at rest areas for personal driver safety as 52% lower than Regular visitors.
d. Drivers who are 50+ years of age perceive driver safety as 8% higher than average and 52% higher than non-visitors.
e. Approximately 25% of the general public sees little relationship between driver safety (theirs and others) and rest area visitorship. These drivers gave scores of 1-5 to the driver safety questions. Approximately 75% of the general public, on the other hand, scored 6-10 on this relationship representing a marketing opportunity to this portion of the public.
Q5a. Stopping at rest areas makes you personally a safer driver on the highway.
Q5b. Stopping at rest areas makes others drive more safely on the highway.
78%
63%
14%
27%
7%
10%
0% 20% 40% 60% 80% 100%
CVO (n=202)
General Public (n=597)
Agree (8‐10) Neutral (4‐7) Disagree (1‐3)
74%
61%
19%
31%
7%
8%
0% 20% 40% 60% 80% 100%
CVO (n=201)
General Public (n=596)
Agree (8‐10) Neutral (4‐7) Disagree (1‐3)
The Leadership Factor, Inc. MnDOT Rest Area Amenities Study 2009 Unless otherwise noted, n=600 General Public; n=205 Commercial Drivers
27
RELATIONSHIP BETWEEN DRIVER SAFETY AND REST AREAS, BY SUBGROUPS
Below are the average scores for the subgroups listed for Q5b. Q5b. Stopping at rest areas makes others drive more safely on the highway
8.6
7.4
5.7
7.5
7.6
7.5
7.2
7.6
8.0
7.4
6.4
7.3
8.1
8.6
7.7
7.5
8.1
1 2 3 4 5 6 7 8 9 10
Regular Visitors (n=177)
Occasional Visitors (n=369)
Non Visitors (n=54)
Business Traveler (n=85)
Travel Alone (n=160)
Travel w.Others (n=514)
Travel w.Children (n=316)
Travel w.Adults <65yrs (n=520)
Travel w.Adults >65yrs (n=211)
Travel w.Dog (n=131)
18-32yrs (n=84)
33-50yrs (n=180)
50+yrs (n=336)
65+yrs only (n=101)
Male (n=266)
Female (n=334)
CVOs (n=205)
The Leadership Factor, Inc. MnDOT Rest Area Amenities Study 2009 Unless otherwise noted, n=600 General Public; n=205 Commercial Drivers
28
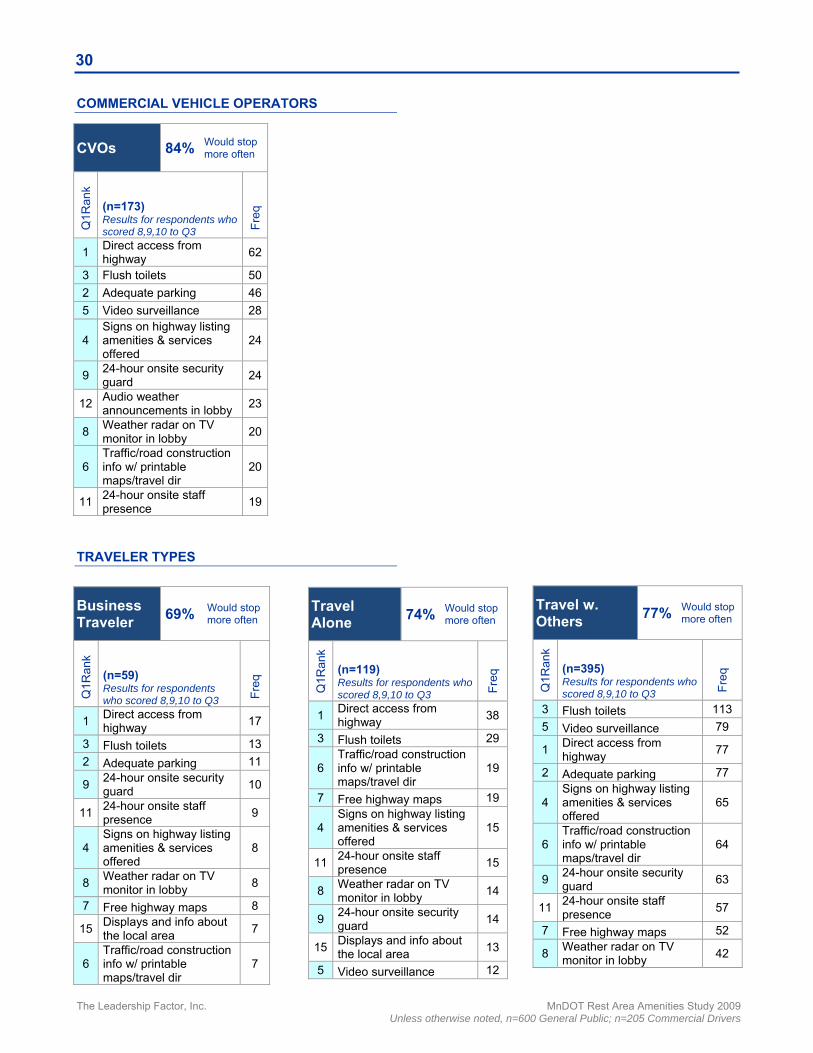
LIKELIHOOD OF STOPPING MORE FREQUENTLY (Q3) INCREASING THE FREQUENCY OF VISITS FOR EACH GROUP OF VISITORS
The amenities that were scored highest in Q1 were bundled and the top three attributes were randomly selected and named for each respondent. Each respondent, then, was asked “Thinking about the features which you just rated the highest in previous sections, how likely would offering those features increase the frequency of your stopping at the highway rest areas where they were offered? Your top rated items were 1… 2… 3…” The tables shown below illustrate the frequency of mentions, by overall General Public and CVOs and also by individual subgroups, for the ‘top 3 rated amenities’ of the Q1 series of attributes as read back to the respondents for question Q3. The results shown for respondents who scored an 8, 9, or 10 to Q3. (Q3.On a 1-10 scale, with ‘10’ meaning Very Likely to get you to stop, and 1 meaning Very Unlikely to get you to stop at rest areas, how likely would offering those features (top 3 rated amenities) increase the frequency of your stopping at the highway rest areas where they were offered?)
The column entitled Q1 rank illustrates a strong relationship between the top three amenities that were selected for Q3 and the overall results which have been analyzed in the earlier sections of this report. The blue shaded numbers on the left of the table represent the rank order of the top 10 amenities (among the general public, from Q1) which scored each amenity for ‘most likely encouraging you to stop’. This rank order is constant, that is; direct access from highway is always #1, adequate parking is always #2, and so on. This Q1 rank order is provided as a reference so the reader may view how each subgroup responded differently compared to the general population once we added the second question (Q3) ‘whether this amenity is likely to increase their frequency of stopping’. The order of the list in each box is the rank order, by subgroup, for – likelihood to increase the frequency of stopping at a rest area if this amenity was present.
General Public
78% Would stop more often
Q1R
ank
(n=466) Results for respondents who scored 8,9,10 to Q3 F
req
3 Flush toilets 128
1 Direct access from highway
103
5 Video surveillance 84
2 Adequate parking 81
4 Signs on highway listing amenities & services offered
75
6 Traffic/road construction info w/ printable maps/travel dir
73
9 24-hour onsite security guard
72
11 24-hour onsite staff presence
67
7 Free highway maps 63
8 Weather radar on TV monitor in lobby
51
Rank order of the top 10 amenities, which scored each amenity for ‘most likely encouraging you to stop’. This order is constant for all the subgroups.
In order of frequency of top 3 highest rated amenities.
Percent of subgroup who scored Q3 with an 8, 9 or 10.
The Leadership Factor, Inc. MnDOT Rest Area Amenities Study 2009 Unless otherwise noted, n=600 General Public; n=205 Commercial Drivers
29
GENDER
USER FREQUENCY
Male 73% Would stop more often
Q1R
ank
(n=195) Results for respondents who scored 8,9,10 to Q3 F
req
3 Flush toilets 49
1 Direct access from highway
47
2 Adequate parking 45
4 Signs on highway listing amenities & services offered
35
5 Video surveillance 31
6 Traffic/road construction info w/ printable maps/travel dir
30
7 Free highway maps 26
8 Weather radar on TV monitor in lobby
25
9 24-hour onsite security guard
23
11 24-hour onsite staff presence
22
Female 81% Would stop more often
Q1R
ank
(n=271) Results for respondents who scored 8,9,10 to Q3 F
req
3 Flush toilets 79
1 Direct access from highway
56
5 Video surveillance 53
9 24-hour onsite security guard
49
11 24-hour onsite staff presence
45
6 Traffic/road construction info w/ printable maps/travel dir
43
4 Signs on highway listing amenities & services offered
40
7 Free highway maps 37
2 Adequate parking 36
8 Weather radar on TV monitor in lobby
26
Non Visitors 52% Would stop more often
Q1R
ank
(n=28) Results for respondents who scored 8,9,10 to Q3 F
req
3 Flush toilets 9
7 Free highway maps 7
5 Video surveillance 6
1 Direct access from highway
5
6 Traffic/road construction info w/ printable maps/travel dir
5
14 Maps 4
1124-hour onsite staff presence
4
9 24-hour onsite security guard
4
2 Adequate parking 3
12Audio weather announcements in lobby
3
Regular Visitors
88% Would stop more often
Q1R
ank
(n=155) Results for respondents who scored 8,9,10 to Q3 F
req
3 Flush toilets 44
1 Direct access from highway
38
2 Adequate parking 26
6 Traffic/road construction info w/ printable maps/travel dir
24
7 Free highway maps 24
4 Signs on highway listing amenities & services offered
22
5 Video surveillance 22
8 Weather radar on TV monitor in lobby
20
11 24-hour onsite staff presence
19
14 Maps 17
Occasional Visitors
77% Would stop more often
Q1R
ank
(n=283) Results for respondents who scored 8,9,10 to Q3 F
req
3 Flush toilets 75
1 Direct access from highway
60
5 Video surveillance 56
9 24-hour onsite security guard
53
2 Adequate parking 52
4 Signs on highway listing amenities & services offered
51
6 Traffic/road construction info w/ printable maps/travel dir
44
1124-hour onsite staff presence
44
7 Free highway maps 32
8 Weather radar on TV monitor in lobby
29
The Leadership Factor, Inc. MnDOT Rest Area Amenities Study 2009 Unless otherwise noted, n=600 General Public; n=205 Commercial Drivers
30
COMMERCIAL VEHICLE OPERATORS
TRAVELER TYPES
CVOs 84% Would stop more often
Q1R
ank
(n=173) Results for respondents who scored 8,9,10 to Q3 F
req
1 Direct access from highway
62
3 Flush toilets 50
2 Adequate parking 46
5 Video surveillance 28
4 Signs on highway listing amenities & services offered
24
9 24-hour onsite security guard
24
12 Audio weather announcements in lobby
23
8 Weather radar on TV monitor in lobby
20
6 Traffic/road construction info w/ printable maps/travel dir
20
11 24-hour onsite staff presence
19
Travel Alone
74% Would stop more often
Q1R
ank
(n=119) Results for respondents who scored 8,9,10 to Q3 F
req
1 Direct access from highway
38
3 Flush toilets 29
6 Traffic/road construction info w/ printable maps/travel dir
19
7 Free highway maps 19
4 Signs on highway listing amenities & services offered
15
1124-hour onsite staff presence
15
8 Weather radar on TV monitor in lobby
14
9 24-hour onsite security guard
14
15Displays and info about the local area
13
5 Video surveillance 12
Business Traveler
69% Would stop more often
Q1R
ank
(n=59) Results for respondents who scored 8,9,10 to Q3 F
req
1 Direct access from highway
17
3 Flush toilets 13
2 Adequate parking 11
9 24-hour onsite security guard
10
11 24-hour onsite staff presence
9
4 Signs on highway listing amenities & services offered
8
8 Weather radar on TV monitor in lobby
8
7 Free highway maps 8
15 Displays and info about the local area
7
6 Traffic/road construction info w/ printable maps/travel dir
7
Travel w. Others
77% Would stop more often
Q1R
ank
(n=395) Results for respondents who scored 8,9,10 to Q3 F
req
3 Flush toilets 113
5 Video surveillance 79
1 Direct access from highway
77
2 Adequate parking 77
4 Signs on highway listing amenities & services offered
65
6 Traffic/road construction info w/ printable maps/travel dir
64
9 24-hour onsite security guard
63
1124-hour onsite staff presence
57
7 Free highway maps 52
8 Weather radar on TV monitor in lobby
42
The Leadership Factor, Inc. MnDOT Rest Area Amenities Study 2009 Unless otherwise noted, n=600 General Public; n=205 Commercial Drivers
31
TRAVELER TYPES (CONTINUED)
Travel w. Children
78% Would stop more often
Q1R
ank
(n=246) Results for respondents who scored 8,9,10 to Q3 F
req
3 Flush toilets 70
1 Direct access from highway
55
9 24-hour onsite security guard
45
5 Video surveillance 45
2 Adequate parking 44
4 Signs on highway listing amenities & services offered
42
6 Traffic/road construction info w/ printable maps/travel dir
34
11 24-hour onsite staff presence
33
7 Free highway maps 31
8 Weather radar on TV monitor in lobby
30
Travel w. Adults <65
78% Would stop more often
Q1R
ank
(n=404) Results for respondents who scored 8,9,10 to Q3 F
req
3 Flush toilets 119
1 Direct access from highway
91
5 Video surveillance 75
2 Adequate parking 72
4 Signs on highway listing amenities & services offered
64
9 24-hour onsite security guard
64
6 Traffic/road construction info w/ printable maps/travel dir
62
1124-hour onsite staff presence
59
7 Free highway maps 55
8 Weather radar on TV monitor in lobby
46
Travel w. Dog
78% Would stop more often
Q1R
ank
(n=102) Results for respondents who scored 8,9,10 to Q3 F
req
3 Flush toilets 24
1 Direct access from highway
22
2 Adequate parking 20
9 24-hour onsite security guard
17
5 Video surveillance 17
4 Signs on highway listing amenities & services offered
15
11 24-hour onsite staff presence
15
6 Traffic/road construction info w/ printable maps/travel dir
13
7 Free highway maps 12
15 Displays and info about the local area
10
Travel w. Adults >65
80% Would stop more often
Q1R
ank
(n=168) Results for respondents who scored 8,9,10 to Q3 F
req
3 Flush toilets 51
1 Direct access from highway
42
5 Video surveillance 32
9 24-hour onsite security guard
31
6 Traffic/road construction info w/ printable maps/travel dir
27
2 Adequate parking 25
7 Free highway maps 25
1124-hour onsite staff presence
21
4 Signs on highway listing amenities & services offered
17
8 Weather radar on TV monitor in lobby
16
The Leadership Factor, Inc. MnDOT Rest Area Amenities Study 2009 Unless otherwise noted, n=600 General Public; n=205 Commercial Drivers
32
TRAVELER TYPES (CONTINUED)
Age 18-32 yrs
77% Would stop more often
Q1R
ank
(n=65) Results for respondents who scored 8,9,10 to Q3 F
req
3 Flush toilets 16
1 Direct access from highway
13
2 Adequate parking 12
9 24-hour onsite security guard
12
4 Signs on highway listing amenities & services offered
11
5 Video surveillance 11
6 Traffic/road construction info w/ printable maps/travel dir
10
22 Wireless Internet access 9
11 24-hour onsite staff presence
9
8 Weather radar on TV monitor in lobby
6
Age 33-49 yrs
82% Would stop more often
Q1R
ank
(n=148) Results for respondents who scored 8,9,10 to Q3 F
req
3 Flush toilets 42
1 Direct access from highway
30
4 Signs on highway listing amenities & services offered
27
5 Video surveillance 26
9 24-hour onsite security guard
24
2 Adequate parking 21
11 24-hour onsite staff presence
21
6 Traffic/road construction info w/ printable maps/travel dir
19
7 Free highway maps 17
15 Displays and info about the local area
15
Age 65+ yrs 72% Would stop more often
Q1R
ank
(n=73) Results for respondents who scored 8,9,10 to Q3 F
req
3 Flush toilets 25
1 Direct access from highway
18
5 Video surveillance 16
7 Free highway maps 13
2 Adequate parking 12
4 Signs on highway listing amenities & services offered
12
12 Travel brochures for sightseeing, lodging/food
12
6 Traffic/road construction info w/ printable maps/travel dir
11
11 24-hour onsite staff presence
10
15 Displays and info about the local area
8
Age 50+ yrs 75% Would stop more often
Q1R
ank
(n=253) Results for respondents who scored 8,9,10 to Q3 F
req
3 Flush toilets 70
1 Direct access from highway
60
2 Adequate parking 48
5 Video surveillance 47
6 Traffic/road construction info w/ printable maps/travel dir
44
7 Free highway maps 42
4 Signs on highway listing amenities & services offered
37
1124-hour onsite staff presence
37
9 24-hour onsite security guard
36
8 Weather radar on TV monitor in lobby
31
The Leadership Factor, Inc. MnDOT Rest Area Amenities Study 2009 Unless otherwise noted, n=600 General Public; n=205 Commercial Drivers
33
IV. CONCLUSIONS/ RECOMMENDATIONS OVERALL INSIGHTS AND IDEAS FOR MNDOT
The following recommendations are based on the results from the quantitative phase of the study indicating the rest area program improvements that will matter most to drivers. FACILITY FUNDAMENTALS
MnDOT has been continually working to ensure that its rest area facilities are both clean and safe. However, it is important to realize that the data from the research in many ways reinforces the extent to which the perceptions of drivers are influenced by the fundamentals of cleanliness, availability of parking and highway accessibility. This validates the responses from earlier focus groups, who, when defining convenience of using rest areas, included location, visibility from the road, ease of access, and ease of parking. Half of regular and occasional visitors from the general public, when asked to name the most memorable aspect of rest areas from other states, mentioned clean/working rest rooms and clean facilities, in general. In addition, direct access from the road and adequate parking were among the Top 5 most important requirements for all visitors. When new facilities are considered in the future, MnDOT should consider these features as fundamental to encouraging visitorship. These characteristics are expected from virtually all visitors, both CVO and general public, of rest areas. When these fundamentals are in place, the following priorities are most important:
1. VIDEO SURVEILLANCE
While visitor safety was mentioned somewhat during the focus groups, this element came out as the most important concern of respondents when they visit rest areas. Video surveillance ranked in the Top Five most important requirements for all General Public and CVO visitor frequencies and was the Number One amenity mentioned by General Public non-visitors. While the perception of safety may be conveyed through the availability of onsite staff and security personnel, video surveillance was rated as more influential in encouraging drivers to visit rest areas. MnDOT should take every step to ensure that the public is aware that safety at rest area premises is its highest priority.
2. SIGNAGE
Drivers are very interested in convenience and the best utilization of their time when stopping at rest areas. The requirement ‘Signs on highway listing amenities and services’ was rated among the Top 5 amenities that would increase the General Public’s frequency of stopping at rest areas. Communication of services and features that are available at each rest stop, particularly through advance signage on the road will help drivers determine in advance whether to stop at a specific facility. Earlier notice of the upcoming rest area – 5 or 10 miles ahead – as well as an explanation of the services provided, would help people plan their stops. If the facility has direct access from the highway and adequate parking, that should also be announced on advance signage. The services listings would also help to manage travelers’ expectations. Participants in earlier focus groups also had asked for advanced notice of the rest area and details about its services. 3. INFORMATION
After the rest area fundamentals mentioned earlier in this section, the number one feature that respondents, both CVOs and general public, said would encourage them to stop was ‘traffic and road construction information with printable maps and travel directions.’ In addition, the following types of information were also rated highly: Displays and information about the local area Free highway maps Vended maps Weather radar on TV monitor in lobby Audio weather announcements in lobby Travel brochures for sightseeing, lodging and
food Not only would these information sources encourage stopping at rest areas, but they offer drivers something to do or read, and encouraged a longer break. 4. COMMUNICATION
The research indicated that over five out of six General Public respondents traveled with others on trips over 250 miles. However, the General Public recognition of the connection between rest areas and driver safety is low. A communication campaign would increase the awareness of the benefits of rest area usage to the general public and this information would encourage people to take breaks from driving. Specifically, these informational opportunities consist of two categories:
The Leadership Factor, Inc. MnDOT Rest Area Amenities Study 2009 Unless otherwise noted, n=600 General Public; n=205 Commercial Drivers
34
1. The effects on driver safety and the amenities which are available at each facility. One possible opportunity to convey the message would be a driver safety campaign built around the knowledge of CVOs, such as ‘professional drivers stop because they know it is safer’.
2. Another campaign could address the visitor safety and cleanliness features which are important to all. Assurances that rest areas will be clean and provide secure, safe visits will overcome the negative viewpoints that linger in many drivers’ perceptions.
Many drivers do not fully understand why rest areas exist and the benefits of stopping. Non-Visitors had the largest difference in their scores to the question about rest areas contributing to driver safety than any other in the study. Also, drivers between the ages of 18 and 32 also scored this question very low. There is a perception, for example, by some drivers that these areas exist primarily for CVOs. In addition, the predominant reasons given by respondents for stopping are to use the rest rooms, to stretch their legs, and, especially for CVOs, to sleep. Visitorship will increase if drivers are given additional reasons to stop. Developing an image that rest areas are for all categories of visitors will create a sense of community that will move them to stop more frequently. Information that defines the experience and benefits for all rest area visitors will encourage visitorship and should be part of any future communication campaigns.
I would like to commend them, about the efforts they do. It is like an oasis from out of nowhere that these rest areas come across. - Minnesota resident ”
“
The Leadership Factor, Inc. MnDOT Rest Area Amenities Study 2009 Unless otherwise noted, n=600 General Public; n=205 Commercial Drivers
35
APPENDIX A – ADDITIONAL DETAILS The following graphs and charts support the information reported in the previous sections of this report and summarize the responses to additional questions that were asked during the interviews. Rest Area Amenities (Q1)
Q1a. Activity Areas
Q1a.1 Children’s playlot
Q1a.2 Pet exercise area
Q1b. Vending
Q1e. Information
Q1c. Facilities
Q1D. Convenience
Q1f. Safety
% of respondents who said they Travel Alone (QG.1)
% of respondents who said they Travel with others (QG.2)
% of respondents who Travel with Children (QH.1)
% of respondents who Travel with other adults ages 18-65 (QH.2)
% of respondents who Travel with people over age 65 (QH.3)
% of Respondents who Travel with a dog (QH.4)
(QI.1)Travel for business
(QI.2)Travel for pleasure
(QJ) HIghway Rest area usage
(QJ1) Percentage of stops at highway rest areas
(QK1) Main reasons to stop at highway rest areas
(QK2) Main reasons to choose to stop at
other places more frequently than HRA
(QK3) Main reasons to choose to stop at other places more frequently than HRA
(QL1) States where visited Highway rest areas (or most often stopping for CVOs)
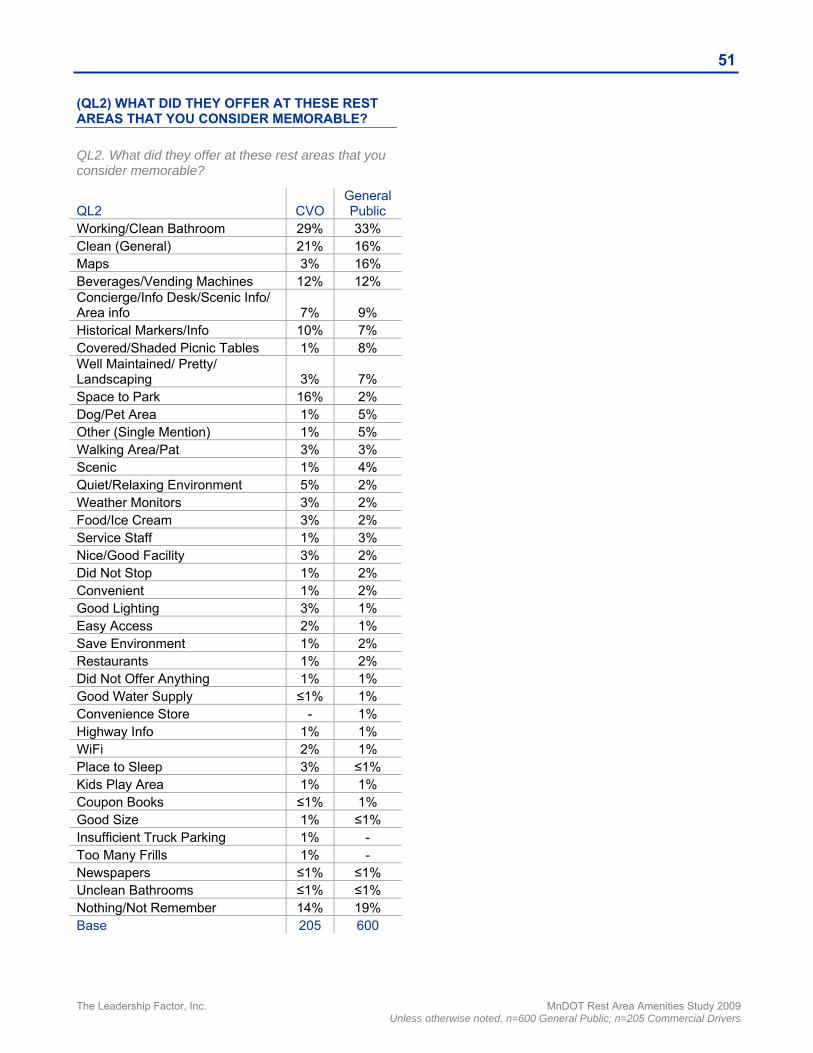
(QL2) What did they offer at these rest areas that you consider memorable?
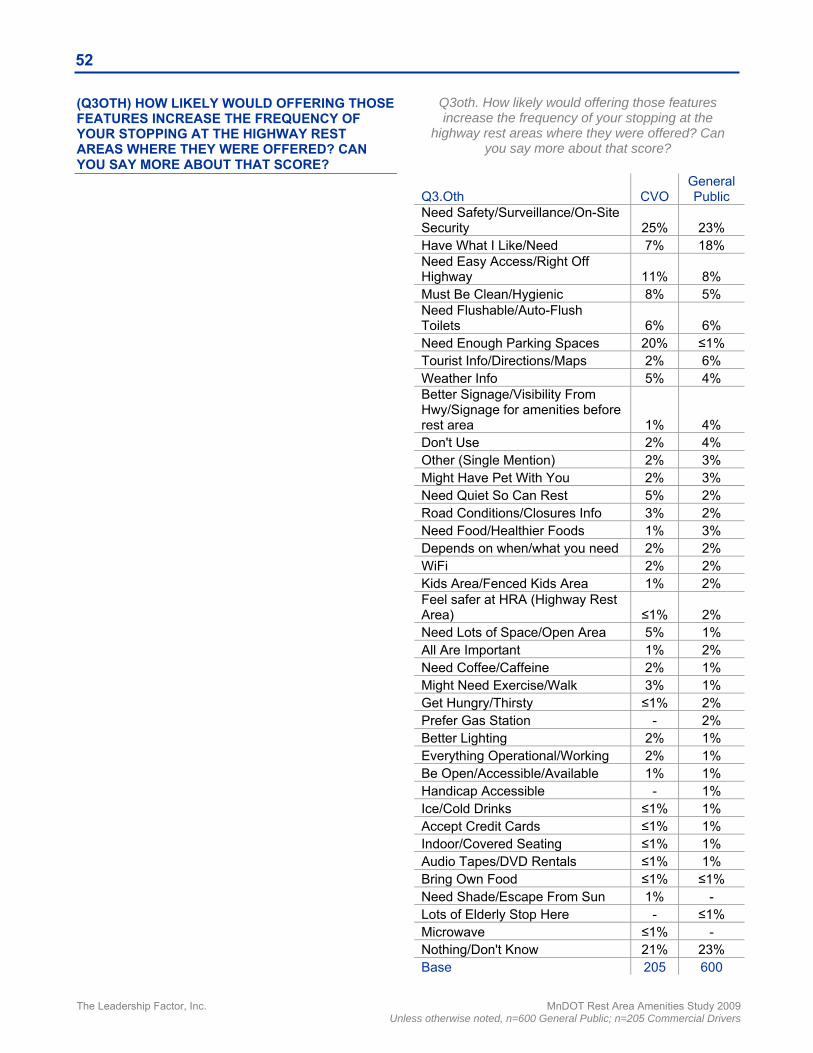
(Q3oth) How likely would offering those features increase the frequency of your stopping at the highway rest areas where they were offered? Can you say more about that score?
Scoring for the top ten amenities based on Q3 bundles
(Q4) What, concerns, if any, do you have about stopping at rest areas?
(Q5other) your feelings about the relationship between driving safety on the highway and the availability of rest areas.
(Q6) Is there anything you want to add (good or bad) about rest areas before we finish up?
Mean scores including Standard deviations
The Leadership Factor, Inc. MnDOT Rest Area Amenities Study 2009 Unless otherwise noted, n=600 General Public; n=205 Commercial Drivers
36
6.8
6.0
5.4
5.0
4.7
4.7
4.5
4.4
1.9
6.4
5.2
4.9
4.4
4.8
4.5
4.4
3.6
1.5
1 2 3 4 5 6 7 8 9 10
Displays and information about the localarea
Picnic areas
Open lawn area
Pet cleanup supplies
Pet exercise area
Children's playlot
Walking trails
Pet drinking fountain
Video gamesGP (n=600)
CVO (n=205)
REST AREA AMENITIES The rating scale questions for Q1 were grouped into 6 sections;
1. Activity Areas
2. Vending
3. Facilities
4. Convenience
5. Information
6. Safety Respondents were told to assume that a rest area is clean and safe, then to rate each feature on a 1-10 scale, with ‘10’ being the ‘mostly likely to encourage you to stop at a rest area with that feature’, and a ‘1’ being ‘least likely to encourage you to stop’. The following graphs indicate the mean scores, in the mean descending order of their likelihood to encourage drivers to stop, between the General Public and CVOs. Q1A. ACTIVITY AREAS
Q1. Rate the following features on a 1-10 scale, with ‘10’ being the mostly likely to encourage you to stop at a rest area with that feature, and a ‘1’ being least likely to encourage you to stop.
The Leadership Factor, Inc. MnDOT Rest Area Amenities Study 2009 Unless otherwise noted, n=600 General Public; n=205 Commercial Drivers
37
53%
15%
32%
60%
21%
19%
0% 25% 50% 75% 100%
Fenced
Unfenced
No opinionGP (n=600)CVO (n=205)
51%
17%
32%
38%
32%
30%
0% 25% 50% 75% 100%
Fenced
Unfenced
No opinionGP (n=600)CVO (n=205)
Q1A.1 CHILDREN’S PLAYLOT
Do you have an opinion whether children’s playlot should be:
Q1A.2 PET EXERCISE AREA
Do you have an opinion whether the pet exercise area should be:
The Leadership Factor, Inc. MnDOT Rest Area Amenities Study 2009 Unless otherwise noted, n=600 General Public; n=205 Commercial Drivers
38
7.1
6.7
6.5
5.9
5.8
5.3
4.8
4.3
4.1
4.0
3.8
3.2
6.1
6.3
6.5
6.8
5.1
5.6
5.0
5.0
4.4
4.2
3.3
3.7
1 2 3 4 5 6 7 8 9 10
Maps
Ice for coolers
Healthy snacks
Coffee
Vending machines that accept credit cards
Refrigerated items
Newspapers
Microwave
Toiletries
Energy drinks
Souvenir items
Books on tape or DVD rentalsGP (n=600)
CVO (n=205)
8.4
8.2
7.6
7.1
7.5
5.5
8.4
7.0
8.4
7.9
6.6
6.1
1 2 3 4 5 6 7 8 9 10
Traffic and road construction information w/printable maps and travel directions
Free highway maps
Weather radar on TV monitor in lobby
Audio weather announcements in lobby
Travel brochures for sightseeing, lodgingand food
Wireless Internet access
GP (n=600)
CVO (n=205)
Q1B. VENDING
Q1E. INFORMATION
Q1. Rate the following features on a 1-10 scale, with ‘10’ being the mostly likely to encourage you to stop at a rest area with that feature, and a ‘1’ being least likely to encourage you to stop.
Q1. Rate the following features on a 1-10 scale, with ‘10’ being the mostly likely to encourage you to stop at a rest area with that feature, and a ‘1’ being least likely to encourage you to stop.
The Leadership Factor, Inc. MnDOT Rest Area Amenities Study 2009 Unless otherwise noted, n=600 General Public; n=205 Commercial Drivers
39
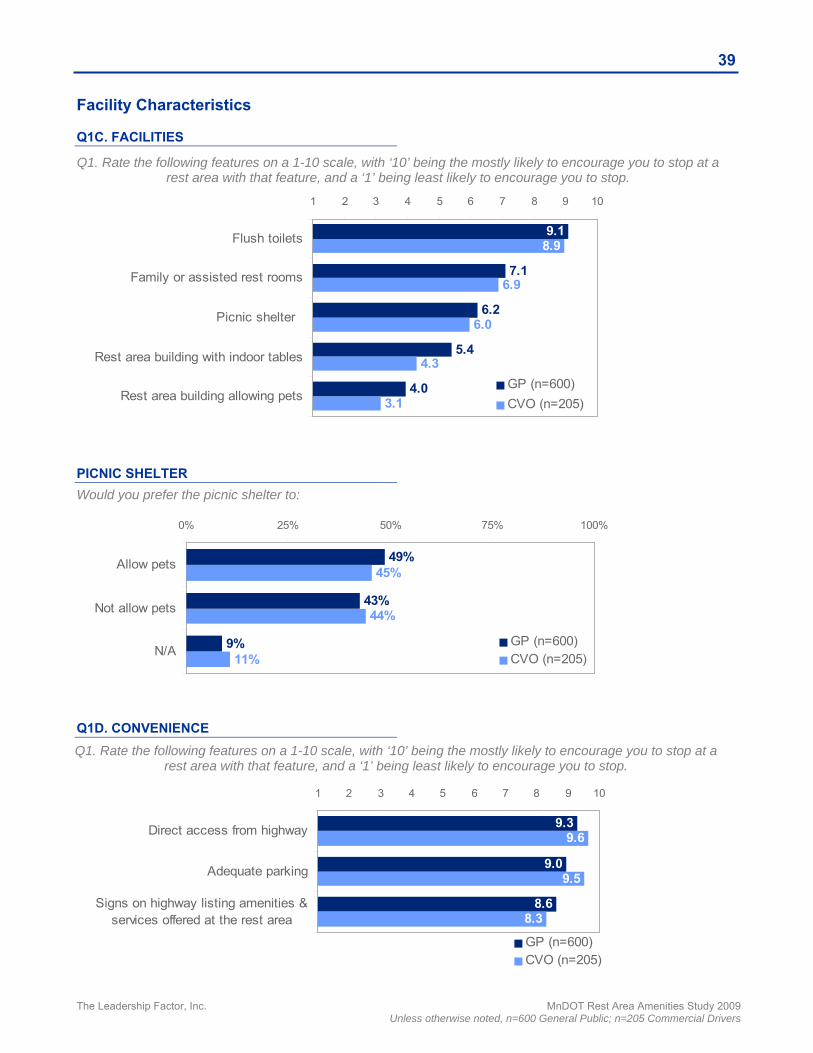
7.1
6.2
5.4
4.0
6.9
6.0
4.3
3.1
9.18.9
1 2 3 4 5 6 7 8 9 10
Flush toilets
Family or assisted rest rooms
Picnic shelter
Rest area building with indoor tables
Rest area building allowing petsGP (n=600)
CVO (n=205)
9.3
9.0
8.6
9.6
9.5
8.3
1 2 3 4 5 6 7 8 9 10
Direct access from highway
Adequate parking
Signs on highway listing amenities &services offered at the rest area
GP (n=600)CVO (n=205)
49%
43%
9%
45%
44%
11%
0% 25% 50% 75% 100%
Allow pets
Not allow pets
N/AGP (n=600)CVO (n=205)
Facility Characteristics Q1C. FACILITIES
PICNIC SHELTER
Would you prefer the picnic shelter to:
Q1D. CONVENIENCE
Q1. Rate the following features on a 1-10 scale, with ‘10’ being the mostly likely to encourage you to stop at a rest area with that feature, and a ‘1’ being least likely to encourage you to stop.
Q1. Rate the following features on a 1-10 scale, with ‘10’ being the mostly likely to encourage you to stop at a rest area with that feature, and a ‘1’ being least likely to encourage you to stop.
The Leadership Factor, Inc. MnDOT Rest Area Amenities Study 2009 Unless otherwise noted, n=600 General Public; n=205 Commercial Drivers
40
8.5
7.4
7.5
8.5
7.3
7.0
1 2 3 4 5 6 7 8 9 10
Video surveillance
24-hour onsite staff presence
24-hour onsite security guard
GP (n=600)
CVO (n=205)
Visitor safety Q1F. SAFETY
Q1. Rate the following features on a 1-10 scale, with ‘10’ being the mostly likely to encourage you to stop at a rest area with that feature, and a ‘1’ being least likely to encourage you to stop.
The Leadership Factor, Inc. MnDOT Rest Area Amenities Study 2009 Unless otherwise noted, n=600 General Public; n=205 Commercial Drivers
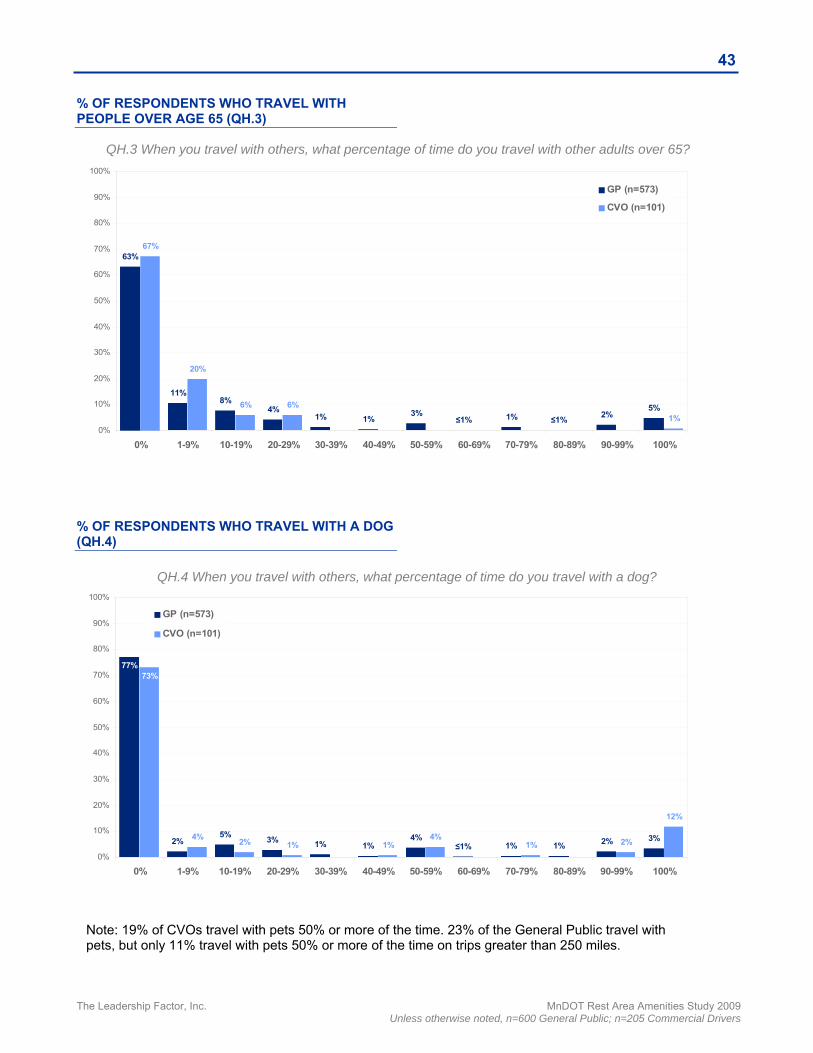
% OF RESPONDENTS WHO TRAVEL WITH PEOPLE OVER AGE 65 (QH.3)
% OF RESPONDENTS WHO TRAVEL WITH A DOG (QH.4)
QH.3 When you travel with others, what percentage of time do you travel with other adults over 65?
QH.4 When you travel with others, what percentage of time do you travel with a dog?
Note: 19% of CVOs travel with pets 50% or more of the time. 23% of the General Public travel with pets, but only 11% travel with pets 50% or more of the time on trips greater than 250 miles.
The Leadership Factor, Inc. MnDOT Rest Area Amenities Study 2009 Unless otherwise noted, n=600 General Public; n=205 Commercial Drivers
QJ. When it comes to trips of 250 miles or more, do you consider yourself a Regular visitor of highway rest areas, an Occasional visitor, or a Non-visitor?
QJ1. When you make stops during these trips over 250 miles, in any state, what percentage of those stops are typically at Highway rest areas?
The Leadership Factor, Inc. MnDOT Rest Area Amenities Study 2009 Unless otherwise noted, n=600 General Public; n=205 Commercial Drivers
46
(QK1) MAIN REASONS TO STOP AT HIGHWAY REST AREAS
Asked only of QJ Regular highway rest area visitors. QK1. What are the main reasons that you stop at highway rest areas?
(QK2) MAIN REASONS TO CHOOSE TO STOP AT OTHER PLACES MORE FREQUENTLY THAN HRA
Asked only of the QJ Occasional highway rest area visitors. QK2. What are the main reasons you choose to stop at other places more frequently than rest areas?
QK1 CVO General Public
Use restroom 59% 84% Stretch/walk around 18% 36% Eat/Get food/beverages 13% 21% Rest/take a break from driving 27% 18% Get information/maps/directions 3% 12% Convenient/easy on-off access 24% 11% Walk pet 7% 6% Sleep 31% 4% Clean 6% 4% Purchase gas - 2% Change drivers - 2% Safe/secure/well lit 5% 1% Quiet/not too crowded 4% 1% Enough room to park 7% 1% Check rig/load 4% - Base 135 370
QK2 CVO General Public
To buy/eat food/beverages 36% 60% To buy gas/diesel 39% 59% Use the restroom - 8% Better selection of food/beverages 6% 7% Convenience 19% 7% Get gas & food at same location 8% 7% Other services/items available 11% 7% Restaurants 17% 5% Spend the night/lodging - 5% Safer 6% 5% Recreation/Entertainment/Tourist attraction 8% 5% Relax/Rest/Sleep 14% 4% Cleanliness 3% 3% Other (single mention) 8% 2% More room to park 14% - Showers 8% - Base 36 97
The Leadership Factor, Inc. MnDOT Rest Area Amenities Study 2009 Unless otherwise noted, n=600 General Public; n=205 Commercial Drivers
47
(QK3) MAIN REASONS TO CHOOSE TO STOP AT OTHER PLACES MORE FREQUENTLY THAN HRA
Asked only of the QJ Non-visitors of highway rest areas. K3. What are the main reasons you choose to stop at other places more frequently than rest areas?
QK3 CVO General Public
To buy/eat food/beverages 35% 62% To buy gas/diesel 26% 58% Use the restroom - 13% Convenience 12% 11% Safer 9% 11% Other services/items available 15% 7% Better selection of food/beverages 6% 5% Restaurants 6% 5% Cleanliness 3% 5% Get gas & food at same location 6% 3% Other (single mention) 6% 3% Spend the night/lodging - 2% More room to park 21% 2% Relax/Rest/Sleep 9% 2% Not enough rest areas - 2% NA/None 3% 2% Recreation/Entertainment/Tourist attraction 3% 1% Showers 6% - Base 34 133
The Leadership Factor, Inc. MnDOT Rest Area Amenities Study 2009 Unless otherwise noted, n=600 General Public; n=205 Commercial Drivers
48
84%
7%
18%
36%
21%
59%
31%
27%
18%
13%
0% 20% 40% 60% 80% 100%
Use restroom
Sleep
Rest/break fromdriving
Stretch/walkaround
Eat/Getfood/Beverages
GP (n=370)
CVO (n=135)
QK1. What are the main reasons that you stop at highway rest areas? (open-ended question asked of self-defined Regular users
defined in QJ)
59%
60%
7%
39%
36%
19%
0% 20% 40% 60% 80% 100%
Buy gas/Diesel
Buy/Eatfood/Beverages
ConvenienceGP (n=97)
CVO (n=36)
QK2. What are the main reasons you choose to stop at other places more frequently than highway rest areas? (open-ended question
asked of self-defined Occasional users defined in QJ)
MAIN REASONS TO STOP AT HIGHWAY REST AREAS (QK1)
Respondents were asked what the main reasons were that they stopped at highway rest areas. The graph below indicates the largest number of mentions for QK1. Note: Use of restrooms was the number one reason indicated by respondents who were Regular Visitors for stopping at rest areas.
The Leadership Factor, Inc. MnDOT Rest Area Amenities Study 2009 Unless otherwise noted, n=600 General Public; n=205 Commercial Drivers
49
62%
58%
11%
11%
35%
26%
12%
9%
0% 20% 40% 60% 80% 100%
Buy/Eatfood/Beverages
Buy gas/Diesel
Convenience
SaferGP (n=133)
CVO (n=34)
QK3. What are the main reasons you choose to stop at other places more frequently than highway rest areas? (open-ended question
asked of self-defined Non-users defined in QJ)
The Leadership Factor, Inc. MnDOT Rest Area Amenities Study 2009 Unless otherwise noted, n=600 General Public; n=205 Commercial Drivers
50
19%
11%
11%
8%
6%
7%
3%
2%
3%
2%
2%
2%
2%
1%
1%
2%
11%
11%
8%
8%
7%
6%
3%
5%
3%
3%
3%
3%
2%
3%
2%
≤1%
0% 5% 10% 15% 20% 25%
MN
WI
IA
SD
IL
ND
NE
IN
MO
WY
MT
OH
KS
TX
OK
CO
GP (n=600)
CVO (n=205)
(QL1) STATES WHERE VISITED HIGHWAY REST AREAS (OR MOST OFTEN STOPPING FOR CVOS)
For the General Public drivers interviewed in the mid-state area, the states where the highway rest areas were most frequently visited were; MN, WI, IA, SD, ND, and IL. A small percentage, 2% for the General Public and 1% for CVOs said they did not stop at any highway rest areas. CVOs were asked to name the states where they most often stop at highway rest areas. The top mentions for the population interviewed for this project were; MN, WI, IA, SD, IL, ND, and IN. The following states were mentioned at less than 2%:
AK AL AR AZ CA CT FL GA ID KY LA MA MD MI MS NB NC NJ NM NV NY OR PA SC TN UT VA WA WV
QL1. Consumer sample: In which states have you stopped at highway rest areas during the
past 2 years? CVO sample: What states do you most often
stop at highway rest areas?
The Leadership Factor, Inc. MnDOT Rest Area Amenities Study 2009 Unless otherwise noted, n=600 General Public; n=205 Commercial Drivers
51
(QL2) WHAT DID THEY OFFER AT THESE REST AREAS THAT YOU CONSIDER MEMORABLE?
QL2. What did they offer at these rest areas that you consider memorable?
QL2 CVO General Public
Working/Clean Bathroom 29% 33% Clean (General) 21% 16% Maps 3% 16% Beverages/Vending Machines 12% 12% Concierge/Info Desk/Scenic Info/ Area info 7% 9% Historical Markers/Info 10% 7% Covered/Shaded Picnic Tables 1% 8% Well Maintained/ Pretty/ Landscaping 3% 7% Space to Park 16% 2% Dog/Pet Area 1% 5% Other (Single Mention) 1% 5% Walking Area/Pat 3% 3% Scenic 1% 4% Quiet/Relaxing Environment 5% 2% Weather Monitors 3% 2% Food/Ice Cream 3% 2% Service Staff 1% 3% Nice/Good Facility 3% 2% Did Not Stop 1% 2% Convenient 1% 2% Good Lighting 3% 1% Easy Access 2% 1% Save Environment 1% 2% Restaurants 1% 2% Did Not Offer Anything 1% 1% Good Water Supply ≤1% 1% Convenience Store - 1% Highway Info 1% 1% WiFi 2% 1% Place to Sleep 3% ≤1% Kids Play Area 1% 1% Coupon Books ≤1% 1% Good Size 1% ≤1% Insufficient Truck Parking 1% - Too Many Frills 1% - Newspapers ≤1% ≤1% Unclean Bathrooms ≤1% ≤1% Nothing/Not Remember 14% 19% Base 205 600
The Leadership Factor, Inc. MnDOT Rest Area Amenities Study 2009 Unless otherwise noted, n=600 General Public; n=205 Commercial Drivers
52
(Q3OTH) HOW LIKELY WOULD OFFERING THOSE FEATURES INCREASE THE FREQUENCY OF YOUR STOPPING AT THE HIGHWAY REST AREAS WHERE THEY WERE OFFERED? CAN YOU SAY MORE ABOUT THAT SCORE?
Q3.Oth CVO General Public
Need Safety/Surveillance/On-Site Security 25% 23% Have What I Like/Need 7% 18% Need Easy Access/Right Off Highway 11% 8% Must Be Clean/Hygienic 8% 5% Need Flushable/Auto-Flush Toilets 6% 6% Need Enough Parking Spaces 20% ≤1% Tourist Info/Directions/Maps 2% 6% Weather Info 5% 4% Better Signage/Visibility From Hwy/Signage for amenities before rest area 1% 4% Don't Use 2% 4% Other (Single Mention) 2% 3% Might Have Pet With You 2% 3% Need Quiet So Can Rest 5% 2% Road Conditions/Closures Info 3% 2% Need Food/Healthier Foods 1% 3% Depends on when/what you need 2% 2% WiFi 2% 2% Kids Area/Fenced Kids Area 1% 2% Feel safer at HRA (Highway Rest Area) ≤1% 2% Need Lots of Space/Open Area 5% 1% All Are Important 1% 2% Need Coffee/Caffeine 2% 1% Might Need Exercise/Walk 3% 1% Get Hungry/Thirsty ≤1% 2% Prefer Gas Station - 2% Better Lighting 2% 1% Everything Operational/Working 2% 1% Be Open/Accessible/Available 1% 1% Handicap Accessible - 1% Ice/Cold Drinks ≤1% 1% Accept Credit Cards ≤1% 1% Indoor/Covered Seating ≤1% 1% Audio Tapes/DVD Rentals ≤1% 1% Bring Own Food ≤1% ≤1% Need Shade/Escape From Sun 1% - Lots of Elderly Stop Here - ≤1% Microwave ≤1% - Nothing/Don't Know 21% 23% Base 205 600
Q3oth. How likely would offering those features increase the frequency of your stopping at the
highway rest areas where they were offered? Can you say more about that score?
The Leadership Factor, Inc. MnDOT Rest Area Amenities Study 2009 Unless otherwise noted, n=600 General Public; n=205 Commercial Drivers
53
38%
31%
17%
12%
8%
7%
26%
25%
5%
11%
3%
5%
23%
11%
≤1%
2%
0% 20% 40% 60% 80% 100%
Safety - unspecified
Nothing/Don'tKnow
Must Be Clean
UnsavoryPeople/Strangers
Poor Lighting
No On-SiteSecurity/Staff
Lack of ParkingLate at Night
Size of ParkingSpaces
GP (n=600)
CVO (n=205)
(Q4) WHAT, CONCERNS, IF ANY, DO YOU HAVE ABOUT STOPPING AT REST AREAS?
Q4. What, concerns, if any, do you have about stopping at rest areas?
Q4. What concerns, if any, do you have about stopping at rest areas? open-ended question
Q4 CVO General Public
Safety - unspecified 26% 38% Must Be Clean 5% 17% Unsavory People/Strangers 11% 12% Lack of Parking Late at Night 23% 2% No On-Site Security/Staff 5% 7% Poor Lighting 3% 8% Issues/Concerns With Nighttime 3% 7% Ease of Access/Not Too Remote 6% 4% Other (Single Mention) 6% 4% Prefer When Lots of Other People There 2% 5% Size of Parking Spaces 11% ≤1% Need Open Layout/No Places to Hide ≤1% 2% Restrooms Out of Order 2% 1% Length Commercial Vehicles Can Stay 4% ≤1% No Food/Drinks Available 2% 1% No Pet Area - 1% RV's Use Too Much Space 1% ≤1% Cost of Items Sold 1% - Getting Lost - ≤1% Trucks Parks on Off/On Ramps ≤1% - Not Allow Camping - ≤1% Nothing/Don't Know 25% 31% Base 205 600
The Leadership Factor, Inc. MnDOT Rest Area Amenities Study 2009 Unless otherwise noted, n=600 General Public; n=205 Commercial Drivers
54
(Q5OTHER) YOUR FEELINGS ABOUT THE RELATIONSHIP BETWEEN DRIVING SAFETY ON THE HIGHWAY AND THE AVAILABILITY OF REST AREAS.
Q5OTHER. Your feelings about the relationship between driving safety on the highway and the availability of rest areas; Can you say more about that?.
Q5.Oth CVO General Public
Need Break/Rest to Avoid Driver Fatigue 54% 56% Driving When Tired/Sleepy 15% 10% Other (Single Mention) 7% 5% Need Breaks to Get Caffeine/Energy Drink 3% 3% Restroom Access (Not Racing to Find Restroom or Driving While Uncomfortable) 2% 4% Doesn't matter/no correlation 2% 4% Provides Safe Haven to Deal with Car/Child/pet Issues 2% 3% Need More Rest Stops 4% 1% Driving While Distracted (i.e. Cell Phones) 2% 1% Some Not Safe 2% 1% Safer Than Parking on Shoulder/Ramp 3% 1% Have Food/Drink While Not Driving 1% 1% Good for Truckers 1% 1% Need More Space at Rest Stops 2% ≤1% Truck Drivers in a Rush/Not Drive Safely 1% ≤1% Decrease Speeding - 1% Secure Area 1% - Nothing/Don't Know 18% 24% Base 205 599
The Leadership Factor, Inc. MnDOT Rest Area Amenities Study 2009 Unless otherwise noted, n=600 General Public; n=205 Commercial Drivers
55
(Q6) IS THERE ANYTHING YOU WANT TO ADD (GOOD OR BAD) ABOUT REST AREAS BEFORE WE FINISH UP?
Q6 CVO General Public
Most Good/Like Them 10% 15% Need More/Open Closed Ones/Keep Them Open 18% 7% Keep Them Clean/Maintained 5% 8% Need More parking Space/ Trucker Space 25% 1% Safety/Need On-Site Security/ Staff 3% 7% Other (Single Mention) 3% 5% Need Good Lighting 4% 4% Rest stops closer together 2% 4% More Vending Machine/Food Options 1% 2% Need Better Entrances/Exits (Layout and Road Conditions) 2% 1% Remove Time Limits 4% ≤1% Not Need Frills 1% 1% Be Family Friendly ≤1% 1% Need Pay Phones (Cells Not Always Work) ≤1% 1% Signage on Hwy if Closed/Out of Order ≤1% 1% Visible From Road/Hwy - 1% Maintain Bathroom Supplies - 1% Like When Scenic/Landscaped - 1% WiFi ≤1% ≤1% Need Flushable Toilets - 1% Handicap Accessible - 1% Like the Info Provided - ≤1% Prefer Gas Stations - ≤1% Need More Trash Cans/Dump stations 1% - Lower/No Costs 1% - Need Change Machine - ≤1% Need ATM - ≤1% Like Ones With Free Coffee - ≤1% Have Picnic Areas - ≤1% Don't Allow Trucks to Sit Running ≤1% - Nothing/Don't Know 37% 54% Base 205 600
The Leadership Factor, Inc. MnDOT Rest Area Amenities Study 2009 Unless otherwise noted, n=600 General Public; n=205 Commercial Drivers
56
MEAN SCORES INCLUDING STANDARD DEVIATIONS
Below are the attributes for Q1 listed in two separate tables, sorted in descending order of overall mean scores in each grouping as stated in the questionnaire.
Overall (n=805) CVO (n=205)
General Public
(n=600)
Mean Std. Dev Mean
Std. Dev Mean
Std. Dev
Act
ivity
Are
as
Displays and info about the local area 6.7 2.8 6.4 3.0 6.8 2.7 Picnic areas 5.8 3.0 5.2 3.0 6.0 2.9 Open lawn area 5.3 3.0 4.9 3.1 5.4 2.9 Pet cleanup supplies 4.8 3.6 4.4 3.5 5.0 3.6 Pet exercise area 4.7 3.6 4.8 3.6 4.7 3.6 Children's playlot 4.7 3.3 4.5 3.2 4.7 3.3 Walking trails 4.5 3.0 4.4 3.1 4.5 3.0 Pet drinking fountain 4.2 3.4 3.6 3.2 4.4 3.5 Video games 1.8 1.8 1.5 1.6 1.9 1.9
The Leadership Factor, Inc. MnDOT Rest Area Amenities Study 2009 Unless otherwise noted, n=600 General Public; n=205 Commercial Drivers
58
APPENDIX B – DEMOGRAPHICS
(QD2) ARE YOU SPANISH/HISPANIC/LATINO?
(QD2B) ARE YOU CURRENTLY RETIRED FROM YOUR PRIMARY JOB?
CVOs were not asked this question.
OverallGeneral Public CVO
n= (805) (600) (205) % % % State IA 12.4 12.8 11.2 MN 50.1 50.5 48.8 ND 13.2 13.0 13.7 SD 11.9 11.2 14.1 WI 12.4 12.5 12.2 Gender Male 55.7 44.3 88.8 Female 44.3 55.7 11.2 Area Rural 50.1 42.5 72.2 Urban 19.0 21.5 11.7 Suburban 30.9 36.0 16.1 Race White 93.7 94.7 90.7 Black or African American 1.4 1.3 1.5 American Indian or Alaskan Native 0.6 0.7 0.5 Asian, Native Hawaiian, Pacific Islander 0.5 0.7 - Some other race 0.6 0.5 1.0 Multiracial 0.4 0.5 - Refused 2.9 1.7 6.3
QD2. CVO General Public
Yes 2 2 No 98 98 Base 205 600
QD2b. General Public
Yes 28% No 72% Base 600
The Leadership Factor, Inc. MnDOT Rest Area Amenities Study 2009 Unless otherwise noted, n=600 General Public; n=205 Commercial Drivers
59
APPENDIX C – INCIDENCE Total records called: 14028 Refusals: 1602 Remaining records (excl. refusals): 12436 (97%) Did not meet study qualifications: 438 (4%) Total number of qualified: 871 Qualified by Market: General Public: 653 CVOs: 218 Qualified by Visitor Frequencies: Regular visitors: 535 Occasional visitors: 139 Non-visitors: 197 Total records purchased: 16472 Duration of each interview: 20 minutes Hours to complete 805 interviews: 764 In the field 6/18-7/8 (no calls on 7/3-7/5) 17 days Source of RDD lists: Survey Sampling International Source of CVO lists: Fleetseek and South Dakota Trucking Association
The Leadership Factor, Inc. MnDOT Rest Area Amenities Study 2009 Unless otherwise noted, n=600 General Public; n=205 Commercial Drivers
60
APPENDIX D – QUESTIONNAIRE
The Leadership Factor, Inc. MnDOT Rest Area Amenities Study 2009 Unless otherwise noted, n=600 General Public; n=205 Commercial Drivers
61
The Leadership Factor, Inc. MnDOT Rest Area Amenities Study 2009 Unless otherwise noted, n=600 General Public; n=205 Commercial Drivers
62
The Leadership Factor, Inc. MnDOT Rest Area Amenities Study 2009 Unless otherwise noted, n=600 General Public; n=205 Commercial Drivers
63
The Leadership Factor, Inc. MnDOT Rest Area Amenities Study 2009 Unless otherwise noted, n=600 General Public; n=205 Commercial Drivers
64
The Leadership Factor, Inc. MnDOT Rest Area Amenities Study 2009 Unless otherwise noted, n=600 General Public; n=205 Commercial Drivers