+ All Categories
Home > Documents > 2009 _ mitchell county _ westbrook isd _ 2009 texas school survey of drug and alcohol use _...

2009 _ mitchell county _ westbrook isd _ 2009 texas school survey of drug and alcohol use _...

Date post: 14-Apr-2018
Category:
Upload: texas-school-survey-of-drug-and-alcohol-use-elementary-reports
View: 214 times
Download: 0 times
Share this document with a friend
107
 Texas School Survey of Drug and Alcohol Use 2009 Westbrook ISD Elementary Complete Report  Introduction  Elementary District Level Executive Summary with Graphics  Elementary District Level Report  Statewide Report with Comparative Tables
Transcript

7/30/2019 2009 _ mitchell county _ westbrook isd _ 2009 texas school survey of drug and alcohol use _ elementary report

http://slidepdf.com/reader/full/2009-mitchell-county-westbrook-isd-2009-texas-school-survey-of-drug-and 1/107


Texas School Surveyof Drug and Alcohol Use

2009

Westbrook ISD

Elementary Complete Report

•  Introduction

•  Elementary District Level Executive Summary with Graphics

•  Elementary District Level Report

•  Statewide Report with Comparative Tables

7/30/2019 2009 _ mitchell county _ westbrook isd _ 2009 texas school survey of drug and alcohol use _ elementary report

http://slidepdf.com/reader/full/2009-mitchell-county-westbrook-isd-2009-texas-school-survey-of-drug-and 2/107

©Copyright 2009, Texas A&M University

All rights reserved.

2009 Texas School Survey of Drug and Alcohol Use 

Introduction 

The Texas School Survey of Drug and Alcohol Use is sponsored by the Texas Commission on

Alcohol and Drug Abuse (TCADA) and implemented by the Public Policy Research Institute (PPRI)

at Texas A&M University. The Texas School Survey project is conducted in two parts. First, a

statewide survey is administered every two years in a sample of districts throughout the state. The

statewide survey helps inform policymakers about the extent and nature of the substance use

 problem in Texas schools. It also gives districts conducting local surveys a standard of comparison

for interpreting their own drug and alcohol survey findings.

The second component of the Texas School Survey makes drug and alcohol surveys available for 

administration in individual school districts. The Texas School Survey is offered annually to every

school district in the state. TCADA partially supports these district-level administrations byabsorbing the cost of instrument development, funding the preparation of an executive summary of 

the local results, and providing state survey data as a basis for interpreting local findings. A local

administration of the Texas School Survey of Drug and Alcohol Use was conducted in your school

district during the Spring of 2009. Your local survey results are presented in this report. Findings

from the statewide assessment, which was conducted in the Spring of 2008, will be presented once

all the data are available.

Organization of the Report 

The report is divided into three major sections. Part I, District Results, contains a set of tables and 

margins summarizing the secondary and (if applicable) elementary survey data for your district. PartII, State Results, is bound as a companion volume. It will contain a complete set of tables and 

margins presenting state results in a format similar to your local report. Part III, Executive

Summary, will contain a customized written synopsis of the local survey results and a complete set

of corresponding figures comparing those local results to the state survey data.

Prior to presenting the results, there are a number of important points that should be considered with

regard to the data cited in this report. These issues relate both to the 2008 statewide survey as well

as to the district-level data from this year. This section briefly presents some basic information

about the development of the report and the limitations of the data.

Background on Local Survey Administration 

The Texas School Survey is offered for students in grades four through twelve. Two versions of the

survey instrument have been developed to accommodate both older and younger students. Districts

were asked to limit survey administration to one of a fixed set of grade combinations. Below are

7/30/2019 2009 _ mitchell county _ westbrook isd _ 2009 texas school survey of drug and alcohol use _ elementary report

http://slidepdf.com/reader/full/2009-mitchell-county-westbrook-isd-2009-texas-school-survey-of-drug-and 3/107

 2

©Copyright 2009, Texas A&M UniversityAll rights reserved.

 brief descriptions of the elementary and secondary survey instruments and a review of acceptable

grade combinations.

The Texas School Survey Instrument 

Two versions of the Texas School Survey are available. The first, a six-page questionnaire, is

designed for secondary students in grades seven through twelve. The secondary survey instrumentexplores usage patterns of twelve drugs including tobacco and alcohol products, inhalants,

marijuana, powdered cocaine, crack, hallucinogens, uppers, downers, Rohypnol, steroids, ecstasy,

and heroin. Other questions pertain to behavioral and demographic correlates of substance use,

 problems associated with substance use, and sources of information about help for substance-related 

 problems.

The secondary survey instrument was revised as part of the 1998 assessment. This revision was

largely a rewording and/or a reformatting of the existing questions in such a manner as to not disrupt

local or statewide over-time analyses. There were, however, a number of additions that were made

as part of this overhaul: Rohypnol and heroin were added to the matrix of illicit substances students

were asked about; a new question was added dealing with parental attitudes toward cigarette; a newquestion was added to ascertain the delivery-system methods most commonly used by those students

who smoke marijuana; and several brief questions were added to gauge the gambling habits of the

student population.

A streamlined, three-page instrument is available for students in grades four through six. The

questions in the elementary survey are similar to those found in the secondary version, but they have

 been adapted to be more easily understood by younger respondents (i.e., the language has been

simplified wherever possible, students have been asked about fewer drug alternatives, and some

complex questions have been omitted).

Standard Grade Combinations 

In order to make state and local comparisons of substance use across all grades, both the state and 

local aggregate percentages must be based upon the same combinations of grades. Otherwise, state

and local data is comparable by individual grade, but overall scores can not be compared directly.

Because the 2008 state survey data was run in only a limited number of grade combinations, districts

were encouraged to administer their local surveys in the following grade groupings:

Elementary Secondary

4 through 6 7 through 12

4 through 5 9 through 128, 10, and 12

If your district did not survey one of the above grade combinations, be aware that you can only

compare your district results to the state data by individual grade. Where districts chose to do other 

combinations of grades, no comparable overall percentages for the state data are available. This will

 be an especially critical issue for small districts who only receive aggregate data.

7/30/2019 2009 _ mitchell county _ westbrook isd _ 2009 texas school survey of drug and alcohol use _ elementary report

http://slidepdf.com/reader/full/2009-mitchell-county-westbrook-isd-2009-texas-school-survey-of-drug-and 4/107

 3

©Copyright 2009, Texas A&M UniversityAll rights reserved.

Limitations of the Data 

A number of subtle factors, such as sampling error and the limitations of self-reported data, can have

a major bearing on the meaning and/or conclusions of the data. In addition, an awareness of the

 precise population to which findings can be generalized is also valuable because knowing who was

not  included in the survey can be as important as knowing who was included. In the following paragraphs, some of the most significant caveats relating to both the statewide and local findings are

discussed.

Survey Population 

In generalizing the results of the state and local surveys, it should be remembered that the data were

collected in public schools. Neither private school students nor drop-outs were sampled though both

represent significant components of the youthful population of Texas. These limitations should be

kept in mind when considering the implications of the data. The findings do, however, represent

reasonable estimates of drug use among the public school population of Texas and offer a suitable

 basis of comparison for public school districts.

Self-Reported Data 

The drug and alcohol use data are entirely based on self-reported information. While a number of 

studies have established the usefulness of self-reported information for estimating the incidence and 

 prevalence of drug use, the validity of these data ultimately depends on the truthfulness, recall, and 

comprehension of respondents. This study is carefully designed to minimize the impact of these

 potential sources of error. For example, students who report impossibly high levels of substance use

or use of non-existent drugs are eliminated from the analysis. Further, differences in recall or 

comprehension are assumed to be constant across both the state and local survey samples. Any

reporting bias in the data should therefore be approximately equal in both assessments, and comparisons between district and state data should be valid. Nonetheless, the limitations of self-

reported information should be considered when drawing conclusions about the data.

Sampling Error 

The 2008 statewide survey data that will be presented at a later date will be based on a sample of 

Texas secondary and elementary students. Because a sample rather than the entire population of 

students was surveyed, a certain amount of error is introduced when generalizing findings from the

sample to the population. To gauge the size of this error, confidence intervals for all estimates are

ascertained. In general, however, small differences of a few percentage points are usually not

statistically meaningful. Attention should be focused on large differences of five percentage pointsor more.

Survey Protocols and Administration

Finally, the accuracy of the data is dependent upon whether school staff followed  Texas School

Survey protocols for the sampling of students.

7/30/2019 2009 _ mitchell county _ westbrook isd _ 2009 texas school survey of drug and alcohol use _ elementary report

http://slidepdf.com/reader/full/2009-mitchell-county-westbrook-isd-2009-texas-school-survey-of-drug-and 5/107

 4

©Copyright 2009, Texas A&M UniversityAll rights reserved.

Analytic Guidelines 

In processing the drug and alcohol survey data, there are a number of analytic issues that should be

addressed. These include questions such as how to identify students who are exaggerating their drug

or alcohol use, how best to calculate average substance use figures, how to handle surveys from

students in grades that are not technically being surveyed, and how to classify data for students whofail to report their grade level. This section will review some rules established to deal with these

matters.

Handling of Exaggerators 

As discussed above, the survey data presented herein is based entirely upon a respondent’s

description of his or her own behavior. It is inevitable that some students will under- or over-report

their use of drugs or alcohol. To the extent possible, an attempt is made to identify and eliminate

data from those respondents. Two checks have been incorporated into the data analysis program to

identify exaggerators. First, data from students claiming to have used "Oxaril," a non-existent drug,

is considered suspect and dropped from the analyses. Second, students claiming impossibly highlevels of drug or alcohol use are also dropped from the analyses. Unbelievably high substance use

among secondary students is based on the following criteria: (1) students report in that they have

consumed two or more alcoholic beverages every day five or more times; (2) students report hat they

have consumed three or more alcoholic beverages every day; or (3) students report that they have

used three or more illicit drugs (other than tobacco, alcohol, inhalants, marijuana, or steroids) on a

daily basis. Elementary students are considered exaggerators, and are excluded, if they indicated 

that they have used five or more substances 11 or more times in either their lifetimes or during the

 past school year.

Weighted Aggregate Data

In many districts, the percentage of all enrolled students that actually take the survey varies

substantially by grade. Though patterns are different for each district, typically a larger proportion

of younger students complete the survey compared to their older peers. If a simple average is taken

when calculating overall levels of use, older students may not be represented in proportion to their 

numbers. Since these are the very students most likely to use drugs or alcohol, their under-

representation in the aggregate scores results in artificially lower overall levels of substance use.

To achieve more representative percentages when calculating overall or aggregate levels of 

substance use, a "weighted average" procedure is used. Prior to calculating the averages, scores for 

each grade surveyed are weighted by the total enrollment for that grade. By weighting averages by

actual enrollment, over- or under-sampling in aggregate scores is partially alleviated.

Surveys From "Out-of-Range" Grades

Occasionally, students from a grade that is not technically being surveyed are included in the district

sample. This is primarily a problem where the survey is administered in a non-contiguous grade

combination (e.g., 8, 10, and 12). In these instances, the final sample often contains a few students

who are in "out of range" grade levels. Generally, data for these students is not thrown out. Rather,

7/30/2019 2009 _ mitchell county _ westbrook isd _ 2009 texas school survey of drug and alcohol use _ elementary report

http://slidepdf.com/reader/full/2009-mitchell-county-westbrook-isd-2009-texas-school-survey-of-drug-and 6/107

 5

©Copyright 2009, Texas A&M UniversityAll rights reserved.

it is re-coded and included with the next contiguous grade level. A conservative approach is used 

whereby younger students can be grouped with their older peers, but older students can not be re-

coded to a lower grade. This prevents artificially high levels of reported substance use in lower 

grades.

There are two cases in which the "out-of-range" data is dropped from the analyses rather than being

re-coded: (1) if there is no contiguous higher grade with which to combine the data; and (2) if thenumber of respondents in "out-of-range" students is greater than ten percent of the grade with which

they are being grouped. This latter measure is designed to prevent a large number of "out of range"

grades from obscuring the true grade-level values.

Surveys In Which No Grade Level Was Reported

When students failed to report their grade level, it is not possible to determine unequivocally with

what grade these students' data should be analyzed. Where grade level is missing, students' data are

retained in the sample and an estimate of grade is made based on his or her age. Students that are at

age level for beginning a grade are included with that grade. If both grade and age are missing, thedata is dropped from the analyses.

Overview of the Data 

The Texas School Survey findings for your school district are summarized in this section. Survey

findings are presented in three formats: figures, tables, and margins. Figures portray both state and 

local survey results in a "side-by-side" format, allowing for direct comparisons to be made. There

are a total of seven elementary and seventeen secondary figures, although not all of these can be

 produced for every school district. All of the figures that can be generated for your district have

 been produced.

Two sets of primary and/or secondary tables are available. The first set, the General Substance

Tables, have been reformatted this year in an effort to make them more accessible. These tables have

 been divided into five groupings---tobacco, alcohol, illicit drugs, inhalants, and miscellaneous. In

each of these groupings are tables that illustrate general information about substance use patterns in

the district and include prevalence of use, frequency of use, and age of first use. In addition, these

tables highlight certain perceptions, attitudes and, behaviors from the data such as perceived 

availability and peer use of various substances, parental attitudes, attending class or operating a

motor vehicle while under the influence of drugs or alcohol, and the use of intoxicants at parties.

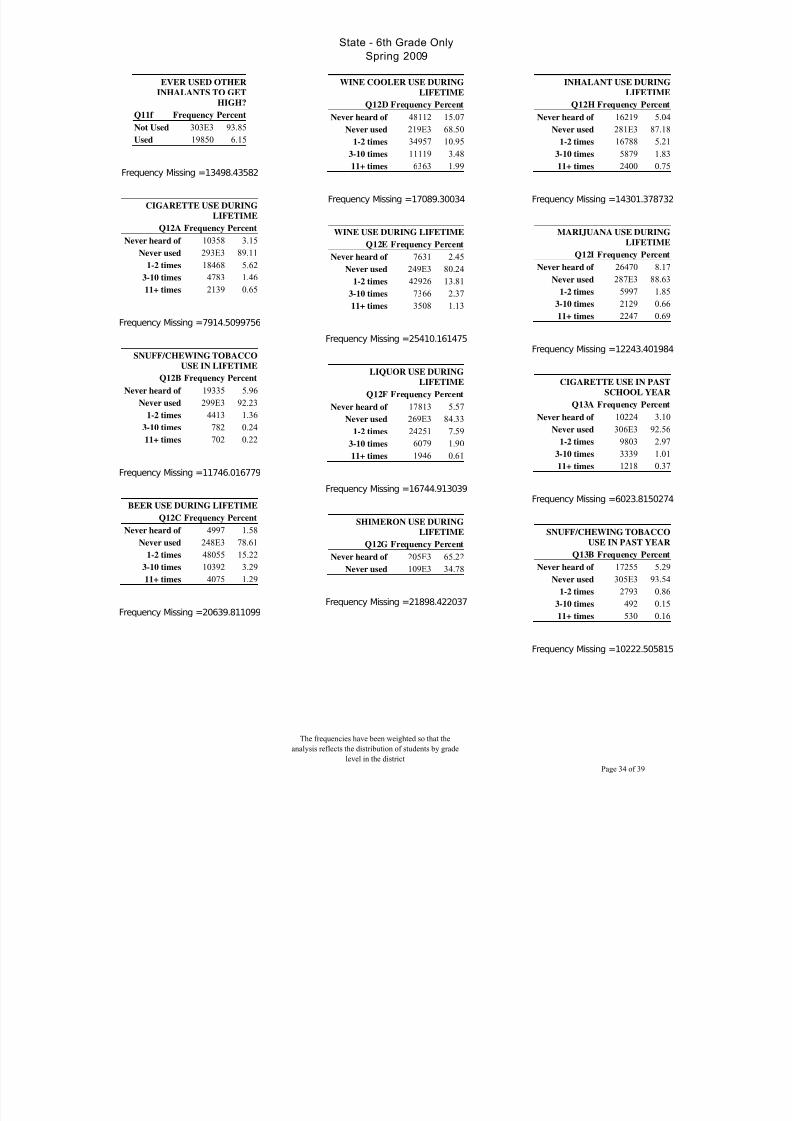
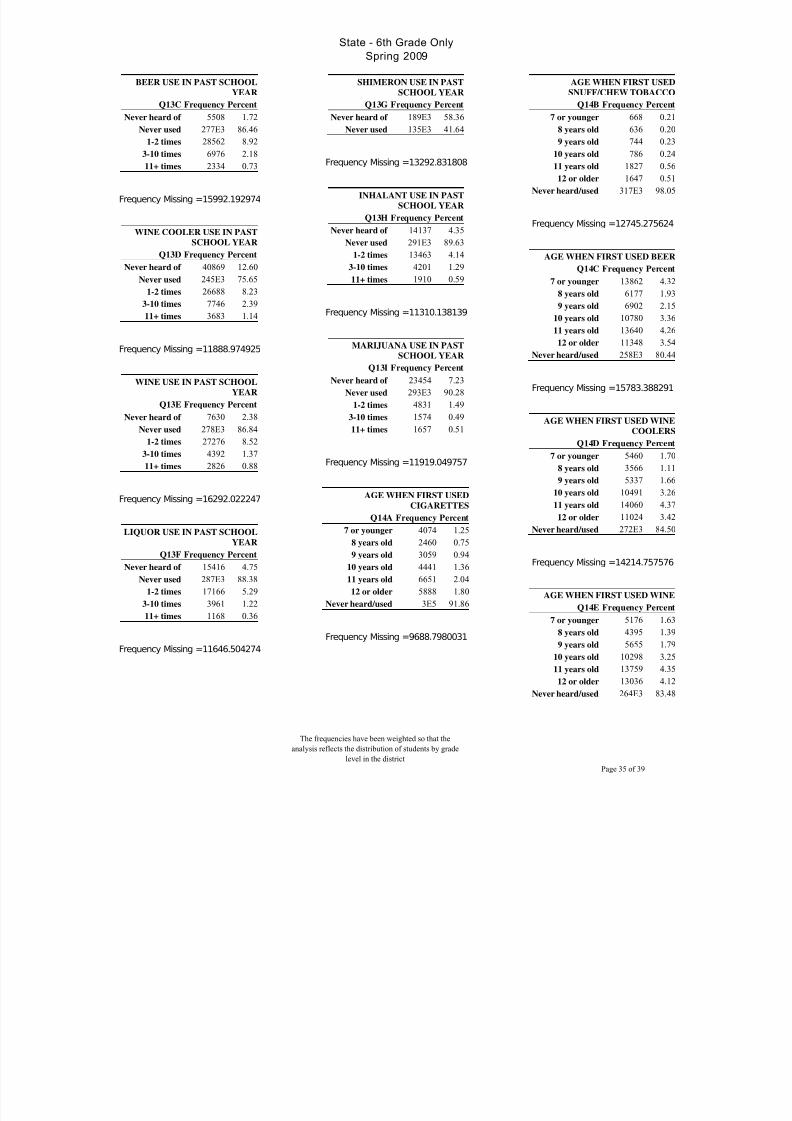
The second set, Prevalence Tables, contains fourteen tables showing the percentage of students whohave used specific drugs or alcohol in the past month, past school year, and during their lifetimes.

All tables are available for each participating district. Tables showing the same data for the state are

 provided in a companion volume. The only change to these tables made as part of the reformatting,

and applicable only with regard to the secondary reports, was to the percentages listed under the

“School Year” heading. Previously, the percentages in this category excluded those found under the

“Past Month” heading. As reformatted, these “School Year” percentages include the “Past Month”

 percentages as well.

7/30/2019 2009 _ mitchell county _ westbrook isd _ 2009 texas school survey of drug and alcohol use _ elementary report

http://slidepdf.com/reader/full/2009-mitchell-county-westbrook-isd-2009-texas-school-survey-of-drug-and 7/107

 6

©Copyright 2009, Texas A&M UniversityAll rights reserved.

Additional data are presented in the margins, which contain the raw percentages of students who

gave each response option for all questions. Keep in mind that if your district under-sampled a

 particular grade(s), your overall percentages will represent "weighted averages." As a result, the raw

 percentages presented in your margins may reflect weighted counts rather than actual raw counts.

Standards of Data Presentation 

A wide variety of school districts took part in the Texas School Survey of Drug and Alcohol Use. In

order to accommodate the diversity of participants, guidelines for organizing and presenting the data

were established. These include standards for handling data from small and mid-sized districts and 

for determining which tables and figures should be produced for each. These guidelines are

reviewed below.

Data Aggregation 

In some districts, too few students are surveyed to allow for reliable grade-level analyses to be

 performed. Where this occurs, data from several grades are grouped together. Grade groupings are

established so as to (1) maximize the number of valid between-group comparisons possible and (2)

 protect students' confidentiality. One of three possible data presentation formats is selected for each

district, depending on the number of students per grade. In districts where the number of students

 per grade varies widely, a format is selected based on the size of the majority of grades surveyed.

However, if one or more grades fall below a total of thirty students, the next lower level of 

aggregation is automatically selected.

The guidelines used for data aggregation are as follows:

Secondary

Small: When there are fewer than thirty students per grade, a single

 percentage is shown representing all students.

 Medium: When there are thirty to ninety students per grade, percentages are

aggregated into grade groupings (e.g., combining grades 7 and 8 and 

grades 9 - 12).

 Large: When there are more than ninety students per grade, separate

 percentages are shown for each grade level surveyed.

Elementary 

Small: When there are fewer than sixty students per grade, a single

 percentage is shown for all students.

 Large: When there are more than sixty students per grade, separate

 percentages are shown for each grade level surveyed.

7/30/2019 2009 _ mitchell county _ westbrook isd _ 2009 texas school survey of drug and alcohol use _ elementary report

http://slidepdf.com/reader/full/2009-mitchell-county-westbrook-isd-2009-texas-school-survey-of-drug-and 8/107

 7

©Copyright 2009, Texas A&M UniversityAll rights reserved.

Availability of Graphics 

According to the data aggregation rules outlined above, graphics illustrating data by grade can not be

 produced for districts surveying fewer than thirty students per grade. As a consequence, figures that

show grade-level breakdowns are omitted from both the elementary and secondary versions of reports for small districts. With these exceptions, all other figures and tables are produced for every

district regardless of size.

Conventions Used in Data Presentation 

Throughout the report, a number of conventions were adopted to maintain consistency in reporting.

A common terminology is employed and a standard set of symbols is used in each table and figure.

These terms and symbols are described in the following paragraphs, beginning with a set of general

definitions and followed by a discussion of specific conventions used in tables and margins.

Definitions 

There are several terms used throughout the report that, though seemingly straightforward, may have

some bearing on how the data is understood and interpreted. These definitions are outlined below.

 Alcohol. When the category "Alcohol" appears in a figure or table, it represents the combined use of 

 beer, wine, wine coolers, and liquor. Each of these alcoholic substances may be referenced 

individually, as well.

Cocaine or Crack. This reference is found only in the prevalence tables (Tables B1-B14). It refersto students that report using either cocaine or crack, or both cocaine and crack. Since there is some

overlap between students who have used cocaine and those who have used crack, the percentages of 

respondents in the "Cocaine or Crack" category should not be a simple sum of percentages in the

individual "Cocaine" and "Crack" categories. It should, however, be at least as great as the larger of 

the two individual categories.

 Illicit Drugs. These are defined as controlled substances and include marijuana, powdered cocaine,

crack, uppers, downers, Rohypnol, hallucinogens, ecstasy, and heroin.

 Inhalants. The overall inhalant use percentages presented in the prevalence tables have been

adjusted to reflect reported use of both specific inhalants and inhalant use generally. Suchadjustments are necessary because some students respond in the positive to specific use (i.e., spray

 paint, correction fluid, gasoline, freon, poppers, shoe shine, glue, paint thinner, other sprays, or other 

inhalants) without responding in the positive to generic use (i.e., "How many times have you used 

inhalants?"), while others respond in the positive to generic use but not to the use of specific

inhalants.

7/30/2019 2009 _ mitchell county _ westbrook isd _ 2009 texas school survey of drug and alcohol use _ elementary report

http://slidepdf.com/reader/full/2009-mitchell-county-westbrook-isd-2009-texas-school-survey-of-drug-and 9/107

7/30/2019 2009 _ mitchell county _ westbrook isd _ 2009 texas school survey of drug and alcohol use _ elementary report

http://slidepdf.com/reader/full/2009-mitchell-county-westbrook-isd-2009-texas-school-survey-of-drug-and 10/107

 9

©Copyright 2009, Texas A&M UniversityAll rights reserved.

response option. The frequency shows the absolute number of students who gave the indicated 

response. The percent is the frequency converted into a percentage of all students who answered the

question. Again, bear in mind that if your district under-sampled a particular grade(s), your overall

 percentages will represent "weighted averages." As a result, the raw percentages presented in your 

margins may reflect weighted counts rather than actual raw counts.

Surveys excluded from analyses as exaggerators are not included in the margins.

7/30/2019 2009 _ mitchell county _ westbrook isd _ 2009 texas school survey of drug and alcohol use _ elementary report

http://slidepdf.com/reader/full/2009-mitchell-county-westbrook-isd-2009-texas-school-survey-of-drug-and 11/107


Texas School Survey

of Drug and Alcohol Use

2009

Westbrook ISD

Part III: Executive Summary

Elementary

Executive Summary

Graphics

7/30/2019 2009 _ mitchell county _ westbrook isd _ 2009 texas school survey of drug and alcohol use _ elementary report

http://slidepdf.com/reader/full/2009-mitchell-county-westbrook-isd-2009-texas-school-survey-of-drug-and 12/107

1

©Copyright 2009, Texas A&M University

All rights reserved. 

Texas School Survey Of Drug And Alcohol Use

Westbrook ISD

Elementary Executive Summary

Introduction

The Texas School Survey is an annual collection of self-reported tobacco, alcohol, inhalant, and 

substance use data from among elementary and/or secondary students in individual districts throughout

the state of Texas. The survey, conducted by the Public Policy Research Institute (PPRI) in

conjunction with the Texas Department of State Health Services (DSHS), is also administered every

other year to a representative sample of Texas students in grades 4 through 6 and grades 7 through 12.

Data from the statewide sampling, last administered in the Spring of 2008, are incorporated into anover-time database maintained by DSHS to track trends in substance use so that policymakers at the

state level have up-to-date information upon which to base decisions and plot prevention strategies.

These data also serve as an overall standard of comparison for use by those at the district level to

interpret, and act upon, local survey findings in a similar way.

The executive summary begins with a section containing a general demographic overview of those

who took the survey in the participating district. This is followed by sections dealing with the various

substances covered by the survey---tobacco, alcohol, inhalants, and marijuana. The summary

concludes with a section that explores selected characteristics associated with substance use in the

district and a final one dealing with where students come by what they know about drugs and alcohol

and to whom they might turn if they thought they were having a problem.

For context, each section dealing with substance use will begin with a brief, over-time glimpse of the

statewide trends over the last decade and a half with regard to that substance. This is followed by a

subsection containing items that are generally recognized as contributing to the environment in which

substance use is most likely to occur---such as availability, peer use, and parental attitudes. Finally, the

use data are then detailed.

As for the actual, self-reported use of each substance, it is important to note the frequency of such use.

Is it experimental, a once-in-a-lifetime thing? Or is it a more casual use, a once-in-a-while behavior?

Further, use data are used to differentiate between those who smoke cigarettes from those who use a

smokeless tobacco product, those who drink beer from those who drink wine coolers, those who sniff correction fluid from those who sniff glue.

Two final points should be noted about the data. First, due to the differences in rounding procedures,

there may be slight discrepancies between the percentages referred to in the tables and those reflected 

in the executive summary. Second, some data in this report are marked with an asterisk. Data so

7/30/2019 2009 _ mitchell county _ westbrook isd _ 2009 texas school survey of drug and alcohol use _ elementary report

http://slidepdf.com/reader/full/2009-mitchell-county-westbrook-isd-2009-texas-school-survey-of-drug-and 13/107

2

©Copyright 2009, Texas A&M University

All rights reserved. 

marked are estimated to be statistically significant at the .01 level from the comparable data for the

state as a whole. This means that in only one of a hundred samples would a difference this large have

occurred when there was no difference between the district and state data. Differences in very small

districts will seldom be statistically significant due to the small number of cases. Differences that are

not marked may be important, but should be treated with more caution than those that are statistically

significant.

The percentages referred to in the executive summary that follows were taken from the tables found in

"Part I: District Survey Results."

Demographic Overview 

7/30/2019 2009 _ mitchell county _ westbrook isd _ 2009 texas school survey of drug and alcohol use _ elementary report

http://slidepdf.com/reader/full/2009-mitchell-county-westbrook-isd-2009-texas-school-survey-of-drug-and 14/107

3

©Copyright 2009, Texas A&M University

All rights reserved. 

In the Spring of 2009, The Texas School Survey was administered to students in grade 6 in the

Westbrook Independent School District (WISD). Texas School Survey protocols, formulated to ensure

that the data used in this analysis has an acceptable probability of error, called for the district to

administer the survey to a predetermined sampling of the elementary students. The accuracy of the

data requires that school staff administering the survey followed the protocols.

A total of 15 students completed the questionnaire. Of that number, no surveys were excluded from

analysis because students did not indicate their grade or age, or because they were identified as

exaggerators (i.e., claimed to have used a non-existent drug or reported overly excessive drug use).

The final number of surveys included in the overall district analysis was 15, consisting of:

•  A split of male (67 percent) and female (33 percent) students;

•  An ethnic breakdown that is 73 percent white and 27 percent Mexican-American;

• Sixty percent who say they live in a two-parent home, and 13 percent who report they have lived inthe district for three or more years; and 

•  Forty percent who say their parent(s) are college graduates, and 13 percent who indicate they

qualify for free/reduced lunches at school.

7/30/2019 2009 _ mitchell county _ westbrook isd _ 2009 texas school survey of drug and alcohol use _ elementary report

http://slidepdf.com/reader/full/2009-mitchell-county-westbrook-isd-2009-texas-school-survey-of-drug-and 15/107

4

©Copyright 2009, Texas A&M University

All rights reserved. 

7/30/2019 2009 _ mitchell county _ westbrook isd _ 2009 texas school survey of drug and alcohol use _ elementary report

http://slidepdf.com/reader/full/2009-mitchell-county-westbrook-isd-2009-texas-school-survey-of-drug-and 16/107

5

©Copyright 2009, Texas A&M University

All rights reserved. 

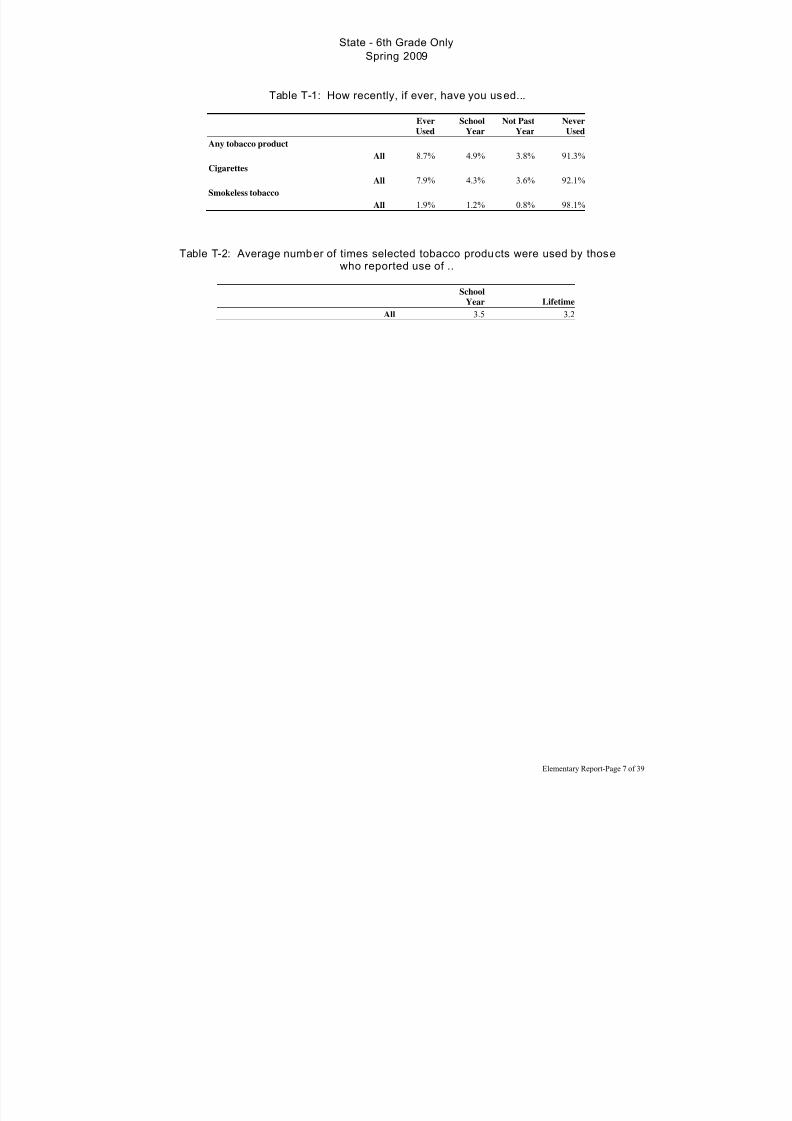
Tobacco General tobacco use includes both cigarettes and smokeless tobacco products.

Statewide Overview. In 1990, a fifth of Texas elementary students reported having experimented 

with a tobacco product at least once during their lifetimes, while 13 percent said they had used sucha product during the past school year. These percentages inched downward over the next eight

years and then dropped dramatically in the 2000 assessment (13 percent in their lifetimes and 7

 percent in the past year). These downward trend in tobacco use continued in 2002 (9 percent in

their lifetimes and 5 percent in the past year), 2004 (8 percent in their lifetimes and 4 percent in the

 past year), and 2006 (6 percent in their lifetimes and 3 percent during the past year). According to

the 2008 statewide assessment, this downward trend continues among those who reported lifetime

tobacco use (5 percent), while past year tobacco use held steady at 3 percent. These overall

numbers reflect decreases in the use of both the use of cigarettes and smokeless tobacco products,

although it appears the more significant movement is in regard to cigarette use.

District Overview.Overall, the general use of tobacco products among Westbrook ISD 6th gradestudents in 2009 was lower than that reported by their counterparts statewide.

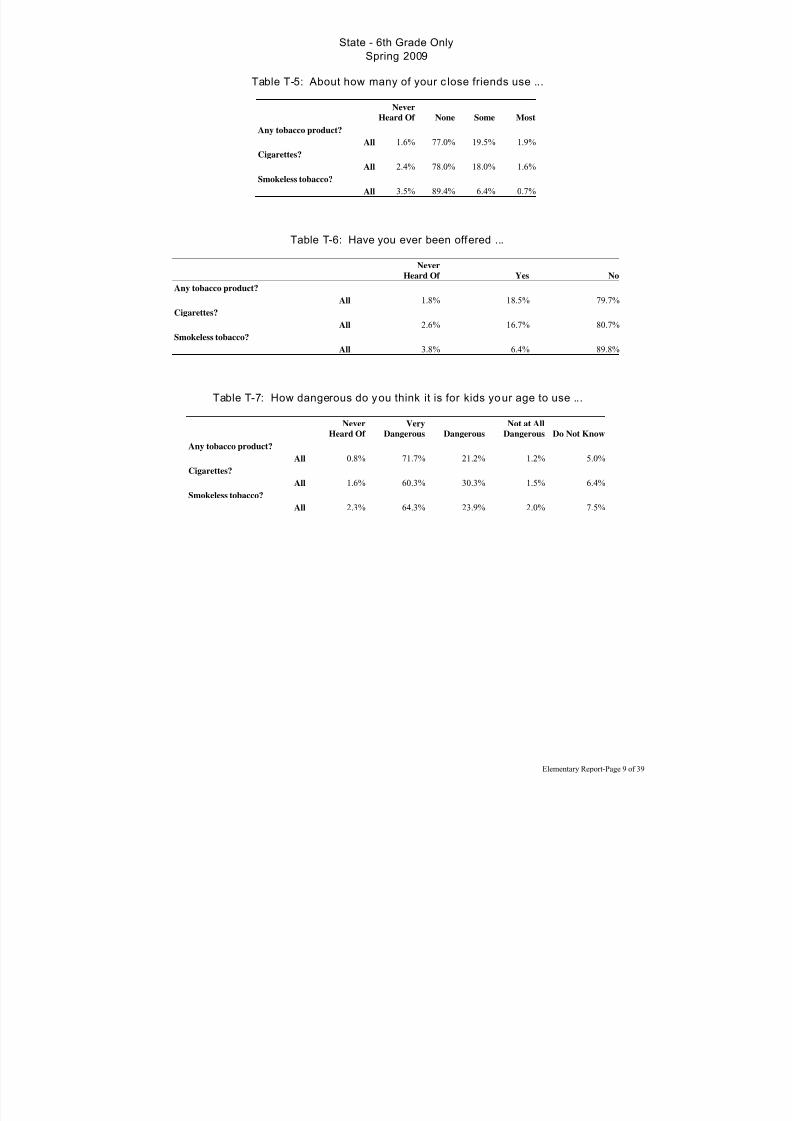
Environment. Less than 1 percent of district elementary students said some or most of their close

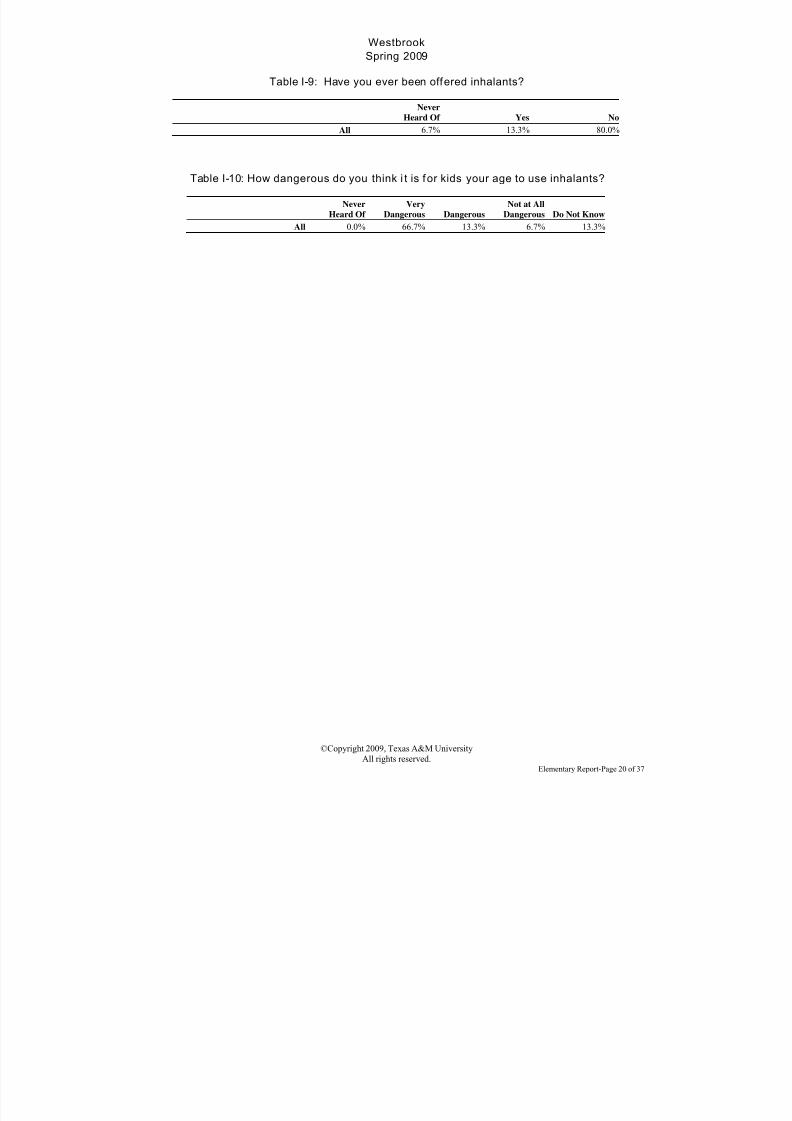
friends smoke cigarettes (20 percent statewide), while 7 percent reported they had been offered 

cigarettes (17 percent statewide). Less than 1 percent of WISD elementary students reported some or 

most of their close friends use snuff or chewing tobacco (7 percent statewide), and less than 1 percent

said they had been offered a smokeless tobacco product (6 percent statewide).

The influence of drug education programs may be reflected in students' attitudes toward the use of 

specific substances. 87 percent of district elementary students believe tobacco use is "very dangerous"

(72 percent statewide).

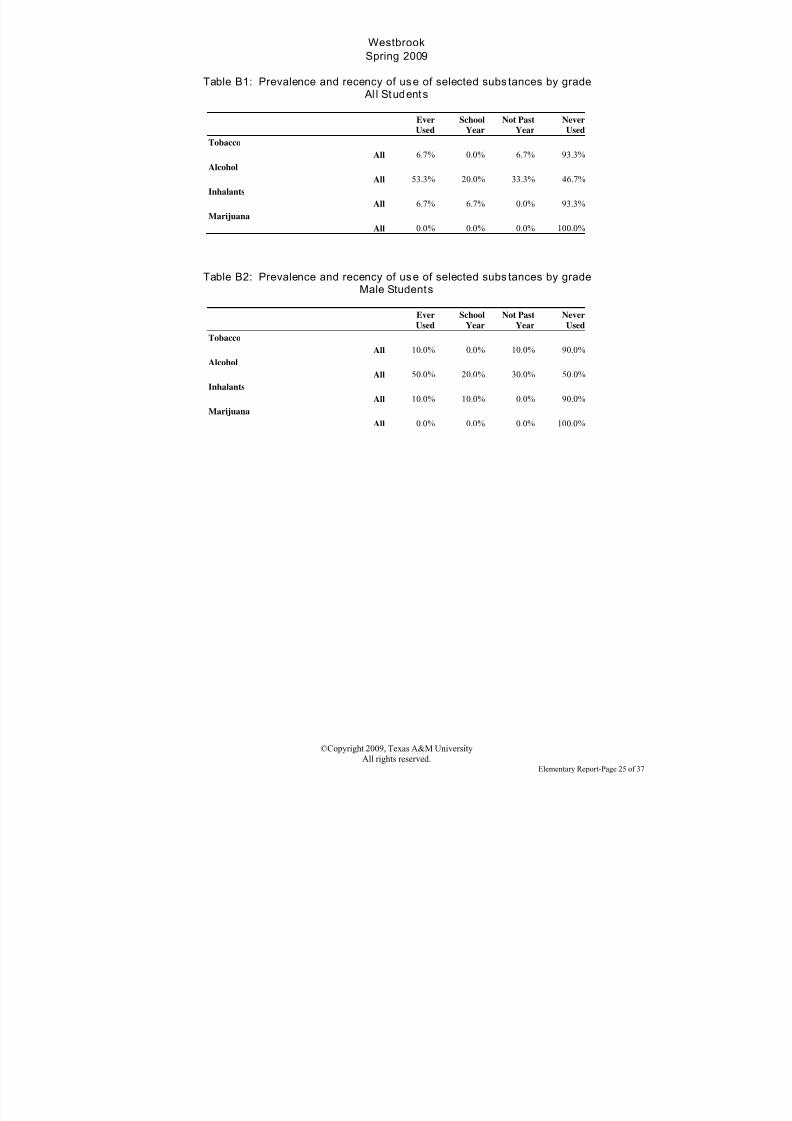
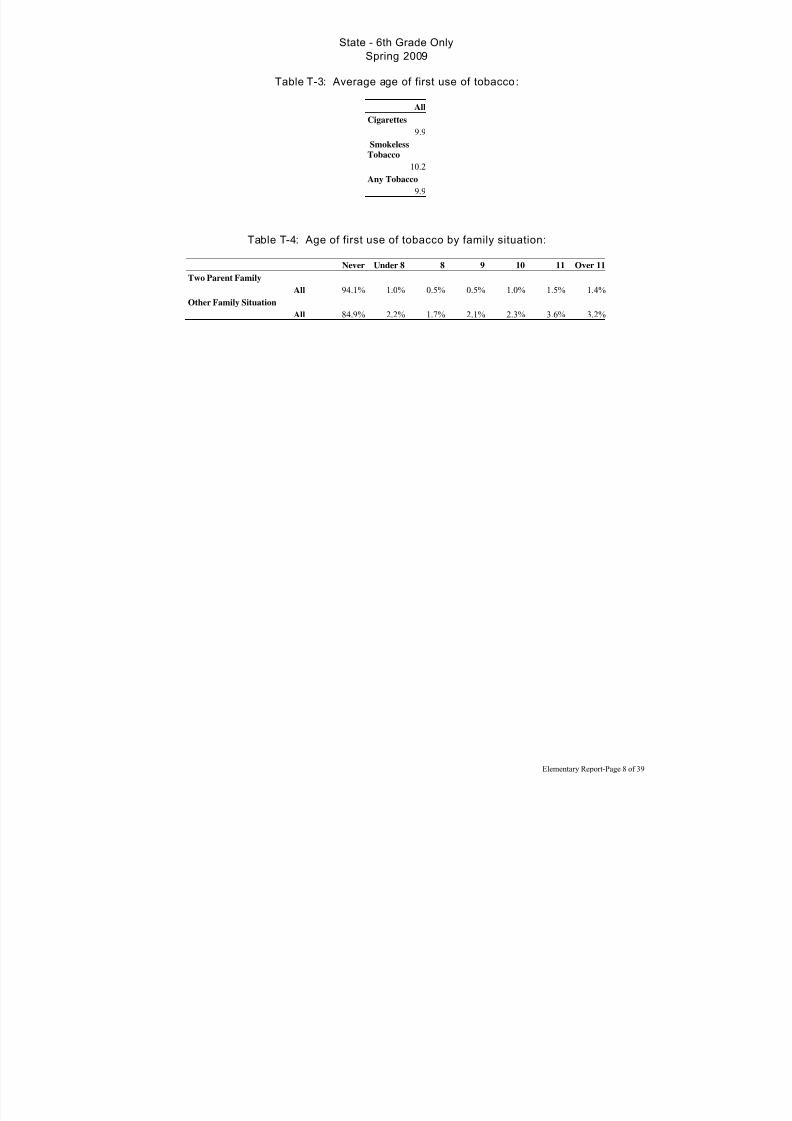
Use. In the Westbrook ISD, 7 percent of elementary students reported general tobacco use at least

once during their lifetimes (9 percent statewide). Use of a tobacco product during the past school year 

was reported by less than 1 percent of Westbrook ISD elementary students (5 percent statewide).

Seven percent of Westbrook ISD elementary students reported smoking cigarettes at least once during

their lifetimes (8 percent statewide), and less than 1 percent said they had smoked cigarettes during the

 past school year (4 percent statewide). Lifetime use of smokeless tobacco products was reported by

less than 1 percent of Westbrook ISD elementary students (2 percent statewide), while less than 1

 percent said they had used snuff or chewing tobacco during the past school year (1 percent statewide).

7/30/2019 2009 _ mitchell county _ westbrook isd _ 2009 texas school survey of drug and alcohol use _ elementary report

http://slidepdf.com/reader/full/2009-mitchell-county-westbrook-isd-2009-texas-school-survey-of-drug-and 17/107

7/30/2019 2009 _ mitchell county _ westbrook isd _ 2009 texas school survey of drug and alcohol use _ elementary report

http://slidepdf.com/reader/full/2009-mitchell-county-westbrook-isd-2009-texas-school-survey-of-drug-and 18/107

7

©Copyright 2009, Texas A&M University

All rights reserved. 

 Alcohol Alcohol is the most widely used substance among elementary students statewide and in the Westbrook 

ISD.

Statewide Overview.In 1990, 40 percent of Texas elementary students said they had experimented with an alcohol product at some point in their lives and just over a quarter (28

 percent) reported having consumed alcohol during the past school year. Over the next two years,

lifetime prevalence dropped dramatically to 33 percent of elementary students statewide, while

 past-year use showed a similar decline to 21 percent. This downward trend with regard to alcohol

use has continued through the next three statewide assessments, stalling in 2002 at 25 percent who

said they had consumed alcohol at least once in their lifetimes and 16 percent who reported 

consuming alcohol during the previous year. These numbers remained flat through the statewide

survey in 2004, but inched downward again in 2006, lifetime prevalence of alcohol use dropped to

22 percent and past-year use dipped to 14 percent. In the most recent statewide assessment in

2008, those elementary students reporting lifetime alcohol use and past-year alcohol use rose by a

 percentage point each, to 23 percent and 15 percent respectively.

Please note that the slight increase in alcohol use in the 2008 statewide assessment is most likely

the result of a change in the definition of “wine coolers” than had been used in all previous

assessments.

District Overview. Overall, Westbrook ISD 6th grade students were drinking alcohol in 2009 at rates

lower than those reported by their counterparts statewide.

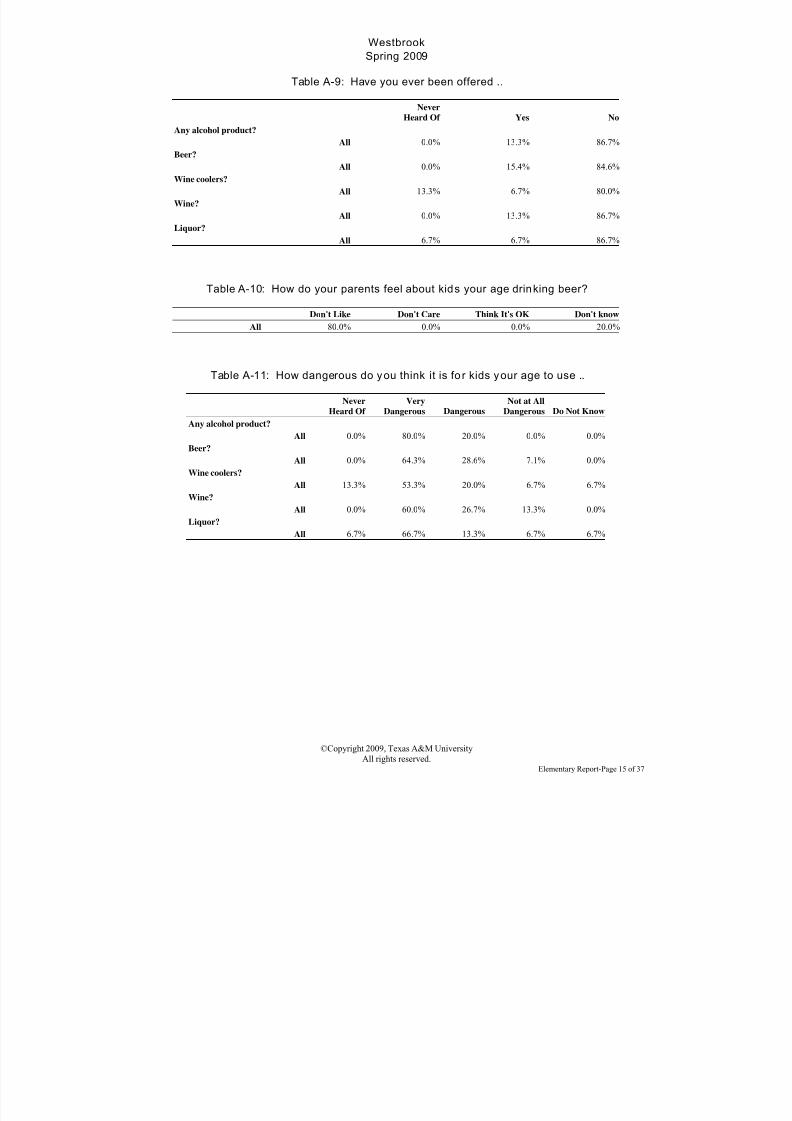
Environment. Twenty percent of Westbrook elementary students said some or most of their close

friends drink beer, wine coolers, wine, or liquor (33 percent statewide), and 13 percent reported they

had been offered alcohol (30 percent statewide). WISD elementary students who said they drink alcohol were asked where they obtain such beverages. Less than 1 percent of district elementary

students said they get alcohol from home (13 percent statewide), less than 1 percent reported obtaining

alcohol from friends (6 percent statewide), and 13 percent said they get alcohol from "somewhere else"

(11 percent statewide).

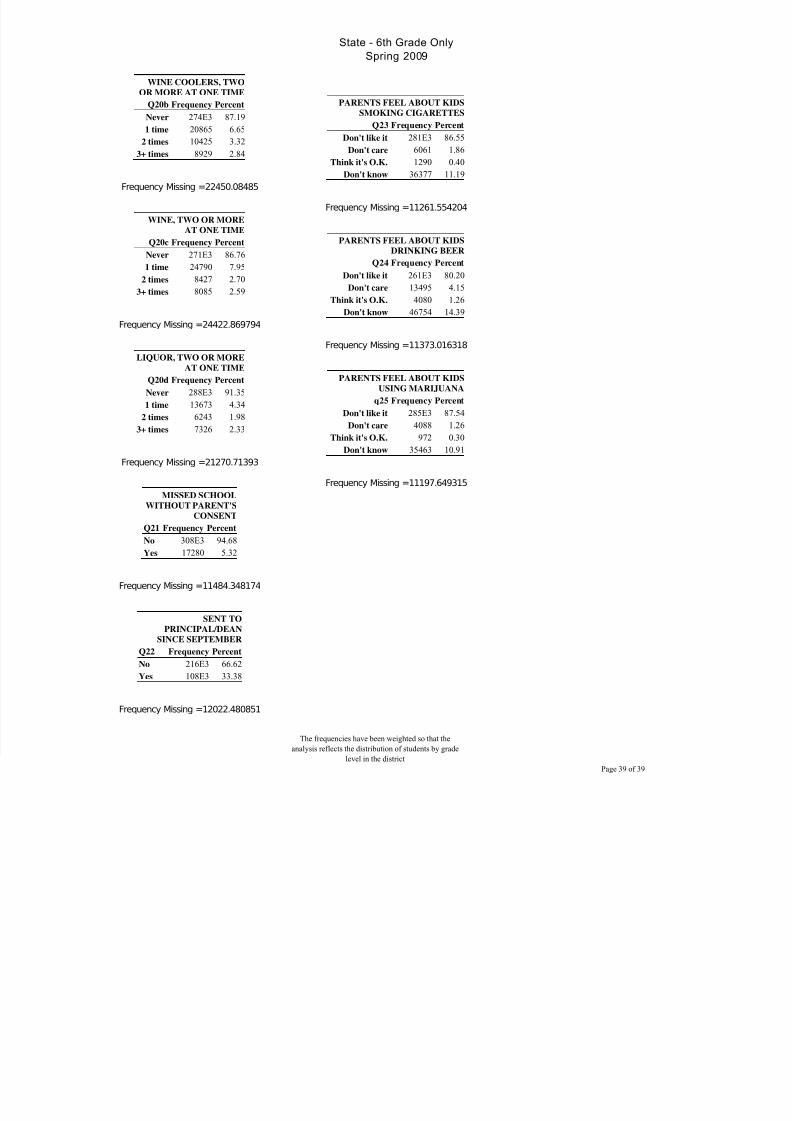
Parental attitudes can be a major factor in whether or not a student uses alcohol or drugs. When asked 

how their parents feel about kids their age drinking beer, 80 percent of WISD elementary students said 

their parents "don't like it" (80 percent statewide). Twenty percent of district elementary students said 

they "don't know" how their parents feel about kids their age drinking beer (14 percent statewide), and 

less than 1 percent said their parents "don't care" if kids their age drink beer (4 percent statewide).

Eighty percent of Westbrook elementary students believe alcohol use is "very dangerous" (64 percent

statewide).

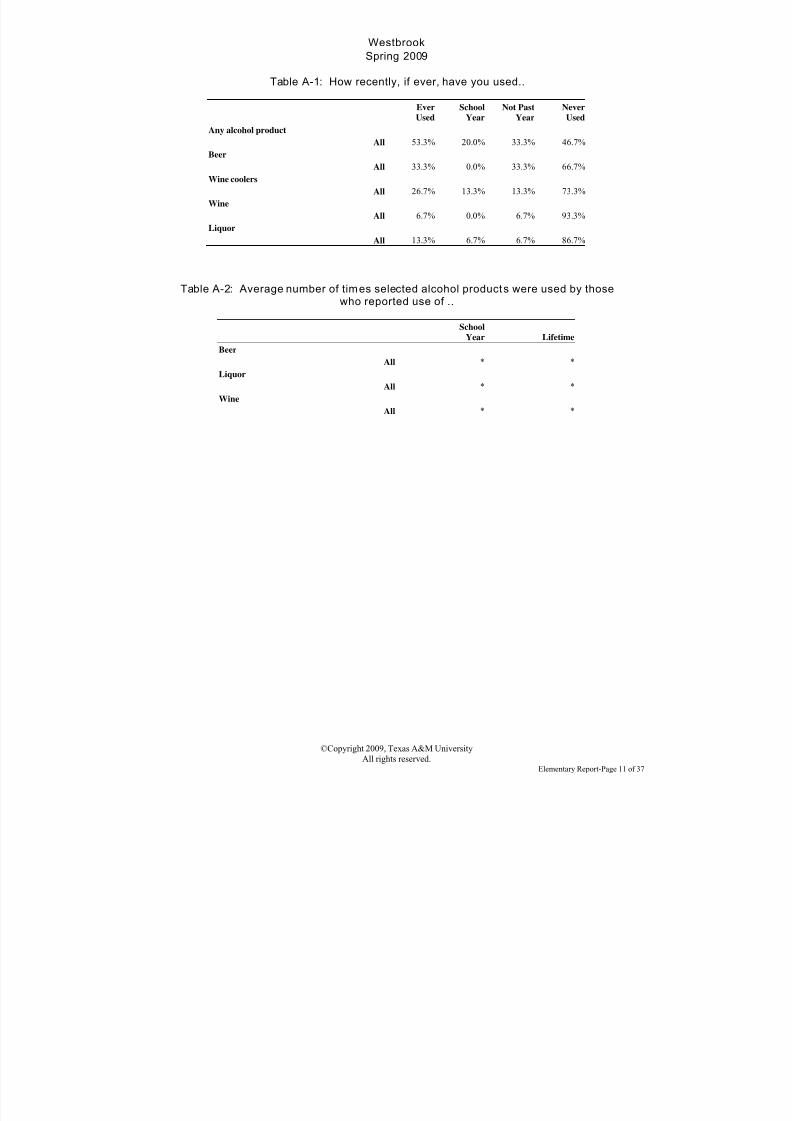
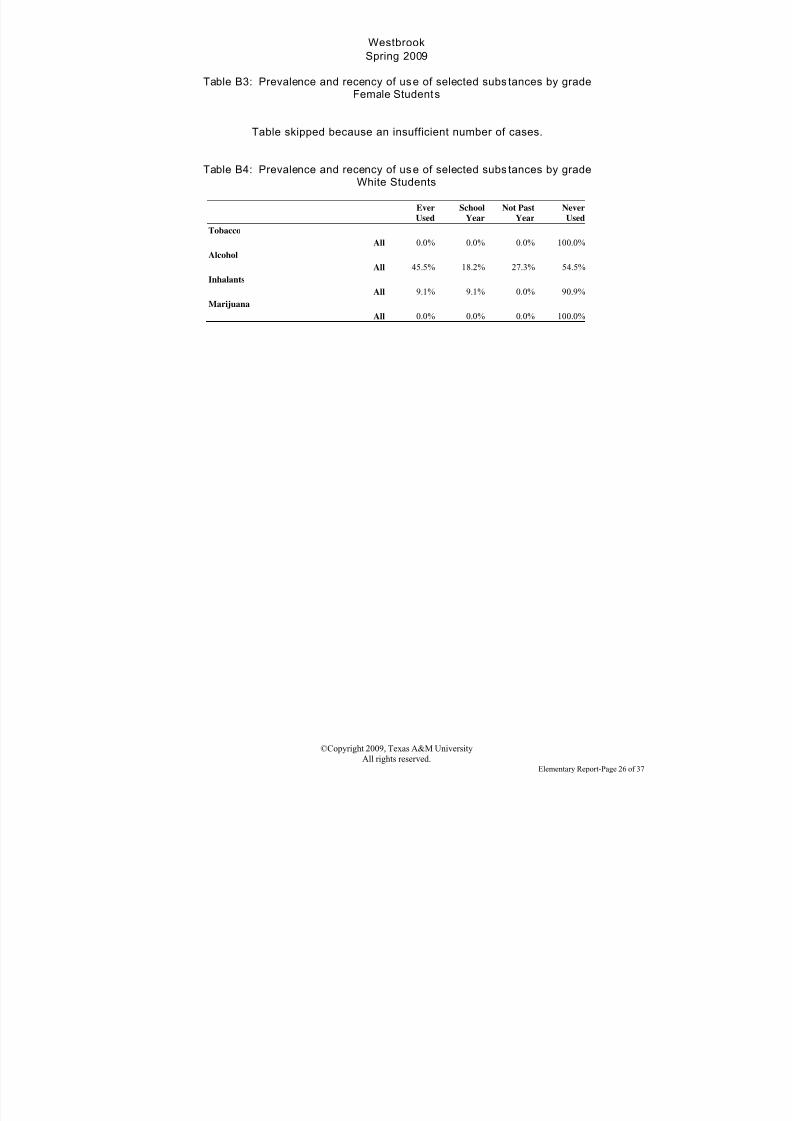
Use. Fifty-three percent of WISD elementary students reported using alcohol at least once during their 

lifetimes (31 percent statewide). Alcohol use during the past school year was reported by 20 percent of 

Westbrook ISD elementary students (21 percent statewide).

7/30/2019 2009 _ mitchell county _ westbrook isd _ 2009 texas school survey of drug and alcohol use _ elementary report

http://slidepdf.com/reader/full/2009-mitchell-county-westbrook-isd-2009-texas-school-survey-of-drug-and 19/107

8

©Copyright 2009, Texas A&M University

All rights reserved. 

Seven percent of WISD elementary students said they "had two or more drinks" of wine cooler in a

row at least once during the past year (13 percent statewide), while 13 percent said they "had two or 

more drinks" of beer in a row at least once during the past year (15 percent statewide), and 7 percent

said they "had two or more drinks" of wine in a row (13 percent statewide). Thirteen percent of 

Westbrook elementary students said they "had two or more drinks" of liquor in a row at least once in

the past year (9 percent statewide).

7/30/2019 2009 _ mitchell county _ westbrook isd _ 2009 texas school survey of drug and alcohol use _ elementary report

http://slidepdf.com/reader/full/2009-mitchell-county-westbrook-isd-2009-texas-school-survey-of-drug-and 20/107

9

©Copyright 2009, Texas A&M University

All rights reserved. 

Marijuana Statewide Overview. In 1990, 2 percent of Texas elementary students reported they had 

experimented with marijuana at least once, and 2 percent indicated they had smoked marijuana

during the past school year. These percentages stayed flat through 1994, crept upward in 1996,

stayed flat through 1998, and dipped slightly in 2000. In the 2002 statewide assessment,experimental use crept back upward slightly to 3 percent and most recent use stayed flat at 2

 percent among elementary students statewide. These percentages of students reporting lifetime and 

 past-year marijuana use held steady through the statewide assessment in 2004. According to the

2006 statewide survey, lifetime marijuana use dipped to 2 percent while the past-year use declined 

to 1 percent. These percentages stayed the same in the most recent statewide assessment in 2008.

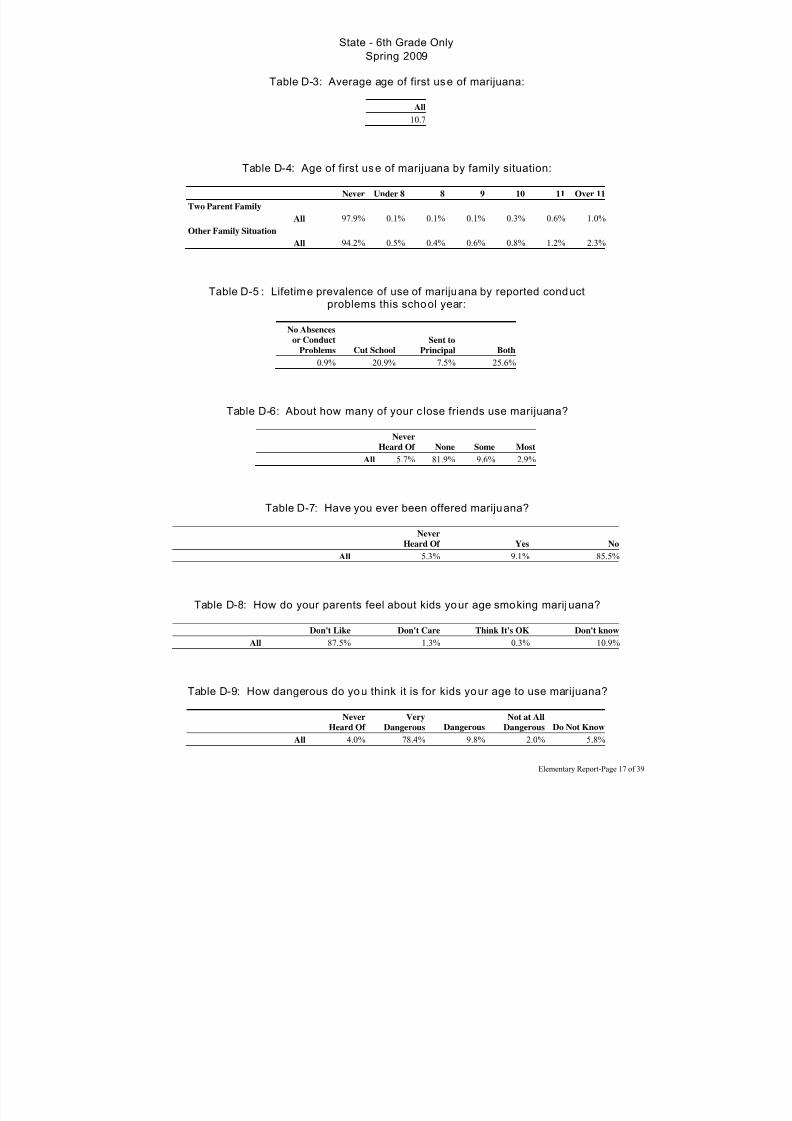
District Overview. Overall, marijuana use among Westbrook ISD 6th grade students in 2009 was

lower than that reported by their counterparts statewide.

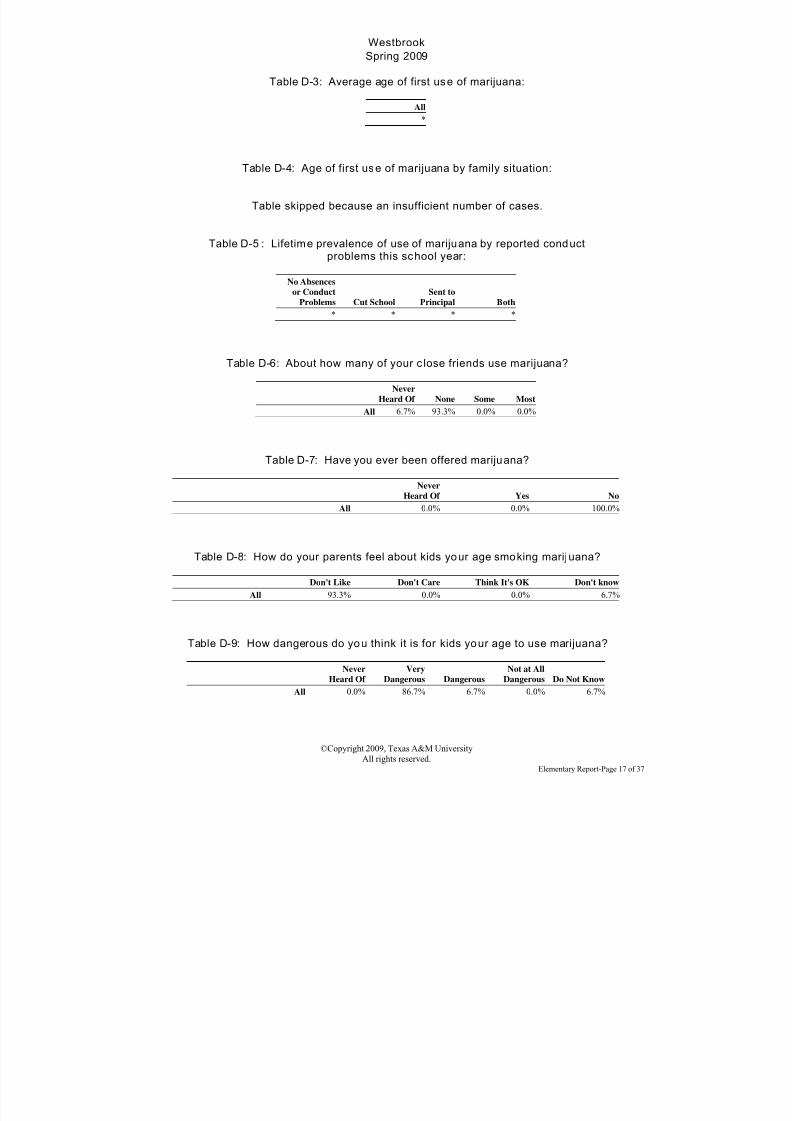
Environment. Less than 1 percent of WISD elementary students said some or most of their close

friends use marijuana (12 percent statewide), and less than 1 percent reported they had been offered marijuana (9 percent statewide).

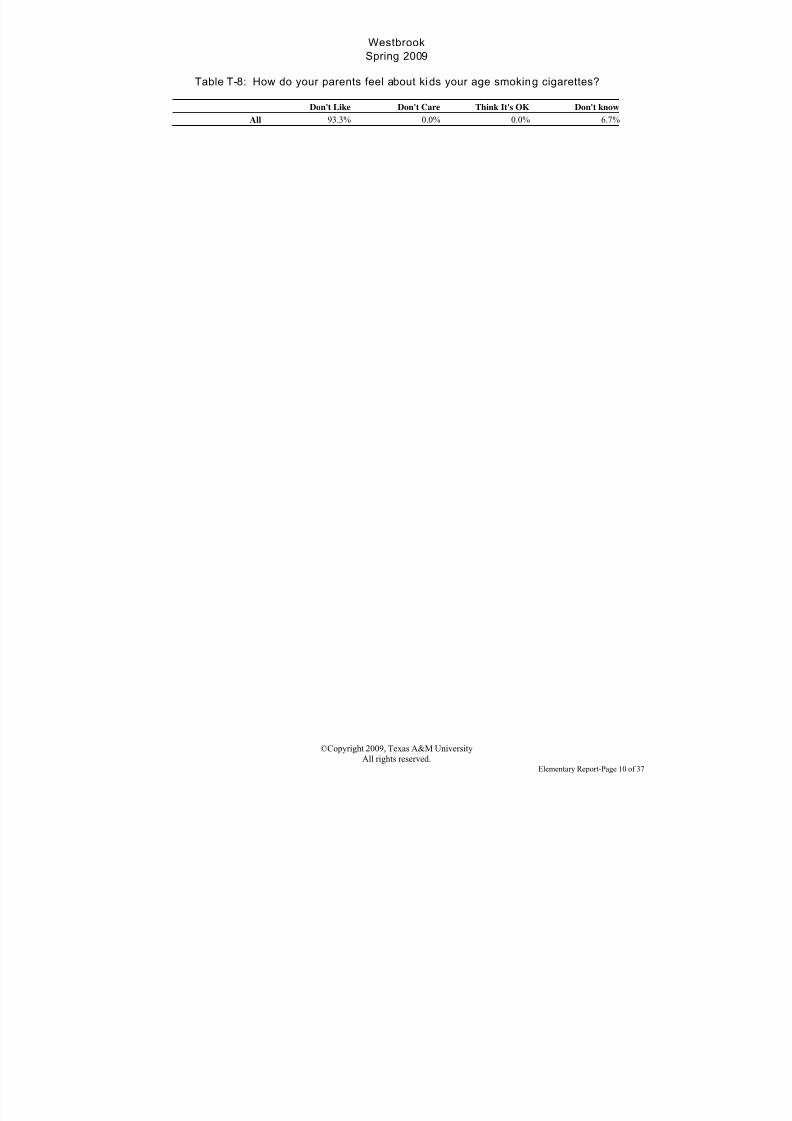
When asked about parental attitudes toward marijuana use, 93 percent of WISD elementary students

said their parents "don't like it" when kids their age smoke marijuana (88 percent statewide), while 7

 percent said that they "don't know" how their parents feel (11 percent statewide), and less than 1

 percent reported their parents "don't care" if kids their age smoke marijuana (1 percent statewide).

When questioned about the danger associated with marijuana use, 87 percent of Westbrook elementary

students believe that using marijuana is "very dangerous" (78 percent statewide).

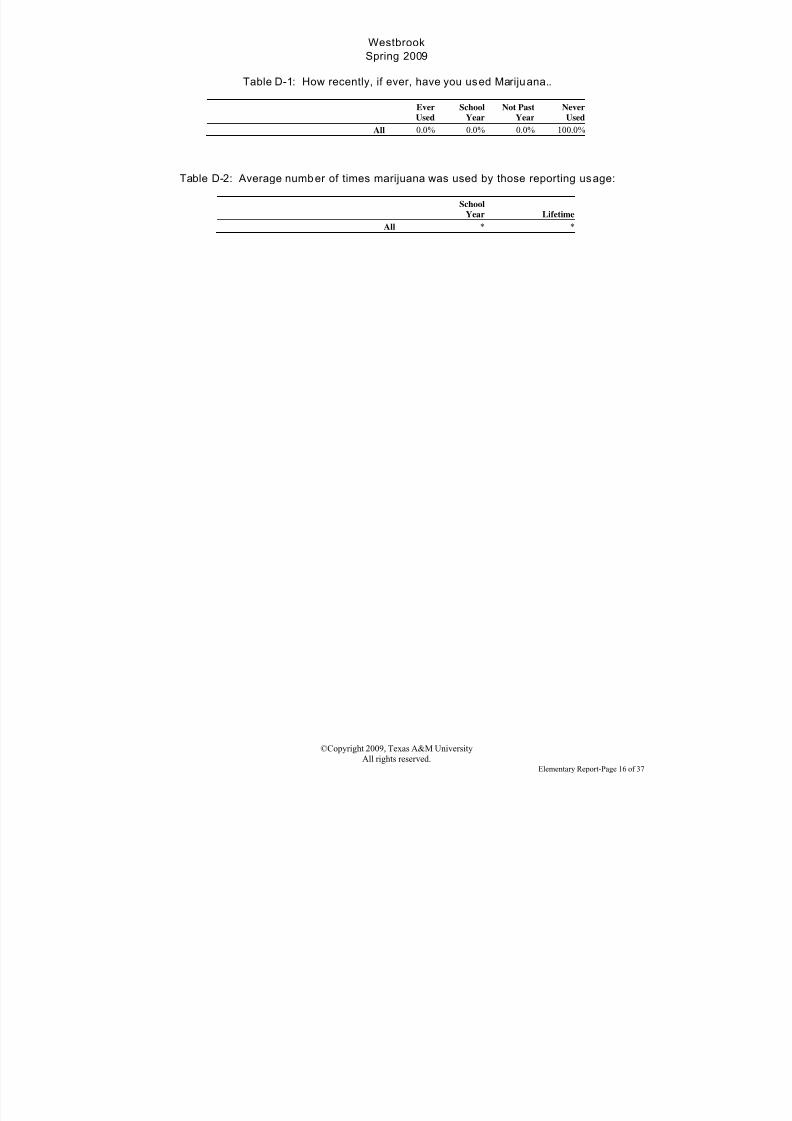
Use. Less than 1 percent of Westbrook ISD elementary students reported using marijuana at least onceduring their lifetimes (3 percent statewide). Less than 1 percent of WISD elementary students reported 

using marijuana during the past school year (2 percent statewide).

7/30/2019 2009 _ mitchell county _ westbrook isd _ 2009 texas school survey of drug and alcohol use _ elementary report

http://slidepdf.com/reader/full/2009-mitchell-county-westbrook-isd-2009-texas-school-survey-of-drug-and 21/107

10

 ©Copyright 2009, Texas A&M University

All rights reserved. 

7/30/2019 2009 _ mitchell county _ westbrook isd _ 2009 texas school survey of drug and alcohol use _ elementary report

http://slidepdf.com/reader/full/2009-mitchell-county-westbrook-isd-2009-texas-school-survey-of-drug-and 22/107

11

 ©Copyright 2009, Texas A&M University

All rights reserved. 

Inhalants In general, inhalants are common, licit substances (paints and thinners, correction fluid, glue, and 

gasoline) which, when sniffed, huffed, or inhaled produce an intoxicating effect. Lifetime and past-

year inhalant use percentages have been adjusted to reflect reported use of both specific inhalants and 

inhalant use generally. This adjustment was made because some students responded positive tospecific use without responding positive to generic use, while some students responded positive to

generic use but not to specific inhalants.

Statewide Overview. Inhalant use among Texas elementary students peaked in 1992, as 16

 percent indicated they had experimented with some form of inhalant at least once during their 

lifetimes and 11 percent said they had used an inhalant during the past school year. Within two

years, however, lifetime use slipped to 10 percent of elementary students statewide and past-year 

use fell to 6 percent. These percentages remained relatively flat through 1996. In 1998, however,

 both experimental and past school year prevalence rates inched back upward---to 12 percent and 9

 percent, respectively. Two years later, this trend was again reversed as both experimental (11

 percent) and past year (8 percent) uses dropped off slightly, then sank further in 2002 to 9 percentlifetime and 6 percent in the past year. Yet, another reverse was detected in 2004, as lifetime

inhalant use rose to 11 percent and past-year inhalant use inched up to 8 percent. Beginning in

2006, yet another reverse in the trend was detected as lifetime use dipped to 10 percent and past-

year inhalant use declined to 7 percent. According to the 2008 statewide assessment, 9 percent

indicated lifetime inhalant use and 7 percent said they had used an inhalant during the previous

year.

District Overview. Overall, use of inhalants among Westbrook ISD 6th grade students in 2009 was

similar to that reported by their peers statewide.

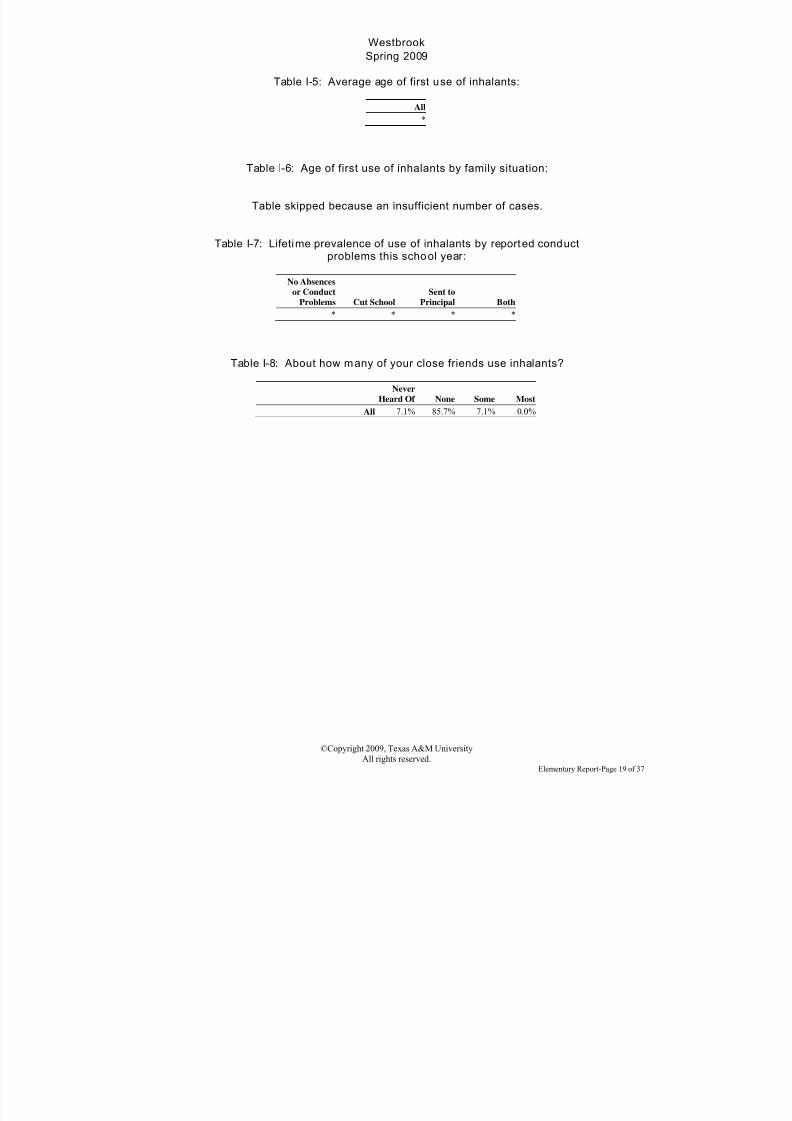
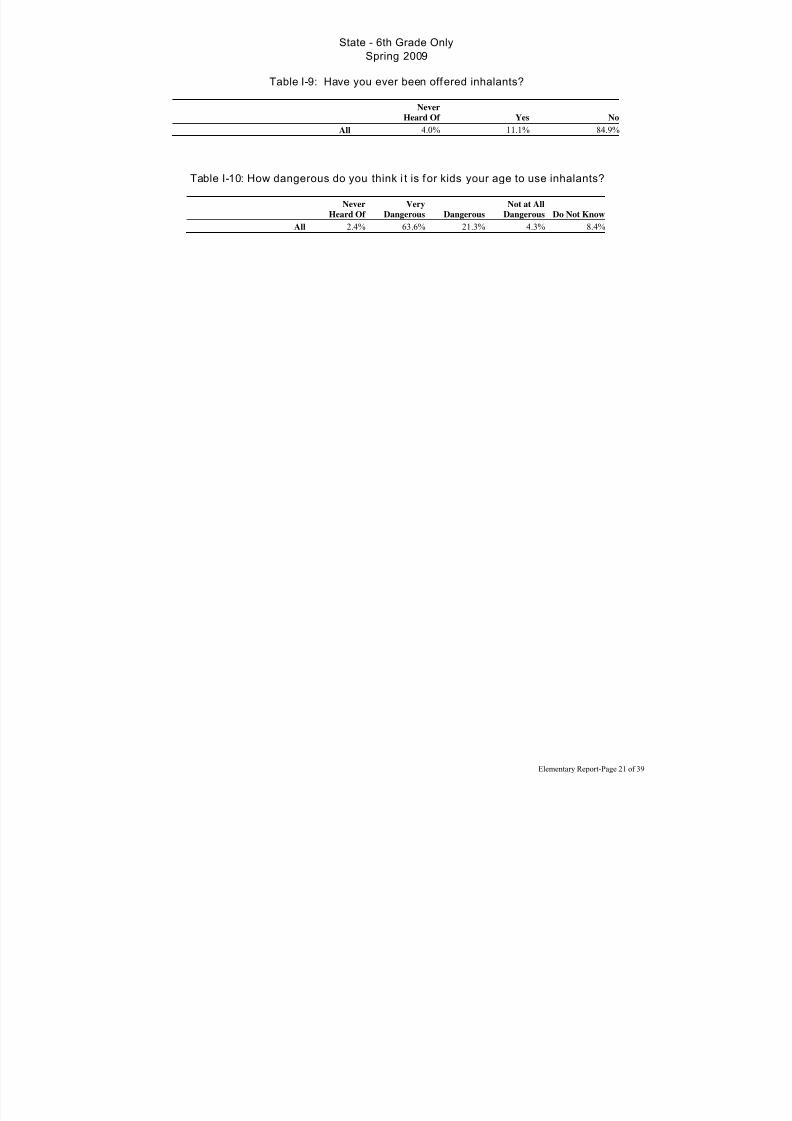
Environment. Seven percent of Westbrook students said some or most of their close friends useinhalants (17 percent statewide), and 13 percent said they had been offered inhalants (11 percent

statewide). Sixty-seven percent of WISD elementary students believe inhalant use is "very dangerous"

(64 percent statewide).

Use. Seven percent of WISD elementary students reported using inhalants at least once during their 

lifetimes (11 percent statewide). Seven percent of Westbrook elementary students said they had used 

inhalants during the past school year (8 percent statewide). Seven percent of Westbrook elementary

students reported using two or more inhalant substances at least once during their lifetimes (5 percent

statewide).

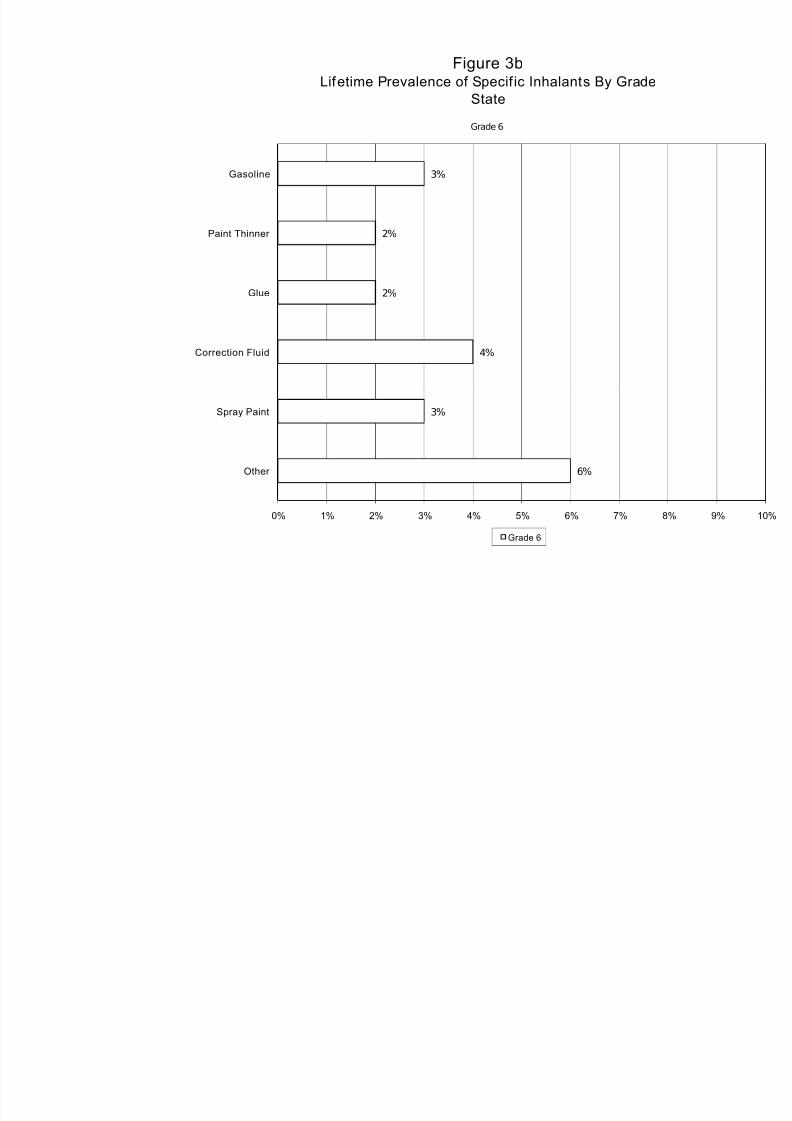
Less than 1 percent of district elementary students reported inhaling whiteout/correction fluid (4 percent statewide), 7 percent indicated they had inhaled glue (2 percent statewide), 7 percent reported 

inhaling spray paint (3 percent statewide), less than 1 percent said they had inhaled gasoline (3 percent

statewide), less than 1 percent indicated they had inhaled paint thinner (2 percent statewide), and less

than 1 percent said they had used substances in the "other inhalants" category (6 percent statewide) at

least once during their lifetimes.

7/30/2019 2009 _ mitchell county _ westbrook isd _ 2009 texas school survey of drug and alcohol use _ elementary report

http://slidepdf.com/reader/full/2009-mitchell-county-westbrook-isd-2009-texas-school-survey-of-drug-and 23/107

12

 ©Copyright 2009, Texas A&M University

All rights reserved. 

7/30/2019 2009 _ mitchell county _ westbrook isd _ 2009 texas school survey of drug and alcohol use _ elementary report

http://slidepdf.com/reader/full/2009-mitchell-county-westbrook-isd-2009-texas-school-survey-of-drug-and 24/107

13

 ©Copyright 2009, Texas A&M University

All rights reserved. 

Drug and Alcohol Information

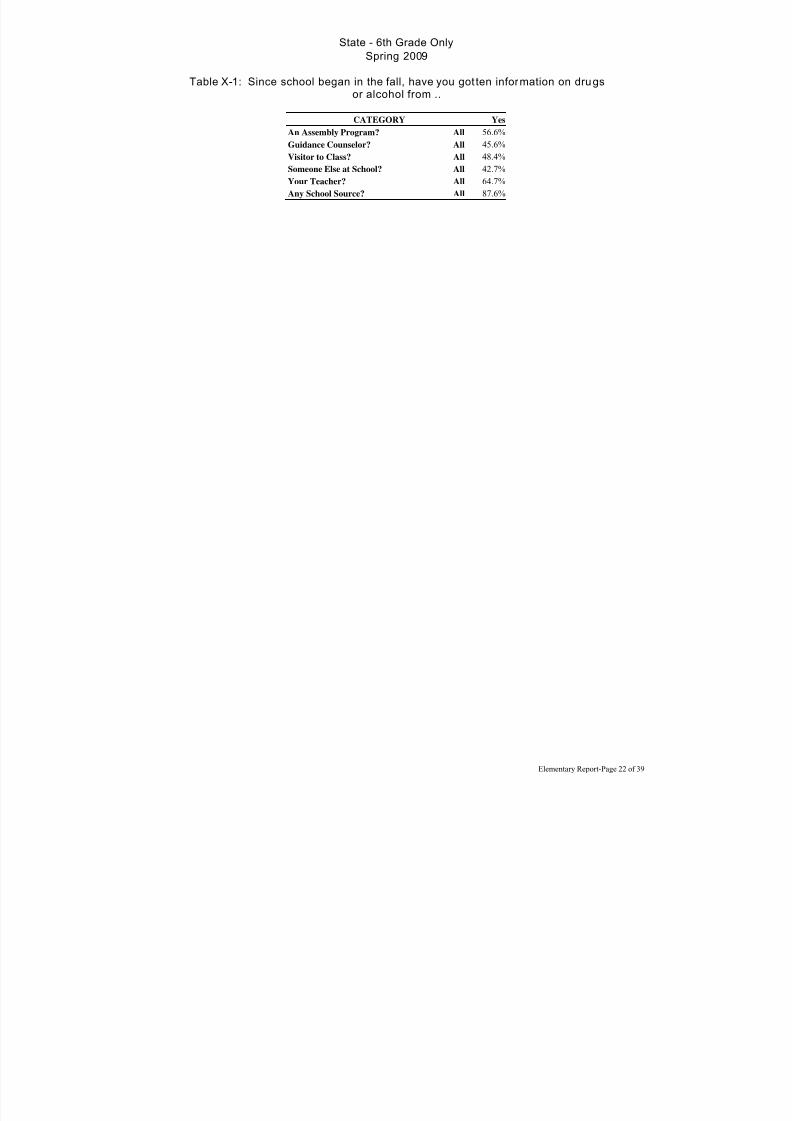
The influence of drug education programs may be reflected in students’ attitudes toward the use of the

specific substances reported above. Ninety-three percent of Westbrook ISD elementary students said 

they had gotten information about drugs and alcohol from a school source since classes began in the

Fall (88 percent statewide). Fifty percent of WISD elementary students said their teacher was a sourcefor information about drugs and alcohol (65 percent statewide), while 87 percent reported getting this

information from a school assembly program (57 percent statewide), and 60 percent said a visitor to

class was a source for information about drugs and alcohol (48 percent statewide). 

7/30/2019 2009 _ mitchell county _ westbrook isd _ 2009 texas school survey of drug and alcohol use _ elementary report

http://slidepdf.com/reader/full/2009-mitchell-county-westbrook-isd-2009-texas-school-survey-of-drug-and 25/107


Texas School Survey

of Drug and Alcohol Use

2009

Part III: Executive Summary 

Elementary Graphics

Figure 1 Prevalence of Lifetime Substance Use

Figure 2 Prevalence of Past School Year Use

Figure 3 Lifetime Prevalence of Specific Inhalants by Grade

Figure 4 Students Who Think Substances are Very Dangerous

Figure 5 Parental Attitudes toward Beer and Marijuana Use

7/30/2019 2009 _ mitchell county _ westbrook isd _ 2009 texas school survey of drug and alcohol use _ elementary report

http://slidepdf.com/reader/full/2009-mitchell-county-westbrook-isd-2009-texas-school-survey-of-drug-and 26/107

Figure 1Prevalence of Lifetime Substance Use Among Grade 6 Elementa

9%

31%

11%

7%

7%

Tobacco

 Alcohol

Inhalants

3%

0%

0% 10% 20% 30% 40%

Marijuana

State Westbrook

7/30/2019 2009 _ mitchell county _ westbrook isd _ 2009 texas school survey of drug and alcohol use _ elementary report

http://slidepdf.com/reader/full/2009-mitchell-county-westbrook-isd-2009-texas-school-survey-of-drug-and 27/107

Figure 2Prevalence of Past School Year Substance Use Among Grade 6 Elem

5%

21%

8%

0%

20%

7%

Tobacco

 Alcohol

Inhalants

2%

0%

0% 5% 10% 15% 20%

Marijuana

State Westbrook

7/30/2019 2009 _ mitchell county _ westbrook isd _ 2009 texas school survey of drug and alcohol use _ elementary report

http://slidepdf.com/reader/full/2009-mitchell-county-westbrook-isd-2009-texas-school-survey-of-drug-and 28/107

Figure 3aLifetime Prevalence of Specif ic Inhalants By Grade

Westbrook

0%

0%

0%

0%

Gasoline

Paint Thinner 

Glue

Correction Fluid

Grade 6

0%

0%

0% 1% 2% 3% 4% 5% 6% 7%

Spray Paint

Other 

Grade 6

7/30/2019 2009 _ mitchell county _ westbrook isd _ 2009 texas school survey of drug and alcohol use _ elementary report

http://slidepdf.com/reader/full/2009-mitchell-county-westbrook-isd-2009-texas-school-survey-of-drug-and 29/107

Figure 3bLifetime Prevalence of Specif ic Inhalants By Grade

State

3%

2%

2%

4%

Gasoline

Paint Thinner 

Glue

Correction Fluid

Grade 6

3%

6%

0% 1% 2% 3% 4% 5% 6% 7%

Spray Paint

Other 

Grade 6

7/30/2019 2009 _ mitchell county _ westbrook isd _ 2009 texas school survey of drug and alcohol use _ elementary report

http://slidepdf.com/reader/full/2009-mitchell-county-westbrook-isd-2009-texas-school-survey-of-drug-and 30/107

Figure 4Percentage of Elementary Students Who Think Various Substances Are Ve

64%

64%

67%

Tobacco

 Alcohol

Inhalants

0% 10% 20% 30% 40% 50% 60% 70%

Marijuana

State Westbrook

7/30/2019 2009 _ mitchell county _ westbrook isd _ 2009 texas school survey of drug and alcohol use _ elementary report

http://slidepdf.com/reader/full/2009-mitchell-county-westbrook-isd-2009-texas-school-survey-of-drug-and 31/107

Figure 5Attitudes of Parents Toward Pre-Adolescent Beer And Mariju

4%

1%

14%

0%

0%

20%

Beer 

Don't Like It

Don't Care

Think It's OK

Don't Know

Marijuana

Don't Like It

1%

0%

11%

0%

0%

7%

0% 10% 20% 30% 40% 50% 60% 70% 80

Don't Care

Think It's OK

Don't Know

State Westbrook

7/30/2019 2009 _ mitchell county _ westbrook isd _ 2009 texas school survey of drug and alcohol use _ elementary report

http://slidepdf.com/reader/full/2009-mitchell-county-westbrook-isd-2009-texas-school-survey-of-drug-and 32/107

Westbrook

Spring 2009

©Copyright 2009, Texas A&M University

All rights reserved.Elementary Report-Page 1 of 37

Texas School Survey

of Drug and Alcohol Use

2009

Westbrook ISD

Part I: District Results

7/30/2019 2009 _ mitchell county _ westbrook isd _ 2009 texas school survey of drug and alcohol use _ elementary report

http://slidepdf.com/reader/full/2009-mitchell-county-westbrook-isd-2009-texas-school-survey-of-drug-and 33/107

Westbrook

Spring 2009

©Copyright 2009, Texas A&M University

All rights reserved.Elementary Report-Page 2 of 37

7/30/2019 2009 _ mitchell county _ westbrook isd _ 2009 texas school survey of drug and alcohol use _ elementary report

http://slidepdf.com/reader/full/2009-mitchell-county-westbrook-isd-2009-texas-school-survey-of-drug-and 34/107

Westbrook

Spring 2009

©Copyright 2009, Texas A&M University

All rights reserved.Elementary Report-Page 3 of 37

Part I: Distric t ResultsElementary (Grade 6)

Table of Contents

General Substance Tables 5-22

 TobaccoAlcoholDrugsInhalantsMiscellaneous

Prevalence Tables 23-30

Selected Substances by Grade:

 Table B1: All Students Table B2: Male Students Table B3: Female Students Table B4: White Students Table B5: African/American Students Table B6: Mexican/American Students Table B7: Students Reporting A Grades Table B8: Students Reporting Grades Lower Than an A Table B9: Students Living With 2 Parents

 Table B10: Students Not Living With 2 Parents Table B11: Students Living in Town More Than 3 Years Table B12: Students Living in Town 3 Years or Less

Margin Tables 31-37

7/30/2019 2009 _ mitchell county _ westbrook isd _ 2009 texas school survey of drug and alcohol use _ elementary report

http://slidepdf.com/reader/full/2009-mitchell-county-westbrook-isd-2009-texas-school-survey-of-drug-and 35/107

Westbrook

Spring 2009

©Copyright 2009, Texas A&M University

All rights reserved.Elementary Report-Page 4 of 37

7/30/2019 2009 _ mitchell county _ westbrook isd _ 2009 texas school survey of drug and alcohol use _ elementary report

http://slidepdf.com/reader/full/2009-mitchell-county-westbrook-isd-2009-texas-school-survey-of-drug-and 36/107

Westbrook

Spring 2009

©Copyright 2009, Texas A&M University

All rights reserved.Elementary Report-Page 5 of 37

1. General Substance Tables

7/30/2019 2009 _ mitchell county _ westbrook isd _ 2009 texas school survey of drug and alcohol use _ elementary report

http://slidepdf.com/reader/full/2009-mitchell-county-westbrook-isd-2009-texas-school-survey-of-drug-and 37/107

Westbrook

Spring 2009

©Copyright 2009, Texas A&M University

All rights reserved.Elementary Report-Page 6 of 37

7/30/2019 2009 _ mitchell county _ westbrook isd _ 2009 texas school survey of drug and alcohol use _ elementary report

http://slidepdf.com/reader/full/2009-mitchell-county-westbrook-isd-2009-texas-school-survey-of-drug-and 38/107

Westbrook

Spring 2009

©Copyright 2009, Texas A&M University

All rights reserved.Elementary Report-Page 7 of 37

Table T-1: How recently, if ever, have you used...

Ever

Used

School

Year

Not Past

Year

Never

Used

Any tobacco product

All 6.7% 0.0% 6.7% 93.3%

Cigarettes

All 6.7% 0.0% 6.7% 93.3%

Smokeless tobacco

All 0.0% 0.0% 0.0% 100.0%

Table T-2: Average number of times selected tobacco products were used by thosewho reported use of ..

School

Year LifetimeAll * 1.5

7/30/2019 2009 _ mitchell county _ westbrook isd _ 2009 texas school survey of drug and alcohol use _ elementary report

http://slidepdf.com/reader/full/2009-mitchell-county-westbrook-isd-2009-texas-school-survey-of-drug-and 39/107

Westbrook

Spring 2009

©Copyright 2009, Texas A&M University

All rights reserved.Elementary Report-Page 8 of 37

Table T-3: Average age of first use of tobacco:

All

Cigarettes

*

Smokeless

Tobacco

*

Any Tobacco

*

Table T-4: Age of first use of tobacco by family situation:

Table skipped because an insufficient number of cases.

7/30/2019 2009 _ mitchell county _ westbrook isd _ 2009 texas school survey of drug and alcohol use _ elementary report

http://slidepdf.com/reader/full/2009-mitchell-county-westbrook-isd-2009-texas-school-survey-of-drug-and 40/107

Westbrook

Spring 2009

©Copyright 2009, Texas A&M University

All rights reserved.Elementary Report-Page 9 of 37

Table T-5: About how many of your c lose friends use ...

Never

Heard Of None Some Most

Any tobacco product?

All 0.0% 100.0% 0.0% 0.0%

Cigarettes?

All 0.0% 100.0% 0.0% 0.0%

Smokeless tobacco?

All 0.0% 100.0% 0.0% 0.0%

Table T-6: Have you ever been offered ...

Never

Heard Of Yes No

Any tobacco product?

All 0.0% 6.7% 93.3%Cigarettes?

All 0.0% 6.7% 93.3%

Smokeless tobacco?

All 0.0% 0.0% 100.0%

Table T-7: How dangerous do you think it is for kids your age to use ...

Never

Heard Of 

Very

Dangerous Dangerous

Not at All

Dangerous Do Not Know

Any tobacco product?

All 0.0% 86.7% 13.3% 0.0% 0.0%

Cigarettes?

All 0.0% 80.0% 13.3% 0.0% 6.7%

Smokeless tobacco?

All 0.0% 80.0% 13.3% 0.0% 6.7%

7/30/2019 2009 _ mitchell county _ westbrook isd _ 2009 texas school survey of drug and alcohol use _ elementary report

http://slidepdf.com/reader/full/2009-mitchell-county-westbrook-isd-2009-texas-school-survey-of-drug-and 41/107

Westbrook

Spring 2009

©Copyright 2009, Texas A&M University

All rights reserved.Elementary Report-Page 10 of 37

Table T-8: How do your parents feel about kids your age smoking cigarettes?

Don't Like Don't Care Think It's OK Don't know

All 93.3% 0.0% 0.0% 6.7%

7/30/2019 2009 _ mitchell county _ westbrook isd _ 2009 texas school survey of drug and alcohol use _ elementary report

http://slidepdf.com/reader/full/2009-mitchell-county-westbrook-isd-2009-texas-school-survey-of-drug-and 42/107

Westbrook

Spring 2009

©Copyright 2009, Texas A&M University

All rights reserved.Elementary Report-Page 11 of 37

Table A-1: How recently, if ever, have you used..

Ever

Used

School

Year

Not Past

Year

Never

Used

Any alcohol product

All 53.3% 20.0% 33.3% 46.7%

Beer

All 33.3% 0.0% 33.3% 66.7%

Wine coolers

All 26.7% 13.3% 13.3% 73.3%

Wine

All 6.7% 0.0% 6.7% 93.3%

Liquor

All 13.3% 6.7% 6.7% 86.7%

Table A-2: Average number of times selected alcohol products were used by those

who reported use of ..

School

Year Lifetime

Beer

All * *

Liquor

All * *

Wine

All * *

7/30/2019 2009 _ mitchell county _ westbrook isd _ 2009 texas school survey of drug and alcohol use _ elementary report

http://slidepdf.com/reader/full/2009-mitchell-county-westbrook-isd-2009-texas-school-survey-of-drug-and 43/107

Westbrook

Spring 2009

©Copyright 2009, Texas A&M University

All rights reserved.Elementary Report-Page 12 of 37

Table A-3: In the past year, how many times have you had two or more drinks at one time of ..

Never 1 Time 2 Times 3+ Times Ever

Beer?

All 86.7% 6.7% 6.7% 0.0% 13.3%

Wine Coolers?

All 93.3% 6.7% 0.0% 0.0% 6.7%

Wine?

All 93.3% 6.7% 0.0% 0.0% 6.7%

Liquor?

All 86.7% 13.3% 0.0% 0.0% 13.3%

7/30/2019 2009 _ mitchell county _ westbrook isd _ 2009 texas school survey of drug and alcohol use _ elementary report

http://slidepdf.com/reader/full/2009-mitchell-county-westbrook-isd-2009-texas-school-survey-of-drug-and 44/107

Westbrook

Spring 2009

©Copyright 2009, Texas A&M University

All rights reserved.Elementary Report-Page 13 of 37

Table A-4: Average age of first use of alcohol:

All

Beer

9.6

Wine Coolers

*

Wine

*

Liquor

*

Any Alcohol

10.2

Table A-5: Age of first use of alcohol by family situation:

Table skipped because an insufficient number of cases.

Table A-6 : Lifetime prevalence of use of alcohol by reported conduct problemsthis school year:

No Absences

or Conduct

Problems Cut School

Sent to

Principal Both

58.3% * 33.3% *

7/30/2019 2009 _ mitchell county _ westbrook isd _ 2009 texas school survey of drug and alcohol use _ elementary report

http://slidepdf.com/reader/full/2009-mitchell-county-westbrook-isd-2009-texas-school-survey-of-drug-and 45/107

Westbrook

Spring 2009

©Copyright 2009, Texas A&M University

All rights reserved.Elementary Report-Page 14 of 37

Table A-7: When you drink alcohol, do you get it from ..

Don't Drink Yes No

Home?

All 85.7% 0.0% 14.3%

Friends?

All 85.7% 0.0% 14.3%

Somewhere else?

All 80.0% 13.3% 6.7%

Table A-8: About how many of your close friends use ..

Never

Heard Of  None Some Most

Any alcohol product?

All 0.0% 80.0% 20.0% 0.0%

Beer?All 0.0% 92.9% 7.1% 0.0%

Wine coolers?

All 13.3% 66.7% 20.0% 0.0%

Wine?

All 0.0% 100.0% 0.0% 0.0%

Liquor?

All 0.0% 100.0% 0.0% 0.0%

7/30/2019 2009 _ mitchell county _ westbrook isd _ 2009 texas school survey of drug and alcohol use _ elementary report

http://slidepdf.com/reader/full/2009-mitchell-county-westbrook-isd-2009-texas-school-survey-of-drug-and 46/107

Westbrook

Spring 2009

©Copyright 2009, Texas A&M University

All rights reserved.Elementary Report-Page 15 of 37

Table A-9: Have you ever been offered ..

Never

Heard Of Yes No

Any alcohol product?

All 0.0% 13.3% 86.7%

Beer?

All 0.0% 15.4% 84.6%

Wine coolers?

All 13.3% 6.7% 80.0%

Wine?

All 0.0% 13.3% 86.7%

Liquor?

All 6.7% 6.7% 86.7%

Table A-10: How do your parents feel about kids your age drinking beer?

Don't Like Don't Care Think It's OK Don't know

All 80.0% 0.0% 0.0% 20.0%

Table A-11: How dangerous do you think it is fo r kids your age to use ..

Never

Heard Of 

Very

Dangerous Dangerous

Not at All

Dangerous Do Not Know

Any alcohol product?

All 0.0% 80.0% 20.0% 0.0% 0.0%

Beer?

All 0.0% 64.3% 28.6% 7.1% 0.0%

Wine coolers?

All 13.3% 53.3% 20.0% 6.7% 6.7%

Wine?

All 0.0% 60.0% 26.7% 13.3% 0.0%

Liquor?

All 6.7% 66.7% 13.3% 6.7% 6.7%

7/30/2019 2009 _ mitchell county _ westbrook isd _ 2009 texas school survey of drug and alcohol use _ elementary report

http://slidepdf.com/reader/full/2009-mitchell-county-westbrook-isd-2009-texas-school-survey-of-drug-and 47/107

Westbrook

Spring 2009

©Copyright 2009, Texas A&M University

All rights reserved.Elementary Report-Page 16 of 37

Table D-1: How recently, if ever, have you used Marijuana..

Ever

Used

School

Year

Not Past

Year

Never

Used

All 0.0% 0.0% 0.0% 100.0%

Table D-2: Average number of times marijuana was used by those reporting usage:

School

Year Lifetime

All * *

7/30/2019 2009 _ mitchell county _ westbrook isd _ 2009 texas school survey of drug and alcohol use _ elementary report

http://slidepdf.com/reader/full/2009-mitchell-county-westbrook-isd-2009-texas-school-survey-of-drug-and 48/107

Westbrook

Spring 2009

©Copyright 2009, Texas A&M University

All rights reserved.Elementary Report-Page 17 of 37

Table D-3: Average age of first use of marijuana:

All

*

Table D-4: Age of first use of marijuana by family situation:

Table skipped because an insufficient number of cases.

Table D-5 : Lifetime prevalence of use of marijuana by reported conductproblems this school year:

No Absences

or Conduct

Problems Cut School

Sent to

Principal Both* * * *

Table D-6: About how many of your c lose friends use marijuana?

Never

Heard Of None Some Most

All 6.7% 93.3% 0.0% 0.0%

Table D-7: Have you ever been offered marijuana?

Never

Heard Of Yes No

All 0.0% 0.0% 100.0%

Table D-8: How do your parents feel about kids your age smoking marijuana?

Don't Like Don't Care Think It's OK Don't know

All 93.3% 0.0% 0.0% 6.7%

Table D-9: How dangerous do you think it is for kids your age to use marijuana?

Never

Heard Of 

Very

Dangerous Dangerous

Not at All

Dangerous Do Not Know

All 0.0% 86.7% 6.7% 0.0% 6.7%

7/30/2019 2009 _ mitchell county _ westbrook isd _ 2009 texas school survey of drug and alcohol use _ elementary report

http://slidepdf.com/reader/full/2009-mitchell-county-westbrook-isd-2009-texas-school-survey-of-drug-and 49/107

7/30/2019 2009 _ mitchell county _ westbrook isd _ 2009 texas school survey of drug and alcohol use _ elementary report

http://slidepdf.com/reader/full/2009-mitchell-county-westbrook-isd-2009-texas-school-survey-of-drug-and 50/107

Westbrook

Spring 2009

©Copyright 2009, Texas A&M University

All rights reserved.Elementary Report-Page 19 of 37

Table I-5: Average age of first use of inhalants:

All

*

Table I-6: Age of first use of inhalants by family situation:

Table skipped because an insufficient number of cases.

Table I-7: Lifetime prevalence of use of inhalants by reported conductproblems this school year:

No Absences

or Conduct

Problems Cut School

Sent to

Principal Both* * * *

Table I-8: About how many of your close friends use inhalants?

Never

Heard Of None Some Most

All 7.1% 85.7% 7.1% 0.0%

7/30/2019 2009 _ mitchell county _ westbrook isd _ 2009 texas school survey of drug and alcohol use _ elementary report

http://slidepdf.com/reader/full/2009-mitchell-county-westbrook-isd-2009-texas-school-survey-of-drug-and 51/107

Westbrook

Spring 2009

©Copyright 2009, Texas A&M University

All rights reserved.Elementary Report-Page 20 of 37

Table I-9: Have you ever been offered inhalants?

Never

Heard Of Yes No

All 6.7% 13.3% 80.0%

Table I-10: How dangerous do you think i t is for kids your age to use inhalants?

Never

Heard Of 

Very

Dangerous Dangerous

Not at All

Dangerous Do Not Know

All 0.0% 66.7% 13.3% 6.7% 13.3%

7/30/2019 2009 _ mitchell county _ westbrook isd _ 2009 texas school survey of drug and alcohol use _ elementary report

http://slidepdf.com/reader/full/2009-mitchell-county-westbrook-isd-2009-texas-school-survey-of-drug-and 52/107

Westbrook

Spring 2009

©Copyright 2009, Texas A&M University

All rights reserved.Elementary Report-Page 21 of 37

Table X-1: Since school began in the fall, have you got ten information on drugsor alcohol from ..

CATEGORY Yes

An Assembly Program? All 86.7%

Guidance Counselor? All 0.0%

Visitor to Class? All 60.0%

Someone Else at School? All 42.9%

Your Teacher? All 50.0%

Any School Source? All 93.3%

7/30/2019 2009 _ mitchell county _ westbrook isd _ 2009 texas school survey of drug and alcohol use _ elementary report

http://slidepdf.com/reader/full/2009-mitchell-county-westbrook-isd-2009-texas-school-survey-of-drug-and 53/107

Westbrook

Spring 2009

©Copyright 2009, Texas A&M University

All rights reserved.Elementary Report-Page 22 of 37

7/30/2019 2009 _ mitchell county _ westbrook isd _ 2009 texas school survey of drug and alcohol use _ elementary report

http://slidepdf.com/reader/full/2009-mitchell-county-westbrook-isd-2009-texas-school-survey-of-drug-and 54/107

Westbrook

Spring 2009

©Copyright 2009, Texas A&M University

All rights reserved.Elementary Report-Page 23 of 37

2.  Prevalence Tables

7/30/2019 2009 _ mitchell county _ westbrook isd _ 2009 texas school survey of drug and alcohol use _ elementary report

http://slidepdf.com/reader/full/2009-mitchell-county-westbrook-isd-2009-texas-school-survey-of-drug-and 55/107

Westbrook

Spring 2009

©Copyright 2009, Texas A&M University

All rights reserved.Elementary Report-Page 24 of 37

7/30/2019 2009 _ mitchell county _ westbrook isd _ 2009 texas school survey of drug and alcohol use _ elementary report

http://slidepdf.com/reader/full/2009-mitchell-county-westbrook-isd-2009-texas-school-survey-of-drug-and 56/107

Westbrook

Spring 2009

©Copyright 2009, Texas A&M University

All rights reserved.Elementary Report-Page 25 of 37

Table B1: Prevalence and recency of use of selected subs tances by grade Al l Students

Ever

Used

School

Year

Not Past

Year

Never

Used

Tobacco

All 6.7% 0.0% 6.7% 93.3%

Alcohol

All 53.3% 20.0% 33.3% 46.7%

Inhalants

All 6.7% 6.7% 0.0% 93.3%

Marijuana

All 0.0% 0.0% 0.0% 100.0%

Table B2: Prevalence and recency of use of selected subs tances by gradeMale Students

Ever

Used

School

Year

Not Past

Year

Never

Used

Tobacco

All 10.0% 0.0% 10.0% 90.0%

Alcohol

All 50.0% 20.0% 30.0% 50.0%

Inhalants

All 10.0% 10.0% 0.0% 90.0%

Marijuana

All 0.0% 0.0% 0.0% 100.0%

7/30/2019 2009 _ mitchell county _ westbrook isd _ 2009 texas school survey of drug and alcohol use _ elementary report

http://slidepdf.com/reader/full/2009-mitchell-county-westbrook-isd-2009-texas-school-survey-of-drug-and 57/107

Westbrook

Spring 2009

©Copyright 2009, Texas A&M University

All rights reserved.Elementary Report-Page 26 of 37

Table B3: Prevalence and recency of use of selected subs tances by gradeFemale Students

Table skipped because an insufficient number of cases.

Table B4: Prevalence and recency of use of selected subs tances by gradeWhite Students

Ever

Used

School

Year

Not Past

Year

Never

Used

Tobacco

All 0.0% 0.0% 0.0% 100.0%

Alcohol

All 45.5% 18.2% 27.3% 54.5%

Inhalants

All 9.1% 9.1% 0.0% 90.9%

MarijuanaAll 0.0% 0.0% 0.0% 100.0%

7/30/2019 2009 _ mitchell county _ westbrook isd _ 2009 texas school survey of drug and alcohol use _ elementary report

http://slidepdf.com/reader/full/2009-mitchell-county-westbrook-isd-2009-texas-school-survey-of-drug-and 58/107

Westbrook

Spring 2009

©Copyright 2009, Texas A&M University

All rights reserved.Elementary Report-Page 27 of 37

Table B5: Prevalence and recency of use of selected subs tances by grade Af rican/American Students

Table skipped because there are no cases.

Table B6: Prevalence and recency of use of selected subs tances by gradeMexican/American Students

Table skipped because an insufficient number of cases.

7/30/2019 2009 _ mitchell county _ westbrook isd _ 2009 texas school survey of drug and alcohol use _ elementary report

http://slidepdf.com/reader/full/2009-mitchell-county-westbrook-isd-2009-texas-school-survey-of-drug-and 59/107

Westbrook

Spring 2009

©Copyright 2009, Texas A&M University

All rights reserved.Elementary Report-Page 28 of 37

Table B7: Prevalence and recency of use of selected subs tances by gradeStudents Reporting A Grades

Table skipped because an insufficient number of cases.

Table B8: Prevalence and recency of use of selected subs tances by gradeStudents Reporting grades lower than A

Table skipped because an insufficient number of cases.

7/30/2019 2009 _ mitchell county _ westbrook isd _ 2009 texas school survey of drug and alcohol use _ elementary report

http://slidepdf.com/reader/full/2009-mitchell-county-westbrook-isd-2009-texas-school-survey-of-drug-and 60/107

Westbrook

Spring 2009

©Copyright 2009, Texas A&M University

All rights reserved.Elementary Report-Page 29 of 37

Table B9: Prevalence and recency of use of selected subs tances by gradeStudents Living With 2 Parents

Table skipped because an insufficient number of cases.

Table B10: Prevalence and recency of use of selected substances by gradeStudents Not Living With 2 Parents

Table skipped because an insufficient number of cases.

7/30/2019 2009 _ mitchell county _ westbrook isd _ 2009 texas school survey of drug and alcohol use _ elementary report

http://slidepdf.com/reader/full/2009-mitchell-county-westbrook-isd-2009-texas-school-survey-of-drug-and 61/107

Westbrook

Spring 2009

©Copyright 2009, Texas A&M University

All rights reserved.Elementary Report-Page 30 of 37

Table B11: Prevalence and recency of use of selected substances by gradeStudents L iving in Town More Than 3 Years

Ever

Used

School

Year

Not Past

Year

Never

Used

Tobacco

All 8.3% 0.0% 8.3% 91.7%

Alcohol

All 58.3% 25.0% 33.3% 41.7%

Inhalants

All 8.3% 8.3% 0.0% 91.7%

Marijuana

All 0.0% 0.0% 0.0% 100.0%

Table B12: Prevalence and recency of use of selected substances by gradeStudents L iving in Town 3 Years or Less

Table skipped because an insufficient number of cases.

7/30/2019 2009 _ mitchell county _ westbrook isd _ 2009 texas school survey of drug and alcohol use _ elementary report

http://slidepdf.com/reader/full/2009-mitchell-county-westbrook-isd-2009-texas-school-survey-of-drug-and 62/107

Westbrook

Spring 2009

©Copyright 2009, Texas A&M University

All rights reserved.Elementary Report-Page 31 of 37

3. Margin Tables

7/30/2019 2009 _ mitchell county _ westbrook isd _ 2009 texas school survey of drug and alcohol use _ elementary report

http://slidepdf.com/reader/full/2009-mitchell-county-westbrook-isd-2009-texas-school-survey-of-drug-and 63/107

Westbrook

Spring 2009

©Copyright 2009, Texas A&M University

All rights reserved.Elementary Report-Page 32 of 37

7/30/2019 2009 _ mitchell county _ westbrook isd _ 2009 texas school survey of drug and alcohol use _ elementary report

http://slidepdf.com/reader/full/2009-mitchell-county-westbrook-isd-2009-texas-school-survey-of-drug-and 64/107

Westbrook

Spring 2009

©Copyright 2009, Texas A&M UniversityAll rights reserved.

 The frequencies have been weighted so that the analysis reflects the distribution of students by grade level in the district.

Page 33 of 37

 The FREQ Procedure

GENDER

Q1 Frequency Percent

Female 5 33.33

Male 10 66.67

GRADE LEVEL

Q2 Frequency Percent

Grade 6 15 100.00

DO YOU LIVE WITH

BOTH PARENTS?

Q3 Frequency Percent

No 6 40.00

Yes 9 60.00

AGE

Q4 Frequency Percent

11 4 26.67

12 8 53.33

13 or older 3 20.00

ETHNICITY

Q5 Frequency Percent

Mexican/American 4 26.67

White 11 73.33

WHAT GRADES DO YOU

USUALLY GET

Q6 Frequency Percent

Mostly A's 6 40.00

Mostly B's 8 53.33

Mostly F's 1 6.67

LIVED IN THIS TOWN FOR

MORE THAN 3 YEARS

Q7 Frequency Percent

Don't Know 1 6.67

No 2 13.33

Yes 12 80.00

EITHER PARENT

GRADUATE FROM

COLLEGE

Q8 Frequency Percent

Don't Know 4 26.67

No 5 33.33

Yes 6 40.00 

QUALIFY FOR A

FREE/REDUCED PRICE

LUNCH?

Q9 Frequency Percent

Don't Know 8 53.33

No 5 33.33

Yes 2 13.33


PARENTS ATTEND

PTA MEETINGS?Q10 Frequency Percent

No 9 60.00

Yes 6 40.00


EVER INHALED

GASOLINE TO GET

HIGH?

Q11a Frequency Percent

Not Used 15 100.00


EVER INHALED PAINTTHINNER TO GET HIGH?

Q11b Frequency Percent

Not Used 15 100.00


EVER INHALED GLUE TO

GET HIGH?

Q11c Frequency Percent

Not Used 14 93.33

Used 1 6.67


EVER INHALED

WHITEOUT TO GET

HIGH?

Q11d Frequency Percent

Not Used 15 100.00


EVER INHALED SPRAY

PAINT TO GET HIGH?

Q11e Frequency Percent

Not Used 14 93.33

Used 1 6.67


EVER USED OTHER

INHALANTS TO GET

HIGH?

Q11f Frequency Percent

Not Used 15 100.00


CIGARETTE USE DURING

LIFETIME

Q12A Frequency Percent

Never used 14 93.33

1-2 times 1 6.67


SNUFF/CHEWING

TOBACCO USE IN

LIFETIME

Q12B Frequency Percent

Never used 14 100.00


Frequency Missing =1

BEER USE DURING

LIFETIME

Q12C Frequency Percent

Never used 9 64.29

1-2 times 5 35.71


Frequency Missing =1

WINE COOLER USE DURIN

LIFETIM

Q12D Frequency Perce

Never heard of  2 14.2

Never used 9 64.2

1-2 times 3 21.4 

Frequency Missing =1

7/30/2019 2009 _ mitchell county _ westbrook isd _ 2009 texas school survey of drug and alcohol use _ elementary report

http://slidepdf.com/reader/full/2009-mitchell-county-westbrook-isd-2009-texas-school-survey-of-drug-and 65/107

Westbrook

Spring 2009

©Copyright 2009, Texas A&M UniversityAll rights reserved.

 The frequencies have been weighted so that the analysis reflects the distribution of students by grade level in the district.

Page 34 of 37

WINE USE DURING

LIFETIME

Q12E Frequency Percent

Never used 13 92.86

1-2 times 1 7.14

Frequency Missing =1

LIQUOR USE DURING

LIFETIME

Q12F Frequency Percent

Never heard of  1 6.67

Never used 12 80.00

1-2 times 2 13.33

SHIMERON USE DURING

LIFETIMEQ12G Frequency Percent

Never heard of  14 100.00

Frequency Missing =1

INHALANT USE DURING

LIFETIME

Q12H Frequency Percent

Never heard of  1 6.67

Never used 14 93.33

MARIJUANA USE DURING

LIFETIME

Q12I Frequency Percent

Never heard of  1 7.14

Never used 13 92.86

Frequency Missing =1

CIGARETTE USE IN PAST

SCHOOL YEAR

Q13A Frequency PercentNever used 15 100.00

SNUFF/CHEWING

TOBACCO USE IN PAST

YEAR

Q13B Frequency Percent

Never used 15 100.00

BEER USE IN PAST

SCHOOL YEAR

Q13C Frequency Percent

Never used 14 100.00


Frequency Missing =1

WINE COOLER USE IN PAST

SCHOOL YEAR

Q13D Frequency Percent

Never heard of  2 13.33

Never used 11 73.33

1-2 times 2 13.33


WINE USE IN PAST

SCHOOL YEAR

Q13E Frequency Percent

Never used 14 100.00


Frequency Missing =1

LIQUOR USE IN PAST

SCHOOL YEAR

Q13F Frequency Percent

Never used 14 93.33

1-2 times 1 6.67


SHIMERON USE IN PAST

SCHOOL YEAR

Q13G Frequency Percent

Never heard of  15 100.00


INHALANT USE IN PAST

SCHOOL YEAR

Q13H Frequency Percent

Never heard of  1 6.67

Never used 13 86.67

1-2 times 1 6.67


MARIJUANA USE IN PAST

SCHOOL YEAR

Q13I Frequency Percent

Never heard of  1 6.67

Never used 14 93.33


AGE WHEN FIRST US

CIGARETT

Q14A Frequency Perc

11 years old 1 6

Never heard/used 14 93


AGE WHEN FIRST US

SNUFF/CHEW TOBAC

Q14B Frequency Perc

Never heard/used 15 100


AGE WHEN FIRST USED BE

Q14C Frequency Perc

7 or younger 2 14

11 years old 2 14

12 or older 1 7

Never heard/used 9 64


Frequency Missing =1

AGE WHEN FIRST USED WI

COOLE

Q14D Frequency Perc

11 years old 4 26

Never heard/used 11 73


AGE WHEN FIRST USED WI

Q14E Frequency Perc11 years old 1 7

Never heard/used 13 92


Frequency Missing =1

AGE WHEN FIRST USED LIQU

Q14F Frequency Perc

11 years old 2 13

Never heard/used 13 86


AGE WHEN FIRST US

SHIMER

Q14G Frequency Perc

Never heard/used 15 100


7/30/2019 2009 _ mitchell county _ westbrook isd _ 2009 texas school survey of drug and alcohol use _ elementary report

http://slidepdf.com/reader/full/2009-mitchell-county-westbrook-isd-2009-texas-school-survey-of-drug-and 66/107

Westbrook

Spring 2009

©Copyright 2009, Texas A&M UniversityAll rights reserved.

 The frequencies have been weighted so that the analysis reflects the distribution of students by grade level in the district.

Page 35 of 37

AGE WHEN FIRST USED

INHALANTS

Q14H Frequency Percent

8 years old 1 6.67

Never heard/used 14 93.33

AGE WHEN FIRST USED

MARIJUANA

Q14I Frequency Percent

Never heard/used 15 100.00

CLOSE FRIENDS USE

CIGARETTES

Q15A Frequency Percent

None 15 100.00

CLOSE FRIENDS USESNUFF/CHEWING

TOBACCO

Q15B Frequency Percent

None 15 100.00

CLOSE FRIENDS USE

BEER

Q15C Frequency Percent

None 13 92.86

Some 1 7.14

Frequency Missing =1

CLOSE FRIENDS USE WINE

COOLERS

Q15D Frequency Percent

Never heard of  2 13.33

None 10 66.67

Some 3 20.00

CLOSE FRIENDS USE

WINE

Q15E Frequency Percent

None 13 100.00

Frequency Missing =2

CLOSE FRIENDS USE

LIQUOR

Q15F Frequency Percent

None 14 100.00


Frequency Missing =1

CLOSE FRIENDS USE

SHIMERON

Q15G Frequency Percent

Never heard of  11 73.33

None 3 20.00

Some 1 6.67


CLOSE FRIENDS USE

INHALANTS

Q15H Frequency PercentNever heard of  1 7.14

None 12 85.71

Some 1 7.14


Frequency Missing =1

CLOSE FRIENDS USE

MARIJUANA

Q15I Frequency Percent

Never heard of  1 6.67

None 14 93.33


EVER BEEN OFFERED

CIGARETTES

Q16a Frequency Percent

No 14 93.33

Yes 1 6.67


EVER BEEN OFFERED

SNUFF/CHEWING

TOBACCO

Q16b Frequency Percent

No 15 100.00


EVER BEEN OFFERED

BEER

Q16c Frequency Percent

No 11 84.62

Yes 2 15.38


Frequency Missing =2

EVER BEEN OFFERED WIN

COOLER

Q16d Frequency Perce

Never heard of  2 13.No 12 80.

Yes 1 6.


EVER BEEN OFFERED

WINE

Q16e Frequency Percent

No 13 86.67

Yes 2 13.33


EVER BEEN OFFERE

LIQUOQ16f Frequency Perce

Never heard of  1 6.

No 13 86.

Yes 1 6.


EVER BEEN OFFERE

SHIMERO

Q16g Frequency Perce

Never heard of  12 85.

No 2 14.2


Frequency Missing =1

EVER BEEN OFFERE

INHALANT

Q16h Frequency Perce

Never heard of  1 6.

No 12 80.

Yes 2 13.


EVER BEEN

OFFERED

MARIJUANA

Q16i Frequency Percent

No 15 100.00


7/30/2019 2009 _ mitchell county _ westbrook isd _ 2009 texas school survey of drug and alcohol use _ elementary report

http://slidepdf.com/reader/full/2009-mitchell-county-westbrook-isd-2009-texas-school-survey-of-drug-and 67/107

Westbrook

Spring 2009

©Copyright 2009, Texas A&M UniversityAll rights reserved.

 The frequencies have been weighted so that the analysis reflects the distribution of students by grade level in the district.

Page 36 of 37

IS ALCOHOL OBTAINED

FROM HOME

Q17a Frequency Percent

Do Not Drink 12 85.71

No 2 14.29

Frequency Missing =1

IS ALCOHOL OBTAINED

FROM FRIENDS

Q17b Frequency Percent

Do Not Drink 12 85.71

No 2 14.29

Frequency Missing =1

IS ALCOHOL OBTAINED

SOMEWHERE ELSE

Q17c Frequency Percent

Do Not Drink 12 80.00

No 1 6.67

Yes 2 13.33

DANGEROUS FOR KIDS TO USE

CIGARETTES

Q18A Frequency Percent

Very dangerous 12 80.00

Dangerous 2 13.33

Don't know 1 6.67

DANGEROUS TO USE

SNUFF/CHEWING TOBACCO

Q18B Frequency Percent

Very dangerous 12 80.00

Dangerous 2 13.33

Don't know 1 6.67

DANGEROUS FOR KIDS TO USE

BEER

Q18C Frequency Percent

Very dangerous 9 64.29

Dangerous 4 28.57

Not at all 1 7.14

Frequency Missing =1

DANGEROUS FOR KIDS TO USE

WINE COOLERS

Q18D Frequency Percent

Very dangerous 8 53.33

Dangerous 3 20.00

Not at all 1 6.67

Don't know 1 6.67

Never heard of  2 13.33


DANGEROUS FOR KIDS TO USE

WINE

Q18E Frequency Percent

Very dangerous 9 60.00

Dangerous 4 26.67

Not at all 2 13.33


DANGEROUS FOR KIDS TO USE

LIQUORQ18F Frequency Percent

Very dangerous 10 66.67

Dangerous 2 13.33

Not at all 1 6.67

Don't know 1 6.67

Never heard of  1 6.67


DANGEROUS FOR KIDS TO USE

SHIMERON

Q18G Frequency Percent

Very dangerous 1 6.67

Don't know 1 6.67

Never heard of  13 86.67


DANGEROUS FOR KIDS TO USE

INHALANTS

Q18H Frequency Percent

Very dangerous 10 66.67

Dangerous 2 13.33

Not at all 1 6.67

Don't know 2 13.33


DANGEROUS FOR KIDS TO USE

MARIJUANA

Q18I Frequency Percent

Very dangerous 13 86.67

Dangerous 1 6.67

Don't know 1 6.67


DRUG/ALCOHOL INFO

FROM TEACHER

Q19a Frequency Percent

No 7 50.00

Yes 7 50.00


Frequency Missing =1

DRUG/ALC INFO

FROM VISITOR TO

CLASS

Q19b Frequency Percent

No 6 40.00

Yes 9 60.00


DRUG/ALC INFO

FROM ASSEMBLY

PROGRAM

Q19c Frequency Percent

No 2 13.33

Yes 13 86.67


DRUG/ALC INFO

FROM GUIDE

COUNSELOR

Q19d Frequency Percent

No 15 100.00


DRUG/ALC INF FROM

SOMEONE ELSE AT

SCHOOL

Q19e Frequency Percent

No 8 57.14

Yes 6 42.86


Frequency Missing =1

BEER, TWO OR MORE

AT ONE TIME

Q20a Frequency PercentNever 13 86.67

1 time 1 6.67

2 times 1 6.67


7/30/2019 2009 _ mitchell county _ westbrook isd _ 2009 texas school survey of drug and alcohol use _ elementary report

http://slidepdf.com/reader/full/2009-mitchell-county-westbrook-isd-2009-texas-school-survey-of-drug-and 68/107

Westbrook

Spring 2009

©Copyright 2009, Texas A&M UniversityAll rights reserved.

 The frequencies have been weighted so that the analysis reflects the distribution of students by grade level in the district.

Page 37 of 37

WINE COOLERS, TWO

OR MORE AT ONE

TIME

Q20b Frequency Percent

Never 14 93.33

1 time 1 6.67

WINE, TWO OR MORE

AT ONE TIME

Q20c Frequency Percent

Never 14 93.33

1 time 1 6.67

LIQUOR, TWO OR

MORE AT ONE TIME

Q20d Frequency Percent

Never 13 86.67

1 time 2 13.33

MISSED SCHOOL

WITHOUT PARENT'S

CONSENT

Q21 Frequency Percent

No 15 100.00

SENT TO

PRINCIPAL/DEAN

SINCE SEPTEMBER

Q22 Frequency Percent

No 12 80.00

Yes 3 20.00

PARENTS FEEL ABOUT

KIDS SMOKING

CIGARETTES

Q23 Frequency Percent

Don't like it 14 93.33

Don't know 1 6.67

PARENTS FEEL ABOUT

KIDS DRINKING BEER

Q24 Frequency Percent

Don't like it 12 80.00

Don't know 3 20.00

PARENTS FEEL ABOUT

KIDS USING MARIJUANA

q25 Frequency Percent

Don't like it 14 93.33

Don't know 1 6.67


7/30/2019 2009 _ mitchell county _ westbrook isd _ 2009 texas school survey of drug and alcohol use _ elementary report

http://slidepdf.com/reader/full/2009-mitchell-county-westbrook-isd-2009-texas-school-survey-of-drug-and 69/107

State - 6th Grade Only

Spring 2009

Elementary Report-Page 1 of 39

Texas School Survey

of Drug and Alcohol Use

2009

Part II: State Results

7/30/2019 2009 _ mitchell county _ westbrook isd _ 2009 texas school survey of drug and alcohol use _ elementary report

http://slidepdf.com/reader/full/2009-mitchell-county-westbrook-isd-2009-texas-school-survey-of-drug-and 70/107

State - 6th Grade Only

Spring 2009

Elementary Report-Page 2 of 39

7/30/2019 2009 _ mitchell county _ westbrook isd _ 2009 texas school survey of drug and alcohol use _ elementary report

http://slidepdf.com/reader/full/2009-mitchell-county-westbrook-isd-2009-texas-school-survey-of-drug-and 71/107

State - 6th Grade Only

Spring 2009

Elementary Report-Page 3 of 39

Part II: State ResultsElementary (Grade 6)

Table of Contents

General Substance Tables 7-22

 TobaccoAlcoholDrugsInhalantsMiscellaneous

Prevalence Tables 25-30

Selected Substances by Grade:

 Table B1: All Students Table B2: Male Students Table B3: Female Students Table B4: White Students Table B5: African/American Students Table B6: Mexican/American Students Table B7: Students Reporting A Grades Table B8: Students Reporting Grades Lower Than an A Table B9: Students Living With 2 Parents Table B10: Students Not Living With 2 Parents Table B11: Students Living in Town More Than 3 Years Table B12: Students Living in Town 3 Years or Less

Margin Tables 33-39

7/30/2019 2009 _ mitchell county _ westbrook isd _ 2009 texas school survey of drug and alcohol use _ elementary report

http://slidepdf.com/reader/full/2009-mitchell-county-westbrook-isd-2009-texas-school-survey-of-drug-and 72/107

State - 6th Grade Only

Spring 2009

Elementary Report-Page 4 of 39

7/30/2019 2009 _ mitchell county _ westbrook isd _ 2009 texas school survey of drug and alcohol use _ elementary report

http://slidepdf.com/reader/full/2009-mitchell-county-westbrook-isd-2009-texas-school-survey-of-drug-and 73/107

State - 6th Grade Only

Spring 2009

Elementary Report-Page 5 of 39

1. General Substance Tables 

7/30/2019 2009 _ mitchell county _ westbrook isd _ 2009 texas school survey of drug and alcohol use _ elementary report

http://slidepdf.com/reader/full/2009-mitchell-county-westbrook-isd-2009-texas-school-survey-of-drug-and 74/107

7/30/2019 2009 _ mitchell county _ westbrook isd _ 2009 texas school survey of drug and alcohol use _ elementary report

http://slidepdf.com/reader/full/2009-mitchell-county-westbrook-isd-2009-texas-school-survey-of-drug-and 75/107

State - 6th Grade Only

Spring 2009

Elementary Report-Page 7 of 39

Table T-1: How recently, if ever, have you used...

Ever

Used

School

Year

Not Past

Year

Never

Used

Any tobacco product

All 8.7% 4.9% 3.8% 91.3%

Cigarettes

All 7.9% 4.3% 3.6% 92.1%

Smokeless tobacco

All 1.9% 1.2% 0.8% 98.1%

Table T-2: Average number of times selected tobacco products were used by thosewho reported use of ..

School

Year LifetimeAll 3.5 3.2

7/30/2019 2009 _ mitchell county _ westbrook isd _ 2009 texas school survey of drug and alcohol use _ elementary report

http://slidepdf.com/reader/full/2009-mitchell-county-westbrook-isd-2009-texas-school-survey-of-drug-and 76/107

State - 6th Grade Only

Spring 2009

Elementary Report-Page 8 of 39

Table T-3: Average age of first use of tobacco:

All

Cigarettes

9.9

Smokeless

Tobacco

10.2

Any Tobacco

9.9

Table T-4: Age of first use of tobacco by family situation:

Never Under 8 8 9 10 11 Over 11

Two Parent Family

All 94.1% 1.0% 0.5% 0.5% 1.0% 1.5% 1.4%

Other Family SituationAll 84.9% 2.2% 1.7% 2.1% 2.3% 3.6% 3.2%

7/30/2019 2009 _ mitchell county _ westbrook isd _ 2009 texas school survey of drug and alcohol use _ elementary report

http://slidepdf.com/reader/full/2009-mitchell-county-westbrook-isd-2009-texas-school-survey-of-drug-and 77/107

State - 6th Grade Only

Spring 2009

Elementary Report-Page 9 of 39

Table T-5: About how many of your c lose friends use ...

Never

Heard Of None Some Most

Any tobacco product?

All 1.6% 77.0% 19.5% 1.9%

Cigarettes?

All 2.4% 78.0% 18.0% 1.6%

Smokeless tobacco?

All 3.5% 89.4% 6.4% 0.7%

Table T-6: Have you ever been offered ...

Never

Heard Of Yes No

Any tobacco product?

All 1.8% 18.5% 79.7%Cigarettes?

All 2.6% 16.7% 80.7%

Smokeless tobacco?

All 3.8% 6.4% 89.8%

Table T-7: How dangerous do you think it is for kids your age to use ...

Never

Heard Of 

Very

Dangerous Dangerous

Not at All

Dangerous Do Not Know

Any tobacco product?

All 0.8% 71.7% 21.2% 1.2% 5.0%

Cigarettes?

All 1.6% 60.3% 30.3% 1.5% 6.4%

Smokeless tobacco?

All 2.3% 64.3% 23.9% 2.0% 7.5%

7/30/2019 2009 _ mitchell county _ westbrook isd _ 2009 texas school survey of drug and alcohol use _ elementary report

http://slidepdf.com/reader/full/2009-mitchell-county-westbrook-isd-2009-texas-school-survey-of-drug-and 78/107

State - 6th Grade Only

Spring 2009

Elementary Report-Page 10 of 39

Table T-8: How do your parents feel about kids your age smoking cigarettes?

Don't Like Don't Care Think It's OK Don't know

All 86.5% 1.9% 0.4% 11.2%

7/30/2019 2009 _ mitchell county _ westbrook isd _ 2009 texas school survey of drug and alcohol use _ elementary report

http://slidepdf.com/reader/full/2009-mitchell-county-westbrook-isd-2009-texas-school-survey-of-drug-and 79/107

State - 6th Grade Only

Spring 2009

Elementary Report-Page 11 of 39

Table A-1: How recently, if ever, have you used..

Ever

Used

School

Year

Not Past

Year

Never

Used

Any alcohol product

All 31.1% 21.4% 9.7% 68.9%

Beer

All 20.1% 11.4% 8.7% 79.9%

Wine coolers

All 17.0% 11.5% 5.4% 83.0%

Wine

All 17.4% 10.4% 6.9% 82.6%

Liquor

All 10.3% 6.7% 3.6% 89.7%

Table A-2: Average number of times selected alcohol products were used by those

who reported use of ..

School

Year Lifetime

Beer

All 3.0 3.0

Liquor

All 2.9 3.0

Wine

All 2.9 2.8

7/30/2019 2009 _ mitchell county _ westbrook isd _ 2009 texas school survey of drug and alcohol use _ elementary report

http://slidepdf.com/reader/full/2009-mitchell-county-westbrook-isd-2009-texas-school-survey-of-drug-and 80/107

State - 6th Grade Only

Spring 2009

Elementary Report-Page 12 of 39

Table A-3: In the past year, how many times have you had two or more drinks at one time of ..

Never 1 Time 2 Times 3+ Times Ever

Beer?

All 84.7% 8.2% 3.4% 3.7% 15.3%

Wine Coolers?

All 87.2% 6.6% 3.3% 2.8% 12.8%

Wine?

All 86.8% 7.9% 2.7% 2.6% 13.2%

Liquor?

All 91.4% 4.3% 2.0% 2.3% 8.6%

7/30/2019 2009 _ mitchell county _ westbrook isd _ 2009 texas school survey of drug and alcohol use _ elementary report

http://slidepdf.com/reader/full/2009-mitchell-county-westbrook-isd-2009-texas-school-survey-of-drug-and 81/107

State - 6th Grade Only

Spring 2009

Elementary Report-Page 13 of 39

Table A-4: Average age of first use of alcohol:

All

Beer

9.6

Wine Coolers

10.1

Wine

10.2

Liquor

10.6

Any Alcohol

9.7

Table A-5: Age of first use of alcohol by family situation:

Never Under 8 8 9 10 11 Over 11

Two Parent Family

All 73.7% 5.2% 2.3% 3.1% 5.2% 5.8% 4.7%

Other Family Situation

All 61.2% 8.3% 3.7% 3.9% 6.6% 8.9% 7.4%

Table A-6 : Lifetime prevalence of use of alcohol by reported conduct problemsthis school year:

No Absences

or ConductProblems Cut School Sent toPrincipal Both

22.3% 65.8% 46.1% 69.6%

7/30/2019 2009 _ mitchell county _ westbrook isd _ 2009 texas school survey of drug and alcohol use _ elementary report

http://slidepdf.com/reader/full/2009-mitchell-county-westbrook-isd-2009-texas-school-survey-of-drug-and 82/107

State - 6th Grade Only

Spring 2009

Elementary Report-Page 14 of 39

Table A-7: When you drink alcohol, do you get it from ..

Don't Drink Yes No

Home?

All 74.5% 13.0% 12.6%

Friends?

All 75.2% 6.2% 18.6%

Somewhere else?

All 73.8% 10.9% 15.3%

Table A-8: About how many of your close friends use ..

Never

Heard Of  None Some Most

Any alcohol product?

All 1.2% 65.3% 25.9% 7.6%

Beer?All 1.4% 72.7% 21.4% 4.5%

Wine coolers?

All 9.4% 72.1% 14.4% 4.1%

Wine?

All 2.0% 80.1% 15.3% 2.7%

Liquor?

All 3.8% 80.8% 12.6% 2.8%

7/30/2019 2009 _ mitchell county _ westbrook isd _ 2009 texas school survey of drug and alcohol use _ elementary report

http://slidepdf.com/reader/full/2009-mitchell-county-westbrook-isd-2009-texas-school-survey-of-drug-and 83/107

State - 6th Grade Only

Spring 2009

Elementary Report-Page 15 of 39

Table A-9: Have you ever been offered ..

Never

Heard Of Yes No

Any alcohol product?

All 1.4% 30.2% 68.3%

Beer?

All 1.6% 23.5% 74.9%

Wine coolers?

All 9.2% 14.5% 76.3%

Wine?

All 2.2% 15.8% 82.0%

Liquor?

All 3.7% 12.0% 84.3%

Table A-10: How do your parents feel about kids your age drinking beer?

Don't Like Don't Care Think It's OK Don't know

All 80.2% 4.2% 1.3% 14.4%

Table A-11: How dangerous do you think it is fo r kids your age to use ..

Never

Heard Of 

Very

Dangerous Dangerous

Not at All

Dangerous Do Not Know

Any alcohol product?

All 0.7% 63.9% 25.9% 3.8% 5.7%

Beer?

All 0.7% 45.6% 36.7% 8.1% 8.8%

Wine coolers?

All 8.1% 41.9% 29.0% 8.8% 12.2%

Wine?

All 1.1% 42.5% 34.4% 10.7% 11.3%

Liquor?

All 2.3% 59.5% 25.9% 3.8% 8.4%

7/30/2019 2009 _ mitchell county _ westbrook isd _ 2009 texas school survey of drug and alcohol use _ elementary report

http://slidepdf.com/reader/full/2009-mitchell-county-westbrook-isd-2009-texas-school-survey-of-drug-and 84/107

State - 6th Grade Only

Spring 2009

Elementary Report-Page 16 of 39

Table D-1: How recently, if ever, have you used Marijuana..

Ever

Used

School

Year

Not Past

Year

Never

Used

All 3.4% 2.4% 0.9% 96.6%

Table D-2: Average number of times marijuana was used by those reporting usage:

School

Year Lifetime

All 4.4 4.6

7/30/2019 2009 _ mitchell county _ westbrook isd _ 2009 texas school survey of drug and alcohol use _ elementary report

http://slidepdf.com/reader/full/2009-mitchell-county-westbrook-isd-2009-texas-school-survey-of-drug-and 85/107

State - 6th Grade Only

Spring 2009

Elementary Report-Page 17 of 39

Table D-3: Average age of first use of marijuana:

All

10.7

Table D-4: Age of first use of marijuana by family situation:

Never Under 8 8 9 10 11 Over 11

Two Parent Family

All 97.9% 0.1% 0.1% 0.1% 0.3% 0.6% 1.0%

Other Family Situation

All 94.2% 0.5% 0.4% 0.6% 0.8% 1.2% 2.3%

Table D-5 : Lifetime prevalence of use of marijuana by reported conduct

problems this school year:

No Absences

or Conduct

Problems Cut School

Sent to

Principal Both

0.9% 20.9% 7.5% 25.6%

Table D-6: About how many of your c lose friends use marijuana?

Never

Heard Of None Some Most

All 5.7% 81.9% 9.6% 2.9%

Table D-7: Have you ever been offered marijuana?

Never

Heard Of Yes No

All 5.3% 9.1% 85.5%

Table D-8: How do your parents feel about kids your age smoking marijuana?

Don't Like Don't Care Think It's OK Don't know

All 87.5% 1.3% 0.3% 10.9%

Table D-9: How dangerous do you think it is for kids your age to use marijuana?

Never

Heard Of 

Very

Dangerous Dangerous

Not at All

Dangerous Do Not Know

All 4.0% 78.4% 9.8% 2.0% 5.8%

7/30/2019 2009 _ mitchell county _ westbrook isd _ 2009 texas school survey of drug and alcohol use _ elementary report

http://slidepdf.com/reader/full/2009-mitchell-county-westbrook-isd-2009-texas-school-survey-of-drug-and 86/107

State - 6th Grade Only

Spring 2009

Elementary Report-Page 18 of 39

7/30/2019 2009 _ mitchell county _ westbrook isd _ 2009 texas school survey of drug and alcohol use _ elementary report

http://slidepdf.com/reader/full/2009-mitchell-county-westbrook-isd-2009-texas-school-survey-of-drug-and 87/107

State - 6th Grade Only

Spring 2009

Elementary Report-Page 19 of 39

Table I-1: How recently, if ever, have you used Inhalants..

Ever

Used

School

Year

Not Past

Year

Never

Used

All 10.7% 7.9% 2.8% 89.3%

Table I-2: Have you ever sniffed any of the following inhalants to get high?

Not Used Used

Correction Fluid/Whiteout

All 96.4% 3.6%

Gasoline

All 97.0% 3.0%

Glue

All 97.5% 2.5%

Paint Thinner

All 97.8% 2.2%Spray Paint

All 96.7% 3.3%

Other Inhalants

All 93.9% 6.1%

Table I-3: Average number of times inhalants were used by those reporting usage:

School

Year Lifetime

All 3.5 3.6

Table I-4: Number of different kinds of inhalants used:

None One Two to Three Four Plus

All 90.0% 4.9% 4.1% 1.0%

7/30/2019 2009 _ mitchell county _ westbrook isd _ 2009 texas school survey of drug and alcohol use _ elementary report

http://slidepdf.com/reader/full/2009-mitchell-county-westbrook-isd-2009-texas-school-survey-of-drug-and 88/107

State - 6th Grade Only

Spring 2009

Elementary Report-Page 20 of 39

Table I-5: Average age of first use of inhalants:

All

10.3

Table I-6: Age of first use of inhalants by family situation:

Never Under 8 8 9 10 11 Over 11

Two Parent Family

All 93.5% 0.7% 0.6% 0.6% 1.1% 1.8% 1.7%

Other Family Situation

All 90.4% 0.9% 0.5% 1.1% 1.7% 2.9% 2.5%

Table I-7: Lifetime prevalence of use of inhalants by reported conduct

problems this school year:

No Absences

or Conduct

Problems Cut School

Sent to

Principal Both

4.5% 32.5% 13.8% 37.0%

Table I-8: About how many of your close friends use inhalants?

Never

Heard Of None Some Most

All 3.8% 79.6% 12.7% 3.9%

7/30/2019 2009 _ mitchell county _ westbrook isd _ 2009 texas school survey of drug and alcohol use _ elementary report

http://slidepdf.com/reader/full/2009-mitchell-county-westbrook-isd-2009-texas-school-survey-of-drug-and 89/107

State - 6th Grade Only

Spring 2009

Elementary Report-Page 21 of 39

Table I-9: Have you ever been offered inhalants?

Never

Heard Of Yes No

All 4.0% 11.1% 84.9%

Table I-10: How dangerous do you think i t is for kids your age to use inhalants?

Never

Heard Of 

Very

Dangerous Dangerous

Not at All

Dangerous Do Not Know

All 2.4% 63.6% 21.3% 4.3% 8.4%

7/30/2019 2009 _ mitchell county _ westbrook isd _ 2009 texas school survey of drug and alcohol use _ elementary report

http://slidepdf.com/reader/full/2009-mitchell-county-westbrook-isd-2009-texas-school-survey-of-drug-and 90/107

State - 6th Grade Only

Spring 2009

Elementary Report-Page 22 of 39

Table X-1: Since school began in the fall, have you got ten information on drugsor alcohol from ..

CATEGORY Yes

An Assembly Program? All 56.6%

Guidance Counselor? All 45.6%

Visitor to Class? All 48.4%

Someone Else at School? All 42.7%

Your Teacher? All 64.7%

Any School Source? All 87.6%

7/30/2019 2009 _ mitchell county _ westbrook isd _ 2009 texas school survey of drug and alcohol use _ elementary report

http://slidepdf.com/reader/full/2009-mitchell-county-westbrook-isd-2009-texas-school-survey-of-drug-and 91/107

State - 6th Grade Only

Spring 2009

Elementary Report-Page 23 of 39

2. Prevalence Tables

7/30/2019 2009 _ mitchell county _ westbrook isd _ 2009 texas school survey of drug and alcohol use _ elementary report

http://slidepdf.com/reader/full/2009-mitchell-county-westbrook-isd-2009-texas-school-survey-of-drug-and 92/107

State - 6th Grade Only

Spring 2009

Elementary Report-Page 24 of 39

7/30/2019 2009 _ mitchell county _ westbrook isd _ 2009 texas school survey of drug and alcohol use _ elementary report

http://slidepdf.com/reader/full/2009-mitchell-county-westbrook-isd-2009-texas-school-survey-of-drug-and 93/107

State - 6th Grade Only

Spring 2009

Elementary Report-Page 25 of 39

Table B1: Prevalence and recency of use of selected subs tances by grade Al l Students

Ever

Used

School

Year

Not Past

Year

Never

Used

Tobacco

All 8.7% 4.9% 3.8% 91.3%

Alcohol

All 31.1% 21.4% 9.7% 68.9%

Inhalants

All 10.7% 7.9% 2.8% 89.3%

Marijuana

All 3.4% 2.4% 0.9% 96.6%

Table B2: Prevalence and recency of use of selected subs tances by gradeMale Students

Ever

Used

School

Year

Not Past

Year

Never

Used

Tobacco

All 10.3% 5.9% 4.3% 89.7%

Alcohol

All 33.3% 21.9% 11.4% 66.7%

Inhalants

All 11.2% 8.0% 3.2% 88.8%

Marijuana

All 4.3% 3.1% 1.2% 95.7%

7/30/2019 2009 _ mitchell county _ westbrook isd _ 2009 texas school survey of drug and alcohol use _ elementary report

http://slidepdf.com/reader/full/2009-mitchell-county-westbrook-isd-2009-texas-school-survey-of-drug-and 94/107

State - 6th Grade Only

Spring 2009

Elementary Report-Page 26 of 39

Table B3: Prevalence and recency of use of selected subs tances by gradeFemale Students

Ever

Used

School

Year

Not Past

Year

Never

Used

Tobacco

All 7.2% 3.8% 3.3% 92.8%

Alcohol

All 29.2% 21.1% 8.1% 70.8%

Inhalants

All 10.3% 7.9% 2.3% 89.7%

Marijuana

All 2.5% 1.9% 0.7% 97.5%

Table B4: Prevalence and recency of use of selected subs tances by gradeWhite Students

Ever

Used

School

Year

Not Past

Year

Never

Used

Tobacco

All 6.6% 3.3% 3.3% 93.4%

Alcohol

All 24.4% 16.1% 8.4% 75.6%

Inhalants

All 7.2% 5.6% 1.6% 92.8%

Marijuana

All 1.1% 0.7% 0.4% 98.9%

7/30/2019 2009 _ mitchell county _ westbrook isd _ 2009 texas school survey of drug and alcohol use _ elementary report

http://slidepdf.com/reader/full/2009-mitchell-county-westbrook-isd-2009-texas-school-survey-of-drug-and 95/107

State - 6th Grade Only

Spring 2009

Elementary Report-Page 27 of 39

Table B5: Prevalence and recency of use of selected subs tances by grade Af rican/American Students

Ever

Used

School

Year

Not Past

Year

Never

Used

Tobacco

All 8.1% 4.5% 3.6% 91.9%

Alcohol

All 32.0% 22.1% 9.9% 68.0%

Inhalants

All 8.2% 6.4% 1.8% 91.8%

Marijuana

All 2.3% 1.8% 0.5% 97.7%

Table B6: Prevalence and recency of use of selected subs tances by gradeMexican/American Students

Ever

Used

School

Year

Not Past

Year

Never

Used

Tobacco

All 10.3% 6.2% 4.2% 89.7%

Alcohol

All 36.2% 25.5% 10.7% 63.8%

Inhalants

All 14.3% 10.4% 4.0% 85.7%

Marijuana

All 5.5% 4.0% 1.5% 94.5%

7/30/2019 2009 _ mitchell county _ westbrook isd _ 2009 texas school survey of drug and alcohol use _ elementary report

http://slidepdf.com/reader/full/2009-mitchell-county-westbrook-isd-2009-texas-school-survey-of-drug-and 96/107

State - 6th Grade Only

Spring 2009

Elementary Report-Page 28 of 39

Table B7: Prevalence and recency of use of selected subs tances by gradeStudents Reporting A Grades

Ever

Used

School

Year

Not Past

Year

Never

Used

Tobacco

All 3.5% 1.9% 1.6% 96.5%

Alcohol

All 23.0% 15.6% 7.5% 77.0%

Inhalants

All 5.8% 4.1% 1.7% 94.2%

Marijuana

All 1.1% 0.7% 0.4% 98.9%

Table B8: Prevalence and recency of use of selected subs tances by gradeStudents Reporting grades lower than A

Ever

Used

School

Year

Not Past

Year

Never

Used

Tobacco

All 11.5% 6.5% 5.0% 88.5%

Alcohol

All 35.8% 24.8% 10.9% 64.2%

Inhalants

All 13.4% 10.0% 3.4% 86.6%

Marijuana

All 4.6% 3.4% 1.2% 95.4%

7/30/2019 2009 _ mitchell county _ westbrook isd _ 2009 texas school survey of drug and alcohol use _ elementary report

http://slidepdf.com/reader/full/2009-mitchell-county-westbrook-isd-2009-texas-school-survey-of-drug-and 97/107

State - 6th Grade Only

Spring 2009

Elementary Report-Page 29 of 39

Table B9: Prevalence and recency of use of selected subs tances by gradeStudents Living With 2 Parents

Ever

Used

School

Year

Not Past

Year

Never

Used

Tobacco

All 5.8% 3.1% 2.7% 94.2%

Alcohol

All 27.2% 18.2% 8.9% 72.8%

Inhalants

All 9.7% 7.0% 2.7% 90.3%

Marijuana

All 2.3% 1.7% 0.6% 97.7%

Table B10: Prevalence and recency of use of selected substances by gradeStudents Not Living With 2 Parents

Ever

Used

School

Year

Not Past

Year

Never

Used

Tobacco

All 14.7% 8.5% 6.2% 85.3%

Alcohol

All 39.6% 28.2% 11.4% 60.4%

Inhalants

All 13.0% 10.0% 3.0% 87.0%

Marijuana

All 5.7% 4.0% 1.7% 94.3%

7/30/2019 2009 _ mitchell county _ westbrook isd _ 2009 texas school survey of drug and alcohol use _ elementary report

http://slidepdf.com/reader/full/2009-mitchell-county-westbrook-isd-2009-texas-school-survey-of-drug-and 98/107

State - 6th Grade Only

Spring 2009

Elementary Report-Page 30 of 39

Table B11: Prevalence and recency of use of selected substances by gradeStudents L iving in Town More Than 3 Years

Ever

Used

School

Year

Not Past

Year

Never

Used

Tobacco

All 8.4% 4.7% 3.6% 91.6%

Alcohol

All 30.8% 21.5% 9.3% 69.2%

Inhalants

All 10.4% 7.7% 2.7% 89.6%

Marijuana

All 3.4% 2.5% 0.9% 96.6%

Table B12: Prevalence and recency of use of selected substances by gradeStudents L iving in Town 3 Years or Less

Ever

Used

School

Year

Not Past

Year

Never

Used

Tobacco

All 10.7% 6.1% 4.6% 89.3%

Alcohol

All 33.6% 21.9% 11.7% 66.4%

Inhalants

All 11.8% 9.2% 2.6% 88.2%

Marijuana

All 3.0% 2.2% 0.8% 97.0%

7/30/2019 2009 _ mitchell county _ westbrook isd _ 2009 texas school survey of drug and alcohol use _ elementary report

http://slidepdf.com/reader/full/2009-mitchell-county-westbrook-isd-2009-texas-school-survey-of-drug-and 99/107

State - 6th Grade Only

Spring 2009

Elementary Report-Page 31 of 39

3. Margin Tables 

7/30/2019 2009 _ mitchell county _ westbrook isd _ 2009 texas school survey of drug and alcohol use _ elementary report

http://slidepdf.com/reader/full/2009-mitchell-county-westbrook-isd-2009-texas-school-survey-of-drug-and 100/107

State - 6th Grade Only

Spring 2009

Elementary Report-Page 32 of 39

7/30/2019 2009 _ mitchell county _ westbrook isd _ 2009 texas school survey of drug and alcohol use _ elementary report

http://slidepdf.com/reader/full/2009-mitchell-county-westbrook-isd-2009-texas-school-survey-of-drug-and 101/107

State - 6th Grade Only

Spring 2009

The frequencies have been weighted so that the

analysis reflects the distribution of students by grade

level in the districtPage 33 of 39

 The FREQ Procedure

GENDER

Q1 Frequency Percent

Female 167E3 50.21

Male 166E3 49.79

Frequency Missing =3033.4254071

GRADE LEVEL

Q2 Frequency Percent

Grade 6 336E3 100.00

DO YOU LIVE WITH

BOTH PARENTS?

Q3 Frequency Percent

No 109E3 32.90Yes 222E3 67.10

Frequency Missing =5084.0682985

AGE

Q4 Frequency Percent

8 or younger 93 0.03

9 5 0.00

10 193 0.06

11 75101 22.41

12 219E3 65.5013 or older 40227 12.00

Frequency Missing =1219.393994

ETHNICITY

Q5 Frequency Percent

African/American 46156 14.14

Asian/American 3984 1.22

Mexican/American 151E3 46.37

Native/American 1480 0.45

Other 7034 2.15White 116E3 35.67

Frequency Missing =9824.2175115

WHAT GRADES DO YOU

USUALLY GET

Q6 Frequency Percent

Mostly A's 114E3 34.72

Mostly B's 16E4 48.73

Mostly C's 43922 13.37

Mostly D's 7102 2.16

Mostly F's 3342 1.02


Frequency Missing =7741.4477892

LIVED IN THIS TOWN FOR

MORE THAN 3 YEARS

Q7 Frequency Percent

Don't Know 17861 5.38

No 45213 13.61

Yes 269E3 81.01


Frequency Missing =4220.2911474

EITHER PARENT

GRADUATE FROM

COLLEGE

Q8 Frequency Percent

Don't Know 96725 29.18

No 86321 26.04

Yes 148E3 44.79


Frequency Missing =4792.8048353

QUALIFY FOR A

FREE/REDUCED PRICE

LUNCH?

Q9 Frequency Percent

Don't Know 96431 29.35

No 11E4 33.63

Yes 122E3 37.03


Frequency Missing =7714.2852717

PARENTS ATTEND

PTA MEETINGS?

Q10 Frequency Percent

No 184E3 56.00

Yes 145E3 44.00


Frequency Missing =7284.3367406

EVER INHALED

GASOLINE TO GET

HIGH?

Q11a Frequency Percent

Not Used 308E3 96.95Used 9674 3.05


Frequency Missing =18675.9417

EVER INHALED PAINT

THINNER TO GET HIGH?

Q11b Frequency Percent

Not Used 308E3 97.78

Used 7000 2.22


Frequency Missing =20895.4305

EVER INHALED GLUE TO

GET HIGH?

Q11c Frequency Percent

Not Used 307E3 97.51

Used 7858 2.49


Frequency Missing =21109.898

EVER INHALEDWHITEOUT TO GET

HIGH?

Q11d Frequency Percent

Not Used 306E3 96.44

Used 11304 3.56


Frequency Missing =18670.1594

EVER INHALED SPRAY

PAINT TO GET HIGH?

Q11e Frequency Percent

Not Used 309E3 96.73

Used 10454 3.27


Frequency Missing =16536.6078

7/30/2019 2009 _ mitchell county _ westbrook isd _ 2009 texas school survey of drug and alcohol use _ elementary report

http://slidepdf.com/reader/full/2009-mitchell-county-westbrook-isd-2009-texas-school-survey-of-drug-and 102/107

State - 6th Grade Only

Spring 2009

The frequencies have been weighted so that the

analysis reflects the distribution of students by grade

level in the districtPage 34 of 39

EVER USED OTHER

INHALANTS TO GET

HIGH?

Q11f Frequency Percent

Not Used 303E3 93.85

Used 19850 6.15

Frequency Missing =13498.43582

CIGARETTE USE DURING

LIFETIME

Q12A Frequency Percent

Never heard of  10358 3.15

Never used 293E3 89.11

1-2 times 18468 5.62

3-10 times 4783 1.46

11+ times 2139 0.65

Frequency Missing =7914.5099756

SNUFF/CHEWING TOBACCO

USE IN LIFETIME

Q12B Frequency Percent

Never heard of  19335 5.96

Never used 299E3 92.23

1-2 times 4413 1.36

3-10 times 782 0.24

11+ times 702 0.22

Frequency Missing =11746.016779

BEER USE DURING LIFETIME

Q12C Frequency Percent

Never heard of  4997 1.58

Never used 248E3 78.61

1-2 times 48055 15.22

3-10 times 10392 3.29

11+ times 4075 1.29

Frequency Missing =20639.811099

WINE COOLER USE DURING

LIFETIME

Q12D Frequency Percent

Never heard of  48112 15.07

Never used 219E3 68.50

1-2 times 34957 10.95

3-10 times 11119 3.48

11+ times 6363 1.99


Frequency Missing =17089.30034

WINE USE DURING LIFETIME

Q12E Frequency Percent

Never heard of  7631 2.45

Never used 249E3 80.24

1-2 times 42926 13.81

3-10 times 7366 2.37

11+ times 3508 1.13


Frequency Missing =25410.161475

LIQUOR USE DURING

LIFETIME

Q12F Frequency Percent

Never heard of  17813 5.57

Never used 269E3 84.33

1-2 times 24251 7.59

3-10 times 6079 1.90

11+ times 1946 0.61 

Frequency Missing =16744.913039

SHIMERON USE DURING

LIFETIME

Q12G Frequency Percent

Never heard of  205E3 65.22

Never used 109E3 34.78


Frequency Missing =21898.422037

INHALANT USE DURIN

LIFETIM

Q12H Frequency Perce

Never heard of  16219 5.

Never used 281E3 87.

1-2 times 16788 5.2

3-10 times 5879 1.

11+ times 2400 0.


Frequency Missing =14301.3787

MARIJUANA USE DURIN

LIFETIM

Q12I Frequency Perce

Never heard of  26470 8.

Never used 287E3 88.

1-2 times 5997 1.

3-10 times 2129 0.11+ times 2247 0.


Frequency Missing =12243.4019

CIGARETTE USE IN PAS

SCHOOL YEA

Q13A Frequency Perce

Never heard of  10224 3.

Never used 306E3 92.

1-2 times 9803 2.

3-10 times 3339 1.11+ times 1218 0.


Frequency Missing =6023.81502

SNUFF/CHEWING TOBACC

USE IN PAST YEA

Q13B Frequency Perce

Never heard of  17255 5.2

Never used 305E3 93.

1-2 times 2793 0.

3-10 times 492 0.11+ times 530 0.


Frequency Missing =10222.5058

7/30/2019 2009 _ mitchell county _ westbrook isd _ 2009 texas school survey of drug and alcohol use _ elementary report

http://slidepdf.com/reader/full/2009-mitchell-county-westbrook-isd-2009-texas-school-survey-of-drug-and 103/107

State - 6th Grade Only

Spring 2009

The frequencies have been weighted so that the

analysis reflects the distribution of students by grade

level in the districtPage 35 of 39

BEER USE IN PAST SCHOOL

YEAR

Q13C Frequency Percent

Never heard of  5508 1.72

Never used 277E3 86.46

1-2 times 28562 8.92

3-10 times 6976 2.18

11+ times 2334 0.73

Frequency Missing =15992.192974

WINE COOLER USE IN PAST

SCHOOL YEAR

Q13D Frequency Percent

Never heard of  40869 12.60

Never used 245E3 75.65

1-2 times 26688 8.23

3-10 times 7746 2.3911+ times 3683 1.14

Frequency Missing =11888.974925

WINE USE IN PAST SCHOOL

YEAR

Q13E Frequency Percent

Never heard of  7630 2.38

Never used 278E3 86.84

1-2 times 27276 8.52

3-10 times 4392 1.3711+ times 2826 0.88

Frequency Missing =16292.022247

LIQUOR USE IN PAST SCHOOL

YEAR

Q13F Frequency Percent

Never heard of  15416 4.75

Never used 287E3 88.38

1-2 times 17166 5.29

3-10 times 3961 1.2211+ times 1168 0.36

Frequency Missing =11646.504274

SHIMERON USE IN PAST

SCHOOL YEAR

Q13G Frequency Percent

Never heard of  189E3 58.36

Never used 135E3 41.64


Frequency Missing =13292.831808

INHALANT USE IN PAST

SCHOOL YEAR

Q13H Frequency Percent

Never heard of  14137 4.35

Never used 291E3 89.63

1-2 times 13463 4.14

3-10 times 4201 1.29

11+ times 1910 0.59


Frequency Missing =11310.138139

MARIJUANA USE IN PAST

SCHOOL YEAR

Q13I Frequency Percent

Never heard of  23454 7.23

Never used 293E3 90.28

1-2 times 4831 1.49

3-10 times 1574 0.49

11+ times 1657 0.51


Frequency Missing =11919.049757

AGE WHEN FIRST USED

CIGARETTES

Q14A Frequency Percent

7 or younger 4074 1.25

8 years old 2460 0.75

9 years old 3059 0.94

10 years old 4441 1.36

11 years old 6651 2.04

12 or older 5888 1.80

Never heard/used 3E5 91.86 

Frequency Missing =9688.7980031

AGE WHEN FIRST US

SNUFF/CHEW TOBAC

Q14B Frequency Perc

7 or younger 668 0

8 years old 636 0

9 years old 744 0

10 years old 786 0

11 years old 1827 0

12 or older 1647 0

Never heard/used 317E3 98


Frequency Missing =12745.2756

AGE WHEN FIRST USED BE

Q14C Frequency Perc

7 or younger 13862 4

8 years old 6177 1

9 years old 6902 2

10 years old 10780 3

11 years old 13640 4

12 or older 11348 3

Never heard/used 258E3 80


Frequency Missing =15783.3882

AGE WHEN FIRST USED WI

COOLE

Q14D Frequency Perc

7 or younger 5460 18 years old 3566 1

9 years old 5337 1

10 years old 10491 3

11 years old 14060 4

12 or older 11024 3

Never heard/used 272E3 84


Frequency Missing =14214.7575

AGE WHEN FIRST USED WI

Q14E Frequency Perc

7 or younger 5176 1

8 years old 4395 1

9 years old 5655 1

10 years old 10298 3

11 years old 13759 4

12 or older 13036 4

Never heard/used 264E3 83


7/30/2019 2009 _ mitchell county _ westbrook isd _ 2009 texas school survey of drug and alcohol use _ elementary report

http://slidepdf.com/reader/full/2009-mitchell-county-westbrook-isd-2009-texas-school-survey-of-drug-and 104/107

State - 6th Grade Only

Spring 2009

The frequencies have been weighted so that the

analysis reflects the distribution of students by grade

level in the districtPage 36 of 39

Frequency Missing =19687.589183

AGE WHEN FIRST USED LIQUOR

Q14F Frequency Percent

7 or younger 2258 0.708 years old 1404 0.44

9 years old 2210 0.69

10 years old 4930 1.53

11 years old 8553 2.66

12 or older 10644 3.31

Never heard/used 291E3 90.66

Frequency Missing =14990.180836

AGE WHEN FIRST USED

SHIMERONQ14G Frequency Percent

Never heard/used 319E3 100.00

Frequency Missing =17382.394104

AGE WHEN FIRST USED

INHALANTS

Q14H Frequency Percent

7 or younger 2445 0.76

8 years old 1754 0.55

9 years old 2329 0.73

10 years old 4255 1.33

11 years old 7078 2.21

12 or older 6274 1.96

Never heard/used 297E3 92.48

Frequency Missing =15489.218317

AGE WHEN FIRST USED

MARIJUANA

Q14I Frequency Percent

7 or younger 737 0.23

8 years old 546 0.17

9 years old 827 0.26

10 years old 1588 0.49

11 years old 2457 0.76

12 or older 4442 1.37

Never heard/used 312E3 96.72

Frequency Missing =13233.648054

CLOSE FRIENDS USE

CIGARETTES

Q15A Frequency Percent

Never heard of  7725 2.38

None 253E3 78.03Some 58443 18.00

Most 5161 1.59


Frequency Missing =11573.477814

CLOSE FRIENDS USE

SNUFF/CHEWING TOBACCO

Q15B Frequency Percent

Never heard of  11210 3.49

None 288E3 89.42

Some 20619 6.41Most 2185 0.68


Frequency Missing =14679.699395

CLOSE FRIENDS USE BEER

Q15C Frequency Percent

Never heard of  4451 1.40

None 231E3 72.73

Some 67858 21.41

Most 14116 4.45


Frequency Missing =19364.906013

CLOSE FRIENDS USE WINE

COOLERS

Q15D Frequency Percent

Never heard of  29980 9.39

None 23E4 72.11

Some 45817 14.35

Most 13214 4.14


Frequency Missing =17108.265147

CLOSE FRIENDS USE WIN

Q15E Frequency Perce

Never heard of  6201 1.

None 251E3 80.

Some 47806 15.2

Most 8421 2.


Frequency Missing =22941.1223

CLOSE FRIENDS USE LIQUO

Q15F Frequency Perce

Never heard of  12106 3.

None 257E3 80.

Some 39937 12.

Most 8837 2.


Frequency Missing =18854.5033

CLOSE FRIENDS US

SHIMERO

Q15G Frequency Perce

Never heard of  159E3 50.

None 153E3 48.

Some 3175 1.

Most 1134 0.


Frequency Missing =20540.8615

CLOSE FRIENDS US

INHALANT

Q15H Frequency Perce

Never heard of  11983 3.

None 254E3 79.

Some 40621 12.

Most 12378 3.


Frequency Missing =17146.4238

CLOSE FRIENDS US

MARIJUAN

Q15I Frequency Perce

Never heard of  18098 5.

None 262E3 81.

Some 30579 9.

Most 9380 2.


7/30/2019 2009 _ mitchell county _ westbrook isd _ 2009 texas school survey of drug and alcohol use _ elementary report

http://slidepdf.com/reader/full/2009-mitchell-county-westbrook-isd-2009-texas-school-survey-of-drug-and 105/107

State - 6th Grade Only

Spring 2009

The frequencies have been weighted so that the

analysis reflects the distribution of students by grade

level in the districtPage 37 of 39

Frequency Missing =16276.069045

EVER BEEN OFFERED

CIGARETTES

Q16a Frequency Percent

Never heard of  8399 2.59No 262E3 80.74

Yes 54084 16.67

Frequency Missing =11888.3301

EVER BEEN OFFERED

SNUFF/CHEWING TOBACCO

Q16b Frequency Percent

Never heard of  12138 3.80

No 287E3 89.80

Yes 20461 6.40

Frequency Missing =16648.436975

EVER BEEN OFFERED BEER

Q16c Frequency Percent

Never heard of  5178 1.63

No 238E3 74.92

Yes 74580 23.45

Frequency Missing =18311.843942

EVER BEEN OFFERED WINE

COOLERS

Q16d Frequency Percent

Never heard of  29270 9.23

No 242E3 76.31

Yes 45873 14.46

Frequency Missing =19091.861642

EVER BEEN OFFERED WINEQ16e Frequency Percent

Never heard of  7053 2.24

No 258E3 82.01

Yes 49626 15.75

Frequency Missing =21293.978364

EVER BEEN OFFERED

LIQUOR

Q16f Frequency Percent

Never heard of  11737 3.71

No 267E3 84.30

Yes 37972 12.00


Frequency Missing =19750.450009

EVER BEEN OFFERED

SHIMERON

Q16g Frequency Percent

Never heard of  154E3 49.08

No 156E3 49.63

Yes 4049 1.29


Frequency Missing =22510.61836

EVER BEEN OFFERED

INHALANTS

Q16h Frequency Percent

Never heard of  12532 3.96

No 269E3 84.94

Yes 35155 11.10


Frequency Missing =19703.878383

EVER BEEN OFFERED

MARIJUANA

Q16i Frequency Percent

Never heard of  17043 5.34

No 273E3 85.52

Yes 29201 9.15


Frequency Missing =17051.6512

IS ALCOHOL OBTAINED

FROM HOME

Q17a Frequency PercentDo Not Drink 235E3 74.46

No 39575 12.56

Yes 40881 12.98


Frequency Missing =21285.834584

IS ALCOHOL OBTAINED

FROM FRIEND

Q17b Frequency Percen

Do Not Drink 233E3 75.1

No 57672 18.6

Yes 19245 6.2


Frequency Missing =26724.0464

IS ALCOHOL OBTAINED

SOMEWHERE ELS

Q17c Frequency Percen

Do Not Drink 231E3 73.7

No 47940 15.3

Yes 34215 10.9


Frequency Missing =23215.8382

DANGEROUS FOR KIDS TO US

CIGARETTE

Q18A Frequency Perce

Very dangerous 194E3 60.

Dangerous 97722 30.

Not at all 4696 1.

Don't know 20628 6.

Never heard of  5060 1.


Frequency Missing =14010.3093

DANGEROUS TO US

SNUFF/CHEWING TOBACC

Q18B Frequency Perce

Very dangerous 205E3 64.

Dangerous 76197 23.

Not at all 6333 1.

Don't know 23997 7.

Never heard of  7277 2.


Frequency Missing =17748.6194

7/30/2019 2009 _ mitchell county _ westbrook isd _ 2009 texas school survey of drug and alcohol use _ elementary report

http://slidepdf.com/reader/full/2009-mitchell-county-westbrook-isd-2009-texas-school-survey-of-drug-and 106/107

State - 6th Grade Only

Spring 2009

The frequencies have been weighted so that the

analysis reflects the distribution of students by grade

level in the districtPage 38 of 39

DANGEROUS FOR KIDS TO USE

BEER

Q18C Frequency Percent

Very dangerous 144E3 45.62

Dangerous 116E3 36.73

Not at all 25381 8.07

Don't know 27791 8.83

Never heard of  2338 0.74

Frequency Missing =21733.503684

DANGEROUS FOR KIDS TO USE

WINE COOLERS

Q18D Frequency Percent

Very dangerous 133E3 41.93

Dangerous 91747 29.02

Not at all 27774 8.78

Don't know 38536 12.19Never heard of  25558 8.08

Frequency Missing =20139.404138

DANGEROUS FOR KIDS TO USE

WINE

Q18E Frequency Percent

Very dangerous 133E3 42.48

Dangerous 107E3 34.41

Not at all 33228 10.65

Don't know 35296 11.31Never heard of  3567 1.14

Frequency Missing =24321.964179

DANGEROUS FOR KIDS TO USE

LIQUOR

Q18F Frequency Percent

Very dangerous 188E3 59.48

Dangerous 81950 25.94

Not at all 12126 3.84

Don't know 26534 8.40Never heard of  7380 2.34

Frequency Missing =20431.340703

DANGEROUS FOR KIDS TO USE

SHIMERON

Q18G Frequency Percent

Very dangerous 109E3 34.56

Dangerous 20602 6.53

Not at all 2086 0.66

Don't know 28687 9.09

Never heard of  155E3 49.16


Frequency Missing =20620.696187

DANGEROUS FOR KIDS TO USE

INHALANTS

Q18H Frequency Percent

Very dangerous 2E5 63.58

Dangerous 67168 21.31

Not at all 13509 4.29

Don't know 26486 8.40Never heard of  7635 2.42


Frequency Missing =21078.134237

DANGEROUS FOR KIDS TO USE

MARIJUANA

Q18I Frequency Percent

Very dangerous 249E3 78.43

Dangerous 31037 9.78

Not at all 6361 2.00

Don't know 18500 5.83Never heard of  12579 3.96


Frequency Missing =18924.352762

DRUG/ALCOHOL INFO

FROM TEACHER

Q19a Frequency Percent

No 11E4 35.27

Yes 203E3 64.73


Frequency Missing =23074.432021

DRUG/ALC INFO

FROM VISITOR TO

CLASS

Q19b Frequency Percent

No 159E3 51.64

Yes 149E3 48.36


Frequency Missing =27801.6633

DRUG/ALC INFO

FROM ASSEMBLY

PROGRAM

Q19c Frequency Percent

No 134E3 43.42

Yes 174E3 56.58


Frequency Missing =27936.1422

DRUG/ALC INFO

FROM GUIDE

COUNSELOR

Q19d Frequency Percent

No 167E3 54.38

Yes 14E4 45.62


Frequency Missing =29202.3742

DRUG/ALC INF FROM

SOMEONE ELSE AT

SCHOOL

Q19e Frequency Percent

No 177E3 57.30

Yes 132E3 42.70


Frequency Missing =27107.5636

BEER, TWO OR MORE

AT ONE TIME

Q20a Frequency Percent

Never 27E4 84.74

1 time 25972 8.16

2 times 10756 3.38

3+ times 11815 3.71


Frequency Missing =18128.0258

7/30/2019 2009 _ mitchell county _ westbrook isd _ 2009 texas school survey of drug and alcohol use _ elementary report

http://slidepdf.com/reader/full/2009-mitchell-county-westbrook-isd-2009-texas-school-survey-of-drug-and 107/107

State - 6th Grade Only

Spring 2009

WINE COOLERS, TWO

OR MORE AT ONE TIME

Q20b Frequency Percent

Never 274E3 87.19

1 time 20865 6.65

2 times 10425 3.32

3+ times 8929 2.84

Frequency Missing =22450.08485

WINE, TWO OR MORE

AT ONE TIME

Q20c Frequency Percent

Never 271E3 86.76

1 time 24790 7.95

2 times 8427 2.70

3+ times 8085 2.59

Frequency Missing =24422.869794

LIQUOR, TWO OR MORE

AT ONE TIME

Q20d Frequency Percent

Never 288E3 91.35

1 time 13673 4.34

2 times 6243 1.98

3+ times 7326 2.33

Frequency Missing =21270.71393

MISSED SCHOOL

WITHOUT PARENT'S

CONSENT

Q21 F P t

PARENTS FEEL ABOUT KIDS

SMOKING CIGARETTES

Q23 Frequency Percent

Don't like it 281E3 86.55

Don't care 6061 1.86Think it's O.K. 1290 0.40

Don't know 36377 11.19


Frequency Missing =11261.554204

PARENTS FEEL ABOUT KIDS

DRINKING BEER

Q24 Frequency Percent

Don't like it 261E3 80.20

Don't care 13495 4.15

Think it's O.K. 4080 1.26Don't know 46754 14.39


Frequency Missing =11373.016318

PARENTS FEEL ABOUT KIDS

USING MARIJUANA

q25 Frequency Percent

Don't like it 285E3 87.54

Don't care 4088 1.26

Think it's O.K. 972 0.30

Don't know 35463 10.91


Frequency Missing =11197.649315


Recommended